


Abstract
This study numerically investigates the influence of different fluid temperatures on the cavitation characteristics of a space-use micropump under microgravity conditions. A homogeneous multiphase model coupled with a thermal modified Zwart–Gerber–Belamri cavitation model is employed, and the SST turbulence model is applied to resolve the cavitating flow under rated and off-design flow rates. Results indicate that cavitation behavior is strongly dependent on both temperature and flow rate. At low temperatures, cavitation intensity increases, leading to reductions in head and efficiency and a slight increase in shaft power. In contrast, elevated temperatures suppress cavitation development, resulting in milder performance degradation and, in some cases, slight improvements in head and shaft power. Internal flow analysis reveals that lower temperatures promote more extensive vapor fraction distributions and greater flow distortion, while entropy production analysis shows that cavitation contributes limited additional loss overall, though entropy generation rises markedly under combined low temperature and high flow rate conditions. The findings highlight that cavitation effects are more pronounced at low temperatures and are further amplified at higher flow rates, providing insights for the design and reliable operation of space micropumps in on-orbit thermal management systems.
1. Introduction
In modern space missions, payloads are becoming increasingly integrated and multifunctional. Their continuous operation generates significant heat loads, which, if not dissipated promptly, can lead to equipment overheating and failure, thereby jeopardizing mission safety [1,2]. Owing to their structural simplicity and high reliability, fluid-loop active cooling systems have become the primary solution for spacecraft thermal management. Specifically, Mechanically Pumped Fluid Loop (MPFL) systems have been extensively developed and deployed in recent years to meet these increasingly stringent high-power heat dissipation demands [3,4,5]. These systems utilize space-rated micropumps to circulate the coolant, enabling efficient heat transfer from onboard equipment. This ensures that operational temperatures remain within safe limits and supports reliable spacecraft performance under extreme thermal conditions.
As the core component of fluid-loop active cooling systems, space micropumps are critical to spacecraft operational stability. Designed to provide high head at low flow rates, these pumps are typically low-specific-speed centrifugal types [6]. During transient operations, they are susceptible to flow separation and stall, the local static pressure within the flow field drops below the saturation vapor pressure corresponding to the current temperature, which can induce cavitation and destabilize system performance. Recent studies have further emphasized that such cavitation behavior severely distorts internal flow field distributions and compromises overall pump stability [7]. Moreover, the low operating pressures characteristic of space micropumps further increase cavitation risk, impairing hydraulic efficiency and potentially causing mechanical damage. Therefore, cavitation control is a key challenge in aerospace pump engineering. The thermophysical properties of the working fluid are temperature-sensitive, and vaporization latent heat can trigger localized cooling, adding complexity to the cavitation behavior.
Despite the critical importance of cavitation control, the current state of the art primarily focuses on conventional centrifugal pumps operating with room-temperature water or specific extreme cryogenic fluids (e.g., liquid hydrogen and oxygen) [8,9]. Previous studies have established that thermodynamic effects can significantly alter cavitation bubble dynamics; the localized temperature drop resulting from the vaporization latent heat lowers the local saturated vapor pressure, thereby retarding cavity growth [10]. Recent numerical investigations have further emphasized the necessity of incorporating these thermodynamic effects to accurately evaluate cavitating flows and pump stability under varying temperature conditions [11]. However, there is a distinct lack of comprehensive research addressing the cavitation characteristics of specific space-use refrigerants (such as perfluorotriethylamine) within MPFL systems. Furthermore, the coupled effects of varying wide-range inlet temperatures, off-design flow rates, and microgravity conditions on the internal flow structure and entropy production of space micropumps remain insufficiently explored.
To bridge this scientific gap, this study investigates how fluid property variations and inlet temperature conditions affect the cavitation characteristics of space micropumps. The scientific novelty of this research lies in coupling a homogeneous multiphase model with a thermally modified Zwart–Gerber–Belamri cavitation model to systematically quantify the temperature dependence of cavitation in a low-specific-speed space micropump under microgravity conditions. The primary objectives are to evaluate the external performance degradation and to uncover the internal flow structures, vapor fraction distributions, and entropy production mechanisms across a wide temperature range (−37 °C to 72 °C). The expected results demonstrate that cavitation effects are highly temperature-dependent and are further amplified at higher flow rates, with lower temperatures actively promoting cavitation intensity and associated energy losses, while elevated temperatures suppress cavity development. The findings provide important insights for enhancing the reliability of orbit thermal management systems.
2. Study on the Mechanism of Cavitation Characteristics of Cryogenic Fluids
To facilitate the study of cavitation phenomena, a dimensionless far-field cavitation number is defined, used to characterize the ease with which cavitation occurs under the current thermodynamic state:
In the formula: is the pressure value at an extremely far distance, is the saturated vapor pressure () of the fluid medium at an extremely far temperature, is the density of the medium in the liquid phase (), and and is the inlet velocity of the flow field ().
The cavitation number describes the influence of the flow field state on the cavitation region and is a dimensionless number. In addition, the physical properties of the flowing medium also have a significant impact on cavitation. The complexity of the cavitation mechanism of cryogenic fluids stems primarily from the significant differences in their physical properties compared to room-temperature water.
Because the density ratio between the liquid and vapor phases of cryogenic fluids is generally lower than that of water, cryogenic fluids need to absorb more energy during evaporation. Furthermore, the thermal conductivity of cryogenic fluids is much lower than that of water within their temperature range, resulting in a more significant temperature gradient distribution near the vapor bubbles during vaporization. The decrease in temperature of the cryogenic fluid leads to a significant decrease in saturated vapor pressure, which in turn inhibits cavitation. This complex cavitation mechanism continues until a dynamic equilibrium is reached.
Current research methodologies for pump cavitation primarily encompass the following approaches: One established method involves employing visualization techniques combined with high-speed camera recording to conduct visual experiments within the pump. This allows identification of cavitation locations and bubble morphology, facilitating analysis of general cavitation flow patterns [12,13]. Another approach investigates, through experiment or numerical simulation, the correlation between cavitation and pump pressure pulsation, vibration, and noise characteristics [9]. A third line of inquiry applies energy-based methods to assess pump performance. To evaluate operating conditions and suction performance, parameters such as Net Positive Suction Head (NPSH) and cavitation number have been introduced [14,15,16,17,18,19]. Although significant advances have been made in the study of cavitation in fluid machinery, both experimental and numerical methods require further refinement. In engineering practice, continued optimization of cavitation and turbulence models remains essential to achieve reliable predictive accuracy.
The thermodynamic effect in cavitation has been extensively investigated. Early comparative experiments in a water tunnel by Sarosdy and Acosta [20] revealed sharper cavity interfaces in water than in Freon, which was attributed to thermal influences. Stahl and Stepanoff [21] subsequently examined this effect in developed cavitation zones, proposing the foundational B-factor method. This work was advanced by Gelder et al. [22] and Moore and Ruggeri [23], who combined experiments to establish the GMR method and refine the B-factor coefficients. Further quantitative analysis was conducted by Moore and Ruggeri [24] using various thermosensitive fluids in pumps, explicitly linking temperature to cavitation behavior. Hord [25] provided comprehensive visual data for cryogenic fluids in tunnel tests. Research then focused on inducers: Francet et al. [26,27] demonstrated that increased temperature (using Freon R-114 and cold water) suppresses cavity length. Gervone et al. [28,29] further quantified this, showing that higher water temperatures reduce pressure pulsation amplitude and confirming a significantly lower thermal effect parameter for cold water.
A review of the aforementioned progress highlights the critical influence of thermodynamic effects on cavitation. Historically, much of the research on thermodynamic cavitation has focused on extreme cryogenic fluids, such as liquid hydrogen, oxygen, and nitrogen. While these fluids are essential for specific deep-space applications—such as cooling Sun sensors or space telescopes (e.g., JWST)—they are rarely used in the routine temperature control of modern satellite platforms due to safety risks and operational constraints. Instead, typical Mechanically Pumped Fluid Loop (MPFL) systems require working fluids capable of operating reliably across an entire wide temperature domain, encompassing both extreme negative and positive temperatures induced by orbital thermal cycling. Consequently, practical space thermal management relies on specialized wide-temperature-range liquids, such as Hydrogen Fluorinated Ethers (HFEs), Ammonia, Galden, Propylene–Glycol–Water mixtures, and specific refrigerants like perfluorotriethylamine. Experimental research on the cavitation characteristics of these specific space-use fluids under extreme temperature variations and microgravity conditions is highly constrained by equipment limitations and safety risks. Therefore, computational fluid dynamics (CFD) simulation remains an essential approach for investigating the exact cavitation mechanisms and thermodynamic effects within space micropumps under these realistic input scenarios.
A review of the aforementioned progress highlights the critical influence of thermodynamic effects on cavitation. However, experimental research has been constrained by equipment limitations and the significant safety risks associated with cryogenic fluids such as liquid hydrogen and oxygen. Consequently, most studies have employed high-temperature water or liquid nitrogen as working media. Liquid nitrogen, being gaseous at ambient conditions, poses substantial challenges for detailed internal flow measurements. Although high-temperature water exhibits thermosensitive behavior, its thermodynamic parameters differ substantially from those of cryogenic fluids, leading to notable discrepancies in cavitation characteristics. Therefore, computational fluid dynamics (CFD) simulation remains an essential approach for investigating the cavitation mechanisms of cryogenic fluids [30,31,32,33,34,35].
3. Computational Model
3.1. Basic Governing Equations
Cavitation is a multiphase flow problem. Most simulations of cavitation flow currently employ homogeneous flow models, specifically a type of Euler-Euler model. These models assume strong coupling between the liquid and vapor phases, sharing common velocity, pressure, and temperature fields, and operating on a single set of governing equations. The basic governing equations are as follows:
- (1)
- Mass conservation equation
- (2)
- Momentum conservation equation
Here, p represents pressure. and are the laminar viscosity coefficients of the liquid and gas, respectively.
- (3)
- Energy Equation
For energy equations, there are two types in CFX: one is the thermal energy equation (see Equation (6)), which is suitable for low-speed flow and cases where viscous effects can be ignored; the other is the total energy equation (see Equation (7)), which is suitable for high-speed flow and cases that consider viscous effects and also considers rotational energy, making it suitable for temperature field calculations of rotating machinery such as turbopumps.
In the formula , is the total enthalpy, , is the static enthalpy, and is the mass fraction of the gas phase. For effective thermal conductivity, for work done by viscous stress.
3.2. Turbulence Model
This study solves the turbulence closure problem arising from the RANS equations by utilizing the SST model. The model utilizes a blending function to unify the and formulations, and its governing transport equations are presented in Equation (8). If the turbulent kinetic energy k equation is
and
The turbulent kinetic energy k equation is
the turbulent frequency is
where, and denote the turbulent dynamic viscosity and turbulent viscosity, respectively. S is a fixed estimate. . All parameters are constants, and F1 and F2 represent the mixture function.
3.3. Multiphase Flow Model
This paper studies the application of miniature centrifugal pumps in the thermal control system of spacecraft. Under microgravity conditions, the influence of surface tension cannot be ignored. Therefore, the VOF multiphase flow model is chosen for calculations, which can reveal the effect of surface tension by tracking the phase interface.
The Fluent surface tension model is a continuous surface force model, and the variation of surface tension in the VOF calculation is represented by the surface tension coefficient. In this paper, the surface tension coefficient of the perfluorotriethylamine medium is taken as 0.0127 N/m, and the wetting angle is corrected to 80°.
3.4. Cavitation Model Considering Thermal Effects
In numerical simulations of cavitation flows, different cavitation models exhibit varying representations of the evaporation source term and the condensation source term . This paper employs the Zwart–Gerber–Belamri cavitation model, neglecting quadratic and surface tension terms and assuming cavitation per unit volume. By considering the cavitation bubbles, we can eventually obtain the expressions for the evaporation source term and the condensation source term as shown in Equations (12) and (13) below.
In the formula, , is the volume fraction of non-condensable gas, , and are the source term constants of evaporation and condensation, respectively, and are taken as 50 and 0.01.
In actual cavitation flows, thermodynamic effects often exist, so the cavitation model needs to be modified as follows:
3.5. Entropy Production Analysis
Based on the second law of thermodynamics, irreversible losses during fluid flow are inevitably accompanied by entropy generation. Therefore, entropy production analysis offers a quantitative means to evaluate energy losses within the space micropump. Under the assumption of constant temperature, heat-transfer-induced dissipation is neglected in the present model, and only viscous dissipation arising from velocity gradients is considered. Following the Reynolds-averaged approach, the entropy generation rate due to velocity gradients is decomposed into two components: the entropy generation rate by direct dissipation (EPDD), which results from mean velocity gradients, and the entropy generation rate by turbulent dissipation (EPTD), which stems from fluctuating velocity gradients. These are expressed as follows:
The entropy generation rate at the wall is given by
where is the near-wall velocity and represents the wall shear stress. The total entropy generation within the system is then obtained by integrating the local entropy generation rate over each flow domain:
The total loss within the flow domain is then calculated as
3.6. Numerical Calculation Model
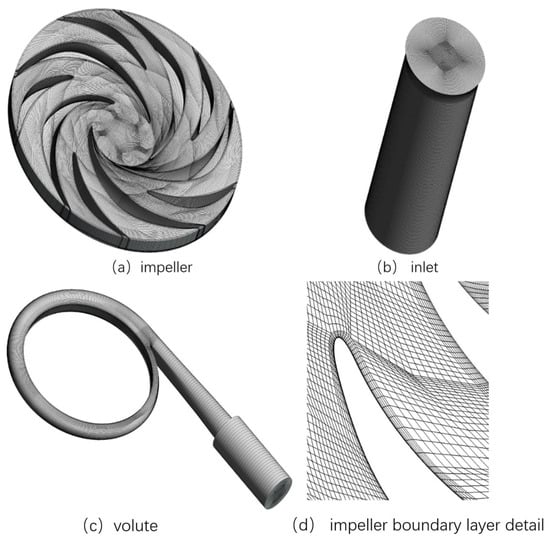
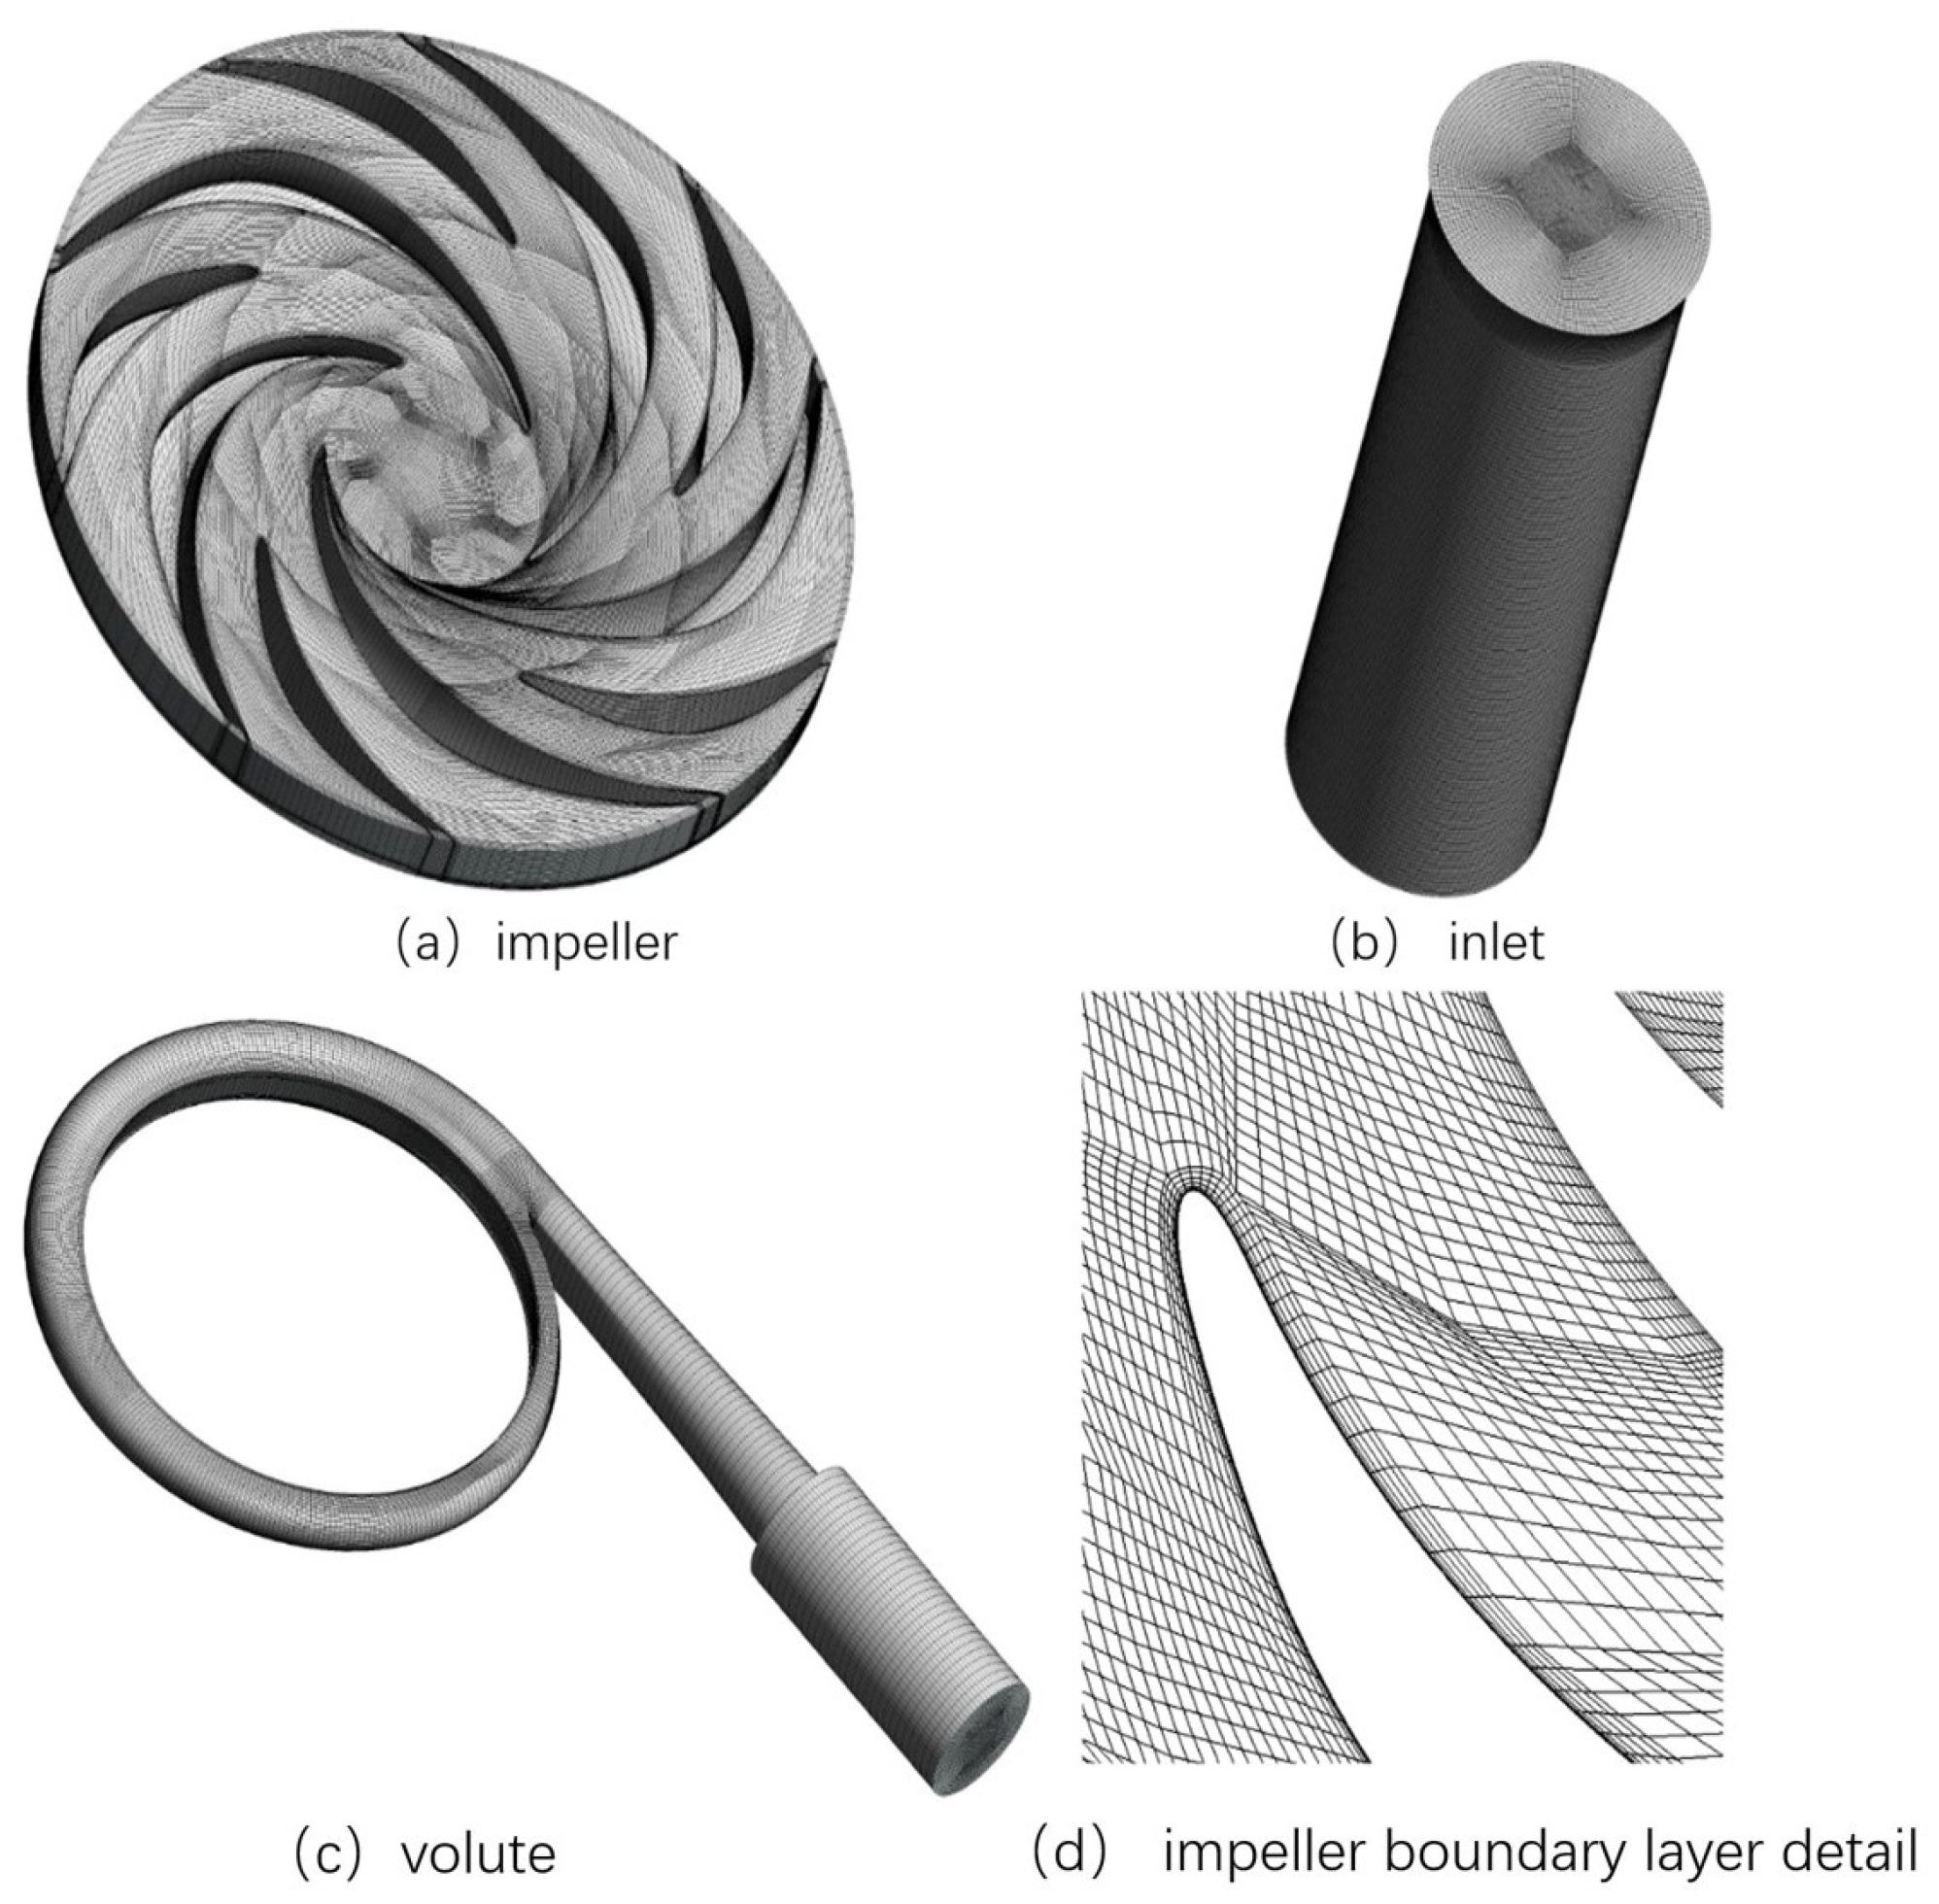
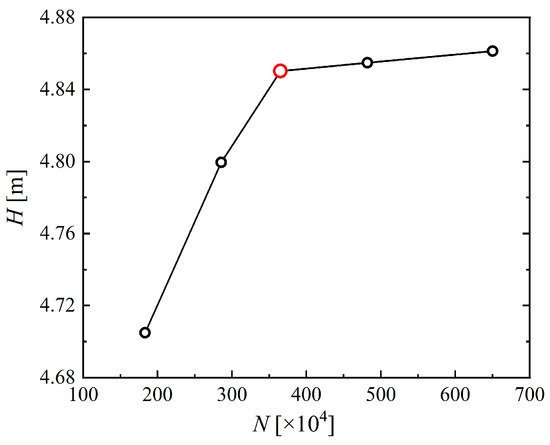
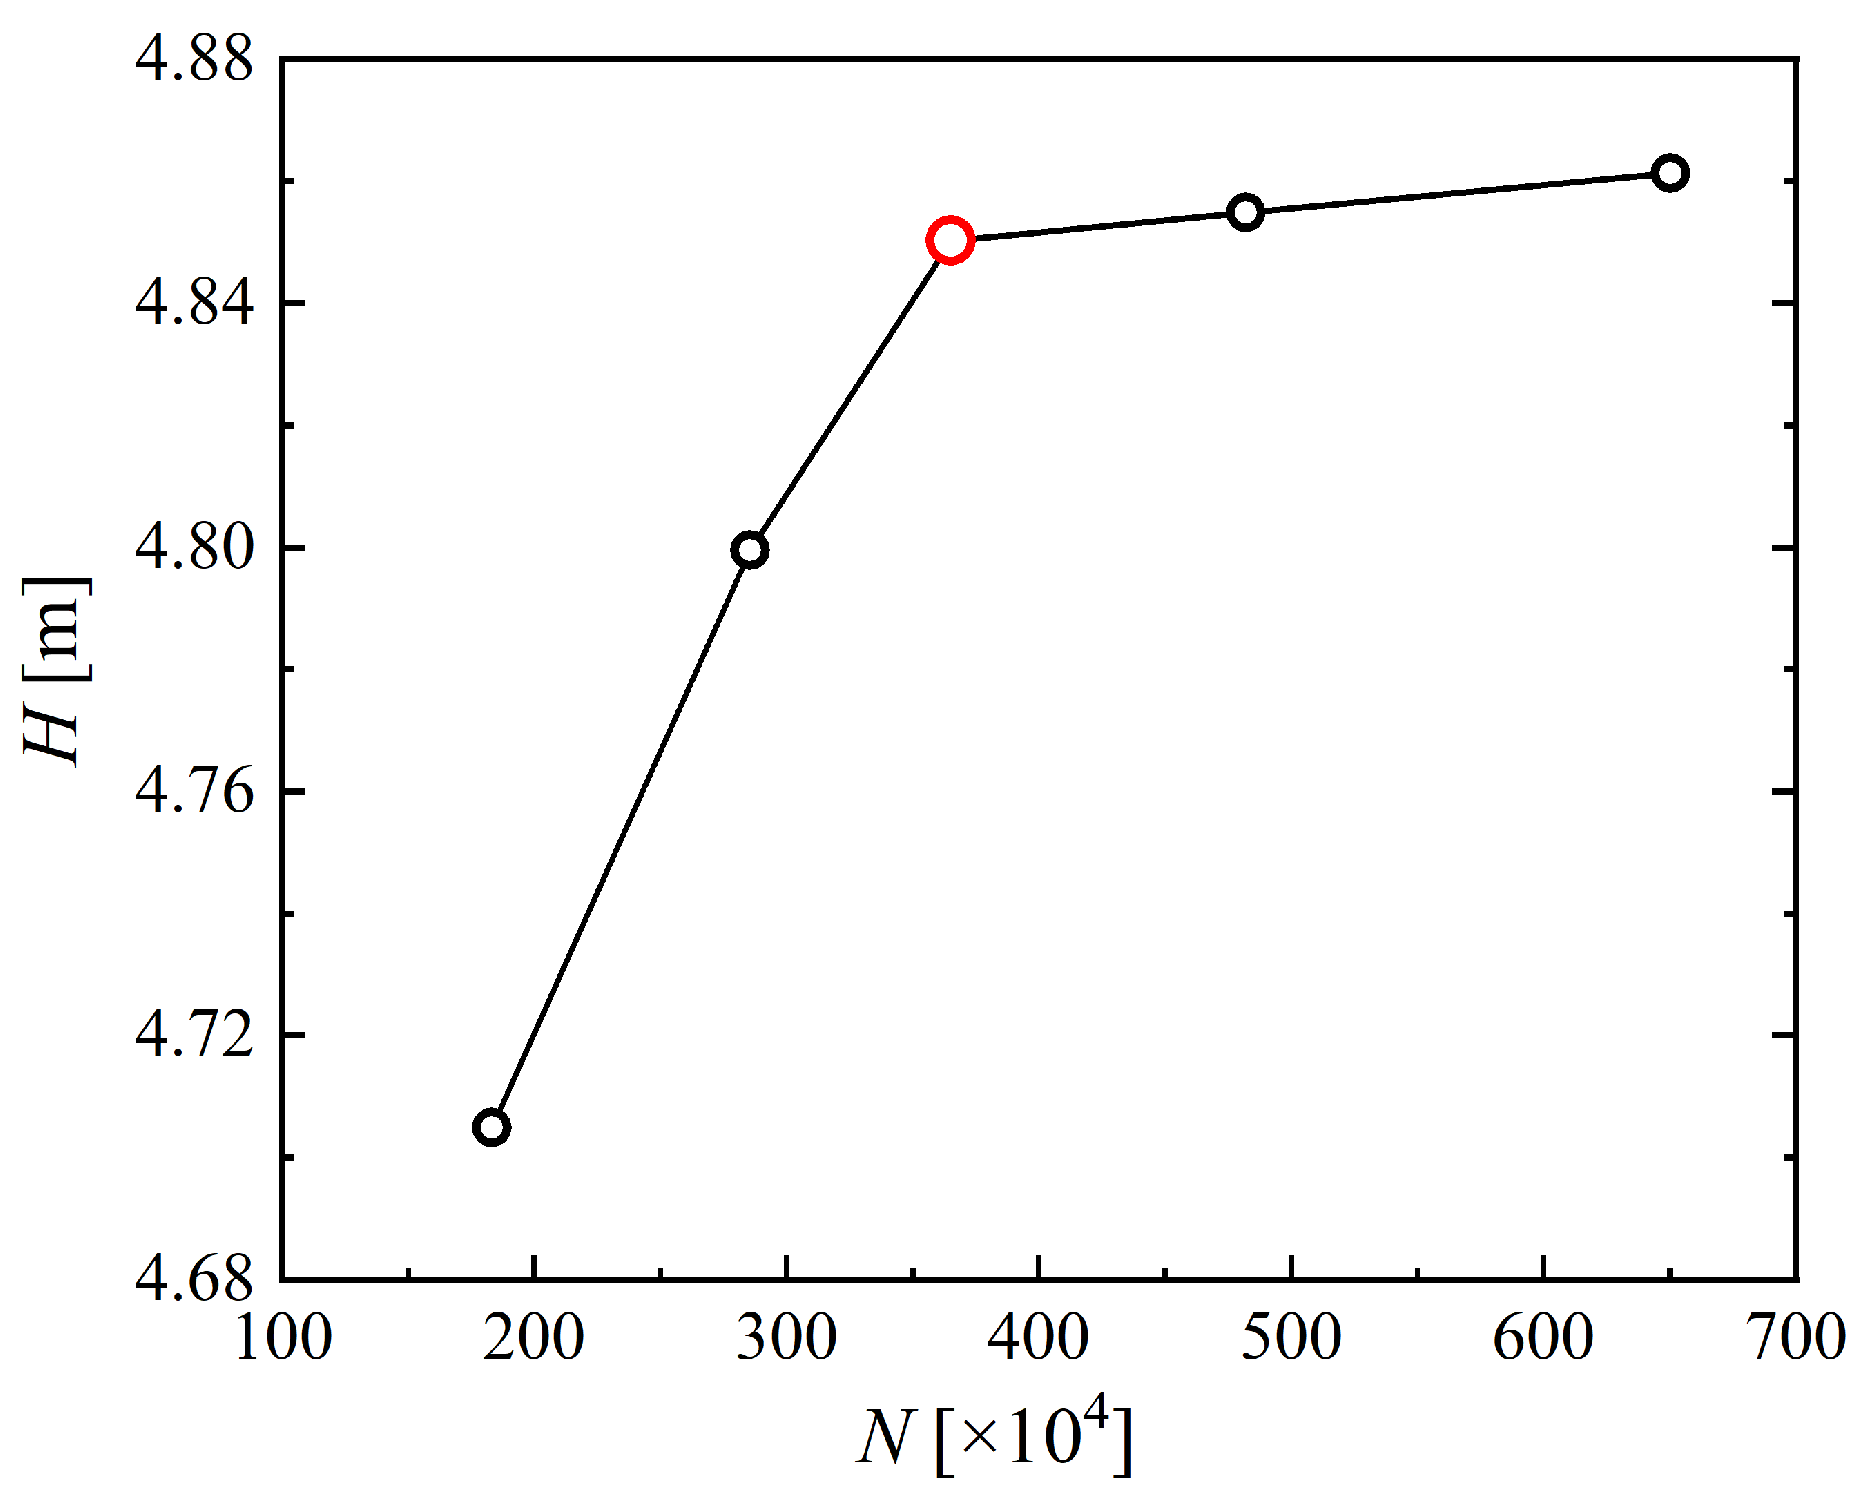
Three-dimensional models were constructed for key computational domains of the micropump, including the inlet section, impeller, and volute. Structured hexahedral meshes were applied throughout the entire fluid domain, with an average mesh quality above 0.1 (Figure 1). A mesh independence study was conducted by generating five mesh sets with varying densities. Steady-state simulations were performed at rated conditions, using pump head as the convergence criterion under specified pressure-inlet and mass-flow-outlet boundaries. As shown in Figure 2, the predicted head increased with mesh density until convergence was achieved; the variation remained within 1% beyond 3.65 million elements. Balancing accuracy and computational efficiency, the third mesh set was selected for all subsequent simulations.
Figure 1.
Mesh of the Space Micropump Fluid Domain.
Figure 2.
Grid Independence Study: Predicted Head for Different Mesh Resolutions.
This paper uses the commercial software Fluent 2024 for numerical simulation, assuming the micropump casing is a rigid body and neglecting dissipation caused by heat transfer. Regarding fluid properties, the functional relationships of the physical properties of perfluorotriethylamine in liquid and gas states with temperature in the range of −37 °C to 72 °C were obtained through fitting based on experiments as follows:
- (1)
- Density
Liquid density of perfluorotriethylamine:
Perfluorotriethylamine vapor density:
In the formula,
- (2)
- Viscosity
Liquid viscosity of perfluorotriethylamine:
Perfluorotriethylamine vapor viscosity:
- (3)
- Specific heat capacity
Liquid specific heat capacity of perfluorotriethylamine:
Perfluorotriethylamine vapor specific heat capacity:
- (4)
- Thermal conductivity
Liquid thermal conductivity of perfluorotriethylamine:
Perfluorotriethylamine vapor thermal conductivity:
- (5)
- Surface tension coefficient, saturated vapor pressure, latent heat of vaporization, and standard state enthalpy
Surface tension coefficient:
Saturated vapor pressure:
Standard state enthalpy:
For perfluorotriethylamine liquid, take ; for perfluorotriethylamine vapor, take . The reference state is taken as 298.15 K and 101,325 Pa.
4. Study on the Influence of Different Incoming Flow Temperatures on the Cavitation Characteristics of Space Micropumps
This study examines the influence of cavitation on the head, shaft power, and efficiency of a space micropump, along with its associated internal flow and loss characteristics. Steady-state simulations were conducted under microgravity across a range of volumetric flow rates (0.5, 1.16, 1.6, and 2 L/min), inlet temperatures (–37, –25, 0, 25, 50, and 72 °C), and cavitation numbers ( 0.2, 0.1, 0.03, 0.02, and 0.01). The work systematically analyzes how temperature and flow rate affect both the pump’s performance and its internal flow structure under cavitating conditions.
4.1. Analysis of the External Characteristics of Cavitation Flow Under Different Incoming Flow Temperatures
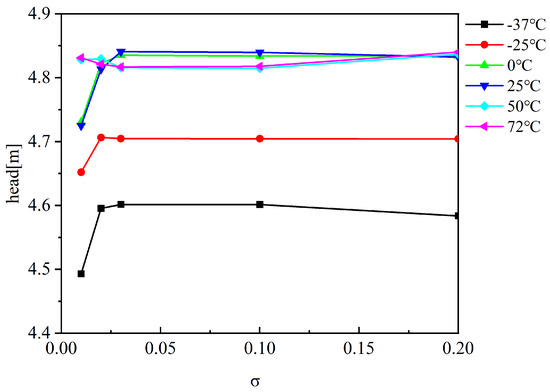
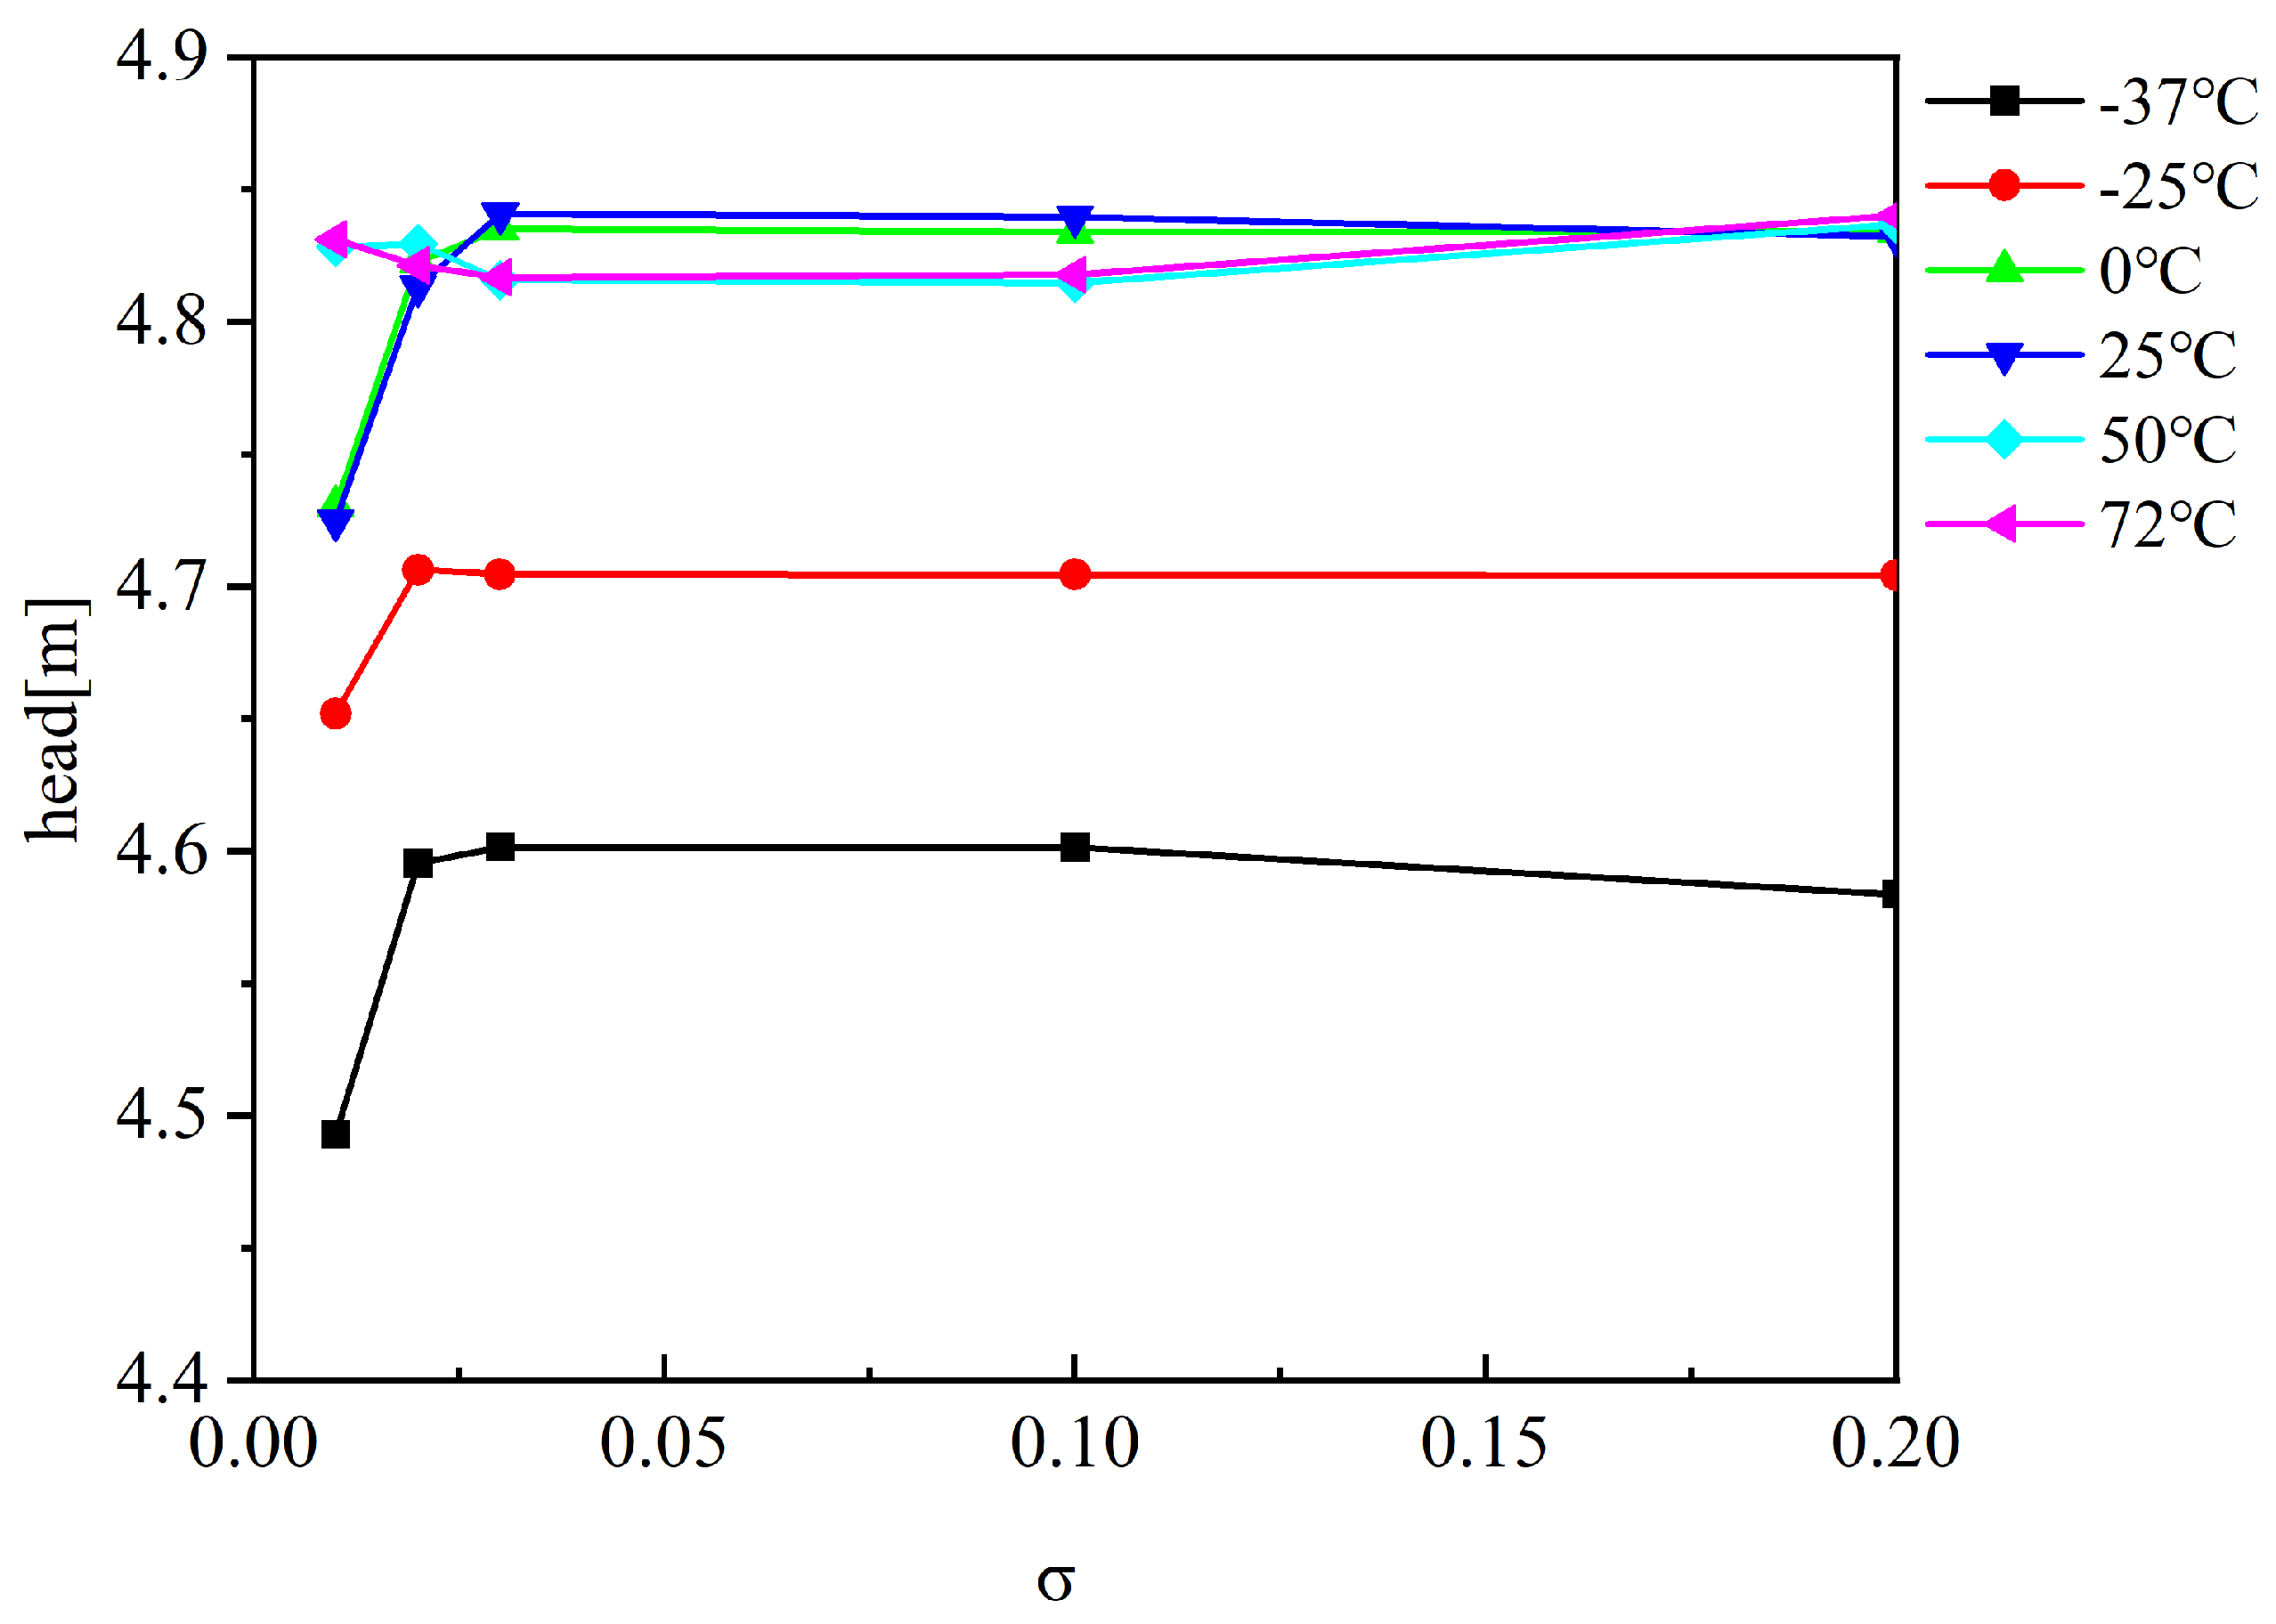
Figure 3 presents the head variation of the space micro-centrifugal pump with cavitation number at a flow rate of 1.16 L/min across different temperatures. Cavitation inception occurs at under all temperature conditions. The results indicate that cavitation is suppressed at elevated temperatures, leading to a progressively smaller reduction in head as temperature increases. In contrast, pump performance at low temperatures shows higher sensitivity to changes in the cavitation number.
Figure 3.
Head vs. Cavitation Number () at Rated Flow and Various Temperatures.
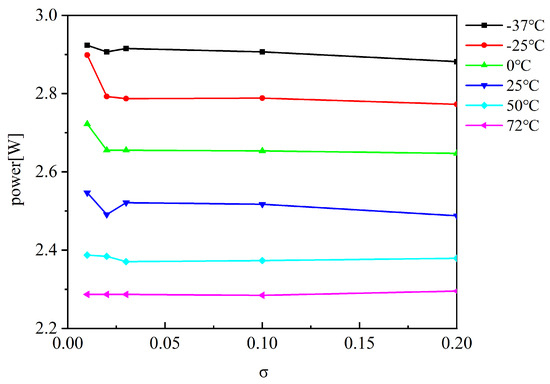
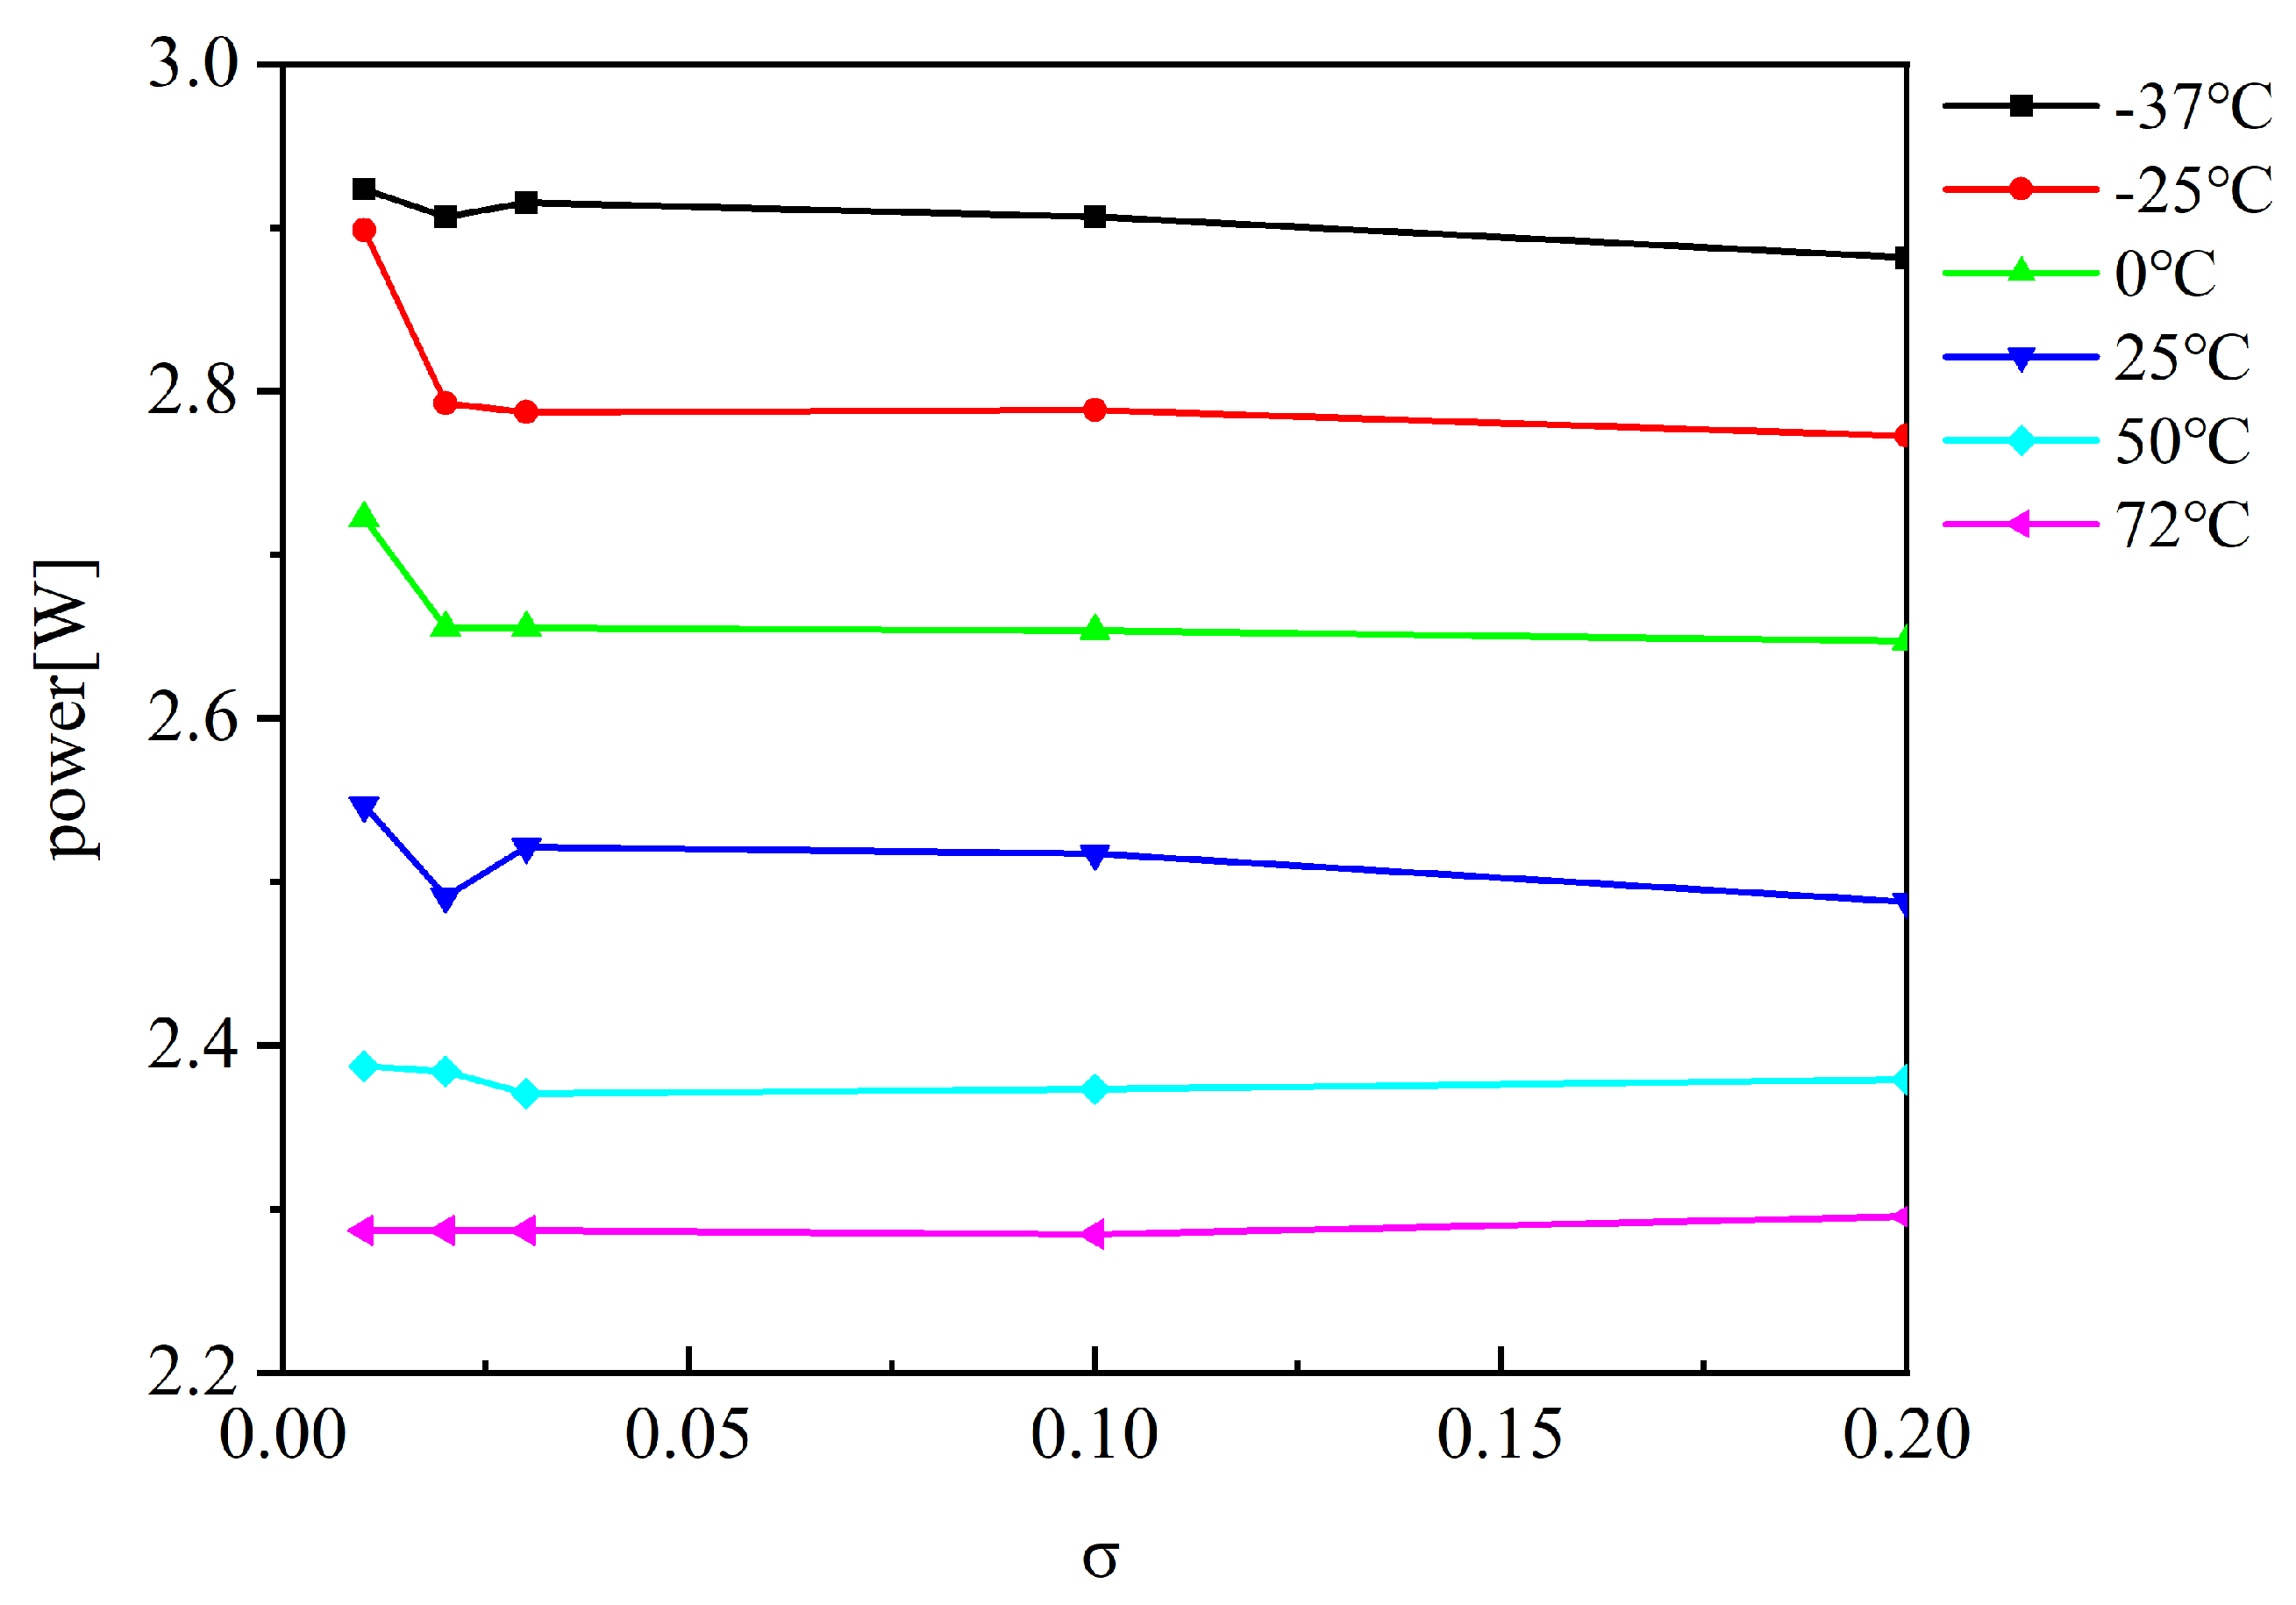
Figure 4 illustrates the variation of shaft power with cavitation number () at different temperatures under rated flow conditions. At low temperatures, shaft power is higher and decreases noticeably as increases. In contrast, at elevated temperatures, shaft power remains relatively low and shows little sensitivity to changes in . Once the cavitation number falls below the critical value of 0.02, the shaft power under low-temperature conditions becomes increasingly sensitive to further reductions in . This indicates that lower temperatures are more conducive to the development of cavitation.
Figure 4.
Shaft Power vs. Cavitation Number () at Rated Flow and Various Temperatures.
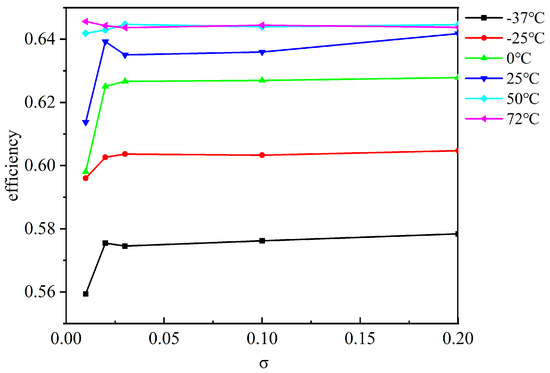
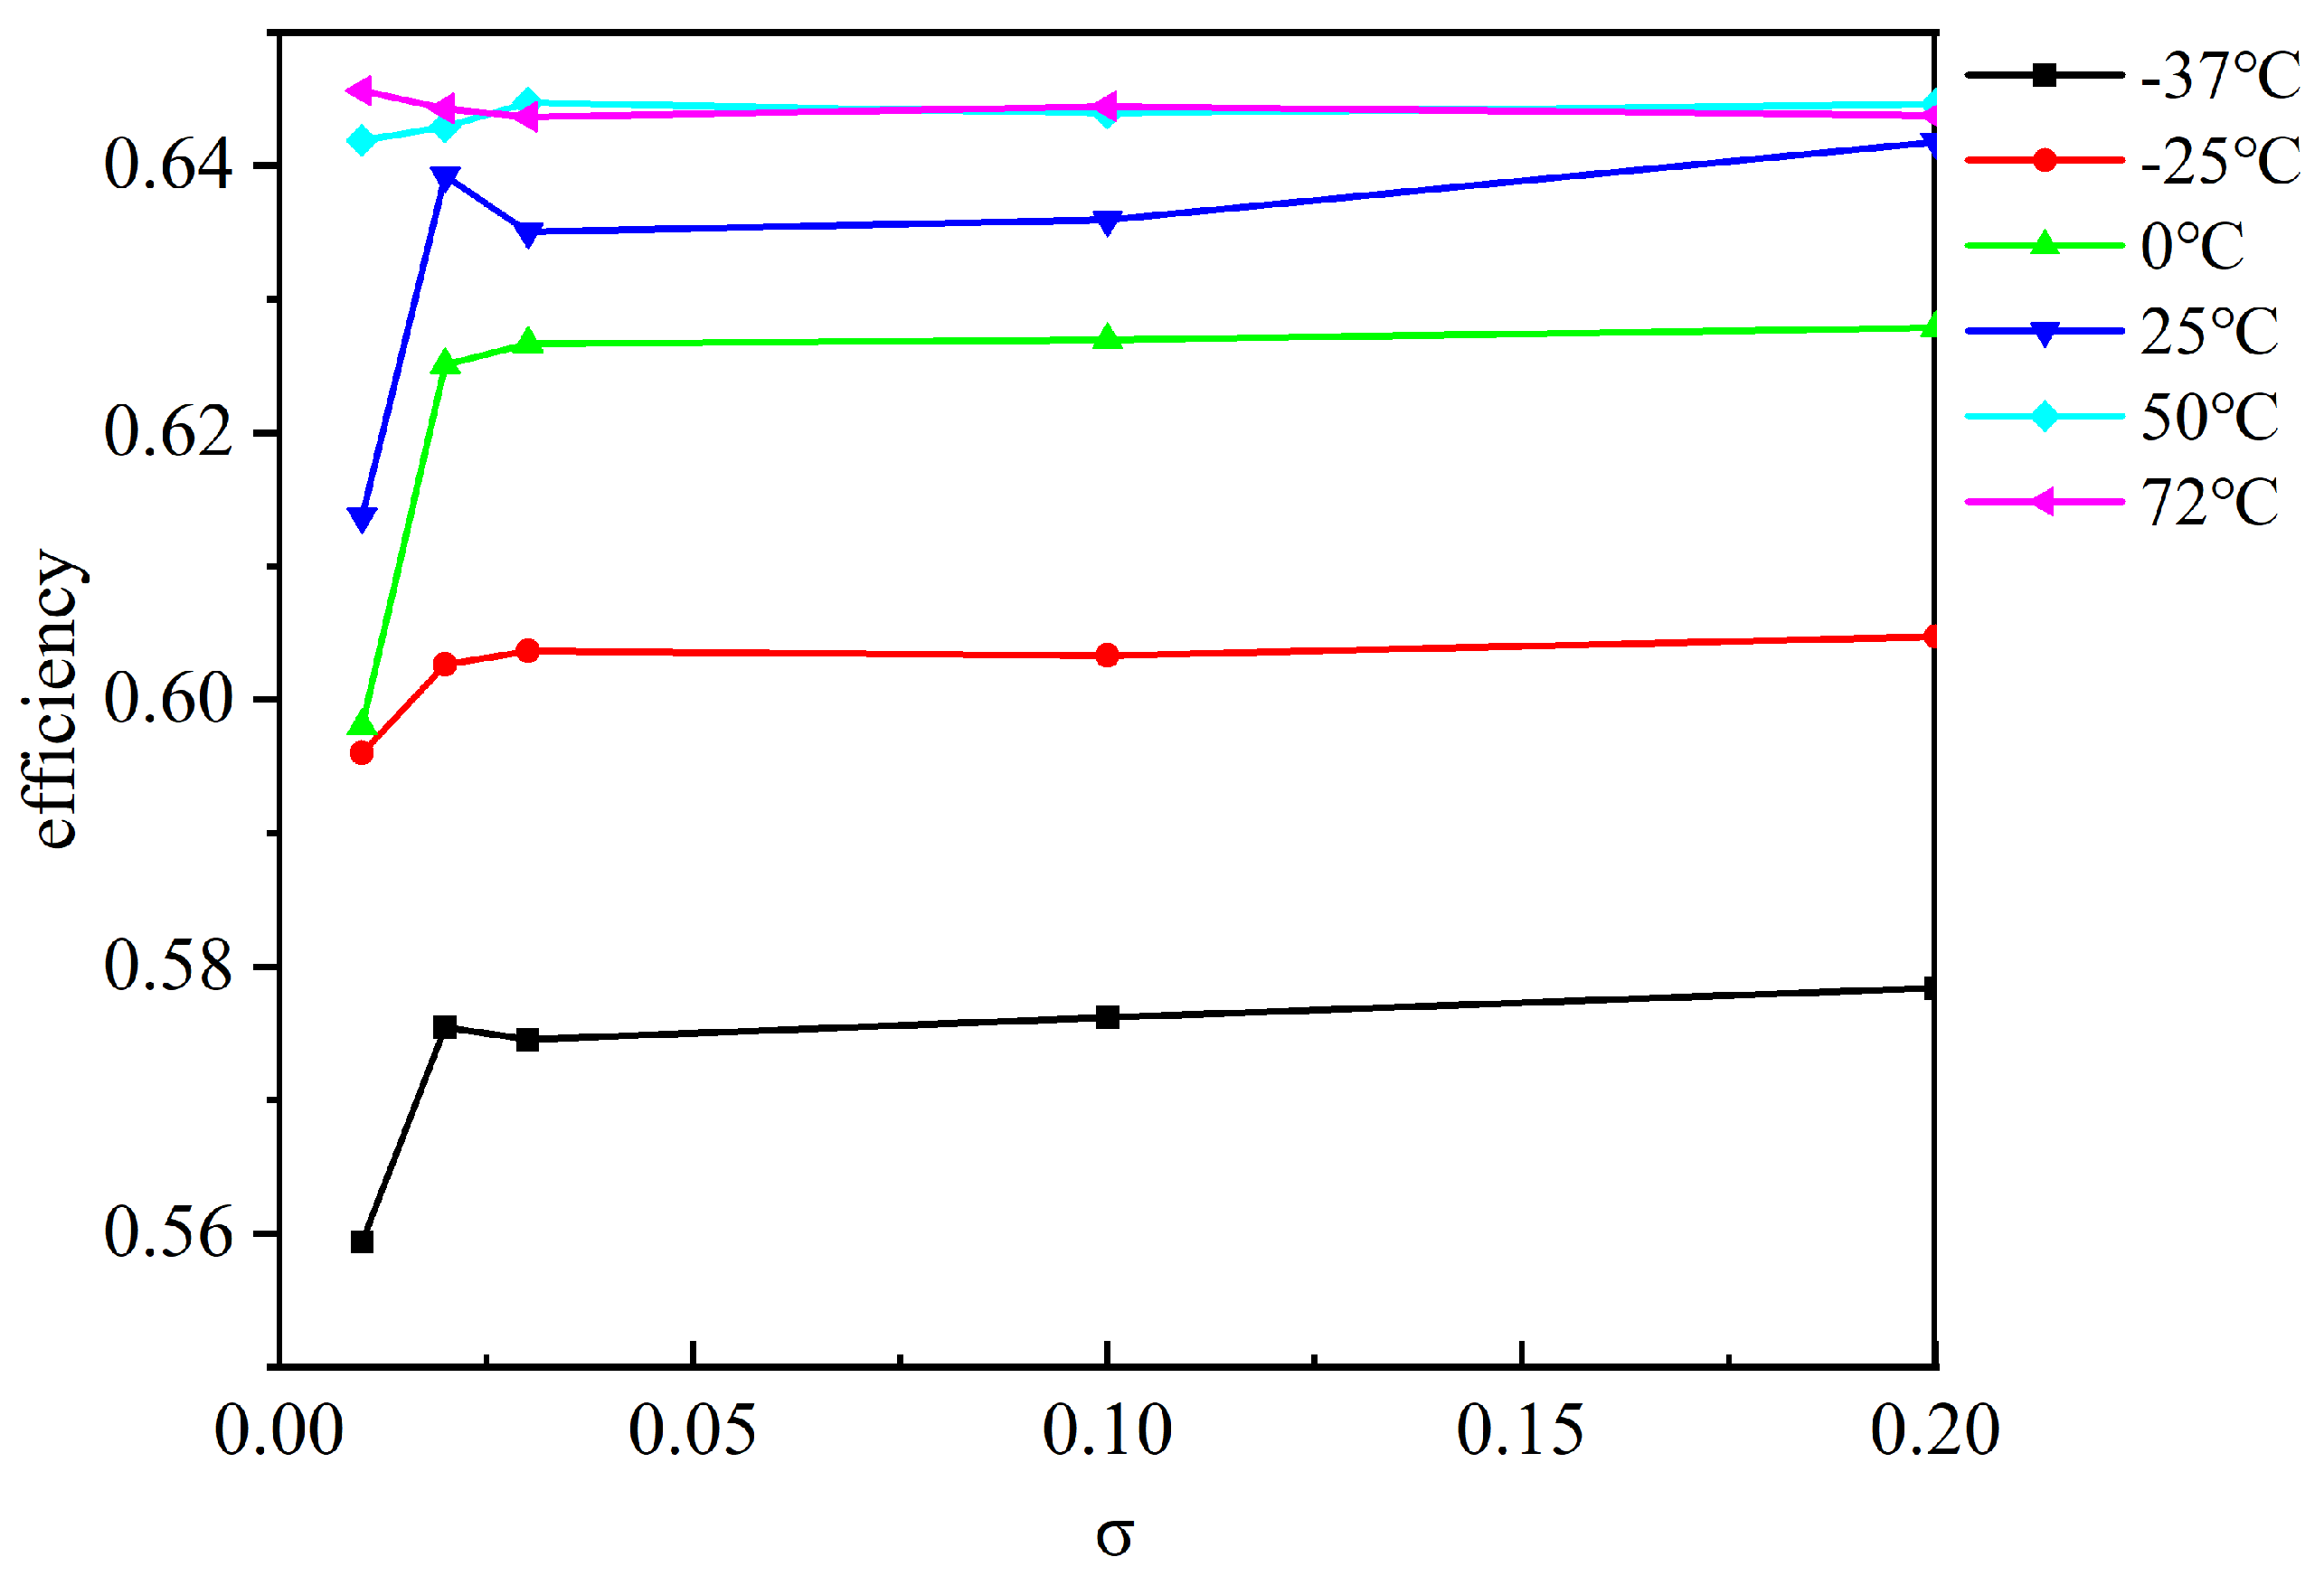
Figure 5 displays the efficiency variation of the micropump with cavitation number under rated flow across different temperature ranges. The results show that cavitation is suppressed at higher temperatures, resulting in a progressively weaker influence on efficiency as temperature increases. Under low-temperature conditions, once the cavitation number drops below the critical value of 0.02, pump efficiency decreases significantly with further reductions in . At elevated temperatures, localized cooling in the cavitation region reduces the local saturated vapor pressure, thereby suppressing cavitation. This suppression weakens as the temperature decreases. However, when the temperature falls below 0 °C, the overall saturated vapor pressure within the impeller drops, resulting in slightly less developed cavitation compared to the 0 °C case.
Figure 5.
Efficiency vs. Cavitation Number () at Rated Flow and Various Temperatures.
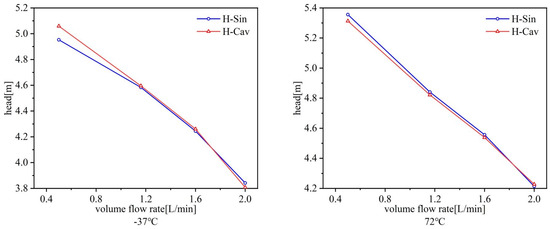
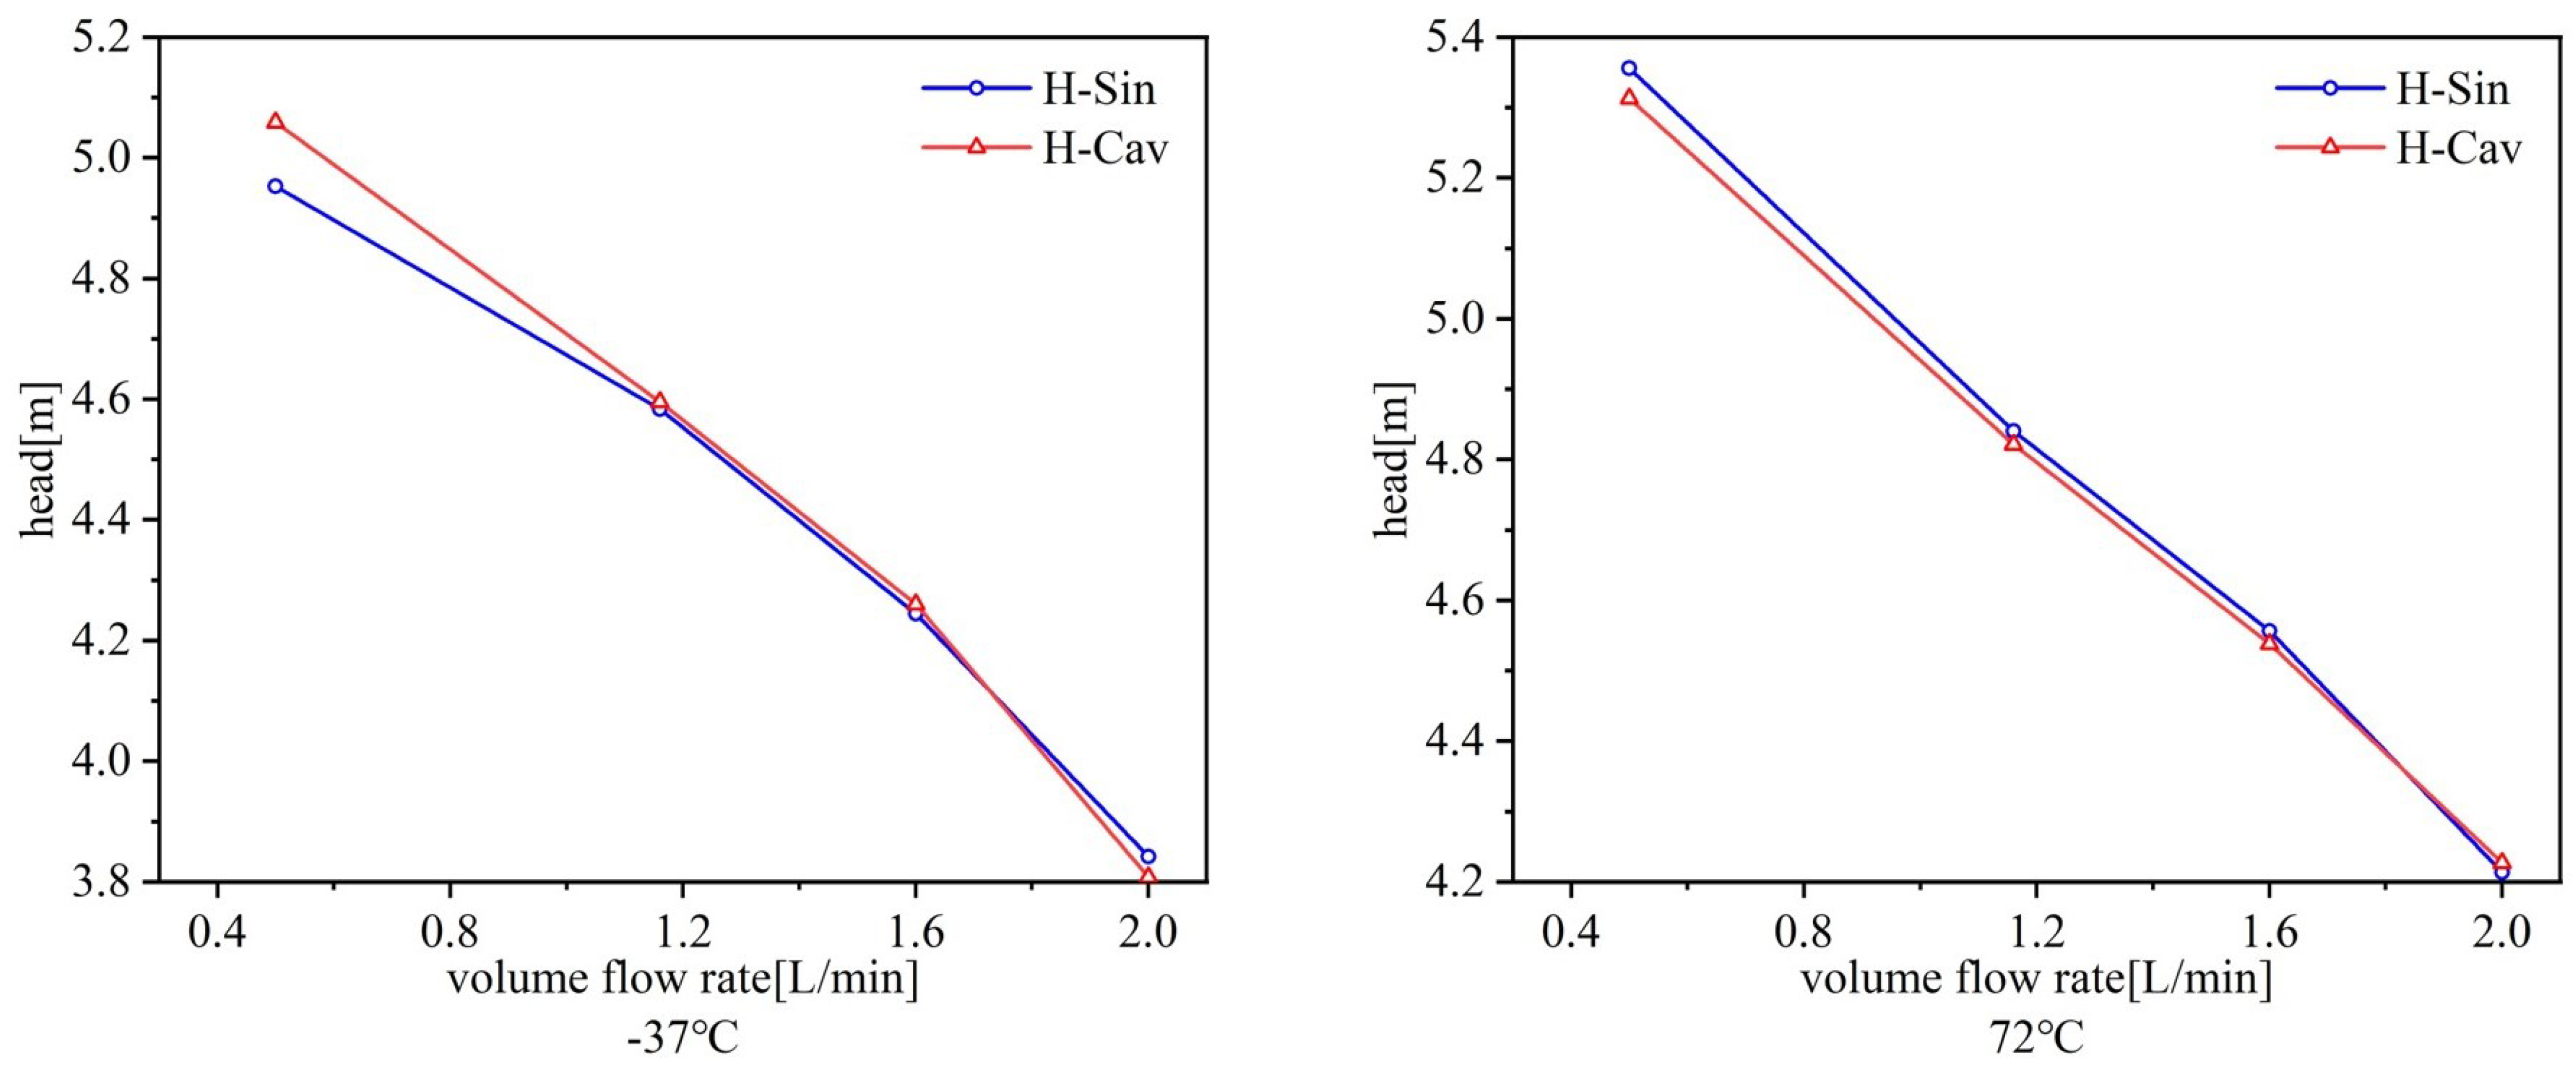
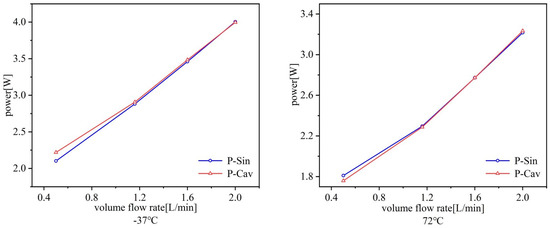
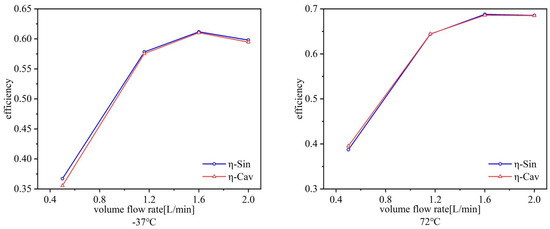
Figure 6, Figure 7 and Figure 8 exhibit the head, shaft power, and efficiency characteristics of the space micropump at −37 °C and 72 °C under non-cavitating conditions and at a cavitation number of . A contrasting temperature dependence is observed in cavitation effects. At high temperatures, local temperature depression lowers the saturated vapor pressure, inhibiting cavitation and reducing its influence on performance. This suppression is further augmented at higher flow rates, where cavitation impacts on head, shaft power, and efficiency become progressively weaker.
Figure 6.
Head-Flow Characteristics at −37 °C and 72 °C: Comparison Between Non-Cavitating Conditions and .
Figure 7.
Shaft Power vs. Flow Rate at for −37 °C and 72 °C.
Figure 8.
Efficiency vs. Flow Rate at for −37 °C and 72 °C.
4.2. Analysis of Cavitation Internal Flow Characteristics Under Different Incoming Flow Temperatures
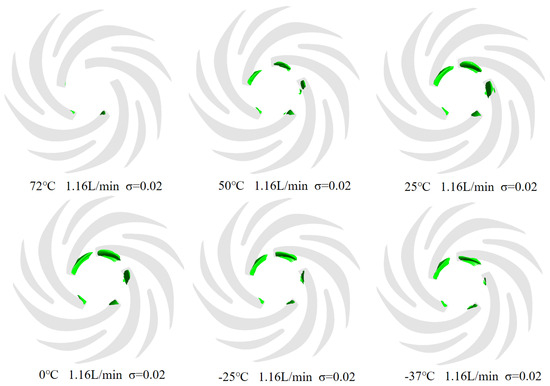
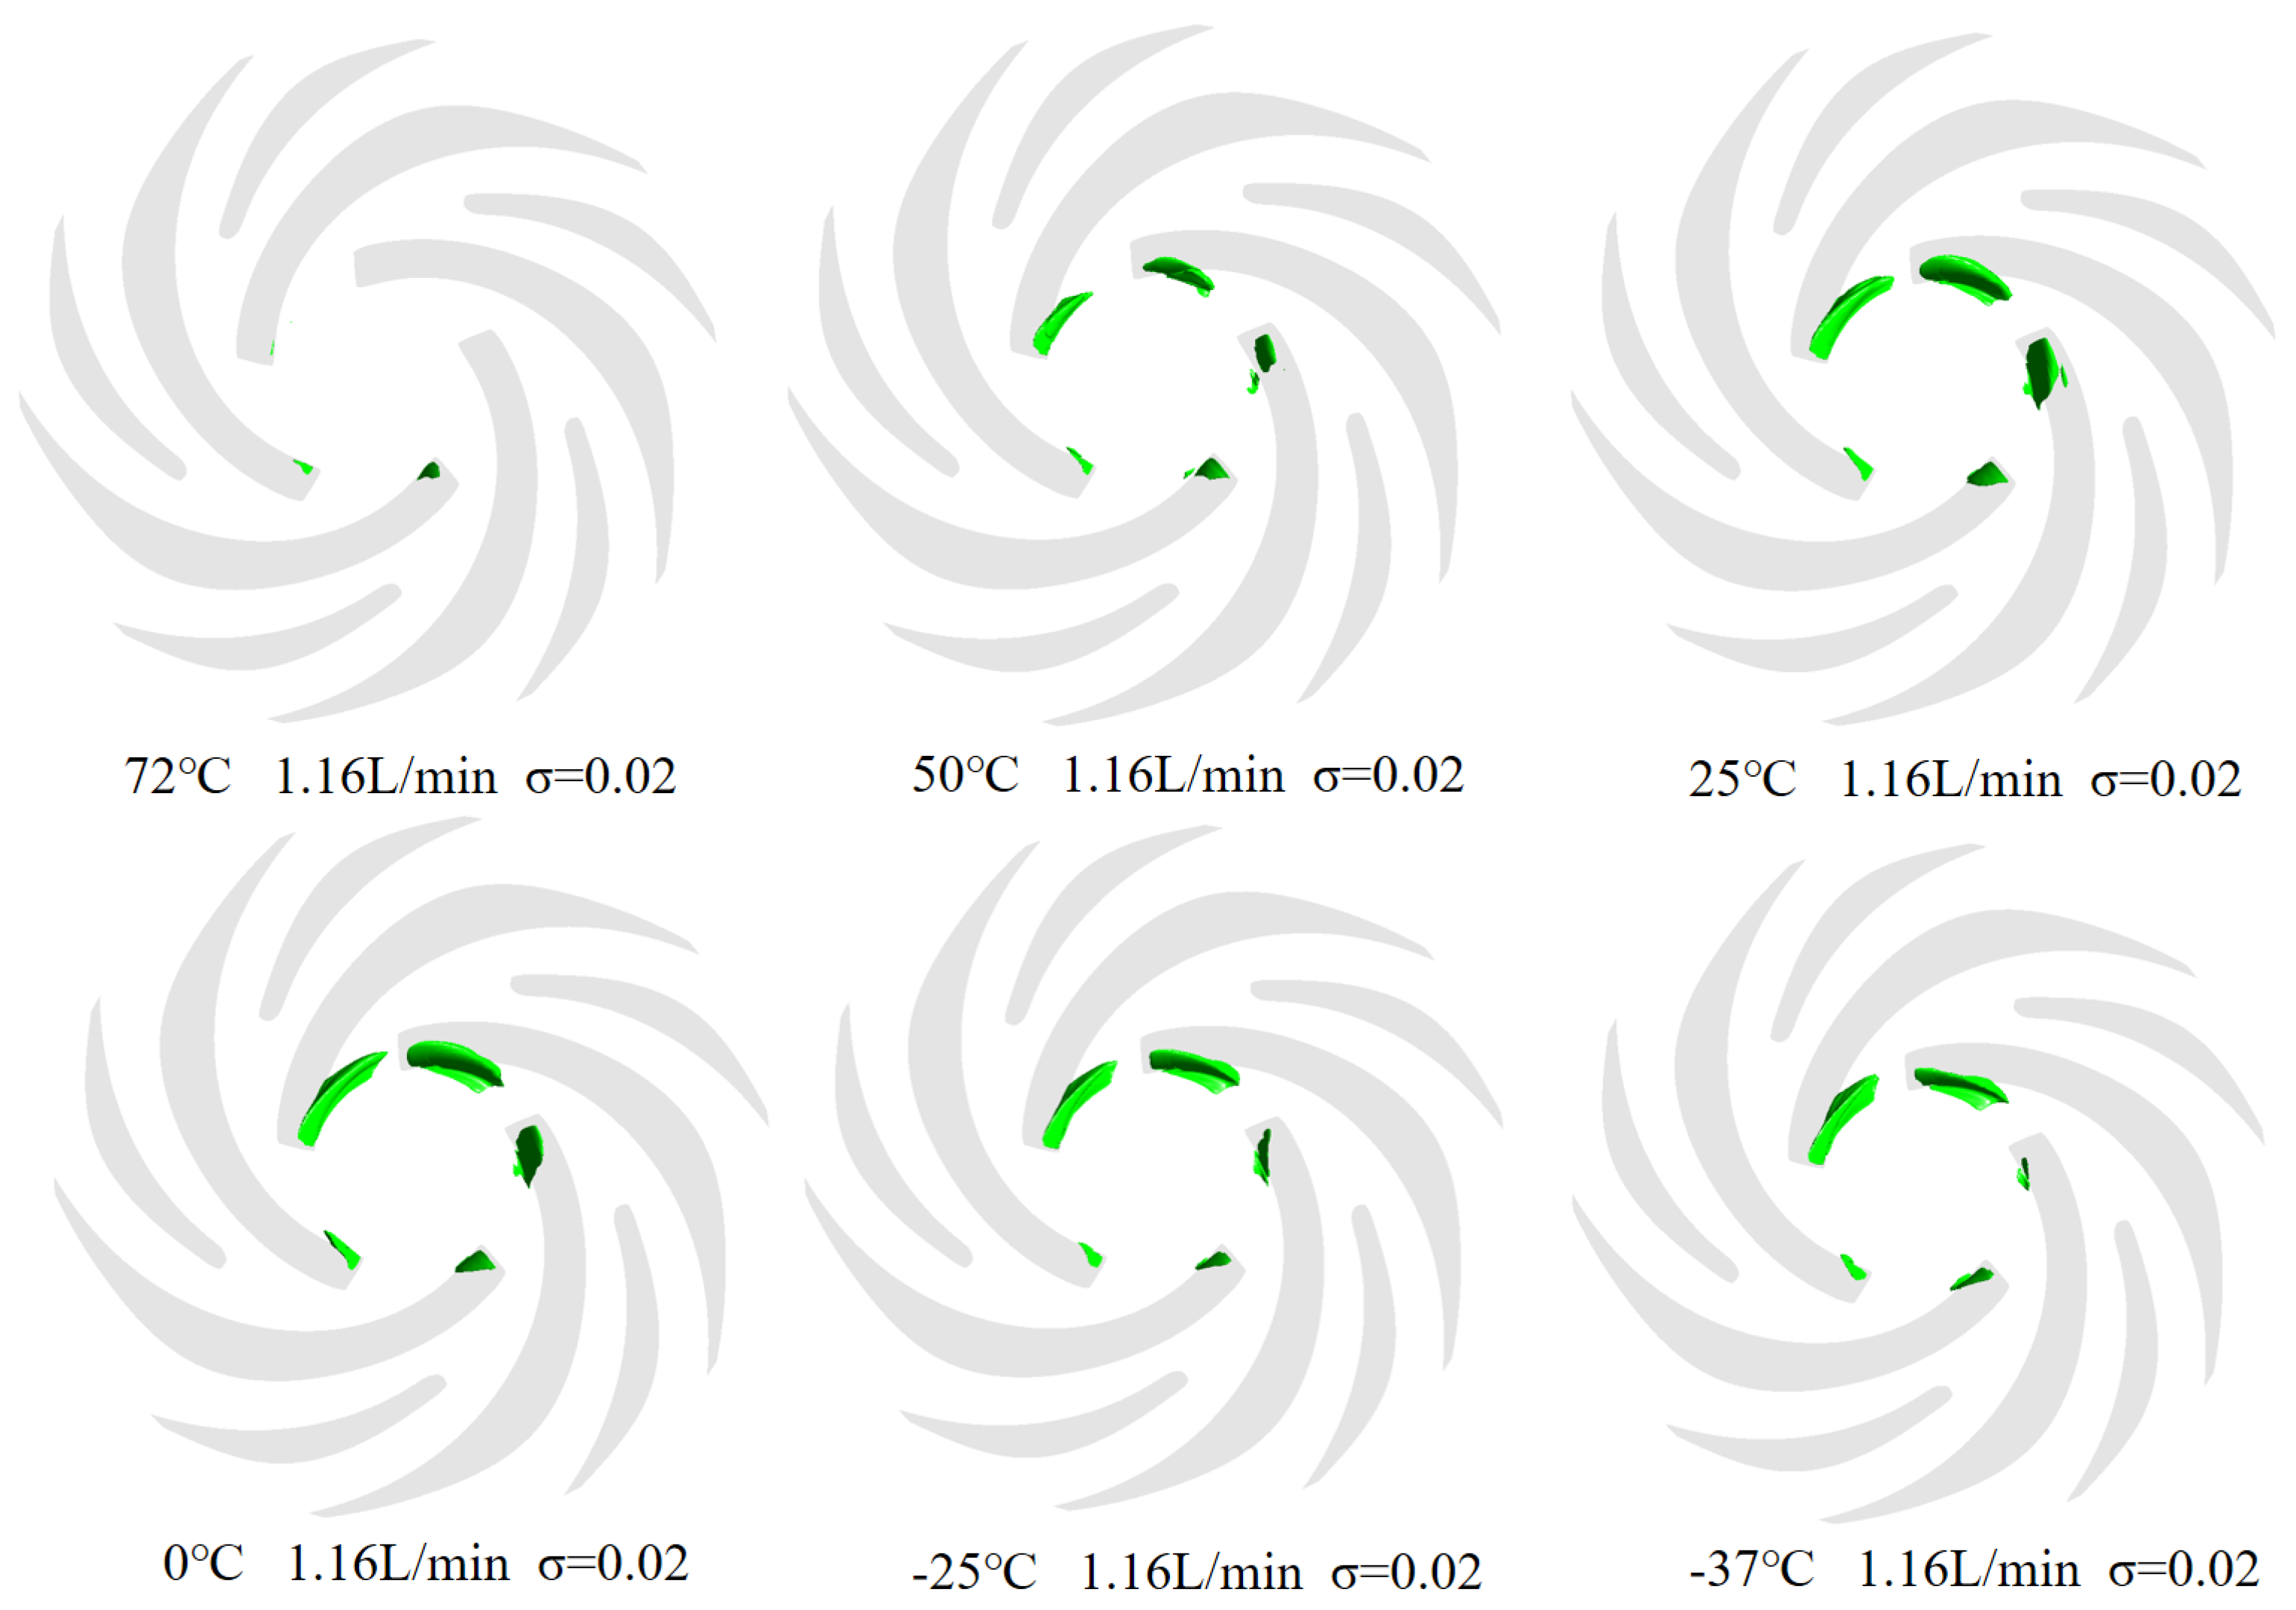
Figure 9 demonstrates the vapor cavity distribution of perfluorotriethylamine in the space micropump at a cavitation number of 0.02 under rated flow and varying temperatures. At 72 °C, cavities are fewer, smaller, and more dispersed. As temperature decreases, cavity number and size increase, and their distribution becomes more concentrated. This trend results from reduced liquid vaporization coupled with enhanced cavity stability at lower temperatures, which promotes cavity formation and persistence. At 0 °C, the impeller region is largely covered by a dense distribution of increased cavitation bubbles in both size and quantity. With further temperature drop, the reduced vaporization rate limits bubble formation, resulting in fewer cavitation bubbles. These observations align with the temperature-dependent cavitation trends identified in the external characteristic analysis.
Figure 9.
Vapor Cavity Distribution of Perfluorotriethylamine at , Rated Flow, and Various Temperatures. (Green represents the vapor cavity, the darker the color, the more vapor cavities).
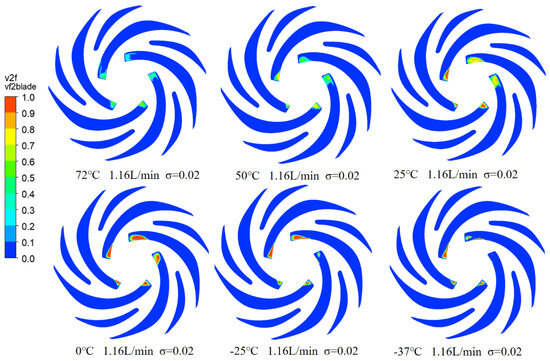
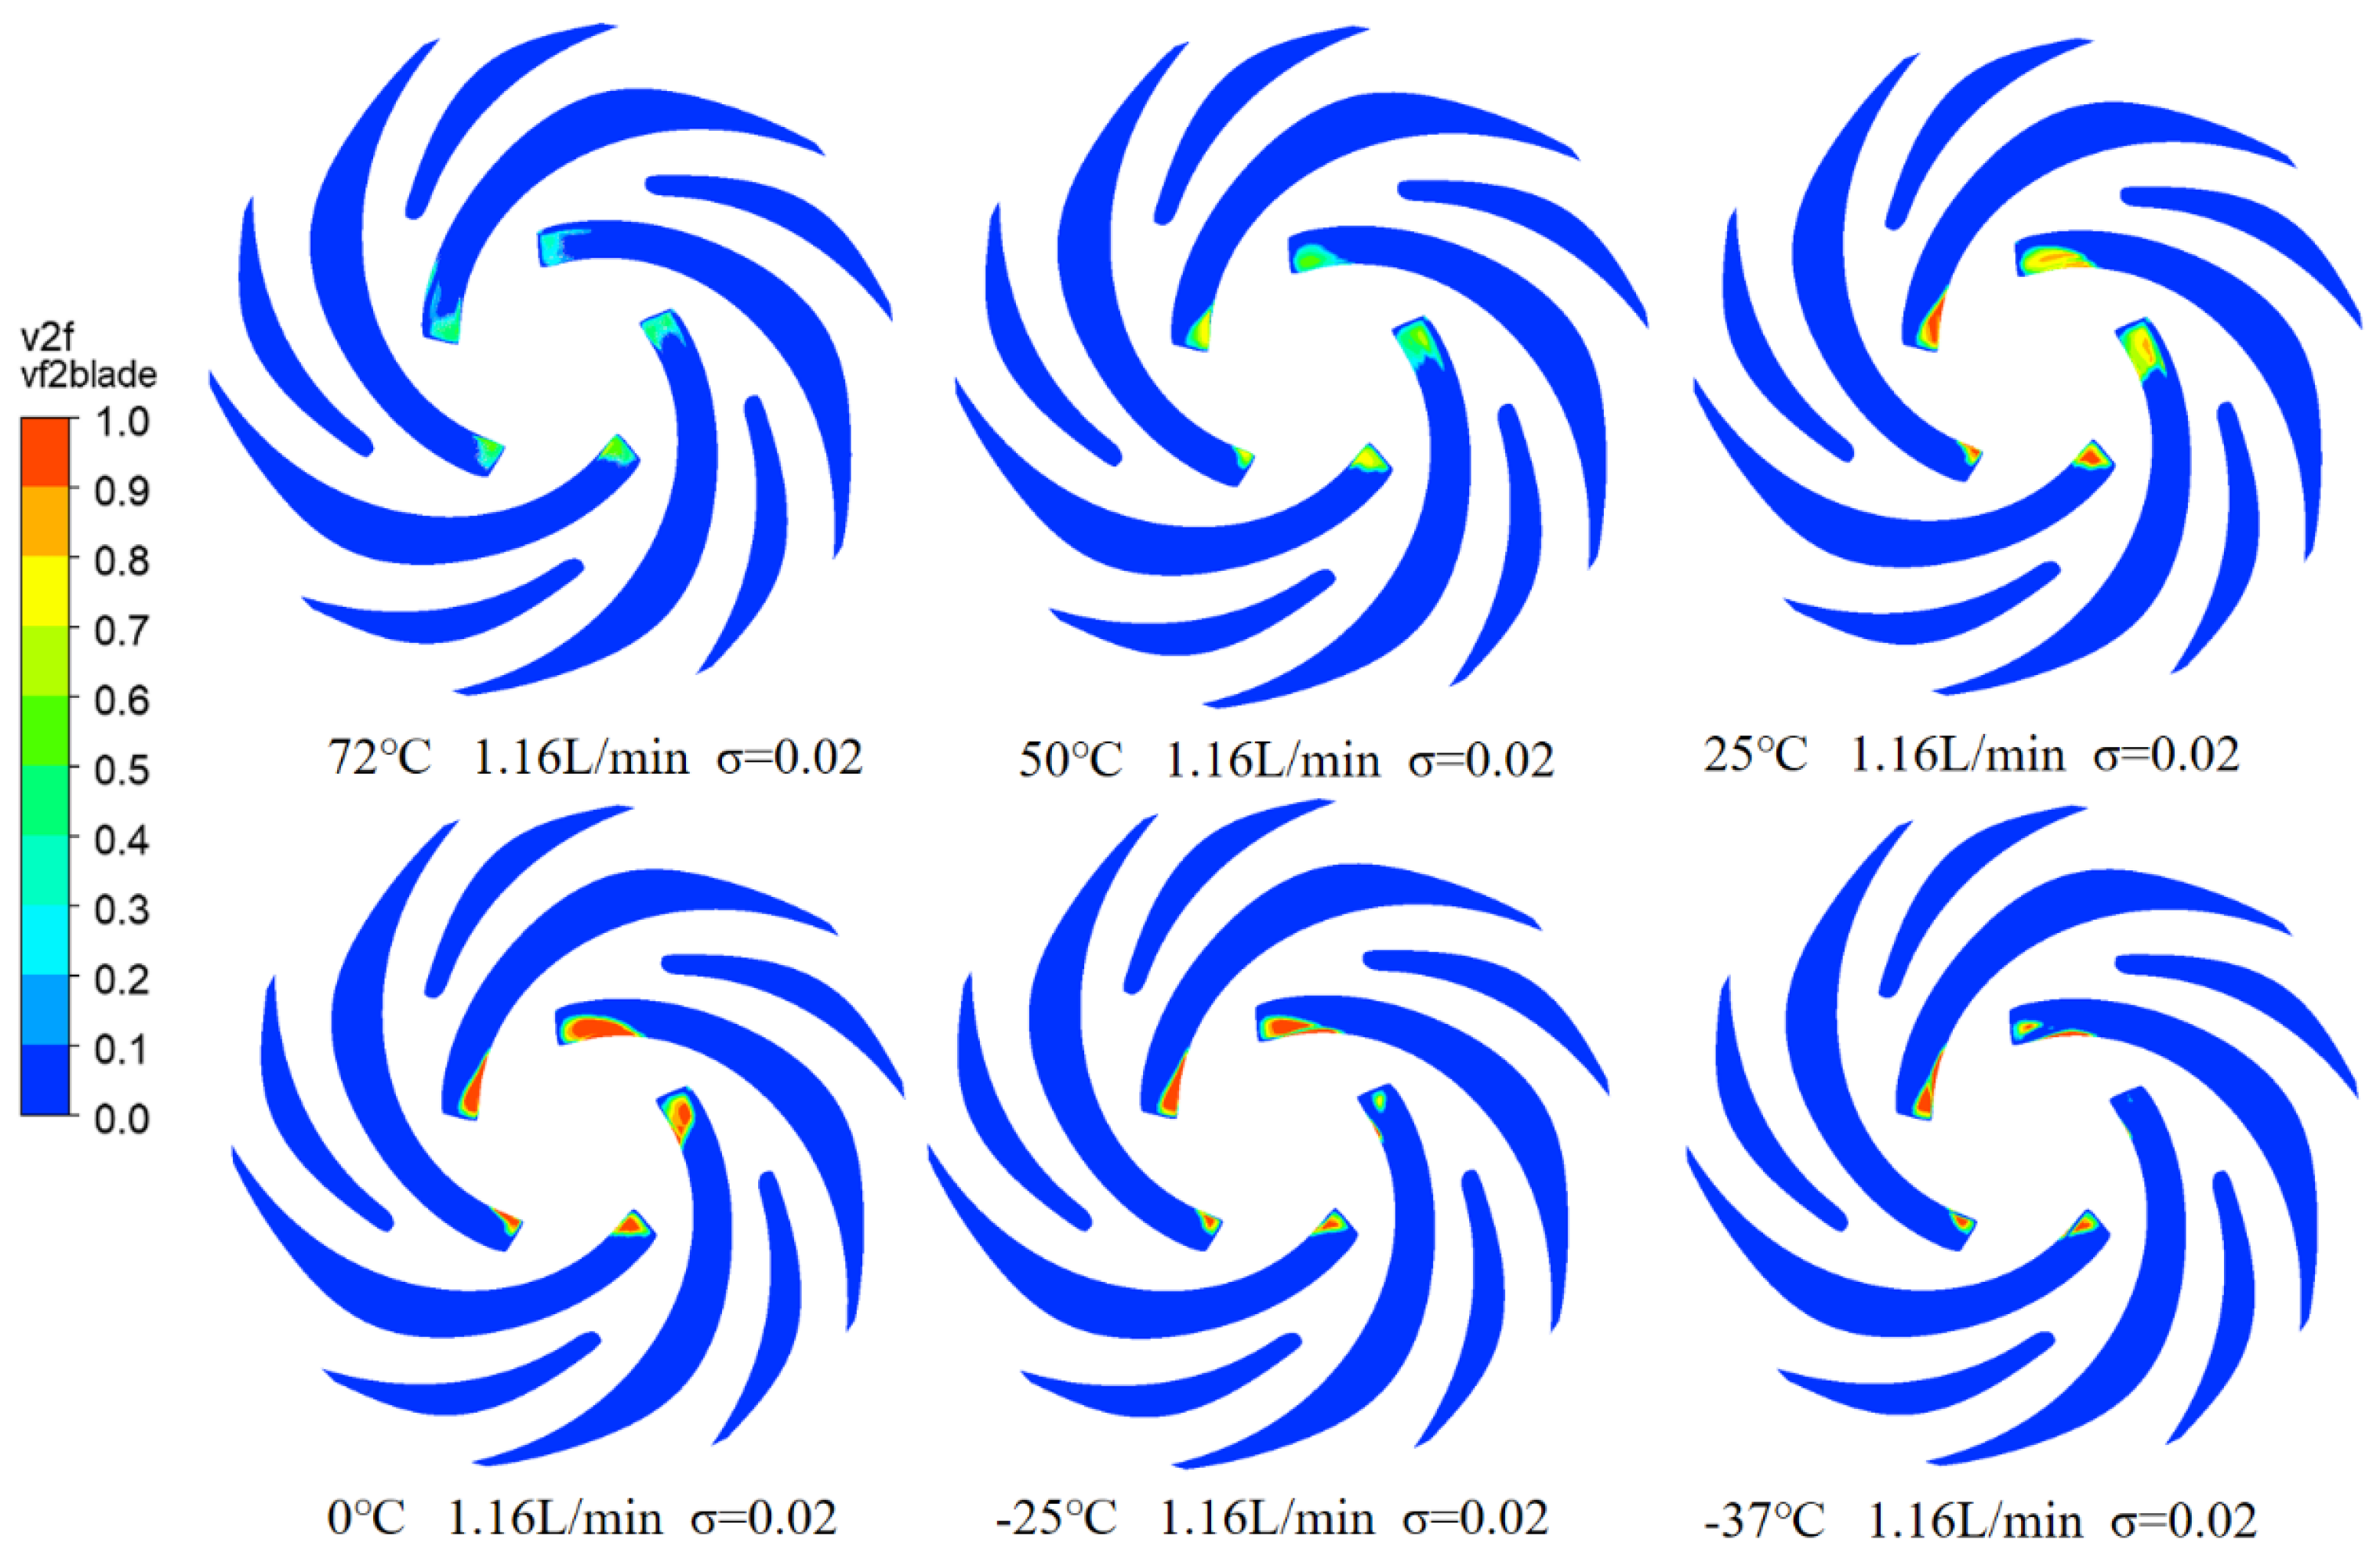
Figure 10 and Figure 11 illustrate the vapor volume fraction distribution of perfluorotriethylamine on the blades and lower cover plate of the space micropump at a cavitation number of 0.02 under rated flow across different temperatures. At 72 °C, the distribution is relatively uniform, though most regions exhibit low vapor volume fractions, with only isolated areas showing higher values. As the temperature decreases, the vapor becomes increasingly concentrated, and zones of high vapor volume fraction expand slightly on the blade surfaces. At 0 °C and –25 °C, the vapor volume fraction rises further, and high-fraction regions grow more pronounced and non-uniform, displaying even larger values. By –37 °C, the vapor volume fraction peaks, with most blade areas exhibiting high values and a markedly non-uniform distribution. These results indicate that lower temperatures promote greater liquid vaporization, leading to higher and more widespread vapor volume fractions.
Figure 10.
Vapor Volume Fraction Distribution on Blades at , Rated Flow, and Various Temperatures.
Figure 11.
Vapor Volume Fraction Distribution on Lower Cover at , Rated Flow, and Various Temperatures.
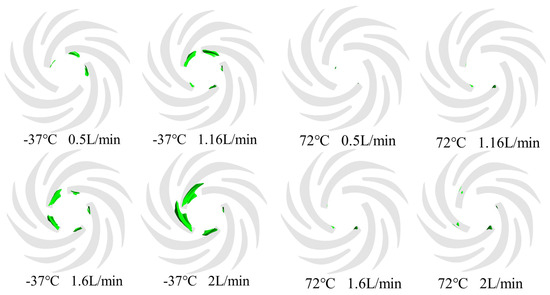
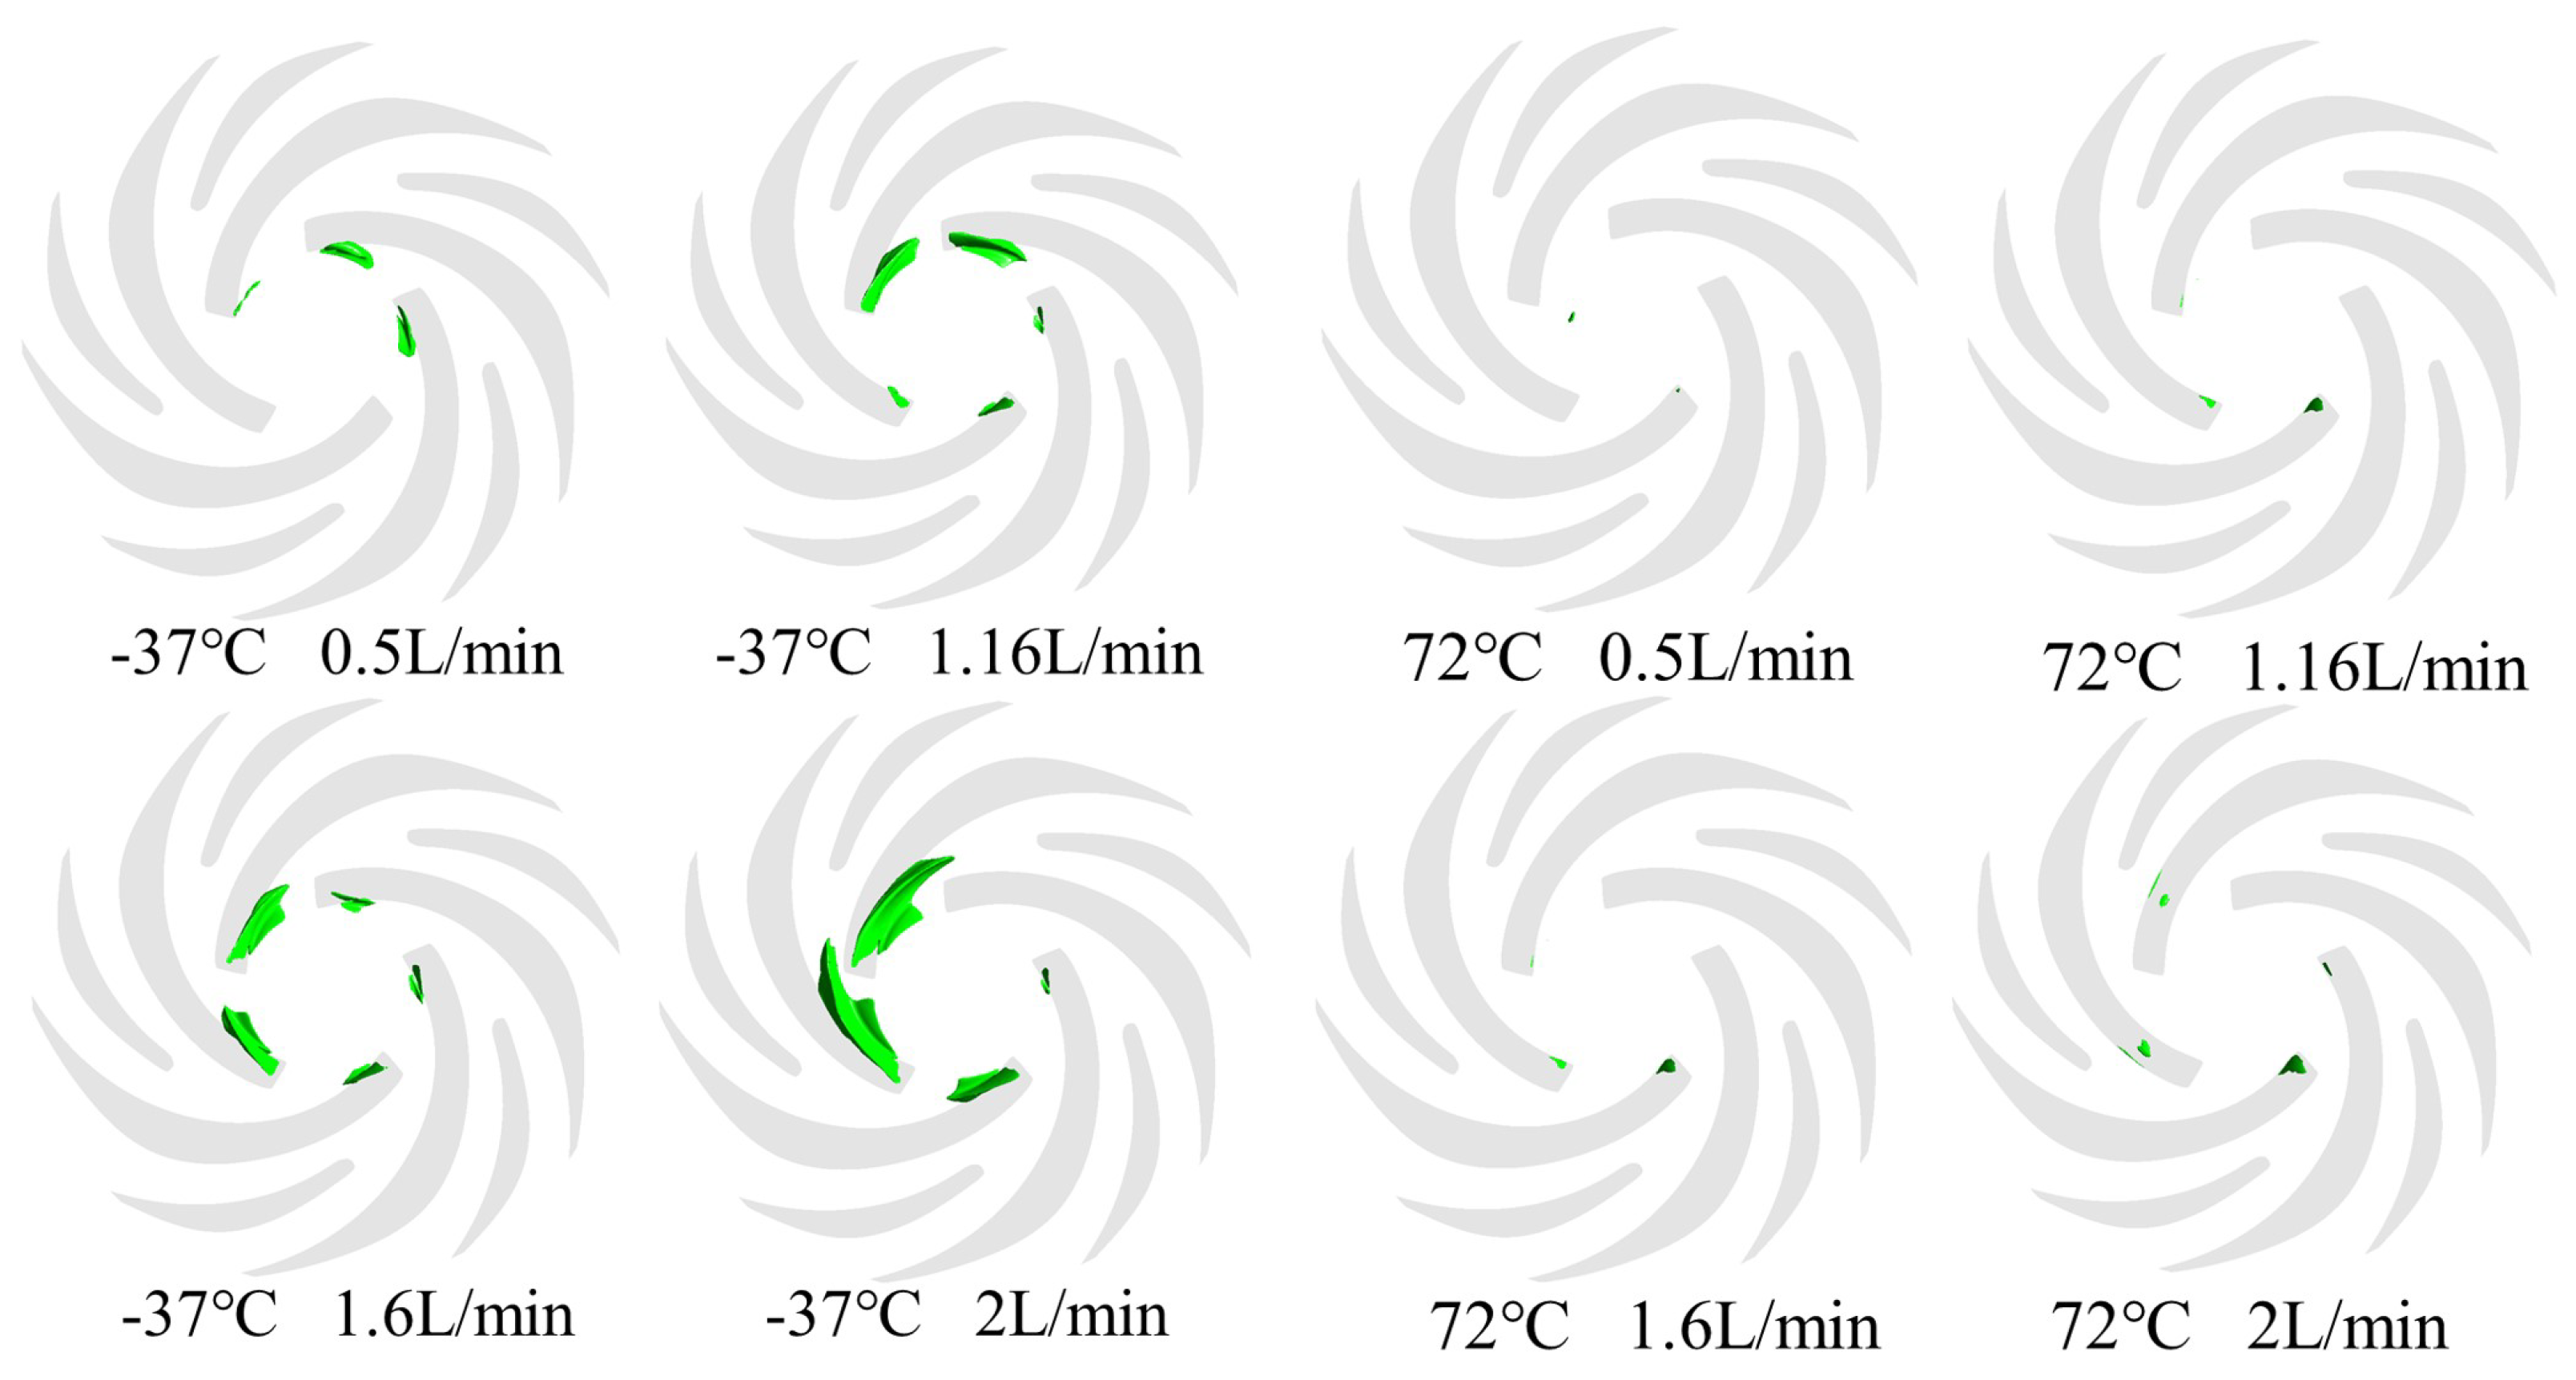
Figure 12 exhibits the vapor cavity distribution of perfluorotriethylamine in the space micropump at a cavitation number of 0.02 under different flow rates and temperatures. At high temperature and low flow rate, cavitation bubbles are few, small, and widely dispersed, indicating a mild cavitation state with minimal impact on pump performance. As the flow rate increases, the number of cavitation bubbles rises sharply, and the distribution becomes significantly denser, eventually covering most of the impeller passage. This suggests that at higher flow rates, cavitation bubble formation and stability are enhanced, exerting a more pronounced influence on pump performance. A similar trend is observed under low-temperature conditions.
Figure 12.
Cavitation Bubble Morphology at : Comparison Between −37 °C and 72 °C at Various Flow Rates. (Green represents the vapor cavity, the darker the color, the more vapor cavities).
A comparison between high- and low-temperature results reveals a consistent trend: regardless of temperature, both the number and size of cavitation bubbles increase with flow rate, and their distribution becomes denser. This indicates that flow rate is the primary factor governing cavitation formation and distribution, while temperature additionally influences the specific morphological characteristics of the cavitation bubbles.
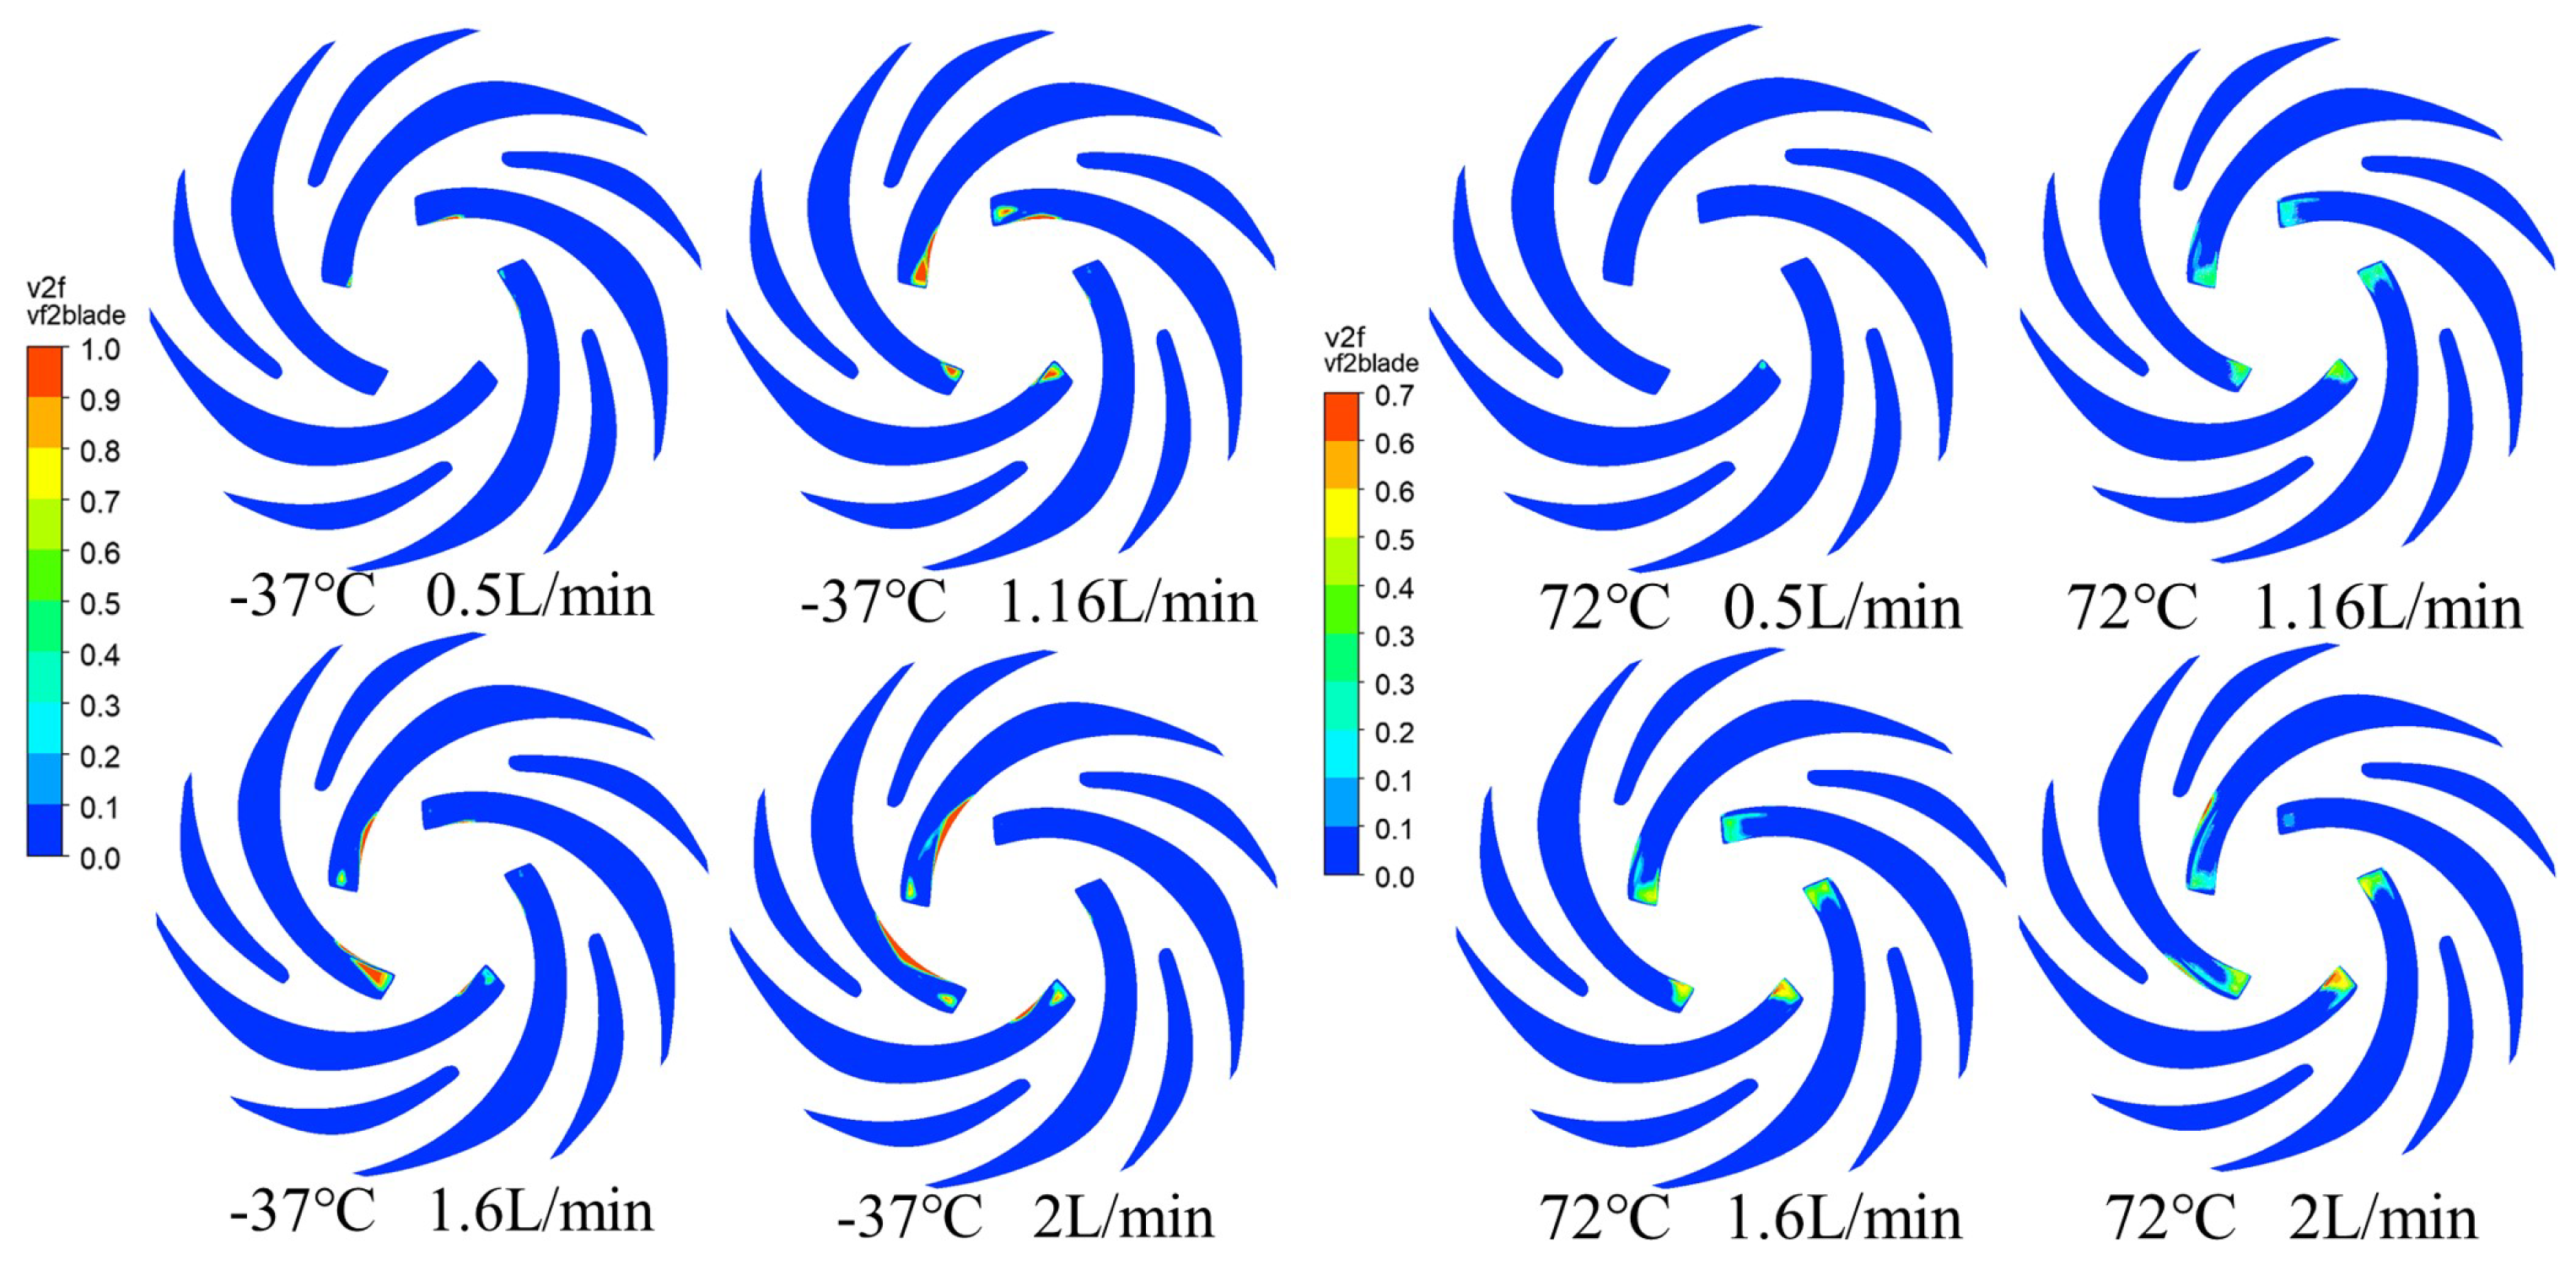
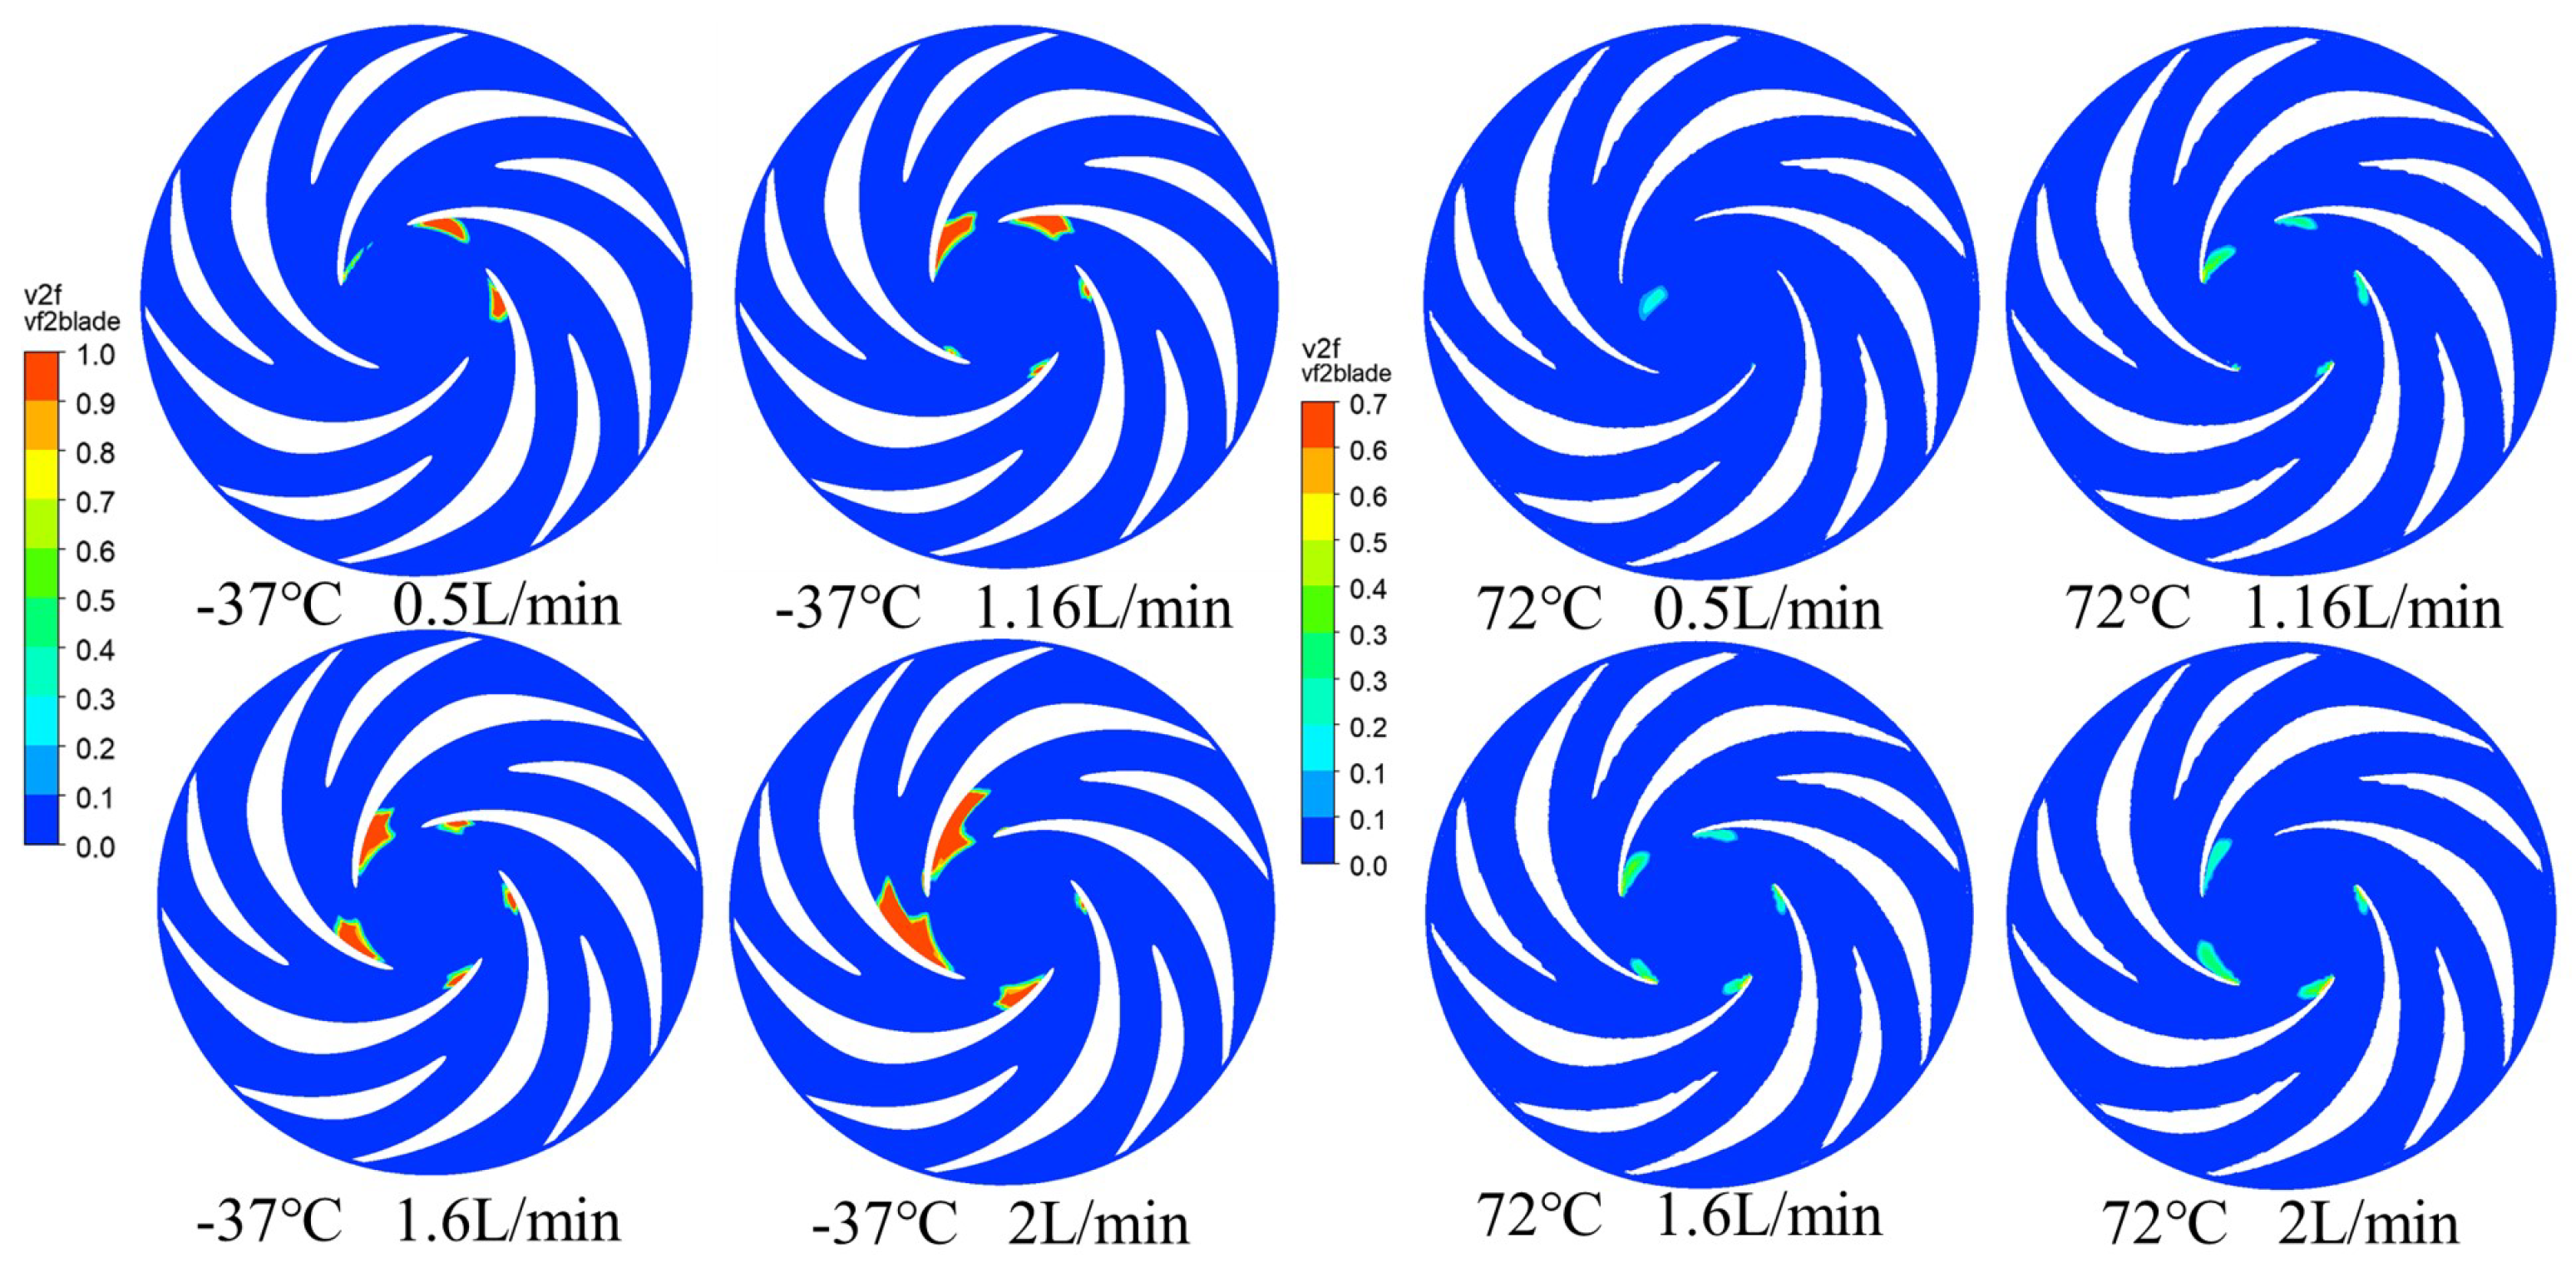
Figure 13 and Figure 14 show the vapor volume fraction distribution on the blades and lower cover plate of the space micropump at a cavitation number of 0.02 for two temperatures (−37 °C and 72 °C) under varying flow rates. At low flow rates, the distribution is relatively uniform, with most regions exhibiting low vapor fractions and only isolated areas showing elevated values—indicating limited and dispersed vapor generation. As the flow rate increases, zones of high vapor fraction expand across the blade surfaces. At the highest flow rate of 2.0 L/min, these regions become more pronounced and unevenly distributed, accompanied by a marked increase in local vapor volume fraction.
Figure 13.
Vapor Volume Fraction Distribution on Blades at : −37 °C vs. 72 °C at Various Flow Rates.
Figure 14.
Vapor Volume Fraction Distribution on Lower Cover at : −37 °C vs. 72 °C at Various Flow Rates.
A comparison of vapor volume fraction distributions at high and low temperatures shows that, irrespective of temperature, the distribution on the blades and lower cover plate grows more non-uniform with increasing flow rate, while regions of high vapor fraction expand progressively. These findings confirm that flow rate is the dominant factor influencing vapor volume fraction distribution.
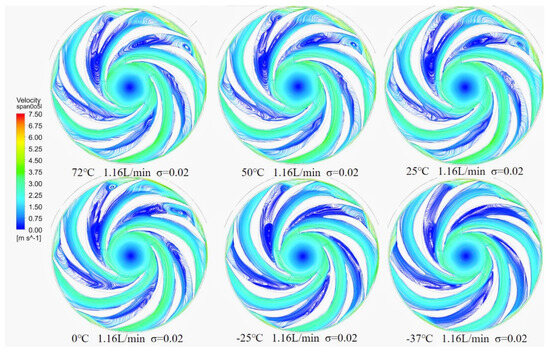
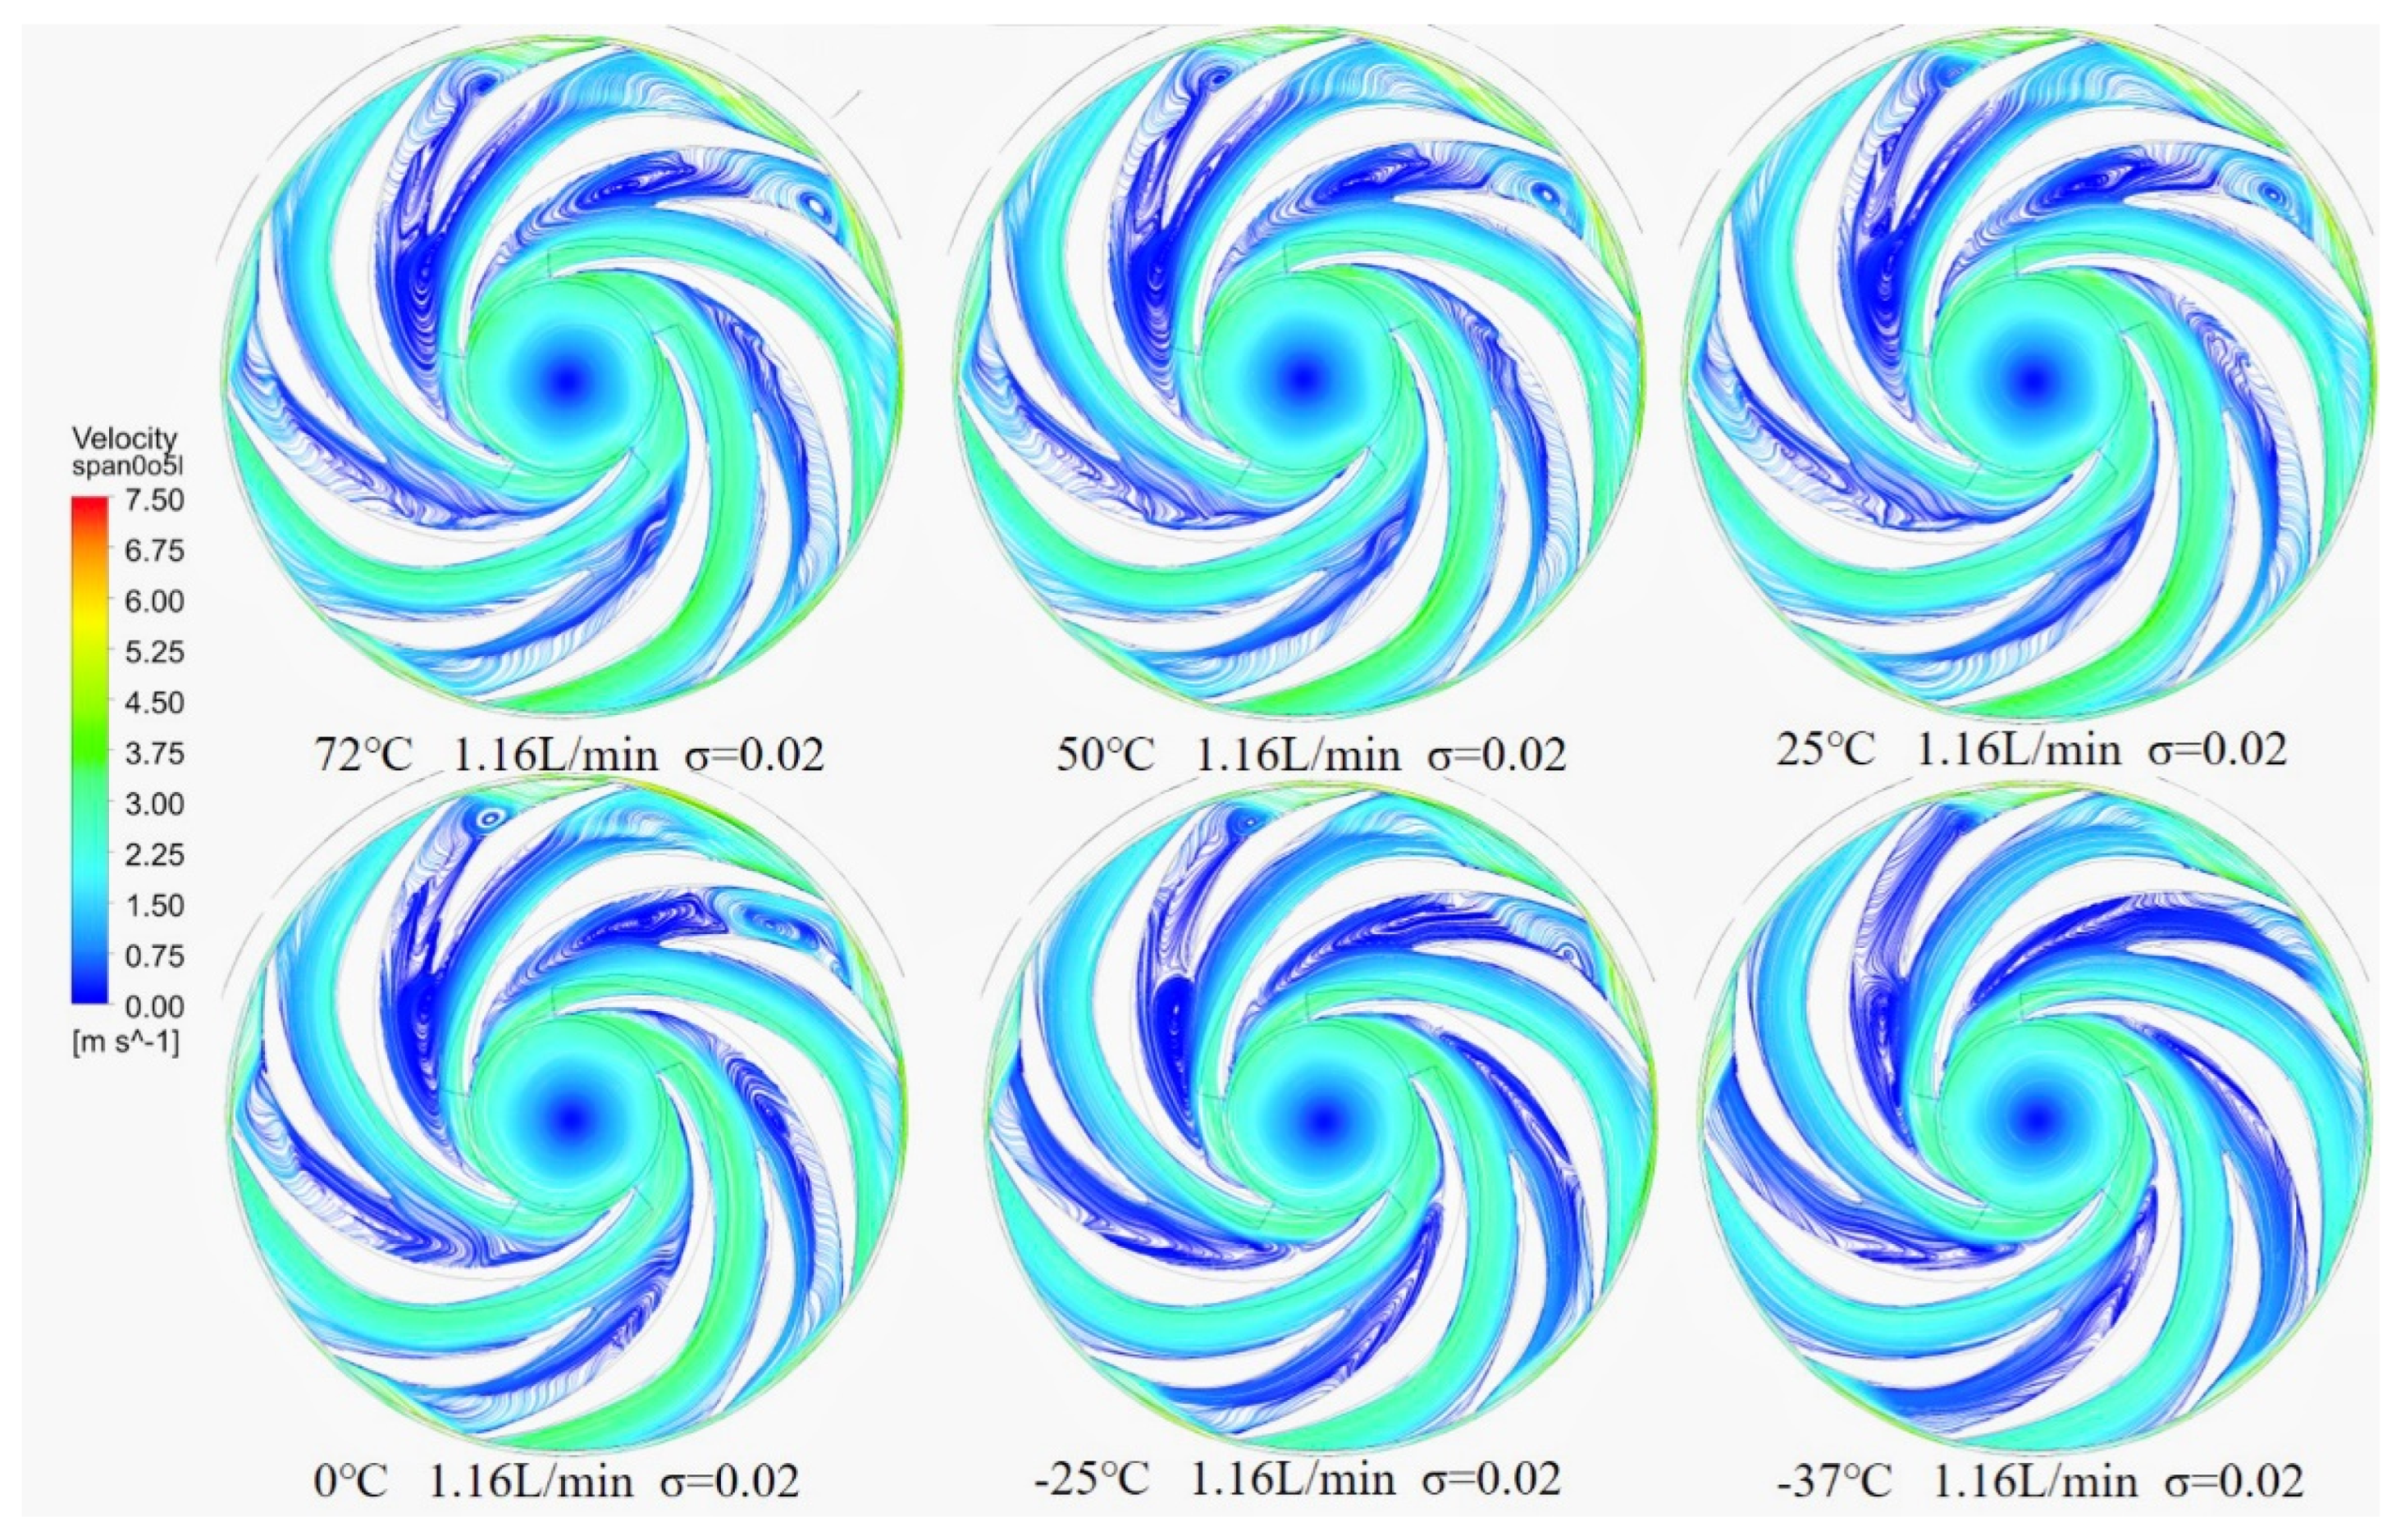
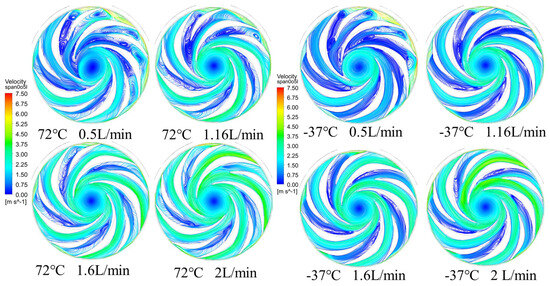
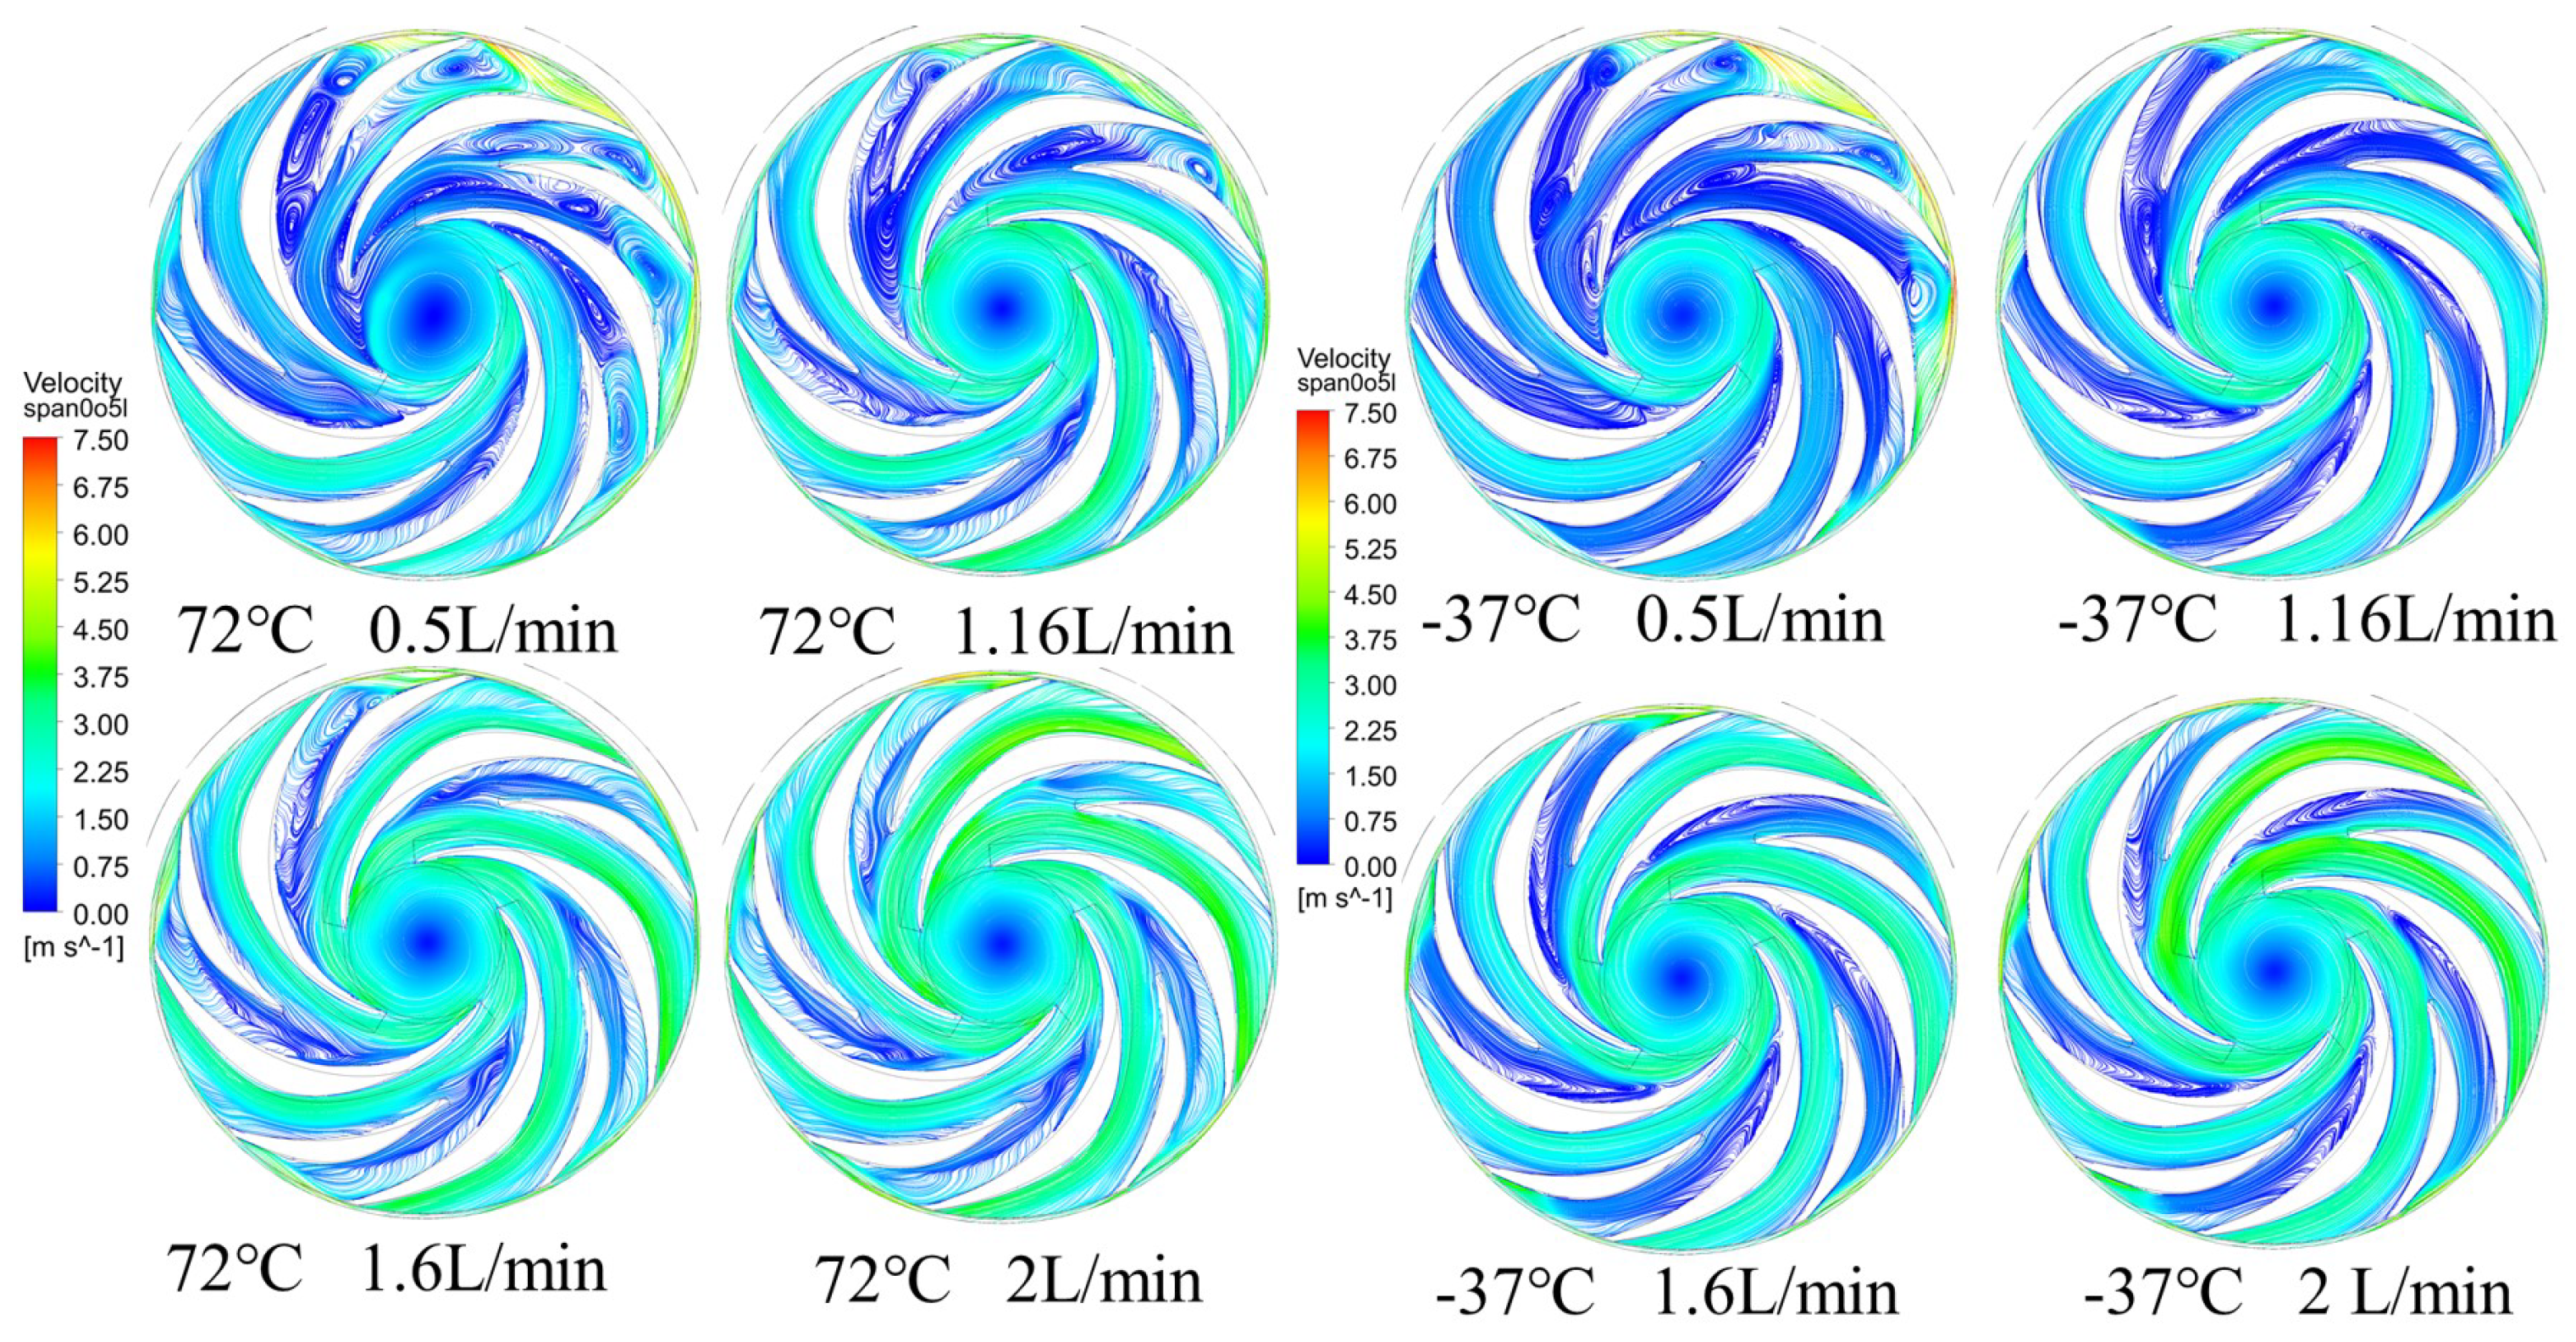
Figure 15 and Figure 16 present streamline diagrams of the intermediate axial section in the impeller region under non-cavitating and cavitating conditions () at −37 °C and 72 °C across various flow rates. With cavitation, flow separation occurs at the suction side near the long blade inlet, marking the cavity inception site. The streamlines increasingly deviate from the blade surface with larger cavity volumes. Downstream of this region, cavitation induces minor disturbances, altering vortex morphology and complicating the flow structure, notably generating small vortices near the diaphragm on the blade’s suction side. In areas of limited cavitation, its influence on the streamlines diminishes. Across both temperatures and all flow rates studied, the observed effects of cavitation on the flow patterns are consistent with the mechanisms described above.
Figure 15.
Streamlines on Impeller Mid-Span Plane at , Rated Flow, and Various Temperatures.
Figure 16.
Streamlines on Impeller Mid-Span Plane at : −37 °C vs. 72 °C at Various Flow Rates.
Cavitation directly modifies the flow field by displacing fluid and altering streamline patterns. The growth of cavitation bubbles compresses the surrounding liquid, which redistributes local pressure and velocity. Stronger cavitation consequently exerts a more pronounced influence on the flow structure. In microgravity environments, surface tension plays a heightened role, retarding cavitation bubble development and limiting the maximum attainable bubble radius. This restraint, in turn, reduces the degree of local fluid compression caused by cavitation.
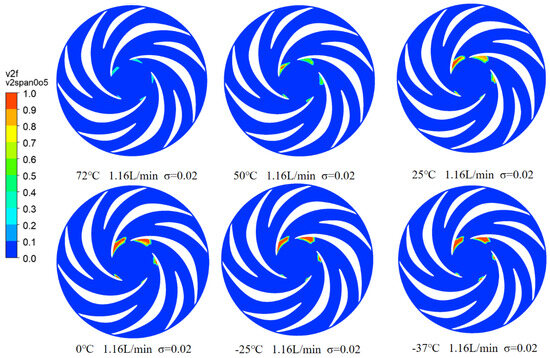
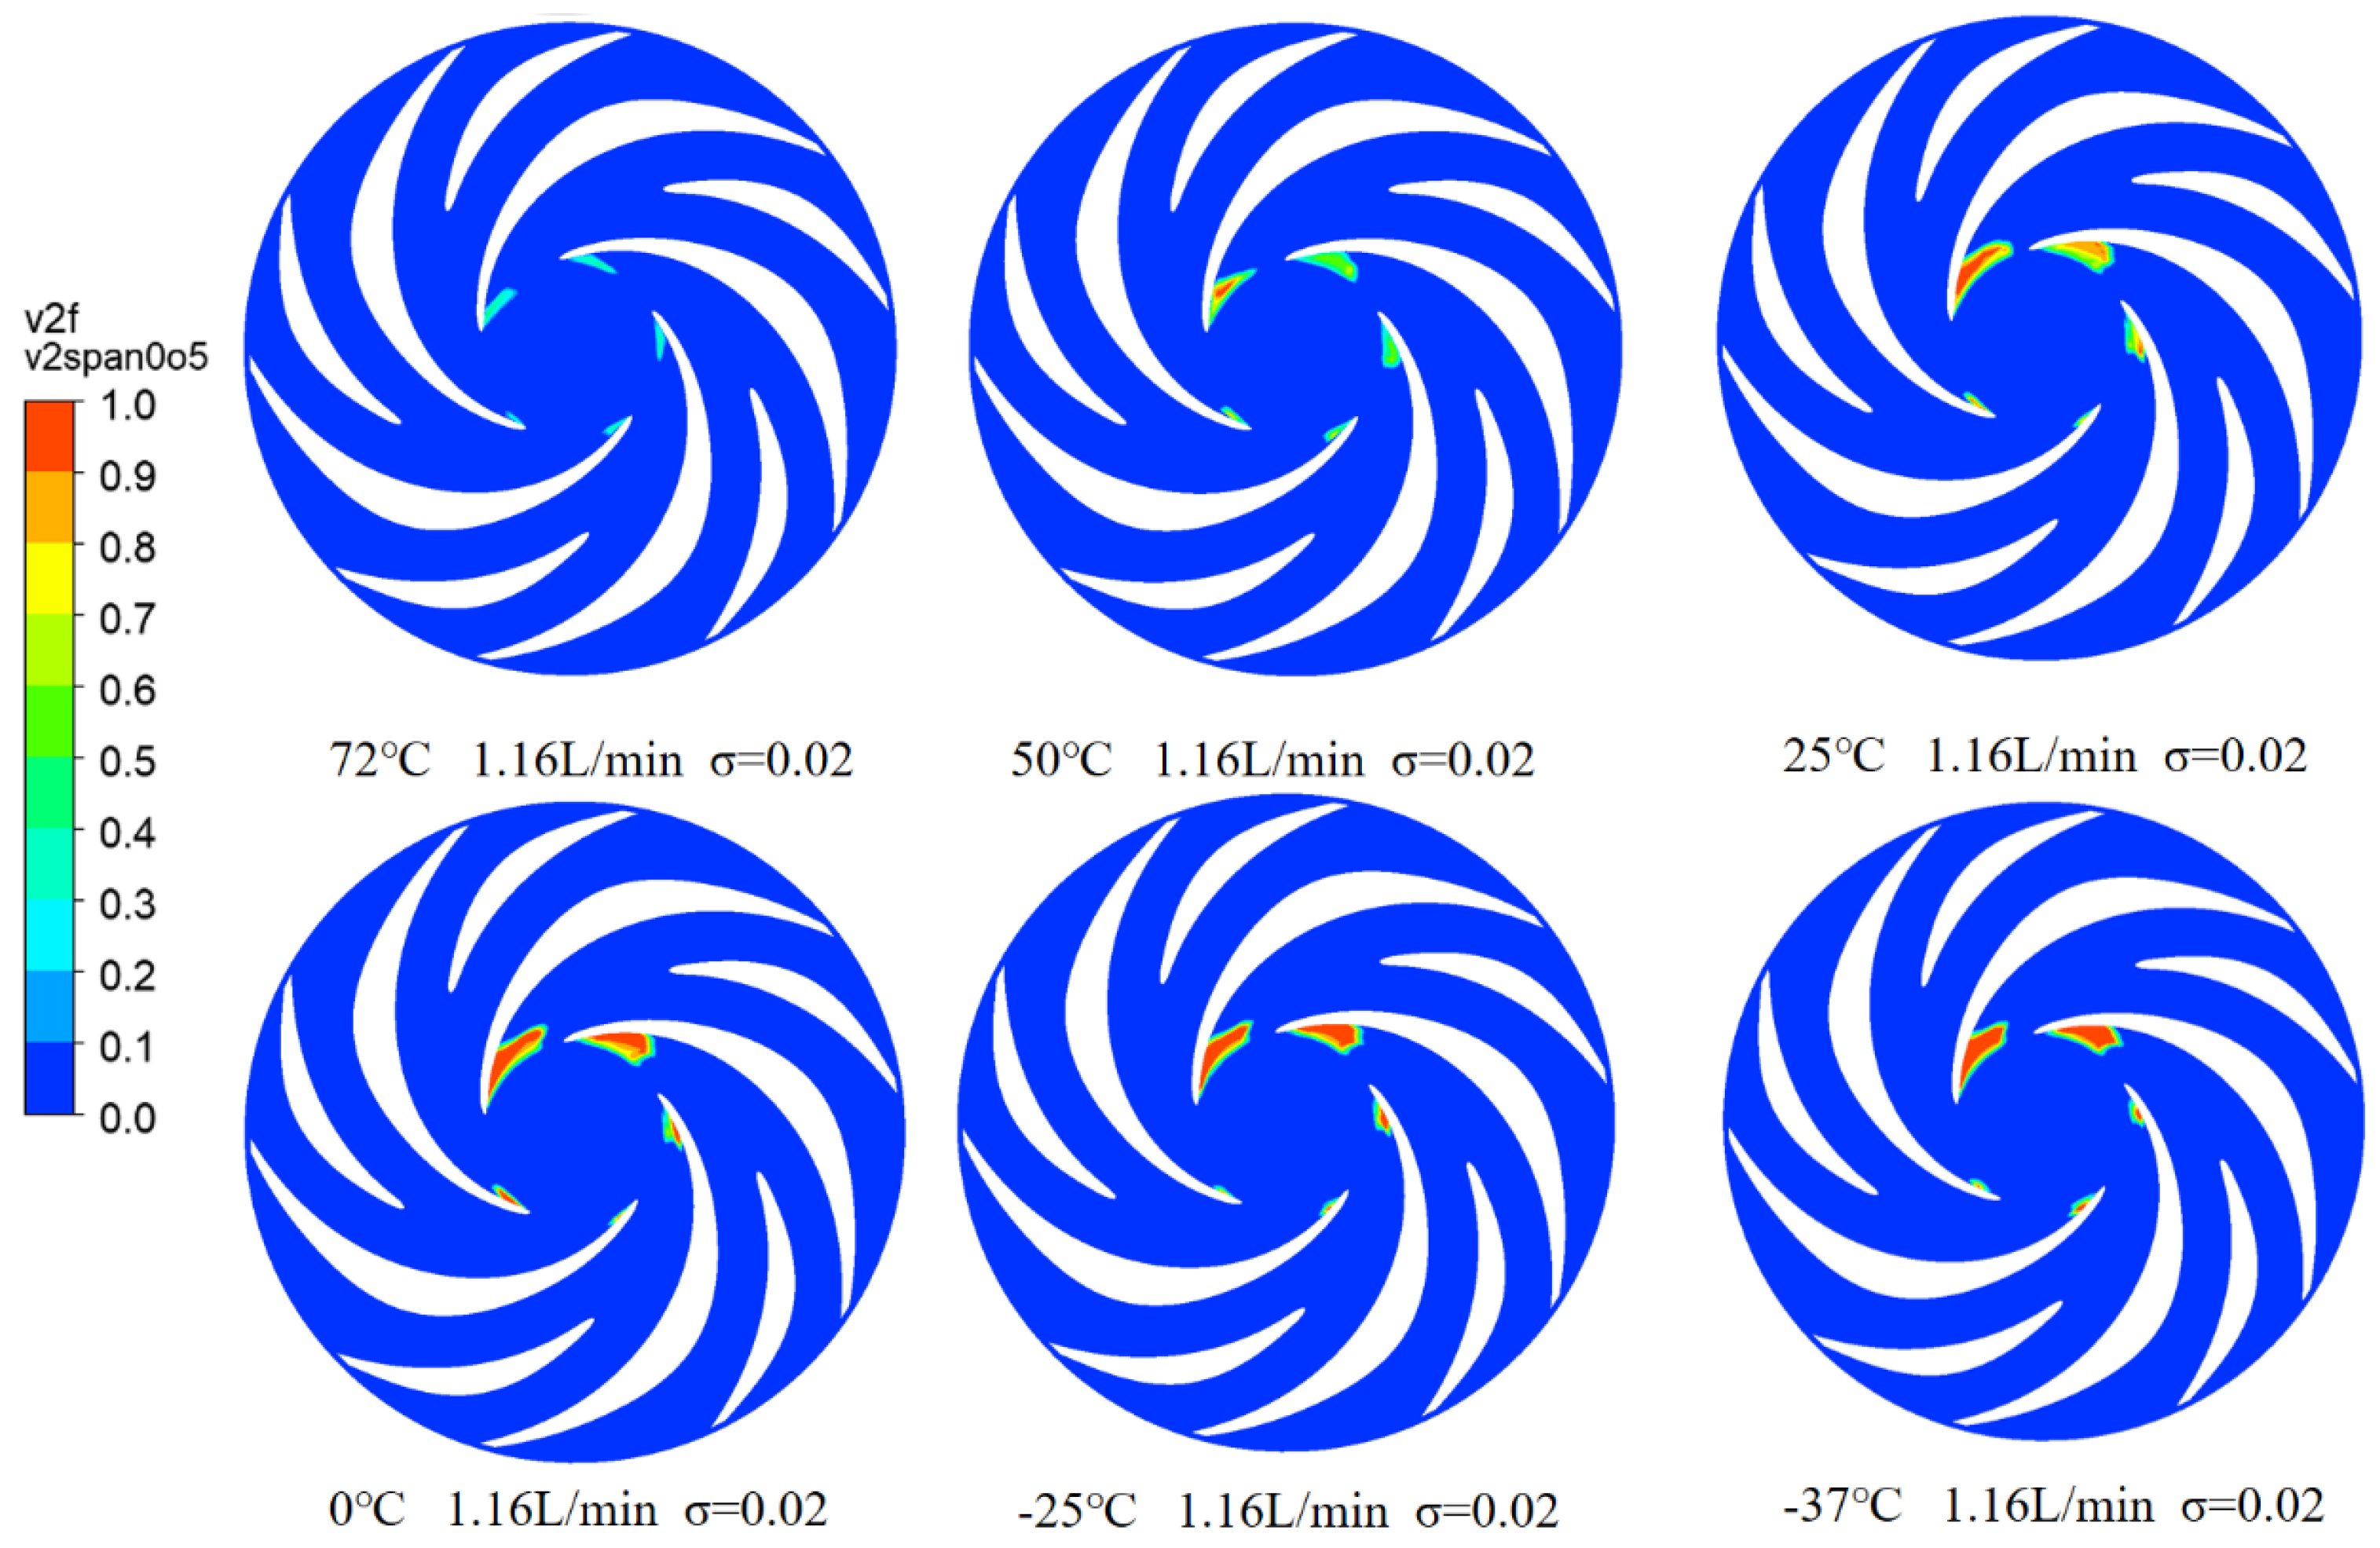
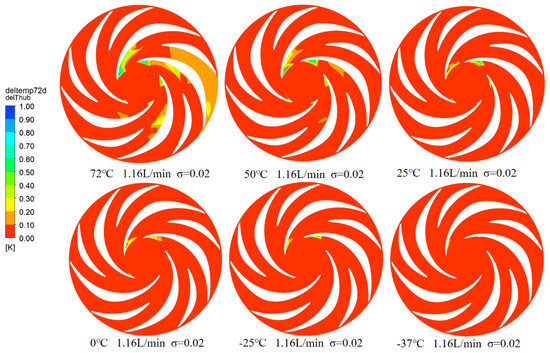
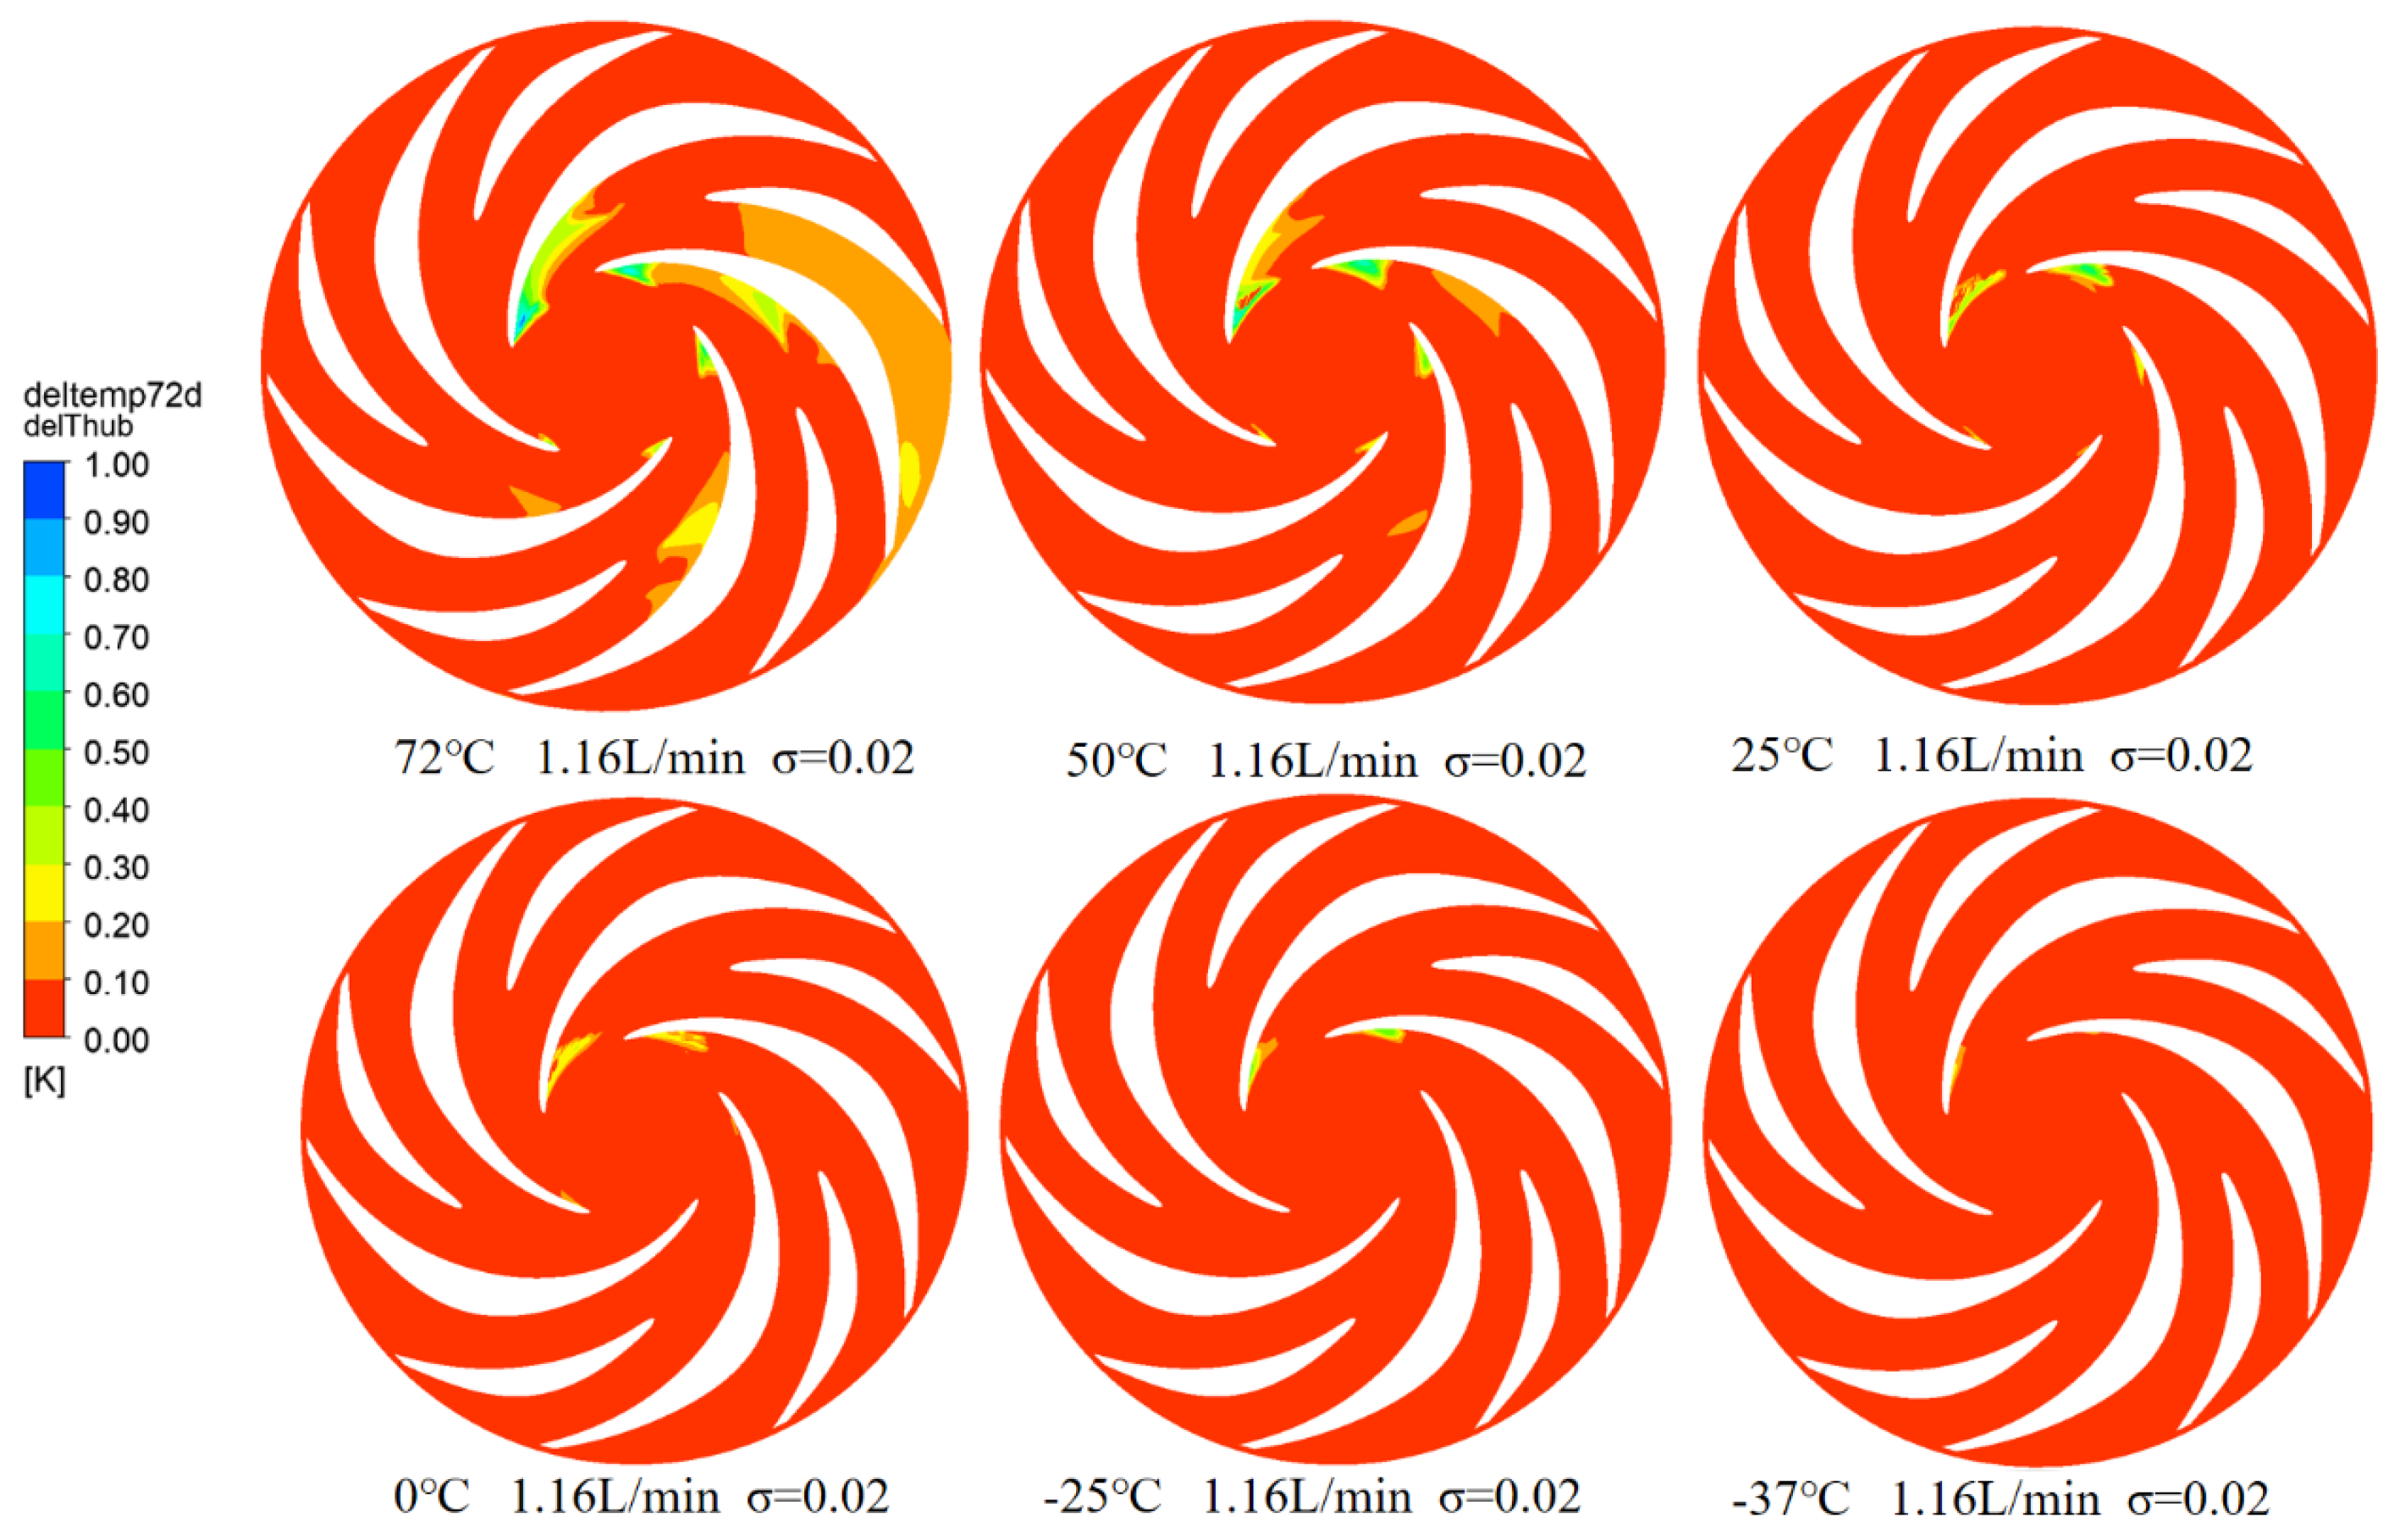
Figure 17 demonstrates the temperature drop distribution on the lower cover plate of the space micropump at a cavitation number of 0.02 under rated flow across different inlet temperatures. The initial cavitation zone is observed to nearly coincide with the region of maximum temperature drop. At a high temperature of 72 °C, the temperature drop is primarily concentrated within the impeller’s cavitation region. As the inlet temperature decreases, the size of this cavitation zone expands while the associated temperature drop diminishes. At lower temperatures (0 °C, −25 °C, and −37 °C), the temperature variation on the cover plate approaches zero. This trend indicates that lower inlet temperatures promote more extensive cavitation, whereas higher temperatures intensify the thermodynamic effect. The enhanced thermal interaction at elevated temperatures leads to a more pronounced local temperature drop, a sharper reduction in saturated vapor pressure, and consequently a stronger suppression of cavitation.
Figure 17.
Temperature Drop Distribution on Lower Shroud at , Rated Flow, and Various Temperatures.
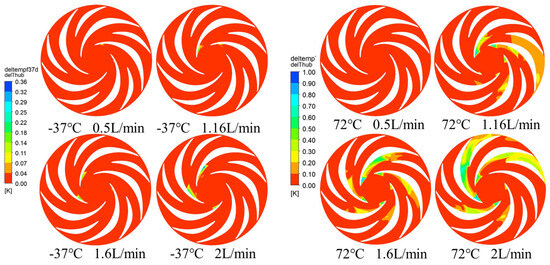
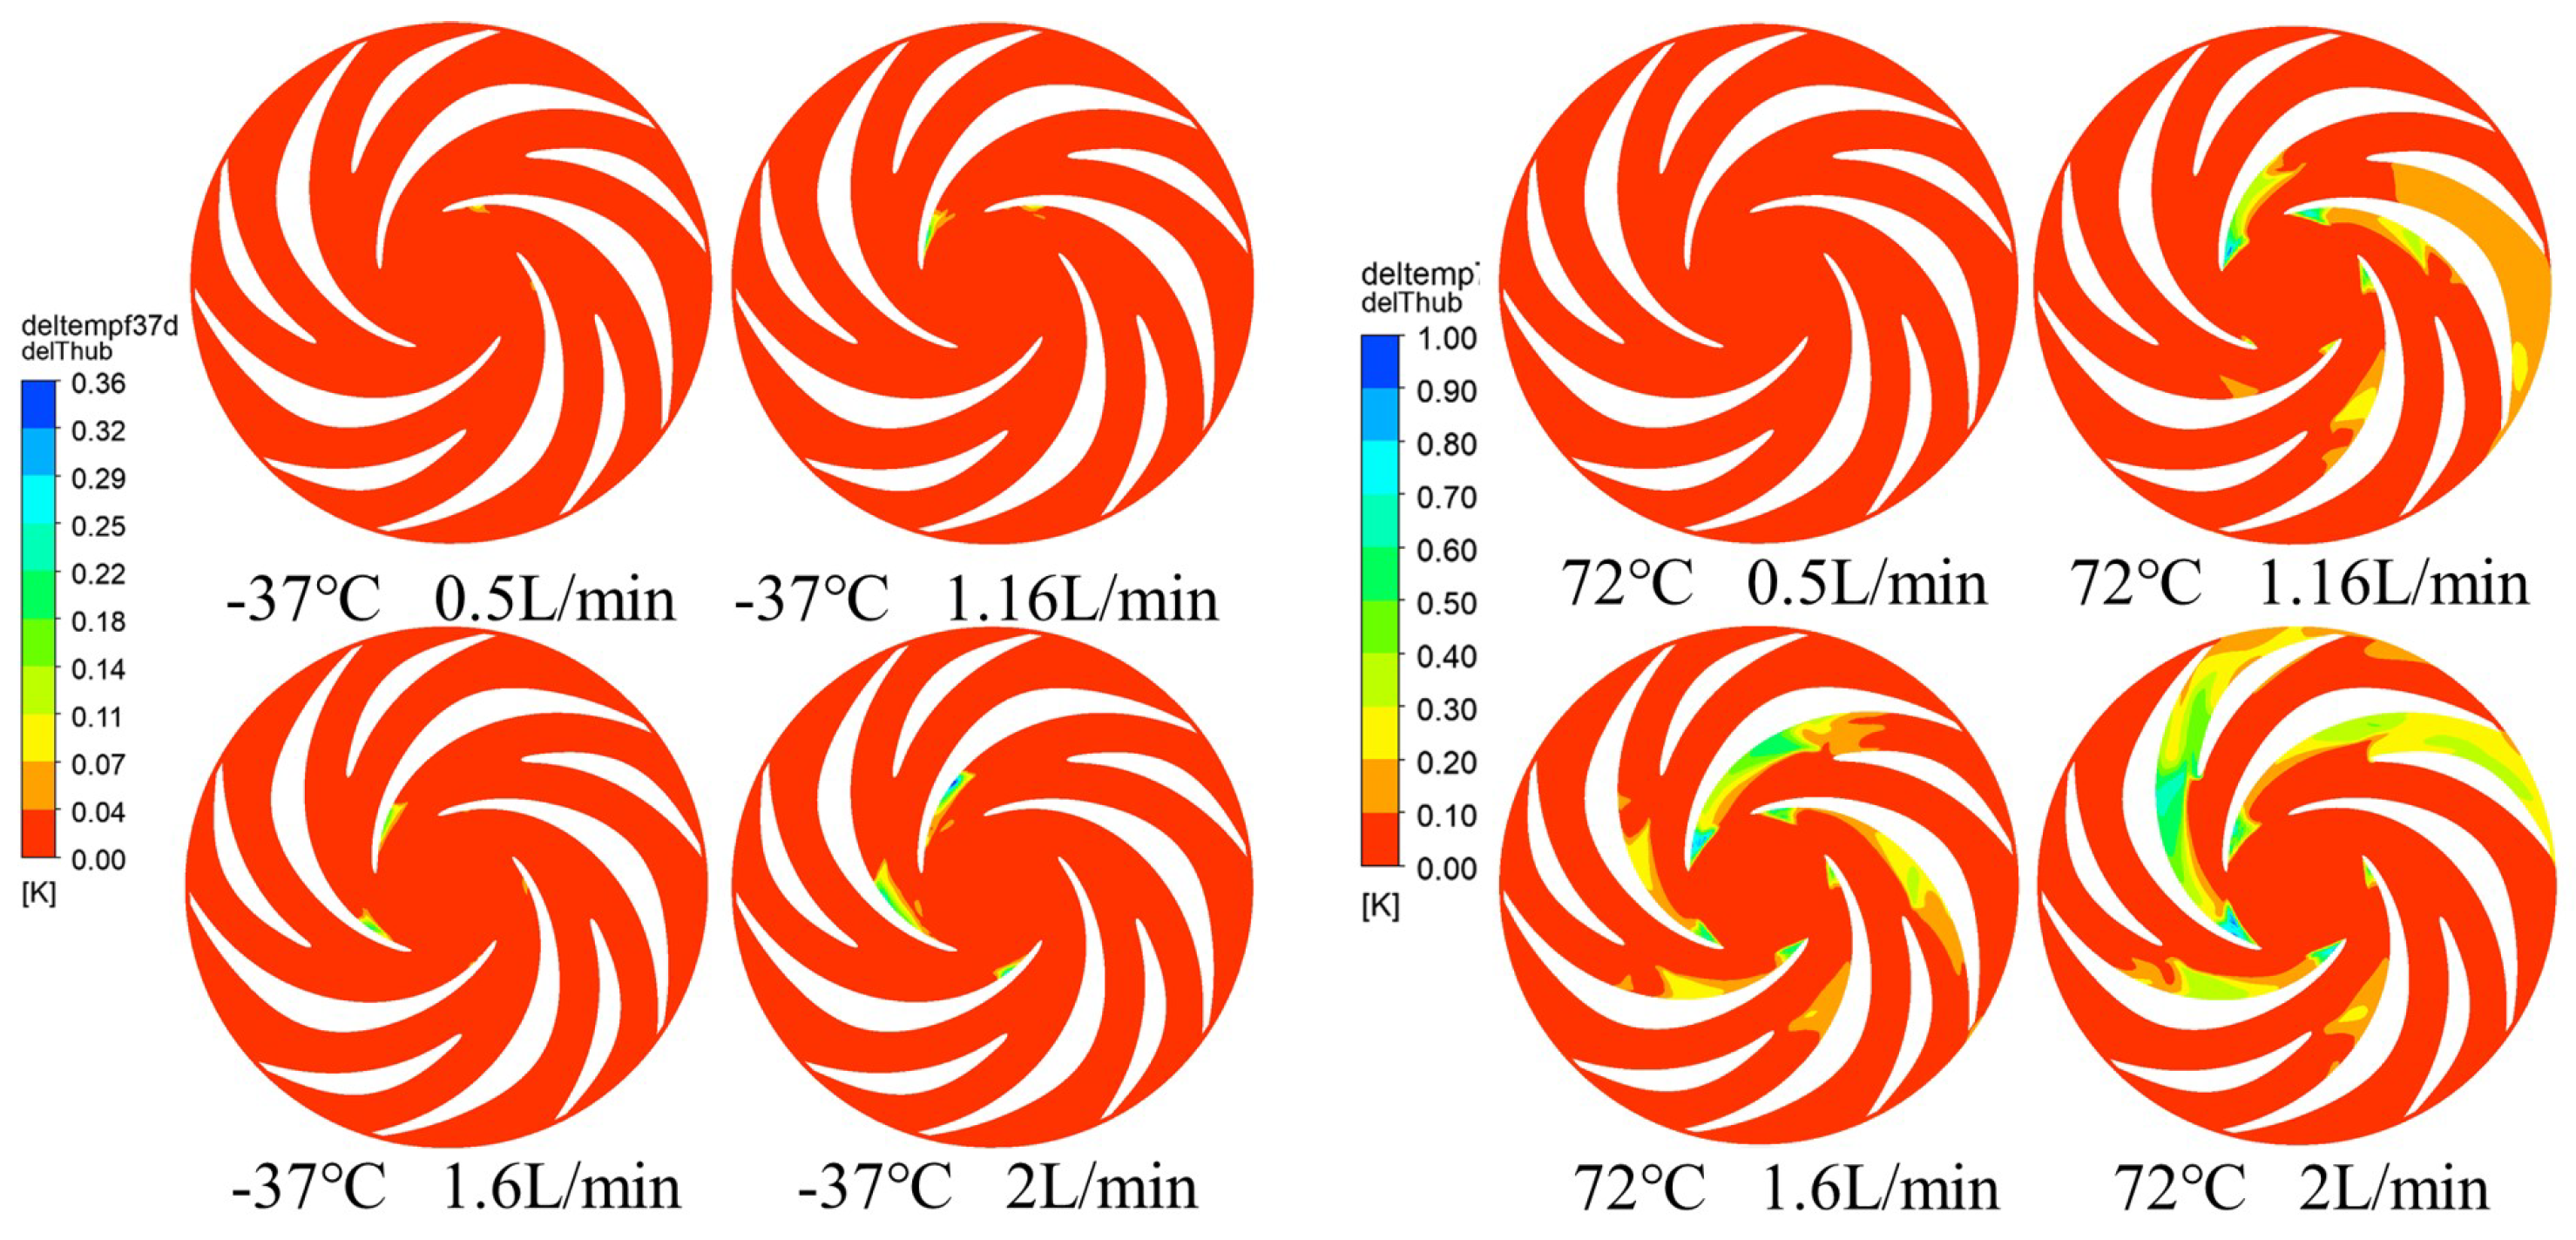
Figure 18 illustrates the evolution of the cavitation zone and its associated temperature drop at 72 °C under increasing flow rates. At the lowest flow rate, the cavitation zone is minimal, and the temperature drop is negligible. As the flow rate rises, the cavitation structure becomes more distinct, accompanied by the emergence of a pronounced high-temperature-drop region. This trend culminates at 2.0 L/min, where both the cavity volume and the temperature drop reach their peak values. In certain flow passages, the temperature fails to recover to the inlet level. This is attributed to weak fluid diffusion under these conditions, which prevents effective mixing between the downstream cold liquid (condensed from vapor) and the warmer, non-cavitated fluid.
Figure 18.
Temperature Drop Distribution on Lower Cover at : −37 °C vs. 72 °C at Various Flow Rates.
At low temperature (−37 °C), the trend with increasing flow rate is similar to that observed at high temperature (72 °C). However, the region exhibiting a temperature drop is smaller, and the magnitude of cooling is reduced. The extent of the pronounced temperature-drop zone is also shorter, while fluid diffusion is stronger. As a result, the colder liquid condensed from downstream vapor mixes more rapidly with the warmer, non-cavitated fluid.
At both temperatures, cavitation intensifies with increasing flow rate, producing a larger temperature drop that spreads over a wider area. These results confirm that the thermal effect of cavitation becomes more pronounced at higher flow rates.
4.3. Analysis of Cavitation Flow Oss at Different Inlet Temperatures
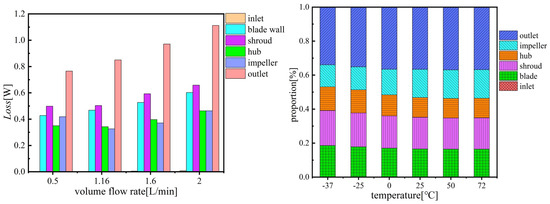
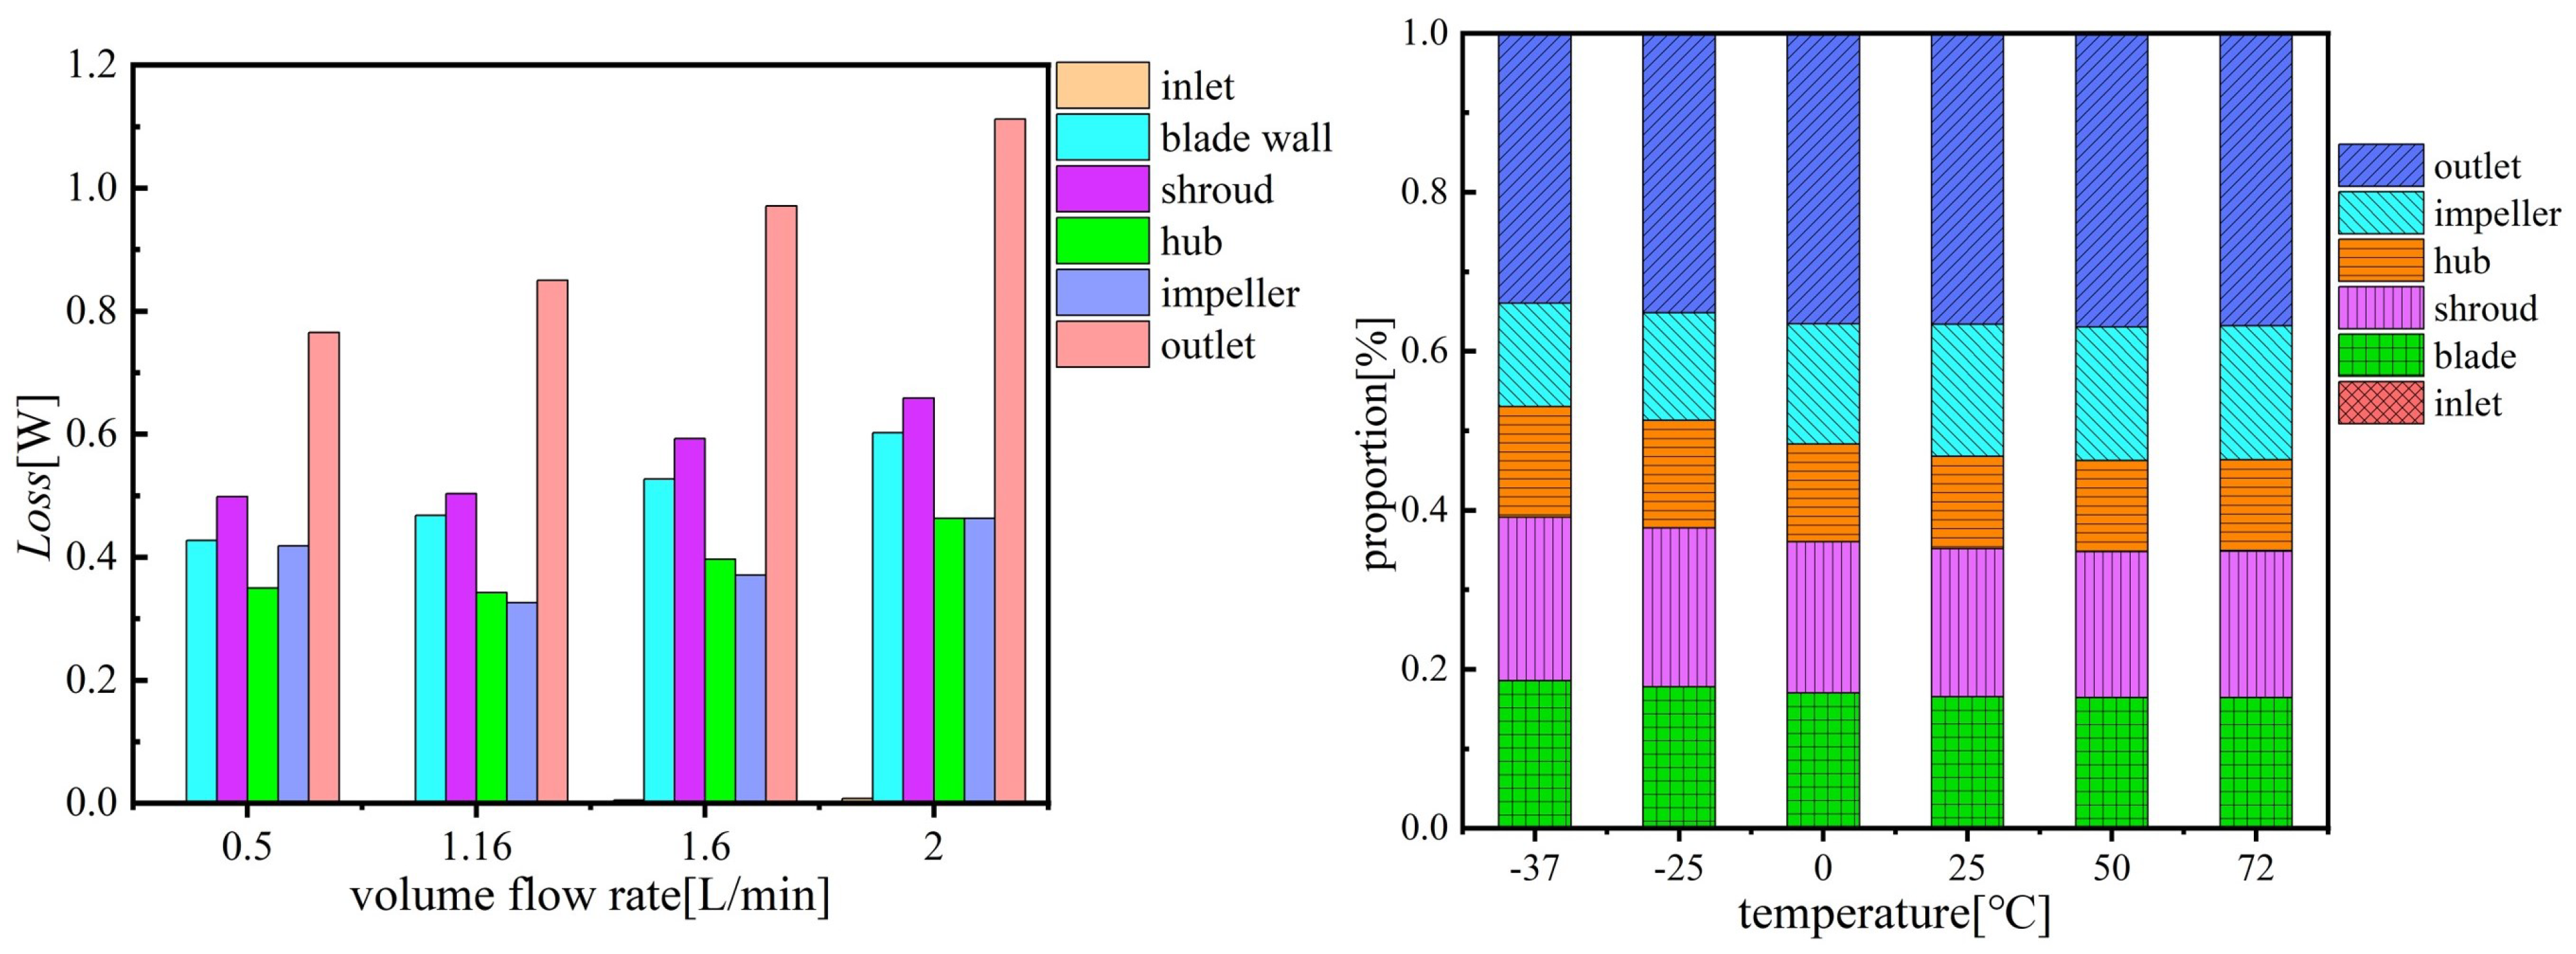
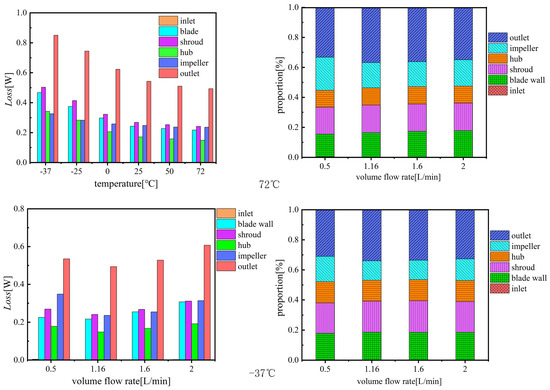
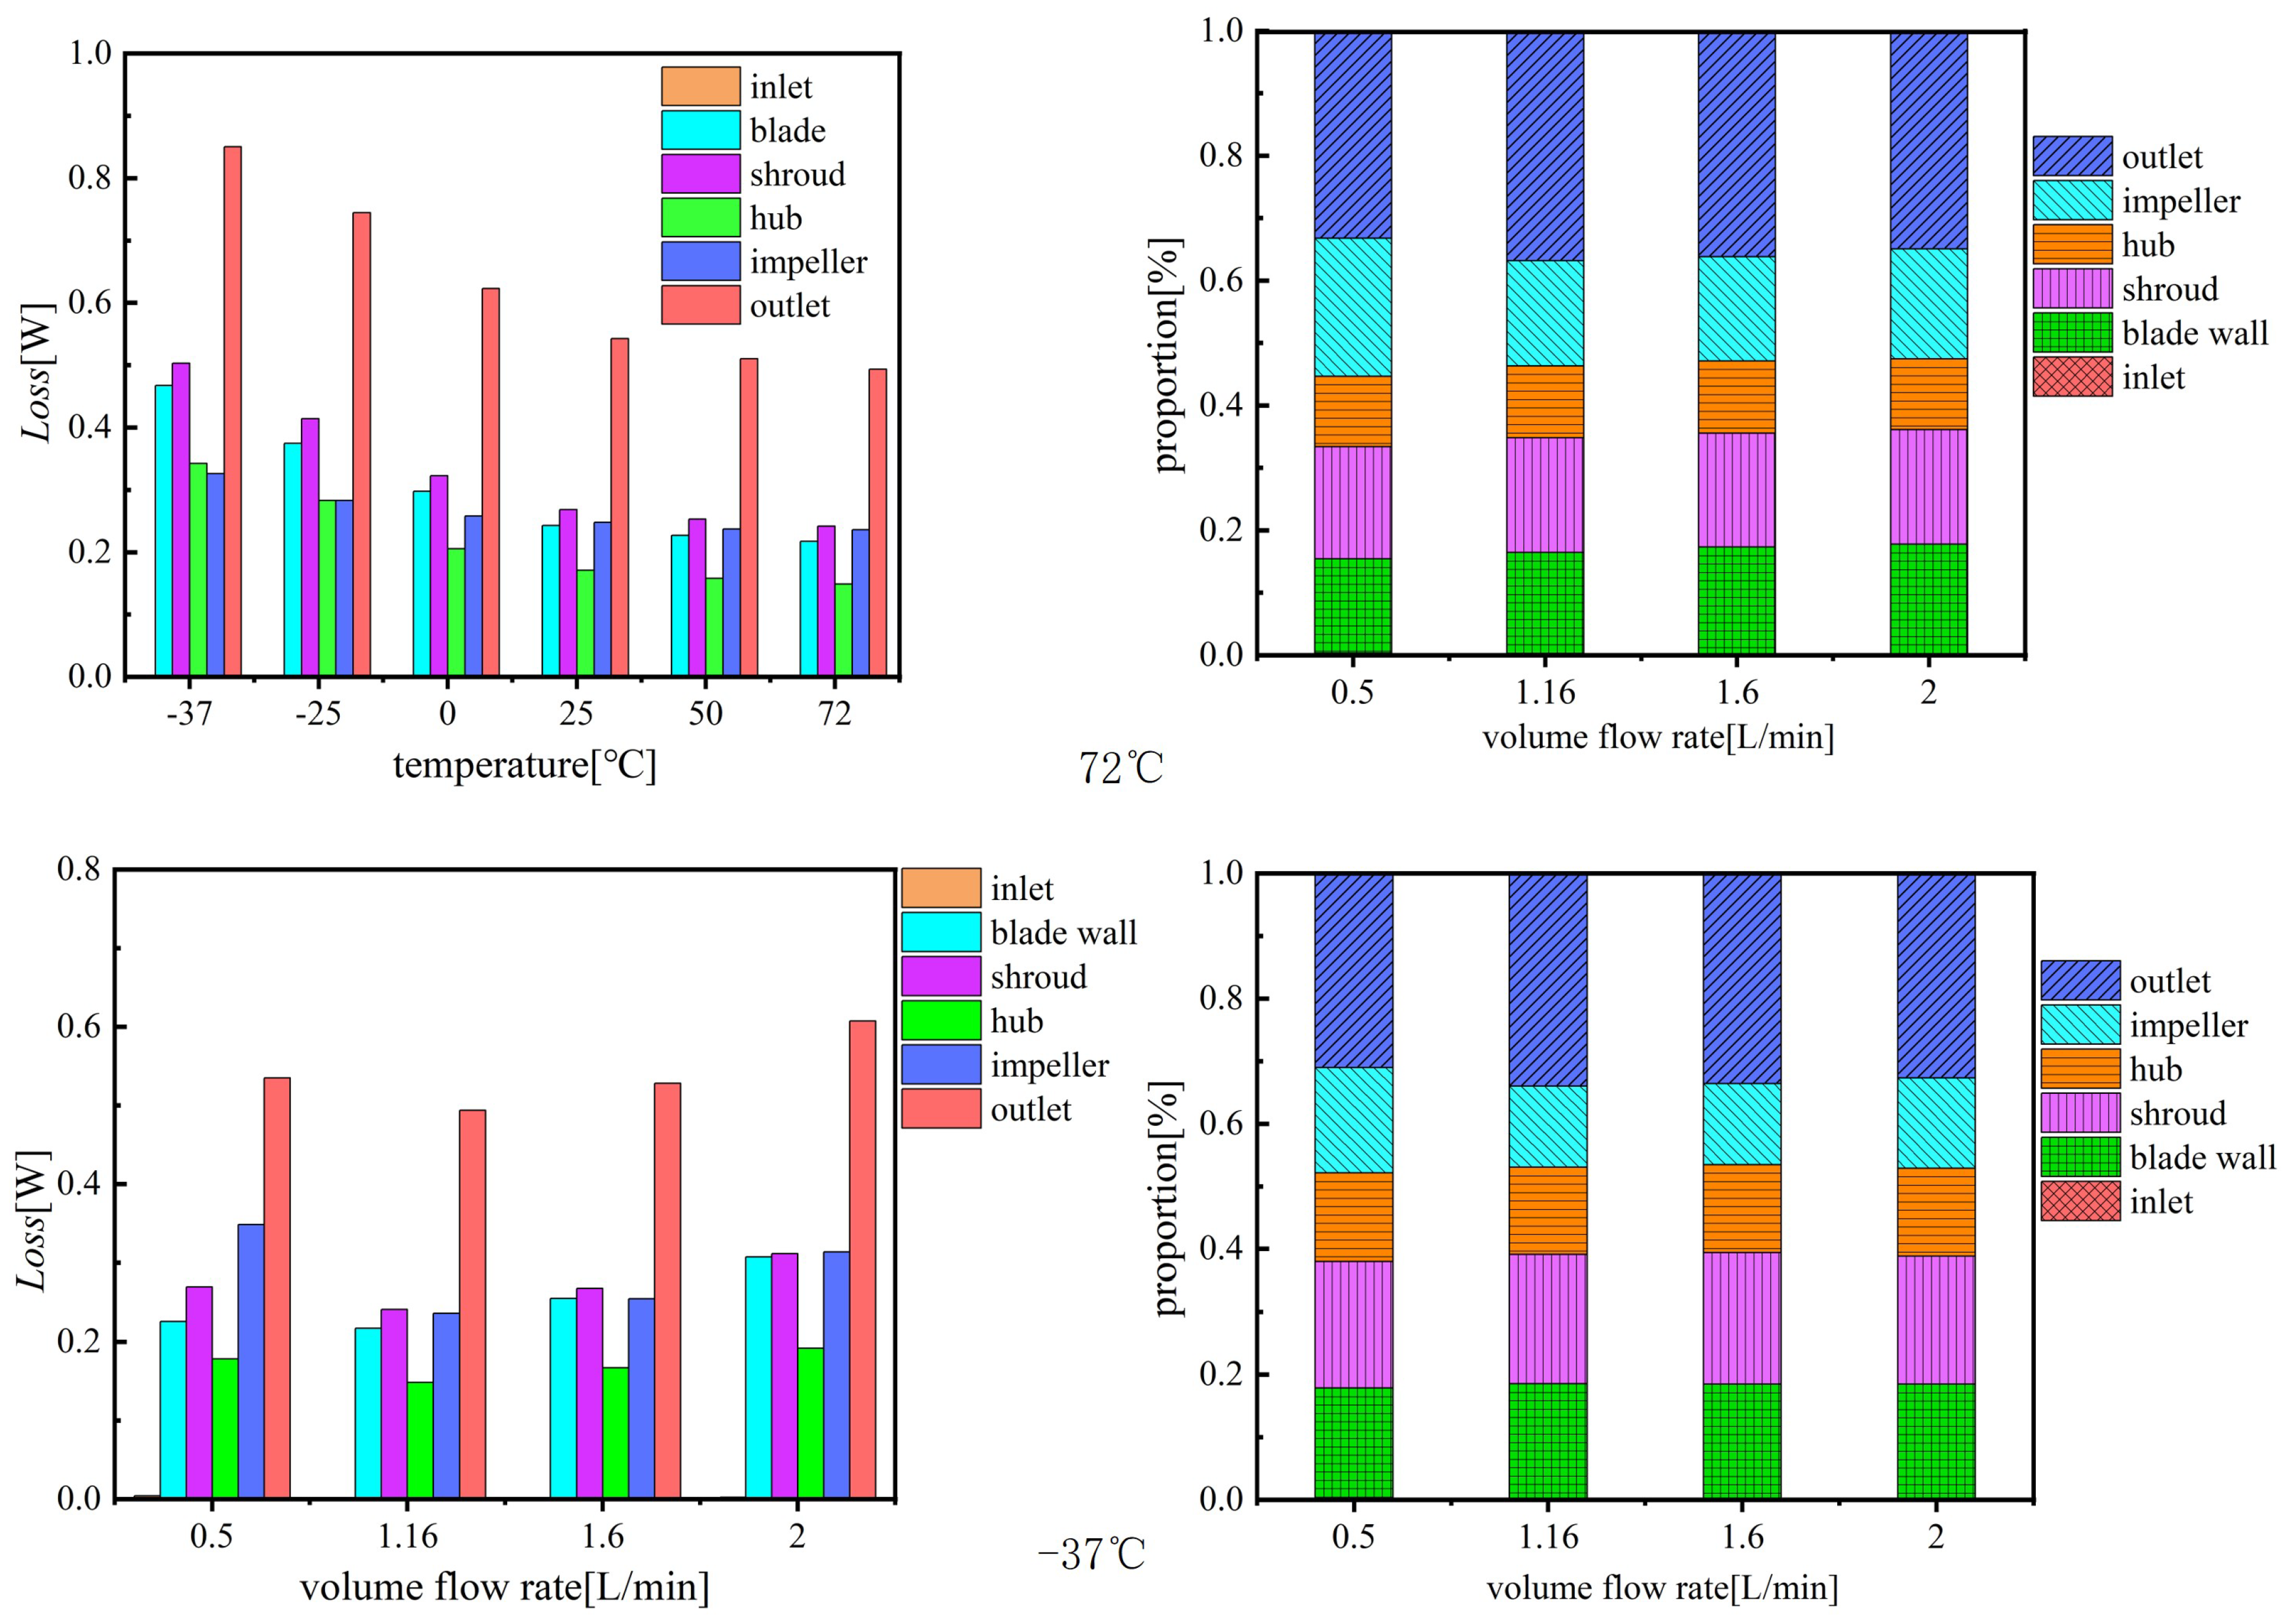
Figure 19 and Figure 20 present the distribution of flow losses within the centrifugal pump under varying temperatures and flow rates. Overall, flow losses in all components decrease as temperature rises. The outlet volute, top cover, and impeller account for the largest share of total system losses. With increasing temperature, the proportion of loss attributed to the impeller grows, while the share from the outlet volute remains stable, and contributions from other areas diminish.
Figure 19.
The losses and proportion of various parts of the space micropump at , Rated Flow, and Various Temperatures.
Figure 20.
The losses and their proportions at different flow rates at −37 ℃ and 72 ℃, .
Regarding flow rate, losses in all locations first decrease and then increase, reaching a minimum at the rated operating point. This pattern indicates a substantial rise in energy loss under off-design conditions. A comparison between cavitating and non-cavitating operation reveals a negligible difference in both loss magnitude and its distribution among components, suggesting that cavitation has a minimal impact on overall energy dissipation.
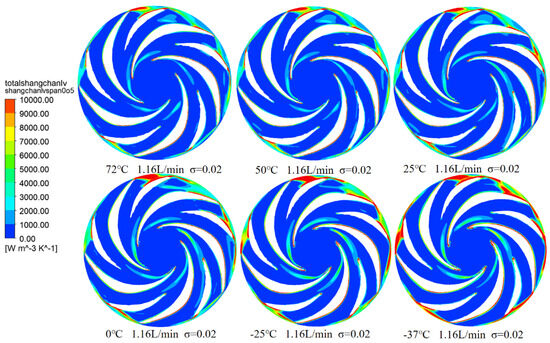
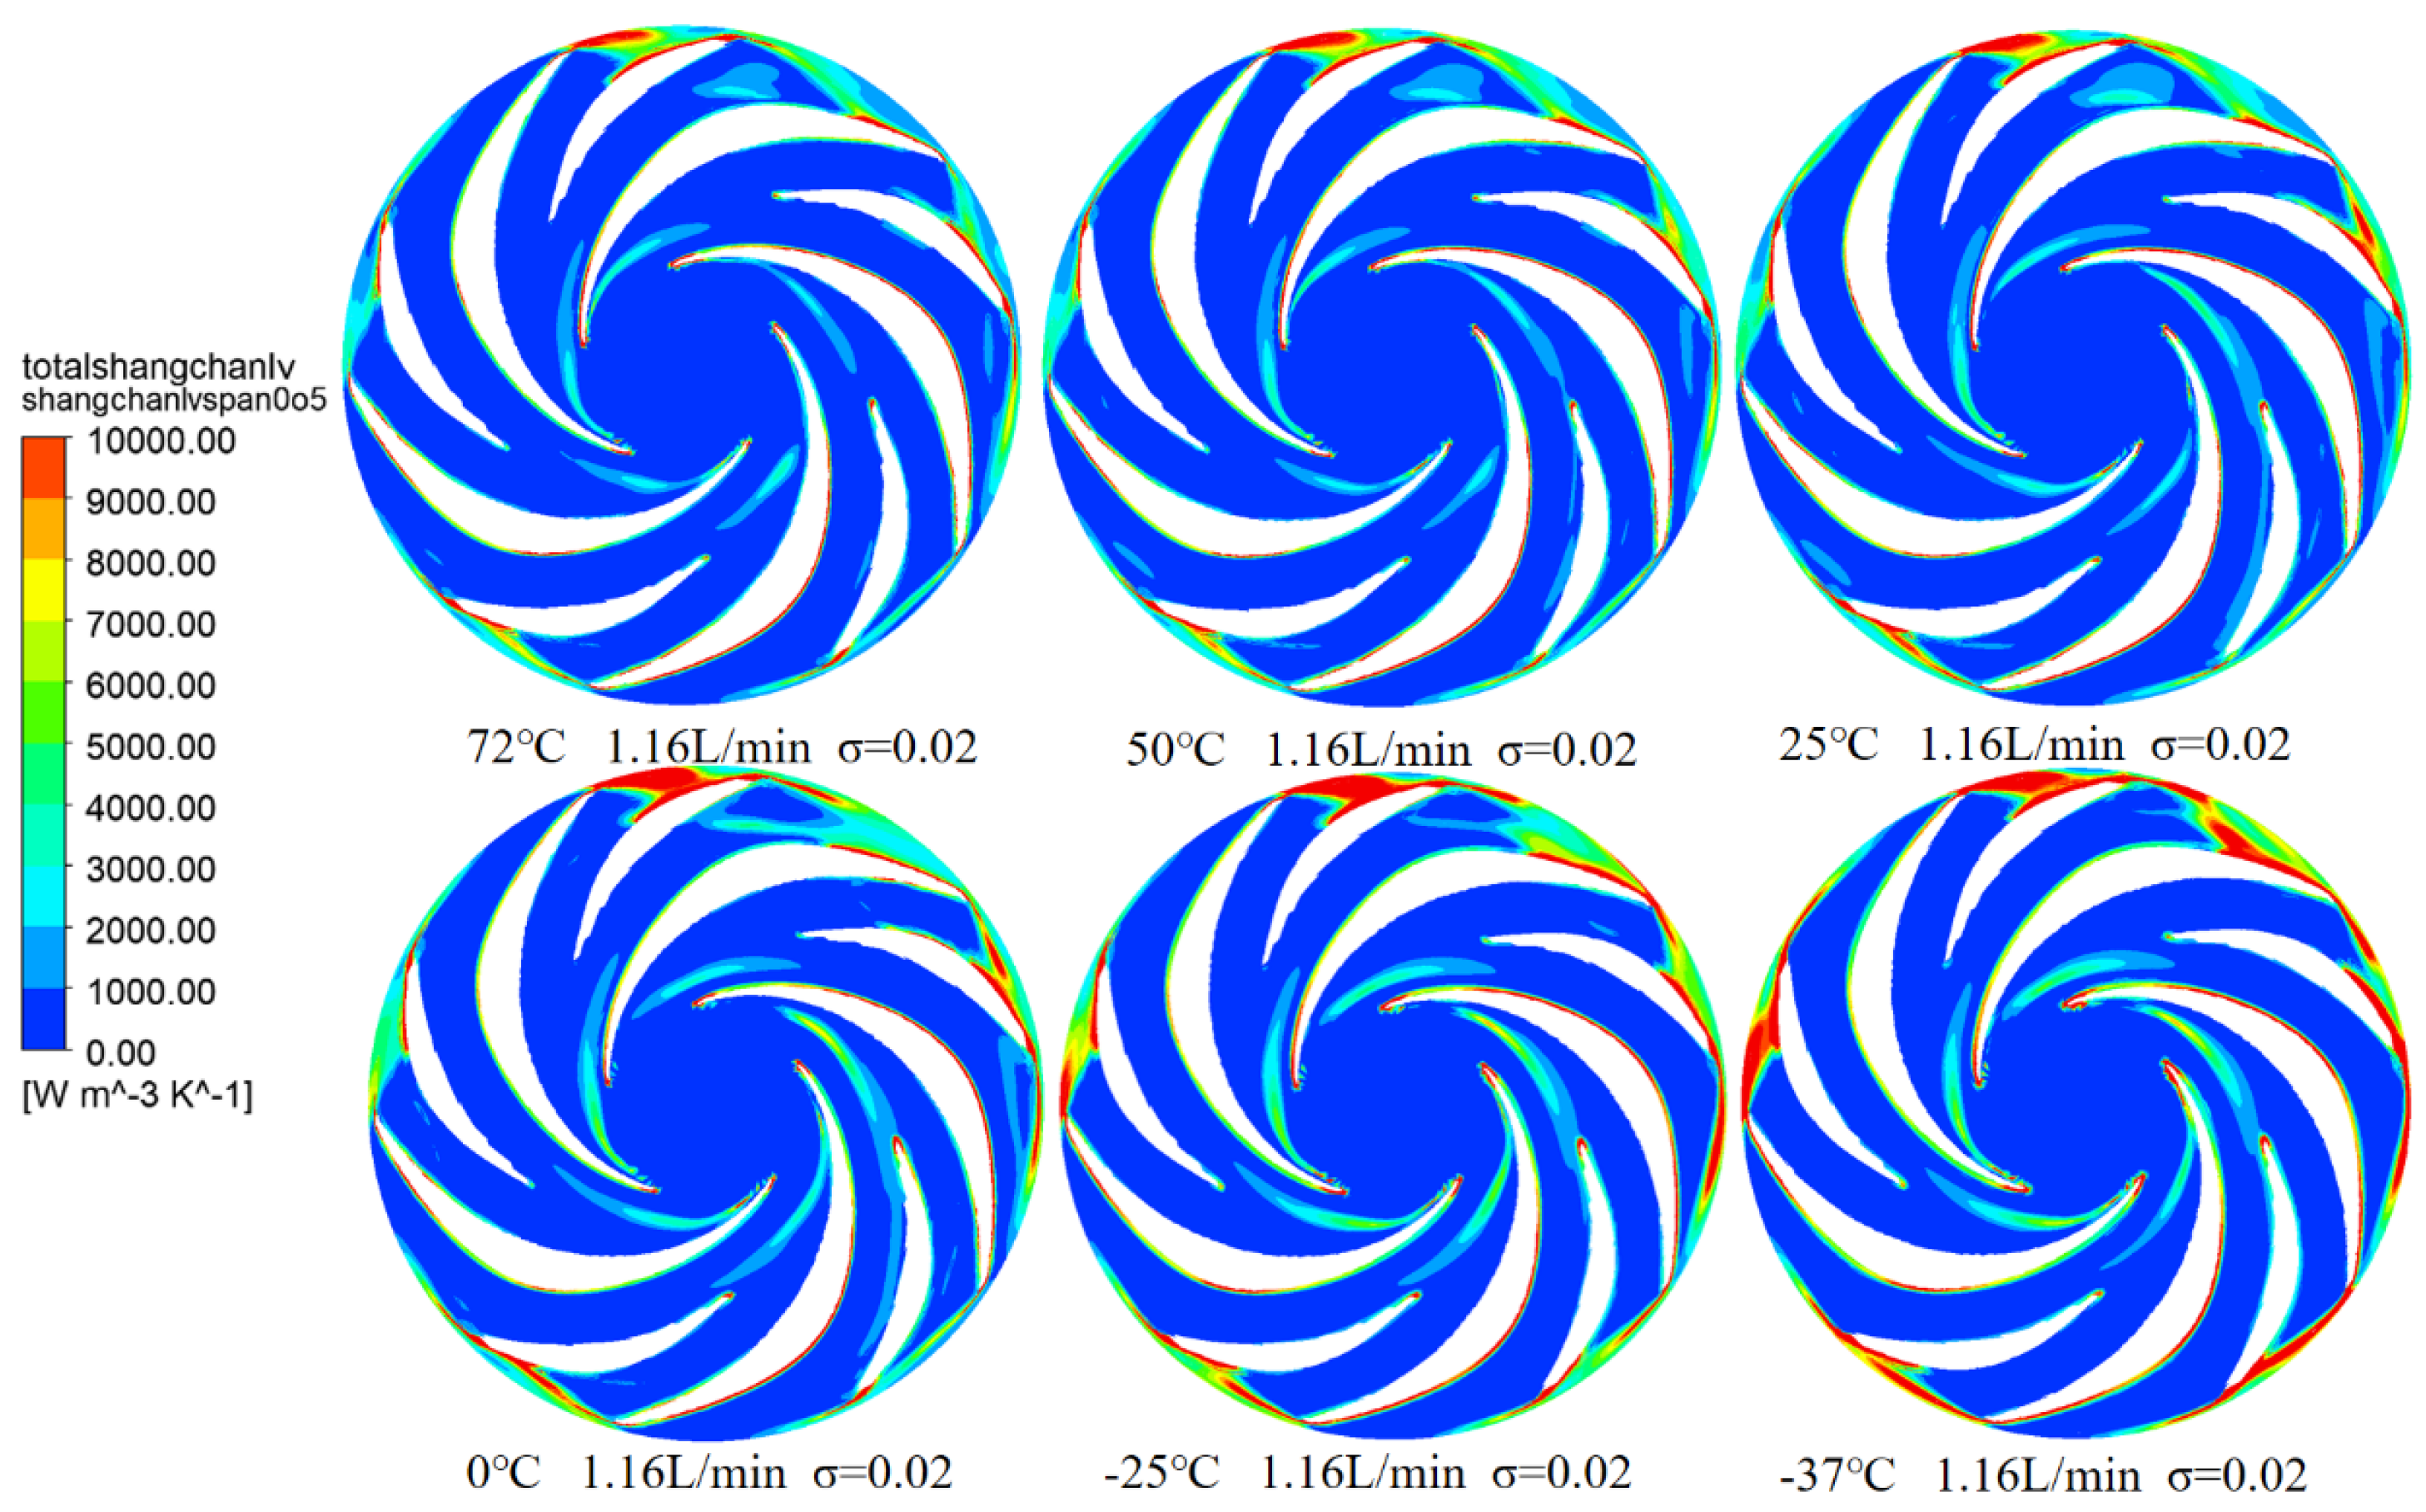
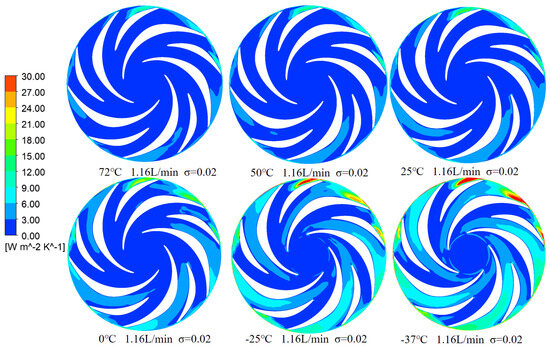
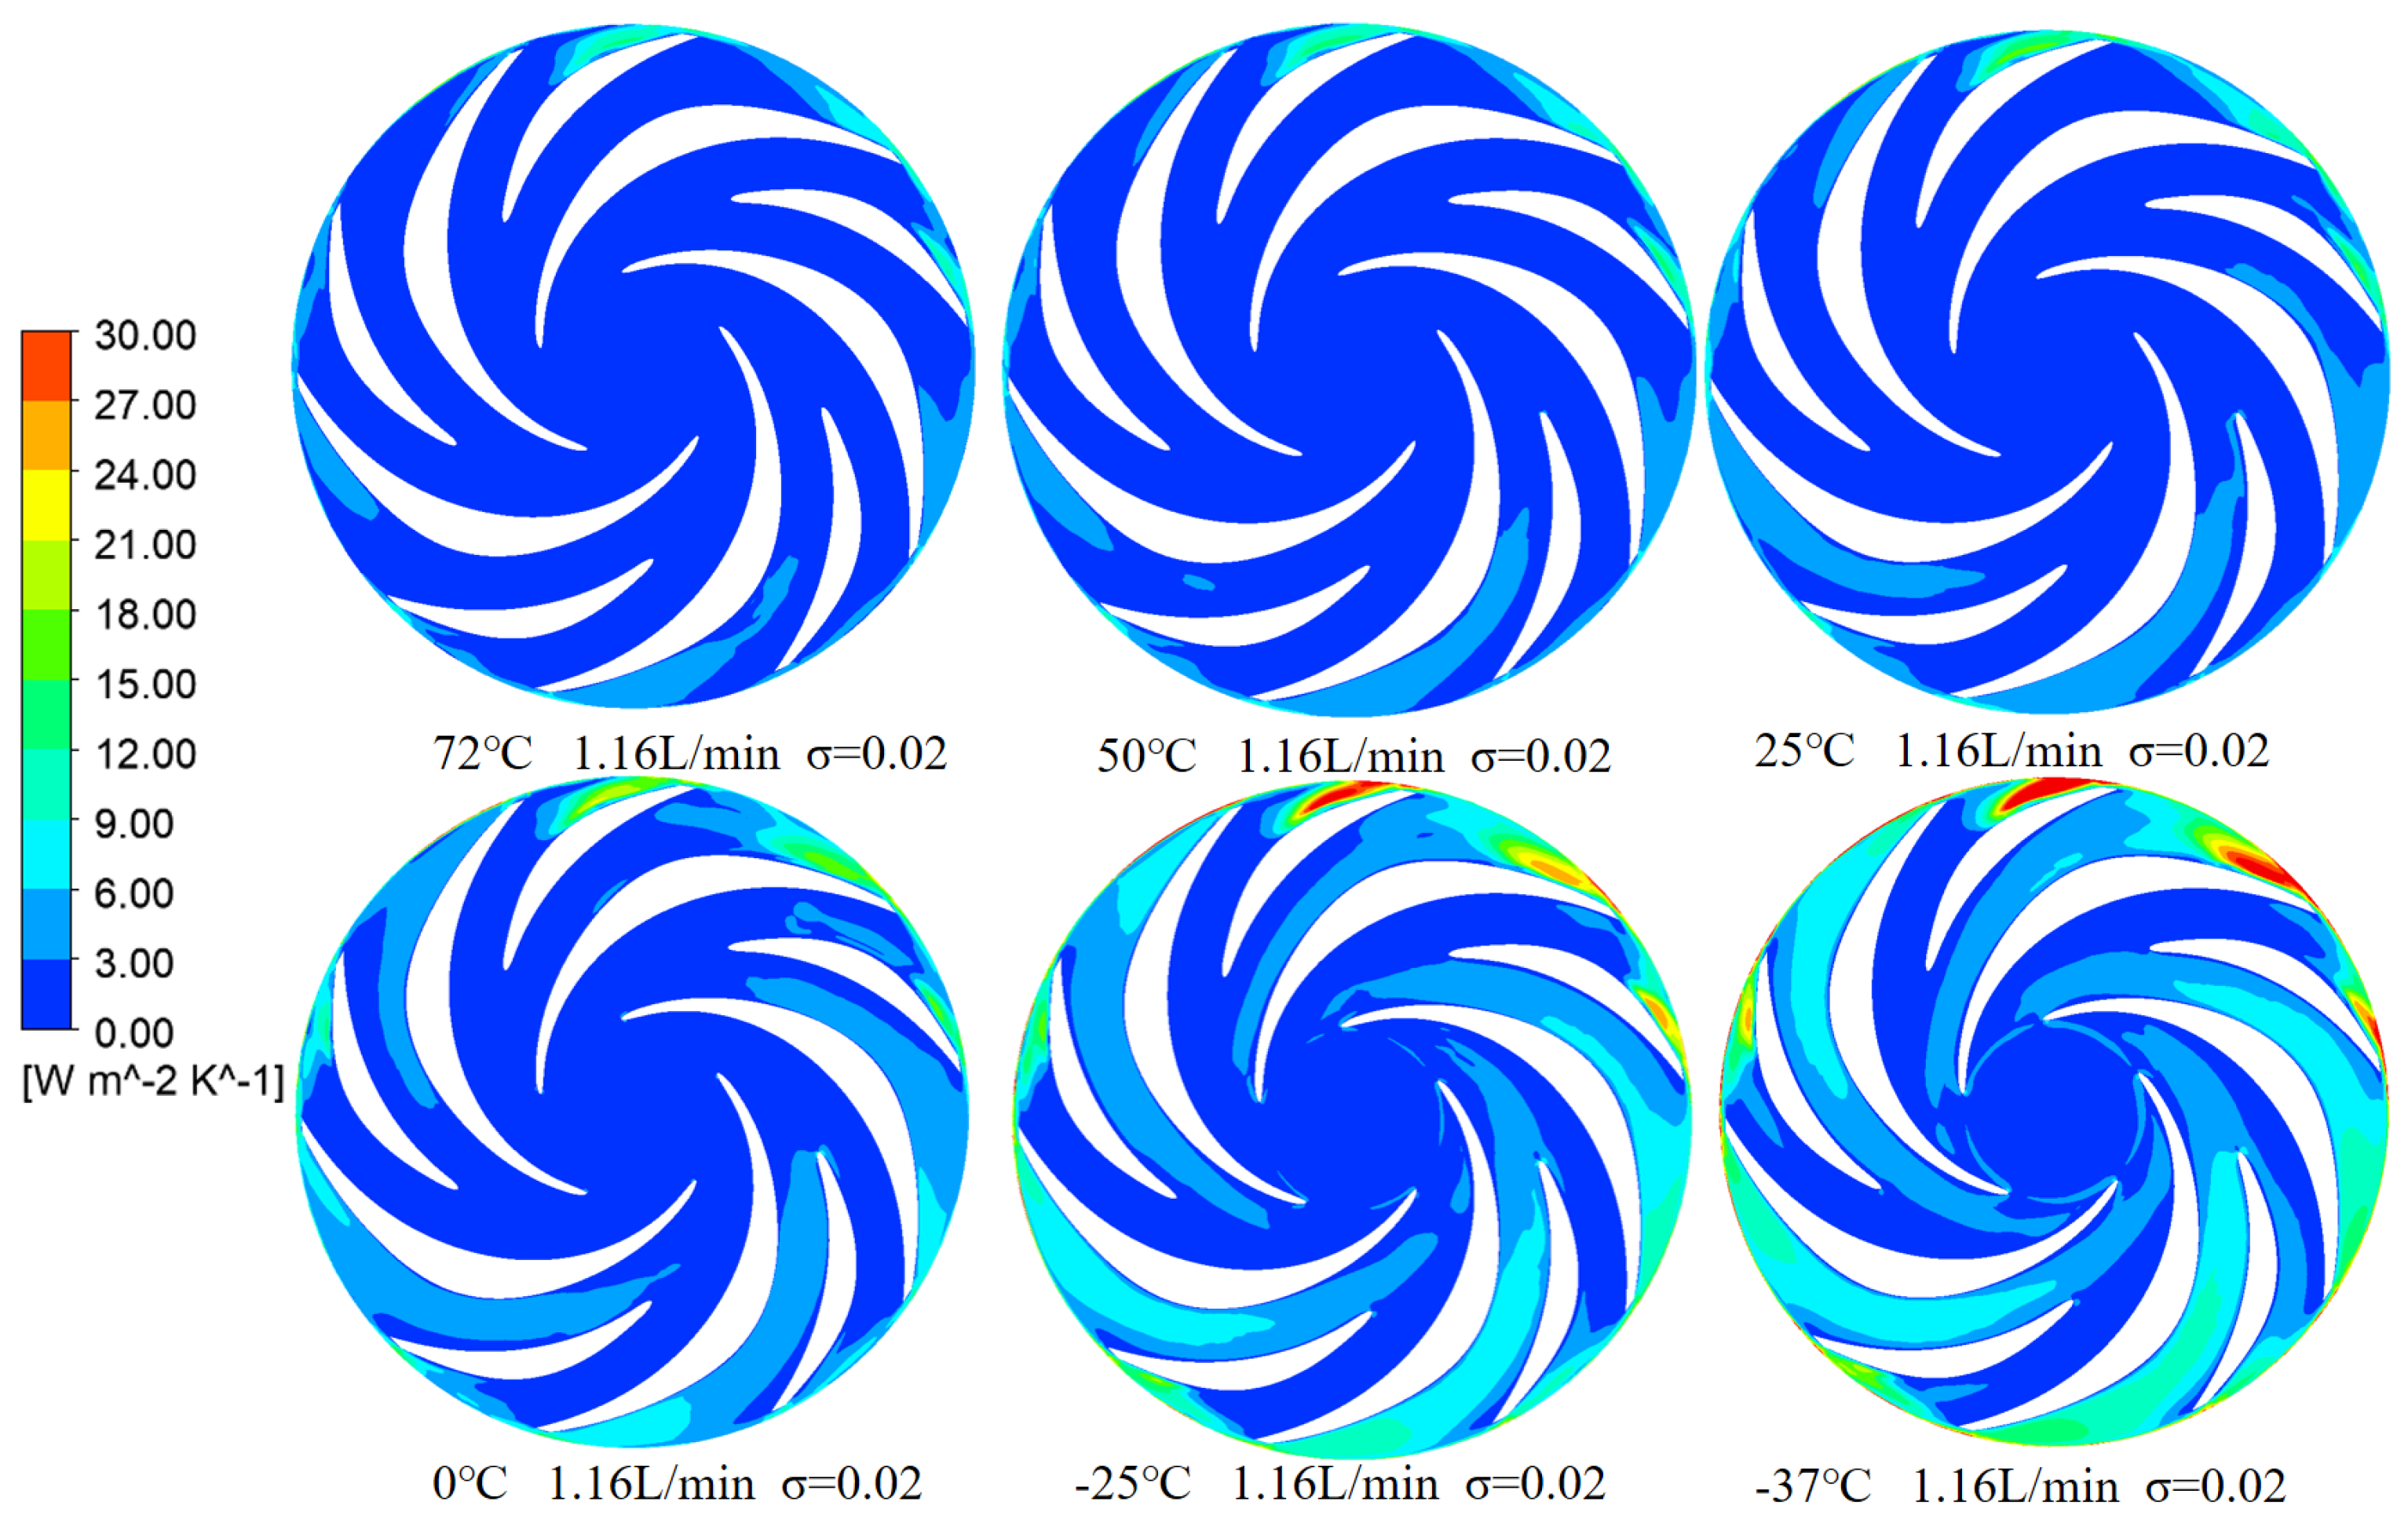
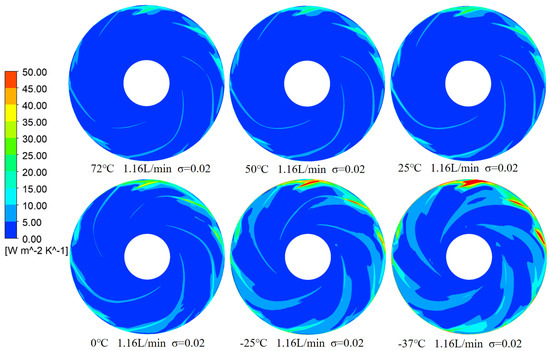
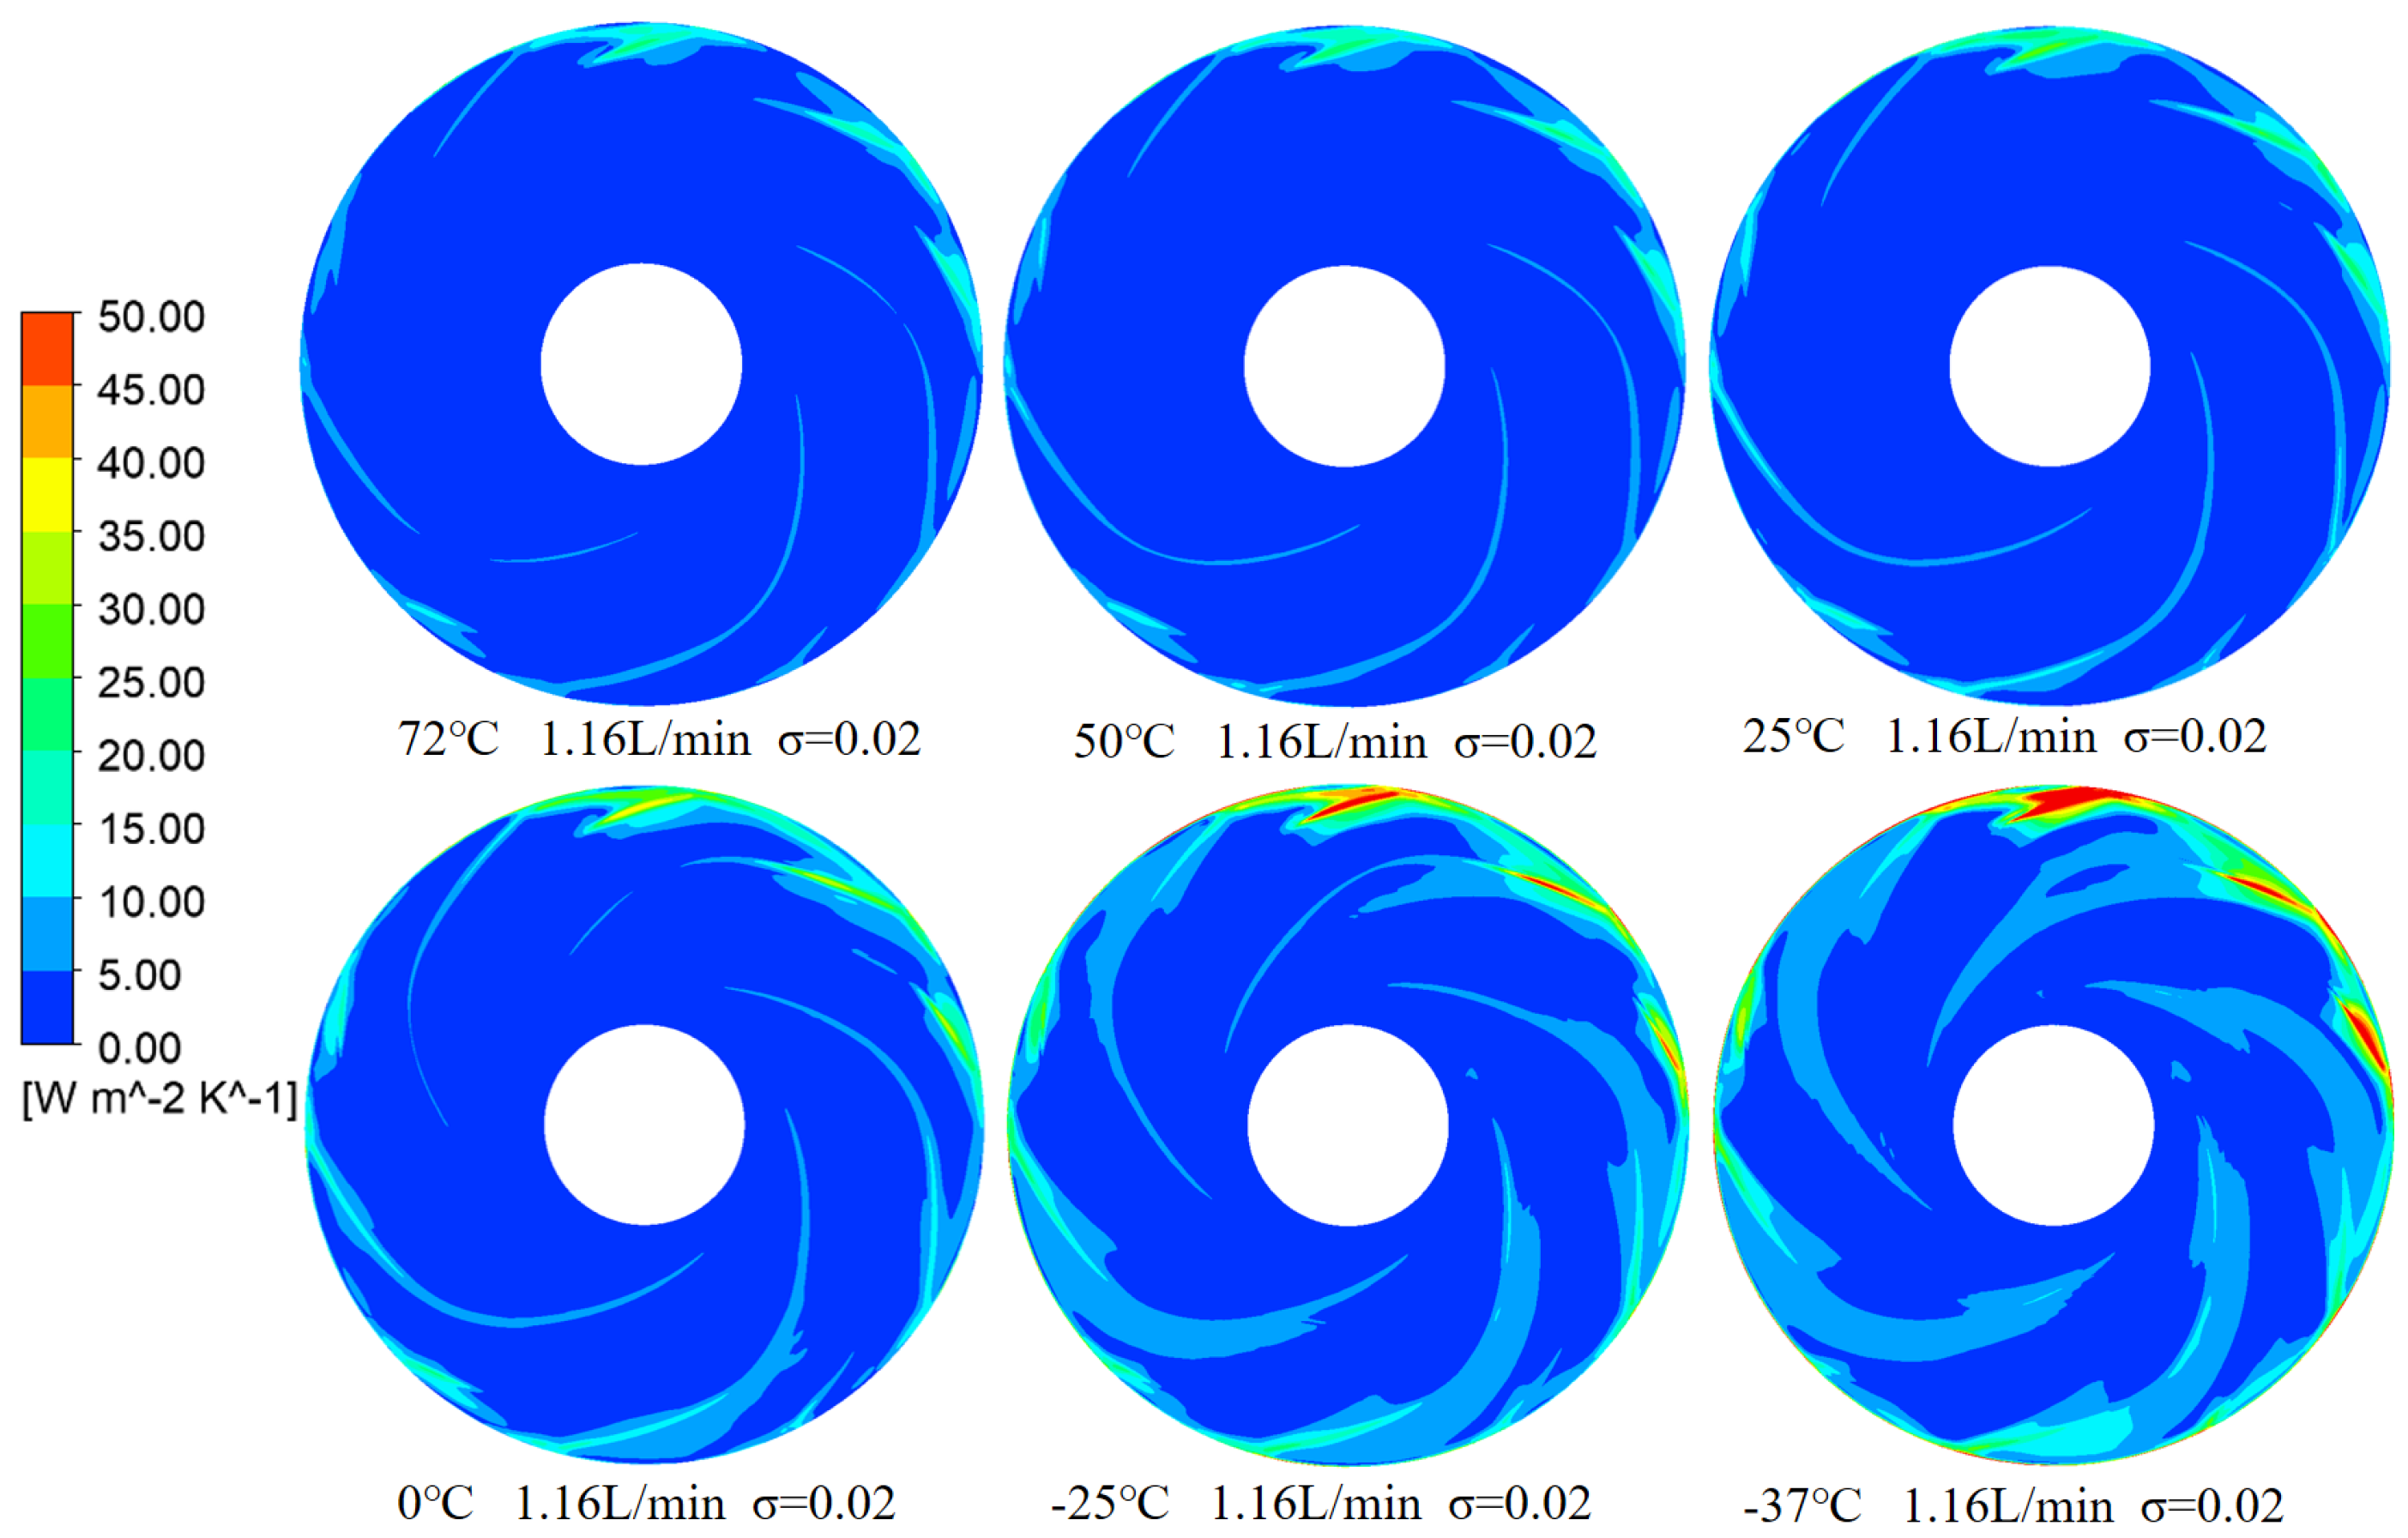
Figure 21 and Figure 22 compare the entropy production distributions between non-cavitating and cavitating conditions at various temperatures and flow rates. The distributions are nearly identical across all locations except at the suction side of the long blade inlet, where cavitation initiates. Under high-temperature conditions (72 °C), regions of high entropy production are relatively small and localized. At medium temperature (25 °C), these regions expand, and the entropy production magnitude increases. The distribution changes notably at lower temperatures (0 °C and −25 °C), with high entropy production zones growing substantially across much of the impeller, nearly covering most blade surfaces. This trend is most pronounced at −37 °C, where high-loss regions cluster together. Overall, as temperature decreases, the extent and complexity of entropy production increase, characterized by a wider distribution and a greater number of high-loss zones.
Figure 21.
Entropy Generation Rate Distribution on Impeller Mid-Span Plane at , Rated Flow, and Various Temperatures.
Figure 22.
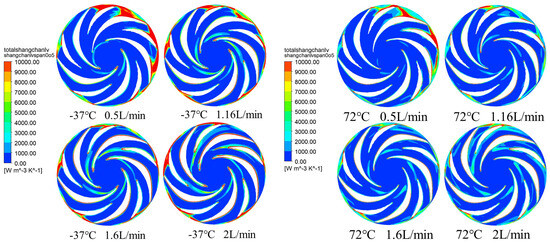
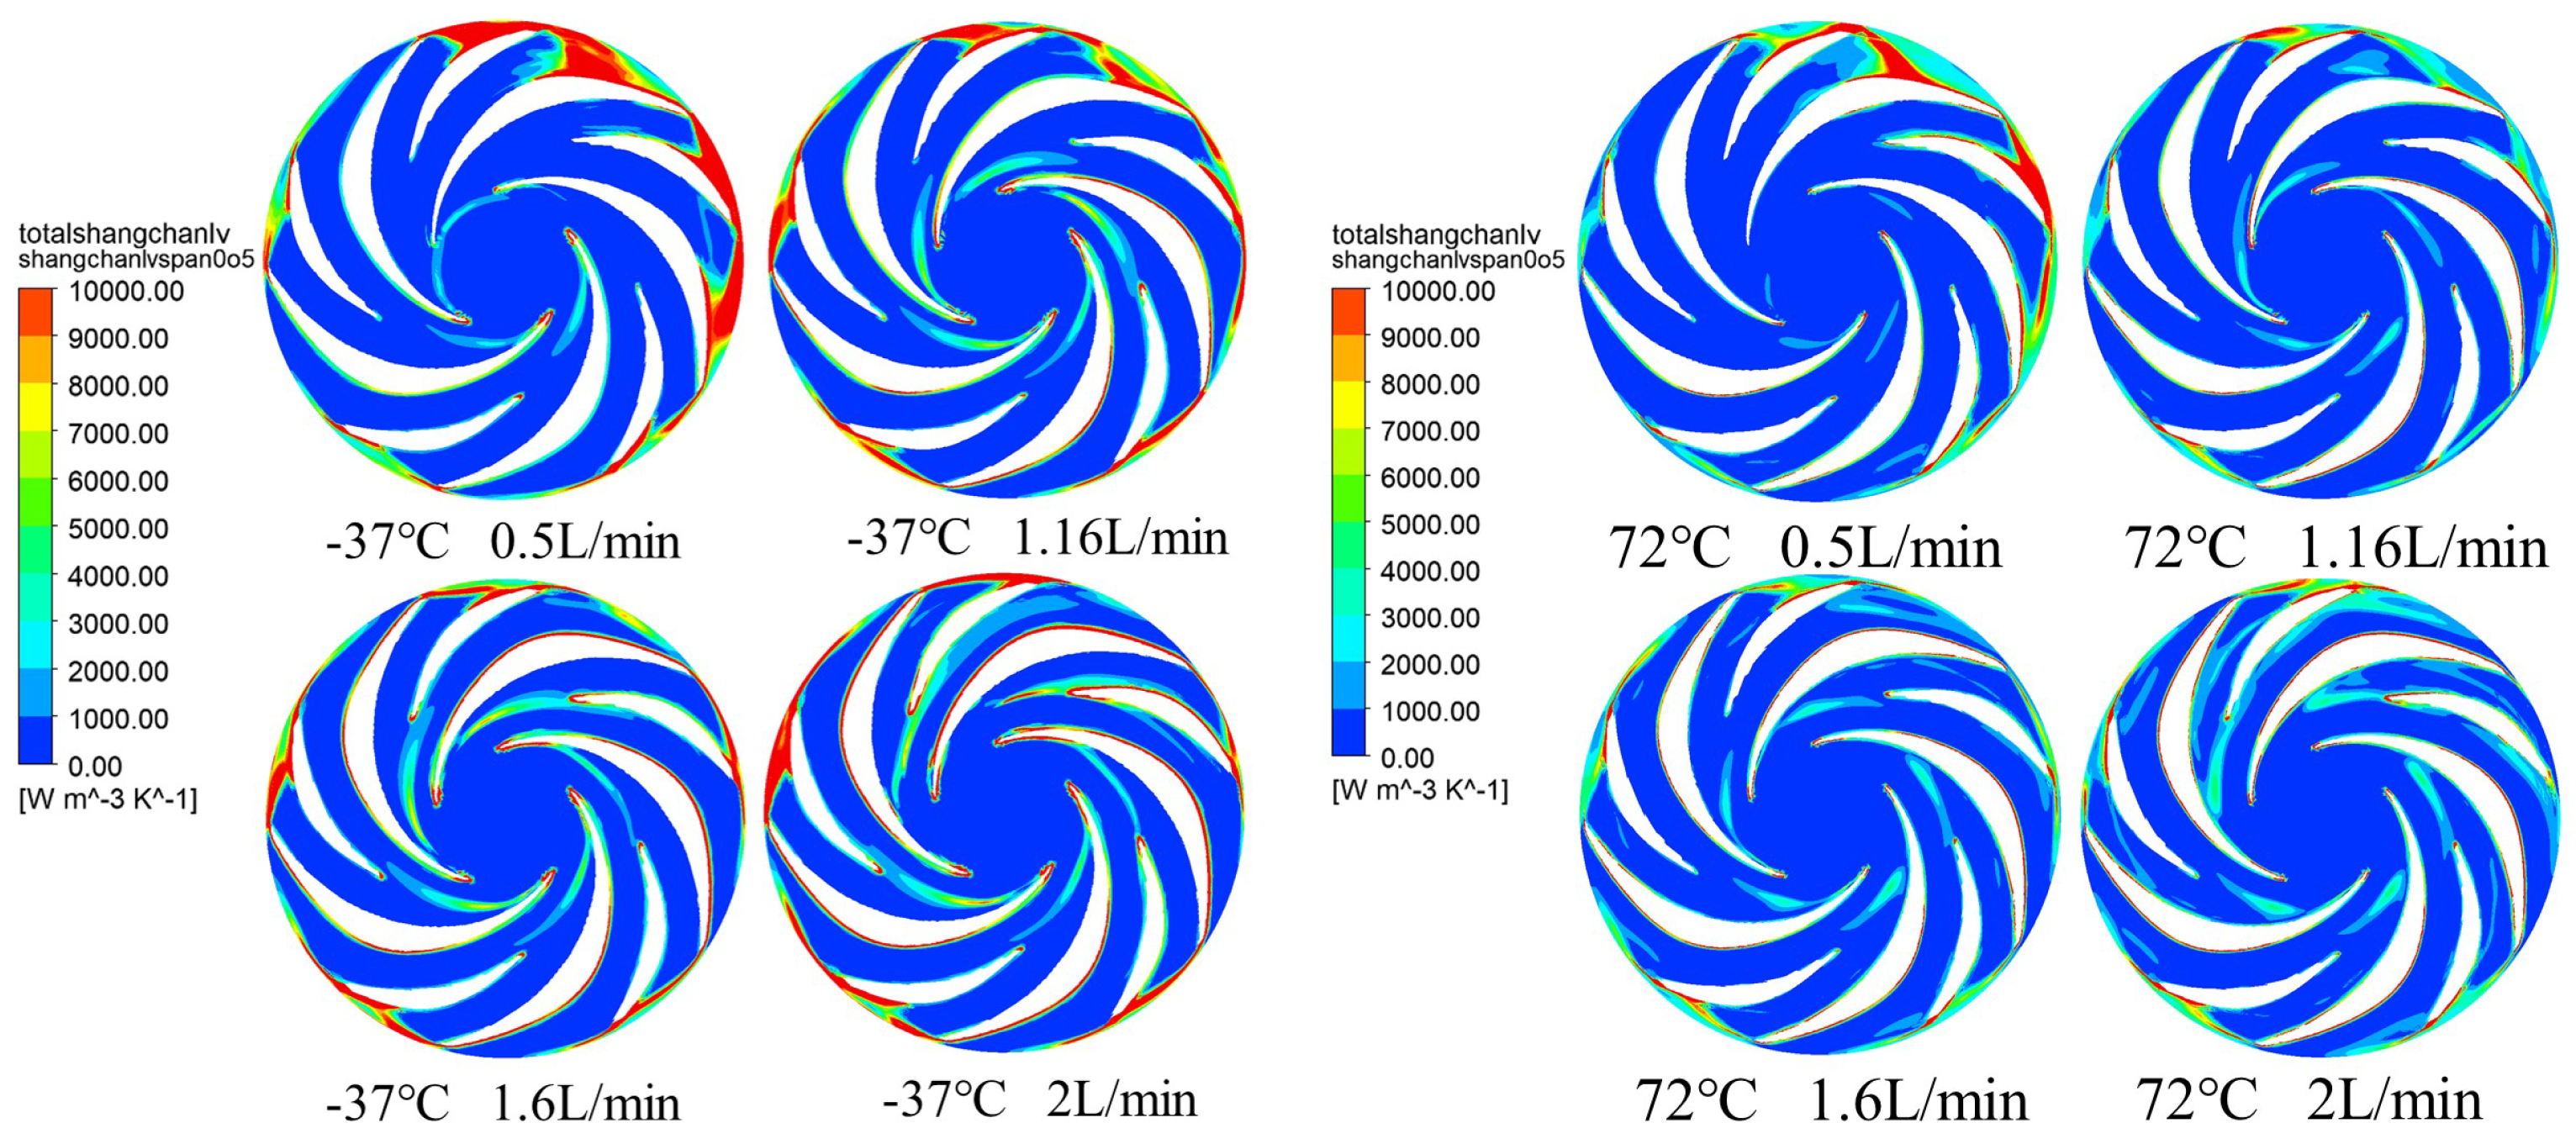
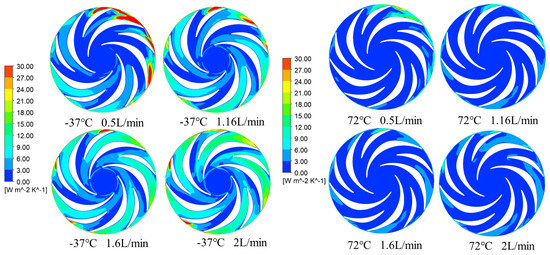
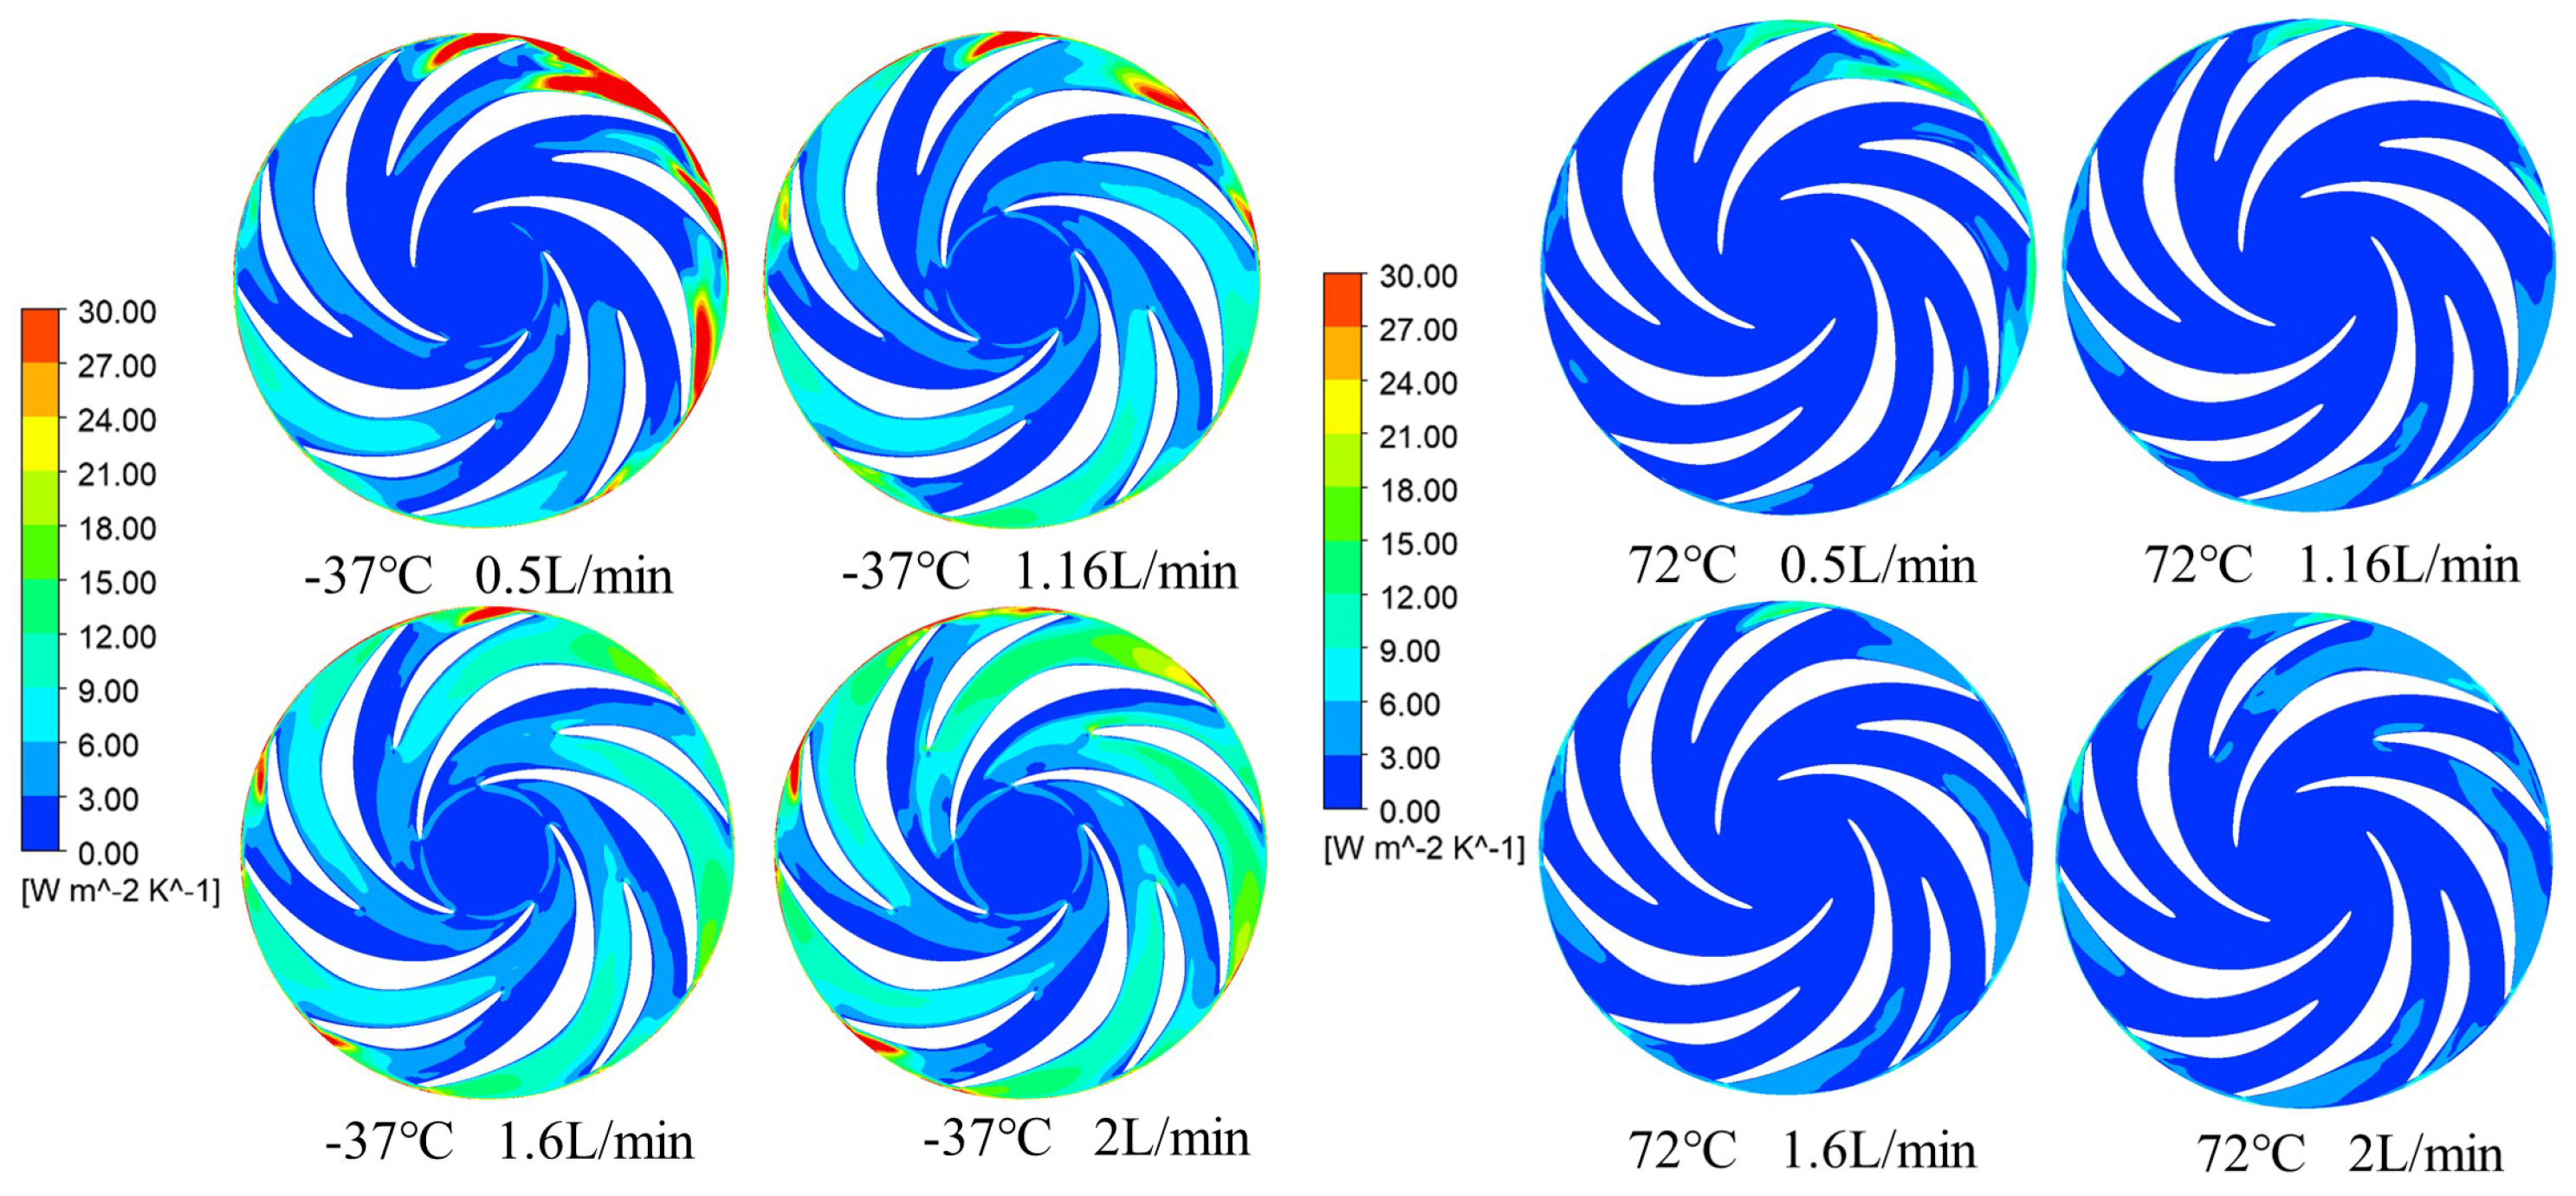
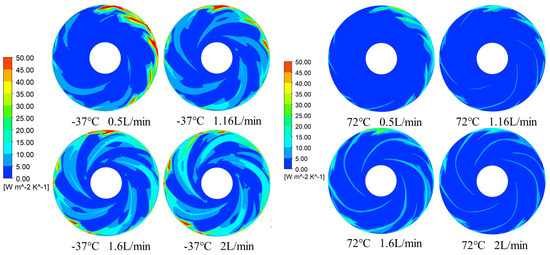
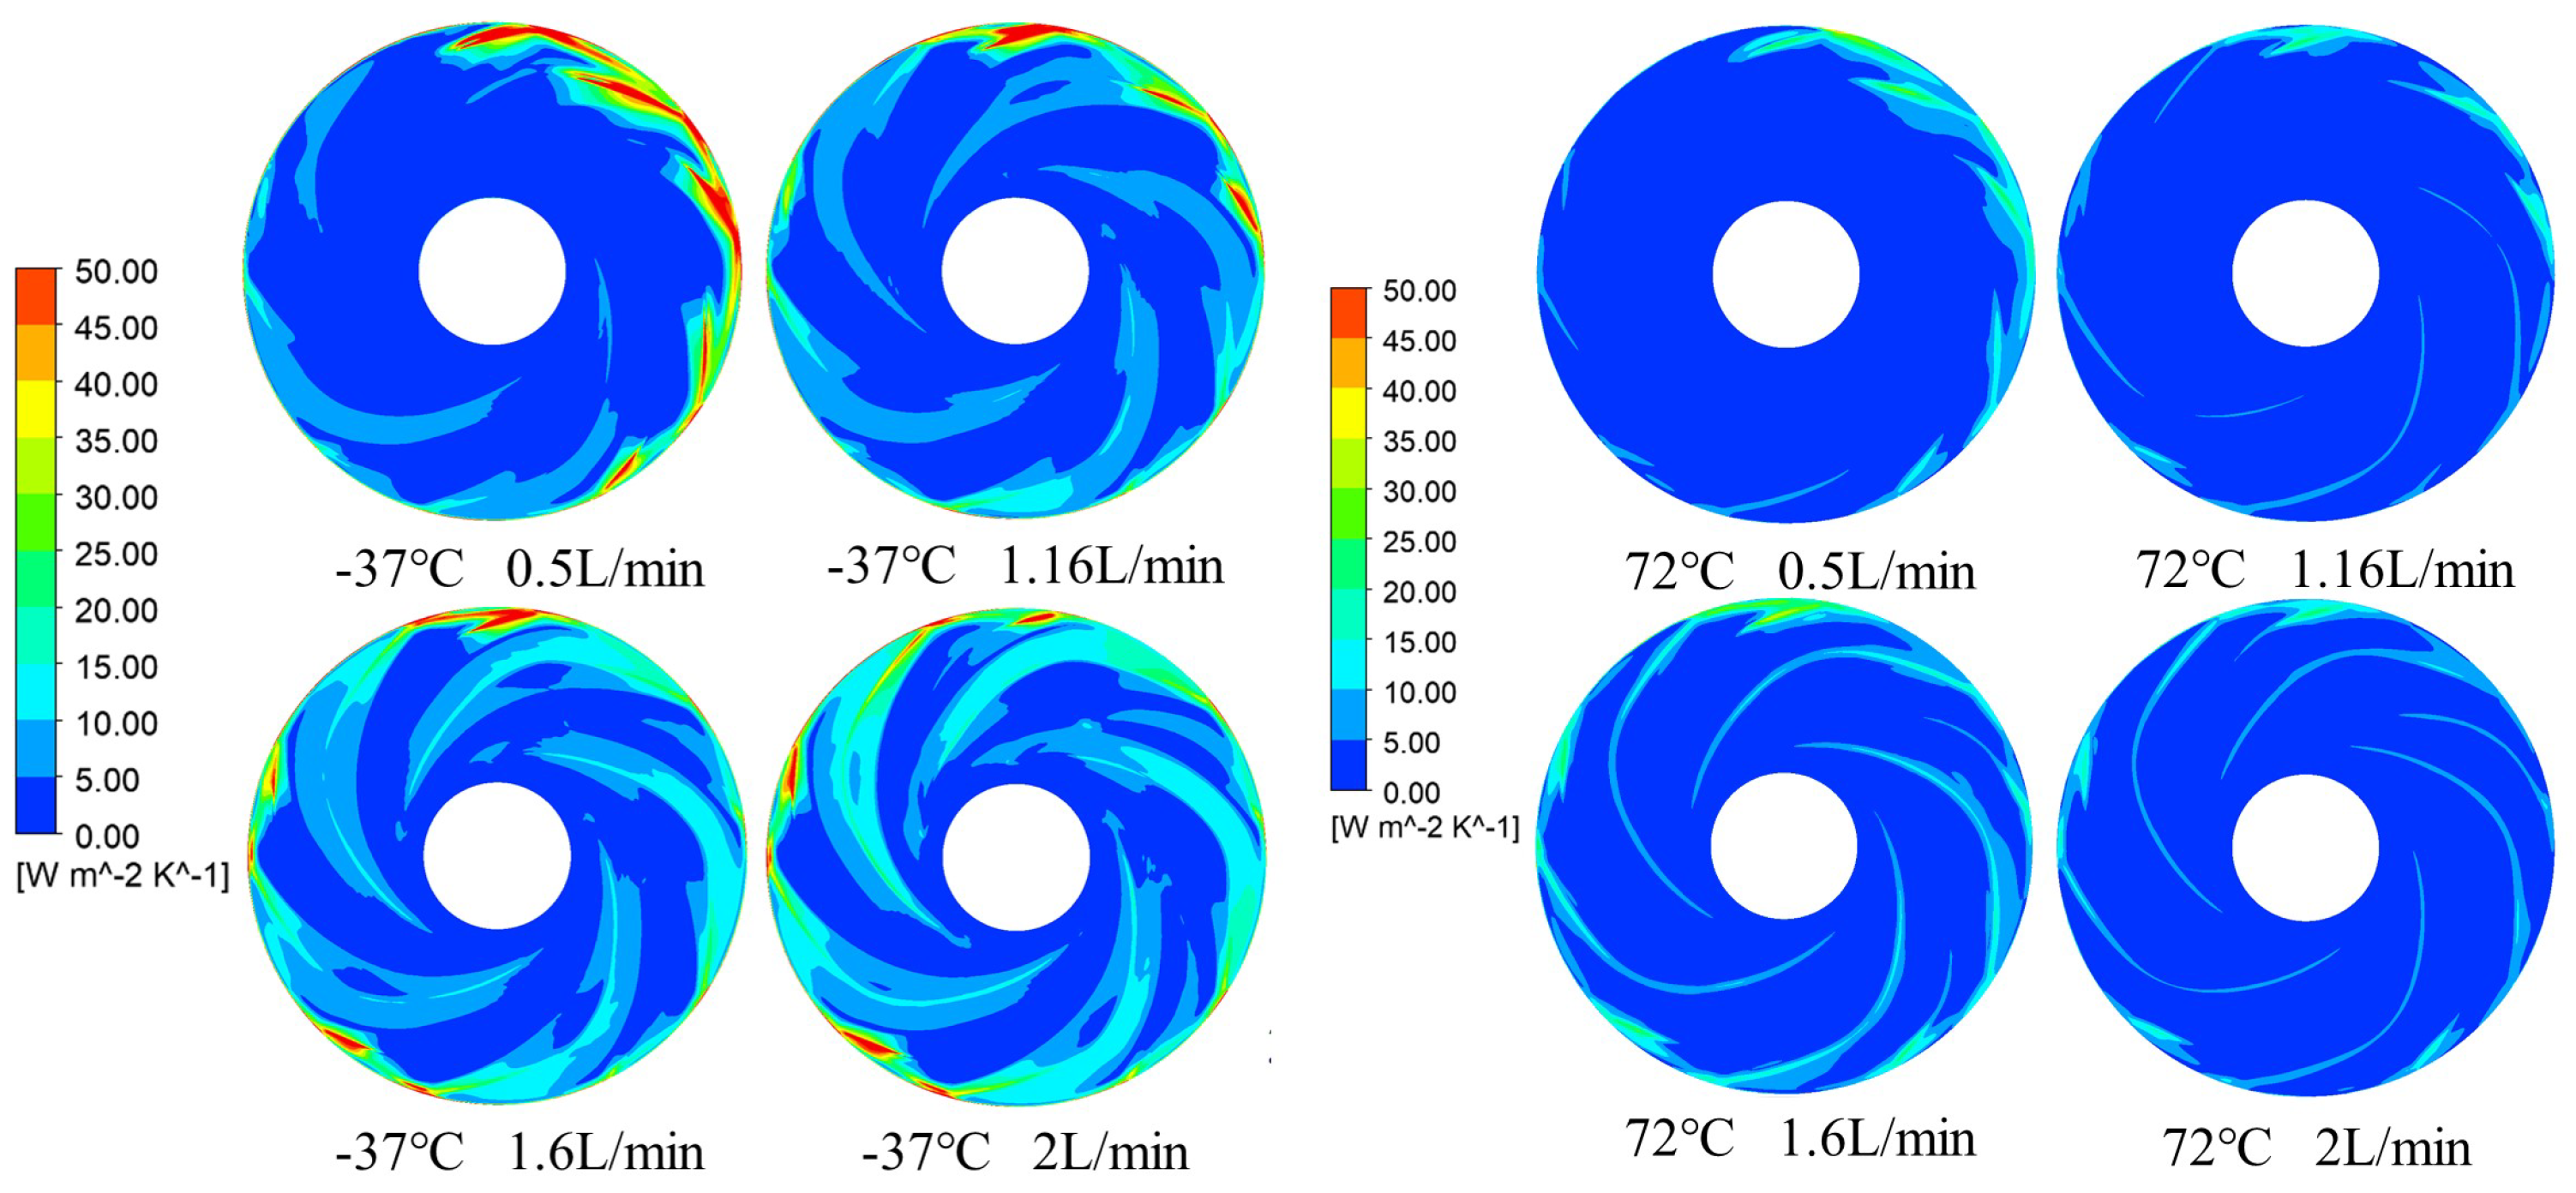
Entropy Generation Rate Distribution on Impeller Mid-Span Plane at : −37 °C vs. 72 °C at Various Flow Rates.
A comparison of entropy generation rate distributions across flow rates (Figure 22) reveals a pronounced influence of flow rate. At 0.5 L/min, entropy production is generally low throughout the impeller. As flow increases to 1.16 L/min, it rises markedly near the inlet working surfaces of both long and short blades, as well as along the impeller outer edge. This trend continues at 1.6 L/min and 2.0 L/min, with further increases in these regions.
Following cavitation inception on the suction side of the long blade inlet, entropy production at the cavitation site itself remains low. Downstream, however, a distinct band of higher entropy production elongates due to cavity compression. The greater the cavity extent, the stronger this compression effect.
As shown in Figure 23, at the rated flow rate, as the temperature gradually increases from −37 ℃ to 72 ℃, the entropy generation rate of the working and back surfaces of both long and short blades generally shows a decreasing trend. This is because at low temperatures, the fluid viscosity is higher, increasing flow resistance and resulting in higher frictional losses, thus increasing the entropy generation rate. Conversely, at high temperatures, the fluid viscosity decreases, reducing flow resistance and frictional losses, leading to a corresponding decrease in entropy generation rate. The entropy generation rate of the impeller outer edge wall also exhibits a similar trend at different temperatures, but its entropy generation rate remains consistently higher than that of the working and back surfaces of both long and short blades.
Figure 23.
Entropy Generation Rate Distribution on Lower Cover Wall at , Rated Flow, and Various Temperatures.
As shown in Figure 24, the entropy generation rate of the working and back surfaces of both long and short blades gradually increases with increasing flow rate. This is because the fluid flow is relatively stable at low flow rates, resulting in relatively small frictional losses; however, as the flow rate increases, the fluid velocity accelerates, the flow resistance increases, and the frictional losses also increase, leading to an increase in entropy generation rate. The entropy generation rate of the impeller outer edge wall also increases with increasing flow rate, and under all flow rates, its entropy generation rate is higher than that of the working and back surfaces of both long and short blades.
Figure 24.
Entropy Generation Rate Distribution on Lower Cover Wall at : −37 °C vs. 72 °C at Various Flow Rates.
A comprehensive comparative analysis of entropy generation rate distributions under different flow rates and temperatures revealed that the outer edge of the impeller consistently contributes the most to the total entropy generation rate of the upper cover plate. This is because the fluid linear velocity is highest at the impeller’s outer edge, forming a strong shear layer with the volute wall, leading to irreversible frictional losses dominating entropy production. Even during cavitation, the high-speed flow and shearing effect at the impeller’s outer edge ensure that its entropy generation rate remains higher than that of the blade working surface and the back surface region.
As shown in Figure 25, as temperature rises from −37 °C to 72 °C, the entropy generated in the clearance between the long/short blades and the upper shroud generally decreases. This trend results from the reduction in fluid viscosity at higher temperatures, which lowers flow resistance and frictional losses.
Figure 25.
Entropy Generation Rate Distribution on Upper Shroud Wall at , Rated Flow, and Various Temperatures.
As shown in Figure 26, when the flow rate changes, the entropy generation rate of the gap region between the long and short blades and the upper cover plate gradually increases with increasing flow rate. This is because at lower flow rates, the fluid flow is relatively smooth, and friction losses are relatively small; however, as the flow rate increases, the fluid flow velocity increases, the flow resistance increases, and the friction loss also increases, leading to an increase in entropy generation rate. The entropy generation rate of the impeller outer edge wall also increases with increasing flow rate, and under all flow rates, its entropy generation rate is higher than that of the gap region between the long and short blades and the upper cover plate.
Figure 26.
Entropy Generation Rate Distribution on Upper Shroud Wall at : −37 °C vs. 72 °C at Various Flow Rates.
Based on Figure 26, the entropy generation rate in the clearance between the blades and the front shroud increases with flow rate. At lower flows, fluid motion is smoother and frictional losses are reduced. As flow increases, higher velocities lead to greater flow resistance and friction, resulting in elevated entropy generation. The impeller outer wall exhibits a similar trend, with its entropy generation rate consistently higher than that in the blade-front shroud clearance across all flow rates.
A comparative analysis of entropy generation across flow rates and temperatures indicates that the impeller periphery consistently dominates entropy production on the front shroud. This results from the highest linear fluid velocity occurring at the outer edge, where a pronounced shear layer develops against the volute wall, generating substantial irreversible friction losses. Even under cavitating conditions, the high local velocity and shear at the periphery maintain its entropy generation rate above that in the blade-front shroud clearance region.
5. Summary
This study investigates the cavitation characteristics of a space micropump under various inlet temperatures at a cavitation number of . The results demonstrate that the influence of cavitation on pump performance is strongly dependent on both temperature and flow rate. In the low-temperature range below 0 °C, the number and volume of cavitation bubbles increase with rising temperature, accompanied by a denser distribution. This leads to a reduction in head and efficiency, along with a slight increase in shaft power. In contrast, under high-temperature conditions, cavitation is suppressed, resulting in a decrease in both head and shaft power, while efficiency improves.
Furthermore, cavitation exerts a more pronounced effect on the flow field at low temperatures, causing greater distortion of streamline patterns and enhancing turbulent kinetic energy, which complicates the internal flow structure. Entropy production analysis reveals that while cavitation itself contributes limited additional loss, the entropy generation rate rises significantly under combined low-temperature and high-flow-rate conditions. This indicates that active cavitation exacerbates local energy dissipation.
Overall, elevated temperatures suppress cavitation inception and development, whereas the impact of cavitation on space micropump performance is more substantial at lower temperatures. This effect is further amplified at higher flow rates.
Based on the above findings, beyond their implications for local flow characteristics, several key insights emerge for spacecraft thermal management. The most hazardous condition for a mechanically pumped fluid loop (MPFL) system occurs during transient orbital phases—specifically, when a spacecraft exits a prolonged eclipse and is subjected to sudden peak heat loads. Under such conditions, the system demands maximum flow rates while the coolant remains at its lowest temperature. As revealed in this study, this combination of low temperature and high flow rate significantly aggravates cavitation intensity. Such severe cavitation can induce abrupt flow blockage, pronounced pressure fluctuations, and a sharp decline in cooling capacity, ultimately leading to critical overheating of essential payloads. Given that cavitation is strictly prohibited in aerospace thermal control systems, effective countermeasures are essential. From a system-level perspective, ensuring adequate subcooling at the pump inlet serves as a key measure to suppress vaporization. Additionally, in hermetic sealless designs, vaporization may also occur within the narrow clearances where the working fluid cools the pump motor. Future structural optimization must therefore fully account for the thermo-fluid dynamic characteristics within these secondary flow paths. Finally, although the present study is constrained by the inherent challenges associated with microgravity and wide-temperature-range testing, establishing a dedicated ground-based experimental loop to empirically validate the temperature-dependent cavitation behavior remains a high priority for future work.
Given that cavitation is strictly prohibited in aerospace thermal control systems, effective countermeasures are essential. From a system-level perspective, ensuring adequate subcooling at the pump inlet serves as a key measure to suppress vaporization. Additionally, in hermetic sealless designs, vaporization may also occur within the narrow clearances where the working fluid cools the pump motor. Future structural optimization must therefore fully account for the thermo-fluid dynamic characteristics within these secondary flow paths. Finally, although the present study is constrained by the inherent challenges associated with microgravity and wide-temperature-range testing, establishing a dedicated ground-based experimental loop to empirically validate the temperature-dependent cavitation behavior remains a high priority for future work.
Author Contributions
Conceptualization, D.Z.; methodology, D.Z., J.L. and Z.Q.; software, L.M., Z.Q. and K.G.; validation, L.M., Z.Q. and Z.Z.; formal analysis, J.L.; investigation, J.L., Z.Q. and Z.Z.; resources, D.Z.; data curation, J.L.; writing—original draft preparation, D.Z.; writing—review and editing, D.Z. and J.L.; visualization, L.M. and K.G.; supervision, J.L.; project administration, D.Z. and J.L.; funding acquisition, J.L. All authors have read and agreed to the published version of the manuscript.
Funding
This work was supported by the National Natural Science Foundation of China (Grant No. 52176034).
Data Availability Statement
The original contributions presented in the study are included in the article; further inquiries can be directed to the corresponding author.
Acknowledgments
The authors would like to thank all the reviewers and editors for their comments on this article.
Conflicts of Interest
The authors declare no conflicts of interest.
References
- Paris, A.D.; Bhandari, P.; Birur, G.C. High Temperature Mechanically Pumped Fluid Loop for Space Applications–Working Fluid Selection; Technical report; SAE Technical Paper: Warrendale, PA, USA, 2004. [Google Scholar]
- Bhandari, P.; Birur, G.C.; Bame, D.; Mastropietro, A.J.; Karlmann, P.; Liu, Y.; Miller, J. Performance of the mechanically pumped fluid loop rover heat rejection system used for thermal control of the Mars science laboratory curiosity rover on the surface of Mars. In Proceedings of the 43rd International Conference on Environmental Systems, Vail, CO, USA, 14–18 July 2013; p. 3323. [Google Scholar]
- Daimaru, T.; Furst, B.; Cappucci, S.; Sunada, E.; Birur, G. Development of an evaporator using porous wick structure for a two-phase mechanically pumped fluid loop. In Proceedings of the 49th International Conference on Environmental Systems, Boston, MA, USA, 7–11 July 2019. [Google Scholar]
- Valdarno, L.; Dhir, V.K.; Furst, B.; Sunada, E. Heat transfer modeling in the wick structure of an innovative evaporator for a two-phase mechanically pumped loop. In Proceedings of the 2020 International Conference on Environmental Systems, Sydney, Australia, 3–5 December 2020. [Google Scholar]
- Lv, Y.G.; Wang, Y.T.; Meng, T.; Wang, Q.W.; Chu, W.X. Review on thermal management technologies for electronics in spacecraft environment. Energy Storage Sav. 2024, 3, 153–189. [Google Scholar] [CrossRef] [Scilit]
- Neumaier, R. Hermetic Pumps: The Latest Innovations and Industrial Applications of Sealless Pumps; Gulf Professional Publishing: Woburn, MA, USA, 1997. [Google Scholar]
- Cheng, W.; Shao, C.; Fan, H. Impacts of cavitation on flow field distributions and pump stability in cryogenic pumps. J. Low Temp. Phys. 2023, 211, 86–107. [Google Scholar] [CrossRef] [Scilit]
- Franc, J.P.; Michel, J.M. Fundamentals of Cavitation; Springer: Berlin/Heidelberg, Germany, 2005. [Google Scholar]
- Lu, J.; Yuan, S.; Luo, Y.; Yuan, J.; Zhou, B.; Sun, H. Numerical and experimental investigation on the development of cavitation in a centrifugal pump. Proc. Inst. Mech. Eng. Part E 2014, 230, 213–214. [Google Scholar] [CrossRef] [Scilit]
- Ge, M.; Petkovšek, M.; Zhang, G.; Jacobs, D.; Coutier-Delgosha, O. Cavitation dynamics and thermodynamic effects at elevated temperatures in a small Venturi channel. Int. J. Heat Mass Transf. 2021, 170, 120970. [Google Scholar] [CrossRef] [Scilit]
- Wu, X.; Liu, Y.; Li, Z.; Yin, X.; Chen, T. Numerical Study of Cavitating Flows in an External Gear Pump with Special Emphasis on Thermodynamic Effects. Appl. Sci. 2025, 15, 3529. [Google Scholar] [CrossRef] [Scilit]
- Friedrichs, J.; Kosyna, G.N. Rotating cavitation in a centrifugal pump impeller of low specific speed. J. Fluids Eng. 2002, 124, 356–362. [Google Scholar] [CrossRef] [Scilit]
- Coutier-Delgosha, O.; Fortes-Patella, R.; Reboud, J.L.; Hofmann, M.; Stoffel, B. Experimental and Numerical Studies in a Centrifugal Pump with Two-Dimensional Curved Blades in Cavitating Condition. J. Fluids Eng. 2003, 125, 970–978. [Google Scholar] [CrossRef] [Scilit]
- Tao, R.; Xiao, R.; Wang, F.; Liu, W. Cavitation behavior study in the pump mode of a reversible pump-turbine. Renew. Energy 2018, 125, 655–667. [Google Scholar] [CrossRef] [Scilit]
- Rakibuzzaman, M.; Kim, K.; Suh, S.H. Numerical and experimental investigation of cavitation flows in a multistage centrifugal pump. J. Mech. Sci. Technol. 2018, 32, 1071–1078. [Google Scholar] [CrossRef] [Scilit]
- Xing, Z.; Lai, X.-D.; Jiao, L.; Liao, G.-L. Influence of Inlet Diameters of Splitter Blades on the Cavitation Performance of Centrifugal Pumps. J. Eng. Therm. Energy Power 2017, 32, 45–50+122–123. [Google Scholar] [CrossRef]
- Vigil, Á.P.; Pérez, J.G.; Suárez, A.G.; Oro, J.M.F.; Perotti, R.B.; Vega, M.G. Global Measurements and Hysteresis-Based NPSH Acoustic Approach for the Experimental Study of Cavitation in a Centrifugal Pump. J. Fluids Eng. 2025, 147, 111205. [Google Scholar] [CrossRef] [Scilit]
- Dehghan, A.A.; Shojaeefard, M.H.; Roshanaei, M. Exploring a new criterion to determine the onset of cavitation in centrifugal pumps from energy-saving standpoint; experimental and numerical investigation. Energy 2024, 293, 130681. [Google Scholar] [CrossRef] [Scilit]
- Wislicenus, G.; Watson, R.; Karassik, I. Cavitation Characteristics of Centrifugal Pumps Described by Similarity Considerations. Trans. Am. Soc. Mech. Eng. 1939, 61, 17–24. [Google Scholar] [CrossRef] [Scilit]
- Sarosdy, L.R.; Acosta, A.J. Note on Observations of Cavitation in Different Fluids. J. Basic Eng. 1961, 83, 399–400. [Google Scholar] [CrossRef] [Scilit]
- Stahl, H.A.; Stepanoff, A.J. Thermodynamic Aspects of Cavitation in Centrifugal Pumps. Trans. Am. Soc. Mech. Eng. 2022, 78, 1691–1693. [Google Scholar] [CrossRef] [Scilit]
- Gelder, T.F.; Moore, R.D.; Ruggeri, R.S. Cavitation Similarity Considerations Based on Measured Pressure and Temperature Depressions in Cavitated Regions of Freon 114; Technical Report. 1966. Available online: https://www.semanticscholar.org/paper/Cavitation-similarity-considerations-based-on-and-Gelder-Moore/1890043a689f581866ef87d4a03c7c3dfbc131f0 (accessed on 10 February 2026).
- Moore, R.D.; Ruggeri, R.S. Prediction of Thermodynamic Effects of Developed Cavitation Based on Liquid-Hydrogen and Freon-114 Data on Scaled Venturis; Technical report; National Aeronautics and Space Administration: Moffett Field, CA, USA, 1968.
- Moore, R.D.; Ruggeri, R.S. Method for Prediction of Pump Cavitation Performance for Various Liquids, Liquid Temperatures, and Rotative Speeds; Technical report; National Aeronautics and Space Administration: Moffett Field, CA, USA, 1969.
- Hord, J. Cavitation in Liquid Cryogens. 3: Ogives; Technical report; NASA: Greenbelt, MD, USA, 1973.
- Franc, J.P.; Janson, E.; Morel, P.; Rebattet, C.; Riondet, M. Visualizations of leading edge cavitation in an inducer at different temperatures. In Proceedings of the 4th International Symposium on Cavitation, Pasadena, CA, USA, 20–23 June 2001. [Google Scholar]
- Franc, J.P.; Rebattet, C.; Coulon, A. An experimental investigation of thermal effects in a cavitating inducer. Asme J. Fluids Eng. 2004, 126, 716–723. [Google Scholar] [CrossRef] [Scilit]
- Cervone, A.; Testa, R.; Bramanti, C.; Rapposelli, E.; D’Agostino, L. Thermal Effects on Cavitation Instabilities in Helical Inducers. J. Propul. Power 2005, 21, 307–326. [Google Scholar] [CrossRef] [Scilit]
- Cervone, A.; Bramanti, C.; Rapposelli, E.; D’Agostino, L. Thermal Cavitation Experiments on a NACA 0015 Hydrofoil. J. Fluids Eng. 2005, 128, 326–331. [Google Scholar] [CrossRef] [Scilit]
- Rodio, M.G.; De Giorgi, M.G.; Ficarella, A. Influence of convective heat transfer modeling on the estimation of thermal effects in cryogenic cavitating flow. Int. J. Heat Mass Transf. 2012, 55, 6538–6554. [Google Scholar] [CrossRef] [Scilit]
- Rhee, S.H.; Kawamura, T.; Li, H. Propeller Cavitation Study Using an Unstructured Grid Based Navier-Stoker Solver. J. Fluids Eng. 2005, 127, 986–994. [Google Scholar] [CrossRef] [Scilit]
- Pascarella, C.; Salvatore, V.; Ciucci, A. Effects of speed of sound variation on unsteady cavitating flows by using a barotropic model. In Proceedings of the 5th International Symposium on Cavitation CAV2003, Osaka, Japan, 1–4 November 2003. [Google Scholar]
- Rapposelli, E.; D’Agostino, L. A barotropic cavitation model with thermodynamic effects. In Proceedings of the Fifth International Symposium on Cavitation, Osaka, Japan, 1–4 November 2003. [Google Scholar]
- Hosangadi, A.; Ahuja, V. Numerical Study of Cavitation in Cryogenic Fluids. J. Fluids Eng. 2005, 127, 267–281. [Google Scholar] [CrossRef] [Scilit]
- Tseng, C.C.; Shyy, W. Modeling for isothermal and cryogenic cavitation. Int. J. Heat Mass Transf. 2010, 53, 513–525. [Google Scholar] [CrossRef] [Scilit]
Disclaimer/Publisher’s Note: The statements, opinions and data contained in all publications are solely those of the individual author(s) and contributor(s) and not of MDPI and/or the editor(s). MDPI and/or the editor(s) disclaim responsibility for any injury to people or property resulting from any ideas, methods, instructions or products referred to in the content. |
© 2026 by the authors. Licensee MDPI, Basel, Switzerland. This article is an open access article distributed under the terms and conditions of the Creative Commons Attribution (CC BY) license.