


Abstract
The investigation of the emergency situation of an aircraft landing on water is mandatory for the certification of novel aircraft. In this context, computer-aided methods are becoming more relevant to support physical testing and to extend the analysis to further impact conditions. In this work, the meshless Lagrangian Finite Pointset Method was integrated into an aircraft pre-design process chain and used for the simulation of the interaction between the water and the structure during ditching. To assess the applicability of the method, results from simulations were compared with experimental data from water impact tests of curved panels and scaled models. In addition, the method was implemented in ditching simulations using a generic mid-range aircraft model. Results are analyzed in terms of accuracy, flexibility, and performance.
1. Introduction
The event of a planned emergency landing on water, known as ditching, is characterized by severe hydrodynamic loads and the presence of hydrodynamic phenomena capable of influencing the kinematics or even affecting the structural integrity of the aircraft. Ditching is analyzed with sub-scale models on experimental campaigns, by means of comparisons with previously certified aircraft or by virtual methods [1]. Computer-aided approaches are convenient in terms of time, cost, and also repeatability and parametric variation. They can be categorized according to the level of fidelity, from semi-analytical to advanced numerical methods.
Eulerian or meshless Lagrangian formulations like the Arbitrary Lagrangian Eulerian (ALE) or the Smoothed Particle Hydrodynamics (SPH) are commonly used in coupled explicit numerical ditching simulations due to the expected large fluid displacements and the structural response of the aircraft [2,3,4,5]. Nevertheless, numerical simulations of an aircraft ditching have one common challenge: the generally costly computational effort for accurate computations. Besides the application of modeling strategies to reduce the complexity of the model [6] or the use of enhanced formulations like the Structured Arbitrary Lagrangian Eulerian (S-ALE) [7], novel methods may also be considered for time-efficient simulations. This paper investigates the application of the Finite Pointset Method (FPM) for ditching simulations in the preliminary aircraft design. The implicit time integration schema of the FPM allows calculating the fluid flow with higher time steps (in the range of milliseconds) compared to explicit approaches, resulting in lower wall-clock times. Investigations are conducted using test cases including water impact in a guided motion and with scale models in free motion, combined also with the assessment of scalability effects. In addition, the effect of waves is addressed in aircraft ditching simulations.
2. FSI Analysis in a Multidisciplinary Aircraft Design Process Chain
In the preliminary design, potential aircraft configurations are assessed in an iterative process using a virtual framework. This approach allows to perform parametric studies and to consider methods of higher fidelity where analytical or handbook methods are limited in providing information, like for crash and impact analysis. Being ditching part of the certification requirements, it shall also be considered at this design stage.
2.1. Numerical Methods
The numerical representation is a coupled interaction between a Lagrangian structural model and a meshless fluid basin. The surface of the structure is modeled using Finite Elements (FE) and forms rigid bodies with pre-defined mass properties. The magnitude of the impact causes large displacements in the fluid domain. Therefore, a meshless discretization is applied. In this work, the FPM, developed by Fraunhofer ITWM, is considered for the fluid [8]. In the FPM, the fluid is discretized by a finite set of points distributed arbitrarily in the domain. The individual points have no mass or volume, but they move, carrying fluid properties like density, velocity, and pressure; i.e., points are used for the interpolation of the fluid quantities with the neighboring points interacting inside a spatial support domain. The size of this support domain is defined by a smoothing length, and the number of points inside the domain is restricted by a weight function. A minimum number of points and a minimum arrangement should be satisfied in the support domain.
FPM solves numerically incompressible Navier–Stokes equations in Lagrangian form by using a projection method. The continuity and momentum equations, relevant in the scope of this work with respect to the calculation of the fluid pressure, are presented in Equations (1) and (2), respectively.
Continuity:
Momentum:
Here, is the velocity vector, the dynamic viscosity, the density, the pressure, and is the gravity. In order to determine the pressure at the position of a point from its neighboring points, a Taylor series expansion around this position is used. To solve the unknown spatial derivatives from the Taylor expansion, a moving least squares approximation is used. For further information on the mathematical fundamentals, the reader is referred to [8,9].
2.2. Virtual Process Chain
The generation of FE models is executed automatically using the Python 3-based tool for structural modeling PANDORA [10]. It uses data stored in the DLR’s multidisciplinary dataset CPACS [11] to extract inputs about the geometry, the materials, and the structural and mass description, necessary for model generation. The data of the model is described in a hierarchical format, including branches to define boundary and initial conditions.
Several functions have been implemented in the tool to generate standard FPM water basins [12]. The standard model is a rectangular domain surrounded at the top by a free surface and at the sides and at the bottom by rigid walls. A void domain has to be additionally included above the free surface. The interface to the FE model impacting the fluid is defined by an additional surface boundary condition.
FPM is integrated in a module in the software Virtual Performance Solution (VPS). The FPM solver performs CFD calculations to solve the Navier–Stokes equations using an implicit time integration schema [9]. The module automatically generates the point set below the free surface before the first iteration. The point arrangement and the number of points are based on the defined smoothing length. In addition to a global smoothing length that is considered for the entire flow field, a local smoothing length can be defined to refine locally the point set to increase the accuracy in relevant regions. The fluid properties are set by pre-defined values corresponding to water at 300 K. At each iteration the fluid pressure is calculated and transferred to the FE solver of the software using an explicit time step coupling. The pressure is applied as an external load to the adjacent structural FEs. This may cause changes, e.g., in the motion. The updated positions and velocities are transferred back to the FPM module as boundary conditions for the next iteration of the flow state.
In this work, simulations were launched on a workstation using 3rd gen. AMD EPYC processors (3.00 GHz) and computed with the VPS version 2021.0 for the simulation of the test cases and with version 2024.0 for the aircraft ditching simulation, which provides updated features on the FE solver side.
2.3. Sea Conditions
The fluid domain generator was extended to generate waves. A wave maker is used to create progressive waves by moving back and forth a wall located at the front edge of the fluid domain. The sinusoidal stimulation of the wall is calculated using the linear wave theory with the frequency and amplitude defined by the user to get the desired wave pattern. The standard sinusoidal function is described in Equation (3).
To minimize interferences from reflecting waves, a generic beach-like sloped surface was implemented at the rear pool edge. A 20° inclination provides good absorption for various amplitudes with a low increase in the computational cost.
3. Test Cases
The initial investigation is based on an experimental campaign performed in the EU Horizon 2020 ditching project SARAH using double-curvature test specimens in a guided ditching [13,14,15]. This investigation gives an insight into hydrodynamic effects that may appear at higher velocities during ditching. The second case is based on ditching tests performed by the NACA to investigate the influence of the rear fuselage shape on the kinematic behavior of scaled aircraft during ditching [16]. The third case assesses scalability effects in ditching simulations with models scaled to full-size representations.
3.1. Investigation of Hydrodynamic Effects
The curvature typically encountered at the rear fuselage and the relative velocity difference between the approaching aircraft and the free surface may cause pressure-dependent hydrodynamic phenomena. To address effects like suction, cavitation, or ventilation, a high-speed ditching facility was used in the scope of the project SARAH to perform guided ditching tests with panels at velocities ranging from 21 m/s to 45 m/s [13]. The facility is based on a catapult system to accelerate a trolley along a guide towards the water basin. The trolley contains a box assembly, beneath which the test specimen is attached. In this work, the test specimen considered for comparisons with the numerical results is a convex panel with a swept-up rear section, similar to the rear bottom fuselage shape in a transport aircraft. The specimen has a length of 1240 mm and a width of 660 mm, and the longitudinal curvature starts in the longitudinal direction at 63.7% of its length.
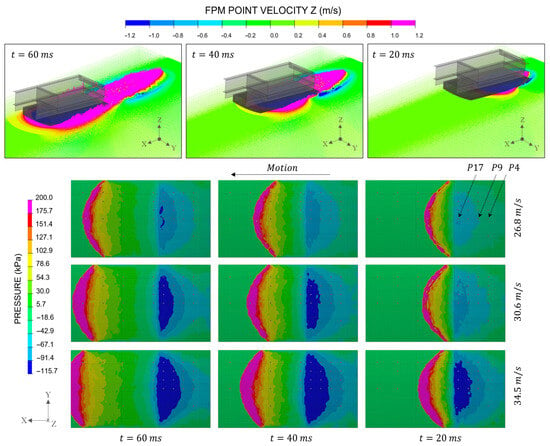
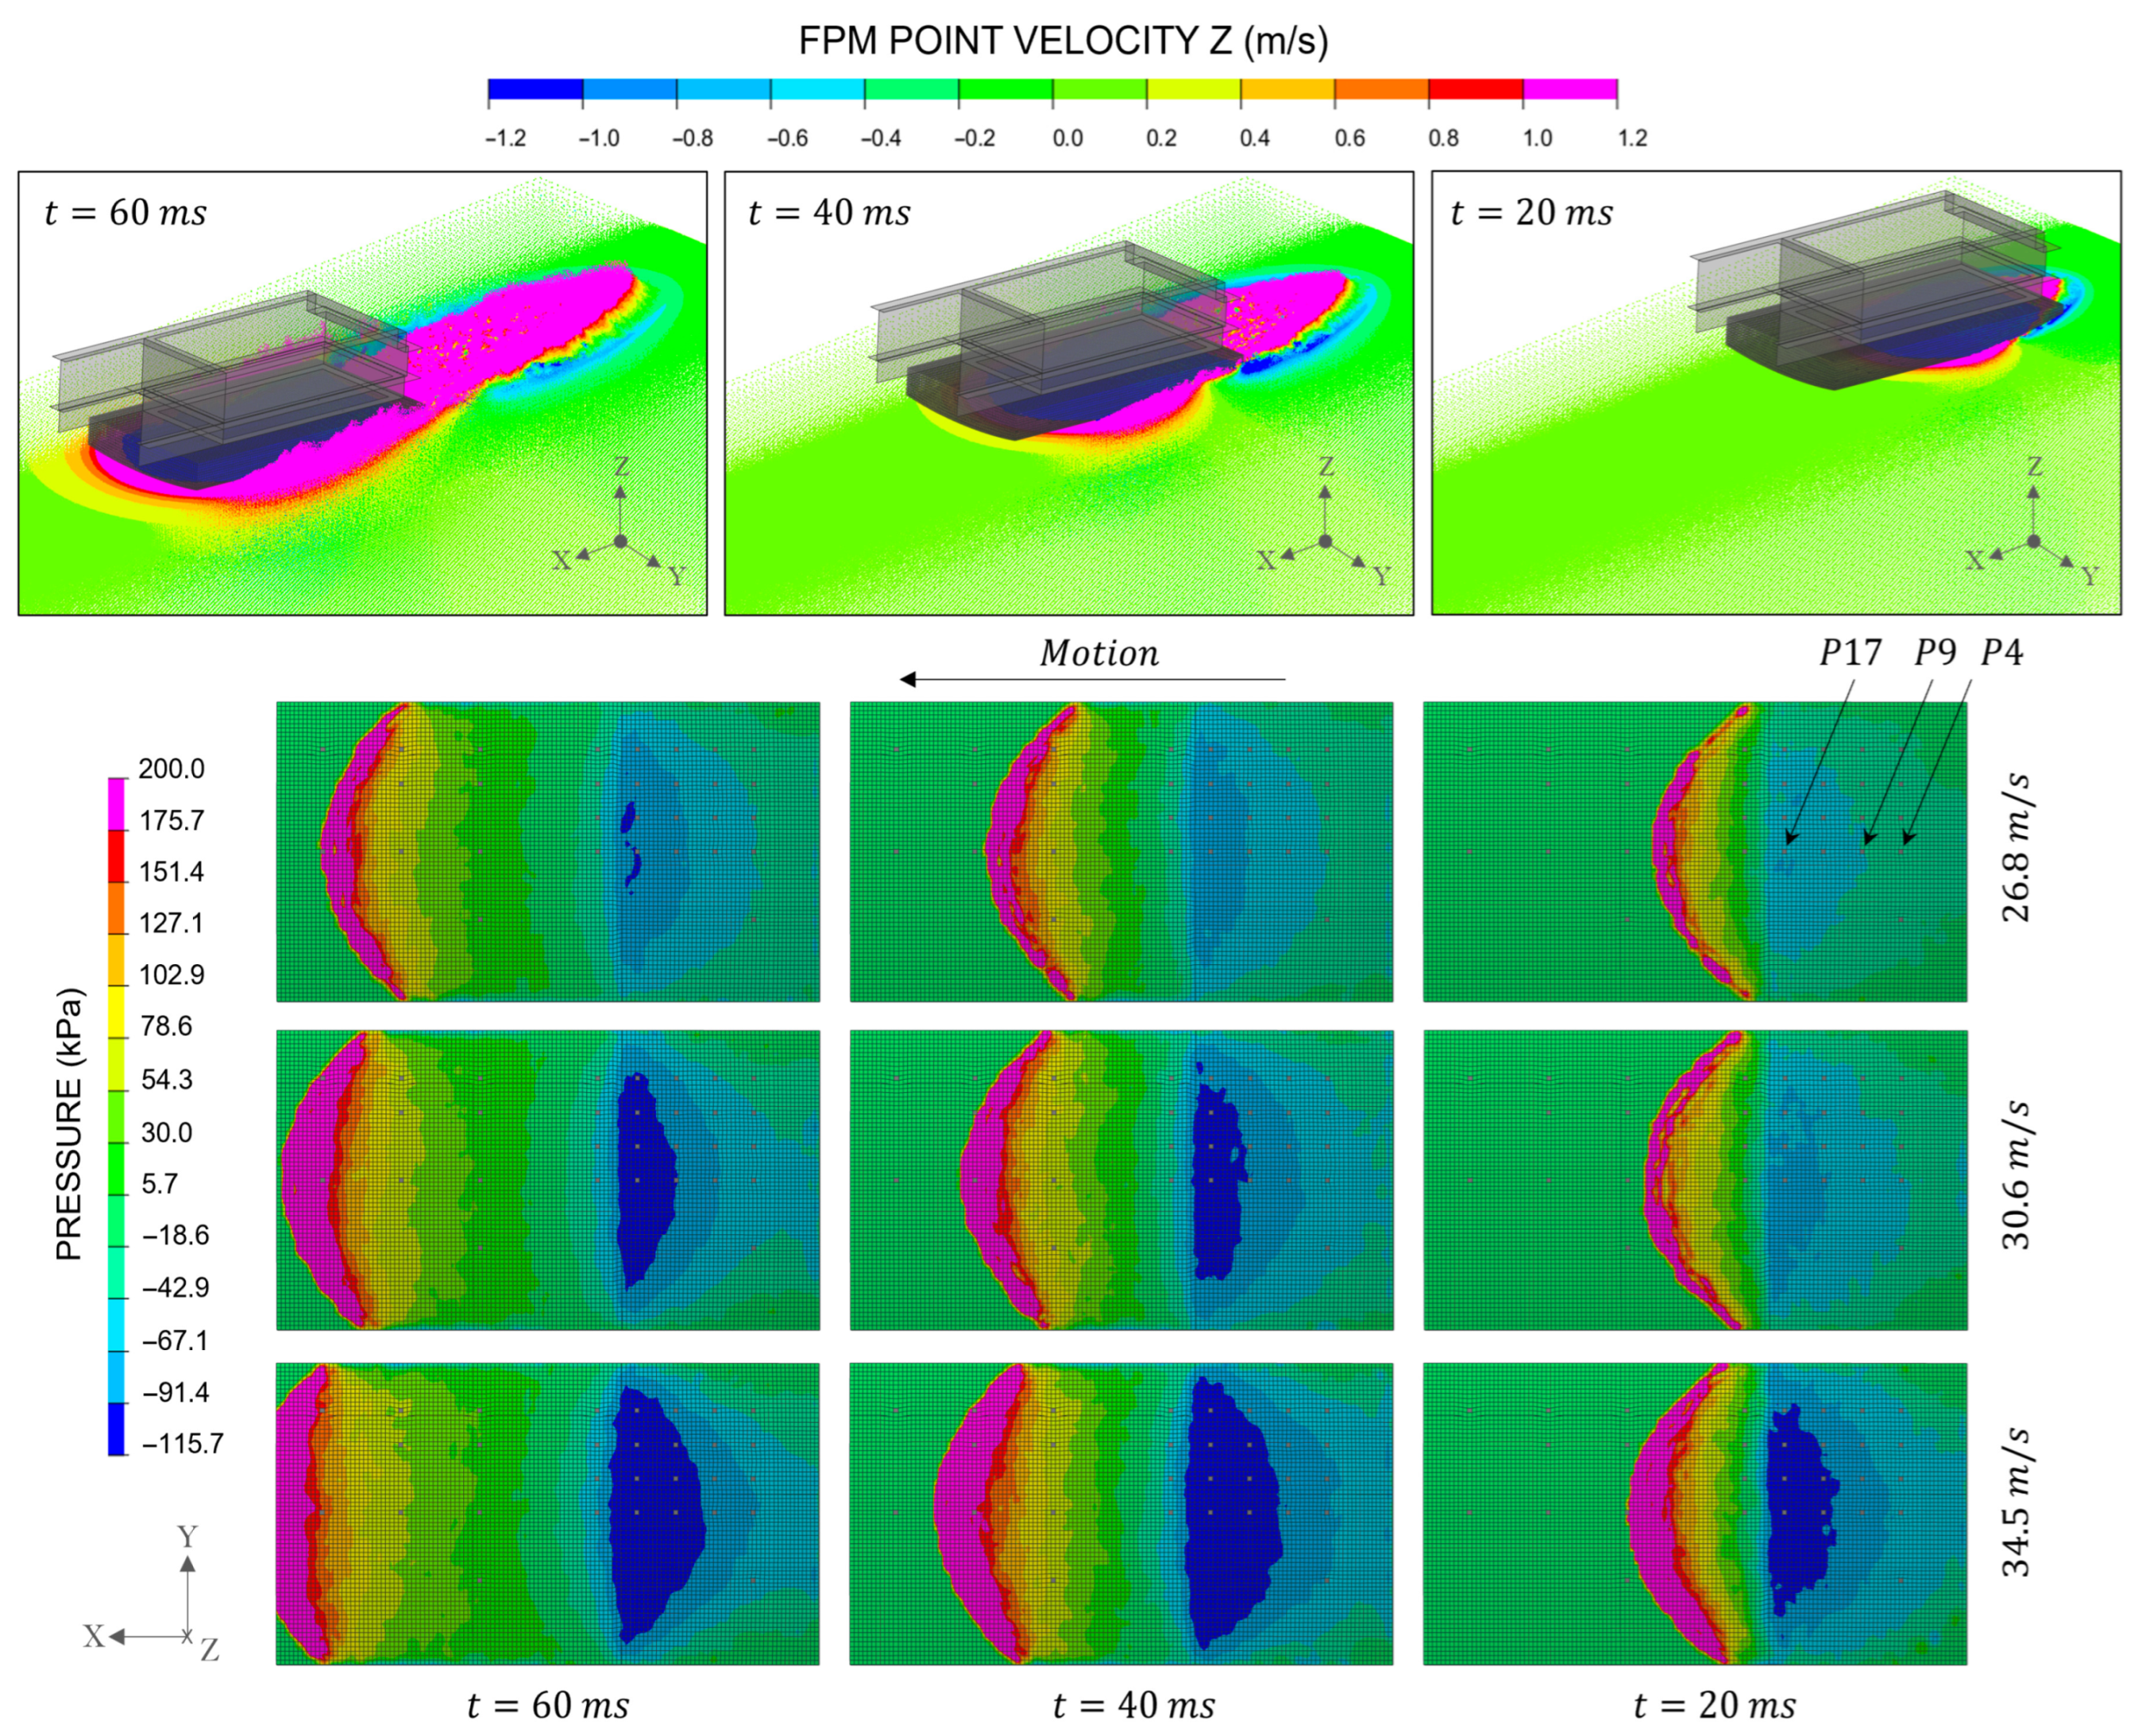
The rigid FE model includes the box assembly carrying the test specimen and has a total mass of 838.12 kg, which also includes the mass of the trolley. The pitch angle is 6°, and the vertical-to-horizontal velocity ratio is 0.0375, i.e., the guide angle is −2.15°. Since no cavitation model is available in FPM, the drop of the dynamic pressure was numerically limited to −100 kPa, similar to the relative vapor pressure at test conditions. This artificial limitation is controlled in the FPM solver before the pressure is transferred to the structural solver. The selected global smoothing length was 100 mm. Nevertheless, to have a high accuracy below the panel where hydrodynamic effects are particularly expected, a local smoothing length of 15 mm was included for the simulations. The simulation time of 60 ms covers the impact and the initial landing phase. Figure 1(top) shows a sequence of a guided ditching simulation at 20 ms, 40 ms, and 60 ms with the double-curvature panel impacting the water at 30.6 m/s. In Figure 1(bottom), the results of the simulations with 26.8 m/s, 30.6 m/s, and 34.5 m/s are presented. In dark blue is the area in which the pressure may sink to the vapor pressure. The locations of the pressure probes are depicted in gray.
Figure 1.
(Top): Guided ditching simulation. Contours of the vertical velocity. (Bottom): Contours of the gauge pressure on the bottom of the panel.
The probes P17, P9, and P4 are located on the symmetry line of the bottom of the panel at 66.5%, 80.9%, and 88% in the longitudinal direction, respectively. With higher velocities, the size of the dark blue area increases. In the test data, at 26.8 m/s some local pressure drops could be identified, and at 30.6 m/s a cavitation bubble could be observed at the position of the pressure probes P17 and P9. At 34.5 m/s the cavitation area extends up to P4.
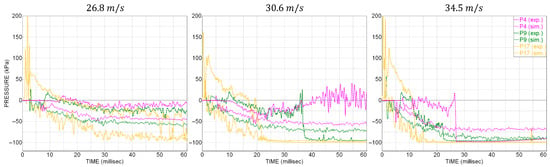
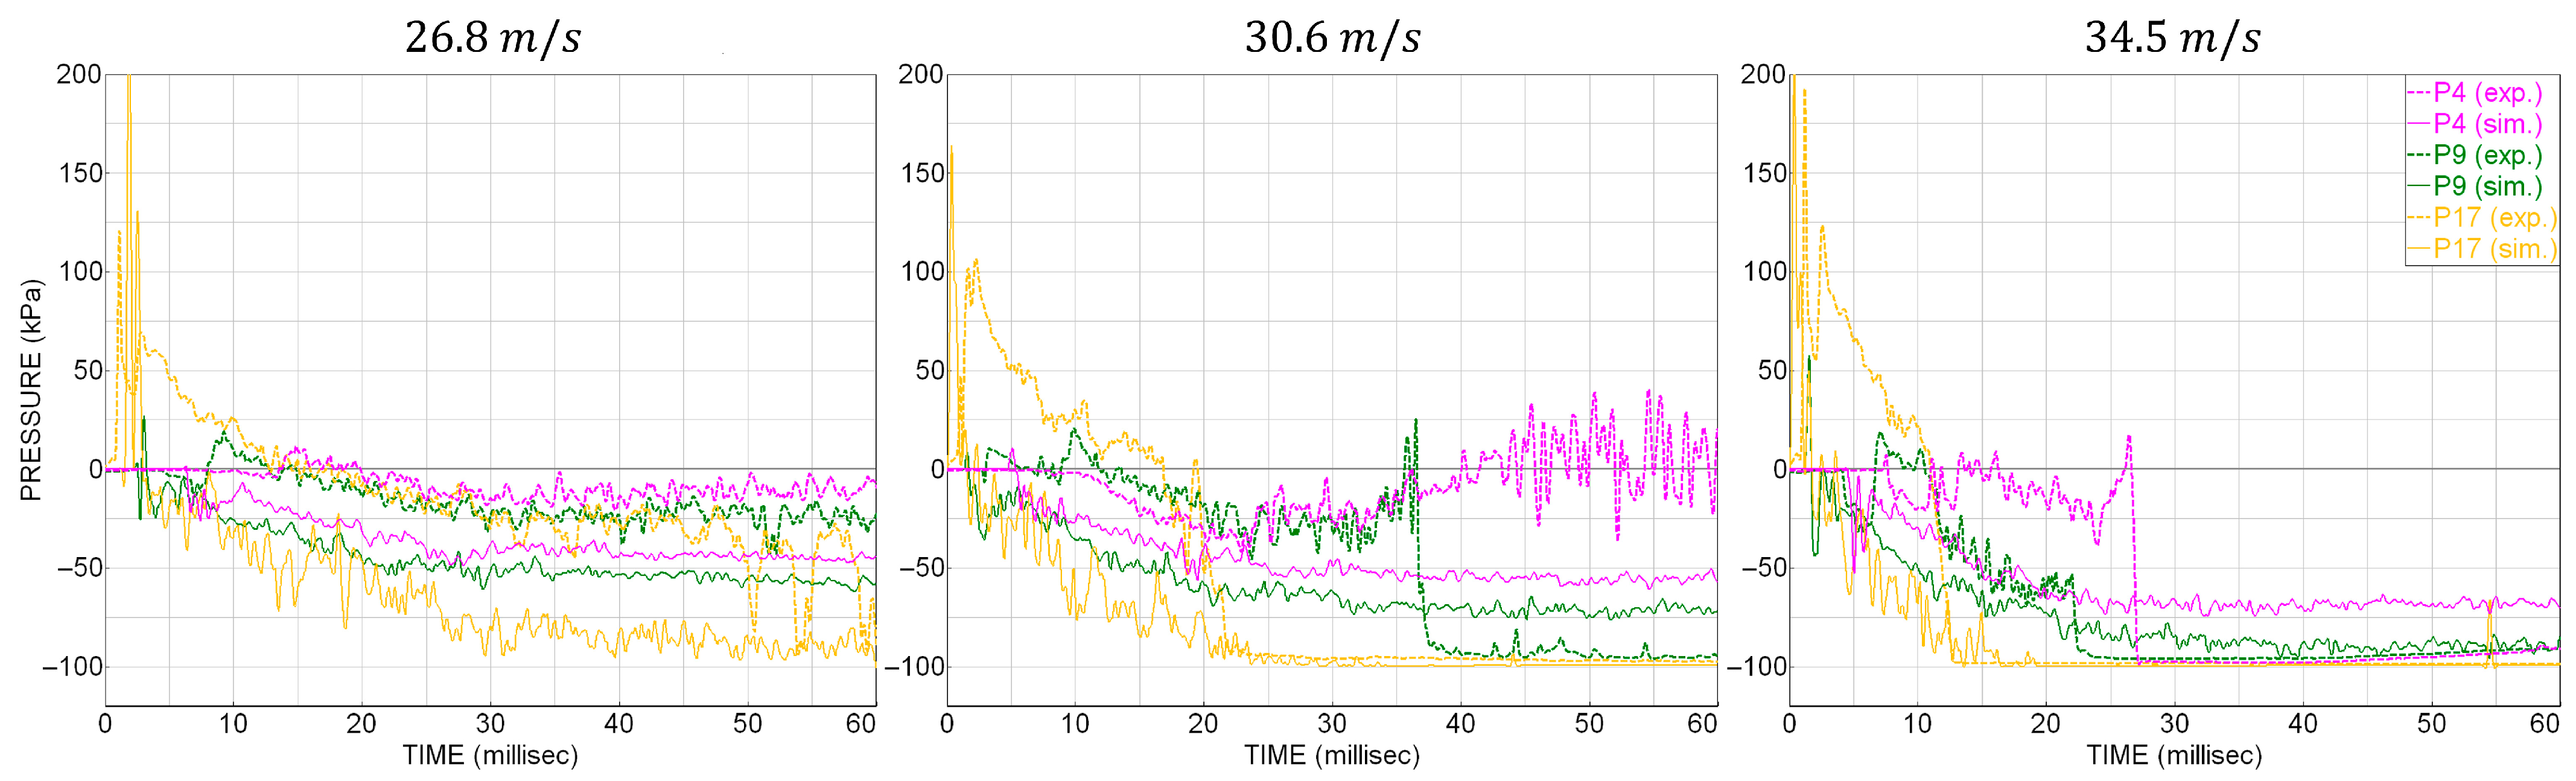
Figure 2 compares the pressure time series of the experimental data with the simulation results. At 26.8 m/s all curves remain above the cavitation pressure, although P17 is close to cavitation after 50 ms. At the same time, the test data show some local pressure drops. For 30.6 m/s the numerical model can well capture the moment of pressure drop to the cavitation pressure at the position of P17. This is also observed with 34.5 m/s. With this velocity, the test and simulation curves also show a good agreement for P9. In regions with higher dynamic pressure the simulations underestimate the pressure. The wall clock time for the simulations was in the range between 2 h and 22 min and 2 h and 30 min using 128 cores.
Figure 2.
Gauge pressure time history calculated (sim.) and measured (exp.) at the probes P4, P9, and P17. Impact velocities from left to right: 26.8 m/s, 30.6 m/s, and 34.5 m/s. Filter: CFC 1000.
3.2. Investigation with Scaled Aircraft Models
In the technical note TN 2929, the behavior of nine fuselage shapes is investigated in sub-scale aircraft ditching with four landing velocities increasing from 9.14 m/s to 18.29 m/s by 3.05 m/s. The model is a high-wing aircraft with a T-tail. The fuselage length is 1.22 m for all the tests, and the length-to-diameter ratio (fineness) is 6 or 9. The mass is 5.67 kg and the initial attitude is 10°.
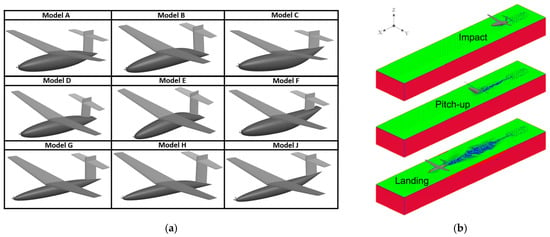
Using a parametric and scalable approach, equivalent numerical models were generated by defining the surface geometry (profiles, sections, and segments) in CPACS datasets and by using PANDORA to create each model and define the impact conditions. Since the stabilizers were designed to be detached from the model at the moment of the impact, in the simulation the interaction between the T-tail and the water was deactivated. For this test case the smoothing length around the sub-scale aircraft was 50 mm, and the global smoothing length was 100 mm. In addition, similar to the approach proposed in [2], an initial sink rate was considered in the simulations. In this work, the sink rate is equal to 0.274 m/s. In addition to a constant acting gravity force, a linearly decreasing upward force was included to simulate lift forces. The total simulation time is 1000 ms. Figure 3a shows the nine scaled FE models. The top and bottom rows show the models with circular cross-section and fineness ratios of 6 and 9, respectively. Models with swept-down and swept-up aft fuselages are presented in the mid and right columns. The models with the flattened rear cross-sections are depicted in the mid row.
Figure 3.
(a) Scaled FE models; (b) FPM-FE ditching simulation of model A with 12.19 m/s. Contours of the FPM point type: walls in red, free surface points in green, and internal points in blue.
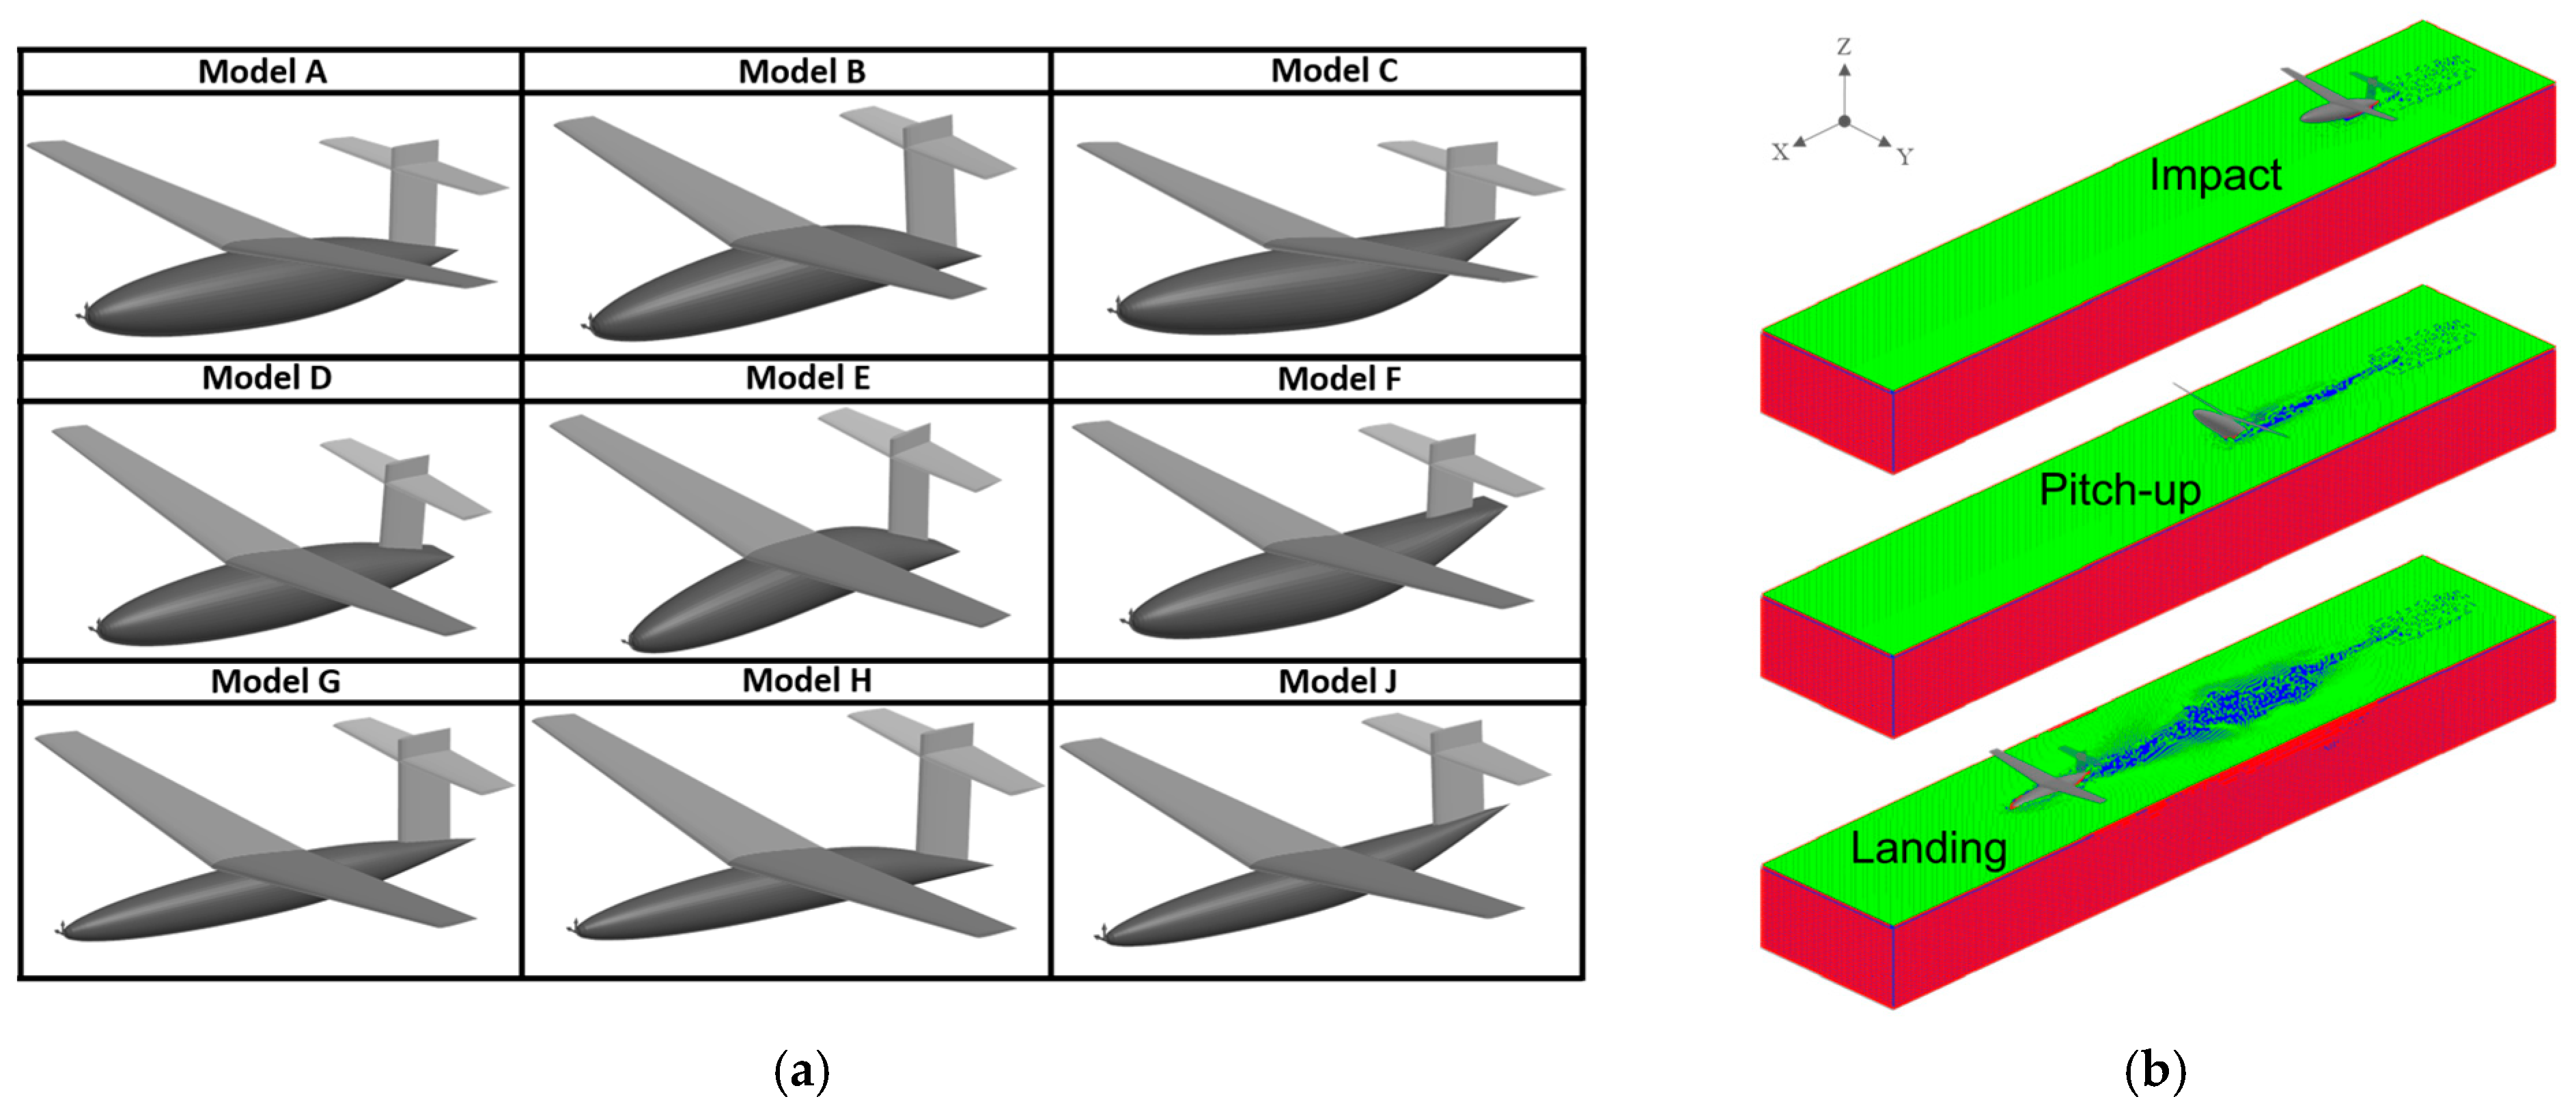
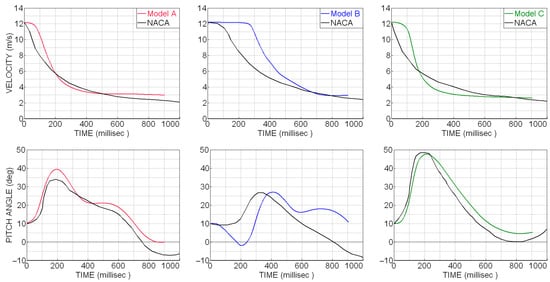
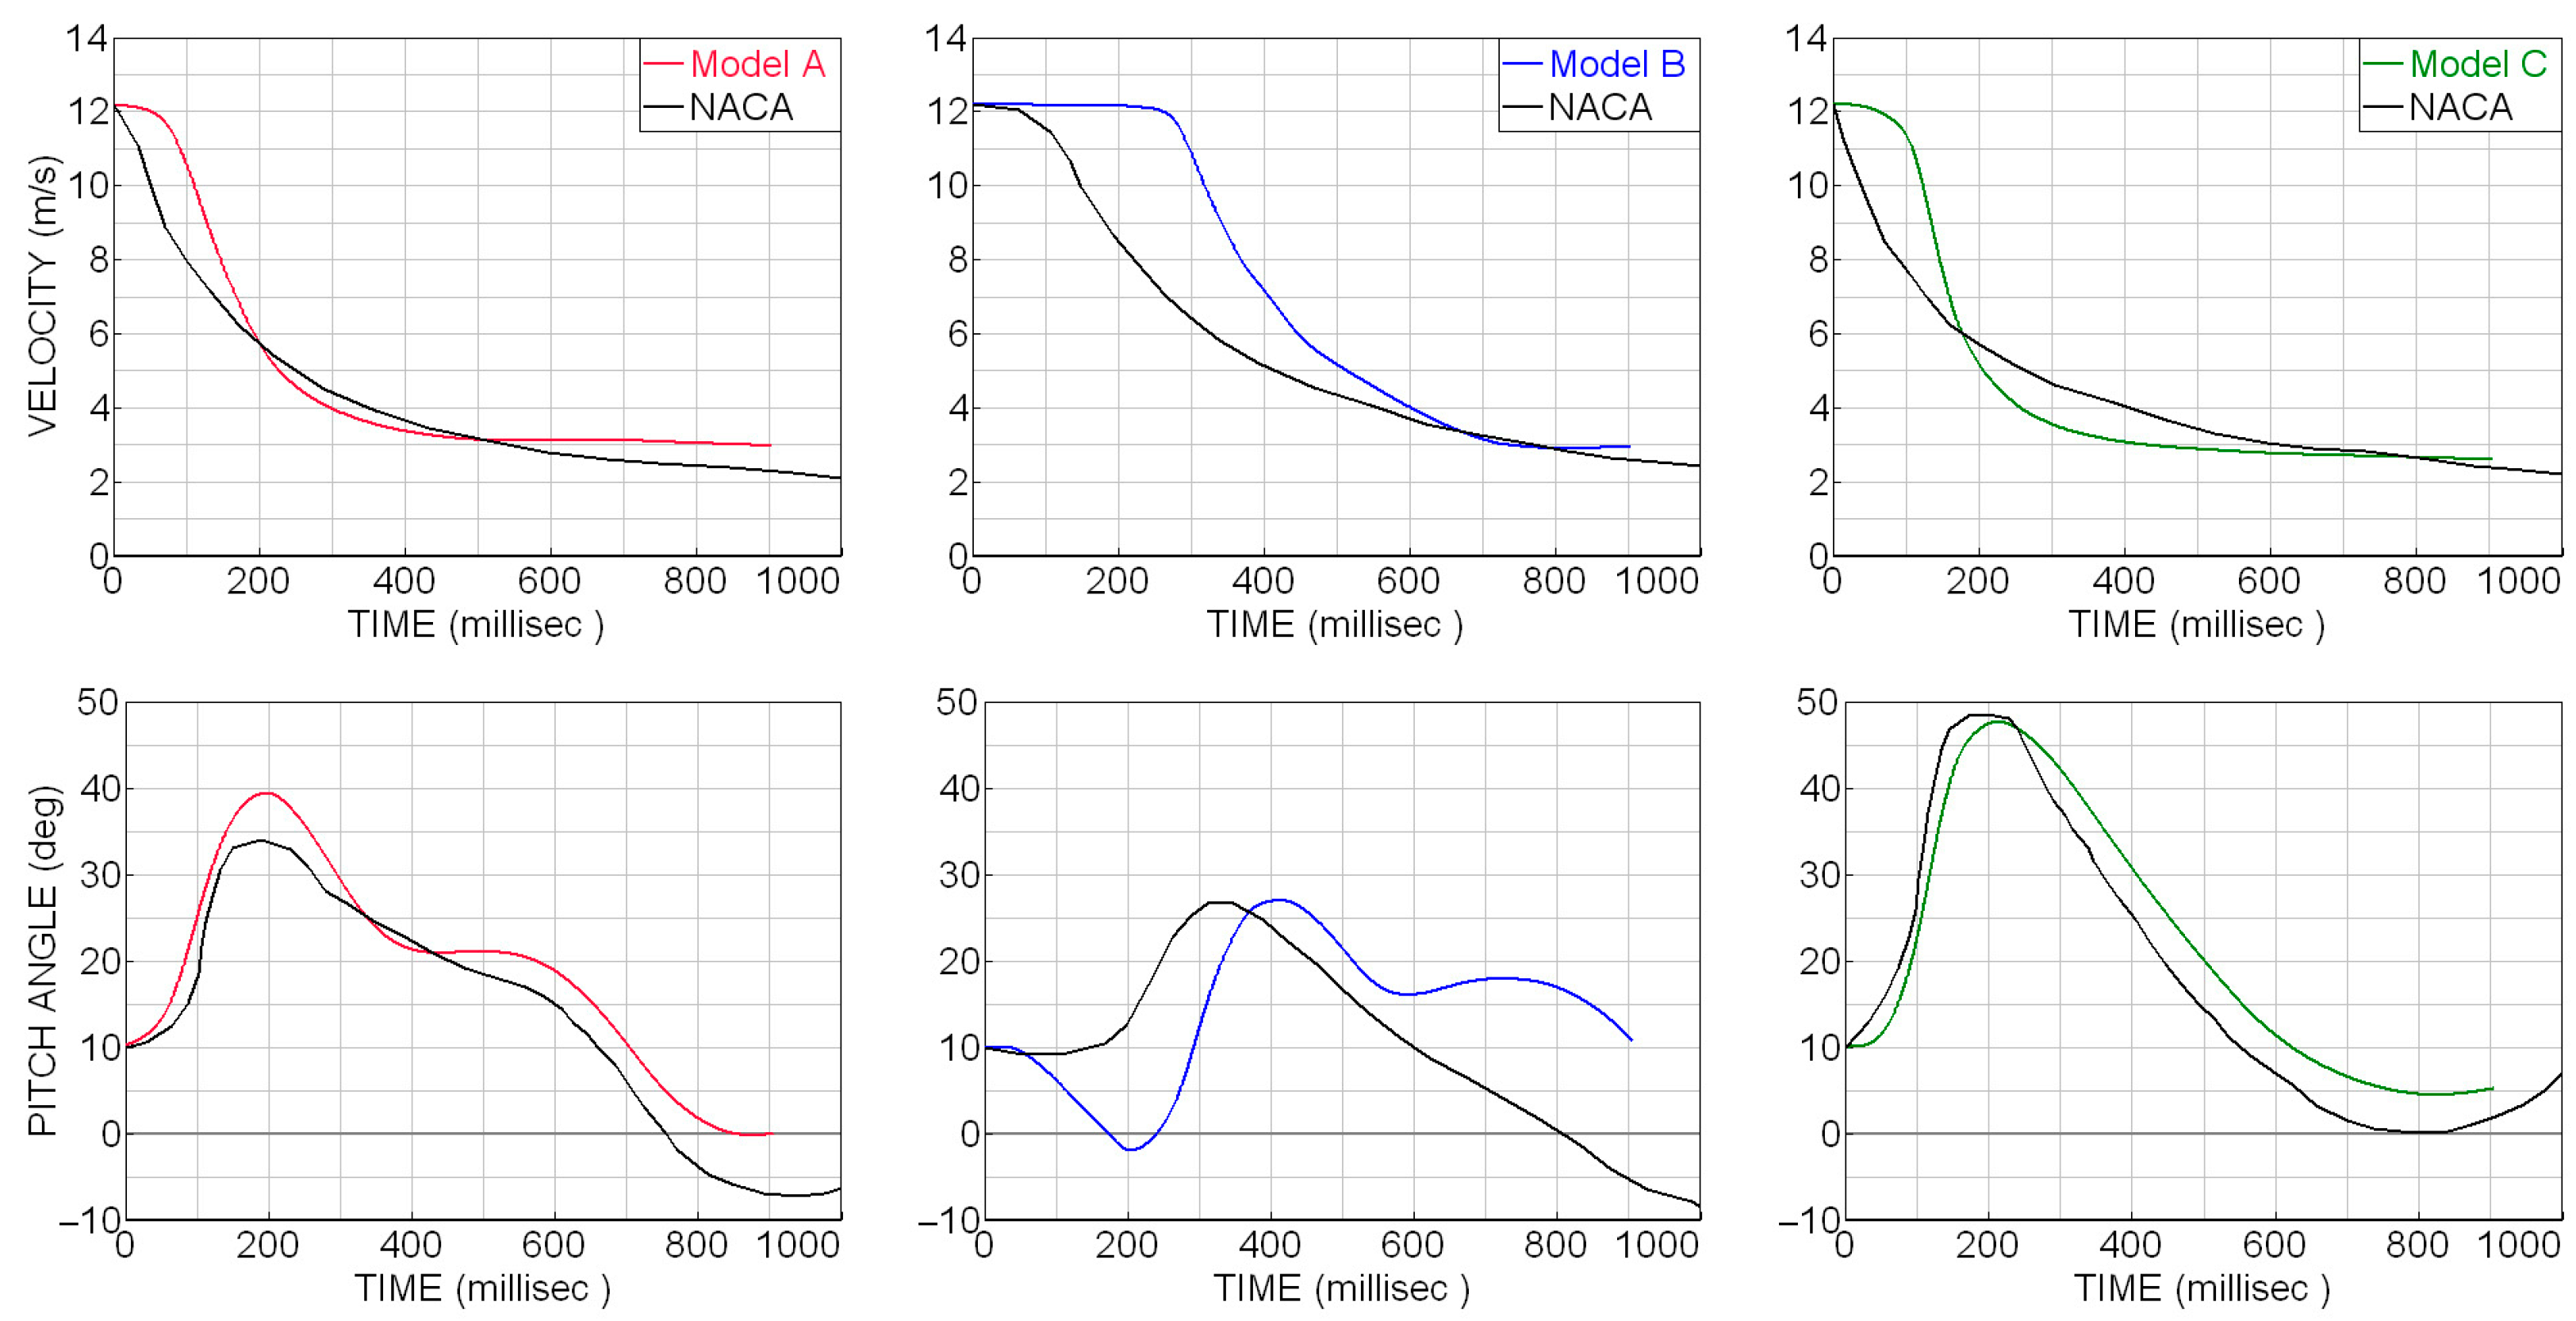
Figure 3b presents a sequence of the simulation with the basic configuration (model A) impacting the water at 12.19 m/s. With this configuration, the first contact with the water occurs at the rear bottom area between 70% and 80% of the fuselage length. After the impact, a pronounced increase in the attitude is observed until the model begins to slide. The wall clock time for this simulation was 38 min using 64 cores. The evolution of the forward velocity and of the pitch angle over time for the models with circular cross-section and fineness ratio 6 is presented in Figure 4. The simulation curves were shifted by 95 ms to skip the free flight approach phase before the impact.
Figure 4.
Results from the ditching simulations with models A, B, and C with 12.19 m/s and corresponding digitalized test data (in black).
Between 100 ms and 200 ms, the numerical model A experiences a slightly higher deceleration in combination with a prolonged increase in the attitude. At 200 ms, the attitude of the numerical model is at its highest and around 6° higher than the test data. Then, during the next 300 ms, the numerical model decelerates slightly faster, and a nose-down pitch is observed. After this instant, the attitude variation is similar to the test data, and the forward velocity remains at around 3 m/s, while in the test a continuous decrease in the velocity up to 2 m/s and a negative attitude were observed.
Due to the swept-down rear fuselage shape, the model B was shifted in the vertical direction by 80 mm to simulate the impact at a similar time as with the basic configuration. The first contact is observed on the trailing edge of the fuselage, causing no immediate decrease in the velocity but inducing a nose-down rotation until the front fuselage impacts the free surface, followed by a pitch-up rotation and the subsequent immersion of the rear fuselage into the water starting at 400 ms. Instants later the attitude of the numerical model is 5° higher than the test data, but during the next 150 ms, the attitude evolves in a similar way. After 600 ms, even though an evident difference in the attitude is observed, the velocity is similar between the numerical model and the test specimen until the end of the simulation.
The model C with the swept-up rear fuselage shape shows a similar behavior compared to the basic configuration but with generally higher attitudes. A good agreement is observed between the numerical results and the test data, especially for the shape of the curve of the attitude time series. The convex shape induces a higher pitch-up rotation reaching almost a 50° angle at 200 ms. From this point on, the attitude of the numerical model is around 5° higher compared to the test data until the end of the simulation. The velocity time series shows a higher deceleration of the numerical model between 100 and 300 ms. Then, the velocity of the numerical model remains almost constant at 3 m/s until the end of the simulation. A similar velocity could be observed for the test specimen between 600 ms and 900 ms.
In general, the kinematic behavior of models A and C is comparable with the test data. The shapes of the curves are similar, and the numerical model reaches its highest attitude at almost the same instant as the test specimen. After the pitch-up, the attitude of the numerical model is moderately overestimated for both shapes. For model B, larger differences could be observed between the simulation and the test, mostly following the different behavior in the first moments after the impact. Nevertheless, a good agreement can be observed between the numerical model and the test specimen for the maximum attitude and for the final velocity.
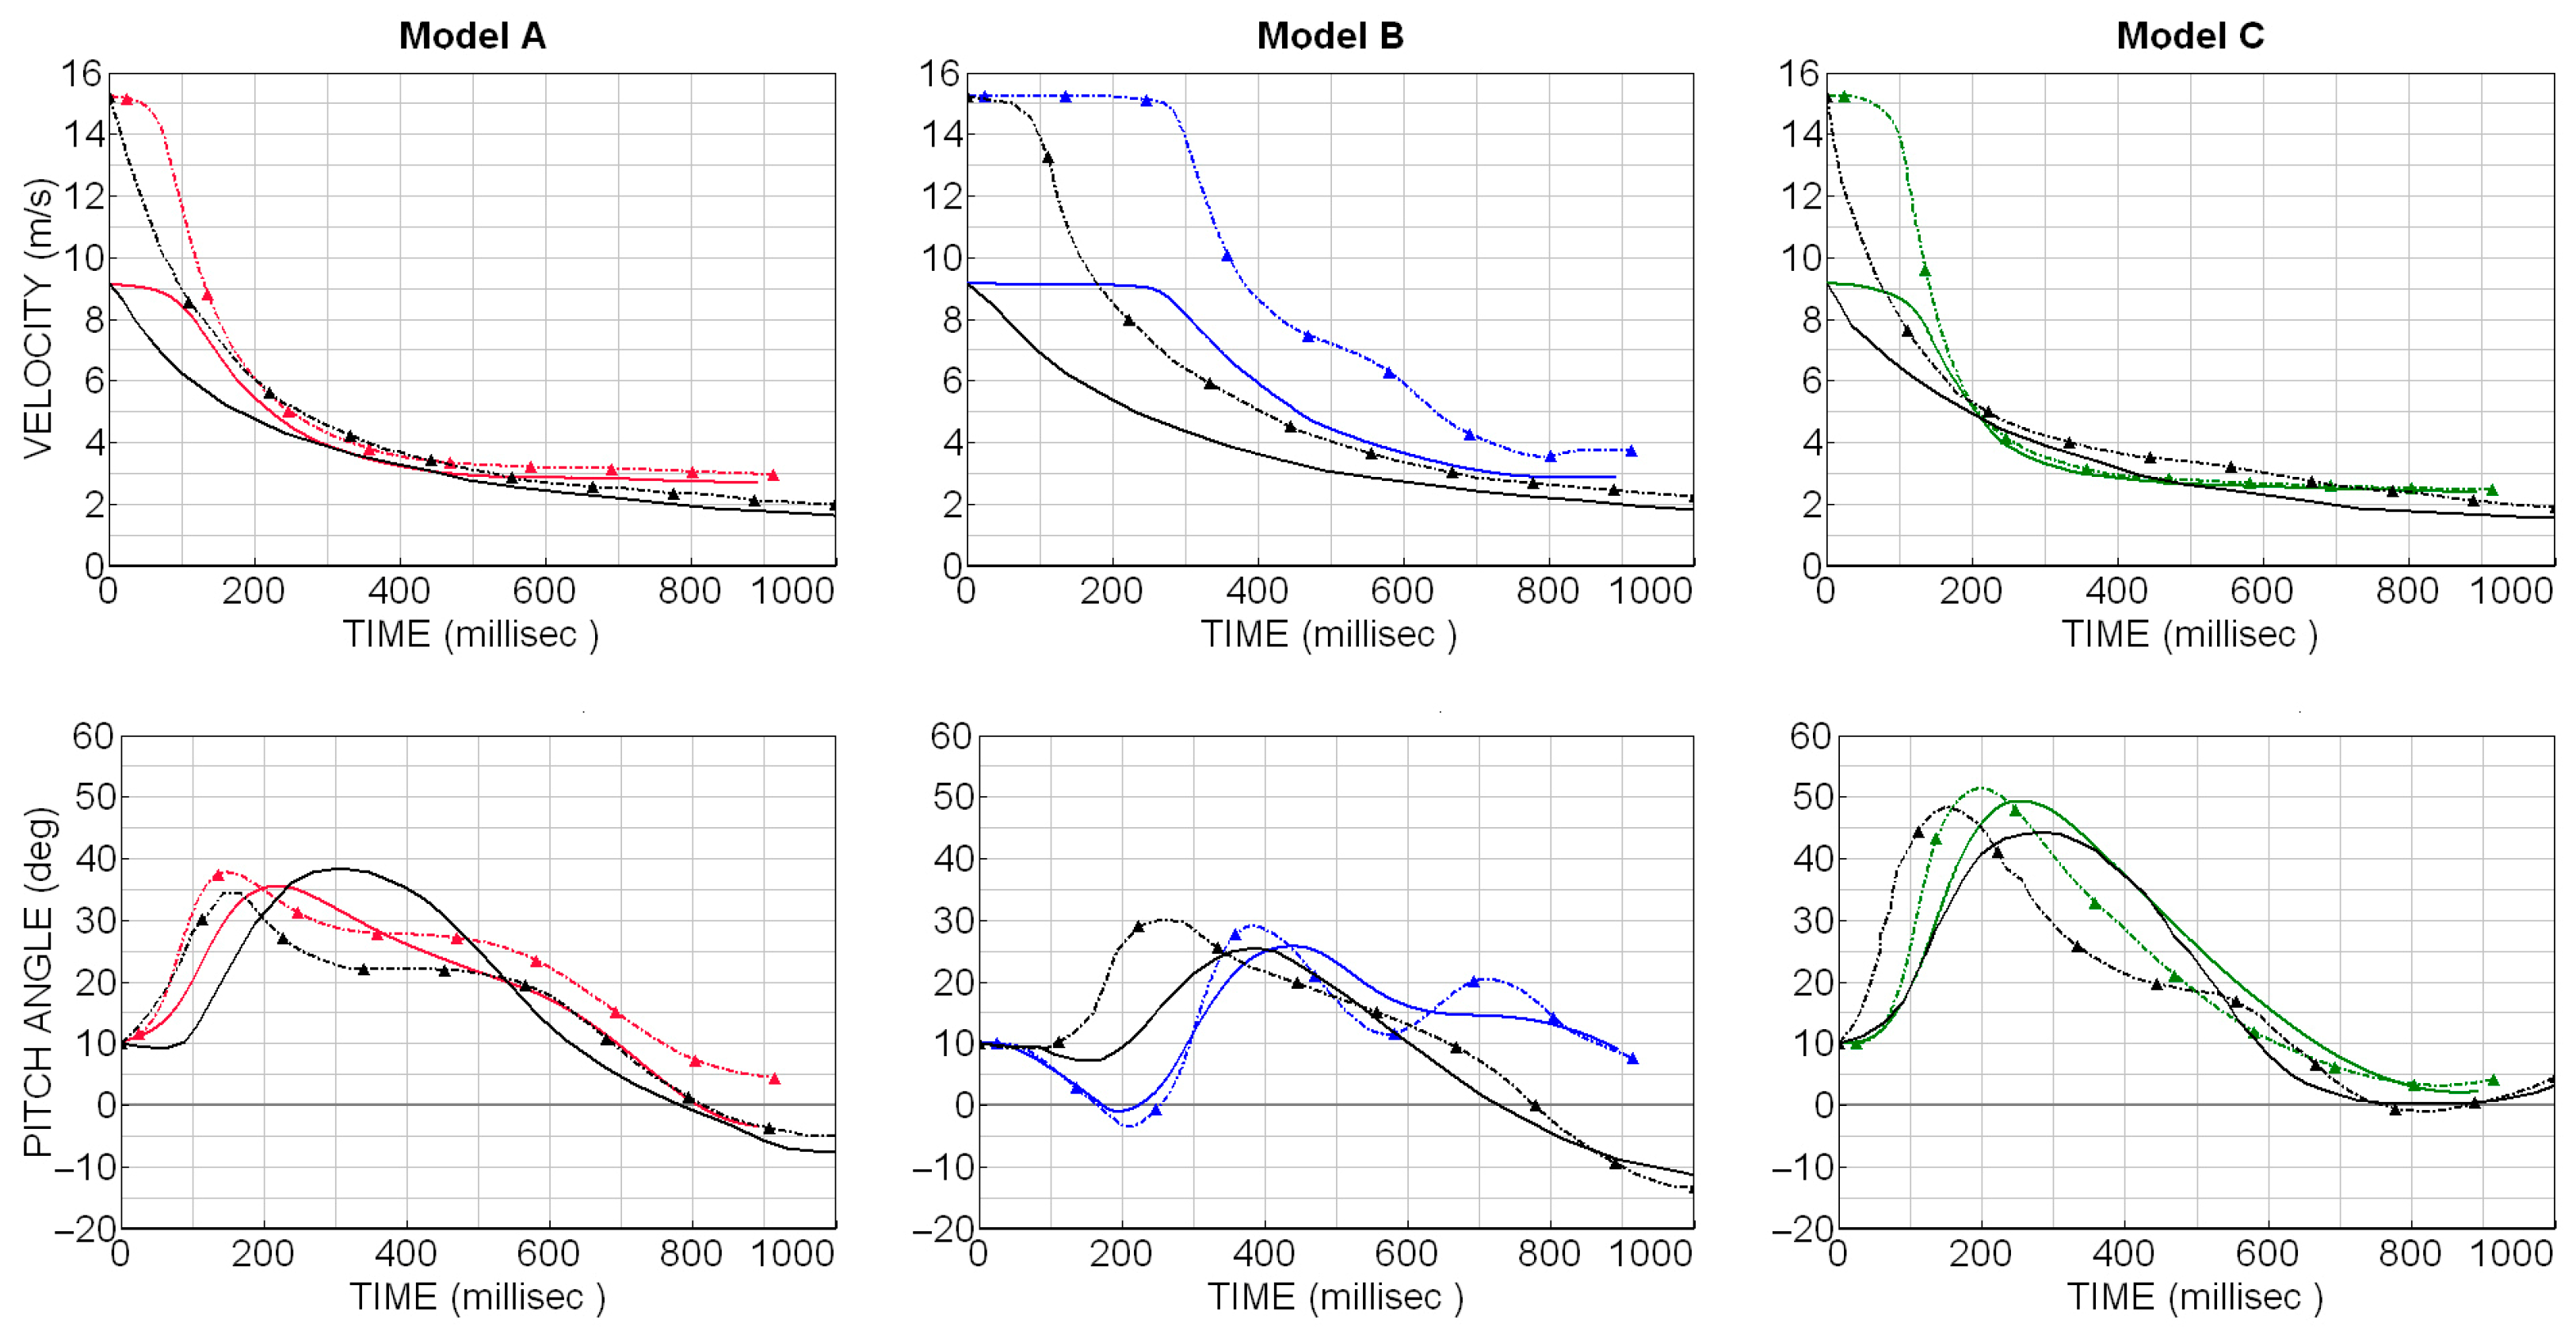
Figure 5 compares the results of the three numerical models with the test data for the ditching with the velocities 9.14 m/s (thick lines) and 15.24 m/s (dash-dot lines with triangular markers). For these cases, the simulation curves were shifted respectively by 107 ms and 86 ms to skip the free flight approach phase prior to the impact.
Figure 5.
Velocity and pitch angle time series for the models A (in red), B (in blue), and C (in green) impacting at 9.14 m/s (thick lines) and 15.24 m/s (dashed lines). Digitalized test data in black.
On the one hand, the curves presented in Figure 5 show that the numerical model can reproduce the kinematic behavior of the test specimen in a different range of velocities. On the other hand, delays can be observed especially for model B, raising the question about the reference impact time to be considered for this fuselage shape. Also, with increasing velocities overestimations decrease for the three models.
For the fuselages with a fineness ratio of 9, the shape of the curves is similar but higher deviations are present. Simulations with flattened rear cross-sections partly showed numerical instabilities during the immersion of the aft section. To overcome these instabilities, the FPM time step was reduced, consequently increasing the wall clock time.
In [2] model A was investigated in numerical ditching simulations over 270 ms using ALE or a hybrid SPH approach with the velocity 9.14 m/s. The evolution of the velocity and of the pitch angle over this time is comparable between the FPM and the ALE simulations, taking into account that the ALE calculation showed the closest behavior with respect to the experimental data in comparison with the hybrid SPH calculation. The wall-clock times mentioned in [2] for the ALE and the hybrid SPH simulations are 17 h and 62 h, respectively.
3.3. Investigation of Scalability Effects
Based on the approach to generate scale models and using scaling factors according to Froude’s dynamic similitude law [17] (also mentioned in the Accepted Means of Compliance 25.563 in [1] (pp. 281–282)), full-scale representations of the scale model were generated and simulated with scaled conditions. The scale factor is 1/30 for the length and the pressure, (1/30)3 for the mass, and √ (1/30) for the time and the velocity, similar to the scale investigated in [18]. As reference, the simulation with model A and 12.19 m/s was taken. The resulting impact conditions for the ditching simulation with the full-scale representation were forward velocity 66.77 m/s, sink rate 1.5 m/s (which corresponds to the descent rate for ditching mentioned in [19]), and aircraft mass 153.1 t. The smoothing length was locally 1500 mm and globally 3000 mm. The initial attitude was kept equal to 10°. Since hydrodynamic effects may appear with higher velocities, the parametric study included the limitation of the pressure drop to the relative vapor pressure of −100 kPa.
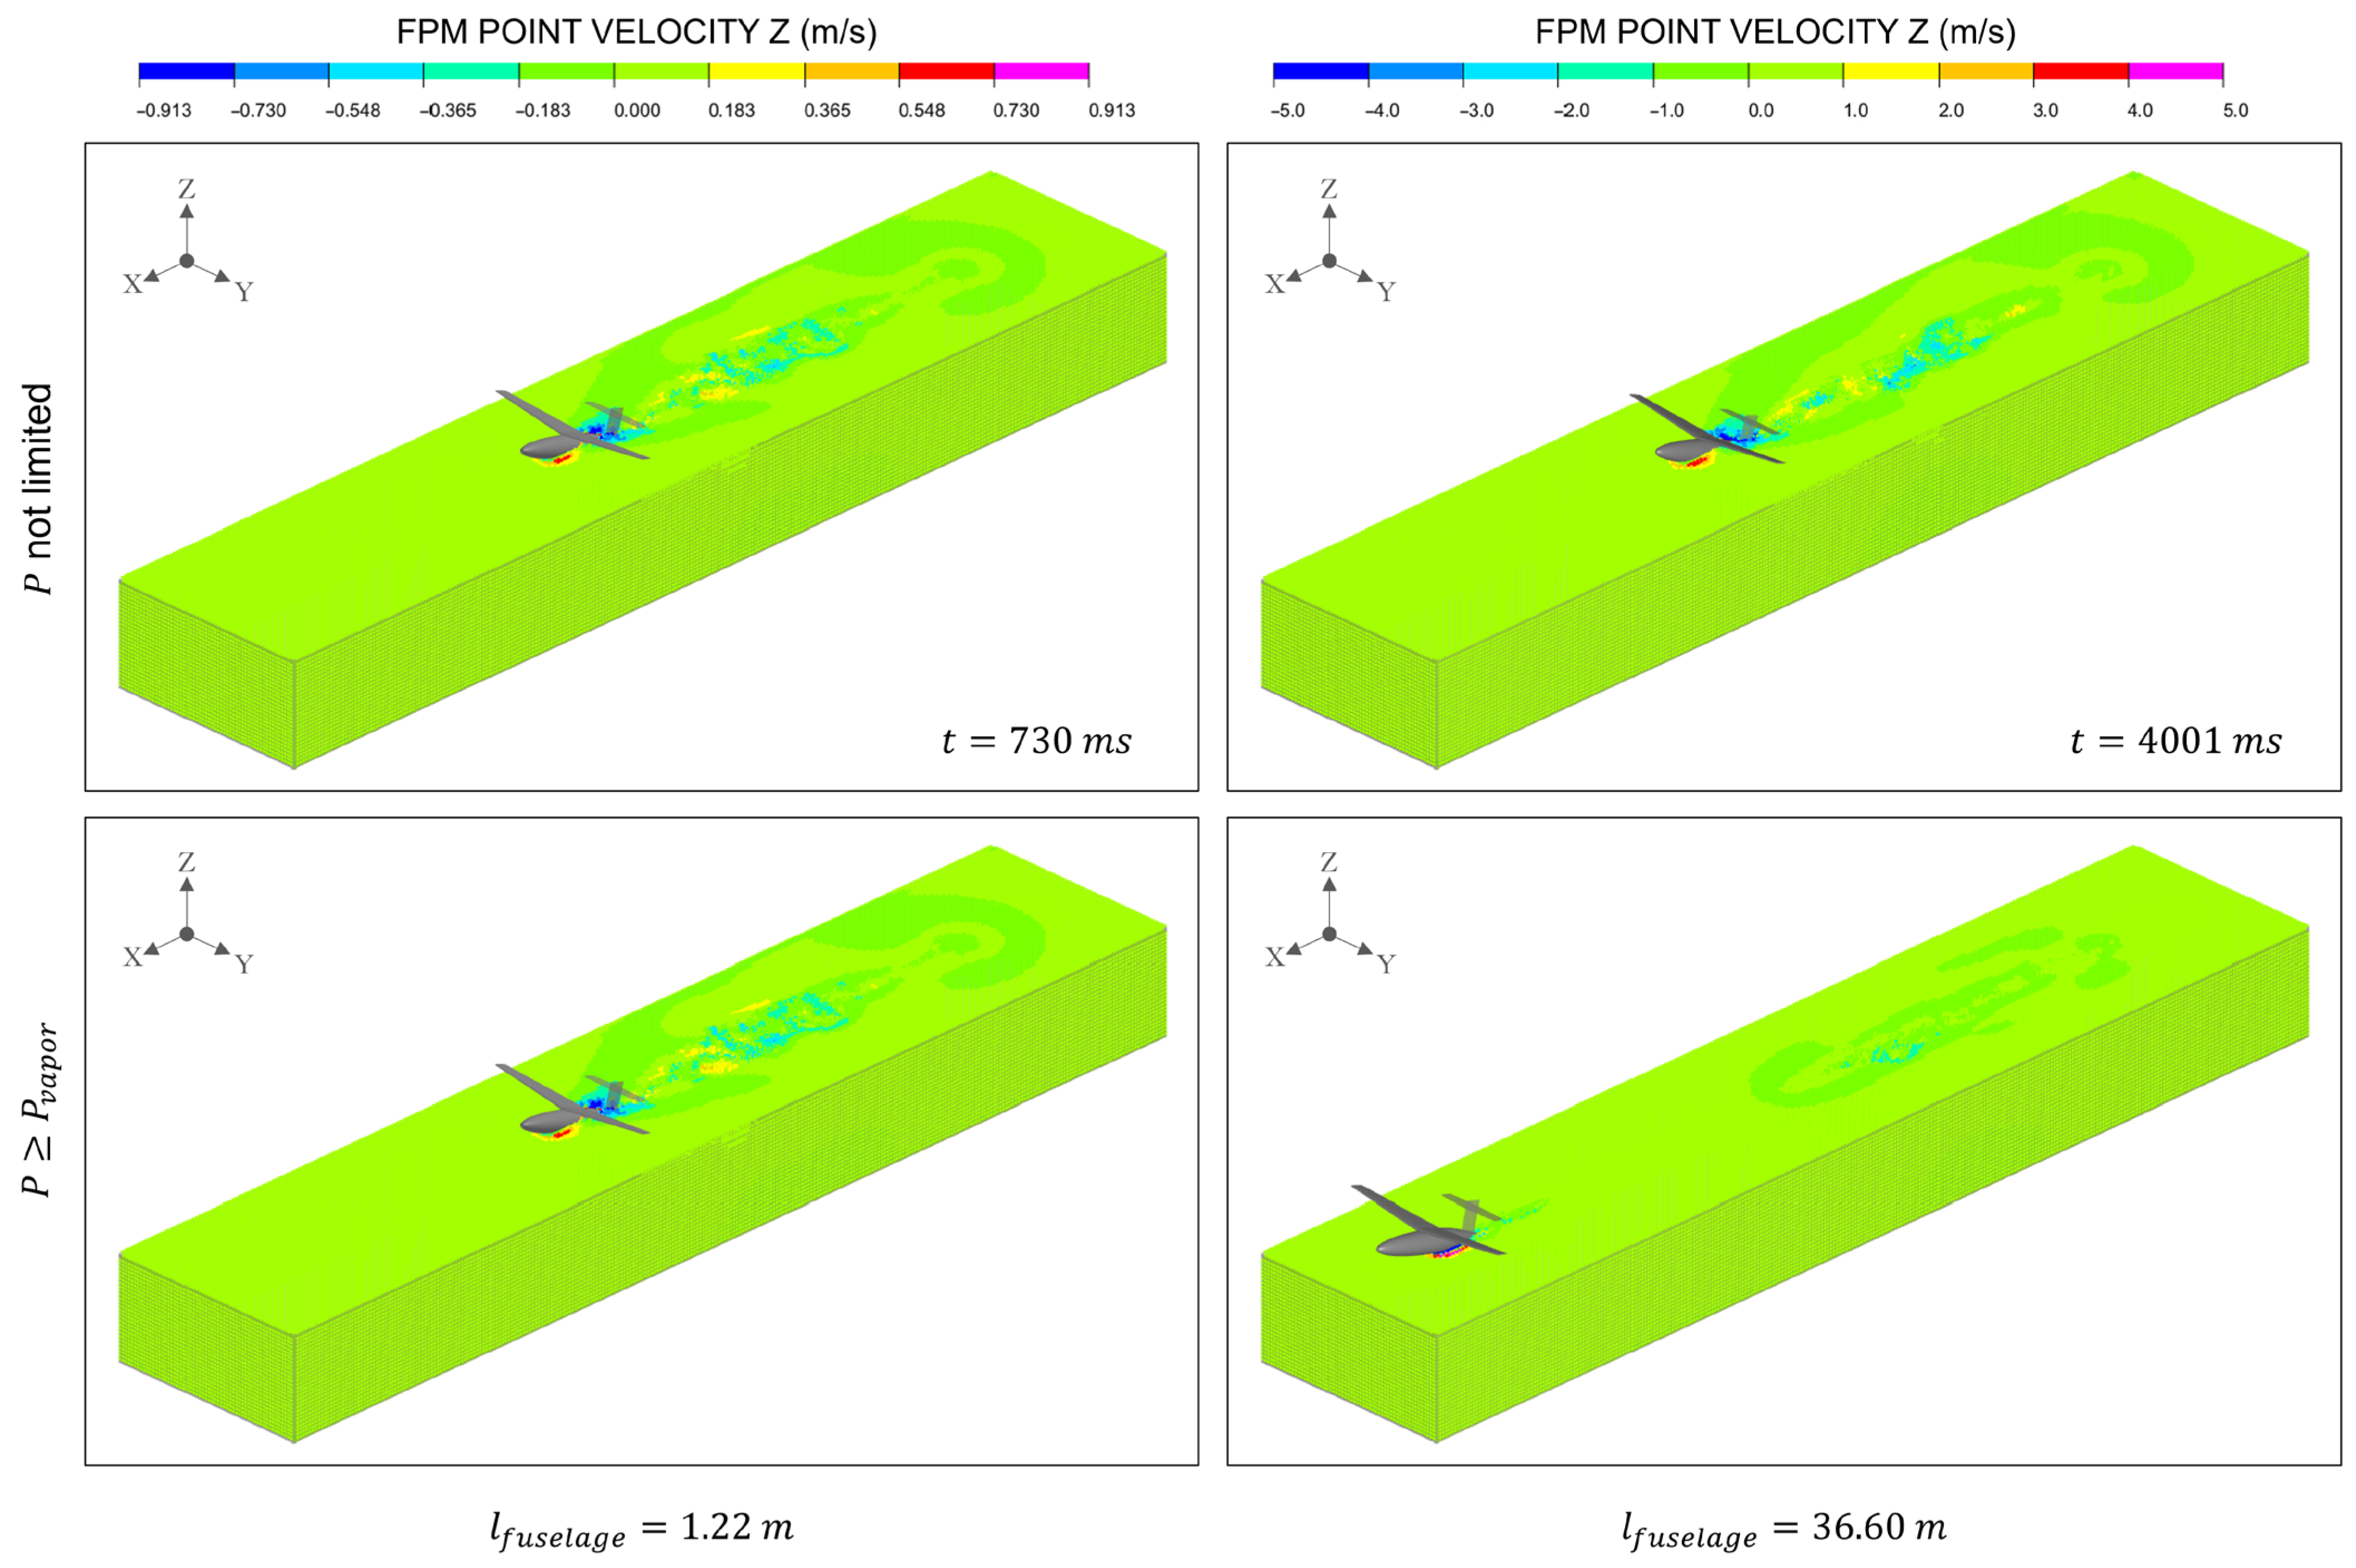
Results are presented with the contour plots of the vertical velocity of the FPM points in Figure 6. The left column shows the ditching with the sub-scale model, the right column the ditching with the full-scale representation. The bottom pictures present the results considering dynamic pressure limitation. The range of the velocity was scaled using the dynamic similitude to have a more realistic comparison between the models. The reference moment for the comparisons is equivalent to the moment after the pitch-up, when the model begins to slide.
Figure 6.
Simulations with model A in two scales (at the same instant). Left: sub-scale, impacts with 12.19 m/s. Right: full-scale, impacts with 66.77 m/s. Bottom: with dynamic pressure limitation.
From Figure 6, certain developments can be observed. First, applying the dynamic similitude law to scale a model, the FPM-FE approach allows conducting simulations with different scales, as can be observed between the two pictures at the top. Second, the scale model behaves in the same way in both simulations. And third, the behavior of the full-scale model at this velocity is considerably different with the pressure limitation. The model skips from the water soon after the impact, followed by a free flight phase until it impacts the water’s free surface for a second time. The pitch-up position of the model before the second impact keeps the model from diving into the water.
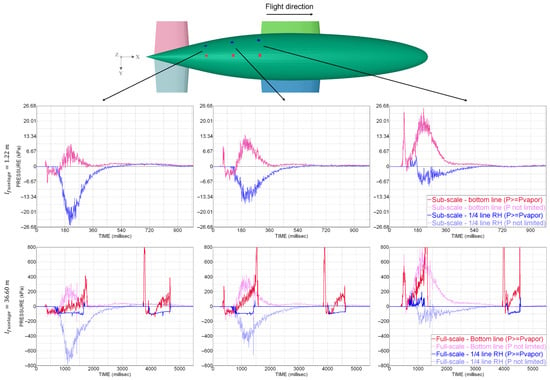
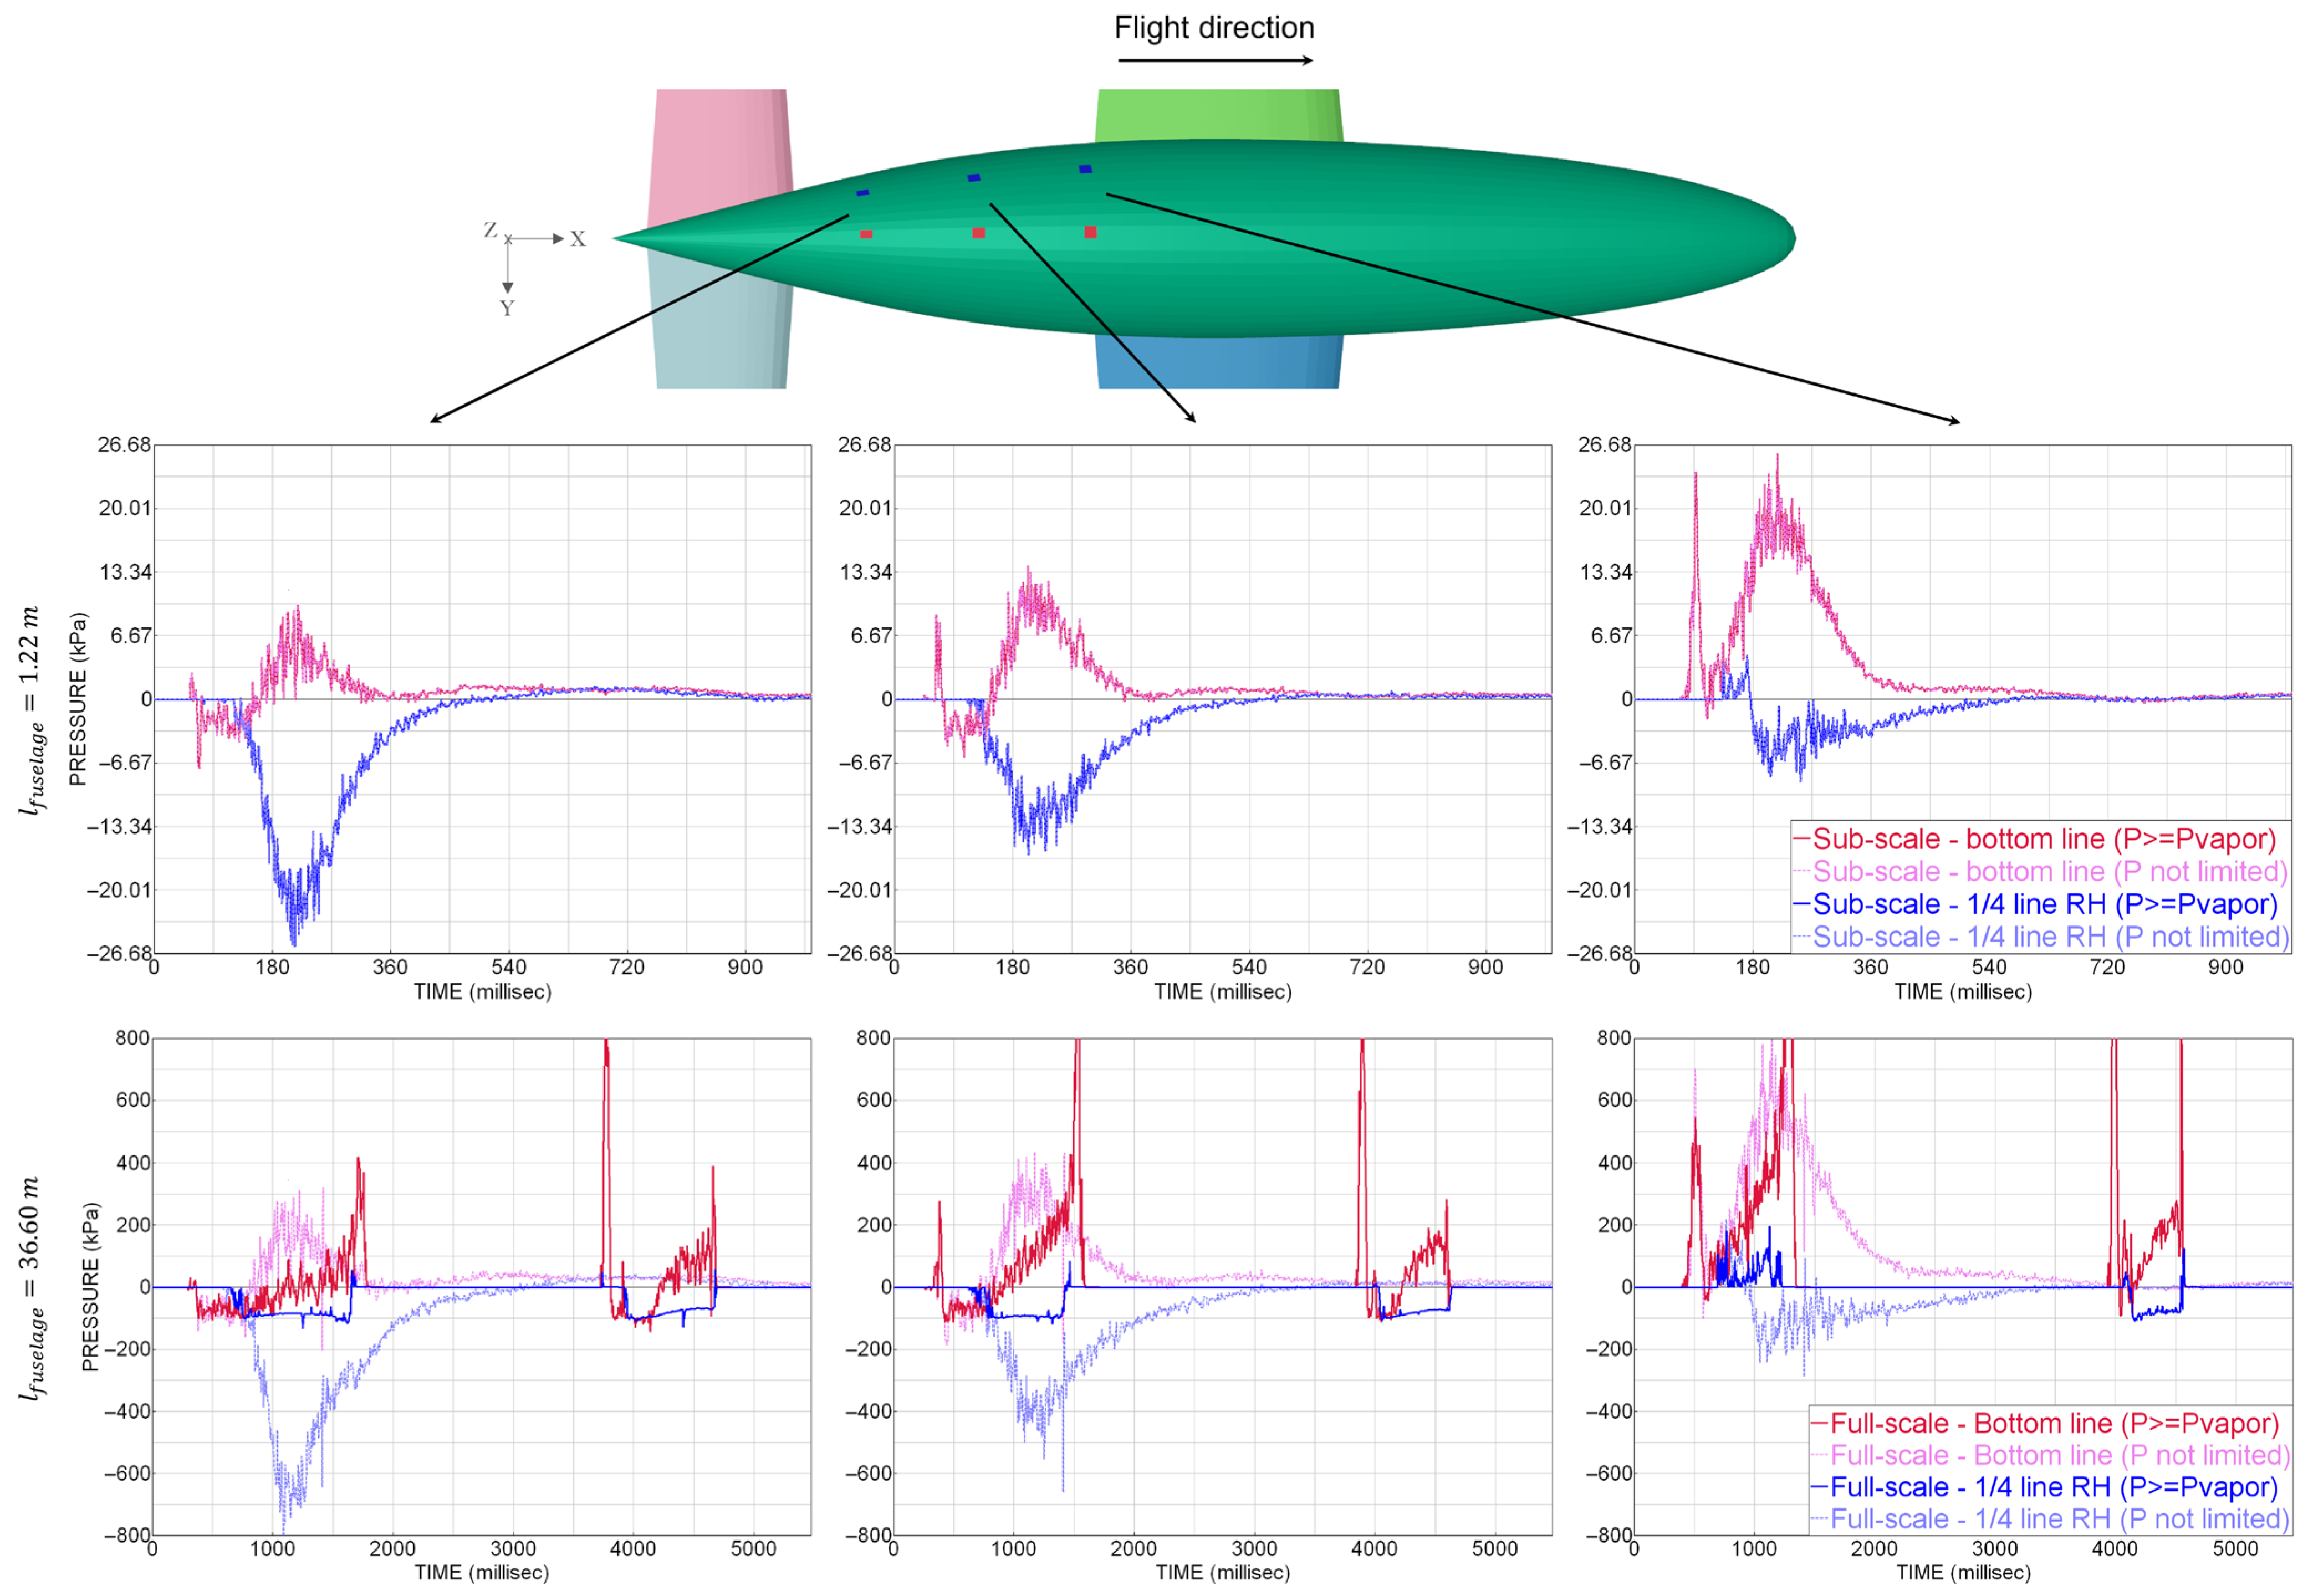
In order to explain the previously mentioned observations, Figure 7 shows the evolution of the gauge pressure at elements located along the fuselage’s bottom line and along the side’s quarter line at 60%, 70%, and 80% of the fuselage length. The curves on the top graphs belong to the sub-scale model. At the bottom, the curves of the full-size representation are presented. The pink and light blue curves are used for the simulations without pressure limitation. The red and blue curves show the results including pressure limitation. The ranges in Figure 7, namely ±26.68 kPa for the sub-scale model and ±800 kPa for the full-size model, are chosen in a way to have a direct comparison between the two scales, following the dynamic similitude for the pressure and for the time.
Figure 7.
Gauge pressure on the rear bottom surface of model A. Top row: sub-scale model with 12.19 m/s. Bottom row: full-size model with 66.77 m/s. Influence of the dynamic pressure limitation.
For the sub-scale model, the pressure remains well above the cavitation pressure level during the whole simulation due to the relatively low impact velocity. Without reaching the cavitation threshold, no differences are observed in the curves with the pressure limitation. This also demonstrates that the activation of the artificial pressure limitation causes no further effect, neither in the pressure and in the related force transfer to the structural elements nor in the displacements and velocities of the FPM points (Figure 6, left).
In contrast, the full-size model reaches the cavitation threshold very soon after the impact. Without the artificial limitation, the aft fuselage is sucked into the water over a longer period of time with unrealistically lower pressures; thus, the full-size model behaves similarly to the sub-scale model. Applying the artificial pressure limitation, the fuselage is sucked with a limited pressure over a smaller period of time of around one second.
Figure 7 also demonstrates that the elements along the bottom-line experience overpressure, showing that the element at 60% of the fuselage length has the highest pressure of around 23 kPa for the sub-scale model and around 700 kPa for the full-size model.
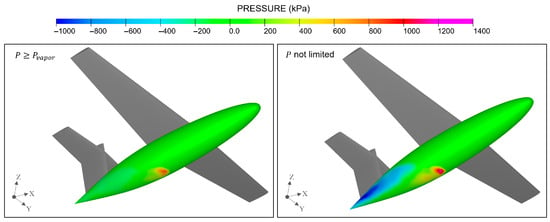
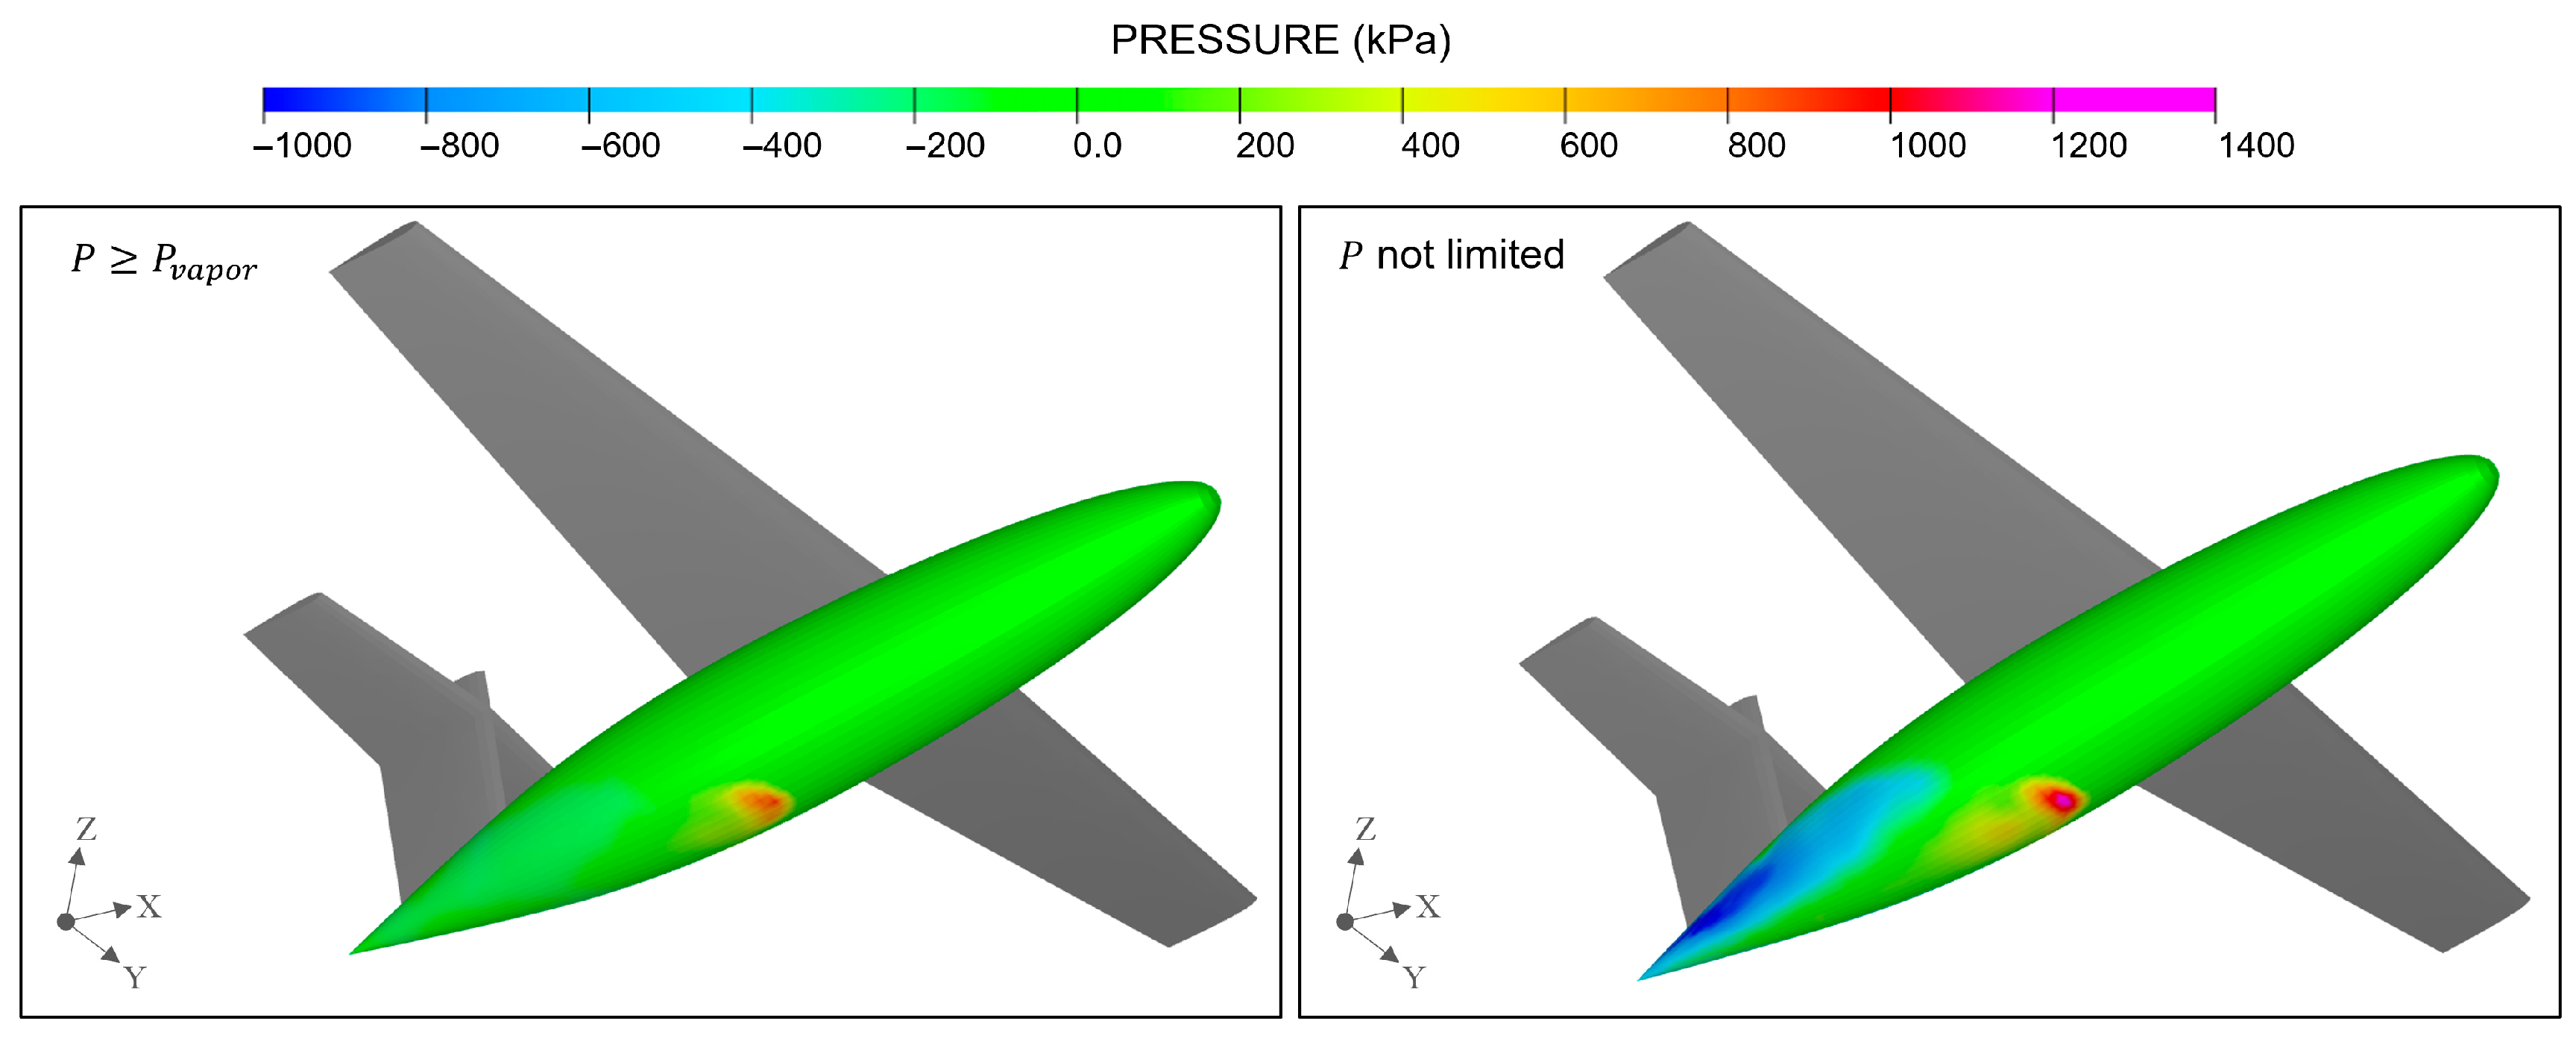
Figure 8 complements the data given by the time series with the contours of the gauge pressure on the fuselage surface of the full-scale model at the moment of the water immersion. The simulation with the artificial pressure limitation is shown on the left. Overpressure is observed at the bottom of the fuselage at around 60% in the longitudinal direction. Nevertheless, the area experiencing negative pressure, observed at the rear fuselage, is significantly wider, also because of the configuration of the model with the T-tail. This has an effect on the kinematics of the model, e.g., contributing to the suction in the case without pressure limitation.
Figure 8.
Gauge pressure on the fuselage of the full-size model at 1000 ms. Left: dynamic pressure limited. Right: without limitation. Perspective view from the right bottom side.
This case evidences the importance of considering methods to adequately extrapolate the ditching behavior from sub-scale specimens to real-size aircraft, especially due to the higher impact velocities and the corresponding likelihood of cavitation.
4. Aircraft Ditching
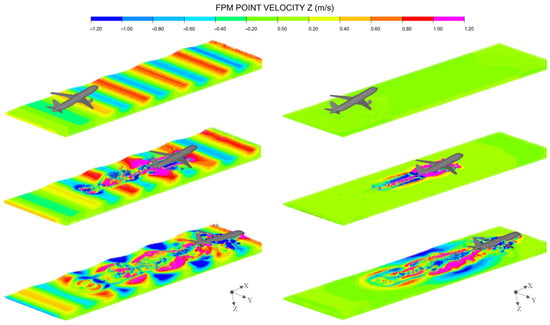
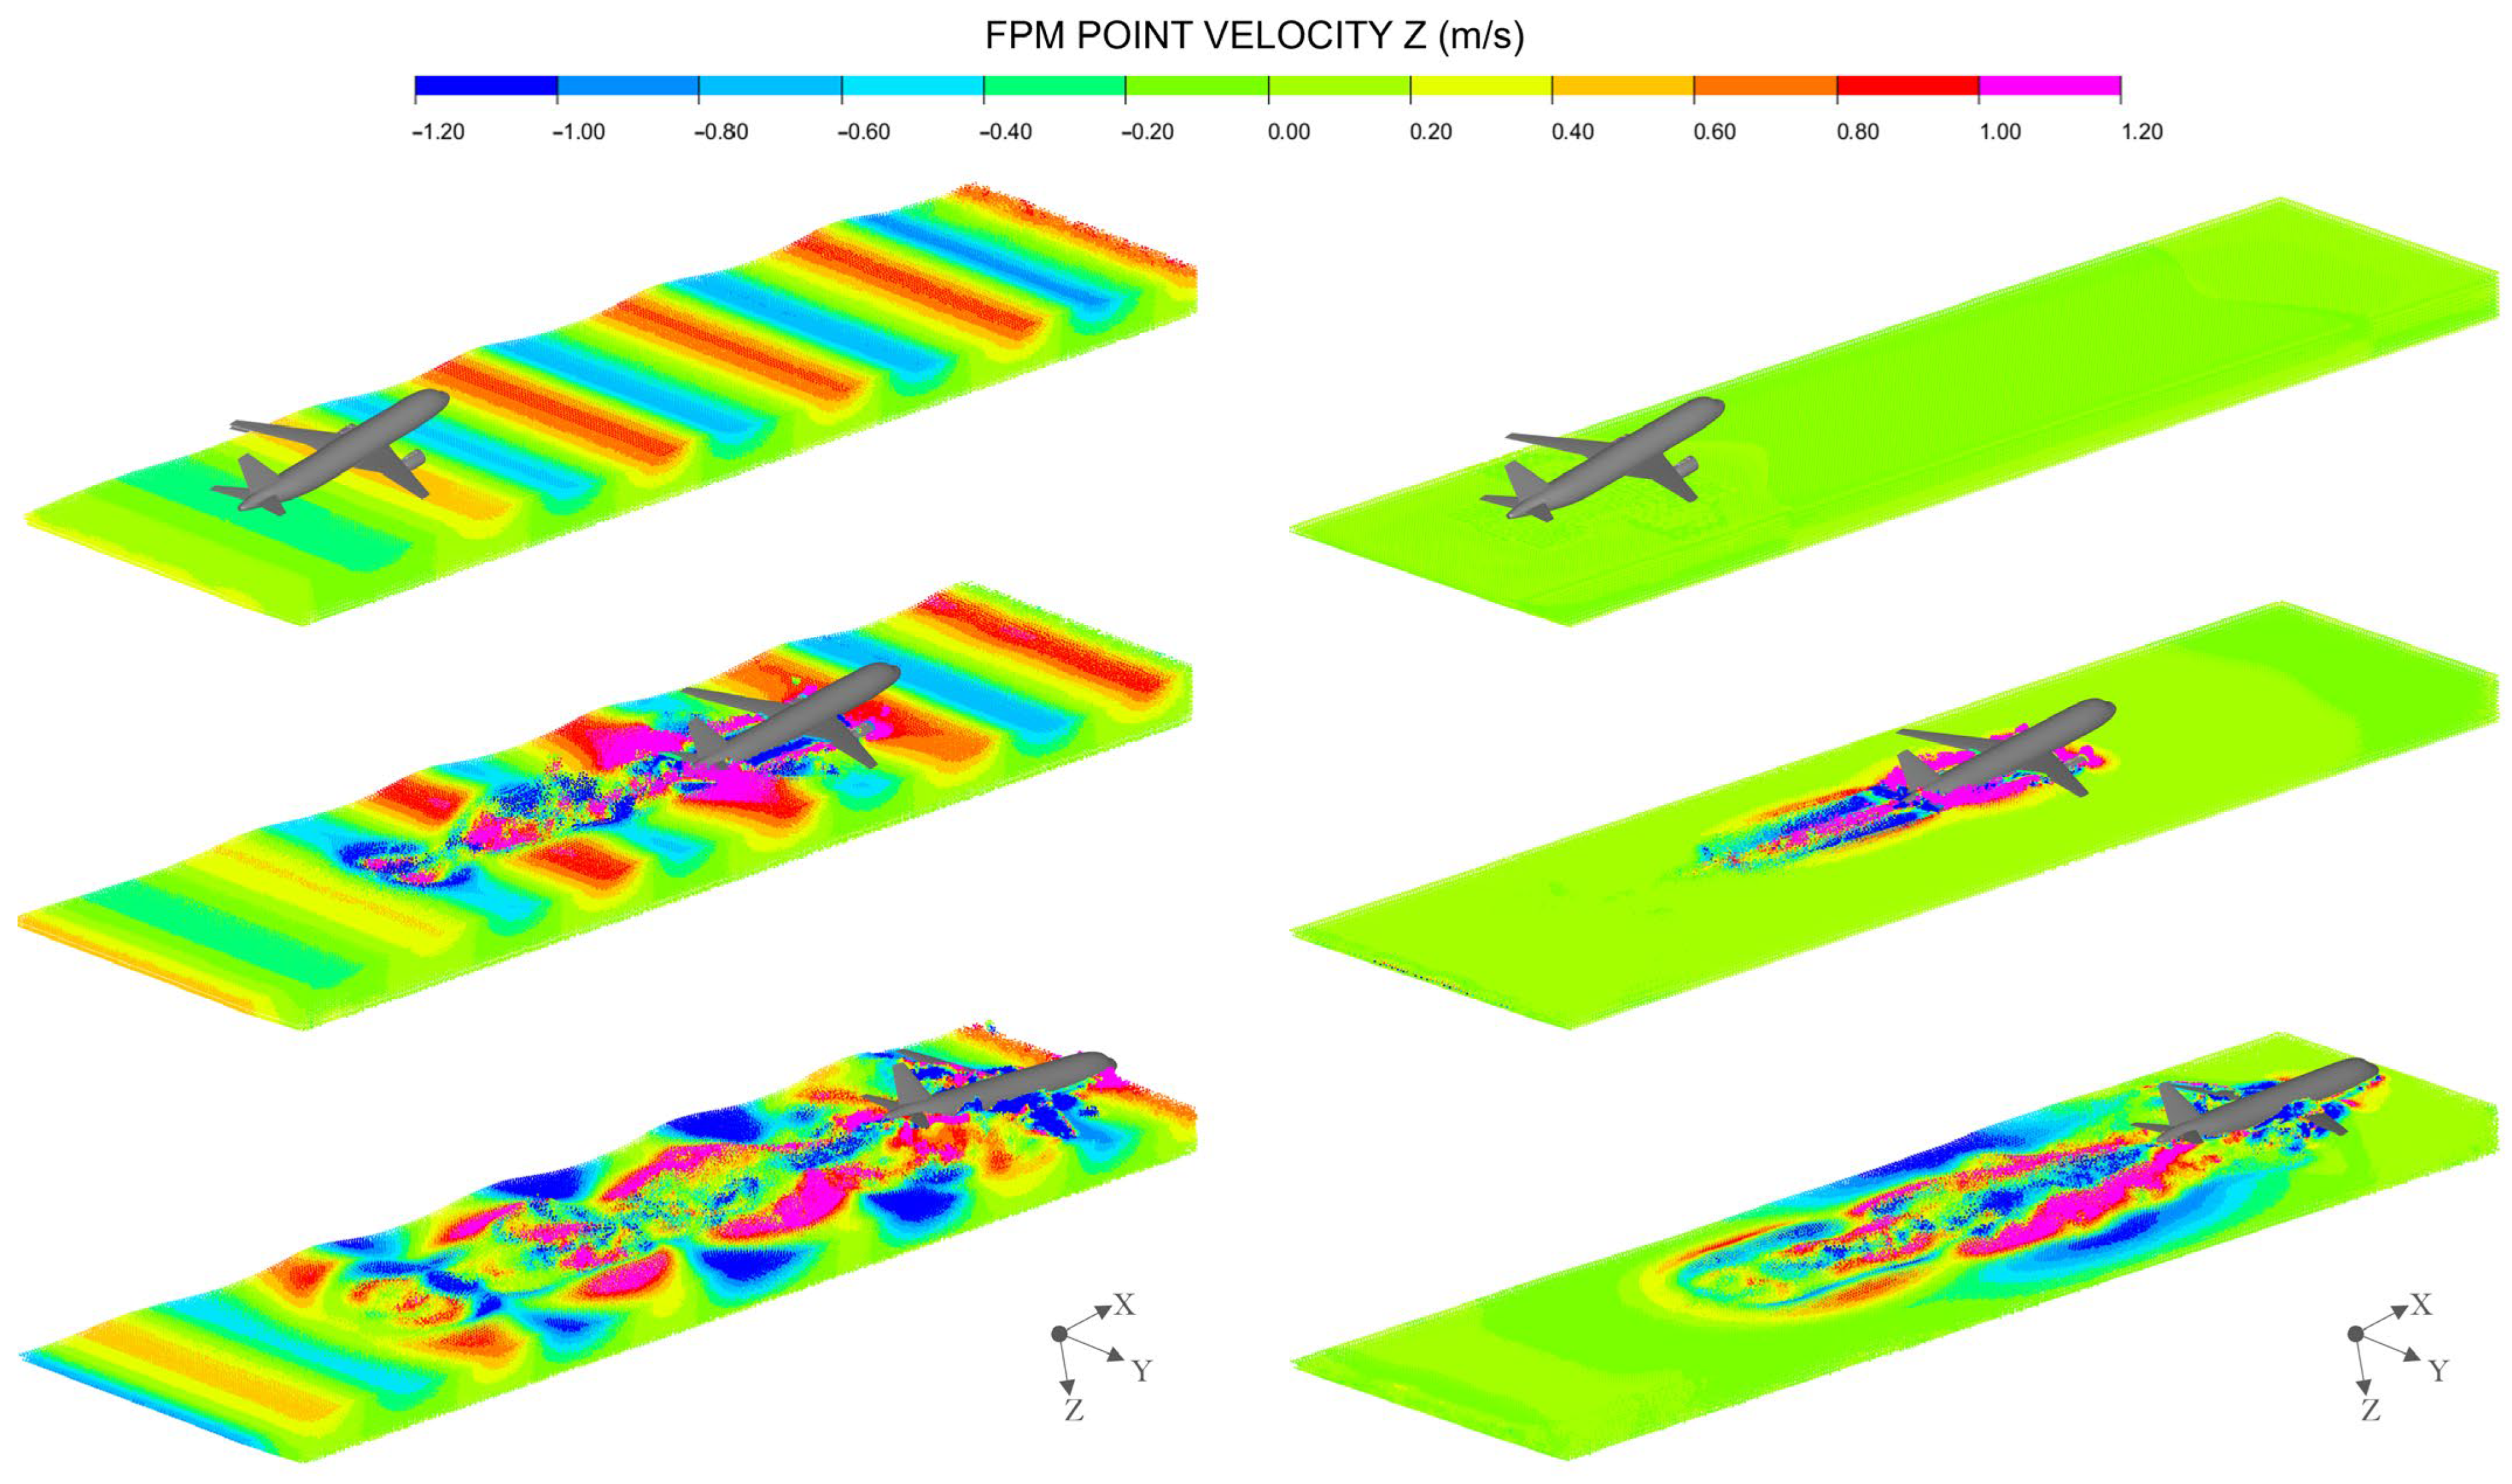
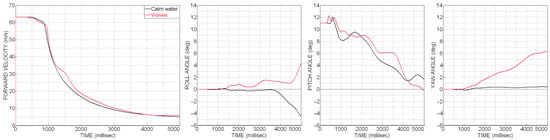
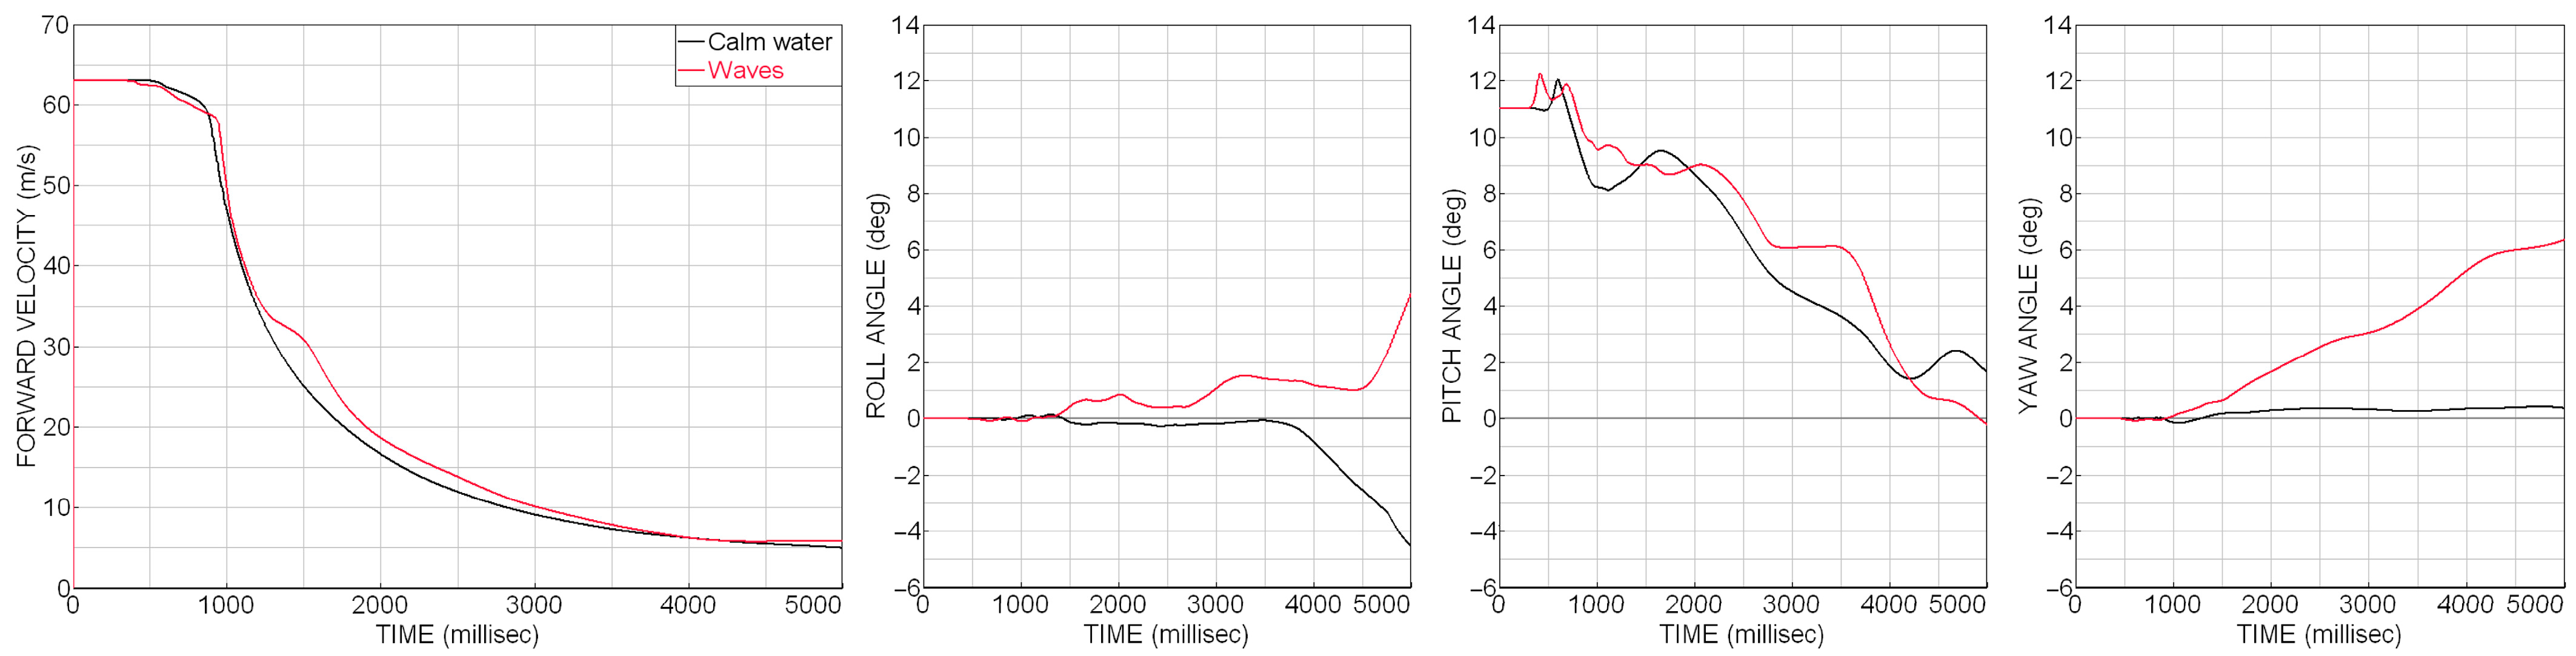
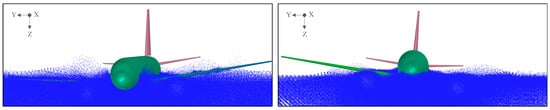
FPM was used in ditching on waves and ditching on calm water using the 36 m long generic aircraft D150. For the ditching on waves, the wave height is 1.2 m, and the wave length is 32 m. The first 30 s of the simulation are used to generate regular sinusoidal waves. After that time, the aircraft model is released for ditching in a simulation over 5 s. This is also the simulation time for the ditching on calm water. The initial conditions are: forward velocity 63 m/s, sink rate 1.5 m/s [1] (pp. 284–285), and pitch angle 11°. Also, the initial height of the aircraft above the free surface is the same in both scenarios, and the engines remain attached to the aircraft during the complete simulation time. The local smoothing length in the impact region is 300 mm, while the global smoothing length is 1500 mm. The aircraft is considered rigid, and the mass is 68 t. The pool length is 170 m. Figure 9 shows the sequence of the ditching on waves at 30 s, 31.5 s, and 34.8 s, and at 0 s, 1.5 s, and 4.8 s for the ditching on calm water. The kinematic behavior of the aircraft is presented with the time series of the forward velocity and of the roll, pitch, and yaw angle in Figure 10. The differences in the final deviations of the roll and yaw angle between the two simulations can be observed in the pictures in Figure 11.
Figure 9.
Aircraft ditching on waves (left) and on calm water (right).
Figure 10.
Aircraft kinematics on the ditching on waves and ditching on calm water.
Figure 11.
Front view of the aircraft at the final instant of the ditching on waves (left) and ditching on calm water (right). FPM points are depicted in blue.
In the ditching on waves, the aircraft impacts on the crest of the wave. Even though the landing was symmetrical, a small rotation about the longitudinal axis could be observed after the aircraft reached the second wave. This led to a wider contact of the right engine with the water resulting in a deviation of the yaw angle in positive direction. At the end of the simulation, the yaw angle of the aircraft reaches 6°. Also, in Figure 11(left), it can be observed that the nose of the aircraft exceeds the rear boundary of the water basin at 34.8 s.
In the ditching on calm water, the aircraft shows a more symmetrical behavior, and the aircraft does not reach the end of the water basin at 4.8 s. Compared to the ditching on waves, the aircraft rotates in the opposite direction about the longitudinal axis, as can be observed in Figure 11(right) and in the time series of the roll angle (Figure 10). The evolution of the pitch angle is comparable with the ditching on waves, but with some deviations, e.g., during the last second, when a slight rotation was observed. Also, in this simulation, the final yaw angle is considerably smaller than after the ditching on waves.
In both scenarios, the aircraft remains in contact with the water during the entire event. However, with the presence of waves, the interactions are different. The aircraft initially interacts with the crest of the wave, resulting in a non-uniform deceleration. Then, when the aircraft is crossing between two waves, the engines are not fully in contact with the water, also due to the attitude of the aircraft. During these short periods of time, e.g., between 1200 ms and 1500 ms, less decelerations are caused by the engines. These interactions may explain the differences in the velocity compared to the ditching on calm water.
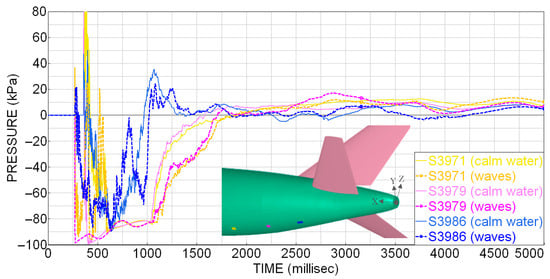
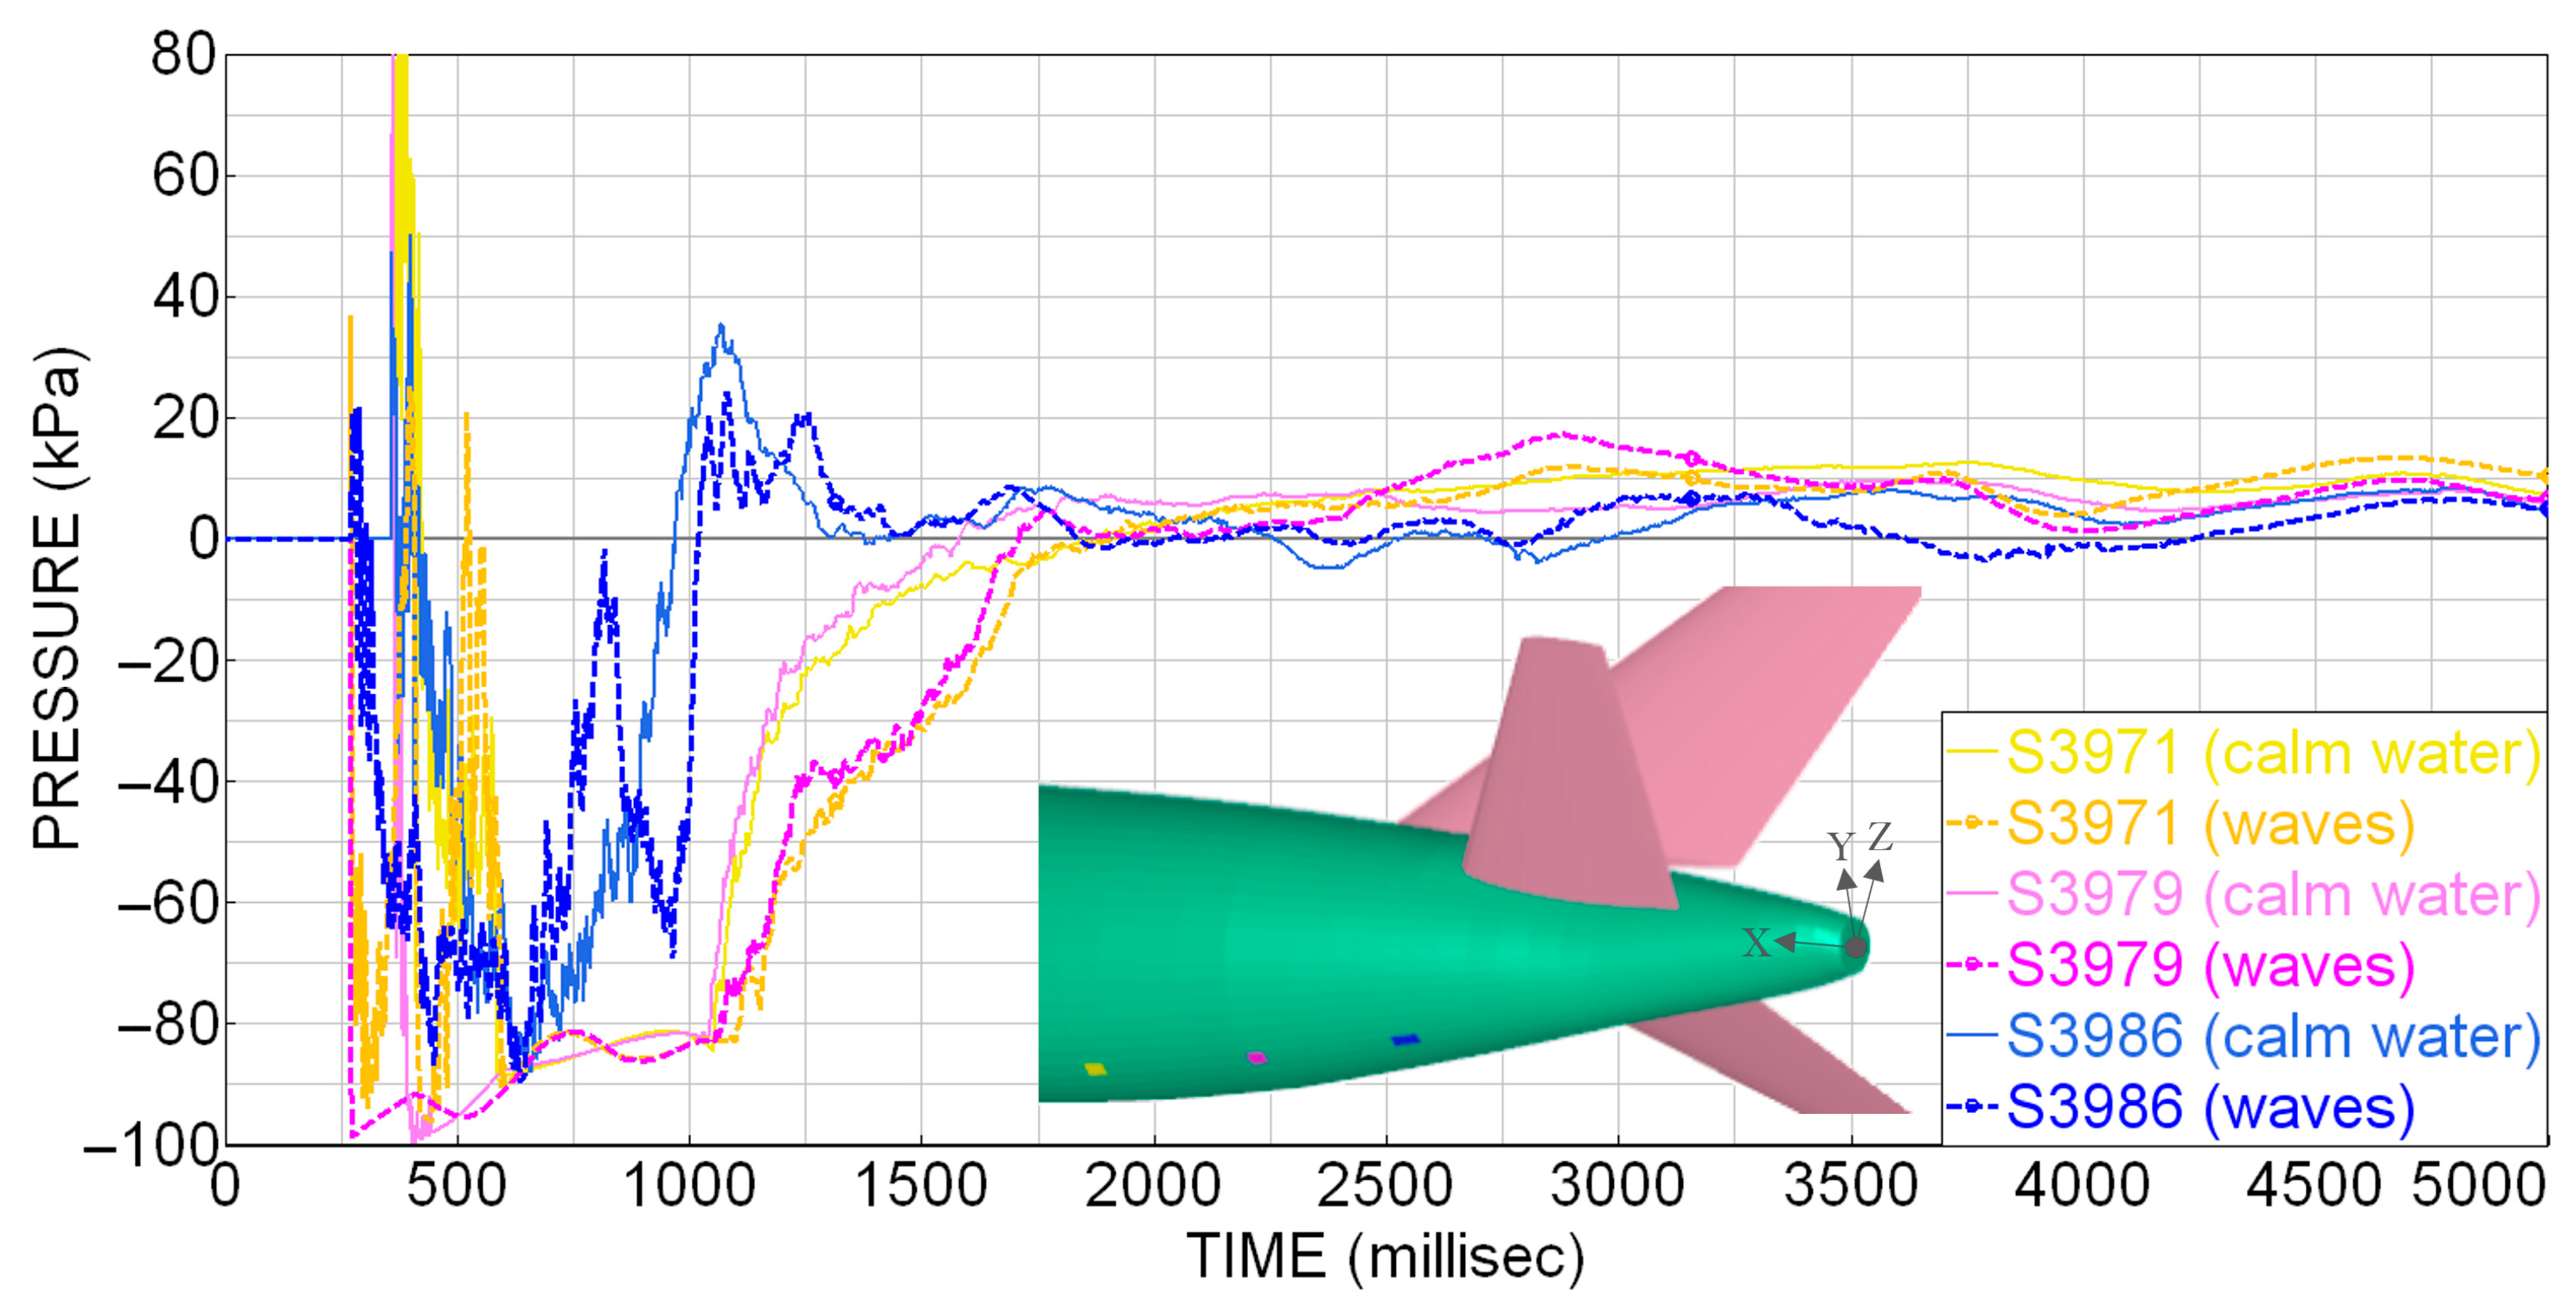
Figure 12 shows the time series of the gauge pressure at 3 locations on the rear bottom fuselage section. When waves are present, higher decelerations can be observed when the aircraft hits the waves at 1000 ms and at 1500 ms, with suction acting over a longer period of time on the aft fuselage, e.g., at the position 3979 (magenta). The highest local pressure is encountered near the position 3971 (yellow), and overpressure can be observed at the position 3986 (blue).
Figure 12.
Gauge pressure experienced during the ditching on waves (dashed lines) and on calm water (thick lines) at three positions (in yellow, magenta, and blue) on the bottom rear fuselage.
In the simulations, no skipping was observed. This is also linked to the additional interaction between the elevators and the water when the aft section immerses into the water. The interaction with the elevators is even more relevant when a roll angle is considered in the initial conditions. In combination with the pitch angle of 11°, a few milliseconds after the impact on the crest of the wave the elevator (on the rotation side) contacts the water, causing a negative moment about the longitudinal axis and a subsequent variation in the yaw angle. With higher initial roll angles, the resultant variation in the yaw angle increases. Also, the resultant rotation is higher compared to the ditching on calm water. With lower pitch angles, the engines may contact the free surface earlier due to the initial position of the aircraft, followed by higher decelerations.
The simulations were computed using 128 cores. The smallest FPM time step for the ditching on waves was 0.25 ms, and the number of FPM iterations was 4799. The wall clock time for this simulation was 2 h and 53 min, including around one hour for the wave generation. The simulation on calm water was completed after 1 h and 57 min with a total of 3286 FPM iterations, being the smallest FPM time step 0.27 ms. These relatively low computational times highlight that the FPM method is promising for ditching in terms of computational effort. Previous ditching simulations with the D150 aircraft model but using a fluid domain discretized by SPH particles and FE bricks show wall-clock times of up to around 7 h for a simulation time of 700 ms when the aircraft is flexible [6].
Besides the investigation of the aircraft behavior during the impact and the landing phase, floatation characteristics can be analyzed in FPM-FE simulations by comparing the waterline level to the door sills for different wave heights, e.g., over 20 s.
5. Conclusions
The Finite Pointset Method was investigated for the application in aircraft ditching simulations. Investigations based on guided ditching tests showed the possibility of predicting the onset of cavitation when the dynamic pressure reaches the relative vapor pressure. Further negative pressure on the structural surface could be restricted numerically. In ditching simulations using scale models, a good agreement in the kinematic behavior could be observed. Scalability effects were assessed using scaling factors according to Froude. The ditching simulation with a full-scale model showed considerable differences in the kinematics when the pressure drop was limited to the vapor pressure compared with the scaled test simulation with lower impact velocity and reduced pressure drop. Using a moderate number of computational cores, the computational times were low for the considered test cases.
The simulation with the generic aircraft proved the potential to consider waves in ditching analysis. The low computational times with simulations completed in 2 h for calm water and 3 h for ditching on waves demonstrate the feasibility of using FPM for the aircraft preliminary design.
Author Contributions
Conceptualization, C.L.M. and D.K.; methodology, C.L.M. and D.K.; software, M.P. and C.L.M.; validation, C.L.M. and D.K.; formal analysis, C.L.M. and D.K.; investigation, C.L.M. and D.K.; resources, D.K., M.P. and C.L.M.; data curation, D.K., C.L.M. and M.P.; writing—original draft preparation, C.L.M.; writing—review and editing, D.K., M.P. and C.L.M.; visualization, C.L.M.; supervision, D.K.; project administration, D.K.; funding acquisition, D.K. All authors have read and agreed to the published version of the manuscript.
Funding
This research was partly funded by the German Federal Ministry for Economic Affairs and Energy (BMWE) in the framework of the federal civil aviation research program LuFo VI-1 under grant agreement No. 20Q1951C, project InSiDE (Industrialized Simulation of Ditching Events).
Data Availability Statement
The numerical and digitalized data presented in this article can be made available by the authors upon reasonable request. Experimental test data sharing is not applicable due to legal restrictions.
Conflicts of Interest
The authors declare no conflicts of interest.
Abbreviations
The following abbreviations are used in this manuscript:
| CFD | Computational Fluid Dynamics |
| CPACS | Common Parametric Aircraft Configuration Schema |
| D150 | DLR’s generic short-mid-range narrow-body aircraft model for 150 passengers |
| FPM | Finite Pointset Method |
| NACA | National Advisory Committee for Aeronautics |
| PANDORA | Parametric Numerical Design and Optimization Routines for Aircraft |
| SARAH | Increased Safety & Robust Certification for Ditching of Aircrafts & Helicopters |
References
- EASA. Certification Specifications and Acceptable Means of Compliance for Large Aeroplanes (CS-25) Amendment 28. 2023. Available online: https://www.easa.europa.eu/en/document-library/certification-specifications/cs-25-amendment-28 (accessed on 17 December 2025).
- Bisagni, C.; Pigazzini, M.S. Modelling Strategies for Numerical Simulation of Aircraft Ditching. Int. J. Crashworth. 2017, 23, 377–394. [Google Scholar] [CrossRef] [Scilit]
- Siemann, M.H.; Langrand, B. Coupled fluid-structure computational methods for aircraft ditching simulations: Comparison of ALE-FE and SPH-FE approaches. Comp. Struct. 2017, 188, 95–108. [Google Scholar] [CrossRef] [Scilit]
- Climent, H.; Viana, J.T.; Espinosa de los Monteros, J.; Sánchez Iglesias, F.; González Fernández, L. Aircraft Ditching Impact Loads and Floatation Analysis. In Proceedings of the 8th European Conference for Aeronautics and Space Sciences EUCASS, Madrid, Spain, 1–4 July 2019. [Google Scholar] [CrossRef]
- Jackson, K.E.; Putnam, J.B. LS-DYNA® Water Ditching Simulation of a Fokker F28 Fellowship Aircraft; Technical Memorandum 2020-5006941; National Aeronautics and Space Administration: Hampton, NY, USA, 2020. Available online: https://ntrs.nasa.gov/citations/20205006941 (accessed on 17 December 2025).
- Leon Muñoz, C.; Kohlgrüber, D.; Petsch, M. High-Fidelity Aircraft Simulations for the Application in an Industrialized Ditching Analysis Process. AIAA J. 2025, 63, 3487–3492. [Google Scholar] [CrossRef] [Scilit]
- Giustina, A.; Colamartino, I.; Dolci, S.; Anghileri, M. Water impact of flexible aluminum panels: Experimental study and numerical validation across different angles for aircraft ditching applications. Int. J. Impact Eng. 2026, 213, 105657. [Google Scholar] [CrossRef] [Scilit]
- Tiwari, S.; Kuhnert, J. Finite Pointset Method Based on the Projection Method for Simulations of the Incompressible Navier-Stokes Equations. In Meshfree Methods for Partial Differential Equations. Lecture Notes in Computational Science and Engineering; Griebel, M., Schweitzer, M.A., Eds.; Springer: Berlin/Heidelberg, Germany, 2003; Volume 26, pp. 373–387. [Google Scholar] [CrossRef] [Scilit]
- Keysight Technologies. ESI Virtual Performance Solution: Solver Reference Manual—Incompressible Fluid Coupling; Keysight Technologies: Santa Rosa, CA, USA, 2024. [Google Scholar]
- Petsch, M.; Kohlgrüber, D.; Schwinn, D.; Leon Muñoz, C.; Marconi, L. Enhancements of the DLR Tool PANDORA for Automated Detailed Preliminary Design and Crash Analyses. In Proceedings of the German Aerospace Congress DLRK, Augsburg, Germany, 23–25 September 2025; Available online: https://elib.dlr.de/221396/ (accessed on 13 January 2026).
- Alder, M.; Moerland, E.; Jepsen, J.; Nagel, B. Recent Advances in Establishing a Common Language for Aircraft Design with CPACS. In Proceedings of the 1st Aerospace Europe Conference AEC2020, Bordeaux, France, 25–28 February 2020; Available online: https://elib.dlr.de/134341/ (accessed on 17 December 2025).
- Leon Muñoz, C.; Petsch, M.; Kohlgrüber, D.; Pedelaborde-Augas, M. Automatic tool-based pre-processing of generic structural models for water impact simulations in the aircraft pre-design. IOP Conf. Ser. Mater. Sci. Eng. 2022, 1226, 012042. [Google Scholar] [CrossRef] [Scilit]
- Iafrati, A.; Grizzi, S. Cavitation and Ventilation modalities during ditching. Phys. Fluids 2019, 31, 052101. [Google Scholar] [CrossRef] [Scilit]
- Iafrati, A.; Grizzi, S.; Olivieri, F. Experimental Investigation of Fluid-Structure Interaction Phenomena During Aircraft Ditching. AIAA J. 2021, 59, 1561–1574. [Google Scholar] [CrossRef] [Scilit]
- Spinosa, E.; Grizzi, S.; Iafrati, A. High-speed ditching of double curvature specimens with cavitation and ventilation. Ocean Eng. 2025, 341, 122209. [Google Scholar] [CrossRef] [Scilit]
- McBride, E.E.; Fisher, L.J. Experimental Investigations of the Effect of Rear-Fuselage Shape on Ditching Behavior; Technical Note 2929; National Advisory Committee for Aeronautics: Washington, DC, USA, 1953. Available online: https://ntrs.nasa.gov/citations/19930083664 (accessed on 17 December 2025).
- Froude, W. On Experiments with H.M.S. Greyhound. In Transactions of the Royal Institution of Naval Architects; Henry Sotheran & Co.: London, UK, 1874; Volume 15, pp. 36–73. [Google Scholar]
- Thompson, W.C. Ditching Investigation of a 1/30-Scale Dynamic Model of a Heavy Jet Transport Airplane; Technical Memorandum X-2445; National Aeronautics and Space Administration: Hampton, NY, USA, 1972. Available online: https://ntrs.nasa.gov/citations/19720009355 (accessed on 17 December 2025).
- Patel, A.A.; Greenwood, R.P., Jr. Transport Water Impact and Ditching Performance; Report DOT/FAA/AR-95/54; U.S. Department of Transportation: Springfield, IL, USA, 1996. Available online: https://www.fire.tc.faa.gov/pdf/ar95-54.pdf (accessed on 17 December 2025).

Disclaimer/Publisher’s Note: The statements, opinions and data contained in all publications are solely those of the individual author(s) and contributor(s) and not of MDPI and/or the editor(s). MDPI and/or the editor(s) disclaim responsibility for any injury to people or property resulting from any ideas, methods, instructions or products referred to in the content. |
© 2026 by the authors. Licensee MDPI, Basel, Switzerland. This article is an open access article distributed under the terms and conditions of the Creative Commons Attribution (CC BY) license.