


Abstract
Discovering design rules is essential for advancing interpretable and intelligent propeller design. This paper proposes a knowledge–data hybrid-driven method for discovering design rules for high-efficiency propellers, with the aim of expanding the pool of comparable design data while reducing the search space for candidate rule parameters. Based on the propeller ideal efficiency theory, an efficiency factor is introduced to address the lack of comparability among performance data caused by differences in propeller loading, thereby enabling all designs in the database to be used for data mining. Dimensionless composite features are then constructed using the principle of dimensional homogeneity and screened through correlation analysis within a knowledge–data hybrid-driven framework. Six characteristic load ratios are identified as rule parameters, yielding the following design rule: a propeller has a high efficiency factor when all six ratios lie within their respective optimal ranges. Finally, the rule is validated on 12 independent designs, including three designs of a different propeller. The proposed knowledge–data hybrid-driven feature-engineering framework provides a viable approach to design-rule discovery and may support inverse design and intelligent propeller design.
1. Introduction
Unmanned aerial vehicles (UAVs) are widely used in both military and civilian applications. Next-generation UAVs are expected to operate at higher altitudes and speeds while achieving longer endurance [1]. For propeller-driven UAVs, high-efficiency propellers are essential for meeting these increasingly demanding requirements. However, it is becoming increasingly difficult to satisfy these requirements using conventional propeller design rules alone. Consequently, there is a pressing need to improve propeller design rules and to develop interpretable design knowledge that can support the design of high-efficiency propellers.
Conventional propeller design rules, such as momentum theory, blade element theory, the Betz condition, and vortex theory, were primarily derived by aerodynamicists through mathematical deduction based on physical laws and simplifying assumptions [2,3]. This rule-discovery paradigm relies heavily on expert knowledge and experience, constituting a typical expert system. The resulting rules often rely on simplified aerodynamic assumptions and therefore may not adequately address the complex operating requirements of modern high-performance propellers. To overcome these limitations, researchers have explored numerical optimization methods [4,5], inverse design methods [6,7], and optimization design methods incorporating artificial intelligence algorithms [8,9,10] for propeller design. Although these methods can improve propeller efficiency to a certain extent, few generalizable and interpretable new design rules have been reported for guiding propeller design.
With the rapid development of computational science, data mining has become an increasingly important research paradigm for knowledge discovery [11,12]. Initially, purely data-driven approaches were employed to rediscover relatively simple confirmatory knowledge (i.e., knowledge that conforms to specific equations or patterns). Lemos et al. [13] trained machine learning models on observational data of the motion of the Sun and planets in the solar system, automatically discovering the governing equations through symbolic regression and thereby rederiving the law of universal gravitation. Iten et al. [14] proposed a brain-inspired machine learning algorithm that recovered the heliocentric model by analyzing the trajectories of the Sun and Mars as observed from Earth. Subsequently, to enable the rediscovery of more complex knowledge, Liu et al. [15,16] pioneered the embedding of physical knowledge into neural networks and developed a data and physical knowledge hybrid-driven machine learning method that automatically rediscovered hidden symmetries, including the Gullstrand–Painlevé metric. Later, Boiko et al. [17] developed Coscientist v1.0, an AI agent based on large language models that autonomously reproduced a palladium-catalyzed cross-coupling reaction. However, existing knowledge discovery studies remain largely confined to rediscovering existing knowledge, most of which is confirmatory knowledge. In contrast, design-oriented knowledge discovery requires extracting previously unknown, interpretable, and actionable rules from design data. This study aims to go one step further by extending data-mining-based knowledge discovery toward uncovering previously unknown knowledge—specifically, knowledge that can guide design. Given the challenges in propeller design outlined above, this study focuses on propellers and attempts to discover novel design rules through a knowledge–data hybrid-driven approach. In the specific context of propeller design, data-driven methods have so far been employed mainly to construct surrogate models that predict aerodynamic performance or noise and to accelerate design optimization [18,19,20]; these studies aim at performance prediction rather than the discovery of interpretable design rules. The present study is therefore focused on the extraction of design-oriented, interpretable rules from propeller design data, which distinguishes it both from the rediscovery-oriented studies reviewed above and from prediction-oriented data-driven propeller design studies.
However, several obstacles remain in applying machine-learning-based data mining techniques to propeller design rule discovery. Rule discovery requires a substantial number of suitable designs, as well as the identification of rule parameters that significantly affect design outcomes, which often leads to two types of problems:
- (1)
- The pool of comparable propeller designs is limited because differences in loading prevent direct performance comparisons. Data constitute one of the three fundamental components of artificial intelligence [21], and data mining for discovering propeller design rules requires a sufficient amount of design data. During the propeller design processes, researchers accumulate a certain amount of design data; however, these data cannot be compiled into a single database for comparison owing to differences in thrust and power. In current propeller optimization design, the conventional approach typically constrains the propeller torque to within the rated value at the design speed [22] and requires the thrust to be no less than the design value [23,24,25]. As a result, a significant amount of data generated under different loading conditions cannot be compiled into a single database, leaving researchers with abundant but mutually incomparable data. Therefore, establishing an evaluation criterion capable of assessing propellers under diverse loading conditions is a prerequisite for discovering propeller design rules.
- (2)
- The search space for candidate rule parameters is extremely large, which may lead to the “curse of dimensionality”. Numerous physical quantities influence propeller performance, and their combinations form a large number of candidate rule parameters. Rule parameters refer to the crucial physical quantities that influence propeller performance, such as the lift-to-drag ratio of the blade element, the utility factor, and circulation; the values of a small set of rule parameters and the relationships among them constitute a propeller design rule. To improve propeller design, researchers have long sought rule parameters that directly affect propeller performance. Betz [26] investigated how to maximize propeller efficiency under frictionless conditions and concluded that the wake vortex surface should resemble a rigid helicoidal surface moving downstream. Patterson et al. [4] studied the influence of the radial distribution of axial velocity in the propeller slipstream and proposed a design method that prescribes a radially uniform axial velocity in the slipstream. Traditionally, such parameters were selected manually, relying entirely on the expertise and experience of the designer. However, the large number of physical quantities involved in propeller design makes this search space prohibitively large, and research on propeller design rules and parameters is still ongoing. Recent advances in automated feature engineering have made knowledge-guided automatic feature construction increasingly feasible. Zhu et al. [27] developed an AI-Chemist and narrowed the extensive search space of metal combinations using the Bayesian optimization algorithm. This indicates that knowledge-driven automatic feature construction can incorporate expert knowledge while narrowing the search space for rule parameters.
This study addresses the two types of problems mentioned above. The main contributions of this study are threefold. First, an efficiency-factor-based evaluation criterion grounded in ideal efficiency theory is introduced, which makes propeller designs under different loading conditions mutually comparable for the first time, so that all available design data—rather than only the small subset sharing the same thrust coefficient—can be exploited for rule discovery. Second, a knowledge–data hybrid-driven feature engineering framework is established, in which the principle of dimensional homogeneity constrains the construction of physically meaningful dimensionless composite features, and correlation-based selection identifies six characteristic load ratios as interpretable rule parameters, thereby avoiding the curse of dimensionality. Finally, a new, quantitative and interpretable propeller design rule is extracted together with the optimal ranges of the rule parameters, validated on independent designs from two different propellers, and physically interpreted in connection with the Betz condition. To the best of the authors’ knowledge, this study is the first attempt to discover a previously unknown, quantitative and interpretable design rule for propellers directly from design data, rather than to rediscover existing confirmatory knowledge.
The remainder of this paper is organized as follows. Section 2 presents the computation method for propeller performance, the construction of the propeller database, and the methods used in this study. Section 3 introduces the concept of the efficiency factor and details the discovery of the new propeller design rule, including feature construction, feature selection, rule extraction, and rule validation. Finally, Section 4 concludes the paper.
2. Materials and Methods
The research in this paper is mainly divided into two steps: establishing a propeller performance database and conducting knowledge discovery. To establish the database, CFD is first used to evaluate a large number of propeller designs. An efficiency factor is then introduced to make propeller performance data obtained under different loading conditions comparable. For knowledge discovery, features are constructed using dimensional homogeneity, selected through correlation analysis, and used in rule mining through hierarchical clustering. The effectiveness of the resulting rule is then validated on multiple independent propeller designs.
This section presents the propeller performance computation method, the correlation analysis, and the hierarchical clustering algorithm used in this study.
2.1. Propeller Performance Computation Method and Database Construction
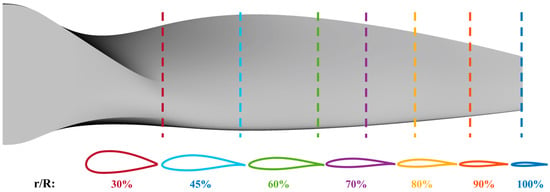
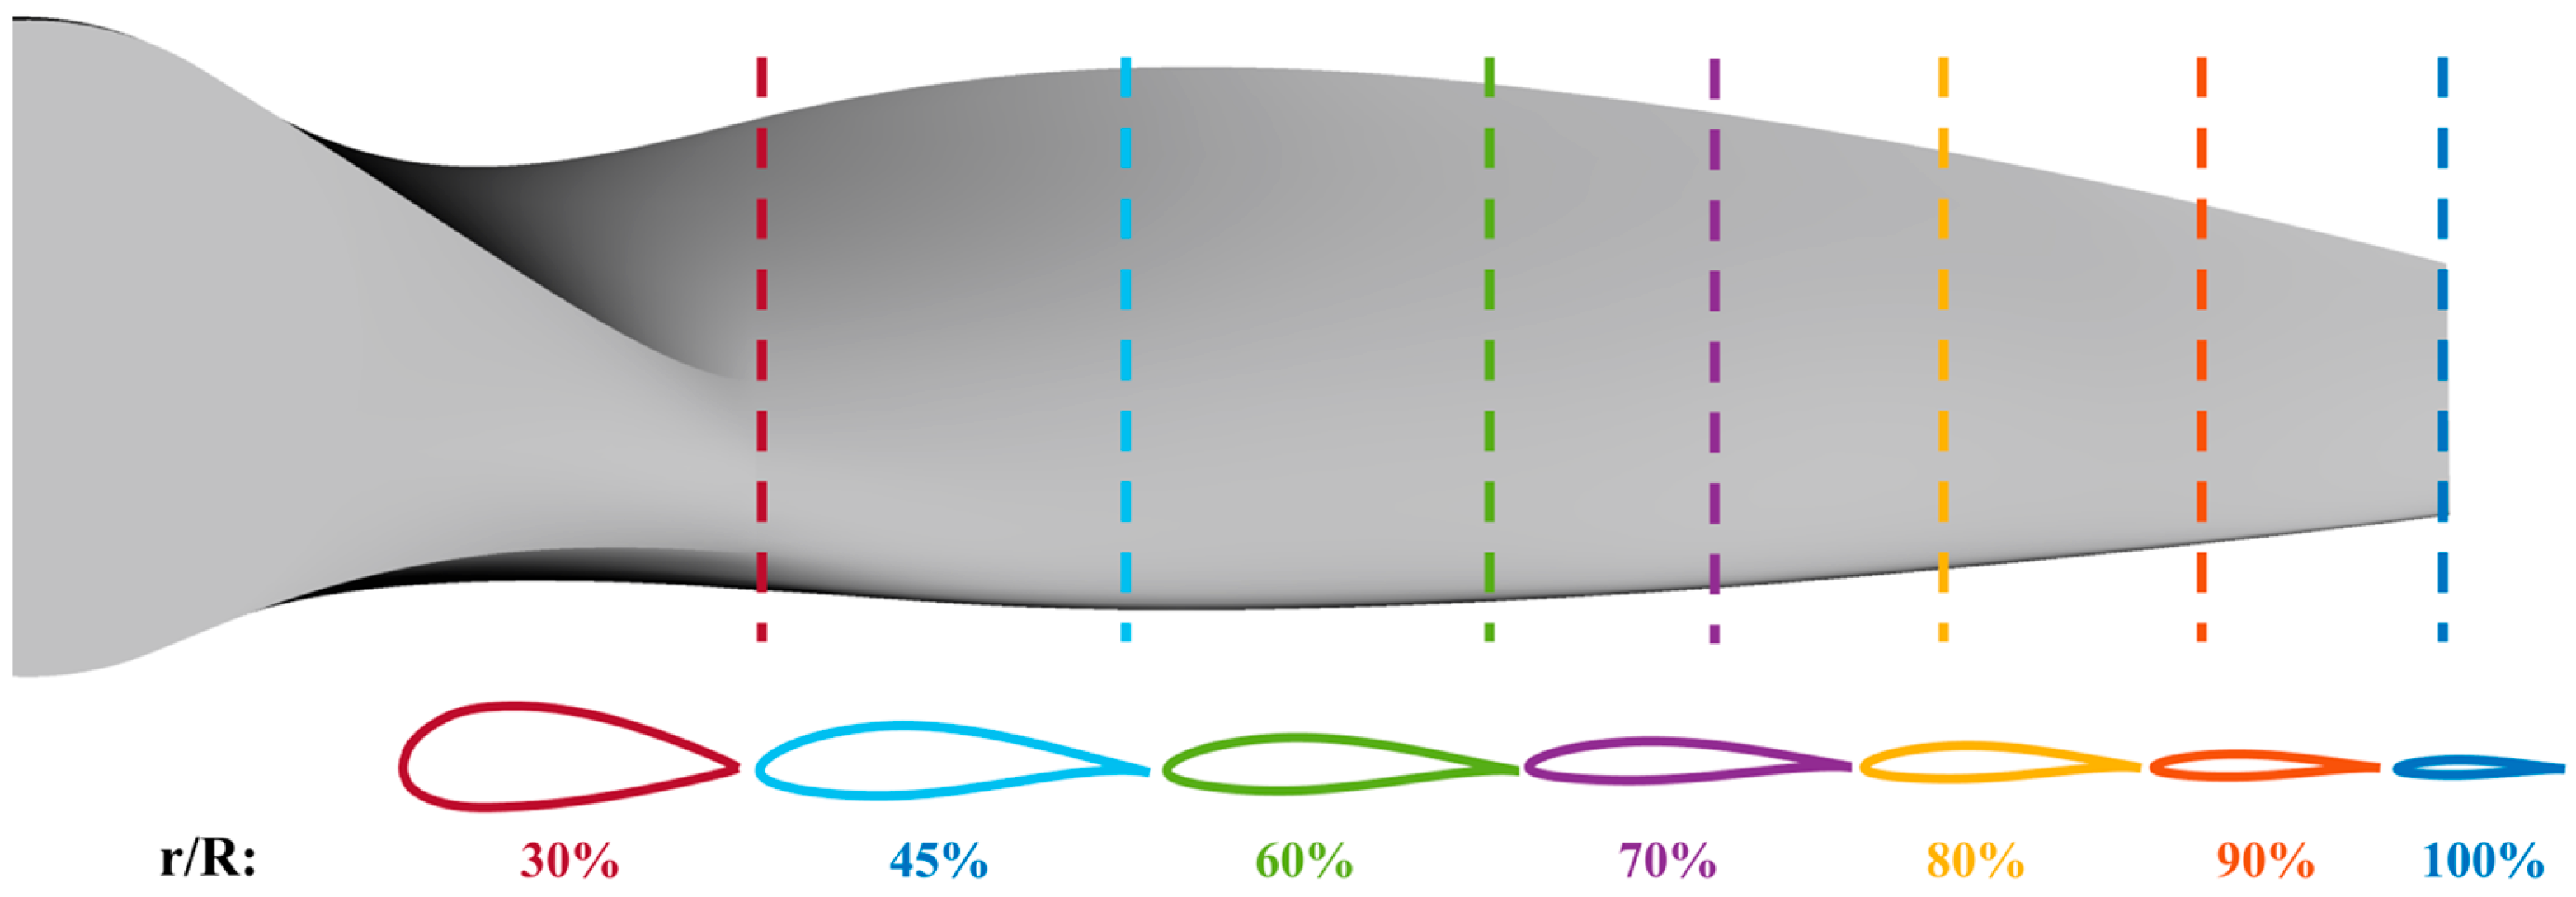
A propeller previously designed by the authors was selected as the baseline; its design requirements are listed in Table 1. The propeller geometry is illustrated in Figure 1. The blade sections use airfoils of the SCLKY and NACA 63 series.
Table 1.
Propeller design requirements.
Figure 1.
Baseline propeller geometry and airfoil sections.
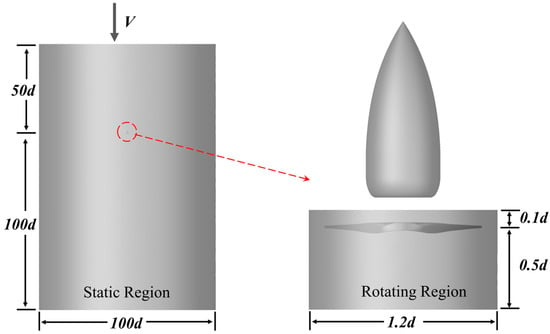
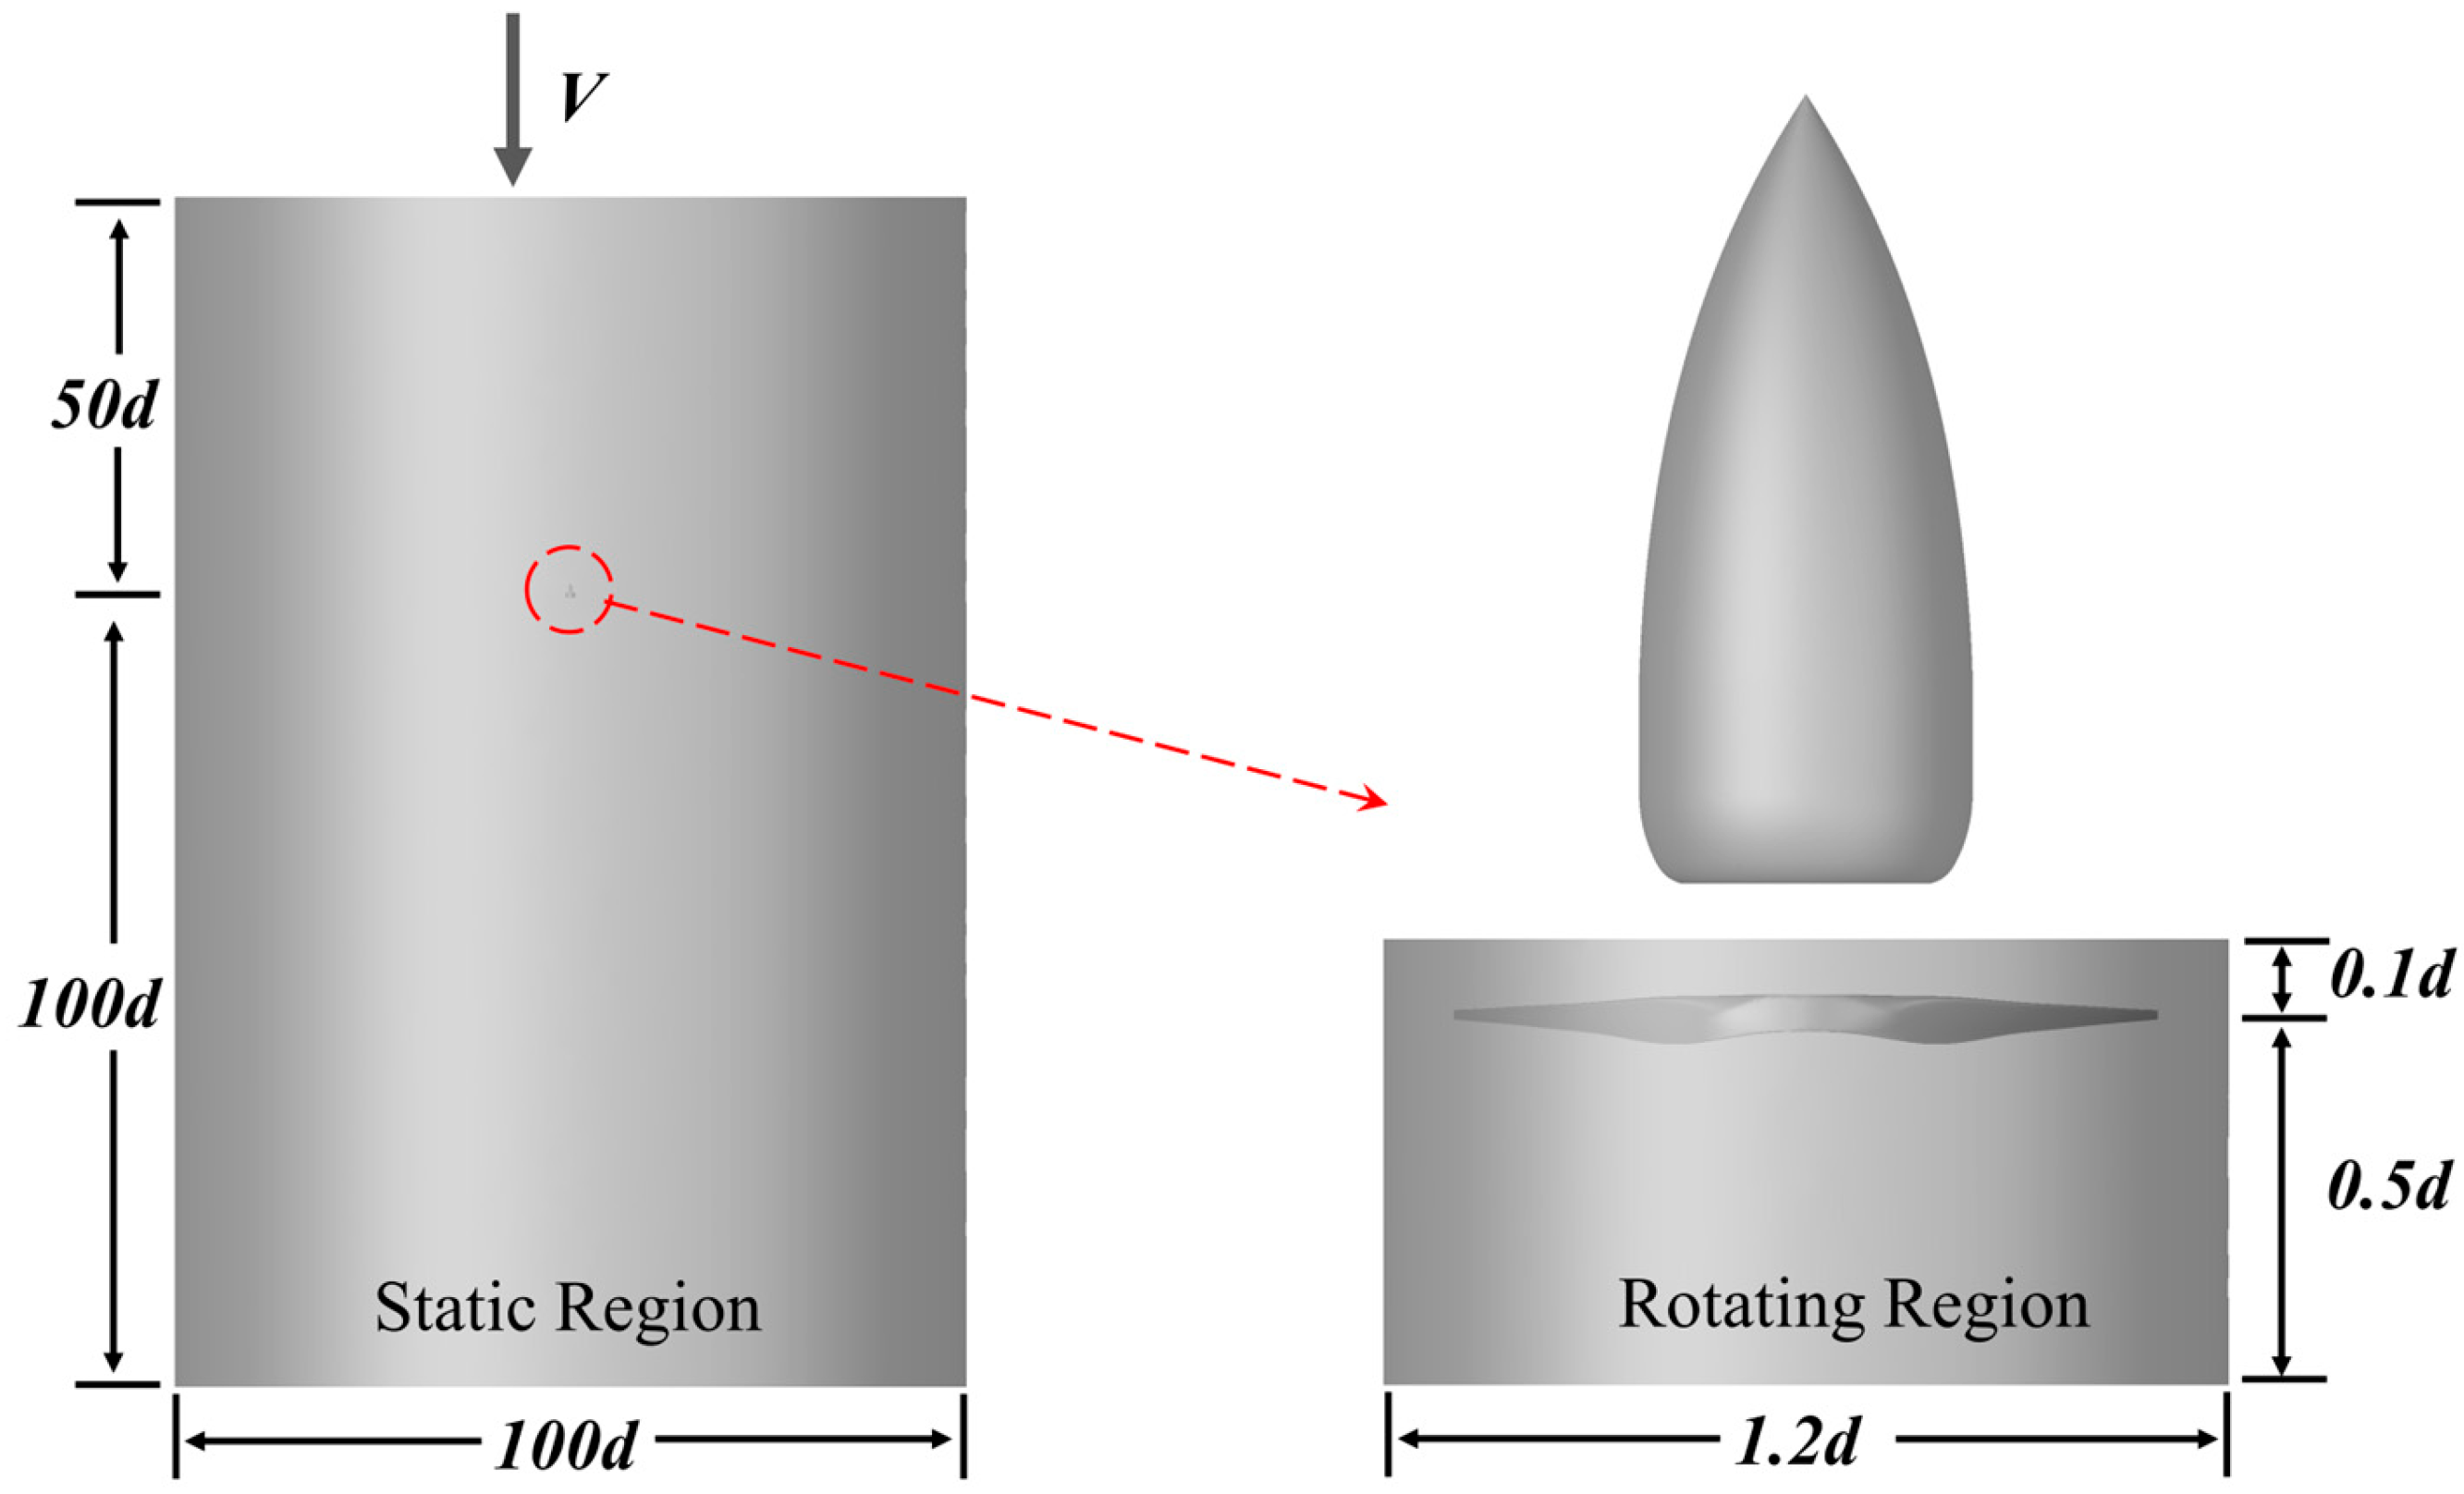
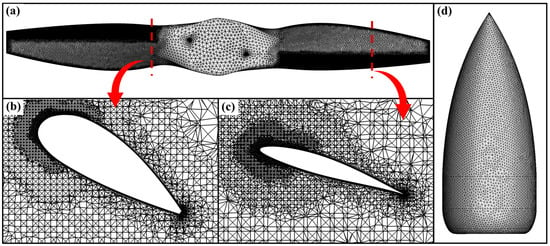
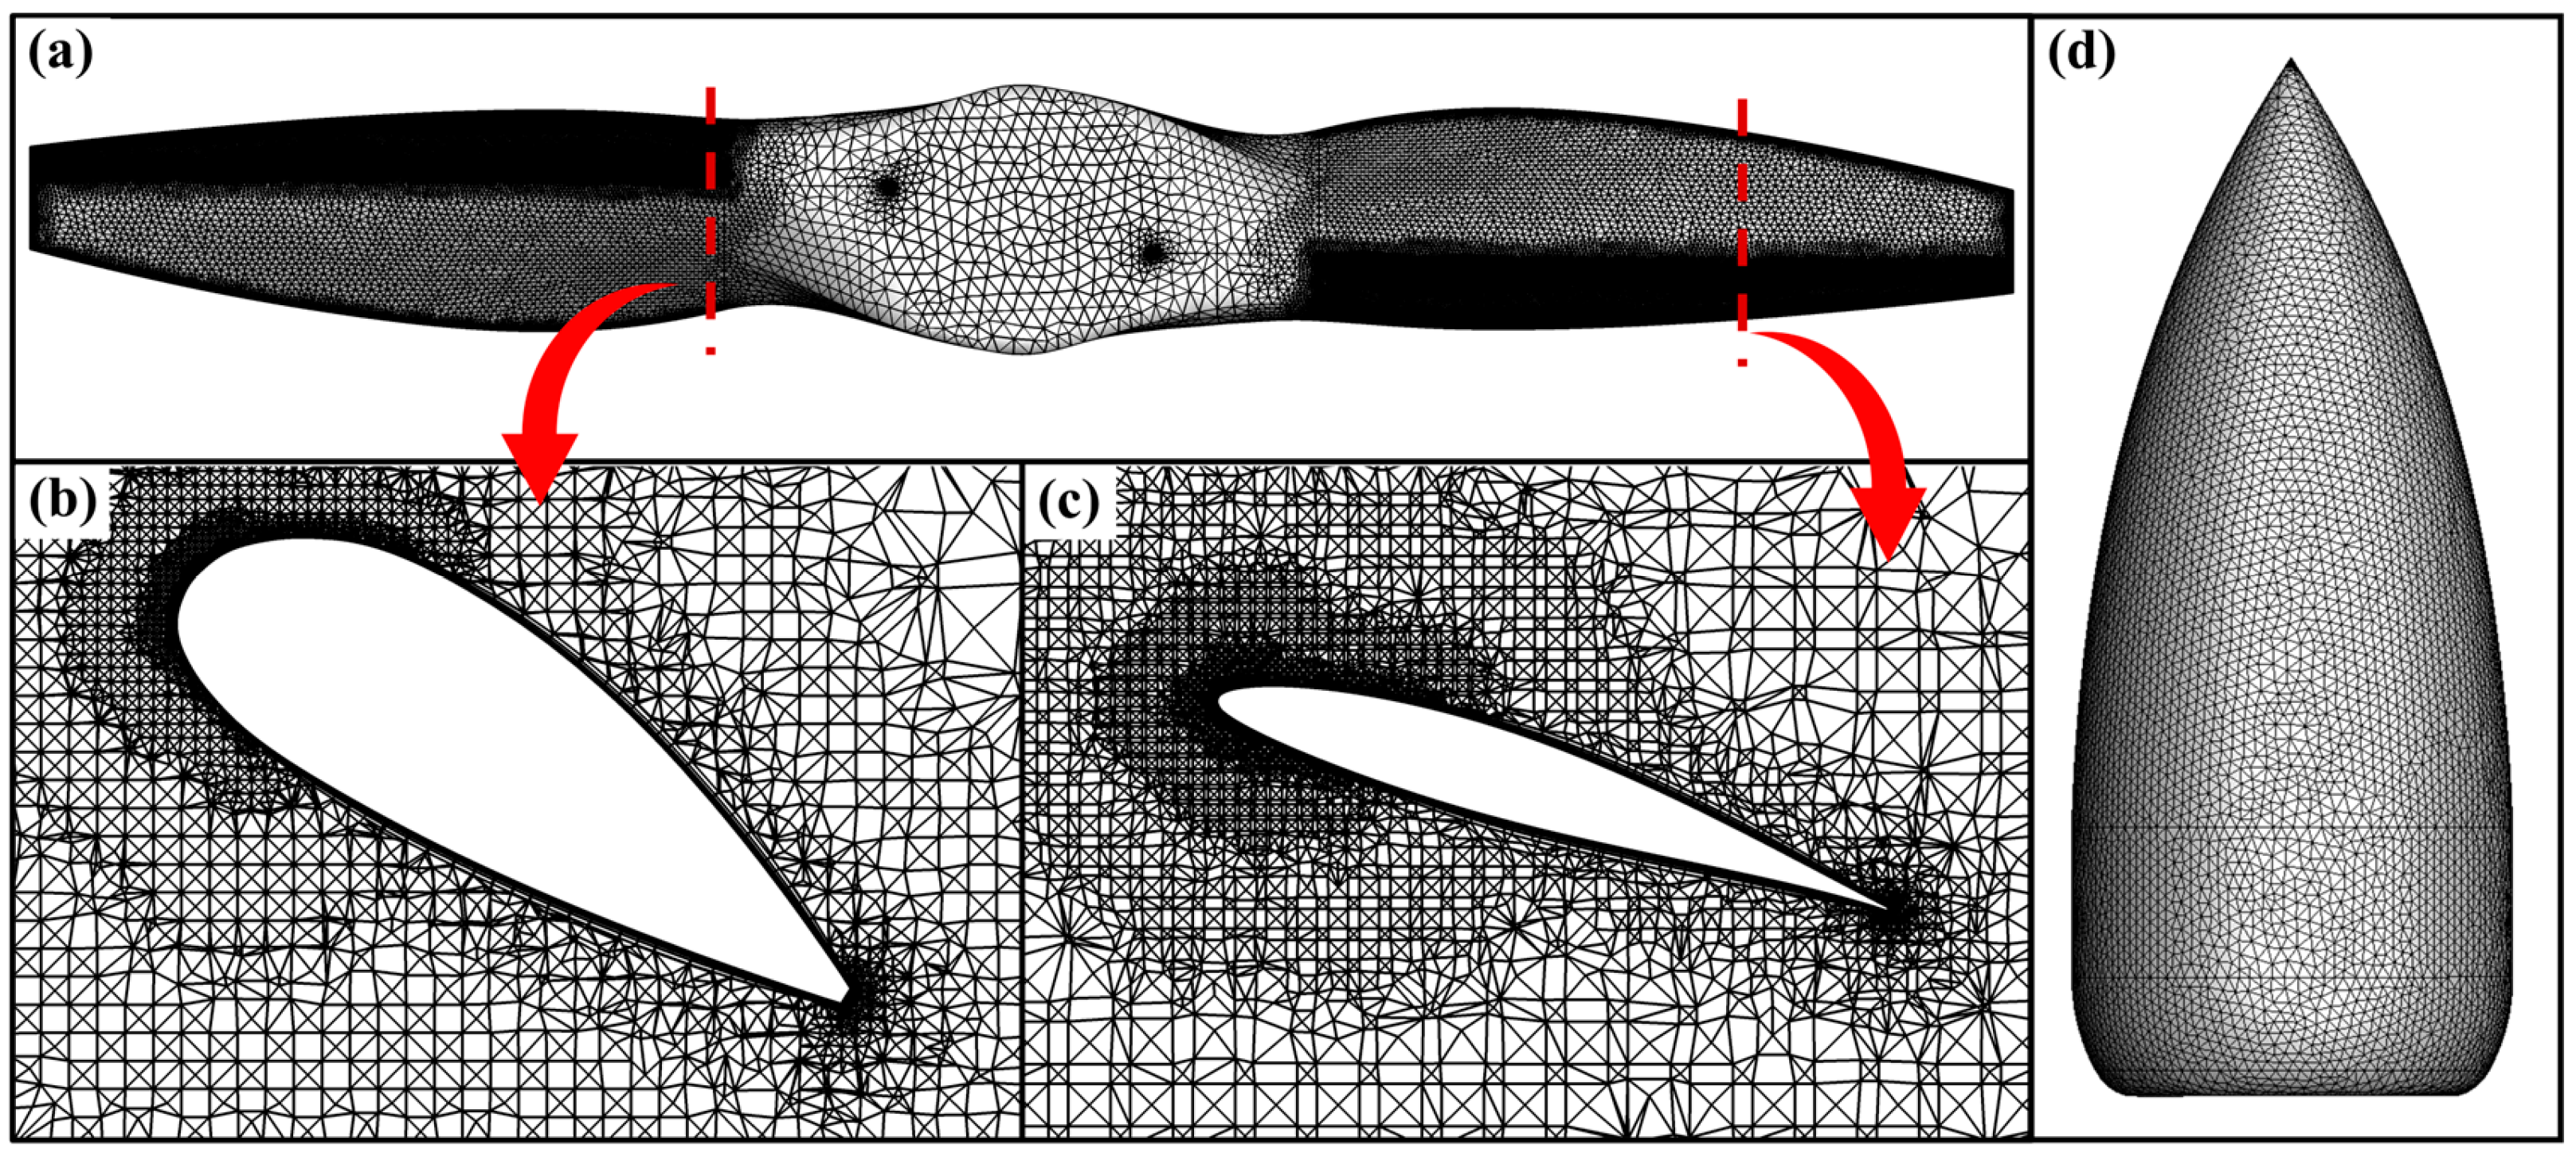
According to the design requirements, 103 propeller designs were generated, and their aerodynamic performance was evaluated using the computational fluid dynamics (CFD) method. The multiple reference frame (MRF) approach and an unstructured mesh were employed in the numerical simulations. The computational domain shown in Figure 2 comprises a stationary cylindrical region and a rotating cylindrical region enclosing the propeller. The stationary region has a diameter of 100d (76,000 mm) and extends 50d (38,000 mm) upstream and 100d (76,000 mm) downstream of the propeller disk, while the rotating domain has a diameter of 1.2d (912 mm) and an axial thickness of 0.6d (456 mm). The dimensions of the stationary region were selected conservatively to reduce the influence of the far-field boundaries on the computed propeller flow. Its upstream, downstream, and radial extents are larger than those used in related propeller CFD simulations [28,29,30]. The upstream boundary is located 50d from the propeller disk so that the far-field condition is imposed where the propeller-induced velocity is negligible. The downstream boundary is located 100d from the disk to allow the wake to develop before reaching the downstream far-field boundary, thereby reducing its influence on the near-wake solution. The stationary region has a diameter of 100d to reduce possible confinement effects from the lateral boundaries. The rotating region has a diameter of 1.2d and an axial thickness of 0.6d, enclosing the propeller and spinner while providing a radial clearance of 0.1d between the blade tips and the rotating–stationary interface. The surface meshes of the propeller and the spinner, together with the spatial meshes of the blade profiles at 30% and 75% radius, are illustrated in Figure 3.
Figure 2.
Computational domain.
Figure 3.
Computational mesh. (a) Propeller surface mesh; (b) spatial mesh of the blade profile at 30% radius of the propeller; (c) spatial mesh of the blade profile at 75% radius of the propeller; (d) spinner surface mesh.
The 103 propeller designs were generated in two stages by varying the radial distributions of chord length and installation angle within prescribed ranges. In the first stage, 49 designs were generated using an L49 orthogonal-array design of experiments with six factors and seven levels: chord length and installation angle at three control radial stations (r/R = 0.45, 0.70, and 0.90). The orthogonal array provides balanced coverage of the factor levels. In the second stage, a local three-level full-factorial perturbation study was conducted around the baseline geometry: chord length was varied by ±3% and installation angle by ±1.5° at each of the three control stations, yielding 36 = 729 candidate designs, from which a balanced, space-filling subset of 54 designs was selected. This two-stage design of experiments combines broad coverage of the design space with systematic sampling of local geometric sensitivities. All designs share the same blade number, diameter, and operating conditions listed in Table 1, so that the geometric design variables are the only factors differentiating the designs.
The Reynolds-averaged Navier–Stokes (RANS) equations were solved using the shear-stress transport (SST) k–ω turbulence model. Spatial discretization was performed using the node-based Green–Gauss method, and the interface between the rotating and stationary regions was treated using the frozen-rotor approach. A pressure-far-field boundary condition was imposed, and the propeller surface was modeled as a no-slip wall.
An unstructured hybrid mesh was used in this study. Fifteen prism layers were grown from the blade and spinner surfaces to resolve the boundary layers, with a first-layer height corresponding to y+ ≈ 1, while tetrahedral cells filled the remainder of the domain. Each design was discretized with approximately 11.6 million cells. A structured H-type mesh, although efficient for untwisted wings with simple planforms, was not adopted for two reasons. First, the propeller blades are highly twisted and tapered, and an H-topology around such blades can produce severely skewed cells near the blade tips and spinner–blade junctions, degrading the accuracy of the boundary-layer discretization. Second, and more importantly, consistent mesh-generation settings were required for all 103 geometries. The unstructured hybrid mesh could be generated automatically using the same quality controls for every geometry, whereas a structured H-mesh would require design-specific multiblock adjustments.
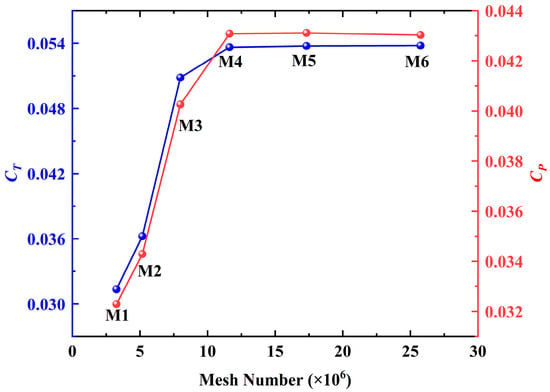
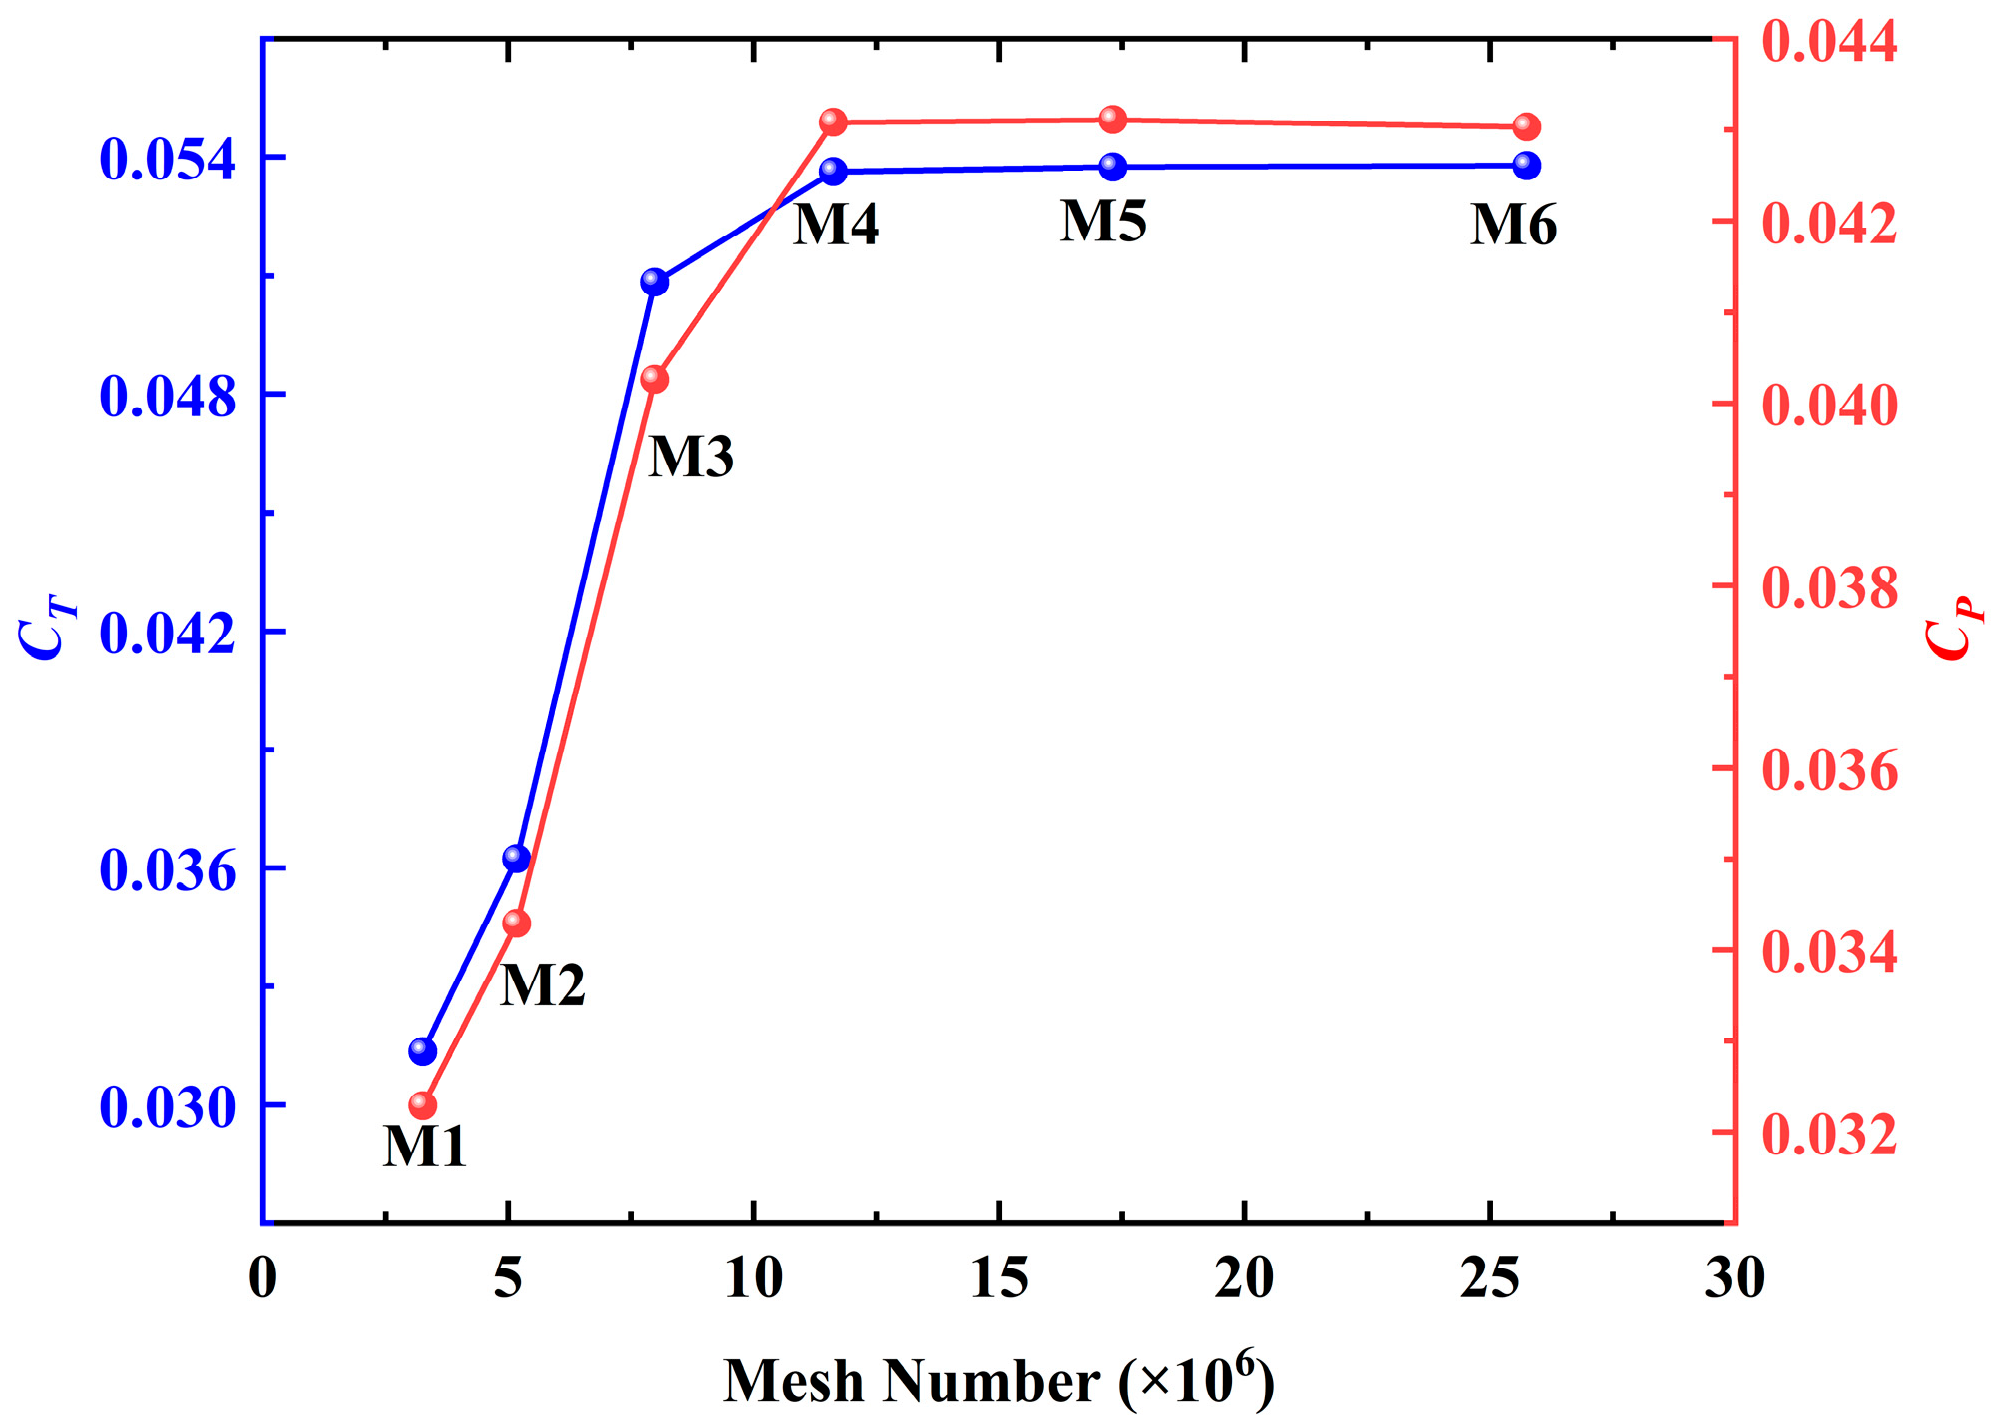
A grid-independence and discretization-uncertainty study was performed on a representative design following the grid convergence index (GCI) procedure [31]. Simulations were performed on six successively refined grids containing 3.26, 5.18, 7.99, 11.63, 17.32, and 25.75 million cells. The convergence of the thrust and power coefficients with mesh refinement is shown in Figure 4. Beyond 11.63 million cells, further refinement changes the thrust coefficient and the power coefficient by less than 0.28% and 0.09%, respectively. The GCI analysis applied to three systematically refined grids (5.18, 11.63, and 25.75 million cells, with a characteristic cell-size ratio of approximately 1.3) yields an extrapolated zero-grid-spacing thrust coefficient of 0.05378 and a fine-grid GCI of 0.003% for the thrust coefficient, while the power coefficient exhibits oscillatory convergence within ±0.1% around the converged value of 0.04304. The discretization uncertainty of the adopted mesh is therefore below 0.3% for both coefficients, indicating that the performance database is numerically reliable. Accordingly, the 11.63-million-cell mesh was adopted for the simulations of all 103 designs, and the reliability of the numerical predictions was further assessed through the wind-tunnel validation presented in Figure 5.
Figure 4.
Convergence of the thrust and power coefficients with mesh refinement for the representative design.
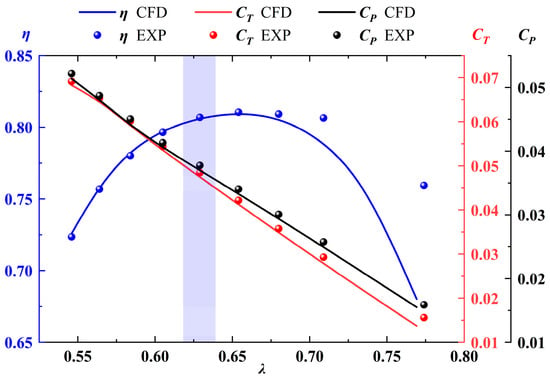
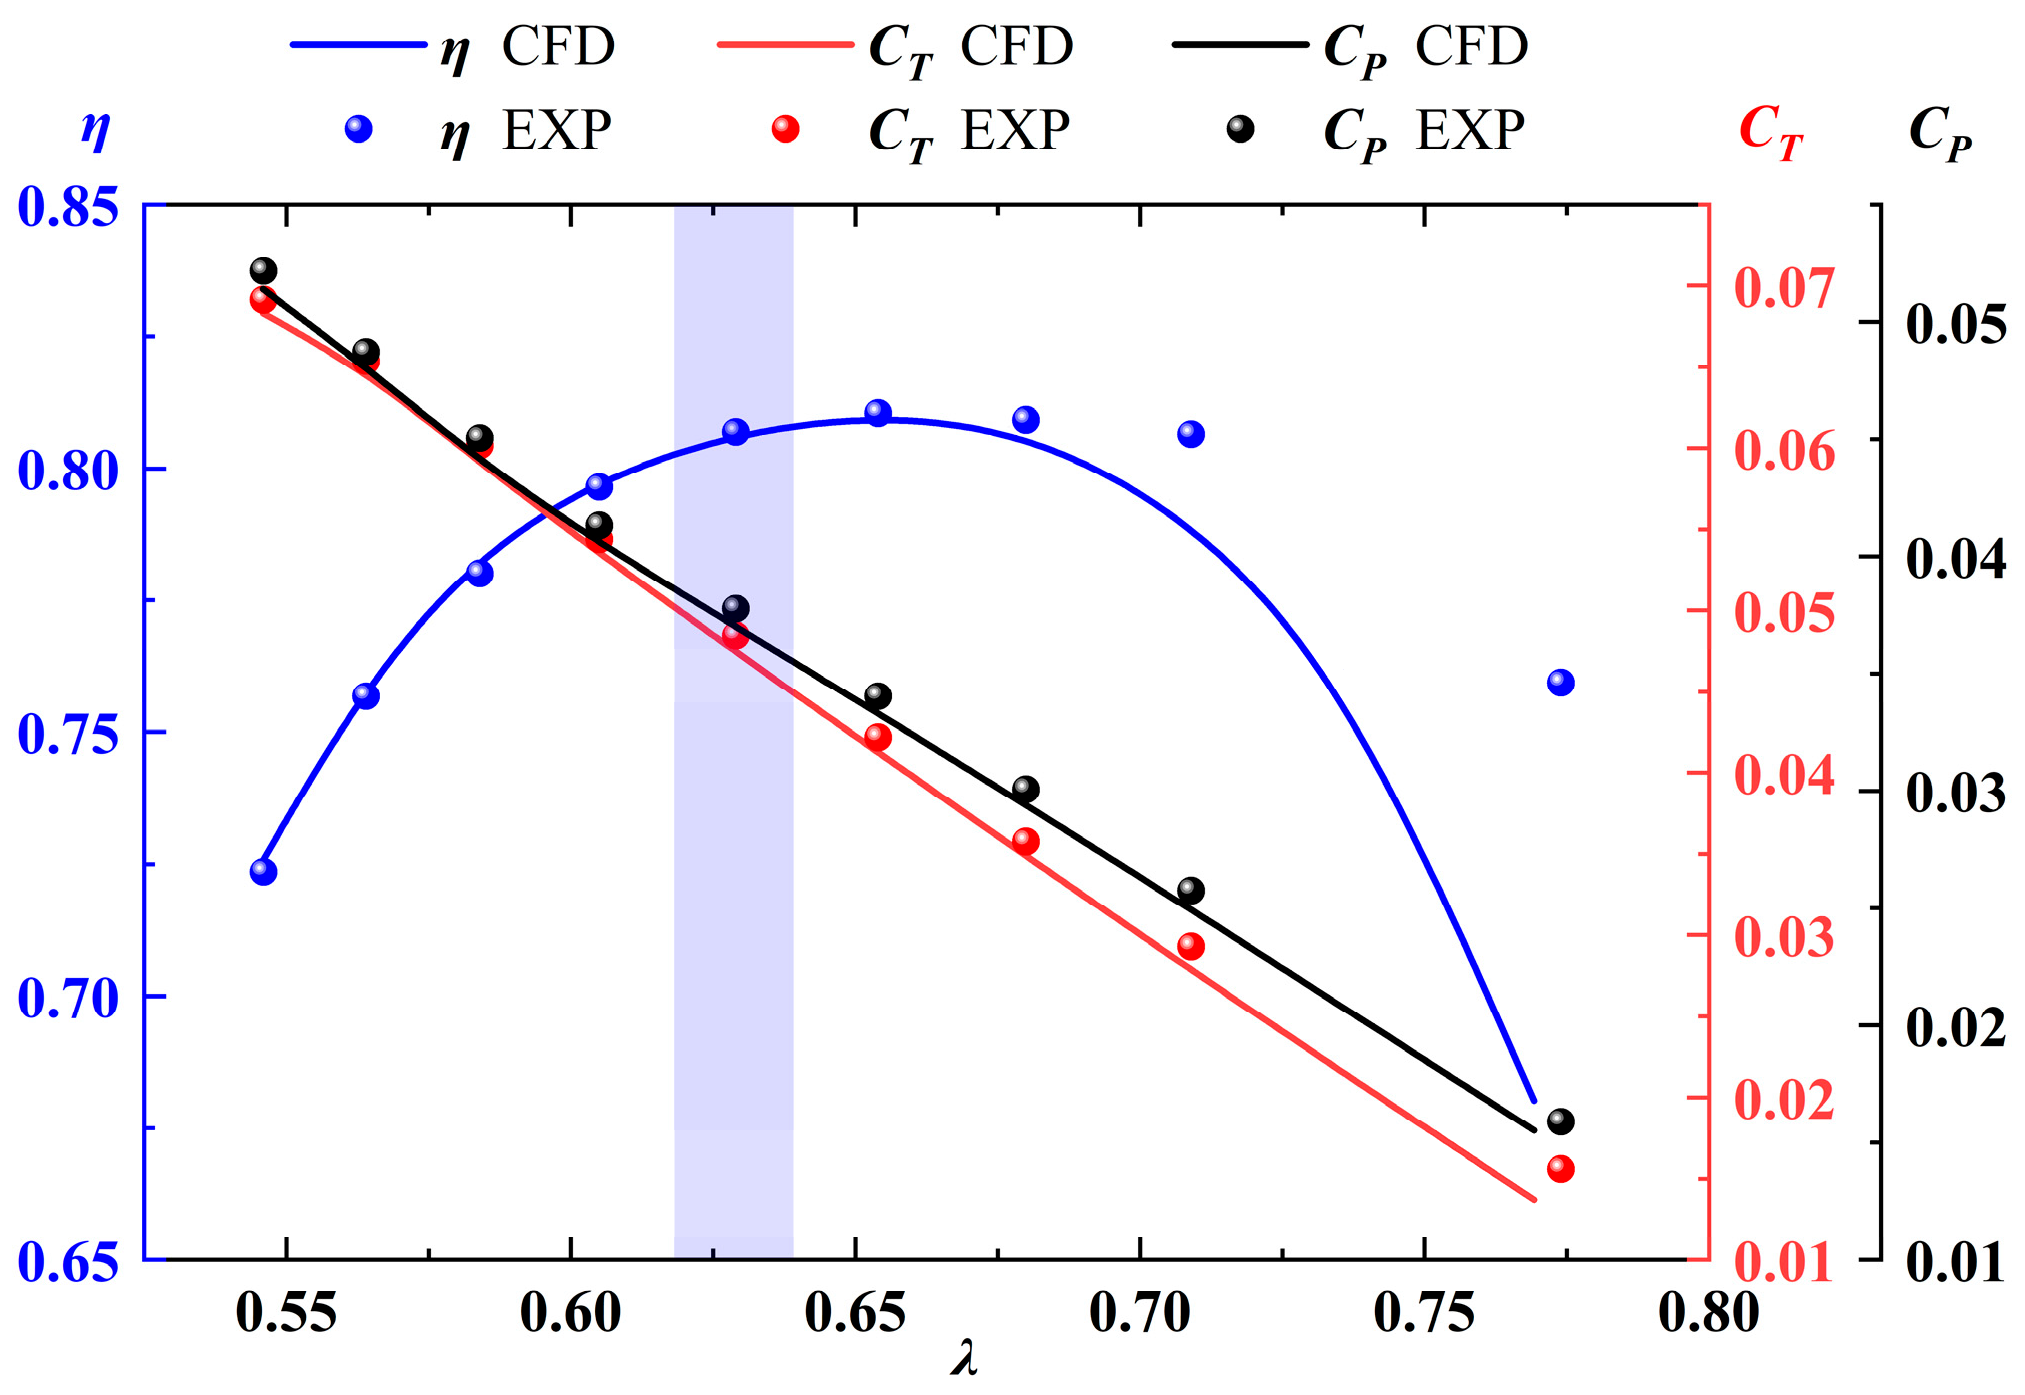
Figure 5.
Comparison of numerical predictions with experimental measurements.
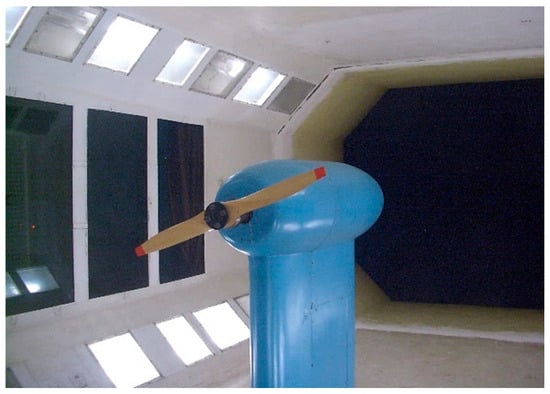
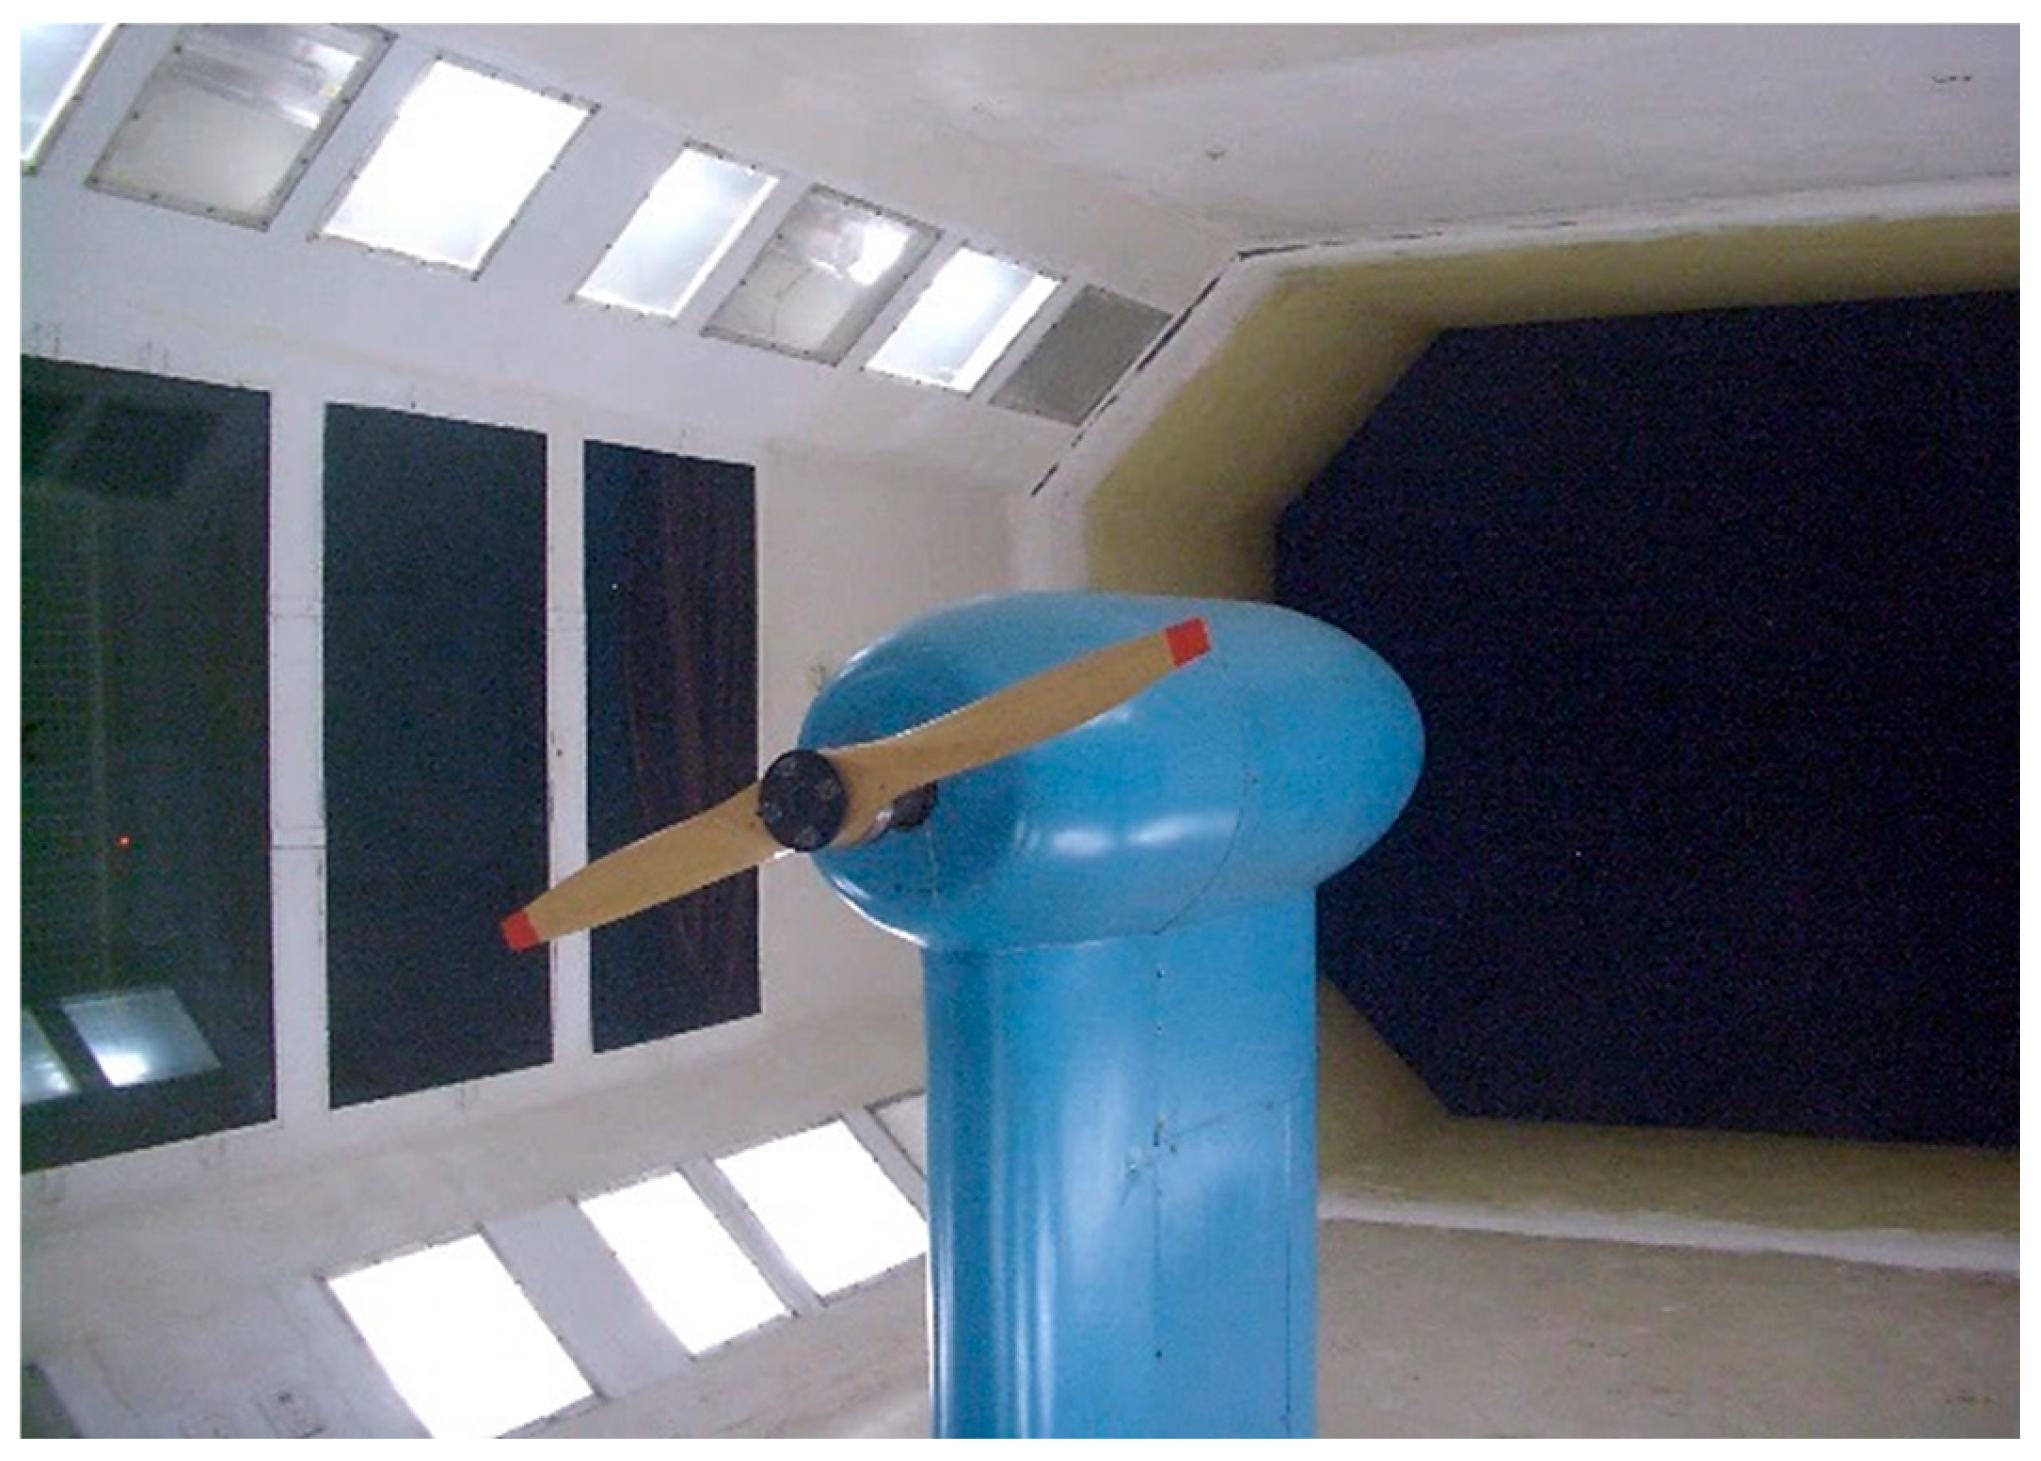
The reliability of the numerical method was assessed by comparing its predictions with wind-tunnel measurements. One design was selected for the wind-tunnel experiment, and the experimental setup is shown in Figure 6. The experiment was conducted in the three-dimensional test section of the NF-3 wind tunnel at Northwestern Polytechnical University at a freestream velocity of 55 m/s. To ensure geometric consistency between the numerical and experimental models, the support geometry used in the experiment was included in the CFD model. Figure 5 compares the numerical predictions with the experimental measurements. Overall, the two sets of results agree closely in both magnitude and trend. At high advance ratios, the absolute propeller thrust is small, but the predicted and measured thrust and power coefficients still agree closely. The apparent efficiency discrepancy at the highest advance ratio is amplified by the definition η = VT/P: because the denominator P is very small under this near-zero-loading condition, even a small deviation in the measured power produces a noticeable relative difference in efficiency, although the thrust and power coefficients themselves remain in close agreement. At the design point (λ ≈ 0.625), the numerical and experimental results also agree closely, supporting the reliability of the numerical method used in this study. It is worth noting that both the thrust and the power coefficients vary almost linearly with the advance ratio in Figure 5. This behavior has a clear physical origin: according to blade element theory, the local angle of attack of a blade element is α = β − arctan[λ/(π r/R)], which decreases nearly linearly as λ increases over the operating range examined; since the blade sections operate under attached flow in this range, the sectional lift—and hence the integrated thrust and torque—varies approximately linearly with λ. Similar quasi-linear CT–λ and CP–λ characteristics are commonly observed for fixed-pitch propellers at moderate advance ratios. The wind-tunnel experiment described above constitutes the experimental validation of the numerical procedure used to establish the database: the same geometry, support, and operating conditions were reproduced in the CFD model, and the measured and computed thrust coefficient, power coefficient, and efficiency agree closely over the whole advance-ratio range, with a relative deviation at the design point below 2%.
Figure 6.
Propeller wind tunnel experiment.
The performance coefficients used in this study follow the standard definitions in propeller aerodynamics [2]:
where V, n, d, T, and P denote, respectively, the freestream velocity, propeller rotational speed, propeller diameter, thrust, and power.
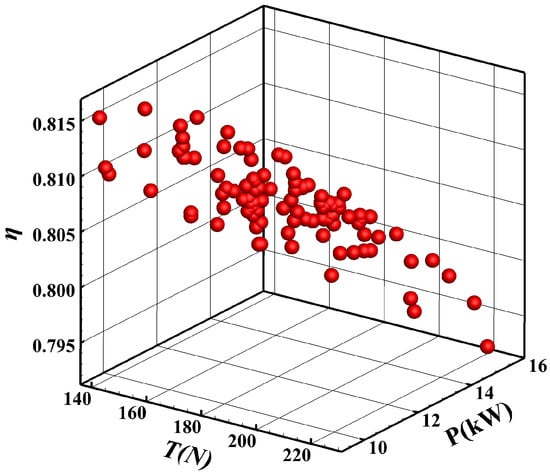
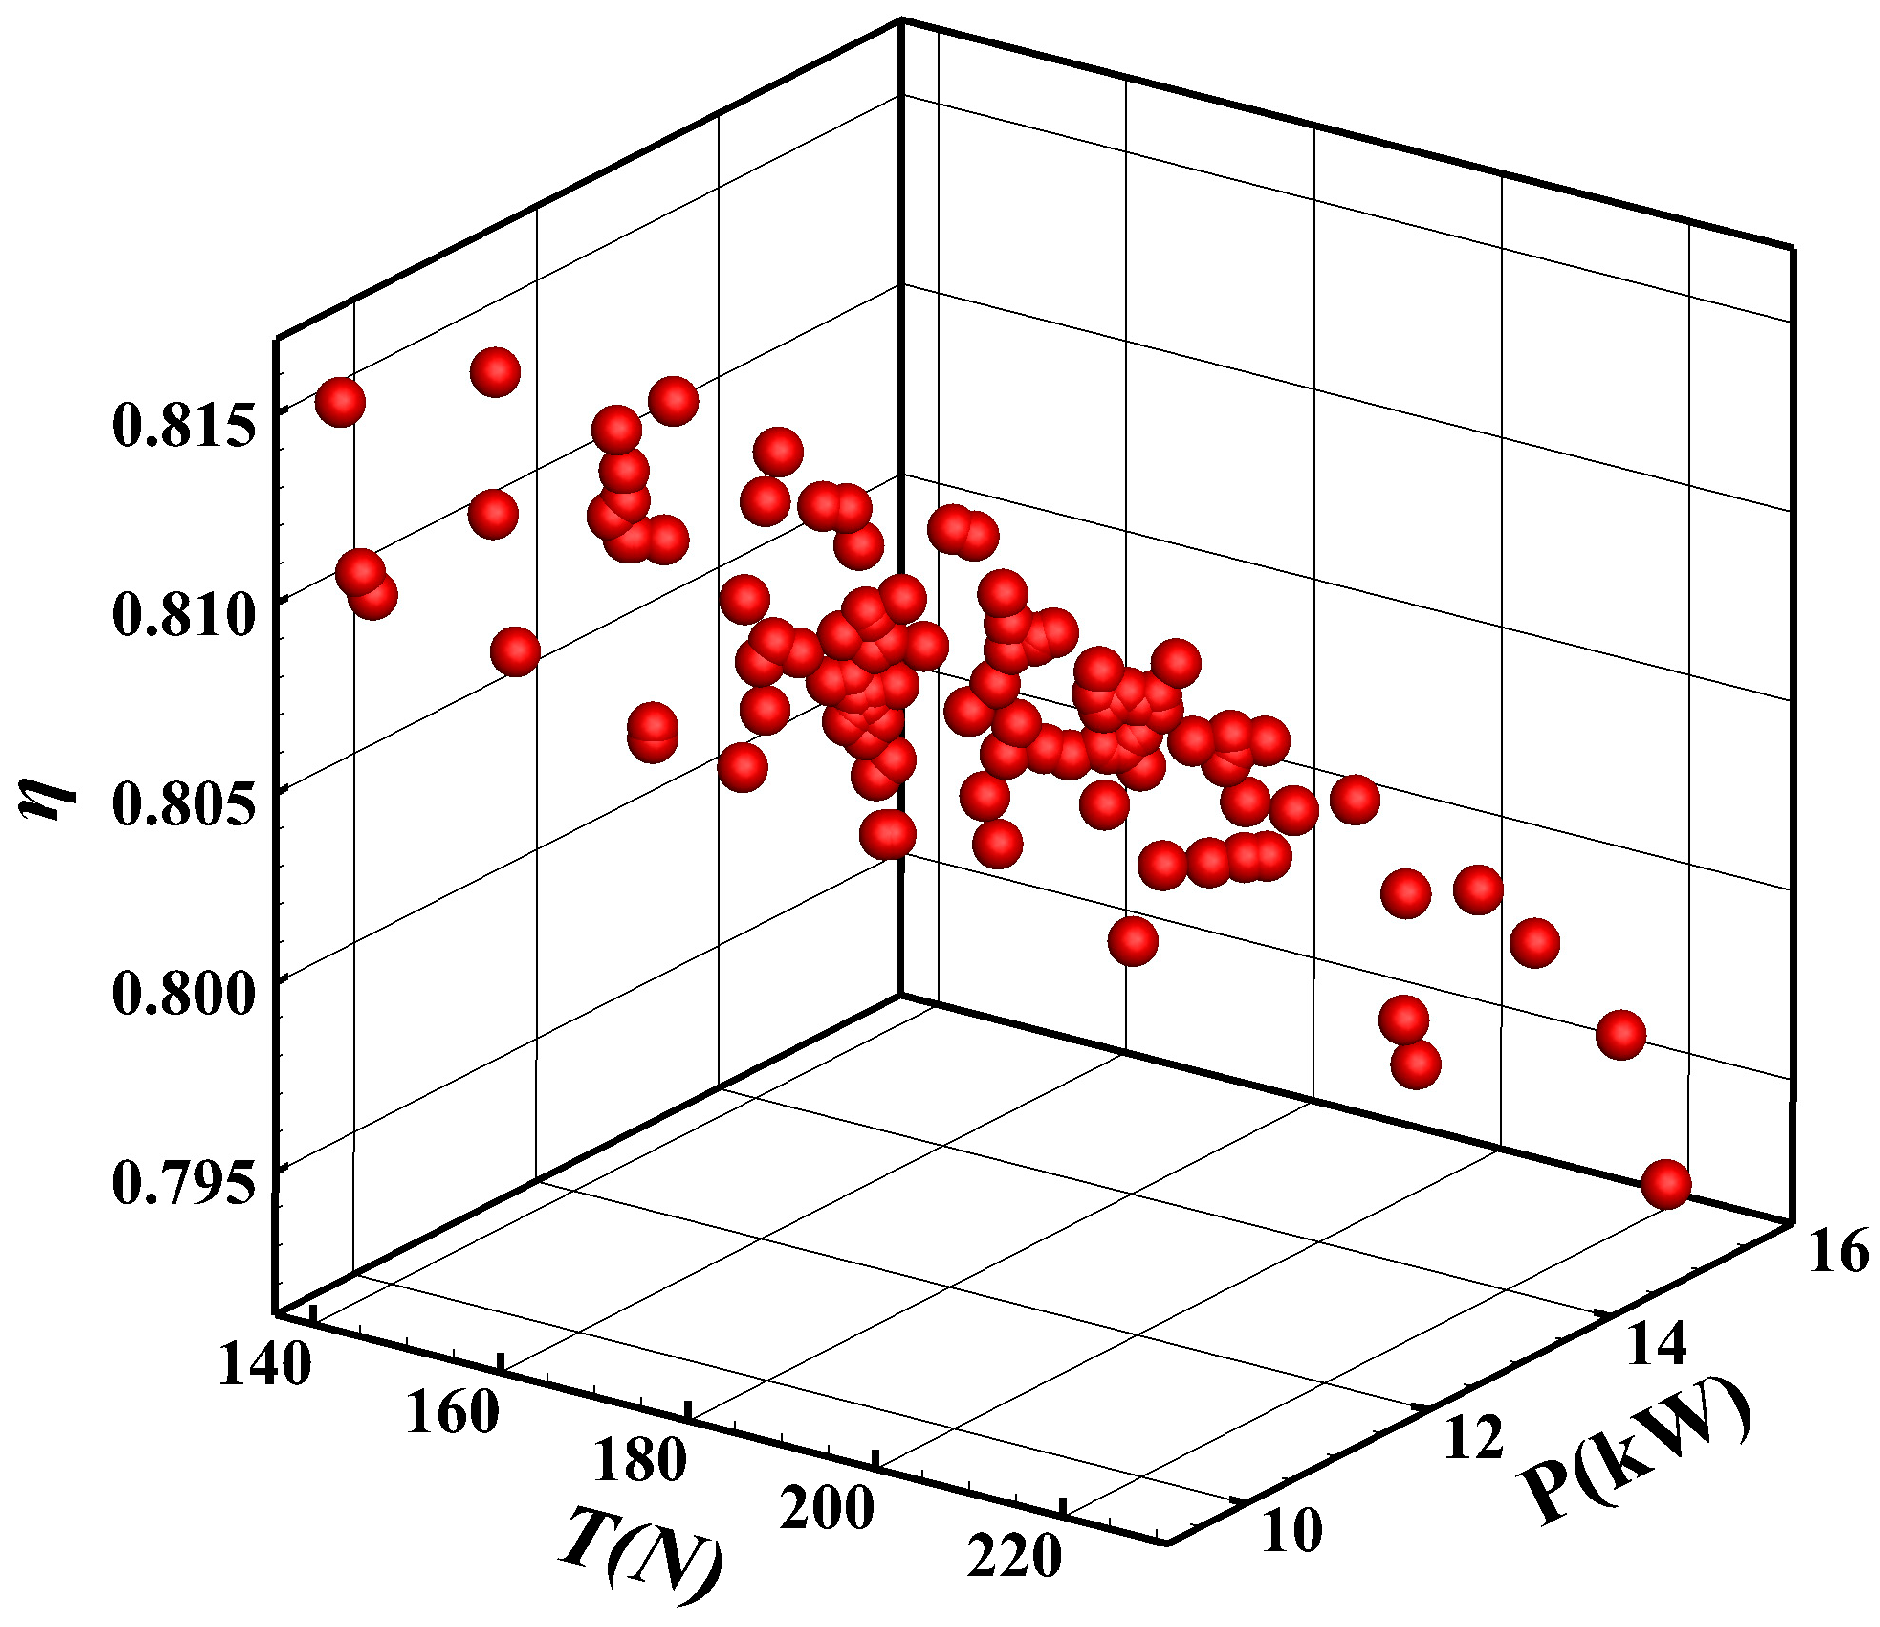
The performance distributions of all designs are shown in Figure 7.
Figure 7.
Aerodynamic performance distri bution of propeller designs.
2.2. Linear Correlation Coefficient
The Pearson product-moment correlation coefficient measures the strength and direction of the linear relationship between two variables [32]. Unless explicitly stated otherwise, all subsequent correlation coefficients in this paper are Pearson correlation coefficients.
The correlation coefficient between the two variables X and Y is defined as follows [32]:
where cov(X,Y) is the covariance between X and Y, and σX and σY represent the standard deviations of X and Y, respectively.
The strength of the correlation between variables is generally determined based on the absolute value of the correlation coefficient. The closer the coefficient is to 1 or −1, the stronger the correlation; the closer it is to 0, the weaker the correlation. The following ranges are typically used to classify the strength of the correlation: a coefficient between 0.75 and 1.00 represents a strong correlation, while a coefficient between 0.3 and 0.7 represents a moderate correlation. A coefficient less than 0.3 indicates a weak correlation [33].
2.3. Hierarchical Clustering
The hierarchical clustering algorithm [34,35] is a clustering method that categorizes n samples into k (k < n) clusters based on a clustering criterion. This algorithm performs the clustering process step by step, beginning with multiple clusters and gradually reducing them until the desired classification is achieved. The iterative process of this algorithm comprises the following steps:
- Step 1: Start with n samples, each forming its own cluster (identical samples are merged beforehand), giving n clusters , , … , where the superscript denotes the iteration index. The primary objective of this step is to calculate the inter-cluster distances (distances between clusters), resulting in amn n × n inter-cluster distance matrix L0. Then, repeat the following steps (m ≥ 2) in a loop.
- Step m: Identify the minimum element in the inter-cluster distance matrix Lm−1 (excluding diagonal elements, as all diagonal elements are zero). If this minimum element corresponds to and , then merge and into one cluster, resulting in a new classification , , … At the same time, calculate the inter-cluster distance matrix Lm. If the minimum element in Lm (excluding diagonal elements) is greater than the threshold value, the algorithm terminates, and the resulting classification is the clustering result. Otherwise, proceed to step m + 1.
- Step m + 1: Repeat Step m.
- Final step: The clusters remaining after termination are numbered 1, 2, 3, …
In this study, the efficiency factor is used as the metric for assessing propeller performance during rule discovery. Hierarchical clustering is therefore applied to the efficiency-factor values to divide them into several categories. The initial number of clusters corresponds to the number of propeller designs. Given that the efficiency factor is a one-dimensional variable, Euclidean distance is adopted to define the inter-cluster distance. If cluster k is formed by merging clusters i and j, its distance to another cluster h is defined as [35]:
By applying the aforementioned algorithm, the efficiency factors of all propeller designs in the database are ultimately categorized into three levels: high, medium, and low.
3. Derivation of Propeller Design Rules
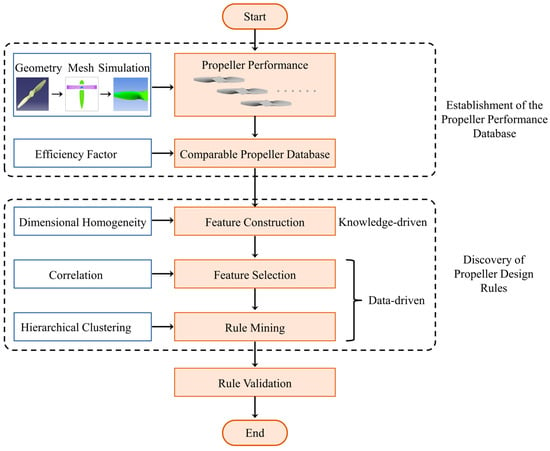
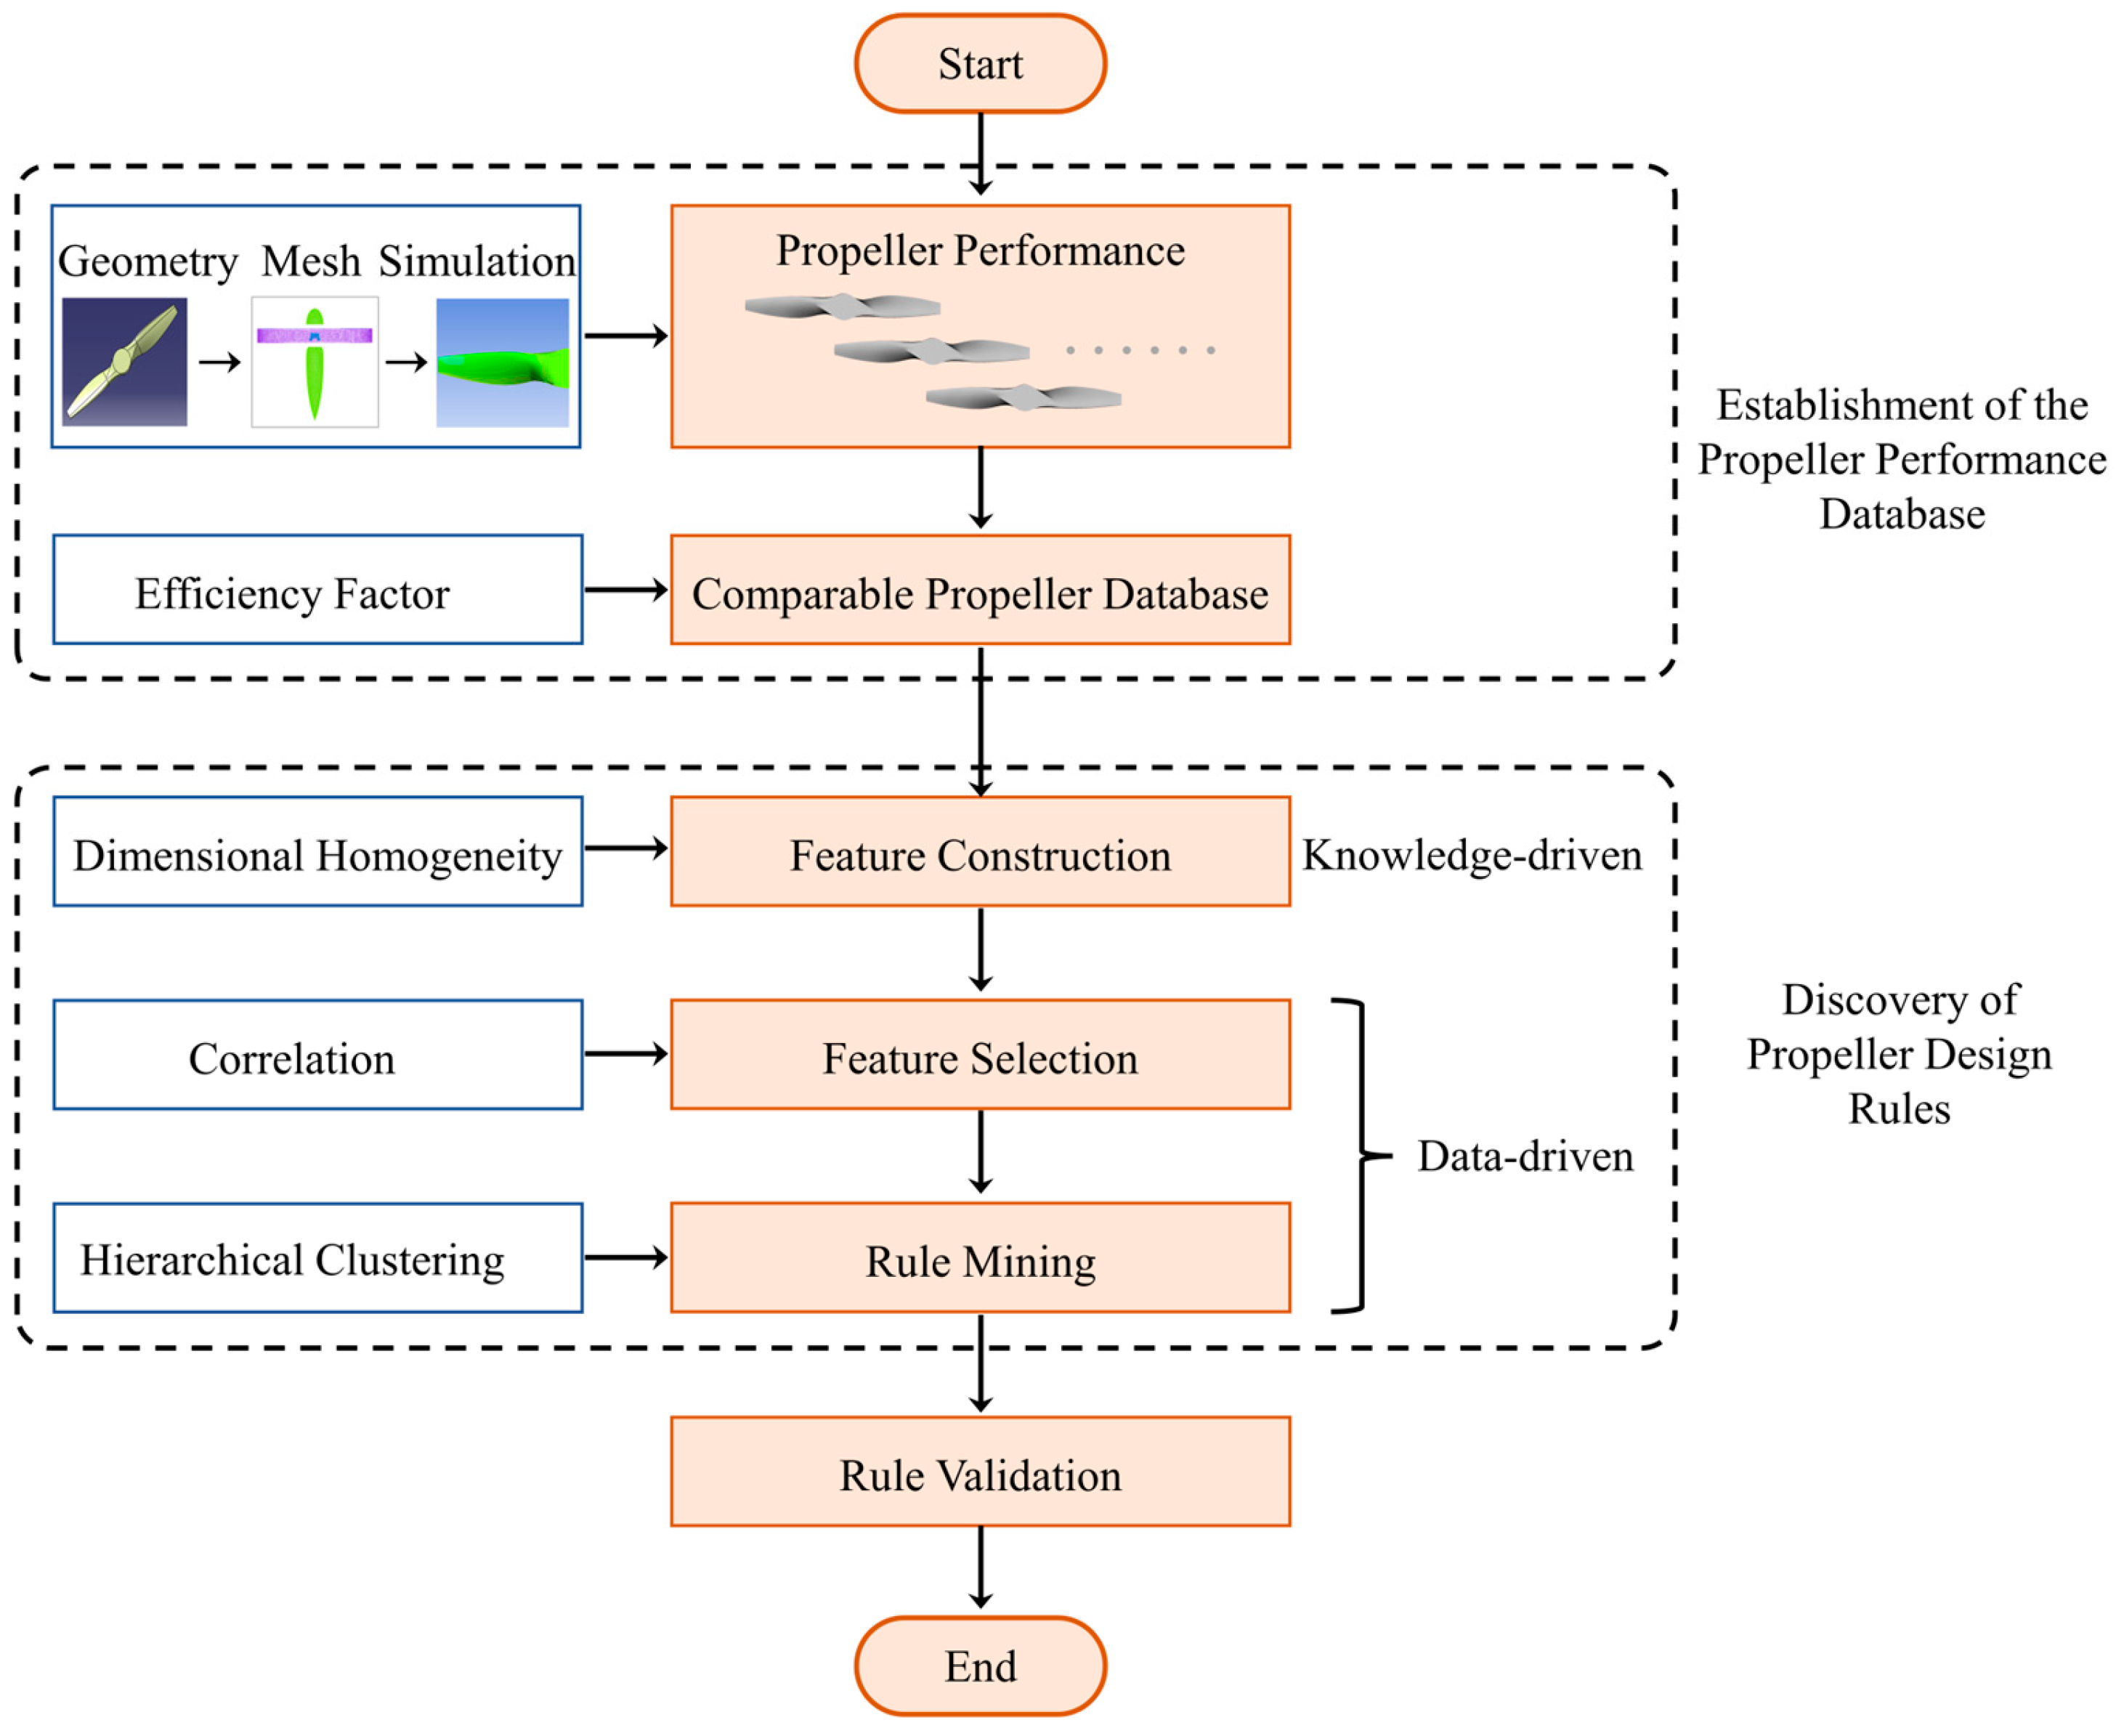
After establishing the propeller-performance database, an efficiency-factor-based criterion is introduced to improve the comparability of designs operating under different loading conditions, thereby increasing the pool of usable design data. To reduce the excessively large search space for candidate rule parameters, dimensionless composite features are constructed using dimensional homogeneity and screened by correlation analysis. The selected characteristic load ratios are then used to derive a propeller design rule, which is evaluated on multiple independent designs. Figure 8 illustrates the overall rule-discovery workflow described below.
Figure 8.
Workflow of the rule discovery method in this study.
3.1. Efficiency Factor
Propeller efficiency is a primary measure of aerodynamic performance. However, absolute efficiency alone is insufficient for comparing propellers operating under different loading conditions. Because ideal efficiency varies with loading, the same absolute efficiency does not necessarily represent the same level of design quality.
The ideal efficiency of a propeller is the maximum efficiency attainable under idealized conditions [36] and therefore provides a theoretical upper bound for a real design. It is defined as follows:
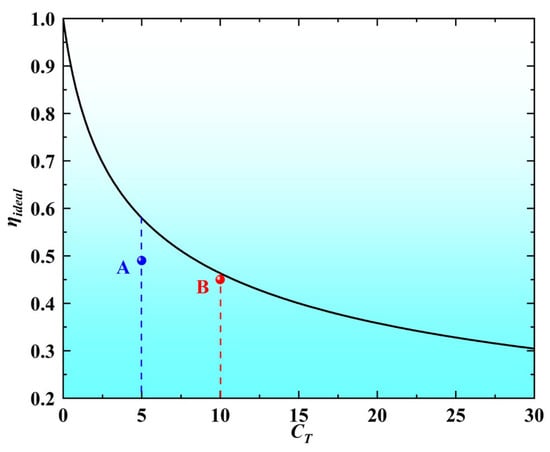
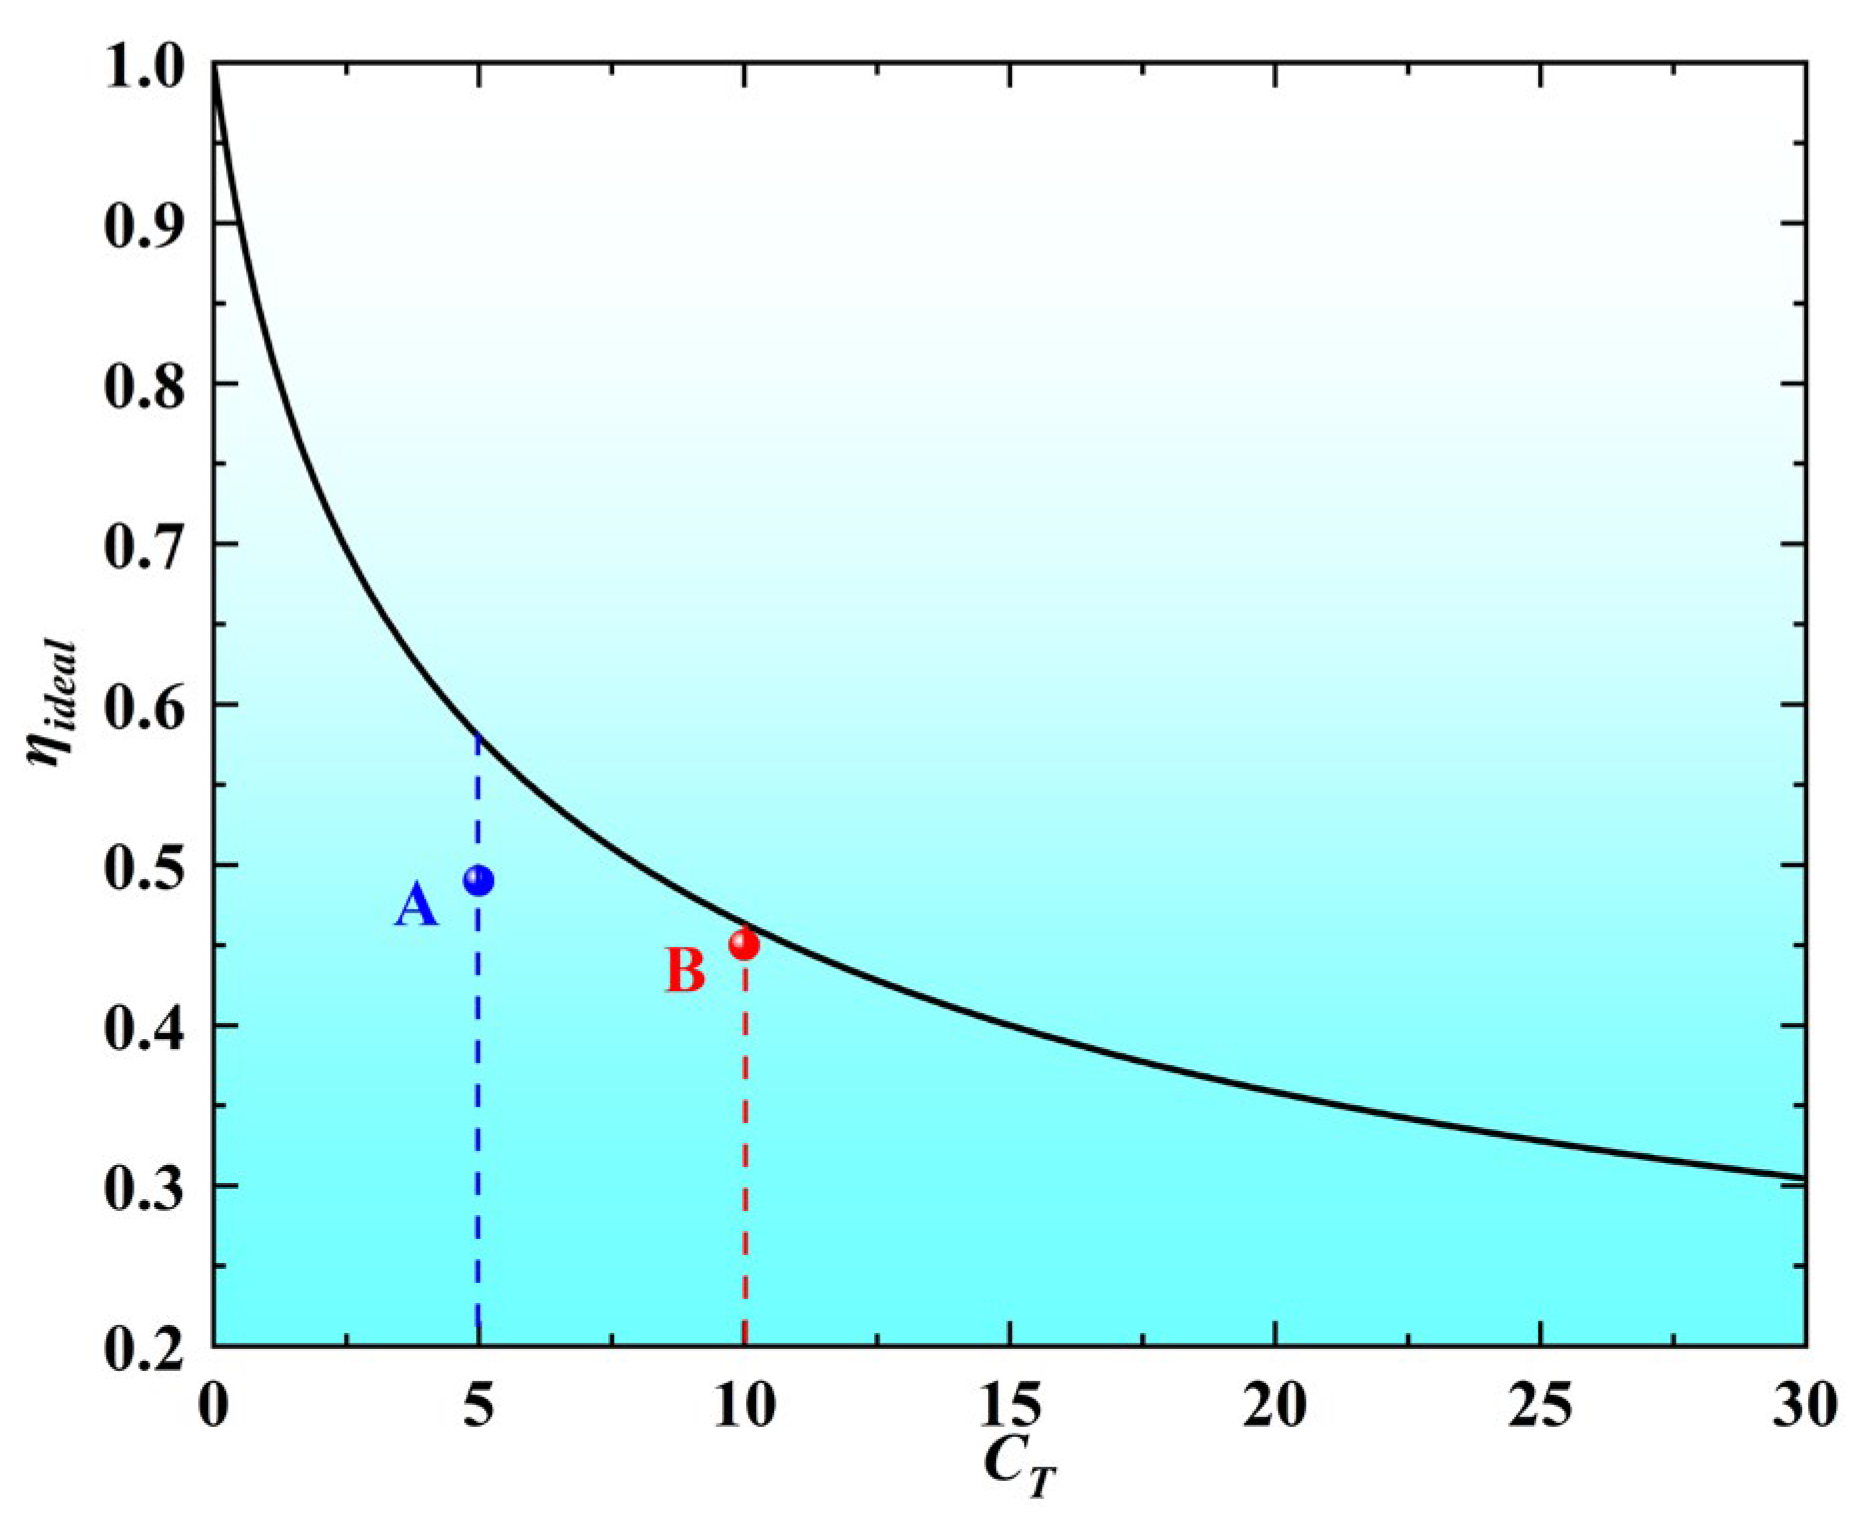
where τ = T/(qS) is the disk-loading coefficient, q is the dynamic pressure of the freestream and S is the propeller disk area. Equation (7) follows directly from the one-dimensional momentum (actuator-disk) theory: for an ideal, frictionless propeller in axial flow, the velocity increment in the fully developed slipstream is entirely induced, and momentum and energy conservation yield the ideal efficiency as a function of disk-loading thrust coefficient alone [26,36,37]. Because this theoretical upper bound depends on disk loading rather than on a particular geometry, it provides a suitable normalization reference for comparing designs operating under different loading conditions. The relationship between ideal efficiency and thrust coefficient is demonstrated in Figure 9. It can be observed that the ideal efficiency of the propeller diminishes as the thrust coefficient increases. Consider two designs, A and B: design A has the higher absolute efficiency, yet it falls short of the ideal efficiency at its own thrust coefficient, whereas design B, although slightly less efficient, operates very close to the ideal efficiency at its thrust coefficient. Therefore, efficiency alone is not an appropriate criterion for comparing propellers designed for different loading conditions.
Figure 9.
The relationship between ideal efficiency and thrust coefficient of the propeller.
In a previous study [38], to ensure the comparability of efficiency among different propeller designs, only designs with thrust coefficients close to each other were selected for study. Specifically, designs with a positive deviation of less than 5% from the design thrust requirement were selected for comparison. As a result, fewer than 4% of the designs remained usable for comparison.
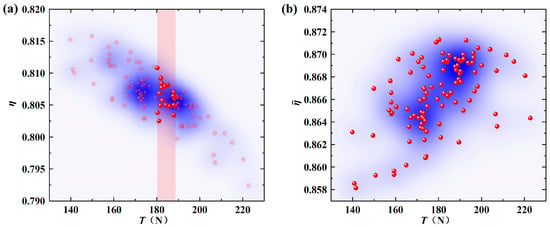
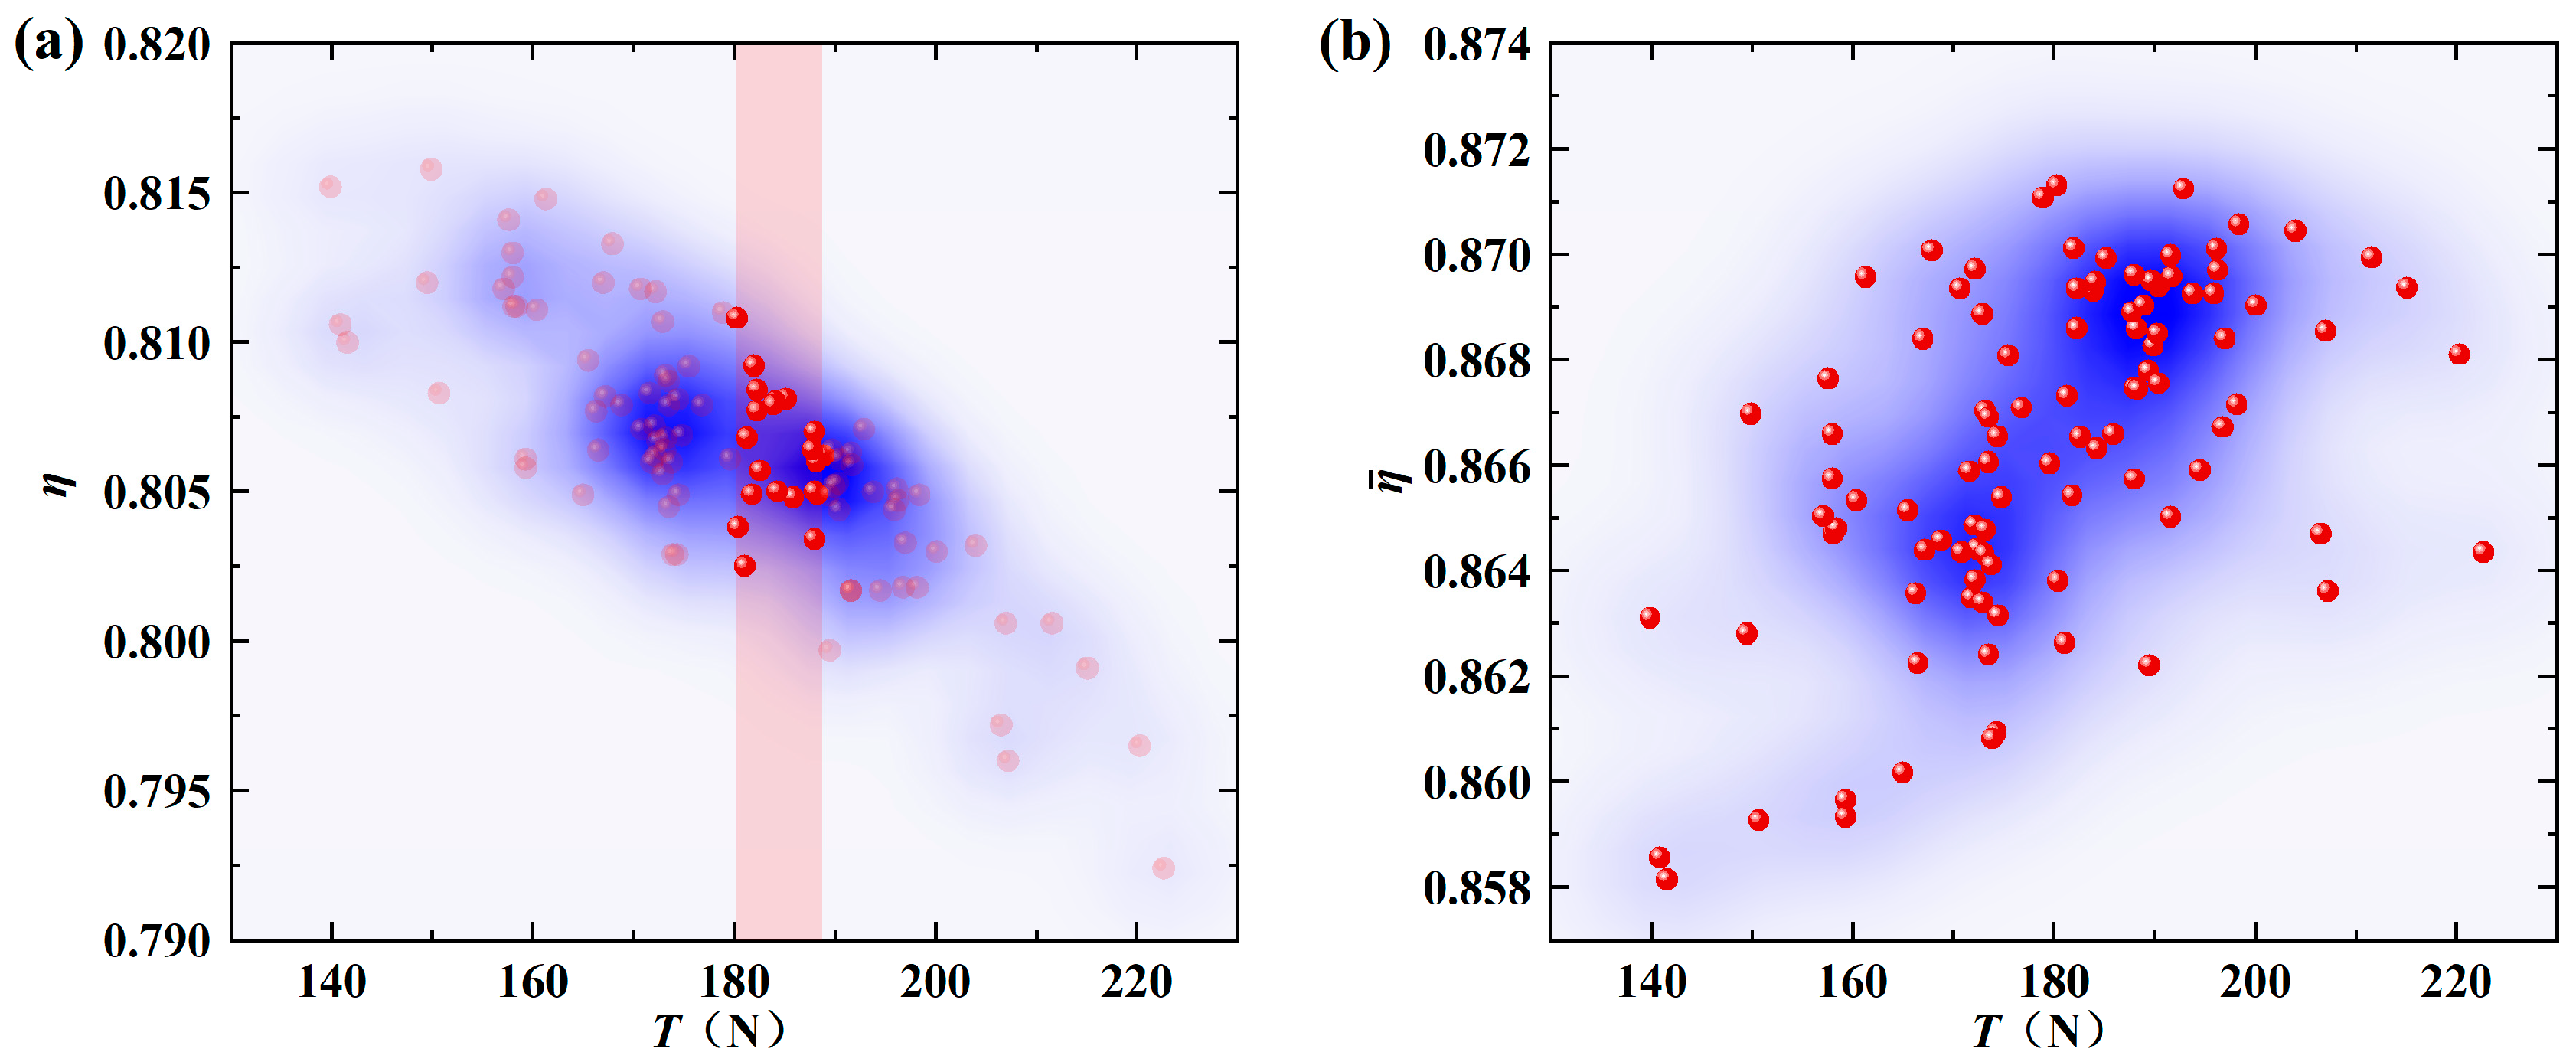
Similarly, in this study, the 103 propeller designs also exhibit varying thrust values, leading to the same challenge of comparing their performance based on efficiency. As illustrated in Figure 10a, the propeller efficiency decreases significantly as the thrust increases, which makes it difficult to directly compare the performance of different designs based on efficiency.
Figure 10.
Variation in the performance of the propeller designs with thrust. (a) Variation in efficiency with thrust; (b) variation in efficiency factor with thrust.
An evaluation criterion applicable to propellers with different thrust coefficients would make full use of the existing design data and provide a solid data basis for data mining. To address this need, this study introduces the concept of the efficiency factor as an evaluation criterion for propellers. It is defined as follows:
The efficiency factors for all designs are shown in Figure 10b. The efficiency factor exhibits no appreciable correlation with the thrust, thereby reducing the thrust-dependent trend and providing a more consistent basis for comparing all designs in the database. By incorporating ideal efficiency into the evaluation criterion, this approach enables performance comparisons across loading conditions and allows the available design data to be used more fully. Physically, normalizing actual efficiency by the ideal efficiency at the same disk loading reduces the direct influence of disk loading and makes the efficiency factor more reflective of avoidable losses, including induced losses associated with a non-optimal load distribution and profile losses associated with blade-section drag. Two designs with the same efficiency factor therefore achieve the same fraction of their respective ideal efficiencies, even when their thrust levels differ. Using raw efficiency, only the 21 designs with thrust coefficients close to the design value could be compared directly; the efficiency factor instead provides a common comparison basis for all 103 designs, expanding the usable database from 21 to 103 designs.
3.2. Knowledge-Driven Feature Construction
The radial load distribution is an important characteristic of a propeller, and it is therefore useful to examine whether a design rule can be derived directly from this distribution. The spanwise region from 0.3R to 1.0R of each blade was divided into seven equal segments, and the corresponding spanwise load distribution was extracted. The segment thrusts are denoted by T1, T2, …, T7 from root to tip. The Pearson correlation coefficients between the thrust of each segment and the efficiency factor were calculated using Equation (5), and the results are listed in Table 2. The correlation coefficients for the tip segments approach the strong-correlation regime defined in Section 2.2 and are markedly higher than those of all other segments (≤0.4861). This finding is consistent with the established understanding that the blade-tip region plays a major role in determining propeller efficiency.
Table 2.
Pearson correlation coefficients between the thrust of each blade segment and the efficiency factor.
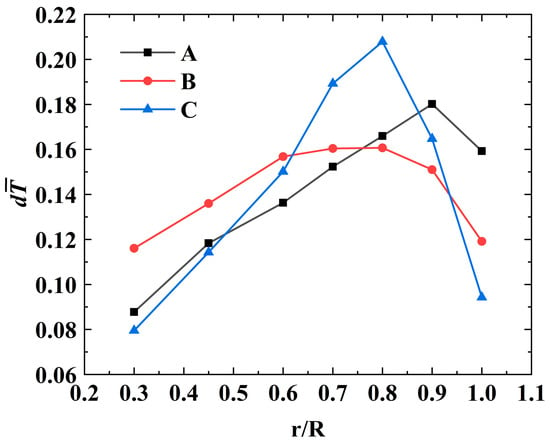
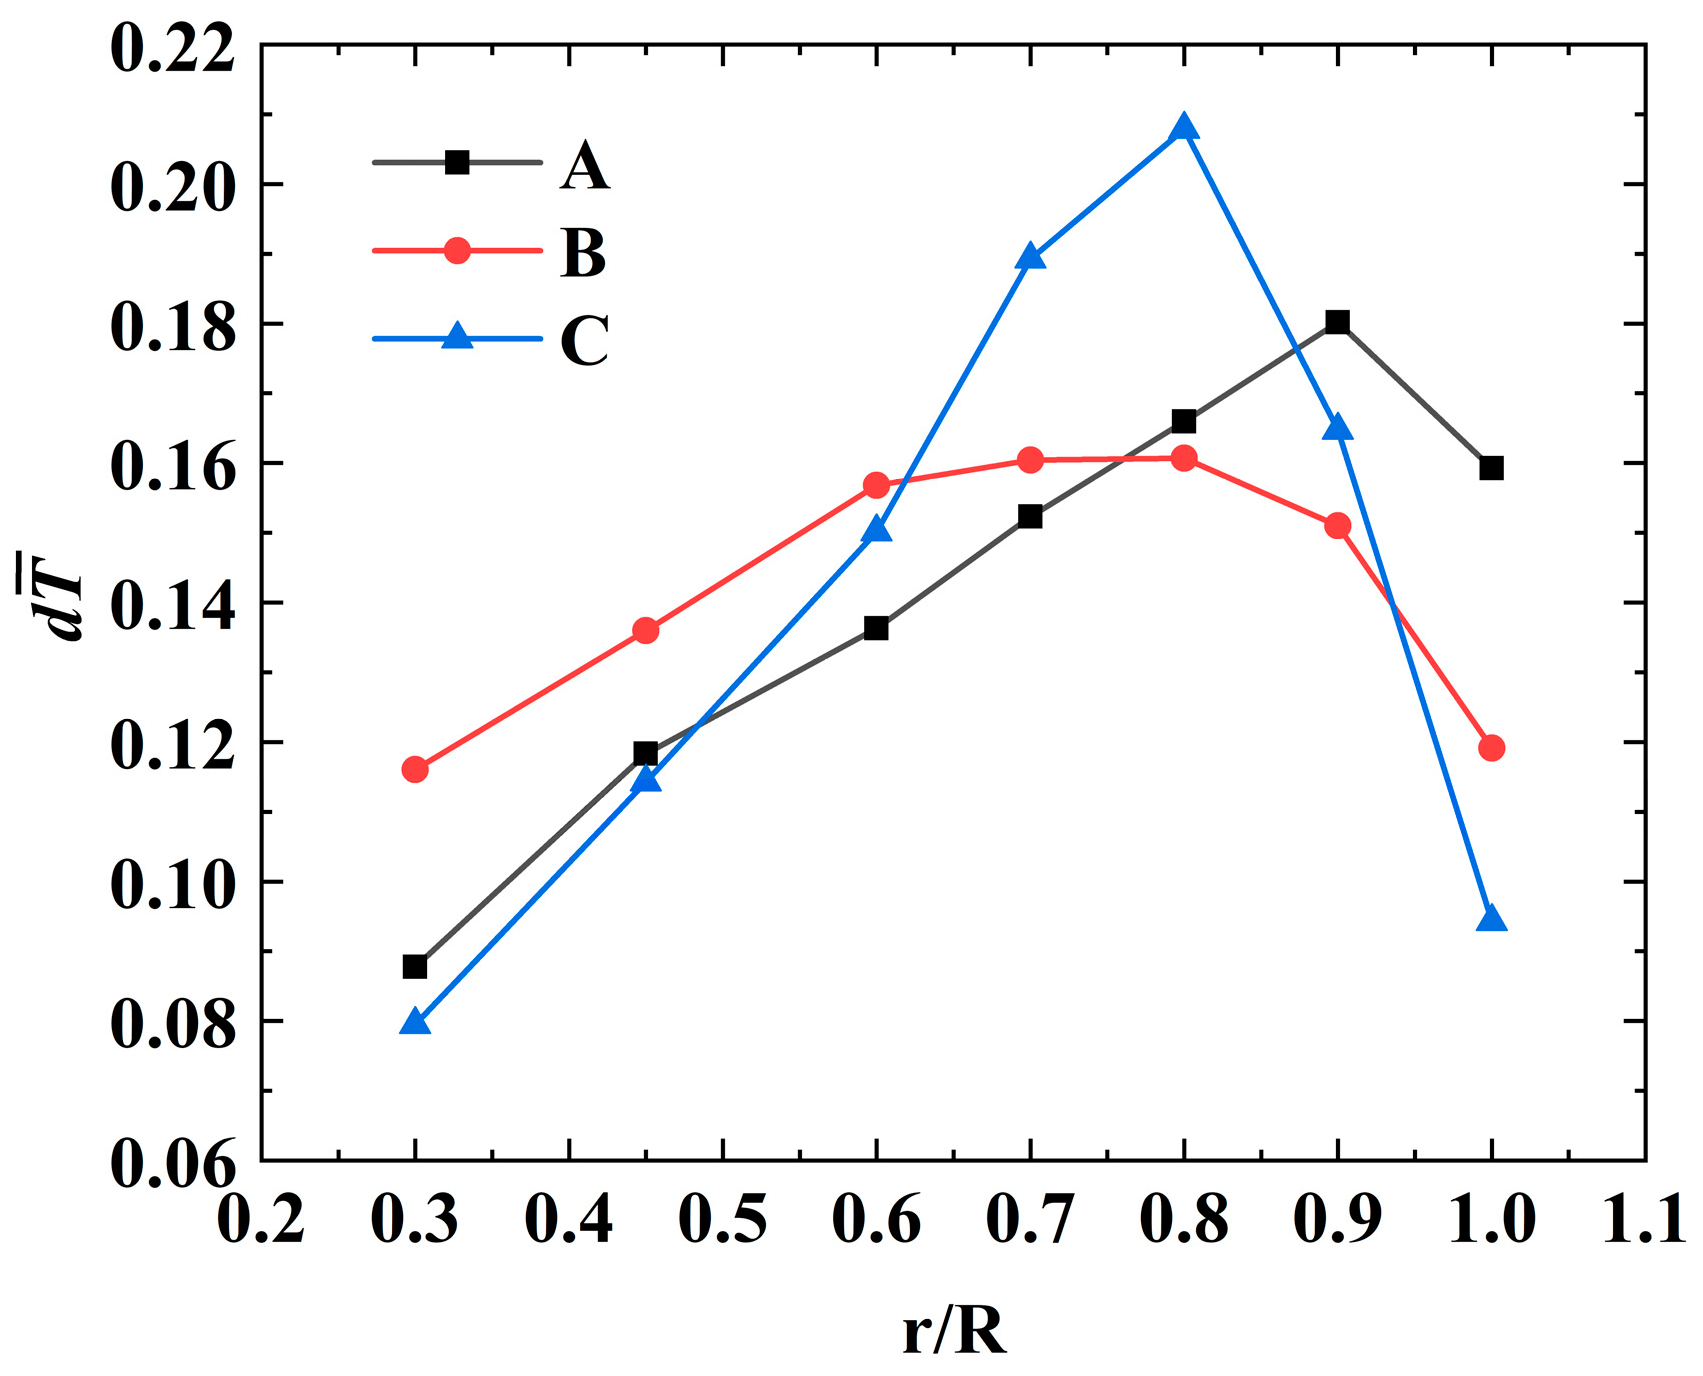
In our previous study, three designs with distinct radial load distributions were developed by optimizing the load distribution of a specific propeller (key parameters listed in Table 3). All three designs used the same airfoils and had nearly the same design-point thrust coefficient (Table 4), differing only in their radial load distributions (Figure 11). Design A exhibited high tip loading, Design B moderate tip loading, and Design C low tip loading. Despite these substantial differences in tip loading, their efficiencies differed only slightly (0.664–0.671), indicating that tip loading alone did not strongly affect efficiency in these cases. The three designs were intentionally optimized to span the widest achievable range of tip loading under the same thrust coefficient—from high (Design A) through moderate (Design B) to low (Design C) tip loading—so that the influence of the radial load distribution alone could be isolated; accordingly, the three curves differ mainly in the tip region. The load distributions are plotted against the non-dimensional radius r/R in Figure 11, with the sectional thrust normalized by the total thrust of each design.
Table 3.
Key parameters of the propeller.
Table 4.
Performance of three propeller designs.
Figure 11.
Load distribution of three propeller designs (the sectional thrust of each design is normalized by its total thrust).
To avoid reliance on empirical assumptions and to identify the factors that actually govern propeller efficiency, new feature parameters are constructed and the key influencing factors of propeller aerodynamic performance are explored with data-driven methods.
Consequently, new features must be constructed from raw data. Although numerous methods exist for feature construction, if the search space is left unrestricted, even a small set of elementary variables and common operators can lead to a combinatorial explosion of features, whose number grows exponentially with the number of variables and operators. Many of these automatically generated features would be irrelevant, and with a database of limited size, screening them out is difficult and burdens the subsequent feature engineering. Therefore, when the available design data are limited in quantity but physically reliable, knowledge-guided feature construction becomes particularly important.
Dimensional analysis is a widely used method in the natural sciences to uncover regularities in physical phenomena. In the field of aerodynamics, the construction of dimensionless parameter groups and the derivation of similarity criteria by means of dimensional analysis have long been important research tools. Dimensional analysis can also be used to check the dimensional consistency of equations during knowledge discovery [39]. Guided by dimensional homogeneity, dimensionless composite features are constructed by dividing the thrust of one segment by that of another, Ti/Tj, where i, j = 1, 2, …, 7 and i ≠ j. This procedure yields 42 ordered ratio features.
3.3. Data-Driven Feature Selection and Rule Extraction
Forty-two dimensionless composite features were generated using the principle of dimensional homogeneity. However, the resulting dimensionality remains too high for rule extraction. The available propeller-performance data are therefore used for feature selection to remove irrelevant, redundant, or noisy features from the original set.
In general, feature selection techniques can be classified into three types: filter methods, wrapper methods, and embedded methods. Filter methods evaluate the relevance of each feature to the response variable independently of any model—for example, by computing the correlation between them—and filter out the features whose correlation is below a given threshold. In this study, a filter method is adopted for feature selection.
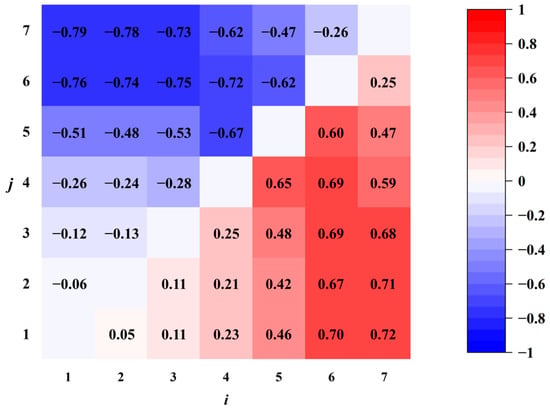
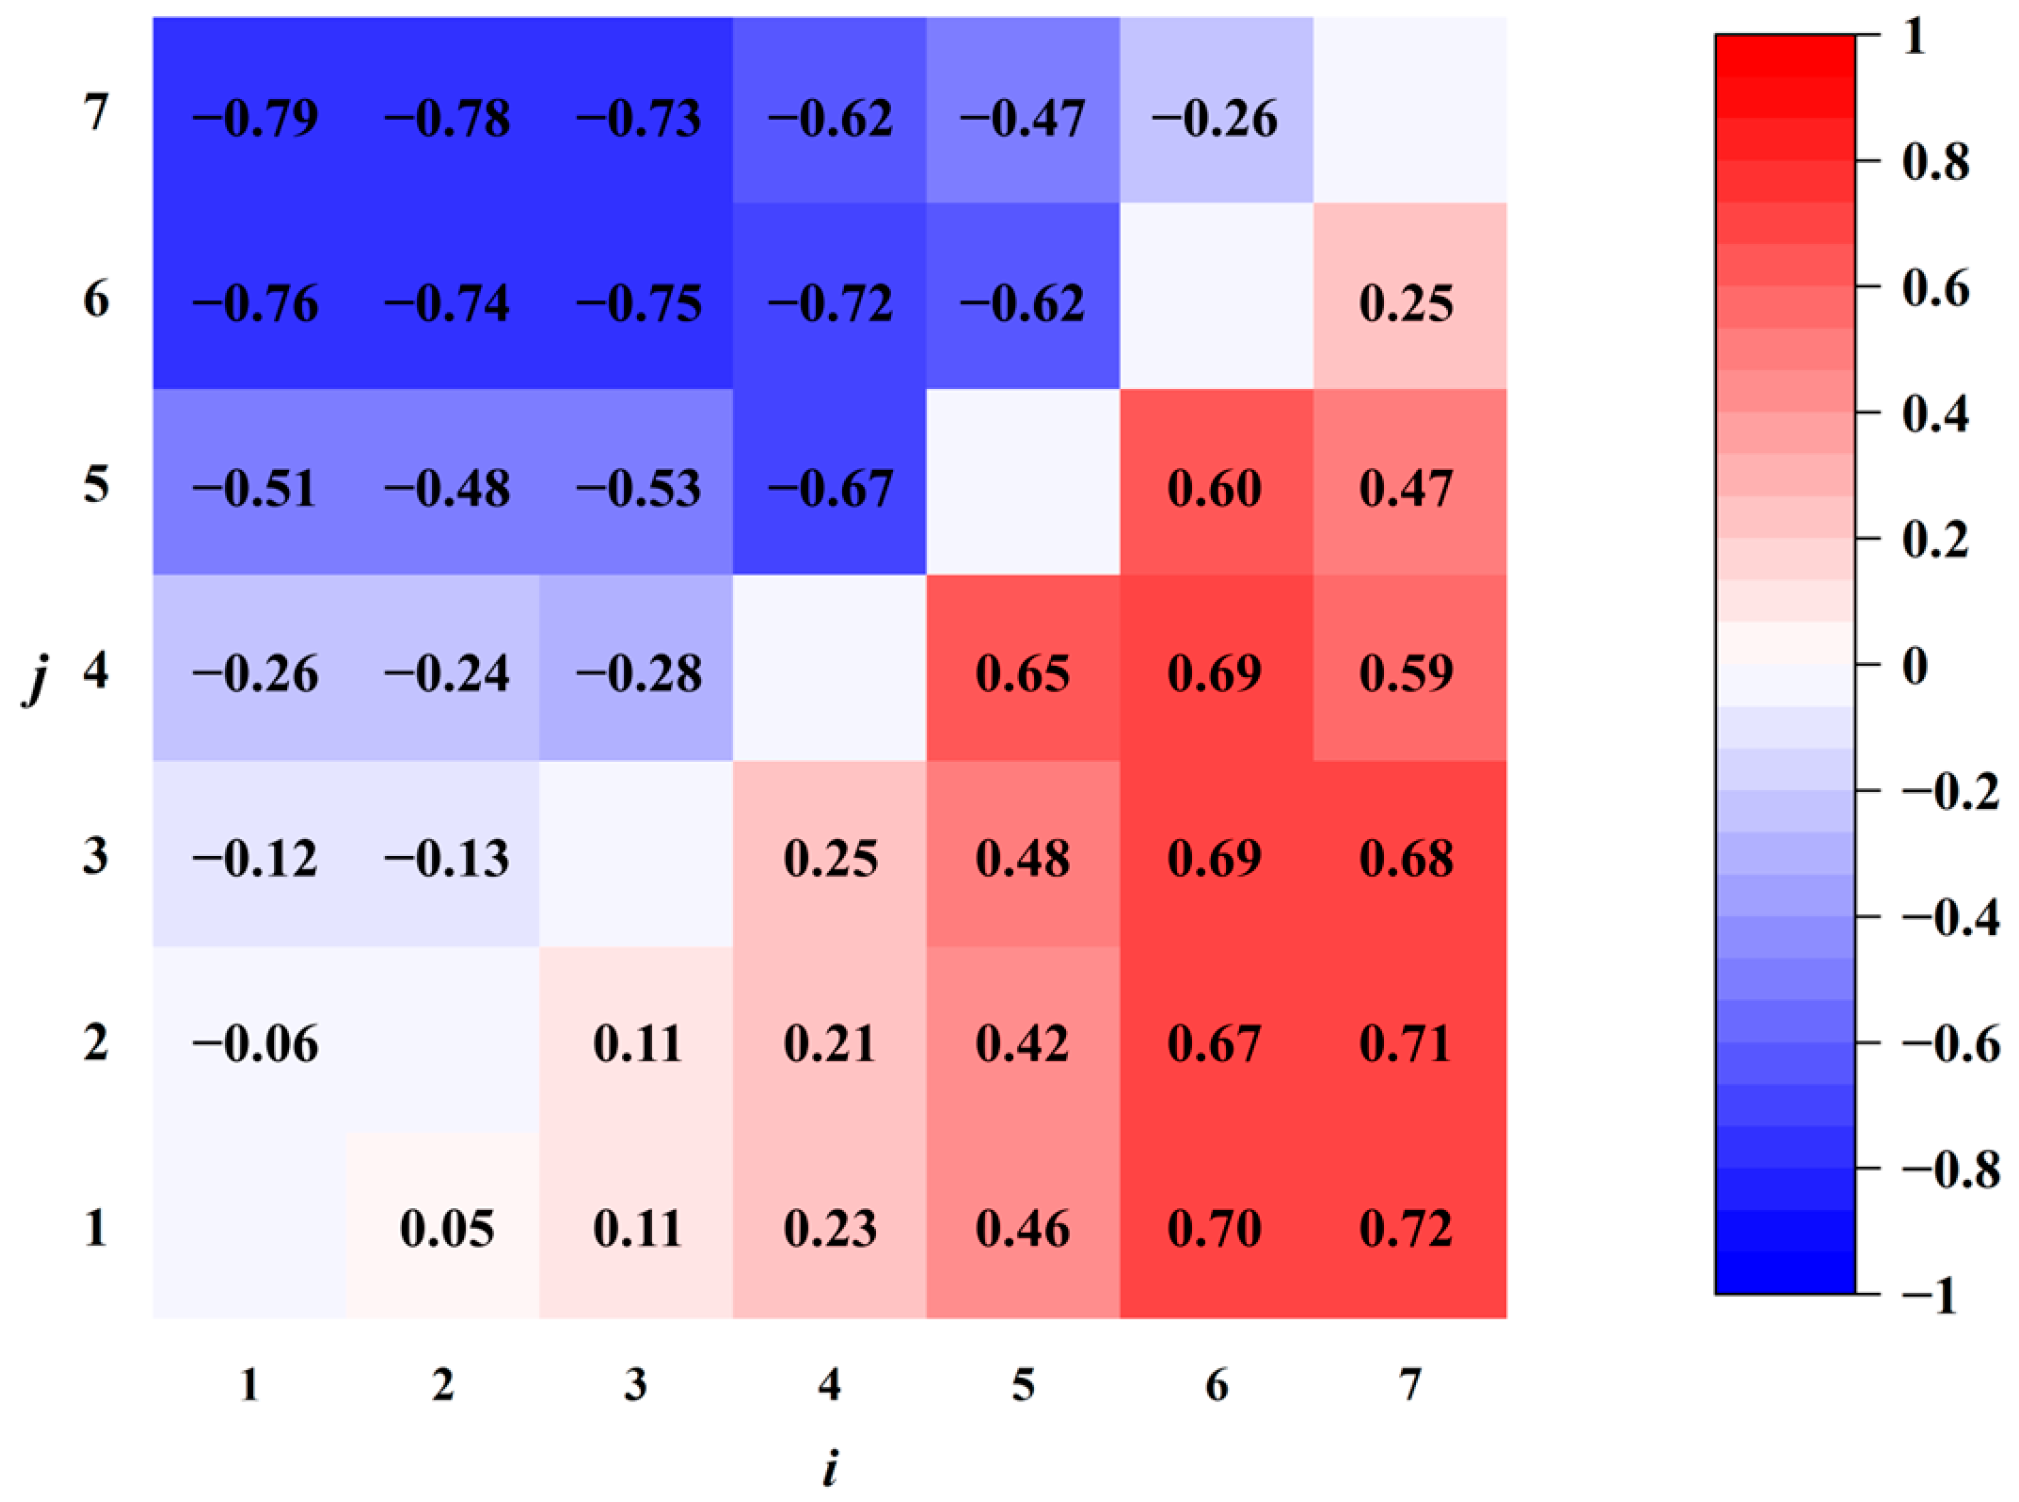
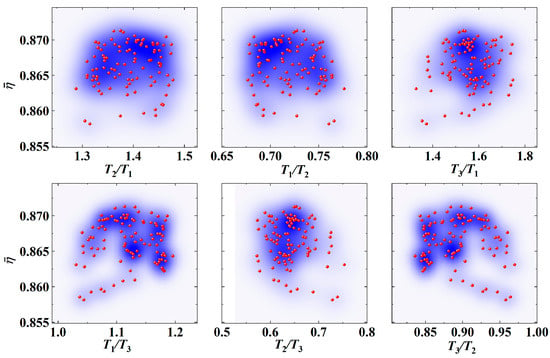
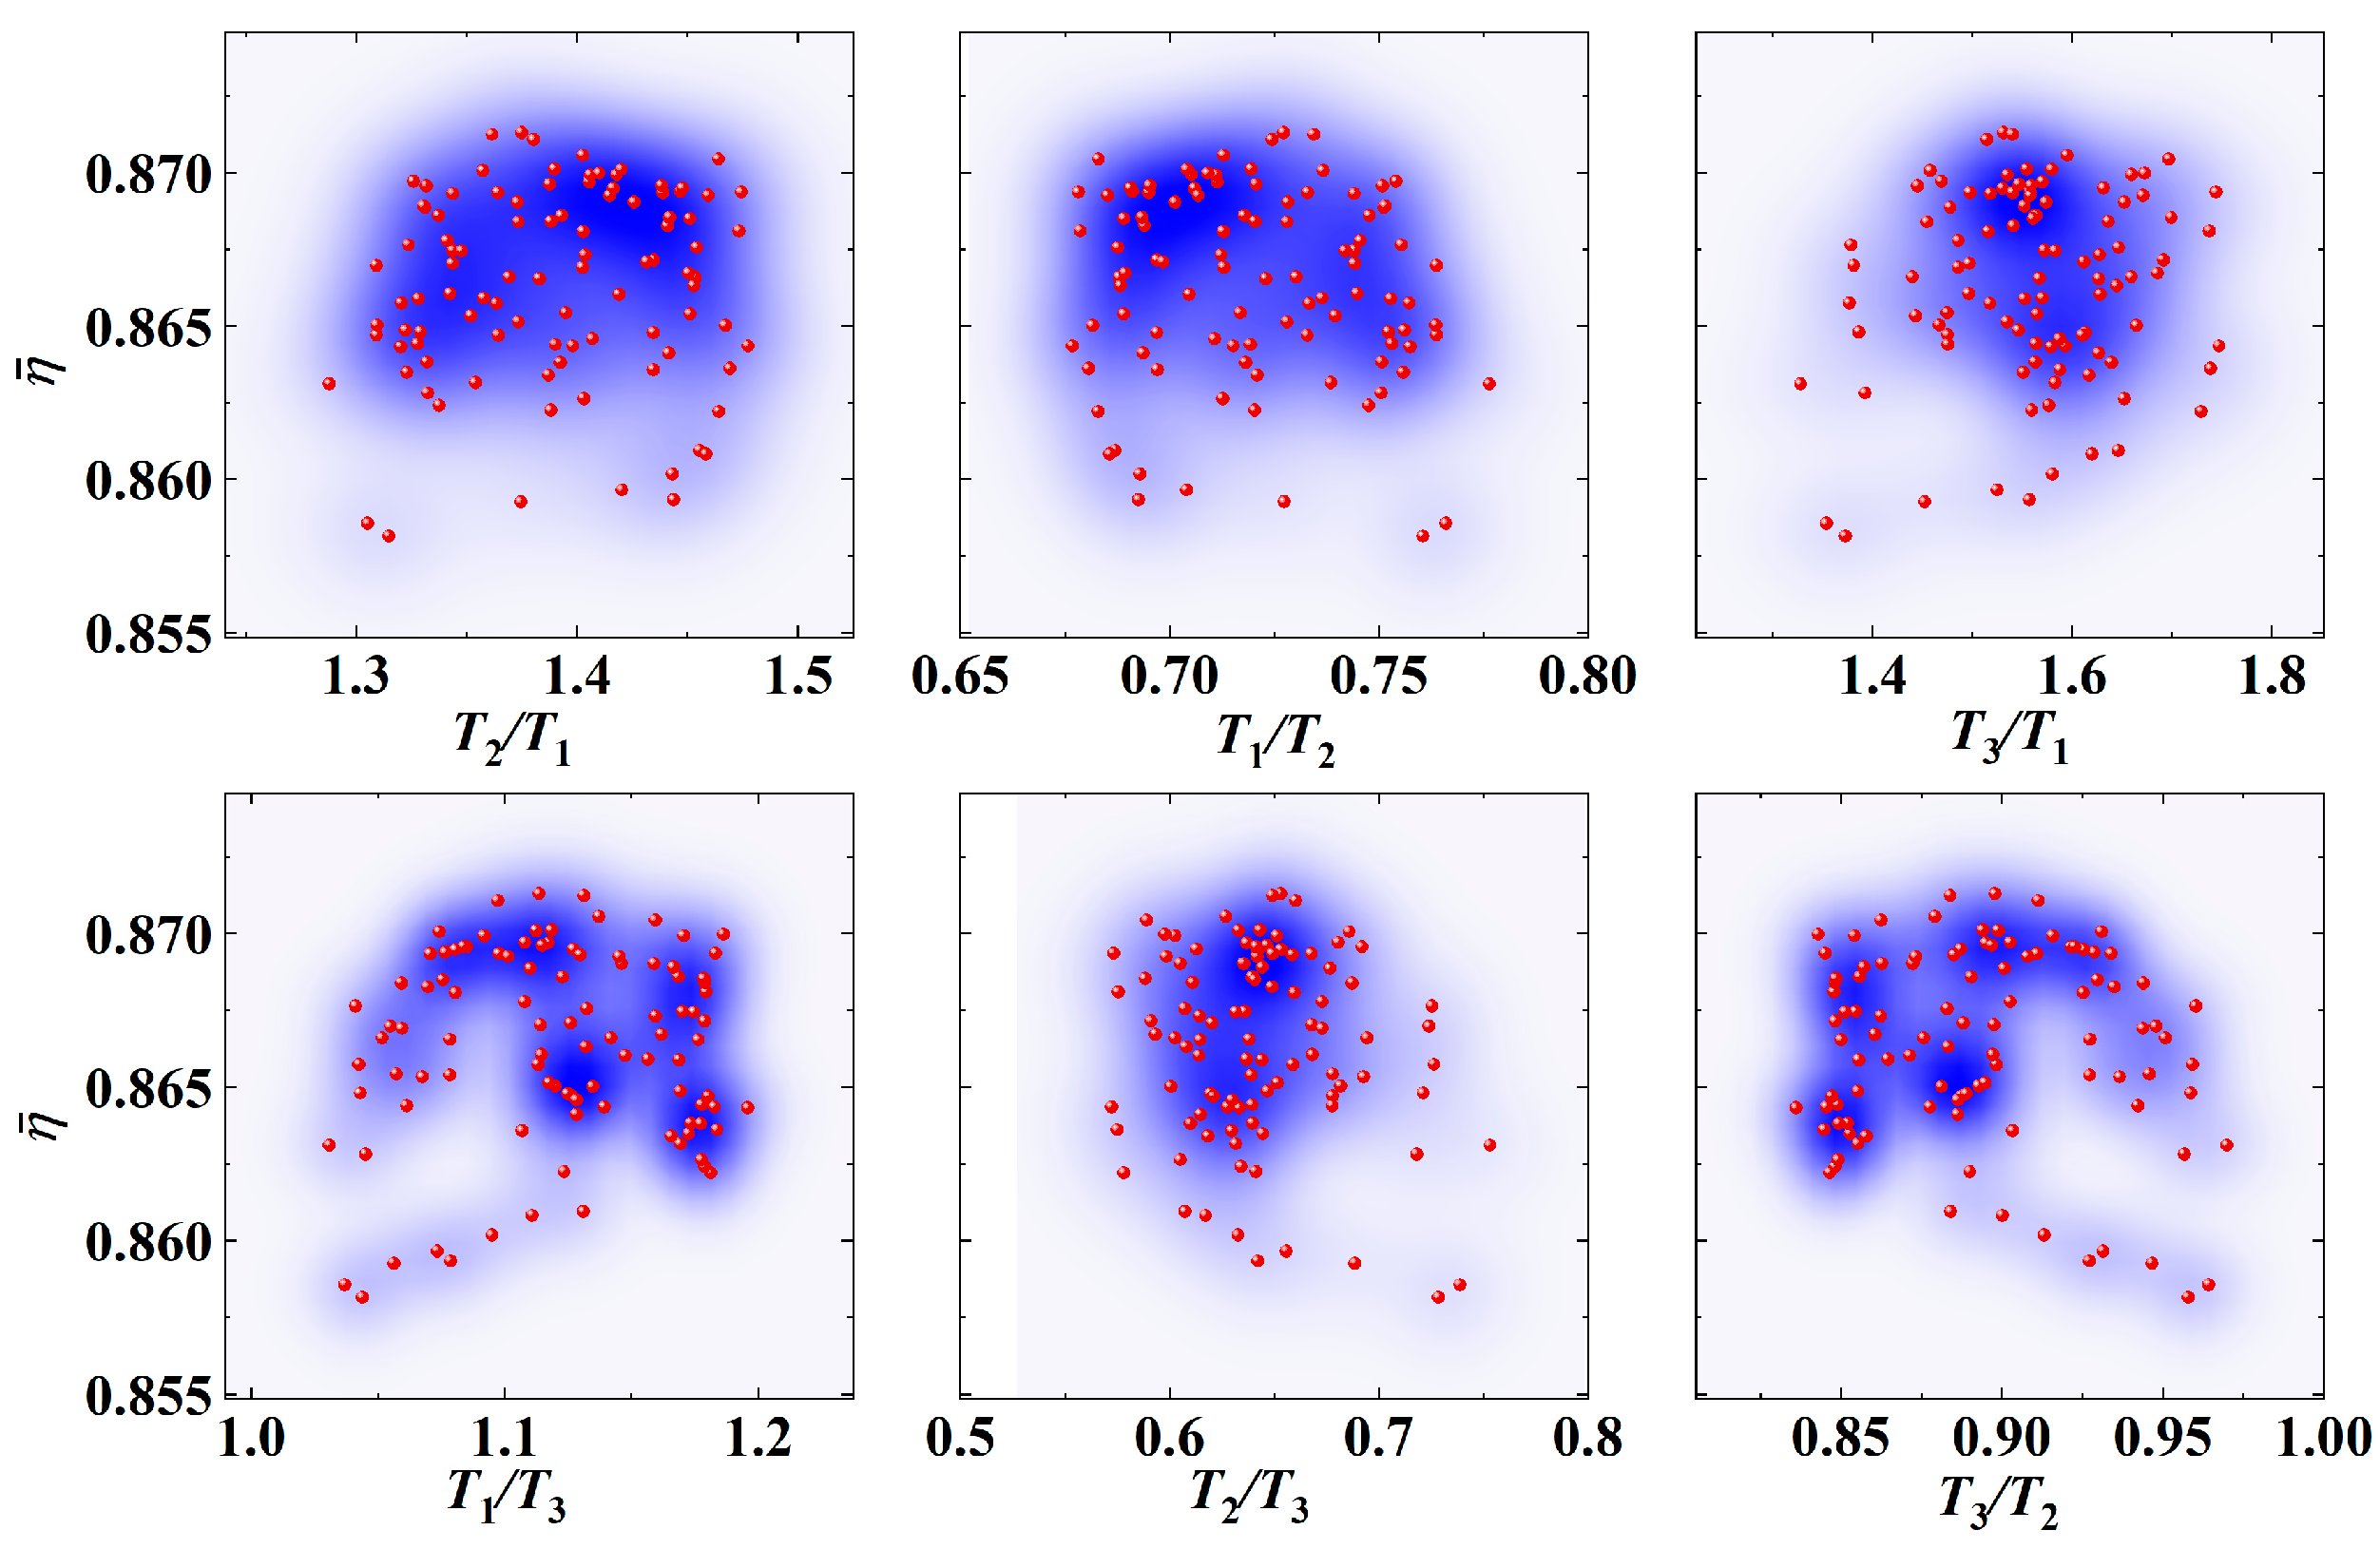
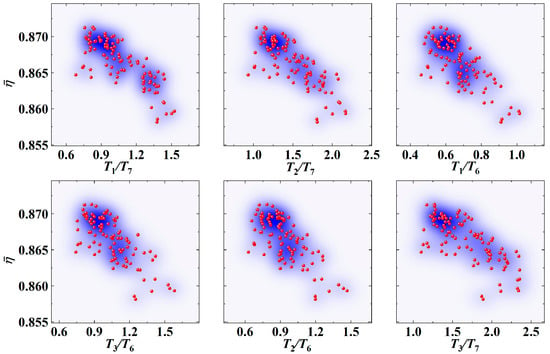
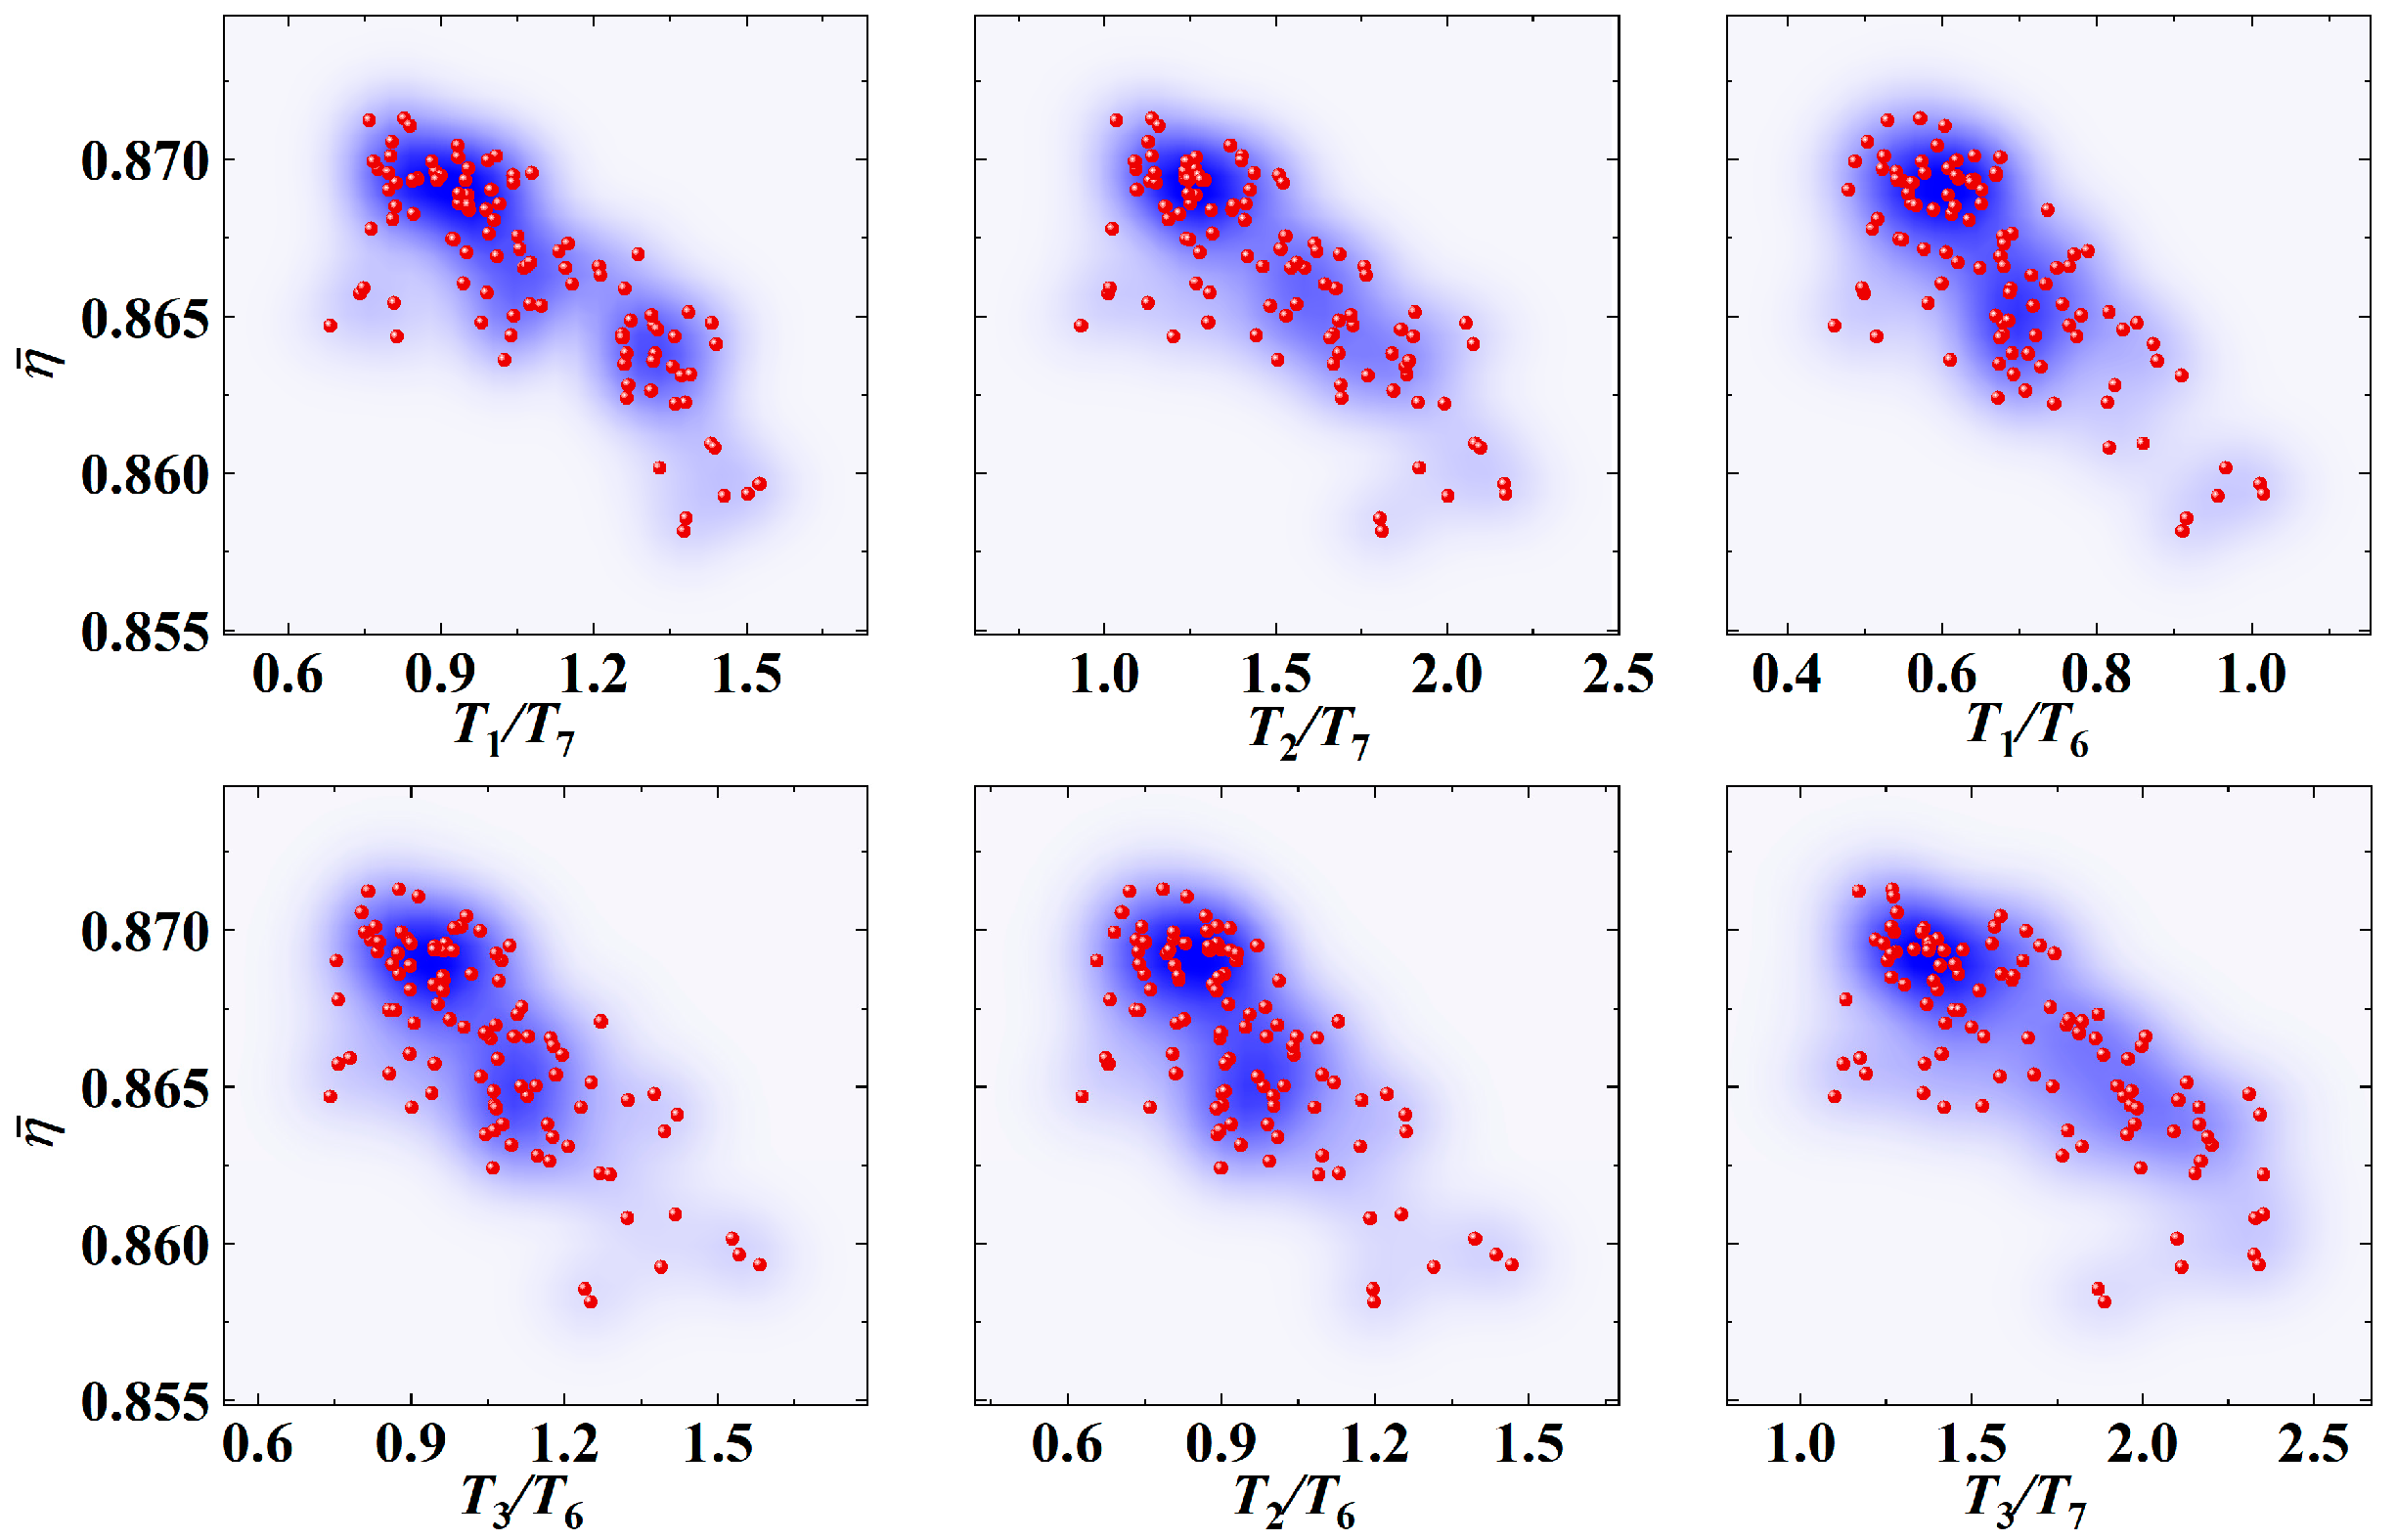
All composite-feature values were computed for each design in the propeller-performance database, and the Pearson correlation coefficients between each feature and the efficiency factor were calculated (Figure 12). Figure 13 presents the six composite features with the smallest absolute correlation coefficients, whereas Figure 14 presents the six features with the largest absolute correlation coefficients. The former exhibit almost no correlation with the efficiency factor, whereas the latter exhibit strong correlations. The six composite features most strongly correlated with the efficiency factor, namely T1/T7, T2/T7, T1/T6, T3/T6, T2/T6, and T3/T7, are selected as candidates. However, these features are not algebraically independent: once the first four are specified, the fifth and sixth are determined. More generally, strong correlation does not imply algebraic independence; for example, T7/T1 is the reciprocal of T1/T7. To retain both strong correlations with the efficiency factor and algebraic independence, the final set comprises T1/T7, T2/T7, T1/T6, T3/T6, T4/T6, and T4/T5, which are termed characteristic load ratios.
Figure 12.
Correlation between the composite feature Ti/Tj and the efficiency factor.
Figure 13.
Variation in the six least-correlated composite features with respect to the efficiency factor.
Figure 14.
Variation in the six most-correlated composite features with respect to the efficiency factor.
The hierarchical clustering method described in Section 2.3 was applied to 103 designs, discretizing the efficiency factor into three levels: high, medium, and low. For the designs in the high efficiency-factor category, the values of the characteristic load ratios were statistically analyzed to determine their optimal ranges, as listed in Table 5. This analysis yields the following rule: when all six characteristic load ratios fall within their optimal ranges, the propeller efficiency factor is high.
Table 5.
Optimal ranges of the characteristic load ratios.
It should be noted that the identified characteristic load ratios are not isolated statistical indicators, but are physically related to the classical aerodynamic descriptions of propeller loading. In momentum theory, propeller efficiency is closely associated with disk loading, induced velocity, and the conversion of shaft power into useful thrust power. In blade element theory, the radial distributions of aerodynamic force, inflow angle, and local lift-to-drag ratio determine the overall thrust and torque generation. Therefore, the characteristic load ratios extracted in this study can be regarded as dimensionless descriptors of the spanwise thrust distribution, which is closely linked to induced power and local aerodynamic loading.
This rule reflects the relationship between load distribution and propeller efficiency. In a specific design, a desirable load distribution can be achieved through the radial twist of the blades and the selection of profile airfoils. Taking blade twist as an example, the rule states in effect that when the blade twist falls within a specific range, the propeller efficiency is high, and it provides a quantitative target range for adjustment.
To make the rule directly usable in design practice, the characteristic load ratios can be translated into adjustments of the geometric design variables through the following iterative procedure. (1) An initial geometry is designed with a conventional method, such as the Betz–Larrabee minimum-induced-loss approach [3], and its sectional thrust distribution is computed. (2) The six characteristic load ratios are evaluated. A ratio below its lower target bound indicates that the numerator segments are underloaded relative to the denominator segments. This imbalance can be corrected by increasing the chord or installation angle, or by selecting an airfoil with a higher lift coefficient, at the radial stations associated with the numerator segments; alternatively, the opposite adjustments can be applied at the stations associated with the denominator segments. A ratio above its upper target bound requires the reverse adjustments. For example, if T1/T7 and T2/T7 lie below their target ranges, the tip loading is too high relative to the root and midspan loading, or equivalently, the root and midspan loading are too low relative to the tip; the tip chord or installation angle should therefore be reduced, or the corresponding parameters in the root-to-midspan region increased. (3) The modified geometry is re-evaluated, and steps (2) and (3) are repeated until all six ratios lie within their target ranges. The rule thus provides quantitative targets for the sectional load distribution and can be combined with inverse-design or optimization methods that map a target load distribution to chord, installation-angle, and airfoil distributions.
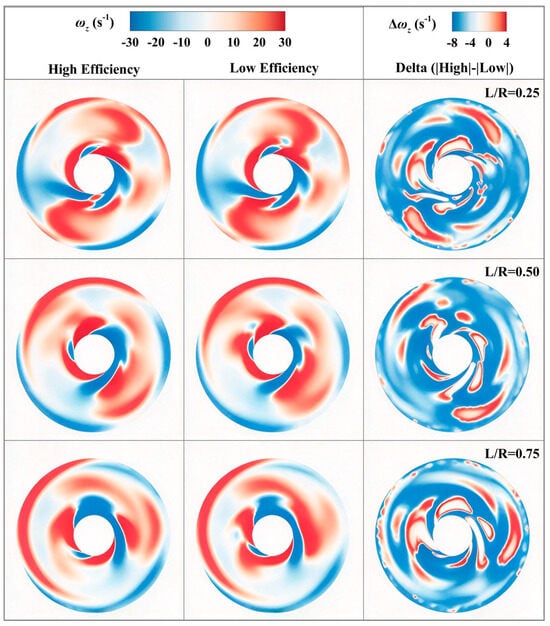
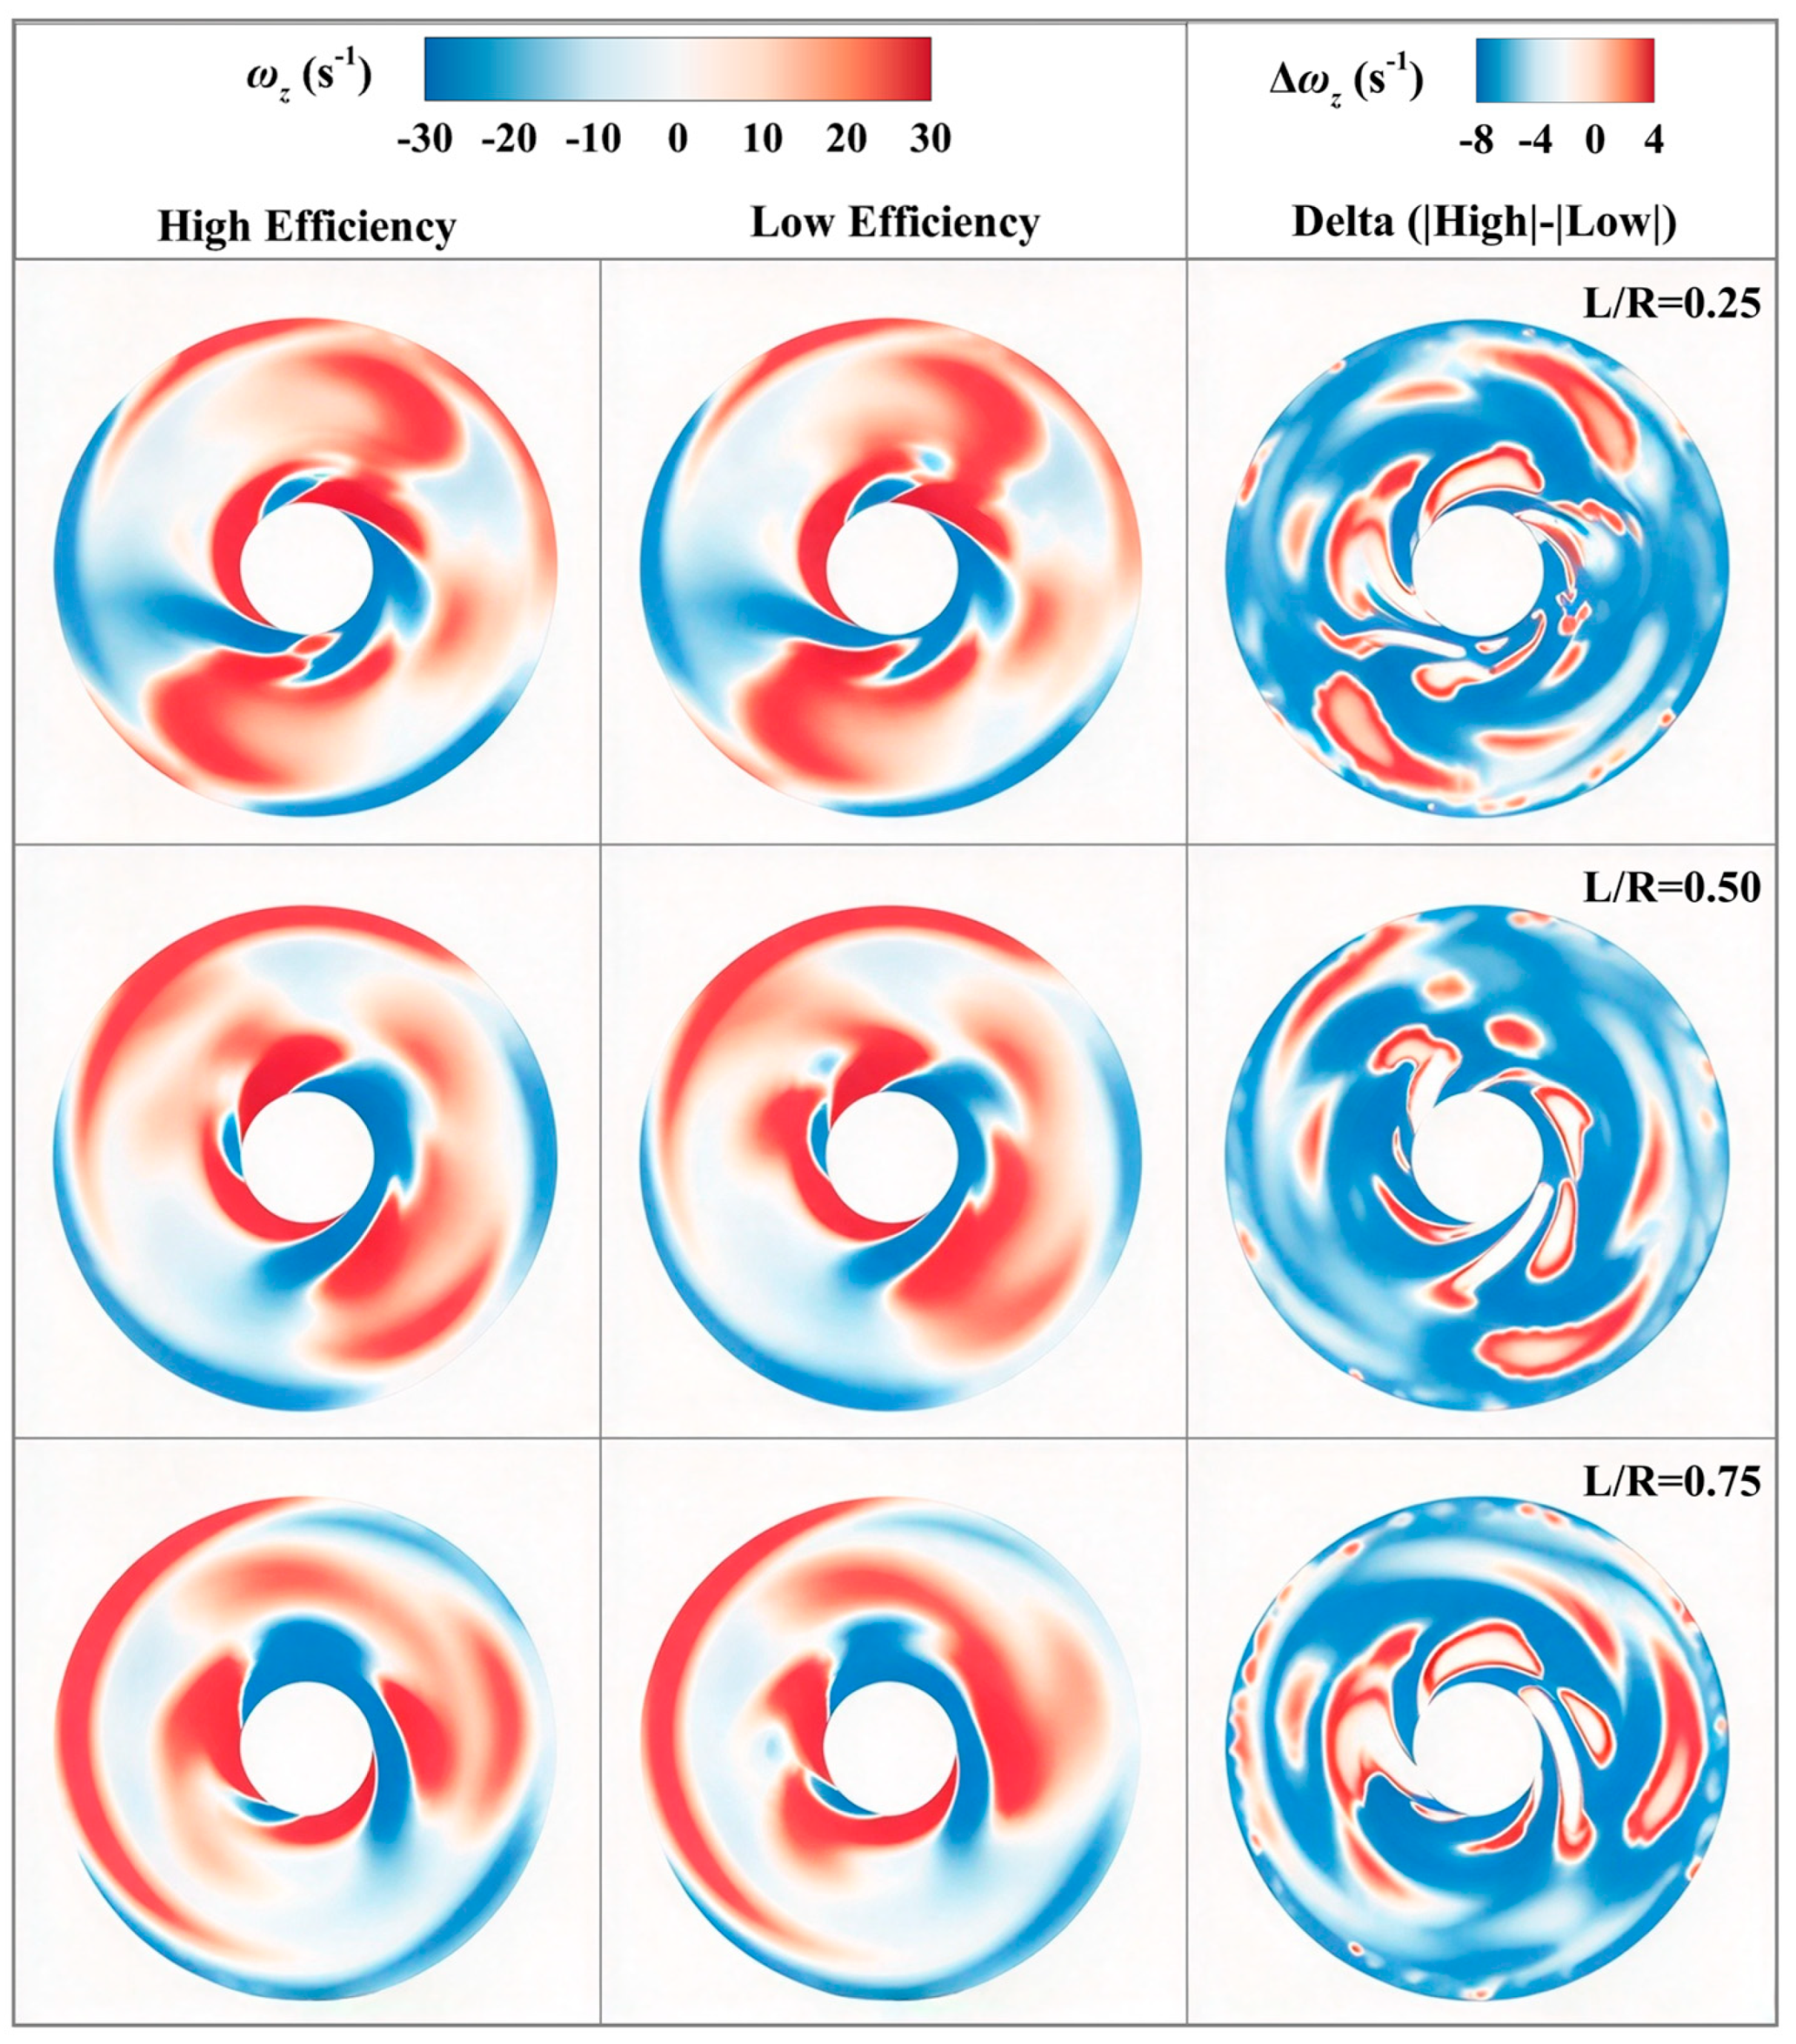
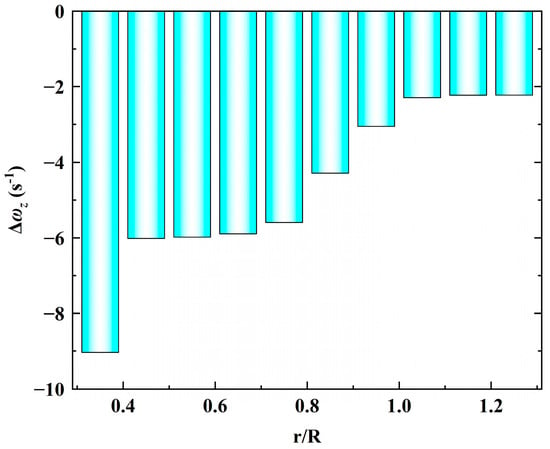
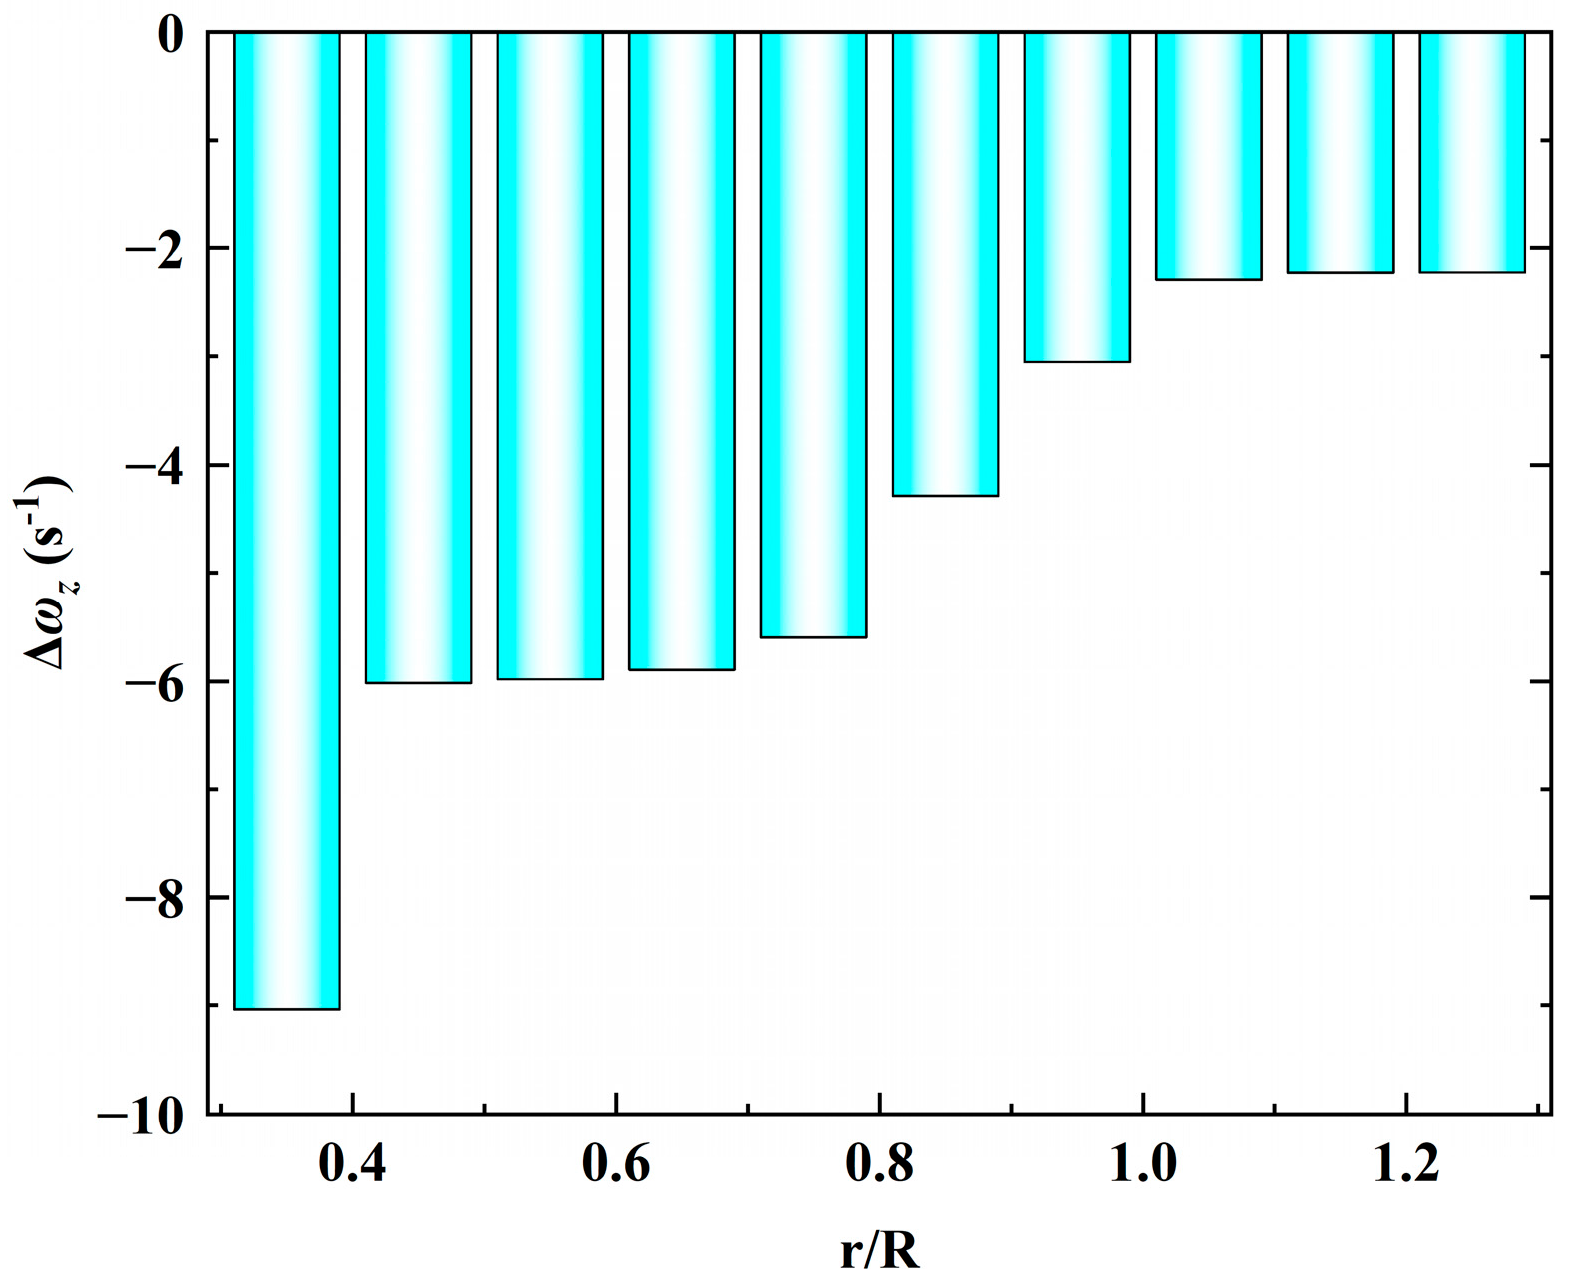
To verify the physical mechanism underlying the extracted rule, the wake vorticity ωz behind the disk is compared in Figure 15 at three downstream cross-sections (L/R = 0.25, 0.50, and 0.75) for the representative high- and low-efficiency-factor designs. The vorticity plotted in Figure 15 and Figure 16 is the axial component of the vorticity vector in the z-direction, defined as ωz = ∂v/∂x − ∂u/∂y, where the z-axis is aligned with the freestream direction. This component characterizes streamwise vortical structures in the wake, which are useful for comparing trailing-vortex strength between the two designs. Δωz is defined as the value of |ωz| for the high-efficiency-factor design minus that for the low-efficiency-factor design. The high-efficiency-factor design exhibits generally weaker streamwise vorticity at all three sections, and the predominantly negative Δωz fields over the blade-wake region support this difference. Figure 16 further shows the radial distribution of the averaged difference in |ωz| between the two designs. The weaker vorticity is consistent with a less intense trailing-vortex system and provides qualitative evidence of reduced induced losses. These results provide a qualitative physical interpretation consistent with the Betz condition; a quantitative assessment based on circulation is presented below.
Figure 15.
Comparison of ωz distributions between the designs with high and low efficiency factors at three downstream cross-sections (L/R = 0.25, 0.50, 0.75).
Figure 16.
Radial distribution of the averaged ωz difference between the high- and low-efficiency-factor designs.
The connection to the Betz condition is further quantified through the sectional circulation distributions, which were extracted from the converged CFD solutions for all 103 designs. For each design, the Betz-optimal circulation distribution was computed at the same total thrust, and the deviation was quantified by a spanwise-weighted relative L2 norm [40]:
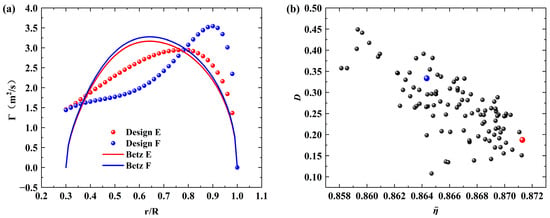
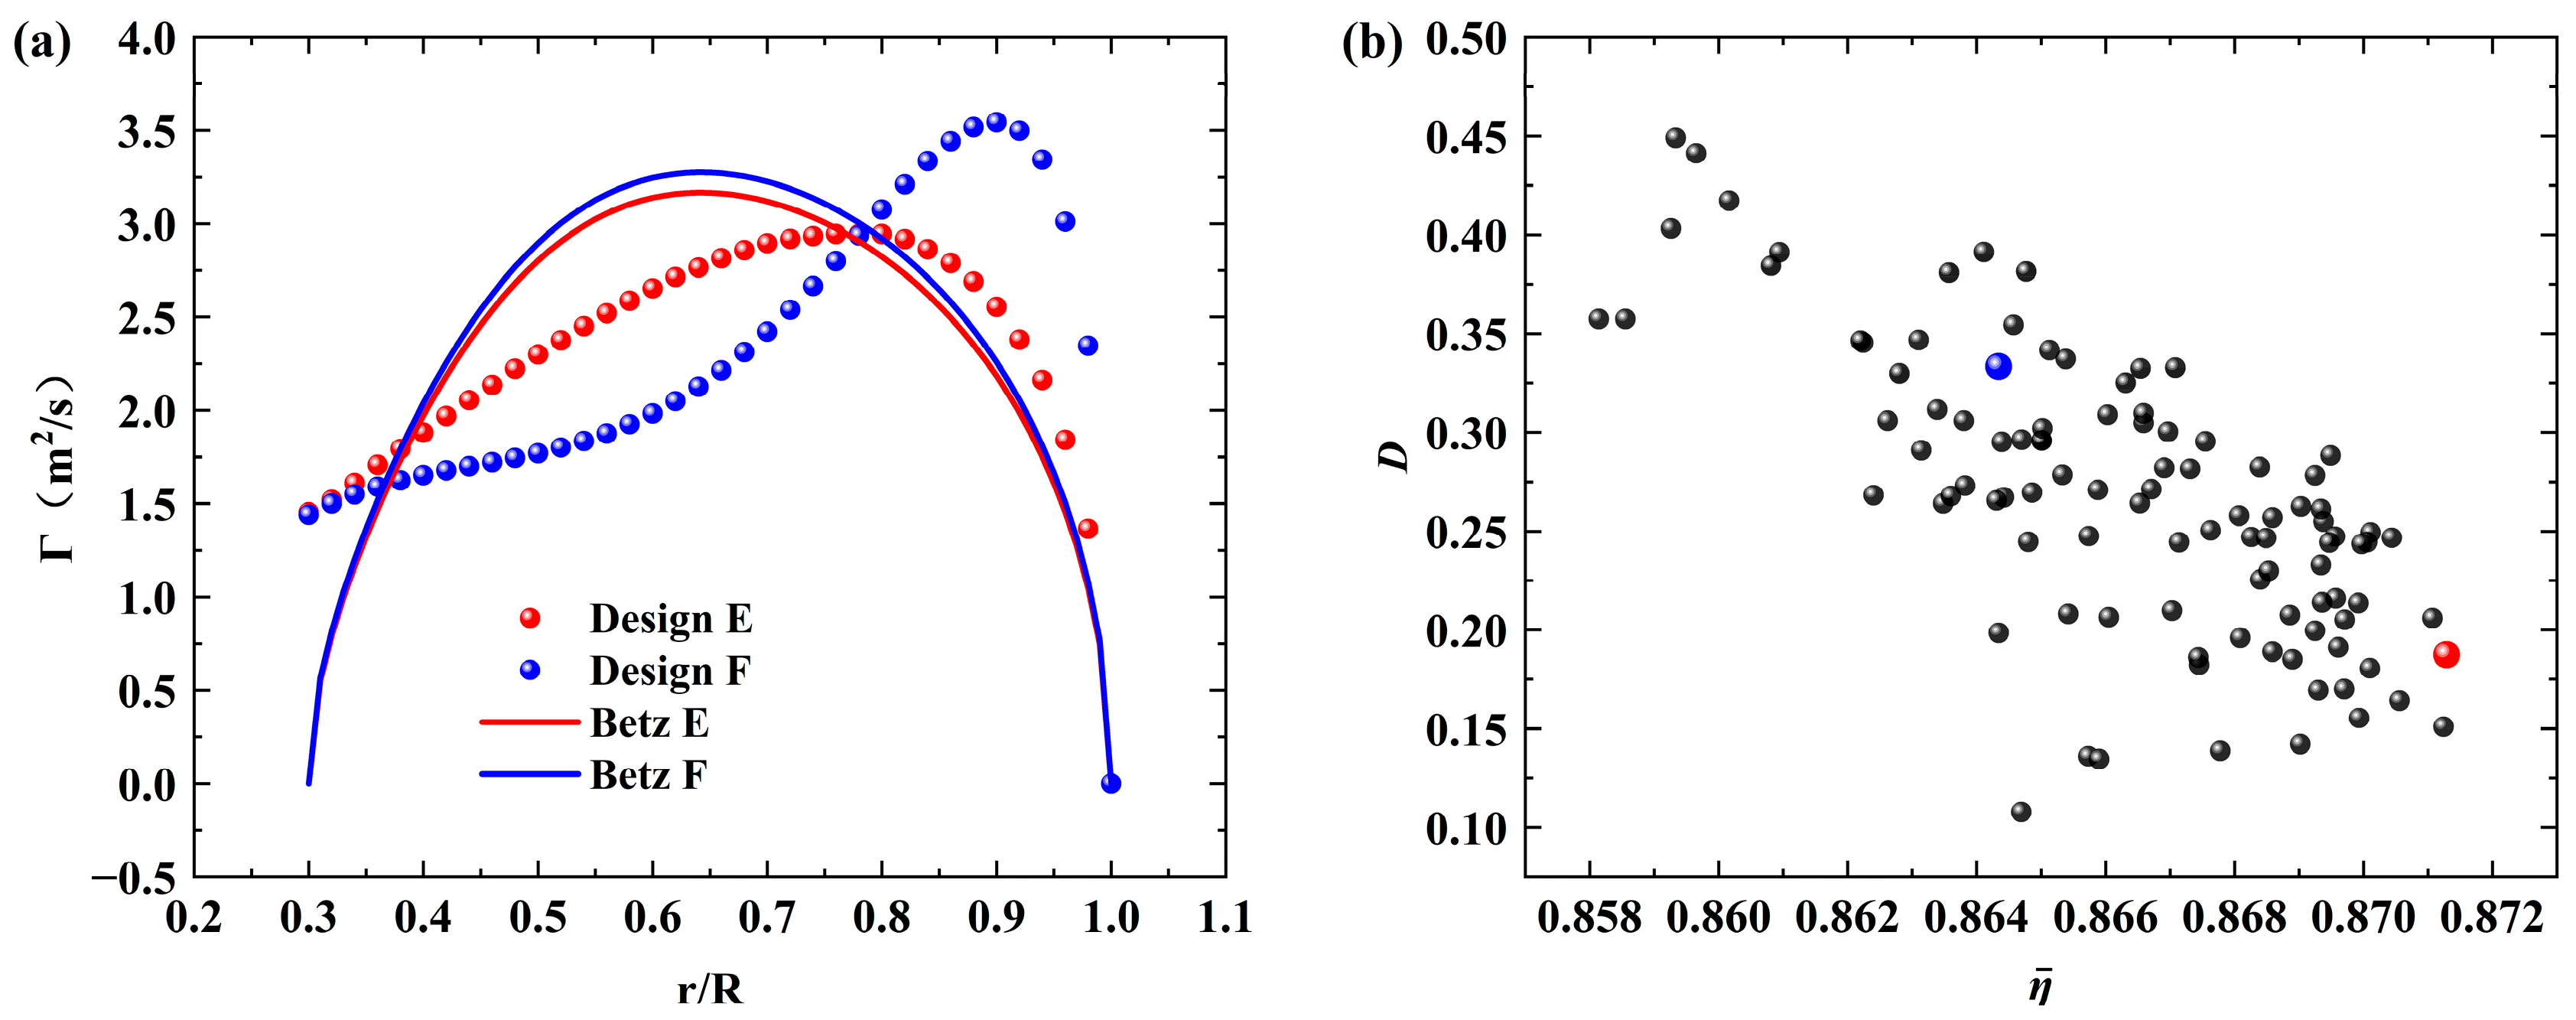
where the radial coordinate ri is taken as the weight and the summation runs over the six outer segments (r/R = 0.45–0.95). Figure 17a compares two designs whose thrusts are both within the design requirement and differ by less than 1.1% (181 N vs. 183 N): the high-efficiency-factor design (Design E) closely follows its Betz distribution, whereas the low-efficiency-factor design (Design F) departs markedly from its Betz optimum, especially in the tip region. The pronounced shift in the circulation peaks originates from the different radial distributions of chord length and installation angle in the two designs. All database designs were generated by varying these two parameters at three control radial stations (0.45R, 0.70R, and 0.90R) around the baseline geometry. In Design F, the chord lengths and installation angles at 0.45R and 0.70R are relatively small, which reduces the loading over the middle part of the blade. In contrast, at 0.90R, the chord length is the longest among the sampled levels and the installation angle is relatively large, thereby increasing the loading near the blade tip. Since the total thrust is nearly the same for the two designs, the increased tip loading of Design F is accompanied by reduced loading over the middle part of the blade, and its circulation maximum consequently shifts toward the tip. In Design E, both parameters vary only slightly around their baseline values at all three control stations, so that its circulation distribution remains closer to the Betz optimum. More specifically, the two designs have similar circulation values near the blade root (0.3R–0.4R), whereas the circulation of Design F is lower over 0.4R–0.75R and higher over 0.8R–1.0R than that of Design E. The combination of reduced mid-span loading and excessive tip loading in Design F increases its departure from the Betz optimum and hence its induced loss, which explains its lower efficiency factor. Over the entire database (Figure 17b), the deviation norm D is strongly negatively correlated with the efficiency factor (Pearson correlation coefficient −0.7137; Spearman rank correlation coefficient −0.7064; Kendall rank correlation coefficient −0.5120; all with p < 10−13), and the squared Pearson correlation is 0.509. When the designs are grouped into efficiency-factor quartiles, the mean D decreases monotonically from 0.3355 in the lowest quartile to 0.2184 in the highest quartile. These results support the physical interpretation that higher efficiency factors are associated with smaller departures from Betz-optimal loading.
Figure 17.
Comparison of the sectional circulation distributions with the Betz-optimal distributions. (a) Circulation distributions of two designs with nearly identical thrust and their respective Betz optima; (b) spanwise-weighted deviation norm D from the Betz optimum versus the efficiency factor for all 103 designs.
3.4. Rule Validation
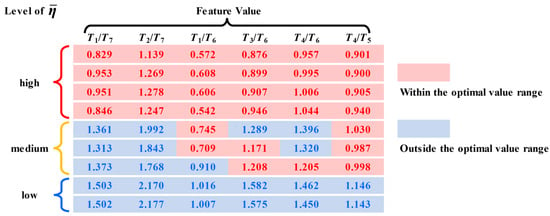
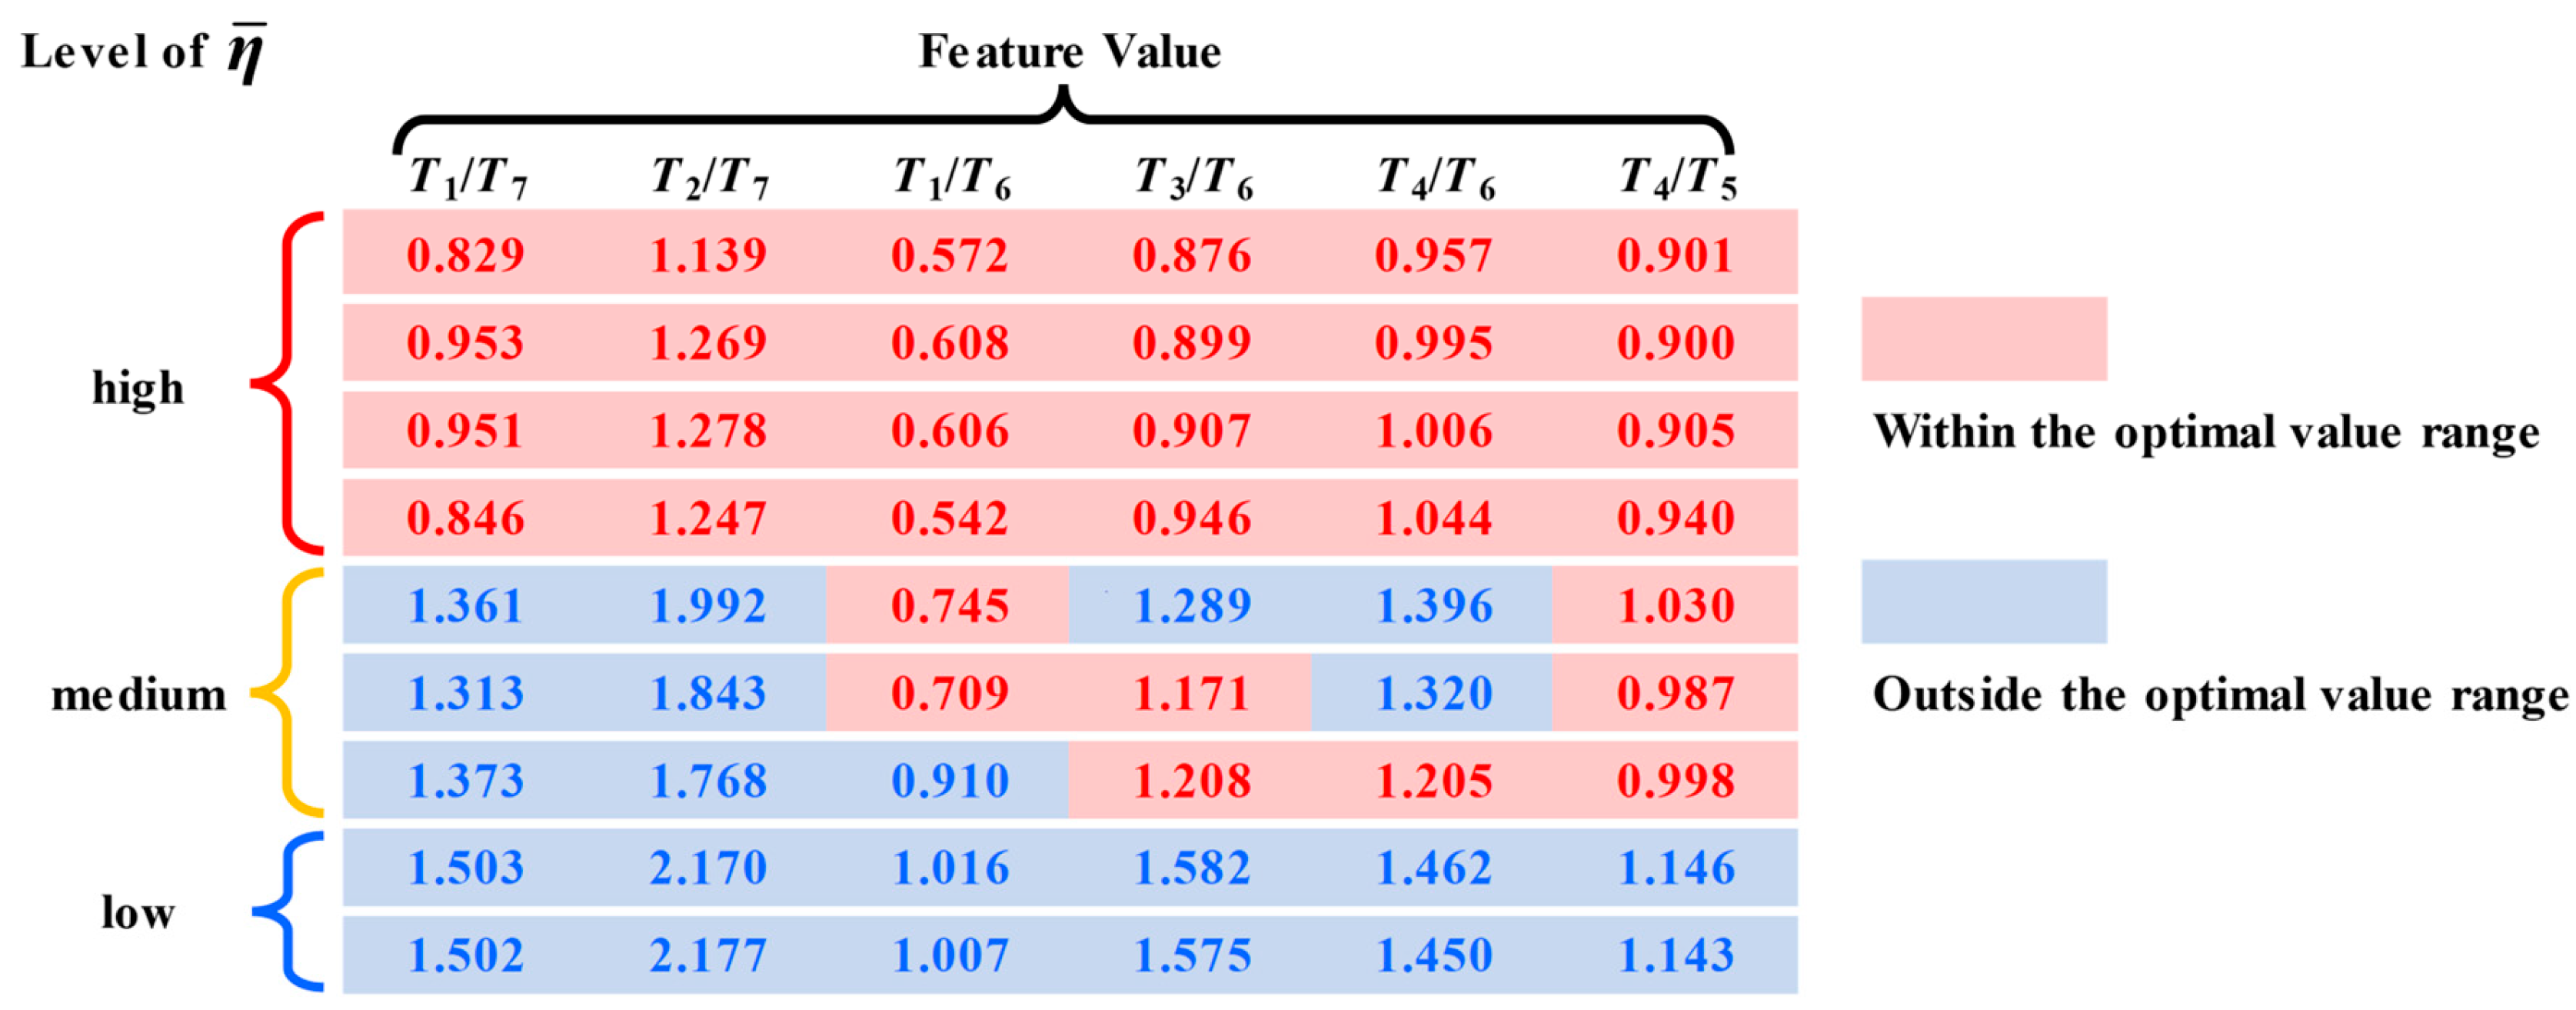
Nine additional propeller designs were evaluated using CFD to verify the effectiveness of the proposed rule. The characteristic load ratios and efficiency factor were then calculated for each design, and the efficiency factors were classified using the hierarchical clustering method described in Section 2.3. As shown in Figure 18, designs with all six ratios within their optimal ranges fall into the high category, those with only some ratios within their ranges fall into the medium category, and those with all ratios outside their ranges fall into the low category. These results support the validity of the rule that a high efficiency factor is obtained when all six characteristic load ratios lie within their optimal ranges. It should be emphasized that these nine designs were not involved in any step of the rule extraction (feature construction, feature selection, clustering, and determination of the optimal ranges); they therefore constitute an independent test set for the rule rather than part of the training data. In addition, the three designs examined in Section 3.2 belong to a different propeller, whose operating conditions differ from those of the database propeller (Table 1); the successful validation on these designs therefore provides a cross-propeller generalization test of the rule.
Figure 18.
Validation of rule effectiveness.
The validation results are also consistent with classical propeller aerodynamics. The thrust distribution of a propeller is a direct manifestation of its circulation distribution. When the circulation distribution of the blade is reasonable—approaching the Betz-optimal distribution—the propeller efficiency is high, which corresponds to the top four high-efficiency examples in Figure 18. When the blade circulation is shifted excessively toward the blade root, the propeller efficiency drops significantly, as shown in the lower two examples in Figure 18. The rules proposed in this study capture this pattern and provide a quantitative range.
To assess the generalizability of the derived rules, the characteristic load ratios of the three propeller designs from Section 3.2 were calculated and checked against the optimal ranges. As shown in Figure 19, all six ratios for Designs B and C lie within their optimal ranges. For Design A, three of the six ratios lie outside their optimal ranges, although T4/T6 (0.845) is only 0.5% below its lower bound (0.849). Collectively, these results provide further support for the effectiveness of the rule. Validation on two propellers with different design requirements provides preliminary evidence of generalizability.
Figure 19.
Validation of rule generalization ability.
On the basis of the validated rules, the applicability range of the present design guidelines is summarized as follows. The rules were extracted from, and validated within, two-bladed UAV propellers operating near the design advance ratio (λ ≈ 0.625), with thrust coefficients of 0.0417–0.0663 and blade-section Reynolds numbers of the order of 6 × 10⁵–9 × 10⁵; their effectiveness within this range has been verified on the twelve independent designs examined above, following the application procedure described in Section 3.3. Extrapolation to propellers with substantially different blade numbers, diameters, or advance ratios should therefore be made with caution.
4. Conclusions
This study developed a knowledge–data hybrid-driven method for discovering interpretable propeller design rules. By normalizing actual efficiency by the ideal efficiency at the same disk loading, the efficiency factor provided a common basis for comparing all 103 designs, whereas raw efficiency allowed direct comparison of only 21 designs with similar thrust coefficients. Dimensional-homogeneity-based feature construction and correlation-based feature selection identified six characteristic load ratios—T1/T7, T2/T7, T1/T6, T3/T6, T4/T6, and T4/T5—and their optimal ranges. The resulting rule states that the efficiency factor is high when all six ratios lie within their optimal ranges and is consistent with the results for all 12 independent validation designs, including three designs of a different propeller. The circulation analysis further supported the physical basis of the rule: the deviation norm D from the Betz-optimal circulation distribution was strongly negatively correlated with the efficiency factor. These results indicate that the proposed rule provides an interpretable, quantitative guideline for adjusting the spanwise load distribution toward the Betz optimum. The rule remains empirical and is currently limited to the two-bladed UAV propellers and operating conditions investigated here; future work should validate it for other configurations and experimentally test a rule-guided design.
Author Contributions
Conceptualization, H.B. and G.Y.; methodology, H.B., G.Y. and W.B.; software, H.B. and W.B.; validation, H.B.; formal analysis, H.B. and W.B.; investigation, H.B.; resources, G.Y.; data curation, H.B.; writing—original draft preparation, H.B.; writing—review and editing, H.B., G.Y. and W.B.; visualization, H.B.; supervision, G.Y.; project administration, G.Y.; funding acquisition, W.B. All authors have read and agreed to the published version of the manuscript.
Funding
This work was supported by the National Natural Science Foundation of China Project (Grant Nos. 12672301, 12302303), and the foundation of National Key Laboratory of Aircraft Configuration Design (No. ZYTS-202403).
Data Availability Statement
The datasets generated and analyzed during this study are not publicly available but are available from the corresponding author upon reasonable request.
Acknowledgments
The authors thank the staff of the NF-3 Laboratory for their assistance with the wind-tunnel experiments. We also thank the National Natural Science Foundation of China Project and the foundation of the National Key Laboratory of Aircraft Configuration Design.
Conflicts of Interest
The authors declare no conflicts of interest.
Nomenclature
The following abbreviations are used in this manuscript:
| Symbol | Meaning |
| CP | power coefficient |
| CT | thrust coefficient |
| D | spanwise-weighted relative L2 norm of the deviation from the Betz-optimal circulation distribution |
| H | altitude (km) |
| L | characteristic downstream distance behind the propeller disk (m) |
| NB | number of blades |
| P | power (W) |
| R | propeller radius (m) |
| S | propeller disk area (m2) |
| T | thrust (N) |
| Ti | thrust of the i-th blade segment, i = 1, …, 7 (N) |
| Ti/Tj | Dimensionless composite features |
| V | freestream velocity (m/s) |
| d | propeller diameter (m) |
| l | inter-cluster distance |
| n | propeller rotational speed (r/min) |
| q | freestream dynamic pressure (Pa) |
| r | local radial coordinate (m) |
| ri | radial coordinate of the i-th segment center (m) |
| u | velocity component in the x-direction |
| v | velocity component in the y-direction |
| y+ | dimensionless wall distance of the first mesh layer |
| α | local angle of attack (°) |
| β | blade twist angle (°) |
| Γ | sectional circulation (m2/s) |
| Δωz | difference in ωz between the high- and low-efficiency-factor designs (1/s) |
| efficiency factor | |
| η | propeller efficiency |
| ηideal | propeller ideal efficiency |
| λ | advance ratio |
| ρ | air density (kg/m3) |
| τ | disk-loading coefficient |
| ωz | streamwise (axial) component of vorticity |
References
- Lee, C. The Next Frontier: UAVs for Great Power Conflict|Part 1: Penetrating Strike; The Mitchell Institute for Aerospace Studies: Arlington, VA, USA, 2022. [Google Scholar]
- Wald, Q.R. The aerodynamics of propellers. Prog. Aerosp. Sci. 2006, 42, 85–128. [Google Scholar] [CrossRef] [Scilit]
- Larrabee, E.E. Practical Design of Minimum Induced Loss Propellers. In Proceedings of the Business Aircraft Meeting and Exposition, Wichita, KA, USA, 3 April 1979. [Google Scholar] [CrossRef] [Scilit]
- Patterson, M.; Borer, N.; German, B. A Simple Method for High-Lift Propeller Conceptual Design. In 54th AIAA Aerospace Sciences Meeting; American Institute of Aeronautics and Astronautics: Reston, VA, USA, 2016. [Google Scholar] [CrossRef] [Scilit]
- Albert, S.; Epple, P.; Willinger, B.; Delgado, A. High Efficiency Propeller Design Based on the Betz Minimum Induced Loss Condition and CFD Validation on an APC 8″ Propeller. In Proceedings of the ASME 2013 International Mechanical Engineering Congress and Exposition; American Society of Mechanical Engineers: New York, NY, USA, 2013. [Google Scholar] [CrossRef] [Scilit]
- Traub, L.W. Inverse Propeller Design for a Prescribed Chord or Blade Angle. J. Aircr. 2017, 54, 825–830. [Google Scholar] [CrossRef] [Scilit]
- Chen, X.; Zhou, Z. Inverse aerodynamic design for DEP propeller based on desired propeller slipstream. Aerosp. Sci. Technol. 2020, 102, 105820. [Google Scholar] [CrossRef] [Scilit]
- Thiele, M.; Staudenmaier, A.; Madabhushi Venkata, S.; Hornung, M. Development of a Reinforcement Learning Inspired Monte Carlo Tree Search Design Optimization Algorithm for Fixed-Wing VTOL UAV Propellers. In AIAA Scitech 2020 Forum; American Institute of Aeronautics and Astronautics: Reston, VA, USA, 2020. [Google Scholar] [CrossRef] [Scilit]
- Patel, C.; Iverson, C. Parametric Design Optimization in Computational Aerodynamics using Artificial Deep Neural Networks. In AIAA Propulsion and Energy 2020 Forum; American Institute of Aeronautics and Astronautics: Reston, VA, USA, 2020. [Google Scholar] [CrossRef] [Scilit]
- Gur, O.; Rosen, A. Optimization of Propeller Based Propulsion System. J. Aircr. 2009, 46, 95–106. [Google Scholar] [CrossRef] [Scilit]
- Brunton, S.L.; Noack, B.R.; Koumoutsakos, P. Machine Learning for Fluid Mechanics. Annu. Rev. Fluid Mech. 2020, 52, 477–508. [Google Scholar] [CrossRef] [Scilit]
- Zhang, W.; Kou, J.; Liu, Y. Prospect of artificial intelligence empowered fluid mechanics. Acta Aeronaut. Astronaut. Sin. 2021, 42, 524689. [Google Scholar] [CrossRef]
- Lemos, P.; Jeffrey, N.; Cranmer, M.; Ho, S.; Battaglia, P. Rediscovering orbital mechanics with machine learning. Mach. Learn. Sci. Technol. 2023, 4, 045002. [Google Scholar] [CrossRef] [Scilit]
- Iten, R.; Metger, T.; Wilming, H.; Del Rio, L. Discovering Physical Concepts with Neural Networks. Phys. Rev. Lett. 2020, 124, 010508. [Google Scholar] [CrossRef] [Scilit]
- Liu, Z.M.; Tegmark, M. Machine Learning Hidden Symmetries. Phys. Rev. Lett. 2022, 128, 180201. [Google Scholar] [CrossRef] [Scilit]
- Udrescu, S.M.; Tegmark, M. AI Feynman: A physics-inspired method for symbolic regression. Sci. Adv. 2020, 6, eaay2631. [Google Scholar] [CrossRef] [Scilit]
- Boiko, D.A.; Macknight, R.; Kline, B.; Gomes, G. Autonomous chemical research with large language models. Nature 2023, 624, 570–578. [Google Scholar] [CrossRef] [Scilit]
- Poggi, C.; Rossetti, M.; Bernardini, G.; Iemma, U.; Andolfi, C.; Milano, C.; Gennaretti, M. Surrogate models for predicting noise emission and aerodynamic performance of propellers. Aerosp. Sci. Technol. 2022, 125, 107016. [Google Scholar] [CrossRef] [Scilit]
- Wu, X.; Zuo, Z.; Ma, L.; Zhang, W. Multi-fidelity neural network-based aerodynamic optimization framework for propeller design in electric aircraft. Aerosp. Sci. Technol. 2024, 146, 108963. [Google Scholar] [CrossRef] [Scilit]
- Dang, Z.; Wu, M.; He, X.; Huang, Z.; Ying, Z.; Chen, Z.; Zheng, C. An amphibious propeller design optimization framework based on deep neural network surrogate model. Aerosp. Sci. Technol. 2025, 159, 109967. [Google Scholar] [CrossRef] [Scilit]
- Russell, S.J.; Norvig, P. Artificial Intelligence: A Modern Approach, 4th ed.; Pearson: London, UK, 2020. [Google Scholar]
- Li, X.; Sun, K.; Li, F. General optimal design of solar-powered unmanned aerial vehicle for priority considering propulsion system. Chin. J. Aeronaut. 2020, 33, 2176–2188. [Google Scholar] [CrossRef] [Scilit]
- Wang, K.; Zhou, Z.; Fan, Z.; Guo, J. Aerodynamic design of tractor propeller for high-performance distributed electric propulsion aircraft. Chin. J. Aeronaut. 2021, 34, 20–35. [Google Scholar] [CrossRef] [Scilit]
- Cong, K.; Ma, D.; Zhang, L.; Xia, X.; Yao, Y. Design and analysis of passive variable-pitch propeller for VTOL UAVs. Aerosp. Sci. Technol. 2023, 132, 108063. [Google Scholar] [CrossRef] [Scilit]
- Yu, P.; Peng, J.; Bai, J.; Han, X.; Song, X. Aeroacoustic and aerodynamic optimization of propeller blades. Chin. J. Aeronaut. 2020, 33, 826–839. [Google Scholar] [CrossRef] [Scilit]
- Betz, A. Schraubenpropeller mit geringstem Energieverlust. In Nachrichten von der Gesellschaft der Wissenschaften zu Göttingen. Mathematisch-Physikalische Klasse; Gesellschaft der Wissenschaften zu Göttingen: Göttingen, Germany, 1919; pp. 193–217. [Google Scholar]
- Zhu, Q.; Zhang, F.; Huang, Y.; Xiao, H.; Zhao, L.; Zhang, X.; Song, T.; Tang, X.; Li, X.; He, G.; et al. An all-round AI-Chemist with a scientific mind. Natl. Sci. Rev. 2022, 9, nwac190. [Google Scholar] [CrossRef] [Scilit]
- Xie, C.; Tao, G.; Wu, Z. Performance prediction and design of stratospheric propeller. Appl. Sci. 2021, 11, 4698. [Google Scholar] [CrossRef] [Scilit]
- Vargas Loureiro, E.; Oliveira, N.L.; Hallak, P.H.; de Souza Bastos, F.; Rocha, L.M.; Grande Pancini Delmonte, R.; de Castro Lemonge, A.C. Evaluation of low fidelity and cfd methods for the aerodynamic performance of a small propeller. Aerosp. Sci. Technol. 2021, 108, 106402. [Google Scholar] [CrossRef] [Scilit]
- Rostami, M.; Farajollahi, A.H. Aerodynamic performance of mutual interaction tandem propellers with ducted uav. Aerosp. Sci. Technol. 2021, 108, 106399. [Google Scholar] [CrossRef] [Scilit]
- Celik, I.B.; Ghia, U.; Roache, P.J.; Freitas, C.J.; Coleman, H.; Raad, P.E. Procedure for estimation and reporting of uncertainty due to discretization in CFD applications. J. Fluids Eng. 2008, 130, 078001. [Google Scholar] [CrossRef] [Scilit]
- Hogg, R.V.; McKean, J.W.; Craig, A.T. Introduction to Mathematical Statistics, 8th ed.; Pearson: Hoboken, NJ, USA, 2018; pp. 102–103. [Google Scholar]
- Iversen, G.R.; Gergen, M. Statistics: The Conceptual Approach; Springer: New York, NY, USA, 1997; pp. 405–410. [Google Scholar]
- Hao, L.; Hu, B.; Gao, Y.; Wei, B. Effect of vortex generator spanwise height distribution pattern on aerodynamic characteristics of a straight wing. Adv. Aerodyn. 2023, 5, 4. [Google Scholar] [CrossRef] [Scilit]
- Polkowski, L.; Skowron, A. Rough Sets in Knowledge Discovery 1 and 2. In Methodology and Applications; Physica: Heidelberg, Germany, 1998. [Google Scholar]
- Ribner, H.S.; Foster, S.P. Ideal efficiency of propellers-Theodorsen revisited. J. Aircr. 1990, 27, 810–819. [Google Scholar] [CrossRef] [Scilit]
- Theodorsen, T. Theory of Propellers; McGraw-Hill: New York, NY, USA, 1948. [Google Scholar]
- Hu, B.; Gao, Y.; Wei, B. Propeller design rule extraction based on rough set theory. J. Aerosp. Power 2023, 38, 1901–1908. [Google Scholar] [CrossRef]
- Ma, W.J.; Zhang, J.; Feng, K.K.; Xing, H.Y.; Wen, D.S. Dimensional homogeneity constrained gene expression programming for discovering governing equations. J. Fluid Mech. 2024, 985, A12. [Google Scholar] [CrossRef] [Scilit]
- Quarteroni, A.; Sacco, R.; Saleri, F. Numerical Mathematics, 2nd ed.; Springer: Berlin/Heidelberg, Germany, 2007. [Google Scholar]



Disclaimer/Publisher’s Note: The statements, opinions and data contained in all publications are solely those of the individual author(s) and contributor(s) and not of MDPI and/or the editor(s). MDPI and/or the editor(s) disclaim responsibility for any injury to people or property resulting from any ideas, methods, instructions or products referred to in the content. |
© 2026 by the authors. Licensee MDPI, Basel, Switzerland. This article is an open access article distributed under the terms and conditions of the Creative Commons Attribution (CC BY) license.