


Abstract
Future commercial engines require higher bypass ratios and smaller cores, leading to open tip clearances exceeding 4% (s/H ≥ 4%) in rear stages. The resulting leakage flows show strong three-dimensional unsteady features that challenge numerical prediction, while experimental data inside open clearances with moving endwalls remain limited. In this study, a Stereo Particle Image Velocimetry (SPIV) system was applied to a high-speed moving-endwall cascade test rig. Measurements were conducted for a Controlled Diffusion Airfoil (CDA) cascade at Mach 0.3, an endwall speed of 900 r/min, and a relative clearance of 7.14%. Velocity fields were obtained on two spanwise planes, 2 mm (MP1) and 3.5 mm (MP2) from the endwall. Results show that the tip leakage vortex develops continuously along the span but differs between planes. In MP2, dominated by blade pressure difference, the leakage jet forms a broader high-velocity region and a more compact vortex, with higher blockage, shear gradient, and turbulent kinetic energy than in MP1. In MP1, endwall shear stretches the leakage flow pitchwise, reducing blockage and weakening mixing. This work demonstrates the feasibility of dual-camera SPIV measurements inside moving-endwall clearances and provides benchmark data for numerical validation.
1. Introduction
The overall dimensions of a compressor directly determine the bypass ratio of the engine and critically influence key performance metrics such as specific thrust and specific fuel consumption [1]. To continuously improve the fuel economy of civil aviation powerplants, the small-core engine has emerged as a primary development direction for next-generation commercial aero-engines [2,3]. However, as compressor dimensions are scaled down, manufacturing tolerances and material strength constraints impose unavoidable limitations: fine geometric features such as blade tip clearances, fillet radii at blade roots, and blade thicknesses cannot be reduced proportionally with the overall machine scale. Consequently, the ratio of tip clearance to blade height (s/H) increases. The industry defines operating conditions with a relative clearance of s/H > 4% as open-clearance regimes [4,5]. Numerous studies have confirmed that leakage flows under open-clearance conditions exhibit strong three-dimensional unsteady characteristics, and the flow field structures differ fundamentally from those observed in conventional small-clearance regimes [6,7].
The complexity of the flow field poses substantial challenges to the accuracy of numerical simulations. Yan et al. [8] evaluated the predictive performance of several turbulence models—SA, SST, k-ɛ, and the PAFV model developed based on lateral-averaged fluctuation velocity and mean strain rate tensors—in numerical simulations of the NASA Rotor 67 transonic compressor. The peak efficiency errors obtained were 2.2%, 1.6%, 0.9%, and 4.9%, respectively. Hah et al. [9] employed unsteady Reynolds-averaged Navier–Stokes (URANS) and large-eddy simulation (LES) to investigate the flow physics within an open tip clearance (5.5% of rotor chord) in a 1.5-stage axial compressor. Their results demonstrated that LES yielded satisfactory predictions of pressure rise, whereas URANS with standard two-equation turbulence closure underestimated the pressure rise by 15–20% of the measured values. Chen et al. [10] applied the shear stress transport (SST) model within the RANS framework, along with scale-adaptive simulation (SAS) and zonal LES (ZLES) as two scale-resolving approaches, to simulate flow in a low-speed axial compressor at three tip-clearance levels (1.3%, 2.6%, and 4.3% of chord length). They found that deviations between unsteady simulations and experimental data at the design point increased with growing tip-clearance size. Goto et al. [11] concluded that URANS provides superior matching and performance prediction for multi-stage axial compressors compared to steady RANS. Predictive accuracy was further enhanced by the improved delayed detached-eddy simulation (DDES), particularly in the tip-clearance region.
Although scale-resolving simulation methods such as LES can capture flow features more faithfully, their high computational cost limits their practicality in engineering applications. Whether through local grid refinement or adjustments to turbulence model parameters, the applicability and performance of various optimization strategies require validation against high-fidelity experimental flow field data. Therefore, the development of numerical methods with robust predictive capability relies on accurate experimental benchmarks.
Experimental investigation remains central to understanding the mechanisms of complex leakage flows. Early studies commonly employed pressure probes [12,13,14], laser Doppler velocimetry [15], and hot-wire anemometry [16] to examine tip-clearance effects. With the maturation of particle image velocimetry (PIV), non-intrusive, high-resolution transient flow field measurements have become feasible and have been widely adopted across various fields [17,18,19]. Xue et al. [20] introduced an optical window with a distortion-correcting surface and an anti-contamination periscopic laser probe for PIV measurements in a single-stage axial compressor. Their results showed that radial inflow near the blade pressure side drives the formation of the tip leakage flow, creating a low-velocity region on the pressure side and a high-velocity leakage region within the clearance. Tip leakage was identified as the primary cause of flow instability in the tip-clearance region. Lei et al. [21] performed stereoscopic PIV (SPIV) in a compressor cascade with varying tip clearances to investigate the wandering characteristics of the tip leakage vortex (TLV). They found that at a small tip clearance (1% chord), the vortex center exhibited a high probability of large displacement around its mean position, whereas at larger clearances (3% and 5% chord), the spatial distribution displayed nearly concentric contours near the mean vortex center. Li et al. [22] conducted an experimental study on the tip flow of two rotors with similar blade geometry but different tip clearances (0.49% vs. 2.3% chord) using SPIV. Their results indicated that increasing the clearance reduced the static pressure coefficient. At high flow rates, the larger clearance delayed TLV roll-up and detachment, reduced circulation, and postponed TLV breakdown, while also causing endwall boundary layer separation at the interface between the leakage flow and the mainstream. Li et al. [23] combined casing pressure measurements with SPIV to study the tip leakage flow behavior in a low-speed multi-stage axial compressor rotor at design and near-stall conditions. They performed three-dimensional Navier–Stokes simulations of the multi-stage compressor and compared the results with SPIV data and casing unsteady pressure measurements. Ayush et al. [24] employed SPIV in a refractive-index-matched facility to measure the full flow field of an axial compressor rotor, with particular emphasis on the leakage jet, double leakage, and TLV roll-up and breakdown in the tip region. Their results showed that these phenomena moved upstream as the flow rate decreased. Prior to stall, turbulent kinetic energy (TKE) increased sharply along the edge of the high circumferential velocity region following TLV breakdown. Lei et al. [25] used PIV to experimentally investigate the mean flow topology and vortex dynamics of transitional flow near the tip surface of C4 compressor blades under two configurations. Their results demonstrated that the region dominated by the leakage vortex was confined to within 20% of the blade height below the tip, suppressing laminar separation. Li et al. [26] conducted experiments on the first stage of a low-speed axial compressor at NASA Glenn to examine the effects of two tip clearances (0.49% and 2.3% chord) on tip flow and turbulence in an axial turbine. Their findings indicated that increasing the clearance significantly reduced pressure rise, delayed TLV roll-up and breakdown, and diminished endwall boundary layer entrainment. Cavitation images were consistent with SPIV results, and peak TKE was located in the TLV core, separation zone, and shear layer.
Despite these contributions, PIV-based experimental studies on large-clearance leakage flows relevant to small-core engines remain insufficient. In particular, test data that simulate realistic moving endwalls and fully capture the blade-to-blade (B2B) flow field within the tip clearance are still lacking.
To address this gap, the present study established a linear cascade test rig with a high-speed moving endwall and conducted SPIV measurements on a cantilevered cascade with a relative clearance of 7.14%. The work consists of two parts: first, a measurement uncertainty analysis to verify data reliability; second, acquisition of velocity fields in the B2B plane at two spanwise locations within the clearance under moving-endwall and large-clearance conditions. Furthermore, the spanwise distribution characteristics of the leakage flow at large clearance are analyzed and compared. This work not only demonstrates the applicability of SPIV for flow field measurements in large-clearance cascades with moving endwalls, but also provides an experimental foundation for uncovering the physical mechanisms of leakage flow and validating numerical models.
2. Subject and Methods
2.1. Experimental Facility and Cantilevered Cascade
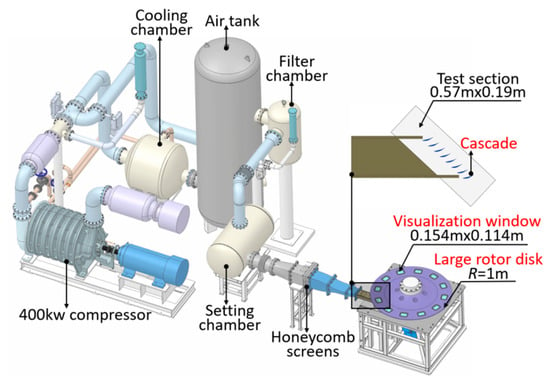
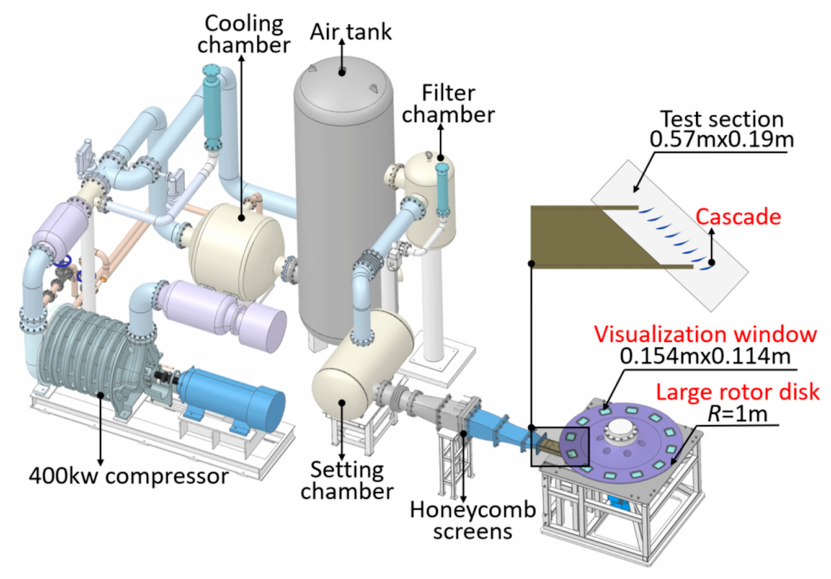
The experiments in this study were conducted in the high-speed cascade wind tunnel at Shanghai Jiao Tong University, with the facility schematically shown in Figure 1. This blow-down wind tunnel features low turbulence intensity and consists of a centrifugal compressor, cooler, air tank, filtration section, settling chamber, honeycomb straightener, test section, and a rotating turntable. The airflow is supplied by a 400 kW compressor. An air tank is placed upstream of the test section to buffer flow fluctuations, and the honeycomb and straightening grids ensure flow quality. The measured inlet turbulence intensity is 5%, which is lower than that in actual engine environments. The test section measures 0.57 m × 0.19 m × 0.07 m. The test section dimensions were selected by considering cascade flow periodicity, blade geometry, and experimental facility constraints. Following established linear compressor cascade designs, eight CDA blades forming seven complete passages were arranged to reduce sidewall interference and improve flow periodicity in the central passage. The SPIV measurements were conducted in the fourth passage to minimize boundary effects. Relative motion at the upper endwall is simulated by a large turntable with a diameter of 2 m and a maximum rotational speed of 2500 r/min, producing a peak blade tip tangential velocity of 220 m/s. This represents the design capability of the test rig, rather than the operating condition investigated in this study. This capability was intended to accommodate high relative-motion velocities relevant to compressor applications. The rotational speed can be adjusted to cover a range of flow coefficient conditions. Twelve sapphire observation windows (0.154 m × 0.114 m) are evenly distributed along the turntable circumference for camera imaging.
Figure 1.
The SJTU wind tunnel system with a high-speed rotating endwall cascade.
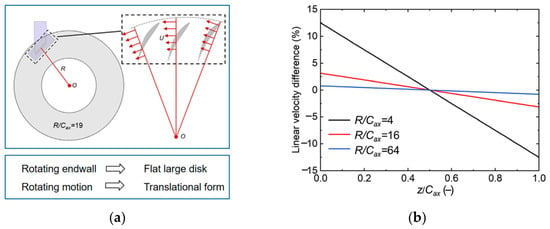
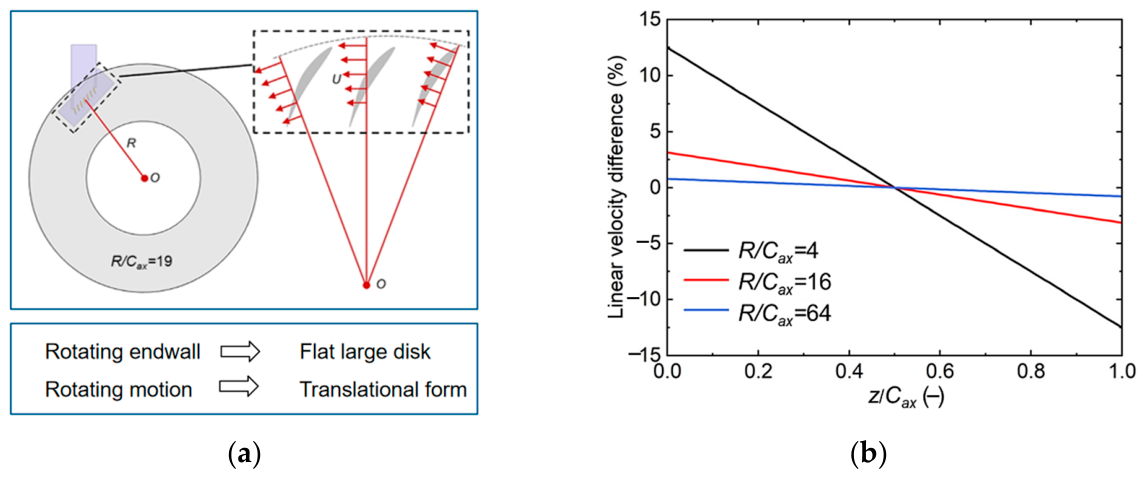
The underlying design philosophy of this test rig is to use the rotary motion of the large-diameter turntable to emulate the relative sliding between the blade tip and the casing or hub endwall during compressor operation, thereby reproducing the complex flow characteristics in the endwall region within a stationary cascade test section. The kinematic equivalence is based on simplifying circular rotation into linear translation, as illustrated in Figure 2a. Previous validation work by our research group has demonstrated that when the turntable radius is sufficiently large, the systematic error introduced by radial position differences becomes negligible [27]. When the radius-to-axial-chord ratio (R/Cax) reaches 16, the maximum linear velocity deviation is approximately 2.5%, as shown in Figure 2b. In the present study, this ratio is 19, further reducing the systematic deviation compared to previous work, so that the endwall motion can be treated as approximately translational.
Figure 2.
The schematic of the relative motion of the cascade endwall [27]: (a) Schematic of linear velocity change with the radius. (b) Evaluation of linear velocity difference.
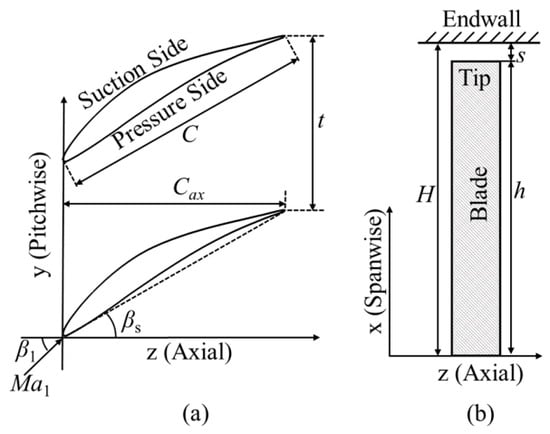
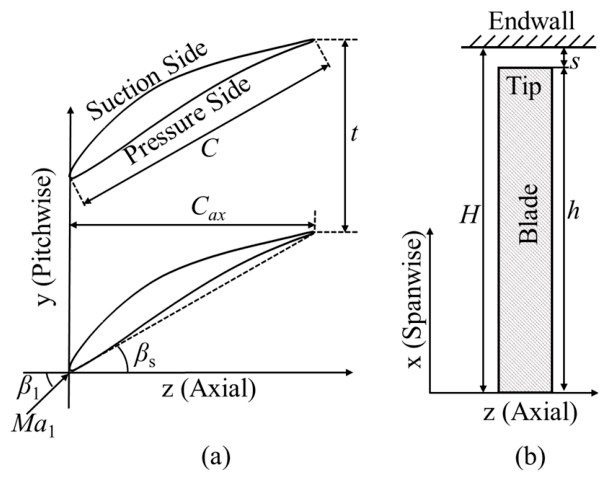
The test blades are of a controlled diffusion airfoil (CDA) type, with their geometric configuration and main design parameters presented in Figure 3 and Table 1, respectively. The suction surface and pressure surface are marked in Figure 3, which is convenient for later analysis. A single-row cascade arrangement is adopted in the test section, comprising eight blades and forming seven complete passages to ensure good flow periodicity. To minimize the influence of passage boundary layer interference on the measurement region, the stereoscopic particle image velocimetry (SPIV) measurement plane is positioned within the middle fourth passage.
Figure 3.
The schematic of the cantilevered cascade: (a) y-z view. (b) z-x view.
Table 1.
Parameters of cantilevered cascade.
2.2. Stereo PIV Setup
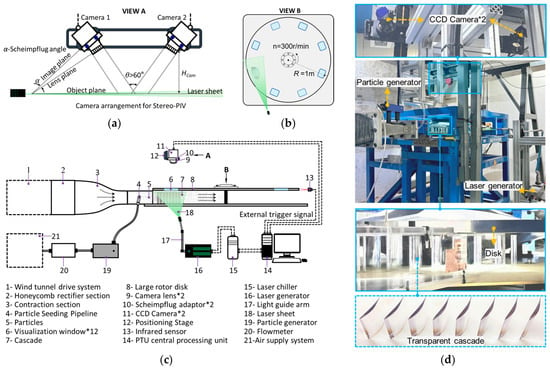
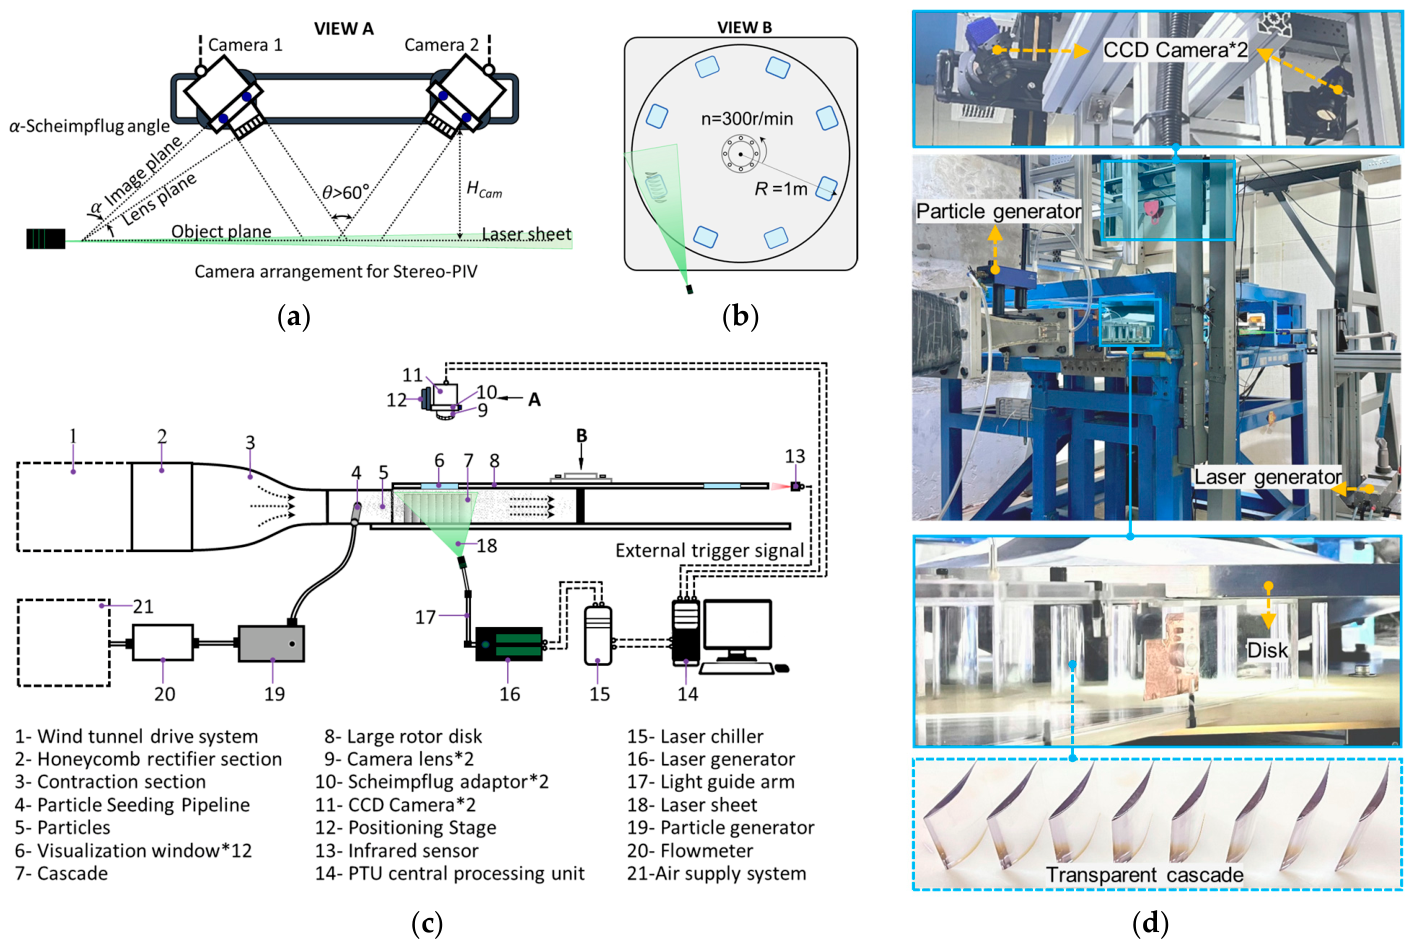
To enhance measurement stability and data accuracy, the present work adopted a modified SPIV optical configuration, in which the light guide arm was positioned laterally to the measurement passage. This arrangement effectively avoids interference from the outlet flow and the rotating endwall with the optical path, thereby meeting the requirements for high-resolution flow field measurements in the blade tip region. The overall system layout and optical configuration are shown in Figure 4. The measurement hardware includes a laser source (16), a seed particle atomizer (19), two CCD cameras (11), a photoelectric synchronizer (13), and a PTU centralized control unit (14). Specifications of each device are listed in Table 2. The laser pulse interval was set to 2 μs, with a maximum repetition rate of 15 Hz, and triggered by an external signal during the experiments. Both cameras were placed on the same side as the light sheet and mounted on a displacement adjustment mechanism specifically designed for this test rig, while satisfying the Scheimpflug condition to ensure sharp imaging across the entire measurement region, as shown in Figure 4a,d. The laser entered from the side of the passage, with its propagation direction parallel to the blade tip plane (Figure 4b,c).
Figure 4.
The stereoscopic particle image velocimetry (SPIV) test system: (a) VIEW A. (b) VIEW B. (c) Detailed schematic diagram. (d) Detailed photograph. Note: * indicates the number of components.
Table 2.
Main parameters of the SPIV system.
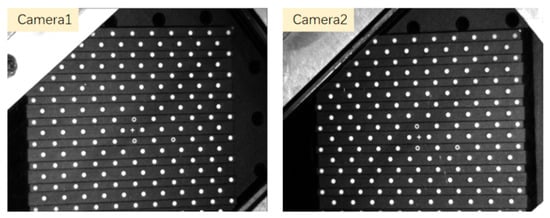
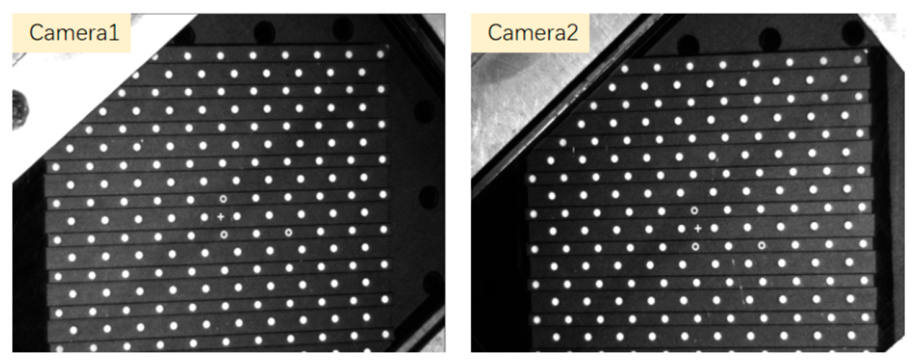
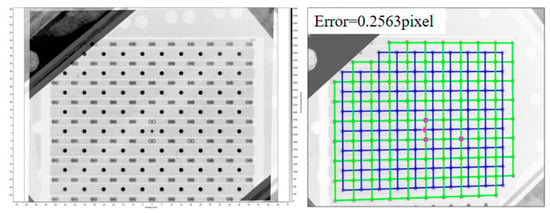
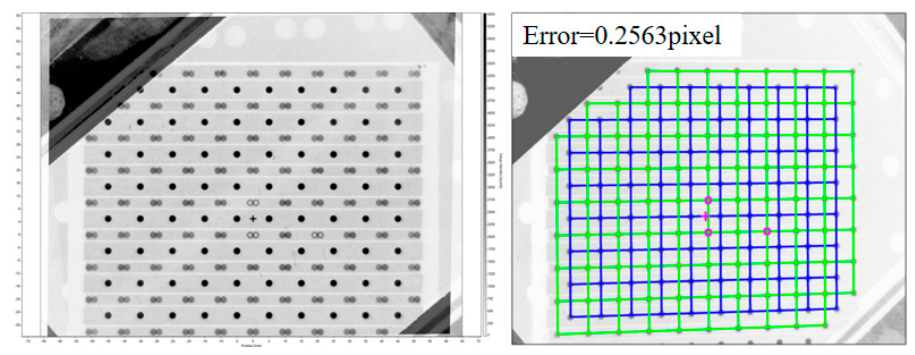
Prior to SPIV acquisition, the system was calibrated using a dual-side dual-plane (DSDP) target through the sapphire glass observation window, as shown in Figure 5. During the procedure, the calibration target was first accurately positioned at the measurement plane. The tilt angle and focal length of each camera were then adjusted until clear and uniformly focused images were obtained across the full field of view. After completing the calibration routine, the fitting residuals were obtained as shown in Figure 6, with values of 0.2563 pixels for Camera. Converted using a calibration scale of 21.66 pixels/mm, the corresponding spatial errors were 0.0082 mm and 0.0118 mm, respectively. According to the calibration quality criteria reported for LaVision DaVis 11 [28], an RMS fitting error below 0.3 pixels is considered an excellent calibration level. The calibration residuals of both cameras satisfy this criterion, indicating satisfactory calibration accuracy for the present SPIV measurements.
Figure 5.
Clear identification of the calibration target.
Figure 6.
Calibration identification and results.
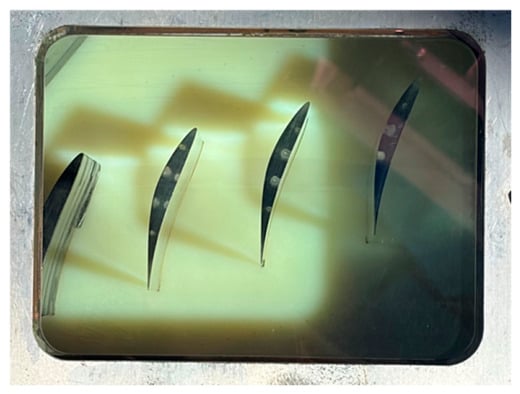
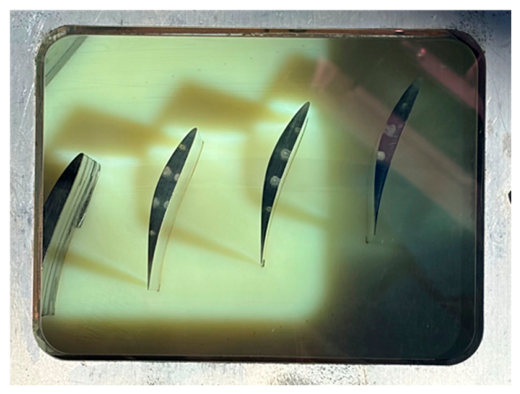
The sapphire observation windows on the rotating endwall turntable are shown in Figure 7. The CDA blades within the passage form a periodic cascade. The high-strength transparent sapphire provides distortion-free optical access for the SPIV system. The middle passage was selected for measurements to avoid sidewall boundary interference and preserve flow periodicity.
Figure 7.
Visualization window.
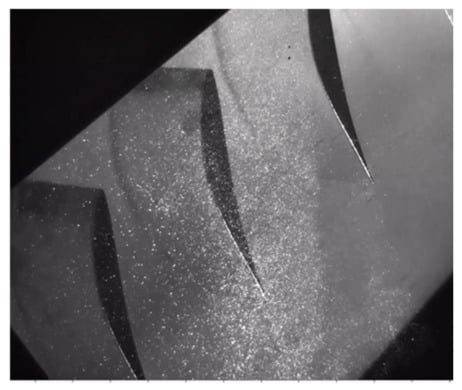
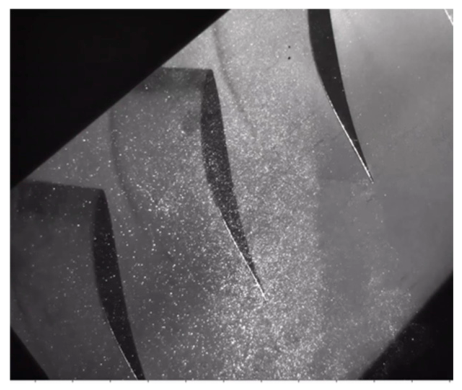
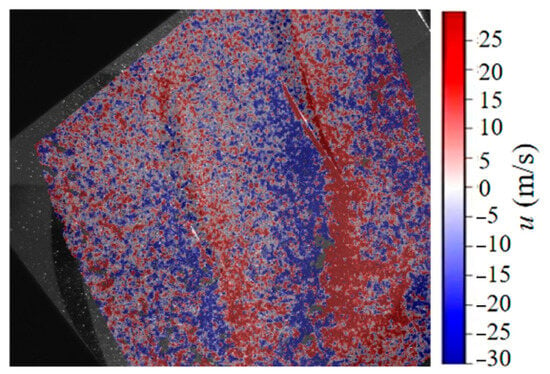
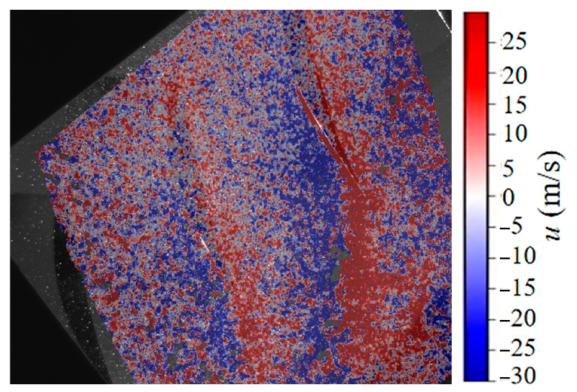
Figure 8 presents the raw particle images from the experiment. Tracer particles are uniformly distributed across the entire field of view, with sufficient seeding density in both the blade gap and the mainstream region. Image contrast is satisfactory, with only minor reflection at the trailing edge, which does not affect accurate particle displacement evaluation. Figure 9 shows the instantaneous spanwise velocity contour. Red indicates positive spanwise velocity (u), while blue denotes negative u. On the pressure side, the red region corresponds to the leakage jet lift-up zone driven by the pressure differential. On the suction side, the blue region corresponds to the reverse spanwise flow induced by the leakage vortex. The shear effect from the moving endwall causes a circumferential shift in the vortex core. The irregular fluctuations in the contour boundaries visually reflect the strong unsteady nature of the leakage flow. Overall, the image data confirm that the SPIV measurement approach in this study is reliable.
Figure 8.
Particle scattering results.
Figure 9.
Instantaneous SPIV result.
2.3. Measurement Plan
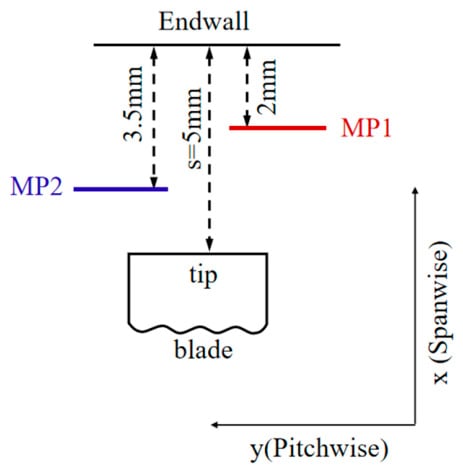
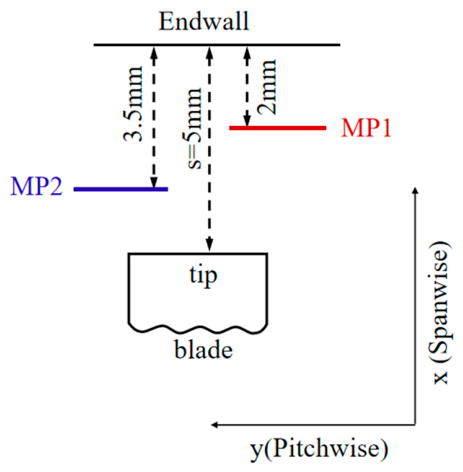
In the present experiments, the peak inflow velocity U∞ was approximately 110 m/s, corresponding to a chord-based Reynolds number Rec of 4.15 × 10⁵. All SPIV acquisitions were performed at an inlet Mach number of 0.3 and a flow incidence angle of 0°. To examine the effect of the moving endwall on the tip leakage flow in the open clearance configuration, measurements were conducted across multiple planes. Table 3 lists the details of the two measurement planes. With the endwall rotating at 900 r/min, the corresponding tangential velocity at the endwall surface was 80.1 m/s, and the two planes were located at distances of 2 mm and 3.5 mm from the endwall, respectively. The test rig was designed to achieve a maximum endwall tangential velocity of 220 m/s to accommodate investigations involving high relative-motion velocities. In the present study, a controlled operating condition of approximately 80 m/s was adopted, primarily to demonstrate the feasibility of SPIV measurements inside a narrow tip clearance under high-speed moving-endwall conditions and to reveal the spatial variations in leakage-flow characteristics under the investigated condition. The effective acquisition rate of the SPIV system was constrained by the laser repetition rate, camera frame rate, and external trigger signals. With the endwall in motion, the sampling frequency was synchronized with the turntable speed and set to 15 Hz for the 900 r/min condition. The final imaging measurement planes were located within the blade tip region. Two planes (MP1 and MP2) were measured in this experiment, positioned at 2 mm and 3.5 mm from the upper endwall, respectively. The specific locations of MP1 and MP2 are illustrated in Figure 10.
Table 3.
Operating conditions and SPIV measurement planes.
Figure 10.
SPIV measurement plane.
3. Results and Discussion
3.1. Error Analysis of SPIV
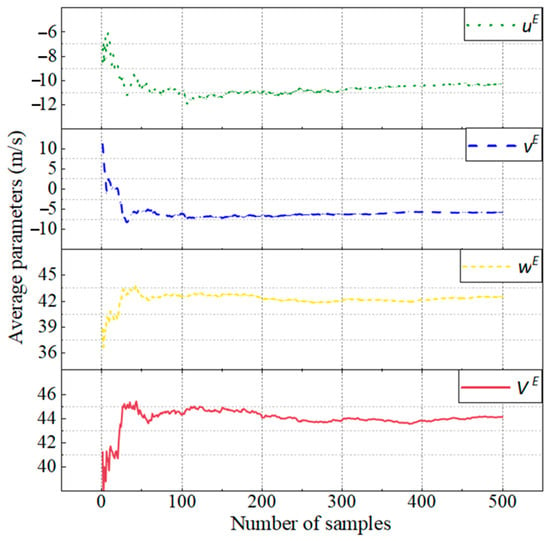
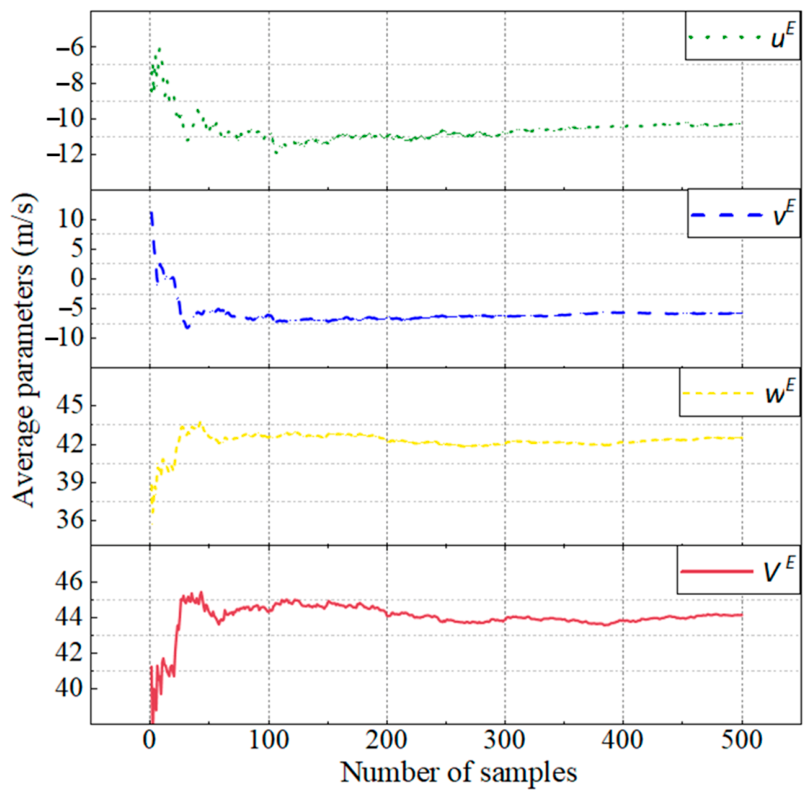
To obtain reliable time-averaged flow field data, a sufficient number of samples is required to achieve statistical convergence [29]. Figure 11 presents the variation in time-averaged velocity components at a monitoring point with increasing sample count, showing the mean velocity VE and its three components (uE, vE, wE). These curves allow a direct assessment of the statistical convergence behavior of the SPIV flow field data. When the sample count is low, turbulent fluctuations cause notable oscillations in the mean velocities, and a small number of samples cannot adequately represent the time-averaged flow characteristics, leading to obvious statistical deviations. As the sample size increases, the fluctuations due to turbulent random motion are gradually smoothed out, and the amplitudes of all four curves continue to narrow. Once the sample count reaches 300, all velocity curves enter a stable plateau, with no further significant variations, indicating that the flow statistics have fully converged. In the present experiment, 500 instantaneous flow field samples were acquired for each operating condition. This total is well above the convergence threshold. Combined with phase-locked averaging, this approach effectively minimizes the statistical uncertainty introduced by turbulent fluctuations, providing a reliable data foundation for subsequent quantitative calculations of time-averaged flow fields, Reynolds stresses, vorticity, and other derived quantities.
Figure 11.
Effect of sample size on cumulative-averaged quantities.
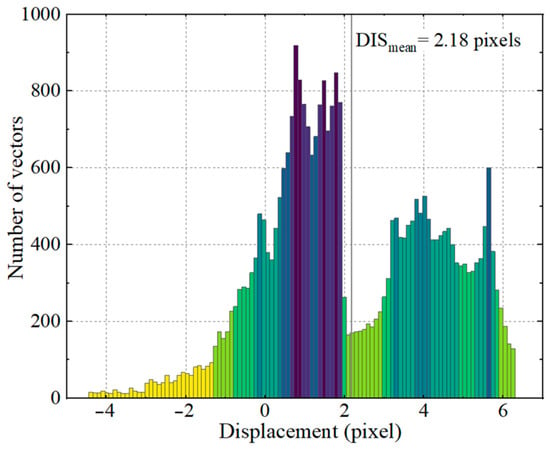
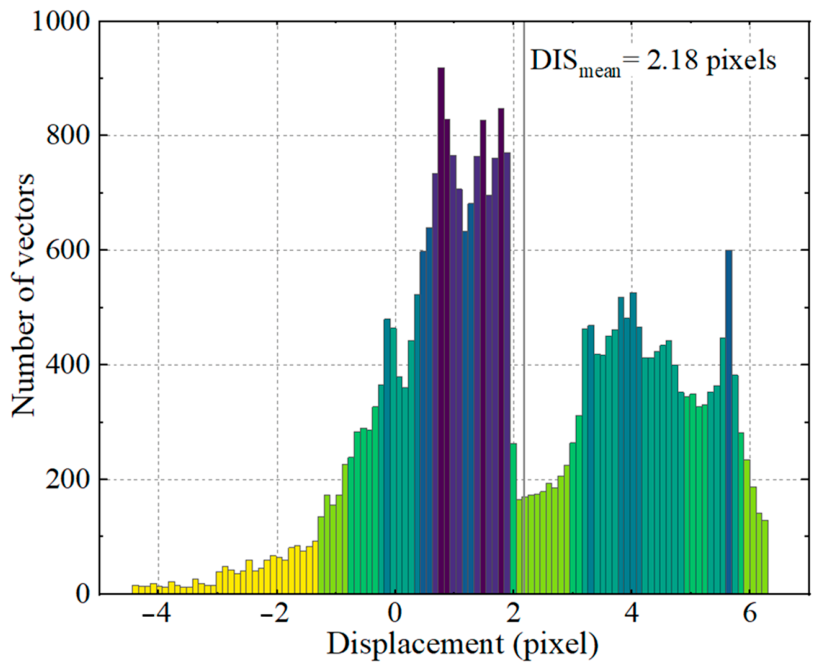
Figure 12 presents the histogram of particle image displacement distribution in the entire measurement field. In SPIV measurements, special attention must be paid to avoid peak-locking effects. The primary cause of peak-locking is that particle image displacements concentrate at integer pixel positions, which significantly reduces the accuracy of sub-pixel fitting and introduces systematic bias into velocity calculations [30]. In the present study, the average particle displacement exceeds 2 pixels, and the displacement values are continuously and uniformly distributed across the pixel range. The histogram shows no abnormally high peaks at integer pixel positions, indicating that the peak-locking issue has been effectively suppressed at the imaging level.
Figure 12.
Particle displacement histogram in the entire measurement field.
During the post-processing stage, particle image processing was performed using LaVision DaVis 11 Background noise reduction was applied to mitigate stray-light interference and wall reflections, improving the signal-to-noise ratio of particle images. Following the initial calibration using the DSDP target, Stereo-PIV self-calibration was performed based on the particle-image disparity method proposed by Wieneke [31]. This procedure corrects residual misalignment between the laser sheet and the initial calibration plane, thereby improving the accuracy of the three-component velocity reconstruction. The instantaneous displacement errors in the yE and zE directions were estimated to be within 0.3 pixels (approximately 0.014 mm), which is sufficient to resolve the leakage flow structures within the tip clearance. For the spanwise velocity component normal to the measurement plane, Zang et al. [32] pointed out that the measurement accuracy is governed by the angle between the laser sheet and the two cameras. For the same-side camera configuration (SSC) adopted in this work, the displacement error satisfies the following relation:
With the included angle of the two cameras at 120°, the upper bound of the displacement error in the xE direction was calculated to be 0.17 pixels (0.008 mm).
In addition, the velocity uncertainties across the flow field were evaluated using the methods adopted in previous studies [33,34,35]. The uncertainties of the three velocity components were estimated to be approximately 1.5%, 1.5%, and 2%, respectively, with an overall uncertainty of less than 5%. Combined with the sample convergence curves and the particle displacement histogram, the overall assessment indicates that both the statistical uncertainty and the instantaneous imaging errors of the SPIV measurement system in this study are maintained within acceptably low ranges for engineering applications. The 500 samples acquired for each condition ensure full convergence of the time-averaged flow statistics, and the continuous uniform particle displacement distribution effectively mitigates the primary systematic error source in PIV measurements. The overall measurement system is well suited for characterizing the complex leakage flow in an open tip-clearance configuration. The resulting three-dimensional velocity fields and second-order turbulence statistics provide reliable quantitative data for flow mechanism analysis. Furthermore, this dataset can serve as a high-fidelity benchmark for validating and assessing the predictive accuracy of various turbulence models.
3.2. Experimental Results and Analysis
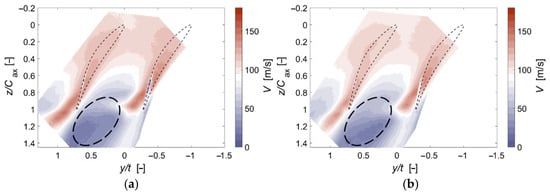
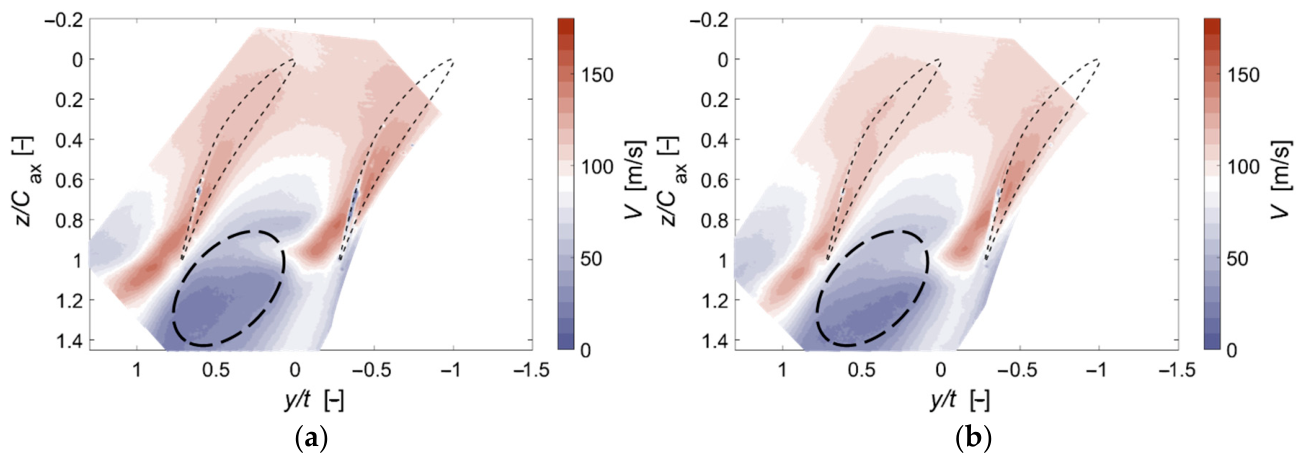
Figure 13 presents the magnitude of the resultant velocity distribution in different planes within the tip clearance. The overall flow distributions in planes MP1 and MP2 are generally consistent. The upstream passage flow accelerates along the suction surface, forming a high-velocity region corresponding to the mainstream inflow. In the downstream region, a large low-velocity zone appears, which is a low-momentum accumulation region formed by the interaction of the tip leakage vortex with the mainstream, endwall boundary layer, and wakes. This zone is also the region responsible for inducing passage aerodynamic blockage. Comparing the two measurement planes in detail, the overall resultant velocity in plane MP2 is lower than that in the near-endwall plane MP1. Since MP1 is closer to the moving endwall, the shear from the endwall continuously imparts momentum to the fluid in the upper part of the gap. Consequently, the high-velocity mainstream region exhibits higher color saturation and a broader coverage area. In contrast, MP2 is farther from the moving endwall, receives less momentum input from endwall motion, and thus has lower overall kinetic energy and a reduced velocity level across the entire field. Meanwhile, the low-velocity blockage region in the downstream exhibits distinct spanwise stratification between the two planes. In MP1 near the endwall, the low-velocity region is smaller in area and has relatively higher velocity magnitudes. In MP2 near the blade tip, the low-velocity region covers a larger extent, with more pronounced accumulation of low-momentum fluid.
Figure 13.
Distributions of resultant velocity V at different planes in clearance: (a) MP1. (b) MP2.
From the perspective of aerodynamic loss, the larger low-velocity blockage area in MP2 indicates that the effective flow area of the passage is more severely occupied by low-momentum leakage fluid at this spanwise location, resulting in stronger aerodynamic blockage and higher flow losses. Near the endwall in MP1, the momentum of the low-velocity fluid is partially replenished by endwall shear acceleration, alleviating the degree of blockage. The velocity differences between the two planes demonstrate that the aerodynamic blockage effect within the open tip clearance exhibits a spanwise stratified distribution, with the blade tip region being the area where flow blockage and aerodynamic losses are most concentrated.
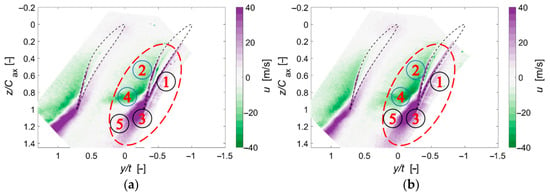
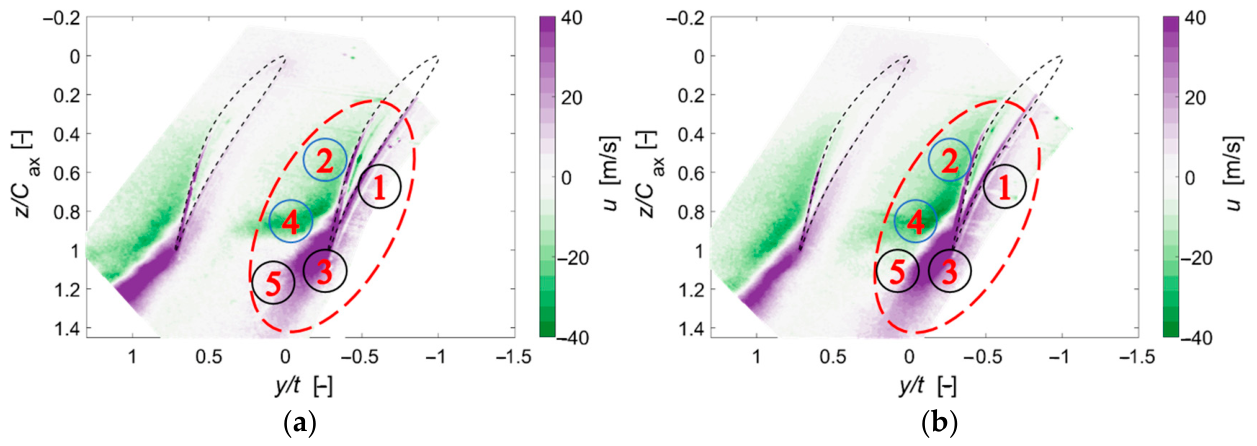
Figure 14 compares the spanwise velocity contours between the near-endwall plane MP1 and the near-tip plane MP2. The overall flow structures on the two planes are highly consistent, both reproducing the evolution path of the pressure-difference-driven tip leakage flow. In the figure, the two regions of high spanwise velocity, ① and ②, correspond to the tip flow driven by the pressure difference, which turns from the pressure side (PS) toward the suction side (SS). As the leakage flow develops downstream, regions ③ and ④ with high spanwise velocity appear on the suction side near the trailing edge, where the leakage intensity is relatively high. The high spanwise velocity decreases substantially throughout region ⑤, indicating that the leakage vortex rapidly moves away from the endwall at this location, resulting in a region of low spanwise velocity within the measurement plane.
Figure 14.
Distributions of spanwise velocity u at different planes in the clearance: (a) MP1. (b) MP2.
Comparing the two planes in detail, in the near-tip plane MP2, regions ① and ③ exhibit larger coverage areas and higher color saturation. In this region, the fluid has just crossed the blade tip, with the spanwise momentum induced by the pressure difference highly concentrated and the leakage vortex remaining compact. In contrast, in the near-endwall plane MP1, the shear from the moving endwall stretches and disperses the concentrated high-velocity fluid along the pitchwise direction. The areas of high-velocity regions ① and ③ are reduced, and the vortex core shifts slightly in the pitchwise direction. The velocity differences between the two planes clearly reflect the competing effects of the two driving forces: endwall shear and blade pressure difference. In the near-tip plane MP2, the flow is dominated by the blade pressure difference, resulting in a larger high-velocity region. In the near-endwall plane MP1, the endwall shear effect is stronger, stretching the leakage flow in the circumferential direction and shrinking the spanwise high-velocity core region.
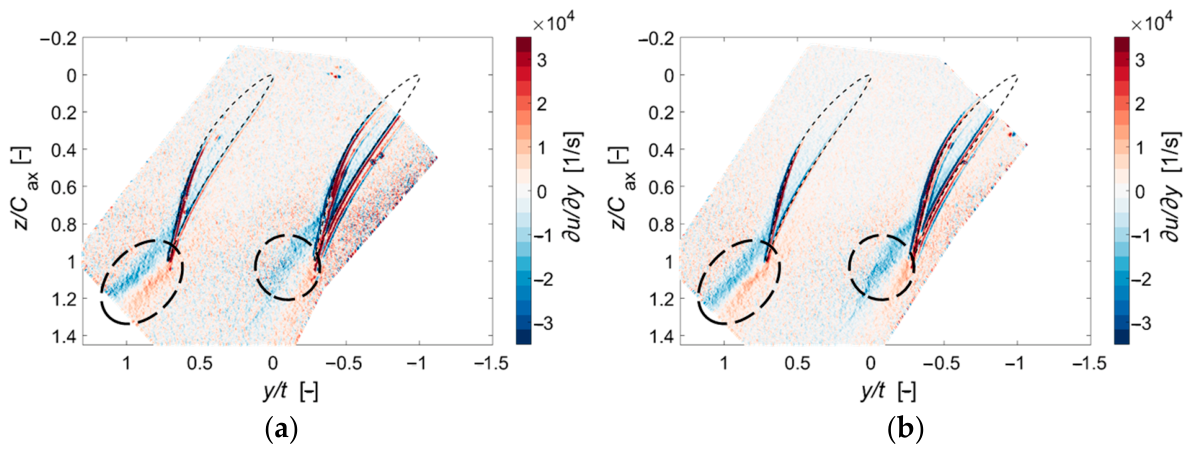
Figure 15 presents the spanwise velocity gradient fields on planes MP1 and MP2. The distribution patterns of the spanwise velocity gradient on the two planes are highly consistent. High-gradient regions are all concentrated in the area downstream of the blade trailing edge, marked by the dashed ellipses, which coincide precisely with the leakage vortex locations identified in the previous analyses. The spanwise velocity in the leakage flow region varies sharply in the circumferential direction, resulting in a strong velocity shear gradient. This region is also the core area where turbulent mixing and aerodynamic losses are concentrated. Inside the main passage, the gradient values approach zero, indicating that the flow is uniform and stable. In plane MP2, the gradient coverage within the dashed ellipse is larger and the color saturation is deeper, indicating more intense spanwise velocity variations and higher shear strength. In plane MP1, which is closer to the moving endwall, the gradient magnitude is slightly lower, and the extent of the high-gradient region is smaller. The reason for this spanwise difference lies in the fact that MP2 is closer to the blade tip, where the leakage flow originates. The high-speed leakage jet from the pressure side and the backflow from the suction side converge directly in this region, with two fluid flows of opposing momentum mixing in close proximity, resulting in a larger velocity jump. MP1 is nearer to the endwall, where the shear motion laterally stretches and dilutes the leakage flow, reducing the velocity difference between the two fluid flows and consequently lowering the spanwise velocity gradient. Combined with the resultant velocity and spanwise velocity fields discussed earlier, plane MP2 not only exhibits a larger low-velocity blockage region but also has a stronger velocity shear gradient, where turbulent mixing and flow losses are superimposed. In plane MP1, the wall motion accelerates and dilutes the flow, thereby alleviating both shear and blockage effects.
Figure 15.
Distributions of spanwise velocity gradient at different planes in clearance: (a) MP1. (b) MP2.
The turbulent kinetic energy (TKE) was calculated from the three instantaneous velocity components (uE, vE, and wE) measured by SPIV. At each measurement location, the mean velocity components were obtained by ensemble averaging 500 instantaneous velocity fields. The velocity fluctuations were then determined by subtracting the corresponding mean velocities from the instantaneous values, and TKE was calculated as half the sum of the mean squared fluctuations of the three velocity components:
where the mean velocity is calculated as follows:
The mean values of vE and wE are calculated in the same manner, with (N = 500). The overbar denotes ensemble averaging and the prime represents velocity fluctuations. Since all three velocity components were directly measured by SPIV, no isotropic turbulence assumption was required for the TKE calculation.
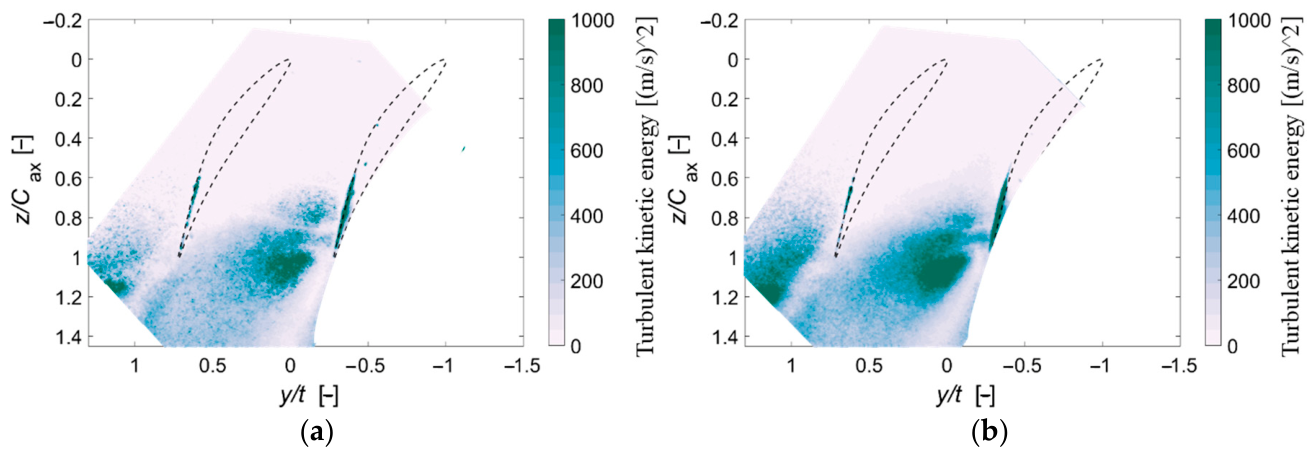
Figure 16 shows the turbulent kinetic energy (TKE) distributions on planes MP1 and MP2. The overall TKE distribution characteristics are similar between the two planes. High-TKE regions are mainly concentrated on the suction side downstream of the blade trailing edge, coinciding with the locations of the leakage vortex and the high-velocity-gradient regions discussed earlier. After the tip leakage jet crosses the blade tip, it undergoes intense shear mixing with the mainstream, inducing substantial unsteady flow fluctuations and forming a concentrated high-loss region. Within the main passage, TKE levels remain generally low, indicating a relatively stable flow state with negligible turbulent losses. Comparing the two planes, it is evident that in plane MP2, closer to the blade tip, the high-TKE region covers a broader area and exhibits higher peak fluctuation values, indicating significantly stronger turbulent mixing than in the near-endwall plane MP1. MP2 is located near the origin of the leakage flow, where the high-speed leakage fluid from the pressure side directly interacts with the low-speed backflow from the suction side. The large momentum difference between these two flows produces strong shear, enhancing turbulent fluctuations. In contrast, plane MP1, closer to the moving endwall, is influenced by the endwall drag effect, which stretches and dilutes the leakage vortex fluid along the pitchwise direction. This reduces the velocity difference between the two flows and alleviates the degree of turbulent mixing, resulting in lower overall TKE levels and a notably contracted high-fluctuation core region.
Figure 16.
Distributions of turbulent kinetic energy at different planes in clearance: (a) MP1. (b) MP2.
4. Conclusions
This study was conducted on the high-speed rotating endwall cantilevered CDA cascade test rig, targeting open-clearance conditions relevant to small-core compressors. SPIV measurements were performed at an inlet Mach number of 0.3 and an endwall rotational speed of 900 r/min, capturing three-dimensional velocity fields in two blade-to-blade planes within the tip clearance, located at 2 mm and 3.5 mm from the moving endwall. Through uncertainty assessment and analysis of velocity, velocity gradient, and turbulent kinetic energy distributions, the spanwise variations in leakage flow characteristics under moving-endwall conditions were examined. The main conclusions are as follows:
- High-resolution SPIV measurements of three-dimensional velocity fields were achieved within the confined space of a large open tip clearance (s/H = 7.14%) under high-speed blade–endwall relative motion. Unlike previous measurements, the present study captured the internal leakage flow at two spanwise locations. Calibration and uncertainty assessments confirmed that the measurements met the required accuracy criteria, providing reliable experimental data for revealing the three-dimensional characteristics of leakage flows.
- The SPIV data acquired within the tip clearance resolve the spanwise variation in leakage flow characteristics under moving-endwall conditions. In the near-tip plane MP2, dominated by the blade pressure difference, the leakage jet covers a broader high-velocity region and the vortex structure remains more concentrated. In the near-endwall plane MP1, endwall shear stretches and diffuses the leakage flow pitchwise, expanding the reverse-flow region and displacing the leakage vortex.
- Aerodynamic blockage, velocity shear, and turbulent losses exhibit distinct spanwise distributions within the tip clearance. The near-tip plane MP2, located closer to the leakage flow formation region, exhibits a wider low-velocity blockage zone, higher spanwise velocity gradients, and elevated turbulent kinetic energy, making it the primary region of shear mixing and aerodynamic loss. Compared with MP2, the near-endwall plane MP1 exhibits a smaller low-velocity region, weaker velocity gradients, and lower TKE levels. These differences suggest that endwall-induced shear may redistribute momentum and modify leakage-flow mixing near the moving endwall.
It should be noted that the present study is limited to two measurement planes within the 5 mm tip clearance due to the optical and spatial constraints of SPIV measurements under high-speed moving-endwall conditions, which prevents a complete characterization of the continuous spanwise evolution of the leakage flow. Furthermore, the experiments were conducted at a single operating condition (Ma = 0.3, incidence angle of 0°, endwall speed of 900 r/min, and s/H = 7.14%), with an inlet turbulence intensity of 5%, lower than that in some actual engine environments. Therefore, the observed flow characteristics and spanwise differences are specific to the present conditions, and their general applicability requires further validation. Future work will extend the measurements to additional spatial locations and a wider range of operating conditions, including inlet turbulence intensity, endwall speed, and tip-clearance size, to further investigate leakage-flow development and assess the generality of the present findings.
Author Contributions
Conceptualization, C.C. and M.Z.; methodology, M.Z.; software, C.C.; data curation, A.S.; writing—original draft preparation, C.C. and H.W.; writing—review and editing, C.C.; visualization, C.C.; supervision, G.Z., M.Z. and J.T. All authors have read and agreed to the published version of the manuscript.
Funding
This research was supported by the Natural Science Foundation of China (No. 52376027), the Fundamental Research Funds for the Central Universities, the Natural Science Foundation of Shanghai (No. 23ZR1435400), and the United Innovation Center (UIC) of Aerothermal Technologies for Turbomachinery.
Data Availability Statement
The data supporting the findings of this study are available from the corresponding author upon reasonable request.
Conflicts of Interest
The authors declare no conflicts of interest.
Abbreviations
The following abbreviations are used in this manuscript:
| B2B | Blade-to-Blade |
| CCD | Charge-Coupled Device |
| CDA | Controlled Diffusion Airfoil |
| EXP | Experiment |
| LE, TE | Leading Edge, Trailing Edge |
| Nomenclature | |
| C | chord length (mm) |
| h | blade height (mm) |
| H | channel height (mm) |
| Hcam | distance from the lens to the subject (mm) |
| Ma | inflow Mach number (−) |
| R | radius of the large rotor disk (m) |
| s | tip-clearance height (mm) |
| u, v, w | velocities in the x, y, and z directions (m/s) |
| V | resultant velocity (m/s) |
| x | spanwise |
References
- Suder, K.L. NASA’s role in gas turbine technology development: Accelerating technical progress via collaboration between academia, industry, and government agencies. J. Turbomach. 2021, 143, 011006. [Google Scholar] [CrossRef] [Scilit]
- Prashanth, P.; Speth, R.L.; Eastham, S.D.; Sabnis, J.S.; Barrett, S.R. Post-combustion emissions control in aero-gas turbine engines. Energy Environ. Sci. 2021, 14, 916–930. [Google Scholar] [CrossRef] [Scilit]
- Botros, B.; Evans, S.; Dong, Y.; Rose, B.; Murphy, A.; Zukowski, M. NASA High Efficiency, High OPR Capable Small Core Compressor; Final Report No. FR-29184-2; Pratt & Whitney: East Hartford, CT, USA, 2021. [Google Scholar]
- Evans, S.; Yi, J.; Nolan, S.; Joseph, L.; Ni, M.; Kulkarni, S. Modeling of axial compressor with large tip clearances. J. Turbomach. 2021, 143, 061007. [Google Scholar] [CrossRef] [Scilit]
- Tan, D.; Li, Y.; Wilkes, I.; Miorini, R.L.; Katz, J. Visualization and time-resolved particle image velocimetry measurements of the flow in the tip region of a subsonic compressor rotor. J. Turbomach. 2015, 137, 041007. [Google Scholar] [CrossRef] [Scilit]
- Seki, R.; Azuma, T.; Iwatani, J.; Nakaniwa, A.; Okui, H.; Shibata, T. Investigation of tip leakage vortex breakdown in a high-speed multistage axial compressor. J. Turbomach. 2023, 145, 071017. [Google Scholar] [CrossRef] [Scilit]
- Xia, K.; Deng, H.; Zhang, H.; Zhu, M.; Qiang, X.; Teng, J. Overall performance and loss analysis of a low-speed research compressor with different nonaxisymmetric tip clearance layouts. J. Aerosp. Eng. 2023, 36, 04023055. [Google Scholar] [CrossRef] [Scilit]
- Yan, W.; Sun, Z.; Zhou, J.; Zhang, K.; Wang, J.; Tian, X.; Tian, J. Numerical simulation of transonic compressors with different turbulence models. Aerospace 2023, 10, 784. [Google Scholar] [CrossRef] [Scilit]
- Hah, C. Flow physics in a large rotor tip gap in a multi-stage axial compressor. In Turbo Expo: Power for Land, Sea, and Air; American Society of Mechanical Engineers: New York, NY, USA, 7–11 June 2021; Volume 2A, Article No. V02AT31A015. [Google Scholar]
- Chen, X.; Koppe, B.; Lange, M.; Chu, W.; Mailach, R. Comparison of turbulence modeling for a compressor rotor at different tip clearances. AIAA J. 2022, 60, 1186–1198. [Google Scholar] [CrossRef] [Scilit]
- Goto, T.; Oshio, T.; Tani, N.; Aotsuka, M.; Pallot, G.; Kato, D. Effect of turbulence model on the prediction of performance and span-wise mixing in high-speed highly-loaded multi-stage axial-flow compressor. In Proceedings of the ASME Turbo Expo 2019: Turbomachinery Technical Conference and Exposition, Phoenix, AZ, USA, 17–21 June 2019; Volume 2A: Turbomachinery. [Google Scholar]
- Kielb, R.E.; Barter, J.W.; Thomas, J.P.; Hall, K.C. Blade excitation by aerodynamic instabilities: A compressor blade study. In Proceedings of the Turbo Expo: Power for Land, Sea, and Air, Atlanta, Georgia, 16–19 June 2003; Volume 36878, pp. 399–406. [Google Scholar]
- Zhang, C.; Hu, J.; Wang, Z. Investigations on the effects of inflow condition and tip clearance size to the performance of a compressor rotor. J. Eng. Gas Turbines Power 2014, 136, 122608. [Google Scholar] [CrossRef] [Scilit]
- Inoue, M.; Kuroumaru, M.; Yoshida, S.; Minami, T.; Yamada, K.; Furukawa, M. Effect of tip clearance on stall evolution process in a low-speed axial compressor stage. In Proceedings of the ASME Turbo Expo 2004: Power for Land, Sea, and Air; ASME: New York, NY, USA, 2004; Volume 5, pp. 385–394. [Google Scholar]
- Mailach, R.; Lehmann, I.; Vogeler, K. Rotating instabilities in an axial compressor originating from the fluctuating blade tip vortex. J. Turbomach. 2001, 123, 453–460. [Google Scholar] [CrossRef] [Scilit]
- Pakmehr, M.; Behbahani, A.; Houtz, N.; Macmann, O. Overview of modern instrumentation technology concerning prognostics and health management and control in aero turbine engines. In Proceedings of the Transitioning Gas Turbine Instrumentation from Test Cells to On-Vehicle Applications, NATO STO Meeting Proceedings, STO-MP-AVT-306, Athens, Greece, 3–7 December 2018. [Google Scholar]
- Ji, L.; Pu, W.; Li, W.; Shi, W.; Yang, Y.; Xiao, C.; Agarwal, R. PIV experimental study on dynamic and static interference flow field of multi-operating centrifugal pump under the influence of impeller wake. Exp. Therm. Fluid Sci. 2025, 161, 111355. [Google Scholar] [CrossRef] [Scilit]
- Jing, F.; Zhang, D.; Mei, Y.; Wang, X. Experimental investigation of the near-wake characteristics of a horizontal-axis tidal turbine using particle image velocimetry. Energy 2026, 360, 141826. [Google Scholar] [CrossRef] [Scilit]
- Pacherres, C.O.; Huber, A.A.; Murthy, S.; Kühl, M. A scanning particle image velocimetry system for spatial mapping of steady flow and O2 concentration fields around aquatic organisms. Methods Ecol. Evol. 2025, 16, 1674–1687. [Google Scholar] [CrossRef] [Scilit]
- Xue, Z.; Liao, Z.; Shen, J.; Zhou, Y.; Jin, Q.; Wu, X. Experimental study on flow field measurements inside the tip clearance of an axial compressor using PIV. Int. J. Turbo Jet-Engines 2026, 43, 687–698. [Google Scholar]
- Shi, L.; Yan, W.; Ma, H.; Wang, T. Experimental investigation of characteristics and influence of tip leakage vortex wandering in an axial compressor cascade. Phys. Fluids 2023, 35, 115107. [Google Scholar] [CrossRef] [Scilit]
- Li, Y.; Chen, H.; Tan, D.; Katz, J. Effects of tip clearance and operating conditions on the flow structure and turbulence within an axial compressor rotor passage. In Turbo Expo: Power for Land, Sea, and Air; American Society of Mechanical Engineers: New York, NY, USA, 2016; Volume 49699, Article No. V02AT37A030. [Google Scholar]
- Li, J.; Hu, J.; Zhang, C. Experimental investigation of the tip leakage flow in a low-speed multistage axial compressor. Sci. Prog. 2020, 103, 0036850420951070. [Google Scholar] [CrossRef] [Scilit] [PubMed]
- Saraswat, A.; Koley, S.S.; Joly, M.; Katz, J. Evolution of flow and turbulence over the entire tip region of an axial compressor rotor. Exp. Fluids 2025, 66, 87. [Google Scholar] [CrossRef] [Scilit]
- Shi, L.; Mao, R.; Ma, H.; Wang, T. Flow structure and vortex dynamics of blade surface transitional flow in the near-tip region of a compressor cascade. Phys. Fluids 2023, 35, 094102. [Google Scholar] [CrossRef] [Scilit]
- Li, Y.; Tan, D.; Chen, H.; Katz, J. Effects of tip gap size on the flow structure in the tip region of an axial turbomachine. In Fluids Engineering Division Summer Meeting; American Society of Mechanical Engineers: New York, NY, USA, 26–31 July 2015; Volume 1, Article No. V001T33A023. [Google Scholar]
- Deng, H.; Xia, K.; Teng, J.; Qiang, X.; Zhu, M.; Lu, S. An experimental facility with the high-speed moving endwall for axial compressor leakage flow research. Aerospace 2023, 10, 226. [Google Scholar] [CrossRef] [Scilit]
- Ahmed, S. Novel Experimental Characterisation of Hyperelastic Materials. Ph.D. Thesis, Sheffield Hallam University, Sheffield, UK, 2018. [Google Scholar]
- Robinson, M.D.; Spencer, A.; McGuirk, J.J.; Butcher, D. LES inlet condition generation using stereoscopic PIV and linear stochastic estimation. Flow Turbul. Combust. 2025, 115, 1403–1433. [Google Scholar] [CrossRef] [Scilit]
- Liu, Y.Q.; Huang, B.; Wu, Q.; Wang, G.Y. Revealing partial and simultaneous double lock-in phenomena in composite hydrofoils: Effects of bending-twist coupling. J. Hydrodyn. 2025, 37, 505–513. [Google Scholar] [CrossRef] [Scilit]
- Wieneke, B. Stereo-PIV using self-calibration on particle images. Exp. Fluids 2005, 39, 267–280. [Google Scholar] [CrossRef] [Scilit]
- Zang, W.; Prasad, A.K. Performance evaluation of a Scheimpflug stereocamera for particle image velocimetry. Appl. Opt. 1997, 36, 8738–8744. [Google Scholar] [CrossRef] [Scilit] [PubMed]
- Lazar, E.; DeBlauw, B.; Glumac, N.; Dutton, C.; Elliott, G. A practical approach to PIV uncertainty analysis. In Proceedings of the 27th AIAA Aerodynamic Measurement Technology and Ground Testing Conference, Chicago, IL, USA, 28 June–1 July 2010; p. 4355. [Google Scholar]
- Sciacchitano, A.; Wieneke, B. PIV uncertainty propagation. Meas. Sci. Technol. 2016, 27, 084006. [Google Scholar] [CrossRef] [Scilit]
- Chen, C.; Zhu, M.; Zhang, G.; Shi, H.; Xia, K.; Teng, J. Experimental investigation of tip leakage flow in a high-pressure compressor cascade with an open clearance using SPIV. In Proceedings of the ASME Turbo Expo 2026: Turbomachinery Technical Conference and Exposition, Milan, Italy, 15–19 June 2026; ASME: New York, NY, USA, 2026; Paper No. V009T29A006. [Google Scholar]

Disclaimer/Publisher’s Note: The statements, opinions and data contained in all publications are solely those of the individual author(s) and contributor(s) and not of MDPI and/or the editor(s). MDPI and/or the editor(s) disclaim responsibility for any injury to people or property resulting from any ideas, methods, instructions or products referred to in the content. |
© 2026 by the authors. Licensee MDPI, Basel, Switzerland. This article is an open access article distributed under the terms and conditions of the Creative Commons Attribution (CC BY) license.