


Abstract
Aero-engine test stand systems are characterized by complex structural configurations, a wide excitation frequency range, and vibration signals containing multiple harmonic components. Under multi-harmonic excitation, nonlinear vibration responses may exhibit complex frequency coupling, making it difficult to distinguish linear resonance from nonlinear coupling effects. To address this issue, a vibration feature identification method integrating finite element modeling and bispectral analysis is proposed. Finite element analysis is first employed to determine the natural frequencies of the test stand structure, while bispectral analysis is used to characterize the frequency coupling relationships associated with nonlinear vibration and to investigate its potential underlying mechanisms. Analysis of the test stand system and measured vibration data demonstrates that the dominant vibration peaks during the startup stage agree well with the numerically predicted modal frequencies, indicating that the vibration response is primarily governed by structural resonance. During the steady-state stage, bispectral analysis reveals nonlinear frequency coupling among the vibration components. In particular, a coupled difference frequency of 155 Hz falls within the near-resonance band of the test stand and is consequently reamplified by the structure. This process indicates a closed-loop mechanism characterized by structural resonance, nonlinear coupling, and structural reamplification. The proposed method provides an effective means of distinguishing linear and nonlinear vibration components and offers a quantitative basis for interpreting the vibration mechanisms of aero-engine test stand systems.
1. Introduction
Ground testing of aero-engines on test stands is a critical stage in engine development, qualification, and production acceptance, accounting for more than 70% of the total duration of developmental testing throughout the engine life cycle. During aero-engine operation on a test stand, rotor unbalance, parametric excitations, and structural modes of the test stand may interact and become strongly coupled, potentially resulting in excessive vibration and posing risks to the safety of test personnel and the structural integrity of the test facility. Therefore, accurately identifying the underlying causes of abnormal vibration during test stand operation is of significant engineering importance.
The ground test stand system of an aero-engine is a strongly coupled system in which rotor dynamics, support structure dynamics, and bearing contact mechanics interact. Its dynamic behavior exhibits pronounced nonlinear characteristics, which are reflected in vibration signals containing abundant harmonic excitation components. On the one hand, the engine rotor operates over a wide speed range. The rotational frequency and its harmonics successively pass through the natural frequencies of the test stand support structure, inducing linear resonance. On the other hand, factors such as contact nonlinearities in the support bearings, looseness at structural joints, and rotor–stator clearance and rubbing introduce substantial nonlinear dynamic behavior into the system, including subharmonic responses, combination resonances, quasiperiodic motions, and even chaotic behavior.
More importantly, linear resonance and nonlinear coupling do not occur independently during practical engine testing; rather, they may interact and become mutually coupled. The large-amplitude structural response induced by linear resonance may aggravate the deterioration of the engine assembly condition, thereby activating nonlinear mechanisms. Conversely, coupling frequency components generated by nonlinear mechanisms may fall within the near-resonance region of the test stand structure and consequently be further amplified by the structural modes. This process can lead to a cascading effect characterized by structural resonance–nonlinear coupling–structural reamplification. The coexistence and interaction of linear and nonlinear vibration mechanisms make the identification of the underlying causes of vibration anomalies during aero-engine test stand operation substantially more challenging than vibration problems dominated by a single mechanism.
Existing vibration analysis approaches can be broadly classified into structural dynamics-based methods, signal-processing methods, and data-driven methods. Although each category has demonstrated value in vibration analysis and fault diagnosis, their respective capabilities and limitations should be considered in relation to the physical mechanisms under investigation. Finite element modeling and experimental modal analysis can characterize structural natural frequencies, mode shapes, and resonance-sensitive regions, thereby providing a physical basis for interpreting vibration amplification [1,2]. However, the accuracy of such interpretations depends on the representation of structural flexibility, boundary conditions, joint stiffness, and excitation mechanisms. In particular, a structural model based primarily on linear dynamics cannot, by itself, fully characterize nonlinear frequency coupling observed in operational vibration signals. Signal-processing methods provide complementary information. Power spectral density analysis and the short-time Fourier transform can identify dominant frequency components and their temporal evolution, while empirical mode decomposition can help characterize nonstationary signals [3,4,5]. Nevertheless, frequency peaks or sidebands alone do not necessarily establish the existence of nonlinear phase coupling or identify the structural mechanism responsible for their amplification. Higher-order spectral methods, including bispectral analysis and bicoherence, can provide evidence of quadratic phase coupling among frequency components [6,7,8]. However, coupling detection alone does not establish whether the coupled components are amplified by a structural resonance, nor does it independently identify the physical source of the coupling. Consequently, structural modeling and signal analysis address related but distinct aspects of the vibration problem. Data-driven methods, including deep learning and transfer learning, offer powerful capabilities for automatic feature extraction and fault-pattern recognition [9,10]. Their diagnostic performance, however, depends on the representativeness and quality of the training data and on the similarity between training and application conditions. Moreover, a high classification accuracy does not necessarily provide a direct physical explanation of how structural resonance and nonlinear frequency coupling interact. These limitations are particularly relevant when abnormal vibration must be interpreted in relation to the dynamic characteristics of a specific aero-engine test stand.
Despite progress in these areas, an important research gap remains in establishing an analytical link between the structural dynamic characteristics of an aero-engine test stand and the nonlinear frequency-coupling features identified from its measured vibration signals. In particular, structural resonance and nonlinear coupling are often examined from separate analytical perspectives, making it difficult to determine whether coupling frequencies identified from vibration signals fall within structural near-resonance regions and may consequently undergo further amplification. A combined analysis is therefore needed to relate structural dynamic evidence to nonlinear signal features and to investigate the possible interaction among structural resonance, nonlinear frequency coupling, and structural reamplification.
To address this gap, this study proposes an integrated vibration fault diagnosis method for aero-engine test stand systems that combines numerical modeling with bispectral analysis. The fundamental concept of this integrated approach is to reveal the linear resonance mechanisms of vibration from a structural-dynamics perspective via numerical modeling, while quantitatively characterizing phase coupling relationships among harmonic components using nonlinear signal analysis based on higher-order statistics. Specifically, finite element modeling and analysis yield the natural frequencies associated with structural vibration, whereas bispectral analysis identifies frequency coupling relationships of nonlinear vibration and the underlying potential mechanisms. These two categories of information complement and mutually support each other within a unified vibration feature identification framework. Vibration data collected during test-stand operation of a representative aero-engine are used for a case study. First, a dynamic model is constructed to identify linear resonance mechanisms during the engine startup stage. Bispectral and bicoherence analyses are then performed to reveal nonlinear phase coupling relationships under steady-state operating conditions. Furthermore, within the framework of nonlinear dynamics theory, a plausible evolutionary pathway linking structural resonance to nonlinear coupling is proposed to interpret the observed vibration phenomena. The objective is to provide a practical analytical framework for differentiating linear vibration fault features from nonlinear coupling effects in the vibration diagnosis of engineering aero-engine test stands.
2. Integrated Analysis Framework Based on Finite Element Modeling and Bispectral Analysis
2.1. Structural Dynamic Modeling of the Aero-Engine Test Stand System
The structural dynamic characteristics of the aero-engine test stand are investigated using finite element modeling (FEM), experimental modal analysis, and harmonic response analysis. The governing equation of the multi-degree-of-freedom system is expressed as [11]:
where M, C, and K denote the mass, damping, and stiffness matrices of the system, respectively; x(t) is the displacement response vector; and F(t) is the external excitation vector, including rotor unbalance forces, bearing transmitted forces, and blade passing frequency excitations. Natural frequencies and mode shapes are extracted by solving the corresponding eigenvalue problem.
A parameterized finite element model of the test stand is established to characterize its structural dynamic behavior. For the test stand system considered in this study, the higher-order bending modal frequencies of the internal engine rotor are substantially higher than the dominant modal frequencies of the test stand structure. Therefore, when evaluating the coupled dynamic characteristics of the test stand and engine, a simplified approach is adopted in which the engine is represented as a lumped mass system mounted on elastic supports, while its internal elastic deformation is neglected and only its equivalent mass and inertia properties are retained [12,13]. The test stand model is simplified at an appropriate level of geometric detail to guarantee computational efficiency while preserving the primary load transfer paths.
The lumped-mass representation of the engine is adopted to reduce model complexity while retaining its equivalent mass and inertia properties and the primary load-transfer paths. This simplification is considered appropriate for the present study because the analysis focuses on the dominant global modes of the test stand within the operating speed range, rather than the internal elastic modes of the engine rotor. Nevertheless, the lumped-mass assumption may affect the predicted natural frequencies, mode shapes, and response amplitudes if the spatial mass distribution, local structural flexibility, or engine–support dynamic coupling has a significant influence on the modes of interest. The experimental modal validation provides evidence of the model’s ability to reproduce the relevant global modal characteristics, but it does not independently quantify the error introduced by the lumped-mass assumption. A direct quantitative assessment would require a comparison with a more detailed distributed-mass or flexible-engine model under consistent boundary conditions and parameter settings. This comparison is beyond the scope of the present study and will be considered in future work.
Experimental modal analysis is conducted using impact-hammer excitation and accelerometer measurements. The measured frequency response functions (FRFs) are processed using the least-squares complex frequency (LSCF) method to identify the natural frequencies, damping ratios, and mode shapes. The consistency between the experimentally identified modes and the finite element predictions is evaluated using the modal assurance criterion (MAC) [14]:
where and denote the r-th and q-th modal vectors, respectively, and * denotes the conjugate transpose. The FE computed modes are compared with the experimentally identified modes using the MAC. A low MAC value indicates poor modal correlation and suggests that the finite element model should be updated accordingly.
Once the system model has been established and validated, harmonic response analysis is performed to obtain the steady-state response of the system in the frequency domain:
After modal validation, harmonic response analysis is performed using the modal superposition method over the relevant operating frequency range. The resulting frequency-response curves are used to identify resonance-related response peaks and characterize the dynamic response of the test stand. The resulting structural dynamic information provides the basis for comparing the structural response characteristics with the frequency-coupling features identified through bispectral analysis.
2.2. Nonlinear Coupling Detection Based on Bispectral Analysis
During aero-engine test stand operation, linear resonance and nonlinear coupling often coexist. Numerical modeling approaches based on linear or weakly nonlinear assumptions are generally unable to adequately characterize nonlinear coupling phenomena in the system. Higher-order spectral analysis provides an alternative approach for detecting nonlinear coupling: unlike the power spectrum, the bispectrum retains the phase information of a signal, thereby enabling the identification of quadratic phase coupling among its frequency components, while its normalized form, the bicoherence, provides a quantitative measure of the coupling strength [6,7]. Recently, studies on bearing and gear fault diagnosis based on bispectral analysis and time–frequency modulated bispectral analysis have demonstrated the advantages of higher-order spectral methods in extracting nonlinear features [15,16,17]. In this study, bispectral and bicoherence analysis are adopted, and a brief introduction is given below.
Bispectrum: The bispectrum, also referred to as the third-order spectrum, is the two-dimensional Fourier transform of the third-order cumulant of a signal. Bispectral analysis is commonly employed for detecting non-Gaussian characteristics, nonlinear system behavior, and non-minimum phase systems. The bispectrum is calculated as follows:
where denotes the third-order moment of the signal, denotes the two independent time lags of the signal, and denotes the bispectrum of the signal, in which and are two arbitrary frequency components in the signal (expressed in Hz), is their sum-frequency component. The bispectrum can be expressed in terms of the Fourier transform of the signal as given in Equation (6).
In the above equation, represents the Fourier transform of the signal segment. It can be seen that the bispectrum characterizes the coupling relationship among three harmonic components at different frequencies , , . Quadratic phase coupling exists when the phase of equals the sum of the phases of and .
Bicoherence: Bicoherence is the normalized form of the bispectrum and is used to quantify the degree of quadratic phase coupling among different harmonic components in a signal. The magnitude of the bicoherence coefficient ranges from 0 to 1. If a quadratic phase coupling relationship exists among the three frequency components , , , the bicoherence value approaches 1; otherwise, it approaches 0. Bicoherence is therefore sensitive to the identification of coupled frequency components in a signal. Its calculation is given by Equation (7) [18].
In this sense, the bispectrum relates to the third-order cumulant as the power spectral density relates to the autocorrelation function (Wiener–Khinchin theorem), and the bicoherence is the bispectrum normalized by the PSD at the three interacting frequencies, analogous to the ordinary coherence.
A simulated rotor vibration signal is constructed as follows:
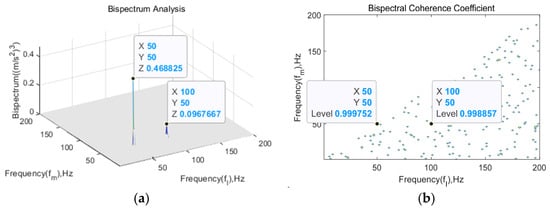
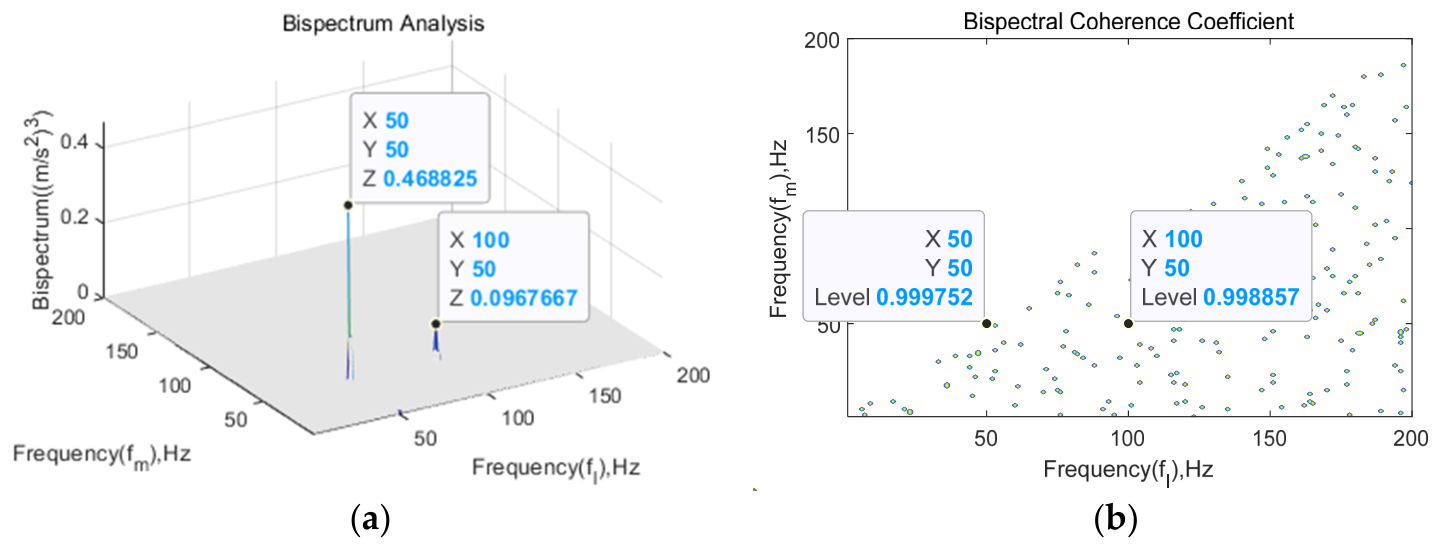
The simulated signal consists of three superimposed harmonic components with a quadratic phase-coupling relationship, where denotes the rotor rotational frequency. Additive Gaussian white noise () is then superimposed on the composite signal at a signal-to-noise ratio (SNR) of 5 dB. According to the definition given above, a quadratic phase coupling relationship clearly exists between the corresponding frequency components. The bispectrum and bicoherence of the simulated signal are then calculated, and the resulting bispectral and bicoherence distributions are shown in Figure 1. A distinct spectral peak can be observed at the frequency pair , while the corresponding bicoherence coefficient approaches 1, indicating strong quadratic phase coupling between the two frequency components.
Figure 1.
Bispectrum (a) and bicoherence (b) of the simulated signal.
The bicoherence estimation employed in this study utilizes the Welch-type averaged periodogram method to reduce variance while maintaining frequency resolution. The specific parameters are as follows: data segment length N = 10,000 points with 50% overlap between adjacent segments; FFT length of 10,000 points yielding a frequency resolution of ; and a Hanning window applied to each segment to minimize spectral leakage. The bicoherence is computed by first accumulating the cross-bispectrum across all segments and subsequently normalizing by the accumulated power spectra, following the standard estimator:
where denotes the number of averaged segments, represents the Fourier transform of the k-th segment, and the summation is performed before normalization to ensure unbiased estimation.
2.3. Integrated Analysis Method
For aero-engine test stand systems, the structural configuration is highly complex, and the operating speed range is broad. Linear structural resonance and nonlinear coupling often coexist during operation and may interact with each other. Consequently, it is difficult to trace the physical origins of system vibration from a global perspective using either a standalone numerical dynamic modeling approach or a signal analysis method. Vibration fault diagnosis needs to address two complementary aspects, namely, the excitation mechanism and the system response. The integrated analysis strategy proposed in this study is therefore based on the complementary information provided by the resonance mechanisms revealed through numerical modeling and the nonlinear harmonic coupling identified through signal analysis. The two approaches are integrated through three levels of linkage.
The first level of linkage: structural information provides a physical interpretation framework for signal analysis. The natural frequency distribution, mode shape characteristics, and harmonic response envelope curves obtained from numerical modeling are compared with the spectral decomposition results of the system during operation. This comparison identifies the locations and amplitudes of resonance frequencies, thereby enabling bispectral analysis to distinguish coupling occurring within resonance regions from that occurring in non-resonant regions.
The second level of linkage: signal analysis provides quantitative evidence of nonlinear behavior to complement structural modeling. Numerical modeling is primarily based on linear or weakly nonlinear dynamic models and has limited capability to quantitatively describe nonlinear phenomena observed during operation, such as the growth of harmonic components and sideband coupling. Bicoherence quantitatively measures the strength of quadratic phase coupling among harmonic components on a scale from 0 to 1, thereby providing direct quantitative evidence of nonlinear coupling that cannot be adequately characterized by conventional numerical modeling.
The third level of linkage integrates the linear resonance mechanism at the structural level with the nonlinear coupling mechanism at the signal level. When frequency components generated by nonlinear coupling in the system fall within the near-resonance region of the test stand structure, they may be further amplified by the structural modes, thereby aggravating the overall engine vibration. This linkage provides a global interpretation of the mechanisms responsible for excessive system vibration.
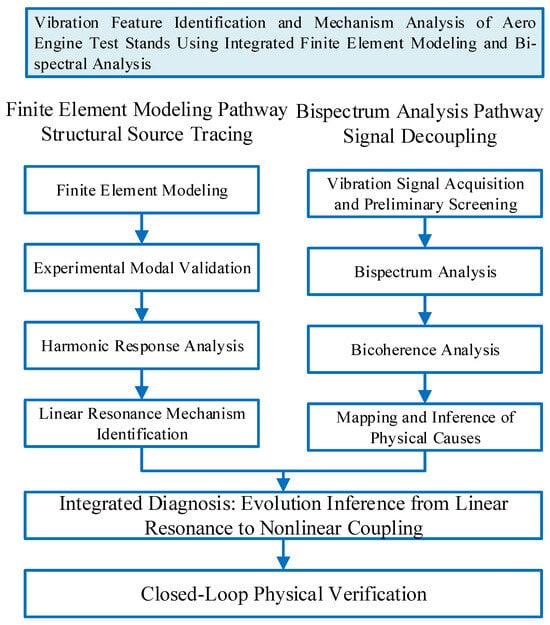
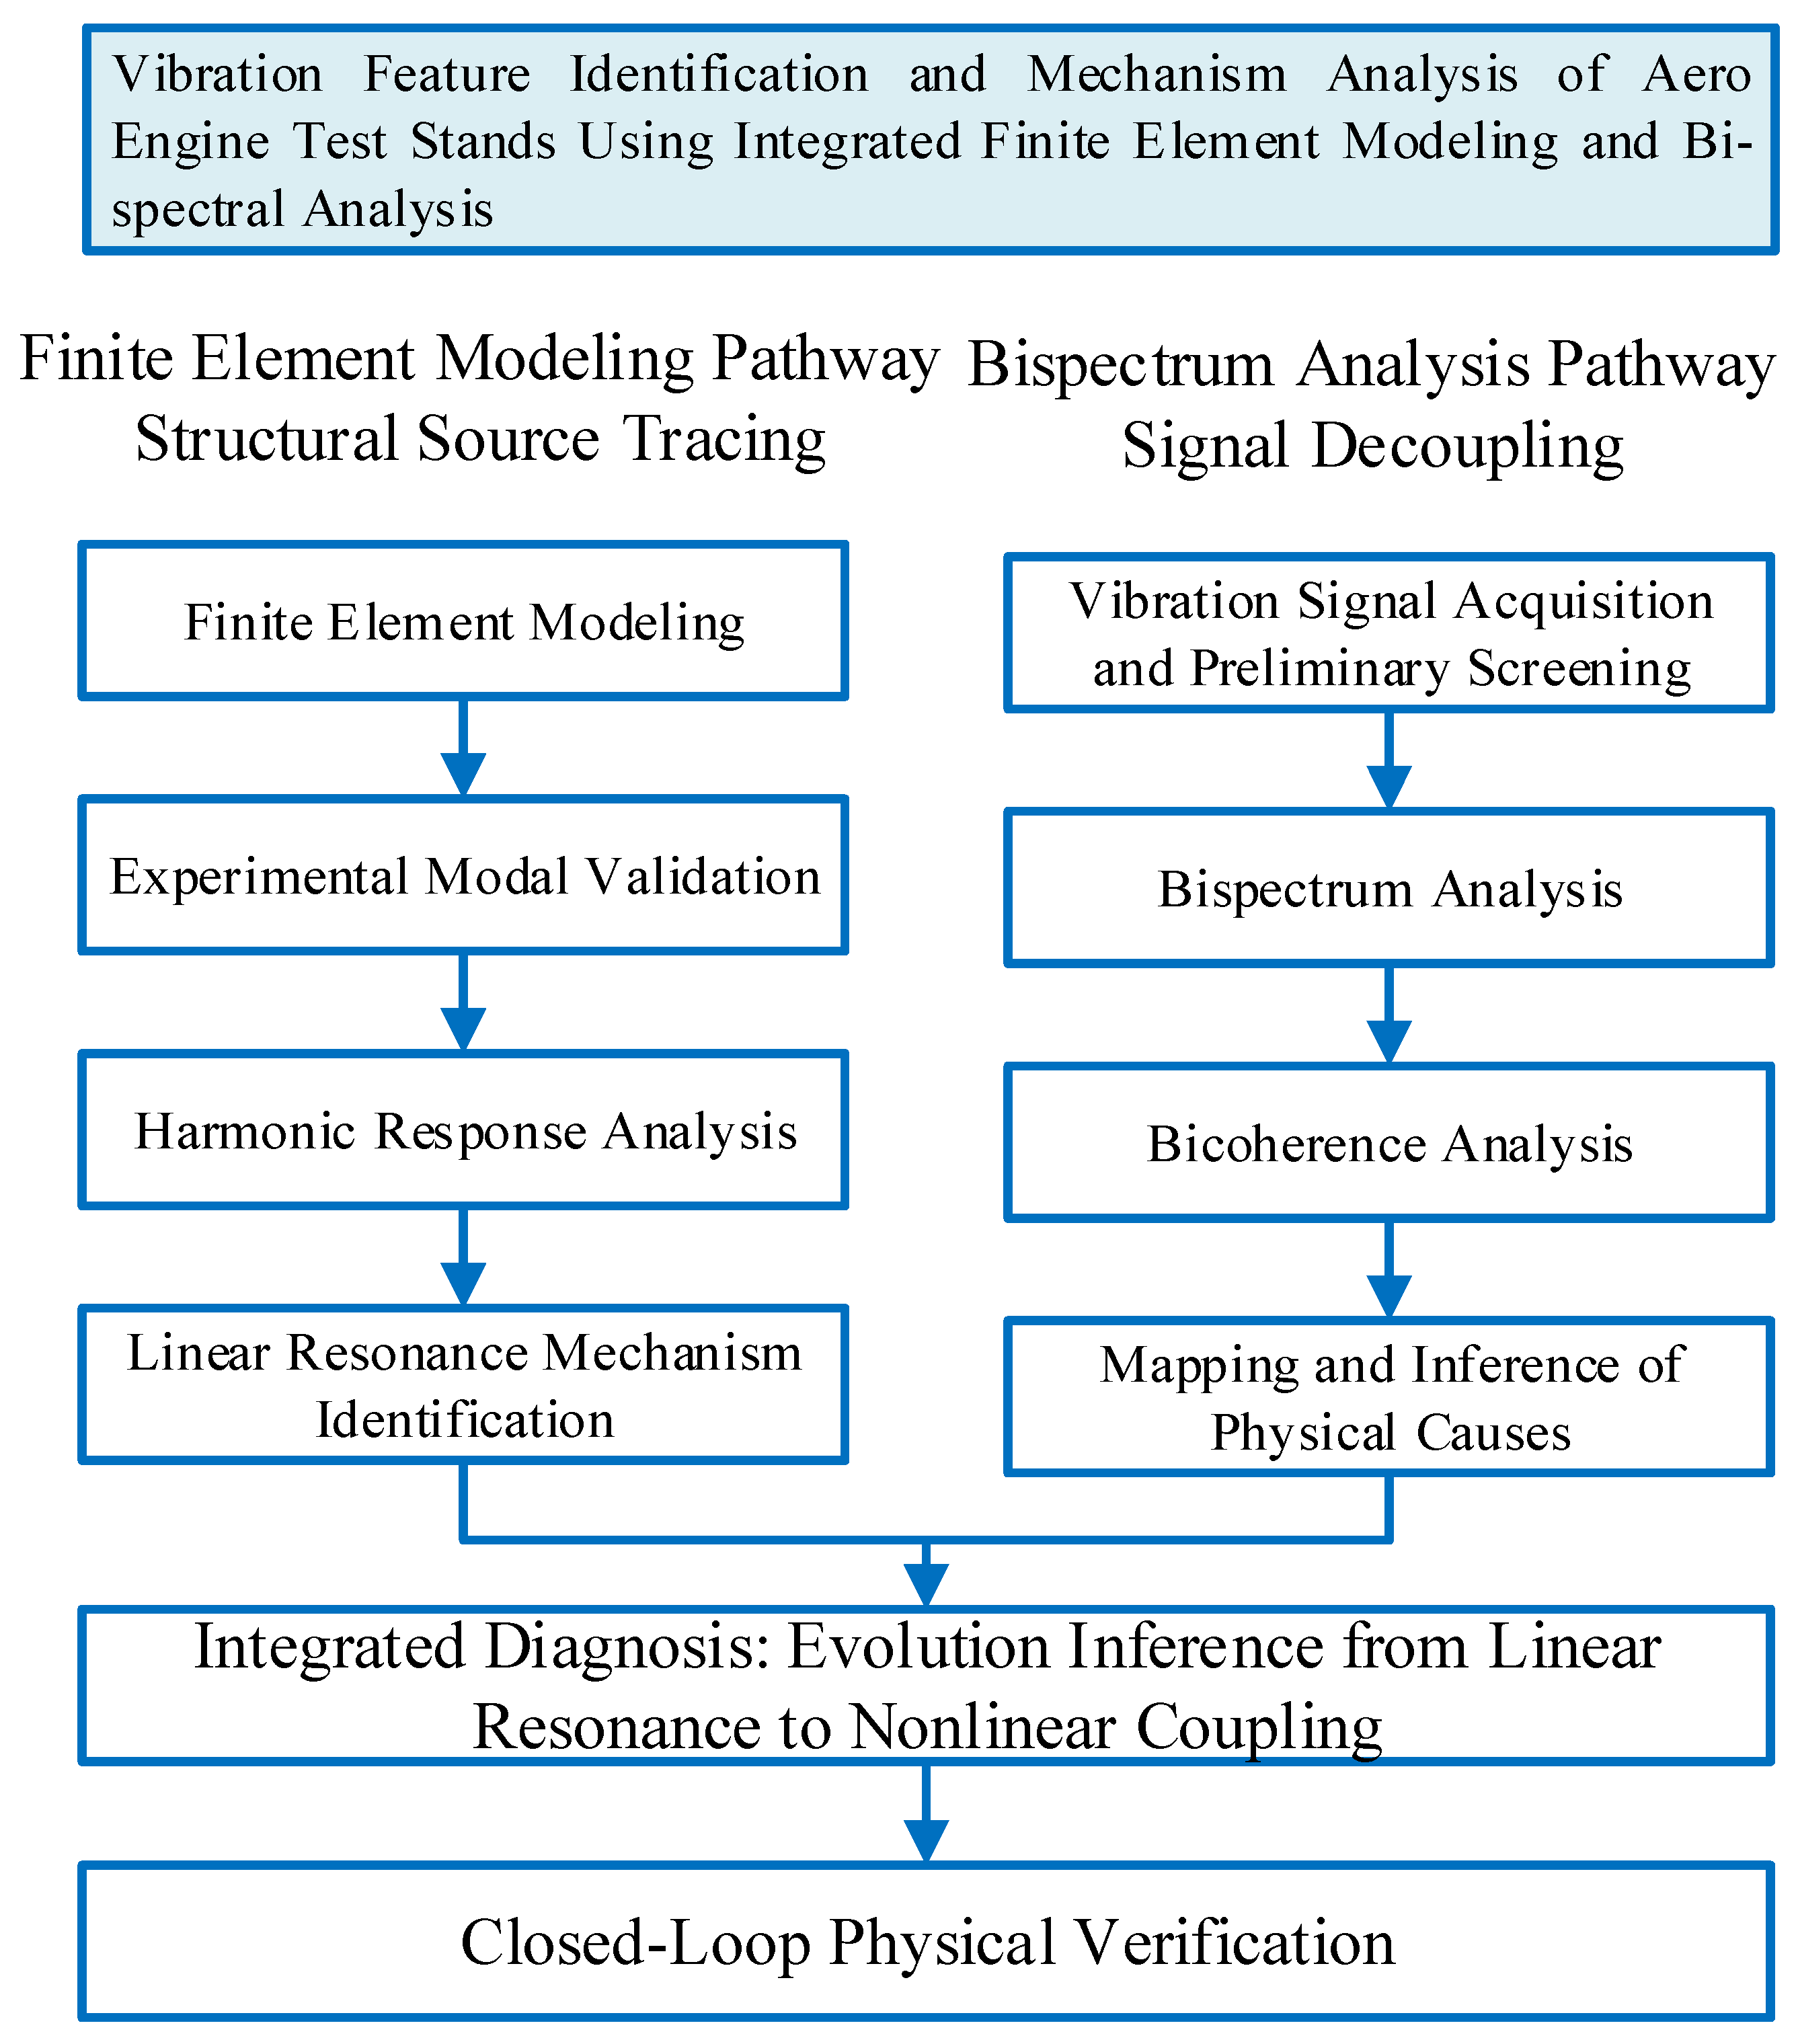
Figure 2 presents the complete framework of the proposed integrated analysis strategy. The framework consists of two complementary analytical paths. The numerical modeling path identifies the resonance mechanisms of the test stand from the perspective of structural dynamics through finite element modeling, experimental modal validation, and harmonic response analysis, thereby revealing the causes of excessive vibration during the startup stage. The bispectral analysis path identifies nonlinear phase coupling relationships from the perspective of higher-order statistics through STFT-based preliminary screening, bispectral and bicoherence analysis, and mapping of coupled frequencies onto structural modes. The detailed integrated analysis procedure is as follows:
Figure 2.
Flowchart of the integrated analysis strategy.
Numerical modeling: A finite element model of the test stand system is established. The model is validated and updated using experimental modal analysis based on impact testing, followed by harmonic response analysis to identify the natural frequencies and mode shapes within the operating speed range.
Signal prescreening: STFT is applied to the vibration signals acquired during the engine test to identify abnormal frequency components and characterize their evolution with rotational speed.
Algebraic relationship verification: The abnormal frequency components identified by STFT are examined to determine whether algebraic relationships, such as difference or sum frequency relationships, exist between them and the natural frequencies of the system.
Bispectral verification: For frequency triplets exhibiting algebraic relationships, bicoherence is calculated to verify whether the corresponding components satisfy the conditions for quadratic phase coupling.
Near-resonance amplification criterion: If significant bicoherence is observed and the coupled difference frequency falls within the near-resonance region of the test stand, the linear resonance and nonlinear coupling are considered to interact. This provides a basis for further inference of the underlying physical mechanism responsible for the observed vibration.
3. Vibration Feature Analysis of an Aero-Engine Test Stand Based on the Integrated Analysis Strategy
3.1. Test Setup and Description of the Observed Vibration Phenomena
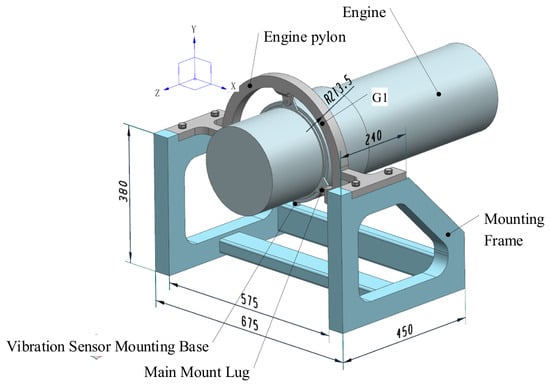
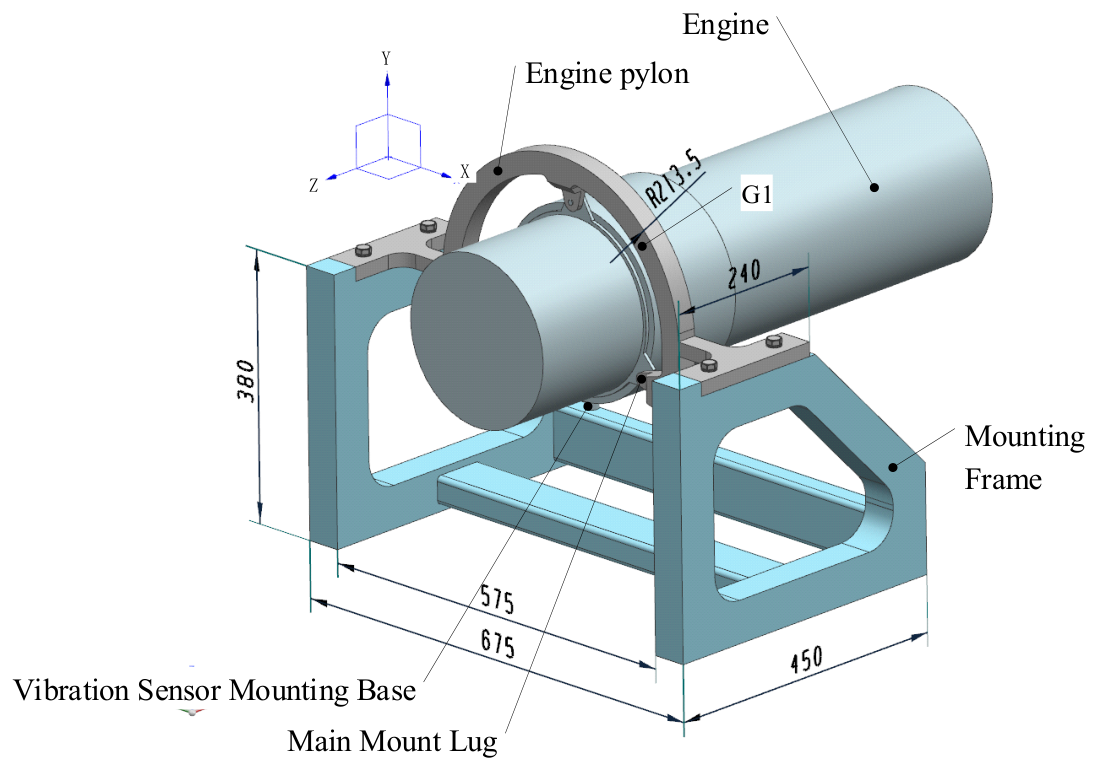
The ground test stand system for the aero-engine investigated in this study mainly consists of the engine test article, foundation base, support frame, mounting structure, fuel system, control system, and measurement system. The support frame is rigidly fixed to the foundation base. The test article is connected to the mounting structure by bolts and is subsequently installed on the support frame together with the mounting structure. An accelerometer is installed directly beneath the main engine mounting section to measure the vibration response. The installation configuration of the main components is shown in Figure 3.
Figure 3.
Model of the aero-engine test stand system.
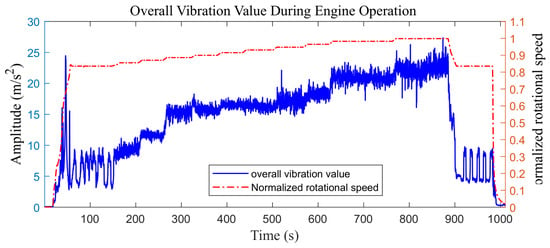
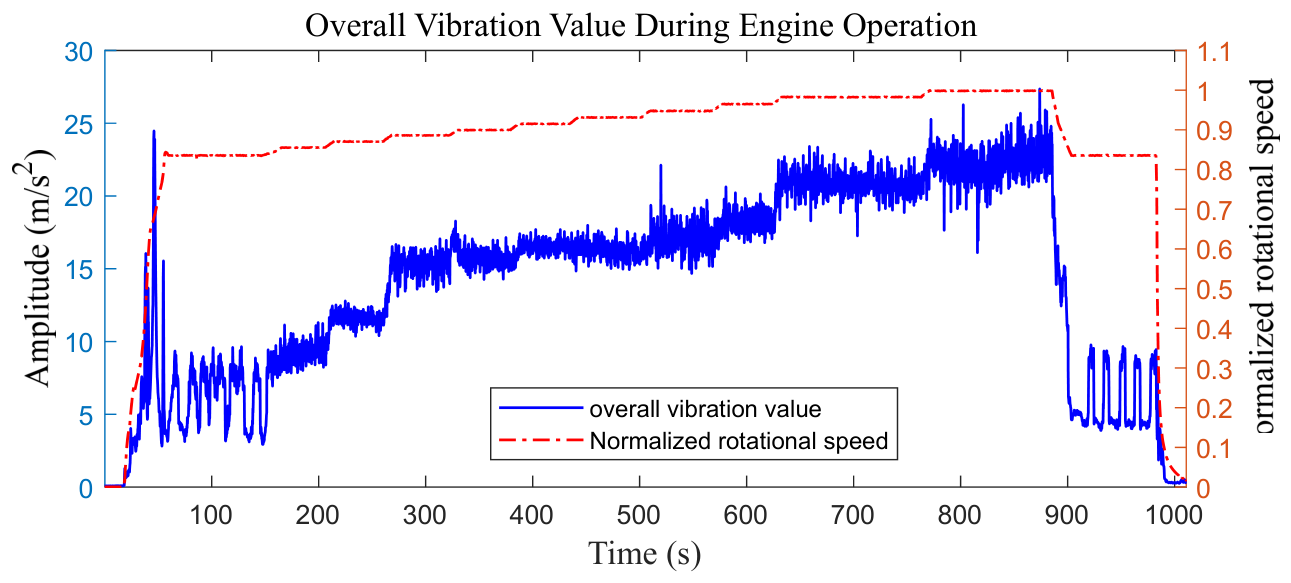
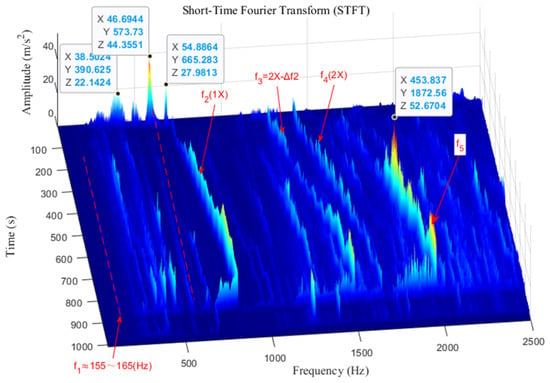
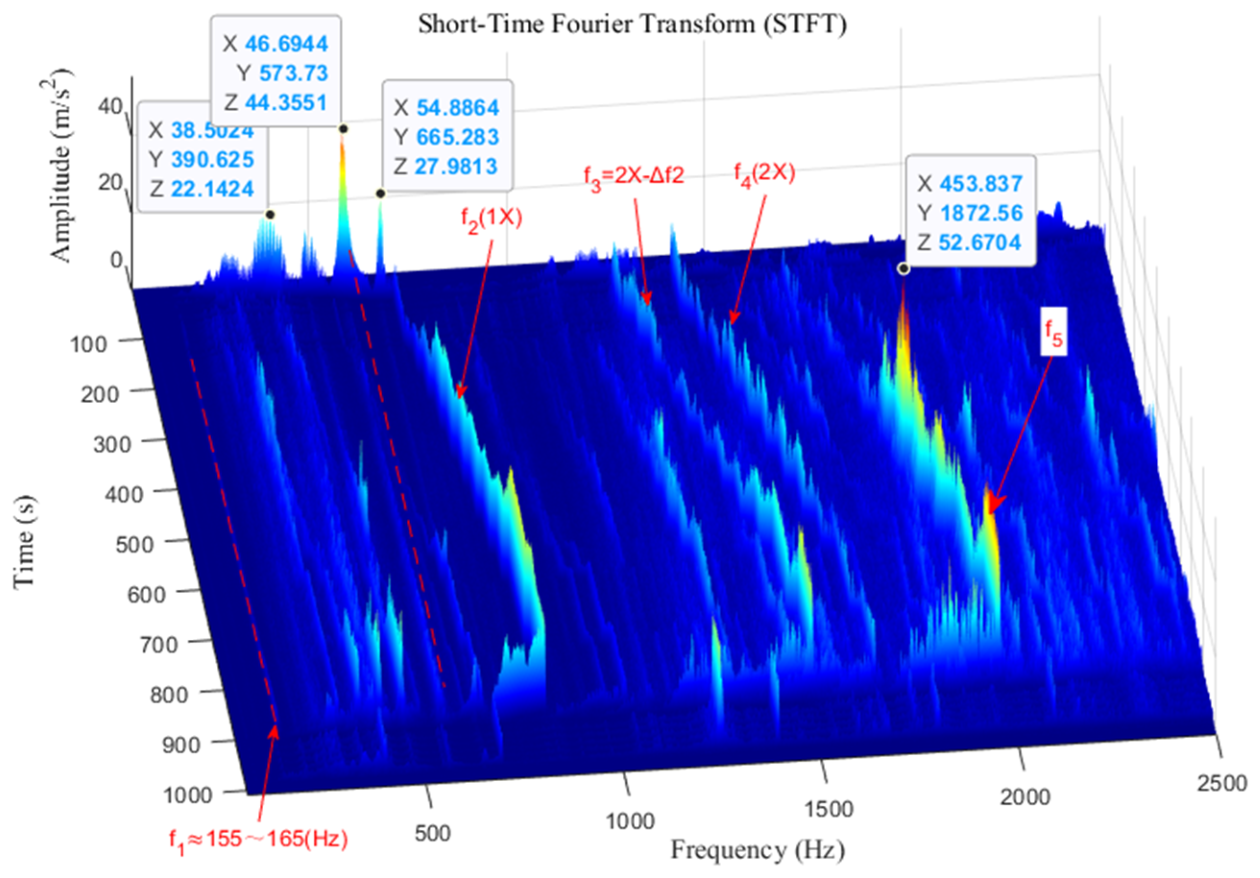
Excessive vibration was observed during both the startup and steady-state stages of the engine test. The time history of the overall vibration level is shown in Figure 4. The overall vibration level shown by the blue curve in Figure 4 is quantified using the root-mean-square (RMS) acceleration calculated over the frequency band of 50–1000 Hz. This metric represents the effective vibration amplitude within the specified frequency range during engine operation. As shown in the STFT spectrogram of the acceleration signal (Figure 5), during the startup stage, the normalized rotational speed () increased from 0 to approximately 0.835, with prominent spectral peaks appearing successively near 300, 390, 480, 570, and 660 Hz.
Figure 4.
Time history of the overall vibration level during engine operation.
Figure 5.
STFT of the vibration acceleration signal.
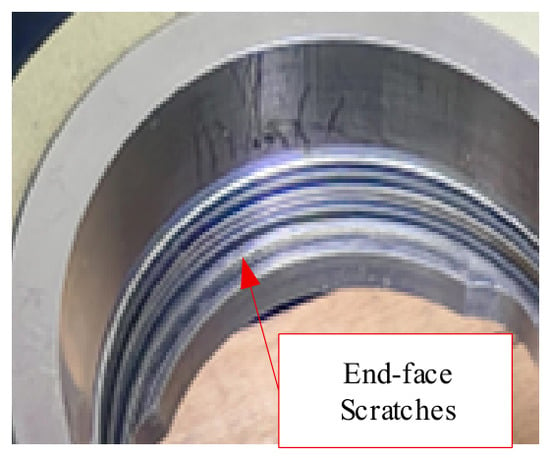
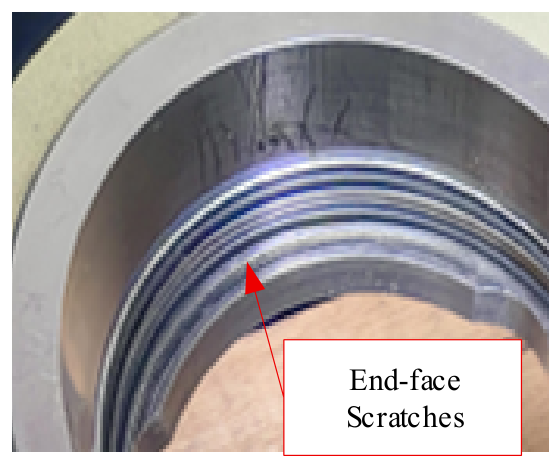
During the steady-state stage, corresponding to a normalized rotational speed range from 0.835 to 1.0, the vibration signal was dominated by the fundamental rotational frequency, its second harmonic, and the associated sideband components. In particular, distinct lower-sideband components were observed below the second harmonic (2X), separated from it by a frequency interval denoted by ∆f2. Here, ∆f2 represents the frequency difference between the second harmonic and the corresponding lower-sideband component. The observed sideband pattern indicates that the vibration signal contains frequency modulation or nonlinear coupling components that warrant further investigation. After completion of the test, the engine was disassembled, and localized circumferential scratches were observed on the end face of the front bearing housing, as shown in Figure 6.
Figure 6.
Circumferential scratches on the end face of the front bearing housing after disassembly.
3.2. Numerical Modeling and Validation of the Aero-Engine Test Stand System
Following the integrated analysis strategy, dynamic models of the mounting structure and support frame are established. Since the natural frequency of the first elastic bending mode of the engine rotor lies well above the upper bound of the assessed frequency band of the bench system, the engine test article is represented by a remote point with an equivalent lumped mass, whose equivalent mass and moments of inertia are prescribed as model parameters. The material properties of the components of the test stand system are listed in Table 1.
Table 1.
Material properties of the test stand components.
The support frame is fully constrained at its interface with the foundation. All welded joints are equivalently modeled using bonded contacts. The bolted connections between the test article and the mounting structure, as well as those between the mounting structure and the support frame, are modeled using frictional contacts with equivalent bolt preload forces. A friction coefficient of 0.15 is assigned to the frictional contacts, and a preload of 10,000 N is applied to each of the four bolts. Dedicated pretension elements (PRETS179) are employed at the bolted connections to account for the effects of bolt preload, and the prestressed modal analysis is performed based on the corresponding preloaded equilibrium state. The structural components are discretized using tetrahedral and hexahedral solid elements. The nominal mesh size is 6 mm, resulting in 585,368 nodes and 136,669 solid elements. According to the mesh sensitivity analysis, at a node count of 585,368, the average and maximum relative frequency differences in the natural frequencies are 1.29% and 4.18%, meeting the widely used engineering convergence thresholds (<2% and <5%) [19,20].
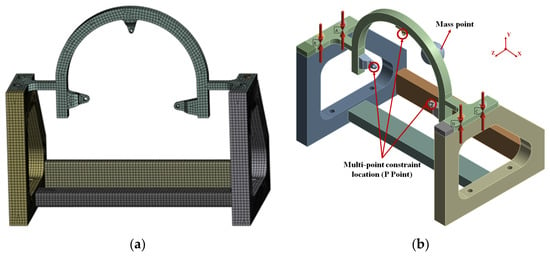
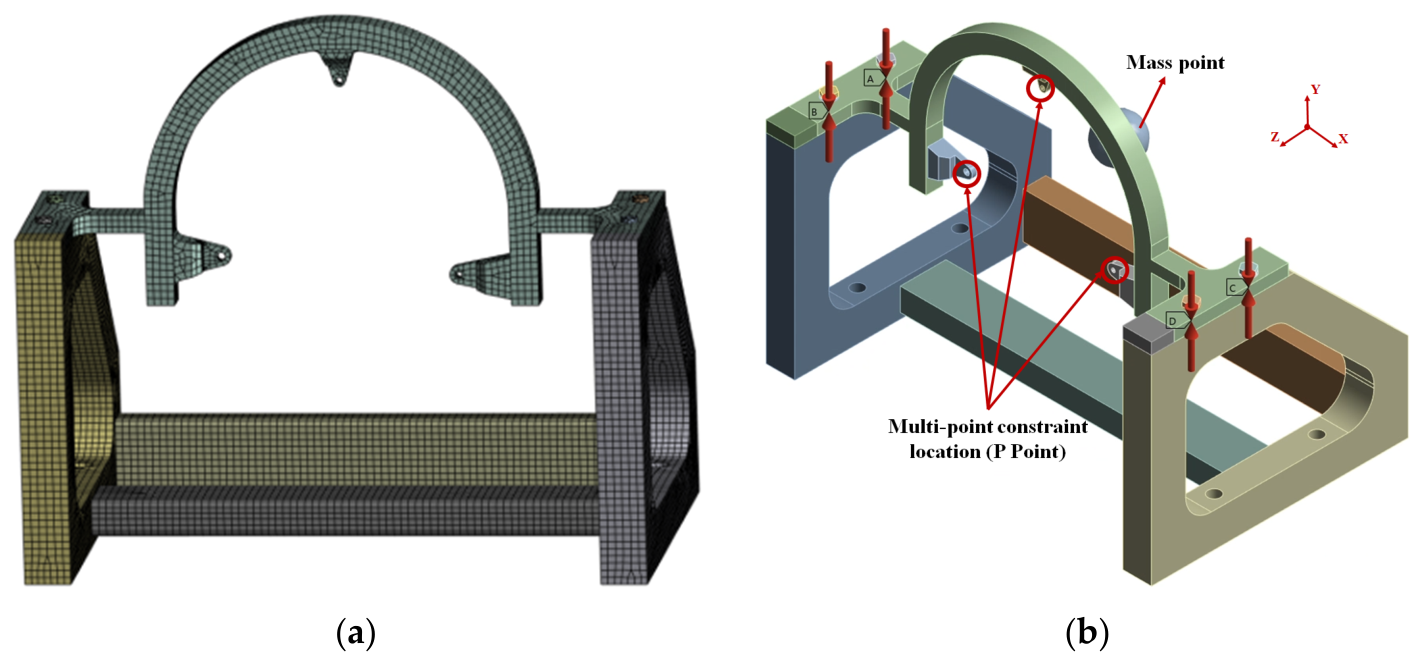
The engine is represented by a six-degree-of-freedom equivalent lumped mass of 12 kg. Its moments of inertia, calculated from the three-dimensional CAD model, are () and (). The total mass of the finite element model is 92 kg, including the equivalent engine mass, while the remaining test-stand components account for 80 kg. A remote reference point is positioned at the center of mass of the engine CAD model and is coupled to the three engine mounting points using deformable multipoint constraints (MPCs). The resulting finite mesh model of the test-stand system is shown in Figure 7a.
Figure 7.
Finite element model of the aero-engine test stand system. (a) Mesh model, (b) boundary conditions.
The harmonic response analysis is conducted using the mode-superposition method over a frequency range of 50–1000 Hz, with a constant structural damping coefficient of 0.02. A harmonic force with an amplitude of 200 N is applied at engine mounting point P1, as indicated in Figure 7b. Three independent load cases are considered, with the excitation applied separately along the global (X), (Y), and (Z) directions. Only one excitation direction is applied in each load case, and the corresponding structural displacement responses are calculated.
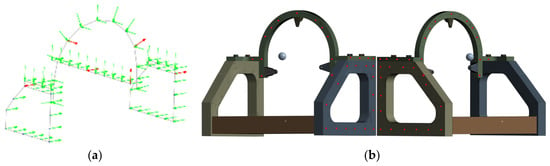
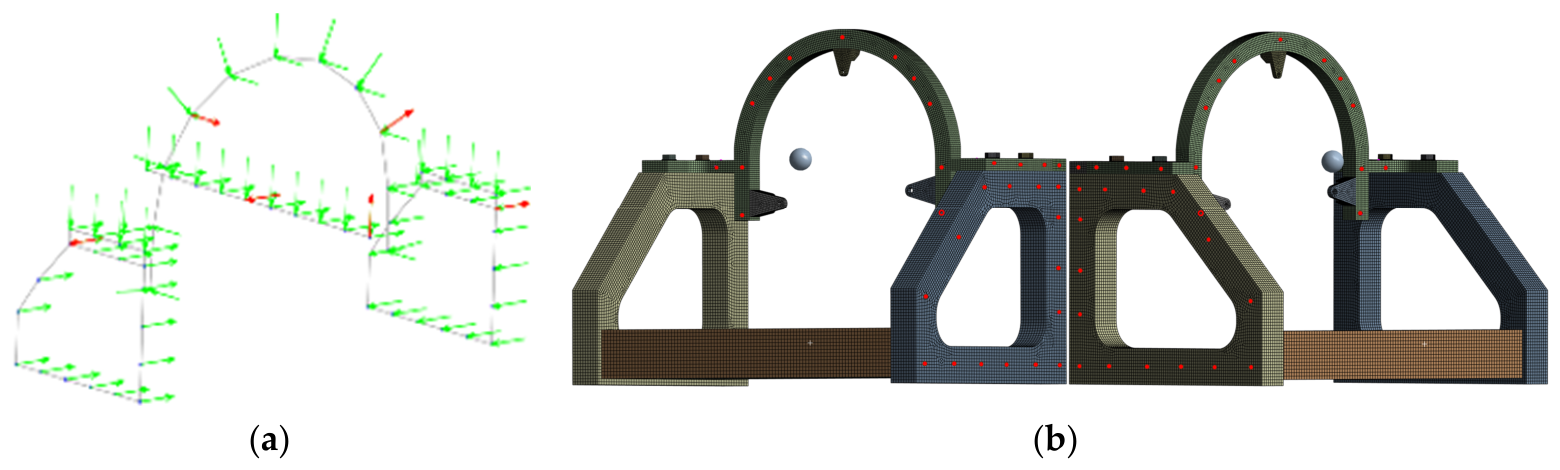
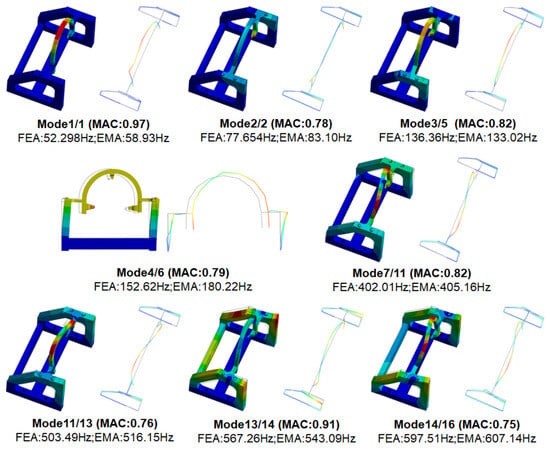
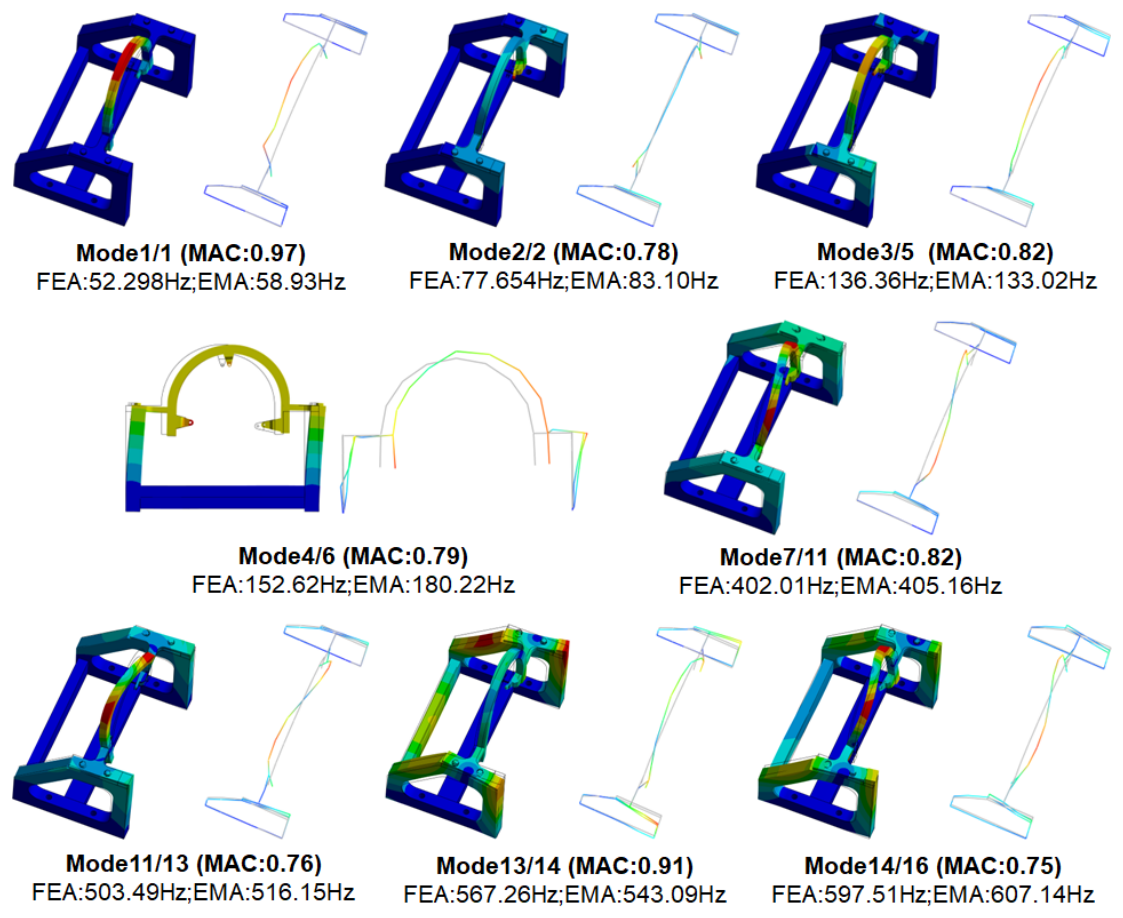
Finite element modal analysis and experimental modal validation using the impact hammer method are performed for the test stand system. Only the global modes whose natural frequencies fall within the operating speed range are considered. Experimental modal testing was conducted using an LMS SCADAS front-end with LMS Test.Lab 18A, with the test-stand base bolted to a heavy-duty cast-iron platform to approximate fixed (clamped) boundary conditions. A multi-reference roving-hammer test was conducted, using PCB 352C22 uniaxial accelerometers (10 mV/g) at the fixed reference response locations and a Brüel & Kjær Type 8206 impact hammer (calibrated force sensitivity 22.5 mV/N, Brüel & Kjær, Virum, Denmark). The reference response locations are marked by the red arrows in subfigure (a) of Figure 8, while the green arrows indicate the impact locations and directions. In subfigure (b), the red dot represents the excitation location. Force and acceleration signals were acquired synchronously at each impact location and direction. The signals were sampled at 10,000 Hz, with 3 impacts averaged per point and force/exponential windows applied. Modal parameters over 0–1000 Hz were identified using the poly reference least-squares complex frequency-domain method. The analysis results are shown in Figure 9, and the MAC matrix is presented in Figure 10.
Figure 8.
Experimental modal test: measurement and excitation directions (a) and locations (b).
Figure 9.
Comparison of experimental mode shapes with finite element mode shapes.
Figure 10.
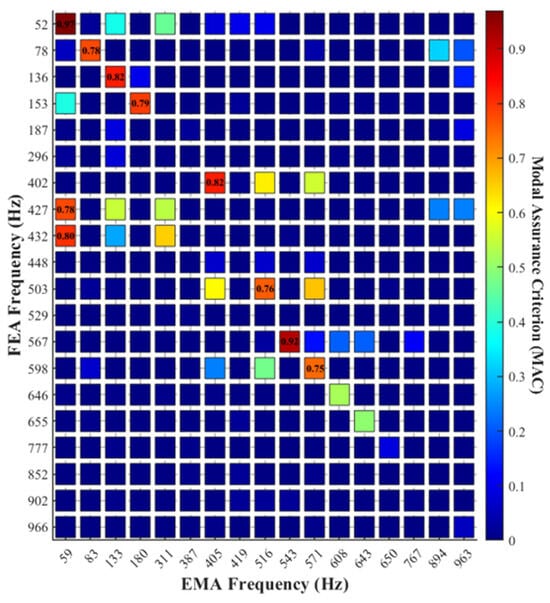
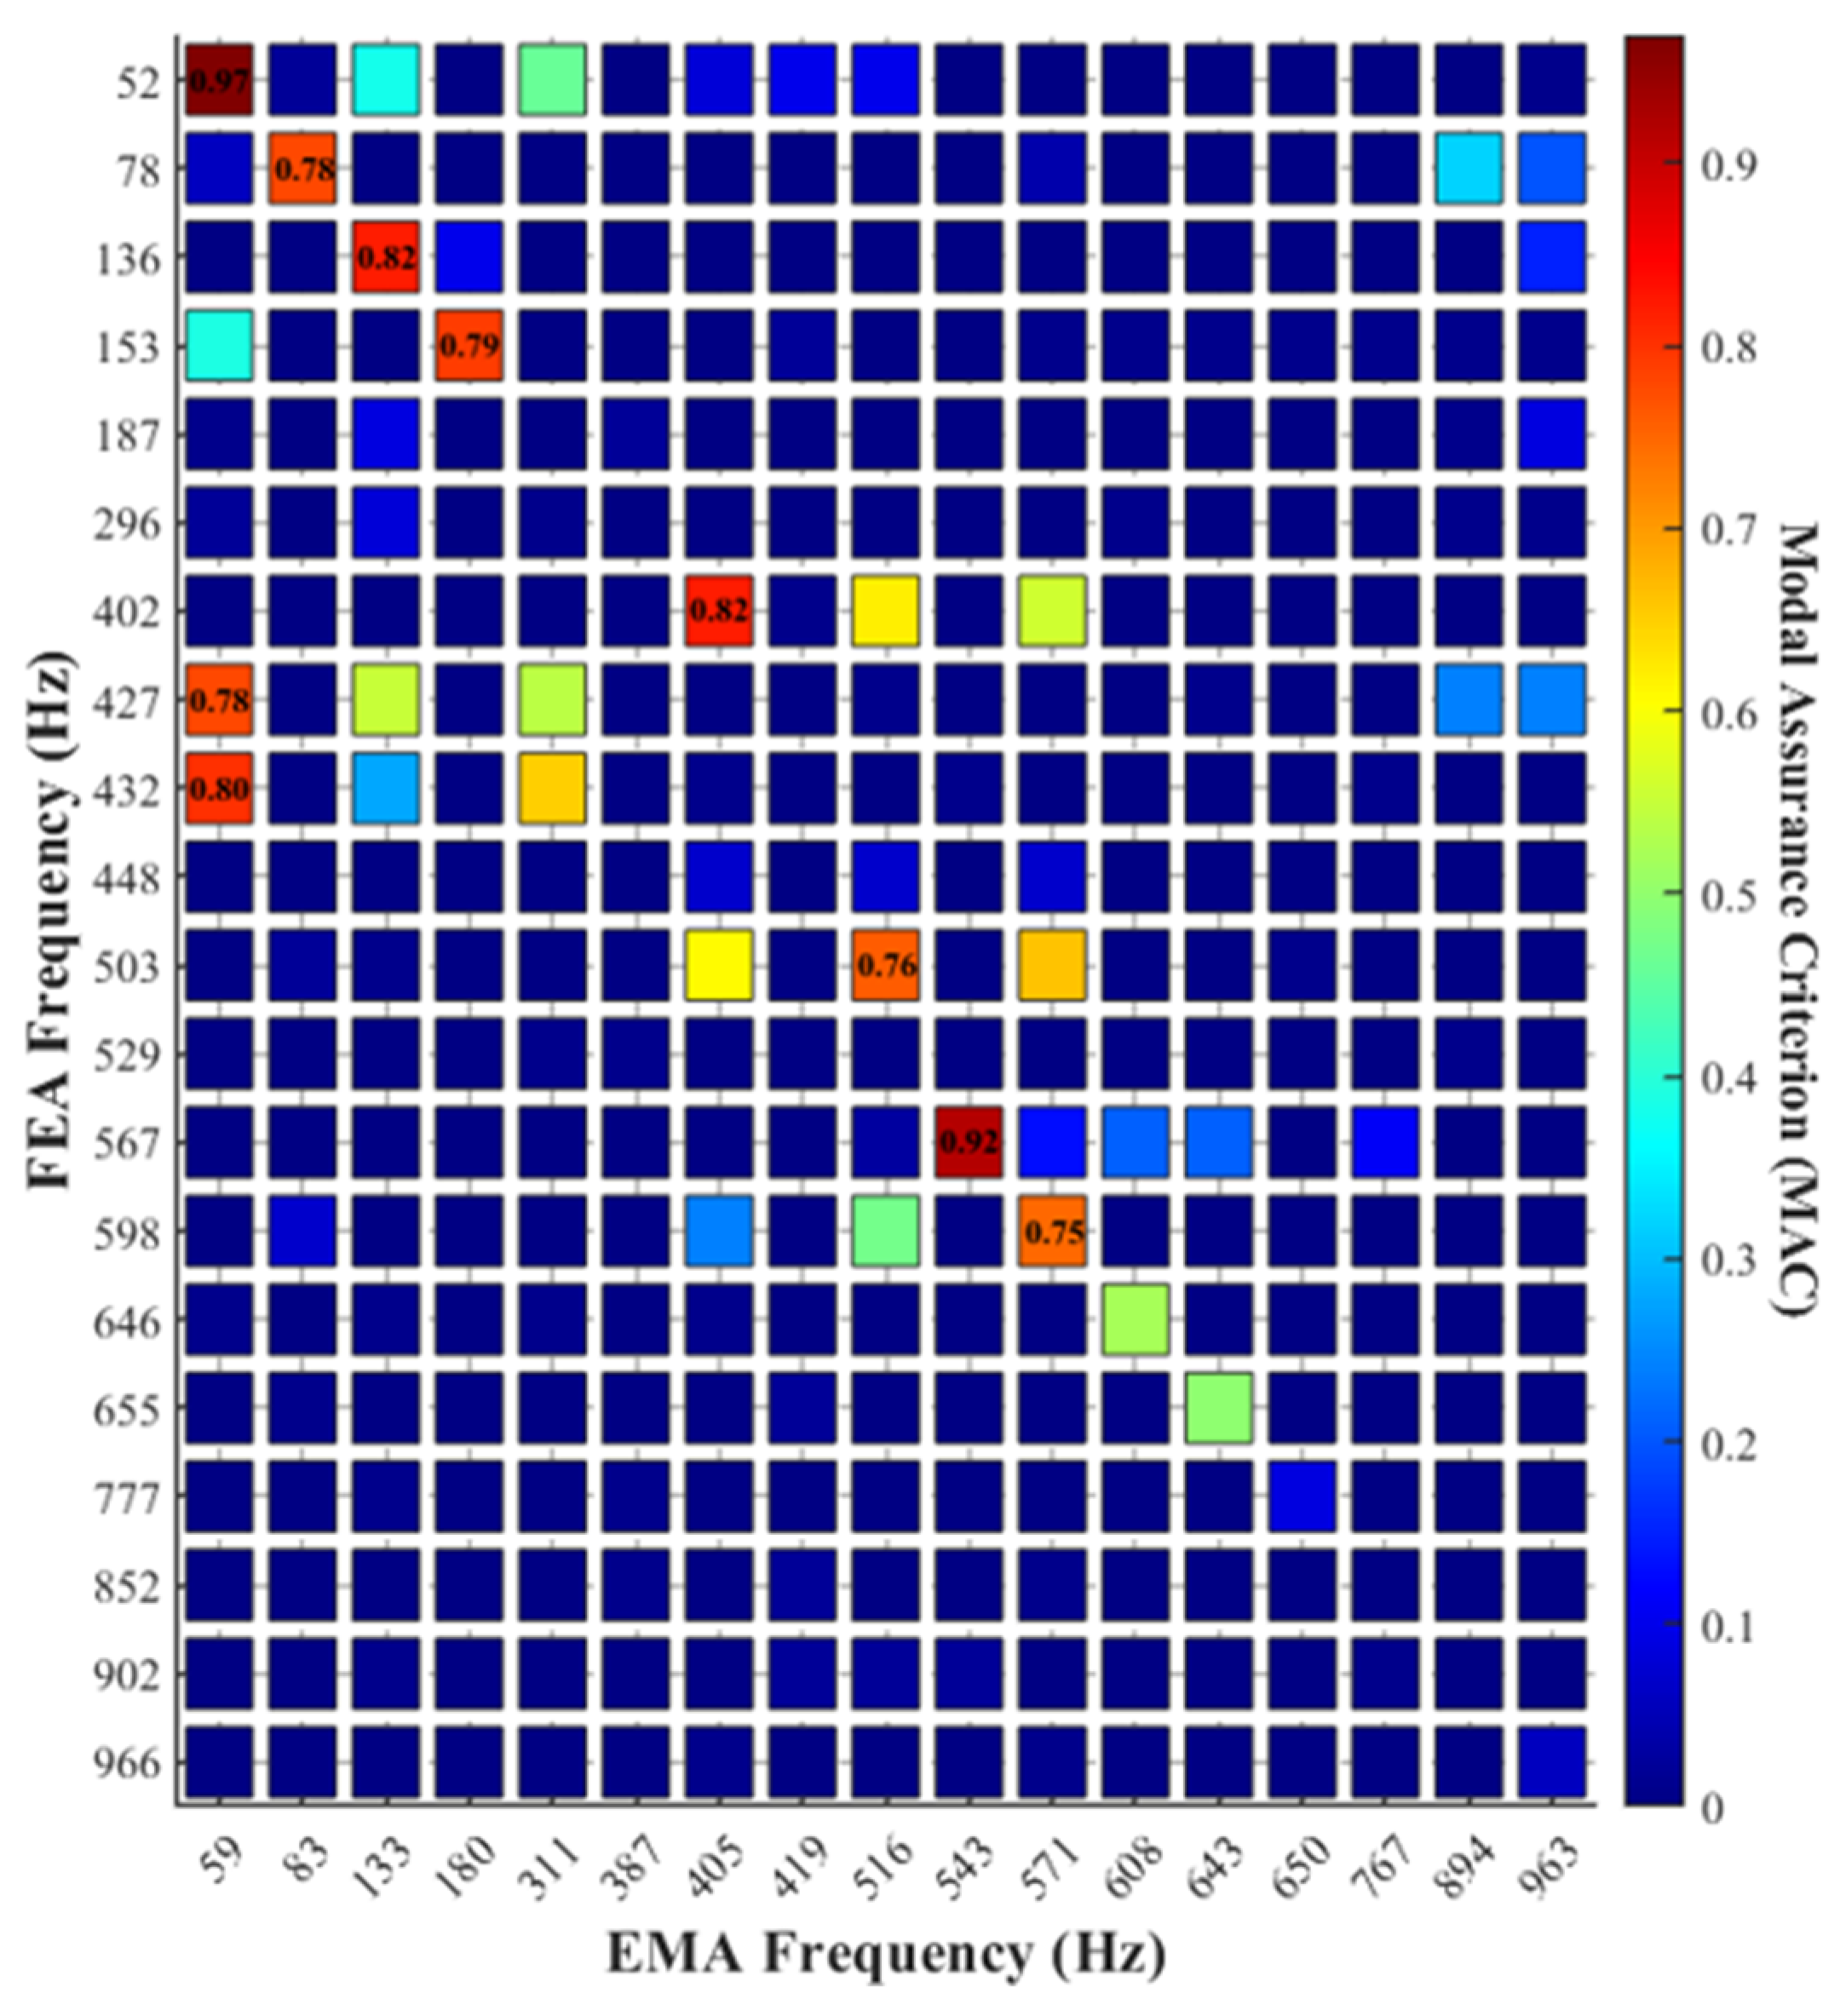
MAC matrix between the EMA and FEA modes.
Following Martin et al. [21], an MAC value above 0.9 is typically considered to indicate good correlation, while a value below 0.7 normally corresponds to poor correlation; in this study, intermediate values (0.7 ≤ MAC < 0.9) are further regarded as acceptable consistency, in accordance with common engineering practice. As shown in the results, eight modes of the support frame and mounting structure within the operating speed range exhibit MAC values greater than 0.7. The corresponding correlation levels are listed in Table 2. These modes may be excited by rotor-induced excitation during engine startup, resulting in structural resonance and consequently affecting the operational stability of the engine.
Table 2.
MAC values and classification of each mode pair.
Certain off-diagonal MAC entries, such as those between the EMA mode at 59 Hz and the FEA modes at 427/432 Hz, exceed 0.7. This may be attributed to incomplete spatial representation of the corresponding mode shapes caused by insufficient measurement point coverage, particularly if local regions of these modes are not adequately captured. The FEA modes at 427 Hz and 432 Hz share nearly identical mode shapes with the 59 Hz experimental mode over the main body of the engine pylon, while discrepancies exist in the local lugs. Since the test measurements only acquired modal information for the main body and ignored the local features, the resulting MAC values appear artificially high.
In addition, it is worth clarifying that the FE and experimental modes are numbered independently within their own complete mode sets, because the two methods yield different total numbers and orders of modes. The mode pairs are therefore identified not by equal indices but by high MAC values together with close frequencies, which is why most high-MAC entries are located off the diagonal (for example, FE Mode 7 is paired with EMA Mode 11 at about 402–405 Hz). Unpaired modes correspond to local or out-of-range modes without a validated counterpart, rather than irrelevant modes. This off-diagonal arrangement is caused by the independent mode numbering.
Among the eight matched mode pairs, the frequency agreement is generally good, with relative errors below 7% for six of the eight pairs; the remaining two pairs, Mode 1/1 (11.3%) and Mode 4/6 (15.3%), show larger discrepancies. This larger discrepancy is attributed to the pronounced sensitivity of this mode to the modeling of the bolted joints: its deformation is concentrated at the frictional-contact interfaces between the mounting structure and the support frame, where the effective stiffness depends strongly on the bolt preload and the contact pressure distribution. In the finite element model, these joints are represented by frictional contacts with an equivalent preload; any idealization of the contact stiffness therefore shifts the predicted natural frequency, although it has little effect on the overall deformation pattern. This interpretation is supported by the corresponding MAC value of 0.79, which indicates that the spatial mode shape is still correctly identified despite the frequency difference. Accordingly, this mode is used in the subsequent analysis with due consideration of its frequency uncertainty.
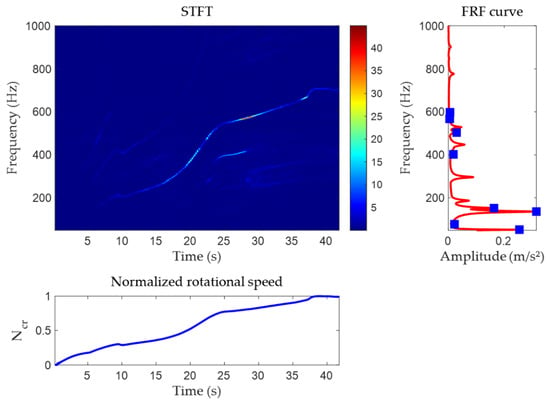
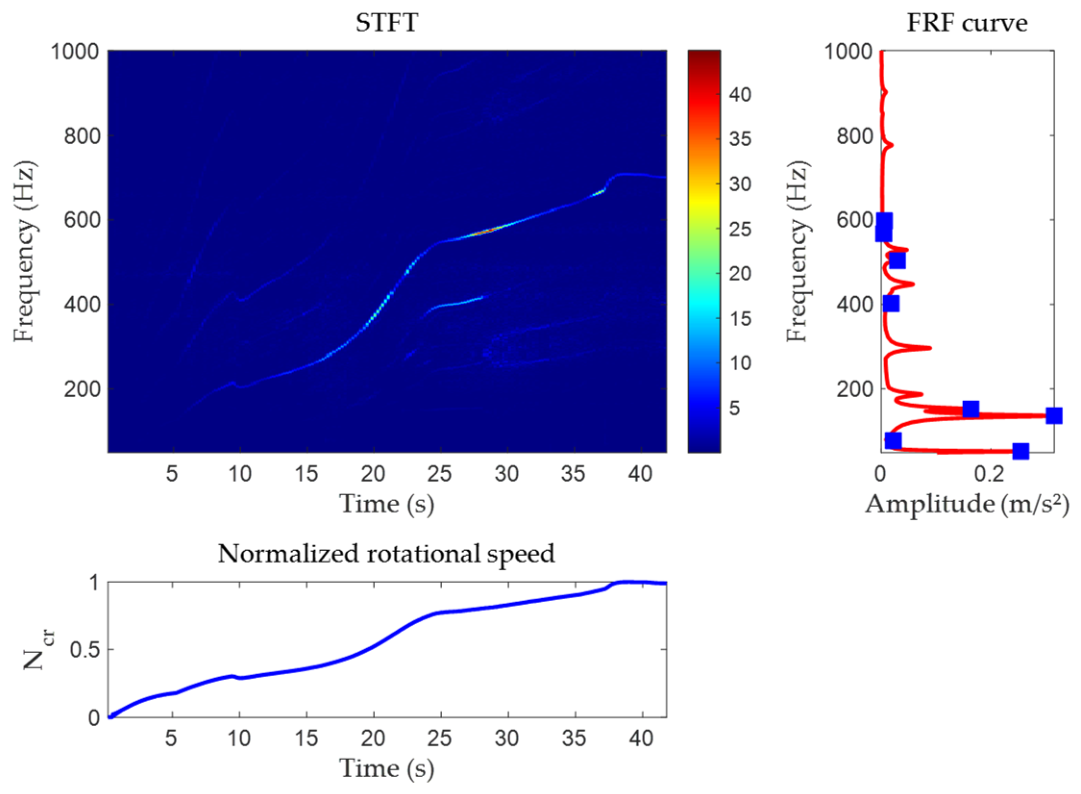
To investigate the relationship between the excessive vibration response observed during engine startup and the modal frequencies of the test stand, steady-state harmonic response analysis is performed over the operating frequency range using the modal superposition method based on the baseline finite element model. During the engine test, the vibration measurement point is located directly beneath the engine, where the vibration acceleration in the Y direction is measured. Accordingly, in the harmonic response analysis, equivalent harmonic excitations are applied to the main mounting joint of the mounting structure along the global X, Y, and Z directions. The displacement amplitude at node G1, located above the mounting structure, is then evaluated. A harmonic response envelope curve is constructed and compared with the STFT results and rotational frequency curve obtained during the startup process, as shown in Figure 11. The right side of the figure presents the acceleration amplitude obtained from the finite-element harmonic-response analysis under an equivalent reference excitation, rather than the spectrum of the measured vibration signal. The time window and normalized rotational speed in this figure correspond to 18–60 s in Figure 4.
Figure 11.
Comparison of the harmonic response spectrum of the test stand with the STFT.
It should be noted that steady-state harmonic response analysis corresponds to a constant-speed operating condition, whereas the engine startup process is a variable-speed condition. Based on the measured rotational speed data, the average rotational acceleration during the startup stage is estimated to be approximately 220(r/s)/s. The dwell time within the resonance regions is substantially longer than the structural decay time constant. Therefore, the quasi-stationary state assumption can be considered approximately valid, and the steady-state harmonic response envelope can be used as an approximate reference for identifying the resonance peak locations during the startup process.
3.3. Identification of Nonlinear Coupling Based on Bispectral Analysis
The measured spectrum (Figure 5) shows harmonic and sideband components during engine operation. The harmonic components exhibit evident nonlinear coupling relationships, and the amplitudes of these coupled frequency components continuously increase as the engine advances from idle to the maximum operating state.
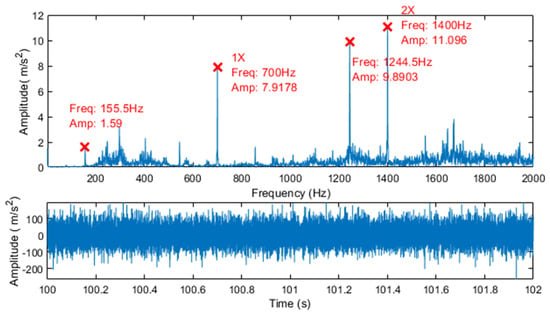
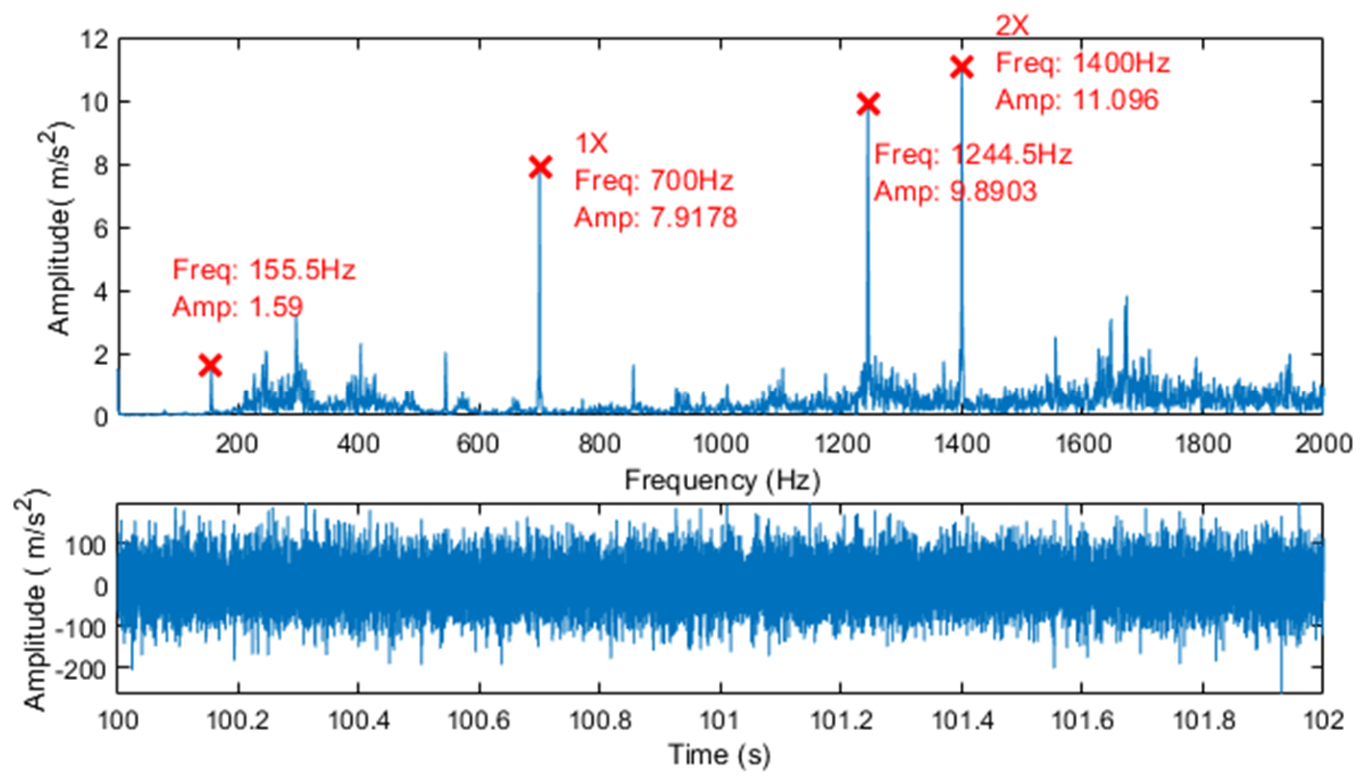
To investigate the coupling relationships among the different spectral components, a representative segment of the vibration data (100–102 s) is selected for higher-order spectral analysis. The corresponding time-domain waveform and frequency spectrum are shown in Figure 12. It can be observed that the vibration signal during this interval contains several dominant frequency components, including , (fundamental frequency, 1X), , and (second harmonic, 2X). These components satisfy the algebraic relationship , while both and vary with rotational speed. As the rotational speed increases, the amplitude of the second harmonic (2X) component eventually exceeds that of the fundamental frequency (1X) component.
Figure 12.
Time-domain waveform and frequency spectrum of the vibration signal recorded during the 100–102 s interval.
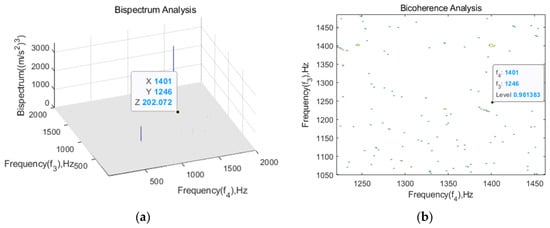
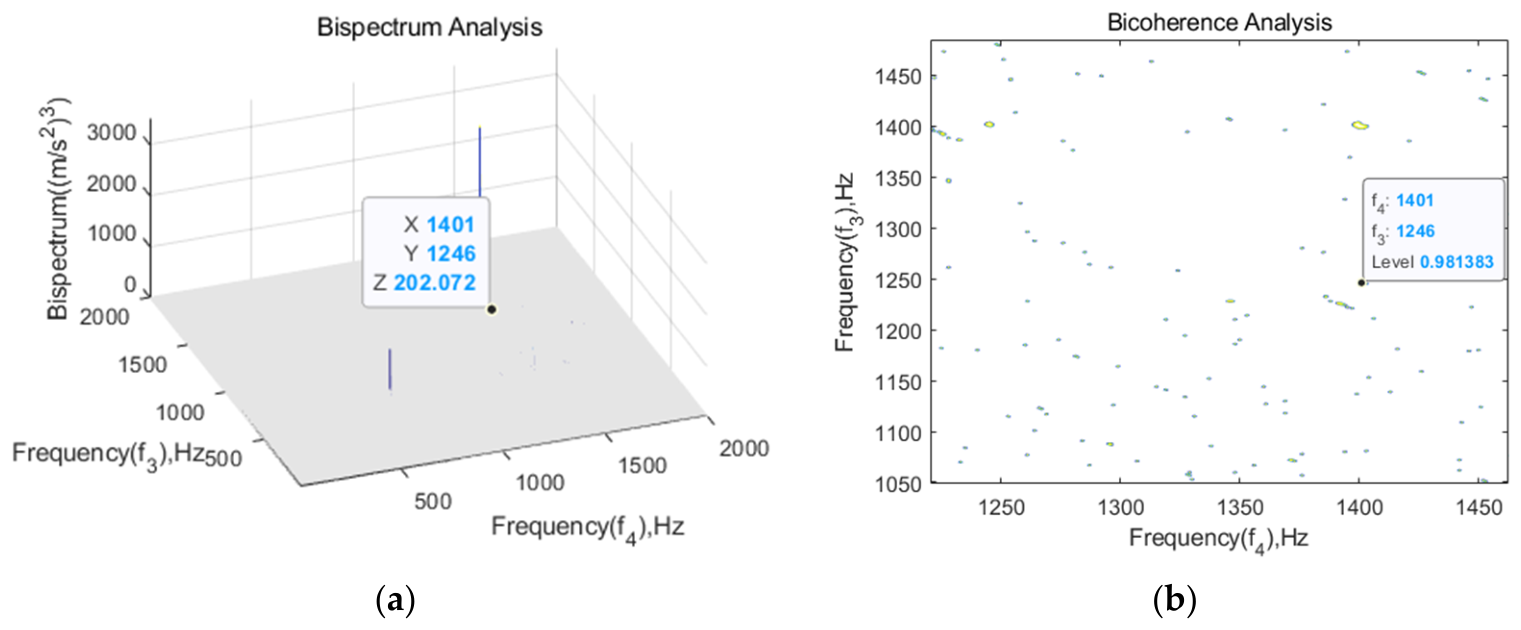
The bispectrum and bicoherence were estimated from the quasi-stationary 100–102 s interval of the measured signal, which was divided into 10,000-point Hann-windowed sub-segments with 50% overlap and averaged over 3 segments, giving a frequency resolution Δf = 1 Hz. The results are shown in Figure 13. At the identified coupled frequency triplet (, , ), the measured bicoherence is approximately 0.98, clearly indicating quadratic phase coupling among the three frequency components, namely , and . Among these components, corresponds to the second harmonic (2X). As the rotational speed increases, maintains a nearly constant frequency difference from , indicating a frequency-following phenomenon. It should be noted that minor discrepancies (within 1–2 Hz) among the peak frequencies reported by the FFT spectrum, bispectrum, and bicoherence arise from their distinct frequency grids (Δf), window main-lobe widths, spectral leakage, and the fact that the bicoherence locates the maximum of the normalized coupled product subject to the constraint , rather than the individual spectral-power maxima. These deviations are within the frequency resolution and do not affect the coupling identification.
Figure 13.
Bispectrum (a) and bicoherence (b) of the vibration signal in the 100–102 s interval.
The coupling between and generates a difference frequency component of , which persists throughout the entire steady-state stage. Its frequency is close to the modal frequency of 152.62 Hz predicted by the numerical model of the test stand (see Table 2) and falls within the near-resonance frequency band of the corresponding mode. Consequently, this coupled frequency component is further amplified by the test stand structure, thereby inducing an additional vibration response.
To evaluate the influence of measurement noise on bicoherence results and determine the detection threshold, we conducted a systematic signal-to-noise ratio (SNR) sensitivity analysis. Gaussian white noise was superimposed onto the original vibration signal at seven SNR levels: −5 dB, 0 dB, 5 dB, 10 dB, 15 dB, 20 dB and the noise-free condition. For each SNR level, ten independent noise realizations were generated, and the bicoherence value at the identified coupling frequency triplet (155 Hz, 1246 Hz, 1401 Hz) was computed.
Table 3 summarizes the mean bicoherence values and standard deviations across the ten trials for each SNR level. The results demonstrate that bicoherence values remain consistently high (mean ) with low variance for SNR ≥ 5 dB, indicating robust detection of quadratic phase coupling. In contrast, at SNR ≤ 0 dB, the bicoherence values decrease substantially (mean ) and exhibit increased variance, suggesting degraded detection reliability under severe noise contamination.
Table 3.
SNR sensitivity analysis and surrogate data testing results for the coupling frequency triplet.
To rigorously assess whether the detected quadratic phase coupling exceeds spurious correlations induced by noise or finite data length, we performed phase-randomized surrogate data testing [22,23]. For each SNR level, 200 surrogate signals were generated by preserving the amplitude spectrum of the original signal while randomizing the Fourier phases, thereby destroying genuine phase coupling while maintaining the power spectral characteristics. The bicoherence at the target frequency triplet was computed for each surrogate realization, and empirical 99% thresholds were determined from the resulting distributions.
As shown in Table 3, the measured bicoherence at the coupling frequency triplet significantly exceeds the 99th percentile of the surrogate distribution for SNR ≥ 10 dB (p-value < 0.01), confirming that the detected quadratic phase coupling is statistically distinguishable from noise-induced artifacts. At SNR = 5 dB, the detection lies at the marginal significance boundary, with some trials achieving significance while others do not reach statistical significance. For SNR ≤ 0 dB, the measured bicoherence values fail to exceed the surrogate thresholds, indicating that genuine coupling cannot be reliably distinguished from random correlations at these noise levels.
These results establish that the statistical detection threshold for the proposed bicoherence analysis lies at approximately SNR ≈ 10 dB. The original aero-engine vibration signal, exhibiting at the identified coupling triplet (155, 1246, 1401) Hz, significantly exceeds the surrogate-based 99% threshold computed for the noise-free case (). This result confirms statistically significant quadratic phase coupling among the three frequency components.
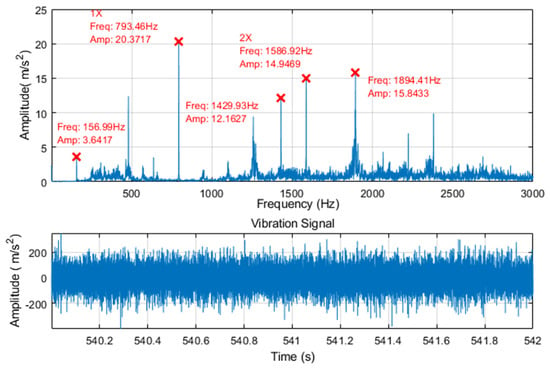
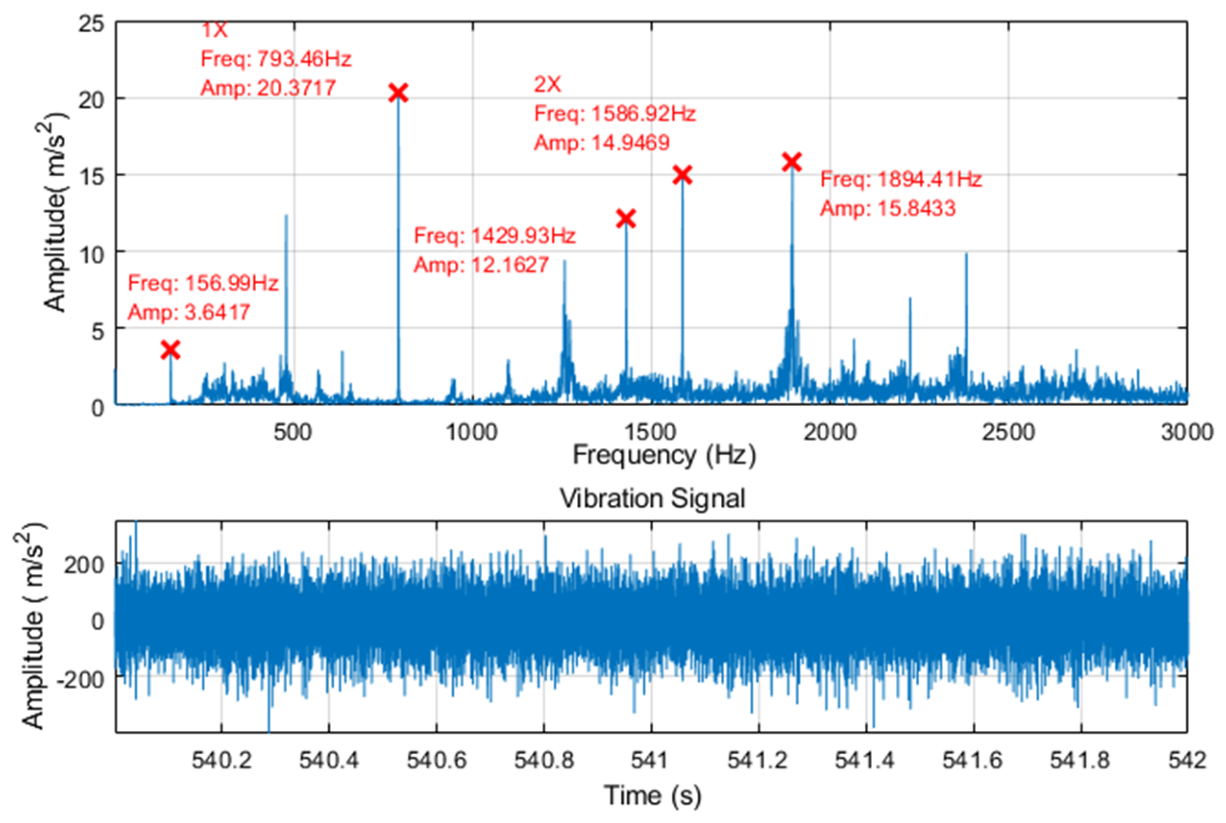
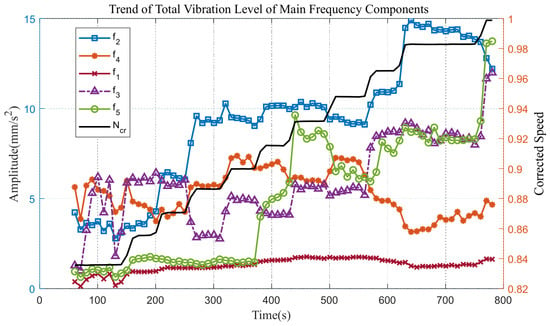
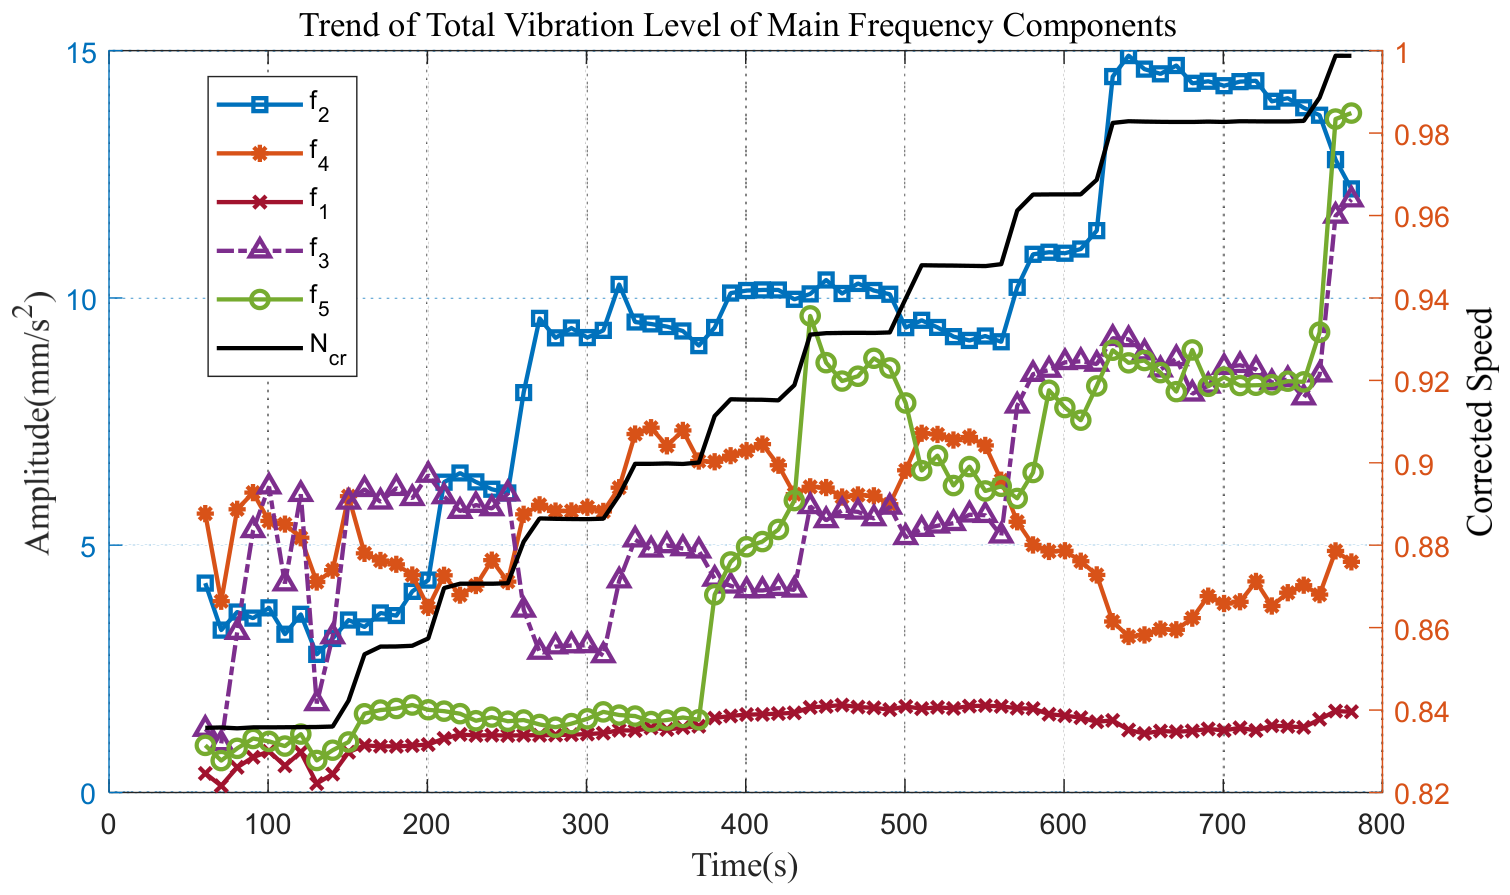
As the rotational speed gradually increases, both the frequencies and amplitudes of the major spectral components exhibit significant variations. As a representative example, the vibration signal recorded from 540 to 542 s was analyzed; Figure 14 shows the corresponding time-domain waveform and spectrum. The signal mainly consists of the frequency components , (fundamental frequency), , (second harmonic), , (this may be the second-order sideband) and others. The variation trends of the overall vibration amplitudes of the major frequency components with rotational speed are presented in Figure 15. The frequency components are speed-following harmonic/sideband frequencies extracted from the measured signal, rather than fixed structural natural frequencies.
Figure 14.
Time-domain waveform and frequency spectrum of the vibration signal recorded during the 540–542 s interval.
Figure 15.
Variations in the amplitudes of the main frequency components with rotational speed.
The amplitude of the fundamental (1X) component increases with rotational speed. When the normalized rotational speed exceeds 0.9, the amplitude of the second harmonic component decreases slightly, which can be attributed to the self-centering effect of the rotor. In contrast, the amplitudes of the lower and upper sideband components, and , around the second harmonic continue to increase. These sideband components maintain an approximately constant frequency separation from the second harmonic as the rotational speed varies. This indicates that the reamplified sideband components are not directly associated with the primary unbalance excitation. Instead, their increasing amplitudes are attributed to amplification by the near-resonant structural response of the test stand.
3.4. Inference of Vibration Evolution During Aero-Engine Test Stand Operation Based on the Integrated Analysis Strategy
Through dynamic modeling and experimental validation of the test stand system, the natural frequencies and mode shapes of the aero-engine test stand are identified. By comparing these structural dynamic characteristics with the measured vibration signals during engine testing, it can be observed that, during the engine startup process, the vibration amplitude measured on the engine exhibits transient increases as the rotational speed increases and the fundamental rotational frequency approaches the modal frequencies of the test stand, indicating a pronounced resonance phenomenon.
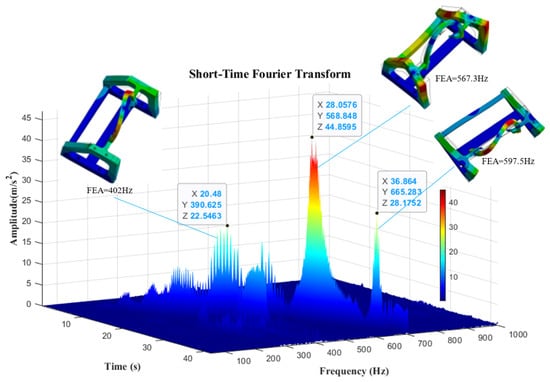
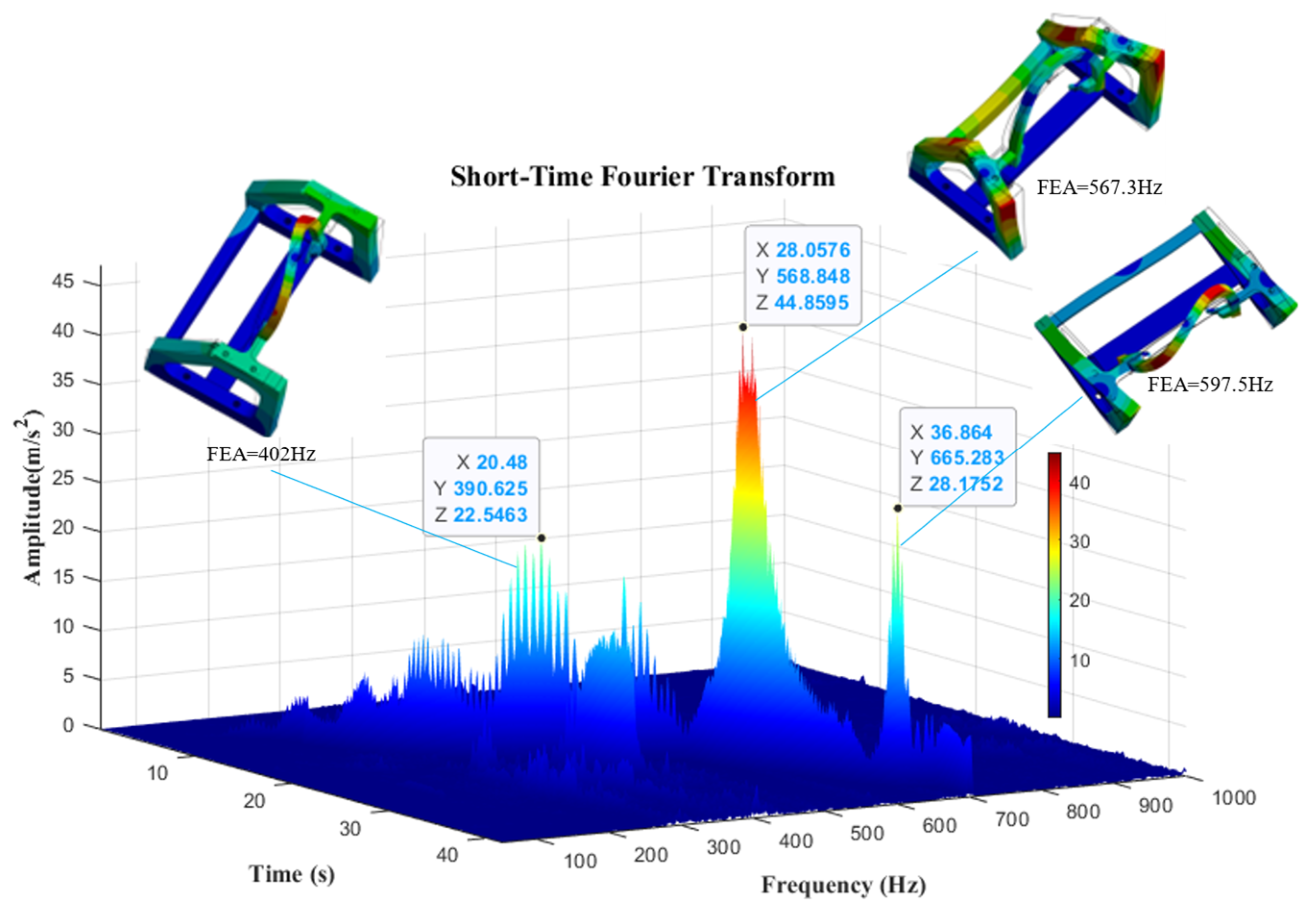
In particular, prominent vibration peaks occur at approximately 390, 570, and 660 Hz, which are in reasonable agreement with the test stand modal frequencies predicted by the finite element analysis, namely 402, 567, and 597 Hz (see Table 2), with relative errors of 3.0%, 0.2%, and 10.5%. These results are shown in Figure 16. The other test stand modes may not produce pronounced vibration peaks because the measurement direction is relatively insensitive to the corresponding mode shapes. Therefore, the excessive vibration observed during engine startup is considered to be primarily associated with resonance of the aero-engine test stand system, as the rotational-frequency harmonics approach the structural modal frequencies. Under actual operating conditions, such resonance may amplify the vibration transmitted between the engine and the test stand, increase dynamic loads on the bearing supports and associated structural components, and potentially accelerate the development of installation-related vibration problems. The post-test teardown findings of circumferential scratches on the bearing housing provide additional evidence of relative motion at the bearing outer-ring–housing interface. However, the present study does not quantitatively establish the extent to which the observed resonance affects engine performance, component fatigue life, or operational safety. Such effects depend on factors including vibration amplitude, duration of resonance, transmission paths, and the dynamic characteristics of the coupled engine–test-stand system. Further coupled dynamic analysis and measurements under representative operating conditions are required to quantify these effects.
Figure 16.
STFT of the vibration signal during startup.
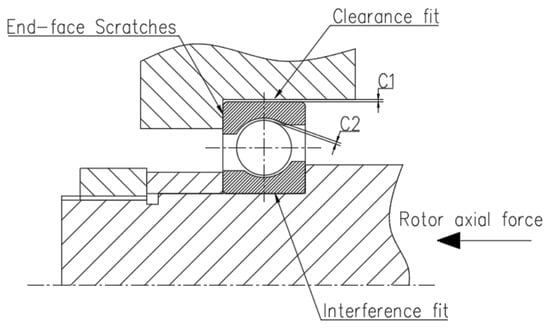
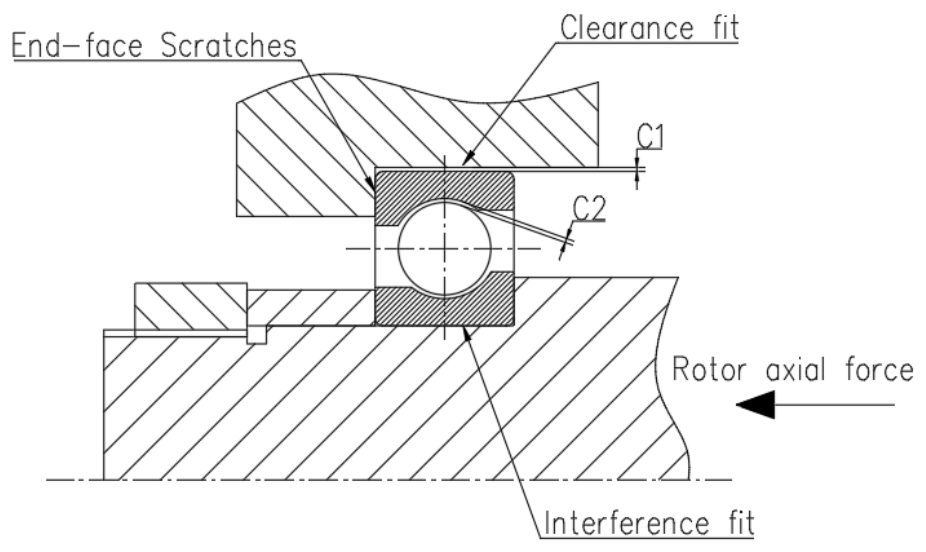
Resonance not only causes the overall vibration level during the startup stage to exceed the specified limit, but, more importantly, sustained resonant vibration subjects the bearing to prolonged operation under large amplitude excitation. Because of the relatively large assembly clearance between the bearing outer ring and the bore of the bearing housing (C1 in Figure 17), the cyclic impact loads imposed on the bearing during resonance may promote changes in the installation state of the outer ring within the bearing housing. Under resonant excitation, the initial concentricity deviation may be amplified, while the amplitude of the second harmonic exceeds that of the fundamental frequency (see Figure 11), indicating that misalignment-related vibration had become dominant. The bearing outer ring may consequently undergo circumferential relative motion within the bearing housing.
Figure 17.
Schematic of the bearing installation (C1: assembly clearance between outer ring and housing bore; C2: radial internal clearance).
This inference is further supported by the results of the post-test engine teardown inspection, which revealed circumferential relative motion between the bearing outer ring and the housing bore, resulting in circumferential scratches on the end face of the bearing housing.
During the steady-state stage, the vibration signal exhibits pronounced upper and lower sideband components around the rotor second harmonic, with a representative sideband frequency of 1246 Hz. Bispectral analysis demonstrates strong quadratic phase coupling among the frequency triplet (155 Hz,1246 Hz, and 1401 Hz), with a bicoherence coefficient reaching 0.98. The coupled frequency component at 155 Hz falls within the near-resonance region of the test stand, centered around 152.62 Hz, and is further amplified by the structural response, thereby aggravating the overall engine vibration.
4. Discussion and Conclusions
4.1. Discussion
Unlike conventional fault diagnosis methods based solely on dynamic modeling, signal feature analysis, or data-driven approaches, the analysis strategy proposed in this study integrates numerical modeling with bispectral analysis. The proposed framework establishes a closed-loop comprising three key elements: modal-frequency priors as constraints, targeted identification of coupled frequencies, and a near-resonance amplification criterion based on difference frequencies. In this way, structural dynamic modeling and nonlinear signal analysis provide complementary analysis criteria that cannot be obtained from either approach independently. This enables the proposed method to distinguish between linear and nonlinear vibration features and to investigate their possible underlying physical mechanisms. The proposed strategy is subsequently applied to the analysis of vibration anomalies observed during the ground testing of an aero-engine test stand.
Through dynamic numerical modeling and experimental modal validation of the test stand system, eight natural frequencies and corresponding mode shapes within the operating speed range are identified. The results suggest that linear structural resonance contributes to the excessive vibration observed during the startup stage, as prominent frequency components approach the natural frequencies of the test stand. Bispectral analysis of the vibration signals during the steady-state stage further identifies frequency components exhibiting quadratic phase coupling. Moreover, an algebraic relationship is identified between the coupled difference frequency and the natural frequency of the system. The identified difference frequency is close to the natural frequency of the test stand and may therefore be subject to structural dynamic amplification under operating conditions. This provides a plausible explanation for the observed sideband behavior during the steady-state stage, although the causal relationship between nonlinear coupling and the increase in sideband amplitude has not yet been independently verified.
The localized circumferential scratches on the end face of the front bearing housing are consistent with possible relative motion at the bearing outer-ring–housing bore interface during the test. Together with the observation that the second harmonic (2X) amplitude exceeds that of the fundamental frequency (1X), these findings raise the possibility that the fit or contact condition at the bearing outer-ring–housing bore interface contributed to the observed nonlinear vibration behavior. However, the available evidence does not directly establish angular wobble of the outer ring or confirm that large-amplitude resonant excitation caused the observed surface damage.
The nonlinear coupling observed in the system may be associated with an increased radial clearance of the bearing (C2 in Figure 17). Based on an investigation of measured signals from aero-engine, Ehrich [24] reported that when clearance exists in the bearing support and the rotor operates under subcritical or supercritical conditions, a cluster of equally spaced spectral lines can spontaneously develop around the subharmonic resonance peak, a phenomenon referred to as “spontaneous sidebanding at the subharmonic peak.” These sidebands are centered around the natural frequency of the system and appear in pairs at speed ratios that are reciprocals of each other, on either side of the critical speed; moreover, the numerical simulation results are in close agreement with the measurements obtained on the high-speed rotor. This observation directly indicates that nonlinear impact dynamics induced by bearing clearance can generate clusters of sidebands in the frequency spectrum. Tiwari et al. [25] further demonstrated from a mechanistic perspective that the radial internal clearance of rolling element bearings, together with Hertzian contact, results in nonlinear support stiffness. As the rolling elements periodically enter the load-bearing zone, this nonlinear support behavior introduces a varying compliance (VC) parametric excitation. Under large clearance conditions, the system undergoes a Hopf bifurcation, introducing new modulation frequencies in addition to the VC excitation frequency. The resulting response exhibits amplitude modulation, and a dense banded spectral structure develops between the VC frequency and its harmonic components. As the clearance increases, the instability and sideband regions become significantly broader.
Overall, excessive radial bearing clearance can introduce varying compliance-induced nonlinear coupling and amplitude modulation, thereby generating sidebands around the dominant frequency components. The experimentally observed sideband pattern around 1244.5 Hz is consistent with previously reported features of clearance-induced nonlinear behavior. This similarity makes clearance-related nonlinear coupling a plausible explanation for the observed vibration features, but it does not establish bearing clearance as the specific cause in the present system. However, the specific source of the nonlinear behavior—whether increased internal bearing clearance or looseness at the bearing outer ring–housing bore interface—remains unresolved. The controlled fault specimens planned for future investigation, as described in Section 4.2, are intended to help distinguish between these possible mechanisms.
Future work will focus on extending the proposed integrated framework toward vibration prediction and more comprehensive fault diagnosis. One possible direction is to investigate hierarchical prediction methods that incorporate physical and statistical prior information, potentially linking the structural dynamic characteristics identified by finite element modeling with the temporal evolution of vibration features. Another direction is to explore spatial–channel collaborative multi-scale feature interaction for integrating measurements from multiple sensors and characterizing relationships among vibration responses at different locations and frequency scales. In addition, task-adaptive learning strategies guided by task variability could be investigated to improve diagnostic generalization across different engine operating conditions and fault scenarios. These extensions will require further methodological development and validation using additional experimental data. The present study provides a mechanism-oriented analytical basis for such future investigations but does not yet implement or validate these prediction and learning frameworks.
4.2. Conclusions
This study addresses the complex vibration problem encountered in aero-engine ground test stand systems, where linear and nonlinear vibrations coexist and interact with each other. A vibration fault identification method integrating numerical modeling and bispectral analysis is proposed to enable physics-based analysis of vibration faults in aero-engine test stand systems. The proposed approach provides a new perspective on vibration fault diagnosis during engine ground testing and offers practical guidance for the dynamic design of aero-engine ground test stand systems. The main conclusions are summarized as follows:
An integrated vibration feature identification method combining numerical modeling and bispectral analysis is proposed. Through three levels of methodological linkage, namely structural information-based prior constraints, quantitative evidence from bicoherence, and a near-resonance criterion based on coupled difference frequencies, the proposed method establishes a global association between linear resonance mechanisms and nonlinear coupling mechanisms, providing a practical analytical framework for tracing the physical origins of vibration faults in test stand systems.
The linear resonance mechanism during the startup stage is identified. Based on finite element modeling and experimental modal validation, eight natural frequencies and their corresponding mode shapes of the test stand system within the operating speed range are identified. Harmonic response analysis shows that the vibration peaks occurring at approximately 390, 570, and 660 Hz during engine startup are in good agreement with the numerically predicted modal frequencies of 402, 567, and 597 Hz, with relative errors of 3.0%, 0.2%, and 10.5%, respectively. These results demonstrate that the excessive vibration during startup is primarily governed by linear resonance induced by the rotational frequency harmonics crossing the structural modes of the test stand.
Nonlinear coupling and the associated bearing installation state evolution during the steady-state stage are identified. The steady-state vibration signal is consistent with misalignment, with the second harmonic (2X) amplitude exceeding the fundamental frequency (1X) amplitude. Posttest teardown inspection revealed localized circumferential scratches on the end face of the bearing housing, suggesting that the fit state of the outer-ring/housing-bore interface was degraded under large-amplitude resonant excitation. Bispectral analysis identifies strong quadratic phase coupling triplets (). For the 100–102 s operating condition, the identified triplet is (155, 1246, 1401) Hz, while for the 540–542 s operating condition, it is (157, 1430, 1587) Hz. The corresponding bicoherence coefficients are both ≥0.98, and the sideband spacing is highly consistent with the difference frequency ().
A structural resonance–nonlinear coupling–structural reamplification cascade is revealed. The coupled difference frequency falls within the near-resonance region of the test stand around its natural frequency of 152.62 Hz and is further amplified by the structural response. This establishes a closed-loop cascade characterized by structural resonance–nonlinear coupling–structural reamplification, which provides a physical explanation for the continuously increasing amplitude of the sideband components during the steady-state stage.
Engineering significance and limitations. The proposed method provides a basis for mechanism-oriented inference of vibration phenomena in aero-engine test stand systems and facilitates the distinction between linear resonance components and nonlinear coupling components, thereby providing guidance for the dynamic design of test stand systems. It should be noted, however, that the mechanism inference presented in this study is based solely on experimentally measured vibration signals and their spectral and bicoherence characteristics. A rigorous distinction between the dominant origins of the sidebands, such as internal bearing clearance/VC effects and friction at the outer ring housing bore interface, requires a coupled dynamic model incorporating multiple degrees of freedom and multiple nonlinear mechanisms. Looking ahead, four extensions are planned. First, the integrated FEM–bispectral procedure will be applied to test stands of different structural configurations and to additional engines, in order to examine the transferability of the near-resonance amplification criterion across platforms. Second, bearings with specified outer-ring-to-housing-bore fit clearances or internal radial clearances will be tested using controlled fault specimens, so that the sensitivity of the bicoherence features to different fault types and severity levels can be quantified, and the dominant source of the observed sidebands (varying-compliance-induced coupling versus outer-ring looseness) can be distinguished. Third, a multi-case data set will be constructed to evaluate the diagnostic reliability and generality of the method in a statistical sense. Finally, the coupled nonlinear rotor-support model mentioned above will be developed to provide a mechanistic cross-check of the experimentally inferred scenario. These extensions, which require dedicated test resources beyond those available for the present study, constitute the clear next step of this research.
Author Contributions
Conceptualization, F.M. and L.Y.; methodology, F.M., L.Y. and Y.W.; software, Y.W. and J.L.; validation, F.M. and L.Y.; formal analysis, F.M., L.Y. and Y.W.; investigation, F.M., L.Y., Y.W. and J.L.; resources, F.M.; data curation, F.M.; writing—original draft preparation, F.M., L.Y. and Y.W.; writing—review and editing, F.M., L.Y. and Y.W.; visualization, F.M., L.Y. and Y.W.; supervision, L.Y. All authors have read and agreed to the published version of the manuscript.
Funding
This research received no external funding.
Institutional Review Board Statement
Not applicable. This study did not involve human participants, animal subjects, or any experiments requiring ethical approval.
Informed Consent Statement
Not applicable. This study did not involve human participants, and no personal or identifiable data were collected.
Data Availability Statement
The data that support the findings of this study are available from the corresponding author upon reasonable request. Owing to confidentiality restrictions associated with the aero-engine development program, the raw test data are not publicly available; they can be obtained from the corresponding author, subject to approval from the relevant parties.
Conflicts of Interest
The authors declare no conflicts of interest.
Abbreviations
The following abbreviations are used in this manuscript:
| EMA | Experimental modal analysis |
| FE | Finite element |
| FEA | Finite element analysis |
| FEM | Finite element method |
| FRF | Frequency response function |
| LSCF | Leastsquares complex frequency domain |
| MAC | Modal Assurance Criterion |
| PRETS179 | Pretension element (ANSYS element type 179) |
| PSD | Power spectral density |
| STFT | Short-time Fourier transform |
| SNR | Signal-to-noise ratio |
| VC | Varying compliance |
| Normalized Rotational Speed |
References
- Ma, H.; Chen, Y.; Yu, L.; Lang, X.; Zhou, Y. Quantification Research on Vibration Fault Modes of Aero-Engine. J. Vib. Eng. 2024, 37, 528–538. [Google Scholar] [CrossRef]
- Zuo, Y.; Wu, Y.; Wang, J.; Feng, K.; Jiang, Z. Influence of Temperature-Induced Material Property Changes on Dynamic Characteristics of Engine Dual-Rotor System. Acta Aeronaut. Astronaut. Sin. 2023, 44, 226993. [Google Scholar] [CrossRef]
- Ding, X.F.; Liao, M.F.; Han, F.J.; Wang, Y.K. Fault Diagnosis and Elimination of the Vibration Fluctuation of a Certain Aero-Engine. J. Vib. Meas. Diagn. 2024, 44, 274–279. [Google Scholar] [CrossRef]
- Xiao, Y.; Feng, K.; Hu, M.; Jiang, Z. Extraction Method for Unsteady Vibration Components of Aero-Engine Rotors. Acta Aeronaut. Astronaut. Sin. 2024, 45, 228158. [Google Scholar] [CrossRef]
- Luan, X.; Zhao, J.; Sha, Y.; Liu, X.; Zhang, W.; Yang, J. Fault Warning Method for Aircraft Engine Rolling Bearings Based on Characteristic Energy. J. Aerosp. Power 2025, 40, 20240094. [Google Scholar] [CrossRef]
- Fackrell, J.; White, P.; Hammond, J.; Pinnington, R.; Parsons, A. The Interpretation of the Bispectra of Vibration Signals—I. Theory. Mech. Syst. Signal Process. 1995, 9, 257–266. [Google Scholar] [CrossRef] [Scilit]
- Fackrell, J.; White, P.; Hammond, J.; Pinnington, R.; Parsons, A. The Interpretation of the Bispectra of Vibration Signals—II. Experimental Results and Applications. Mech. Syst. Signal Process. 1995, 9, 267–282. [Google Scholar] [CrossRef] [Scilit]
- Li, H.; Hao, R. Bearing Fault Diagnosis Based on Incomplete Cholesky Decomposition Correntropy and Bi-Spectrum. J. Vib. Shock 2022, 41, 123–140. [Google Scholar] [CrossRef]
- Chen, X.; Yang, R.; Xue, Y.; Huang, M.; Ferrero, R.; Wang, Z. Deep Transfer Learning for Bearing Fault Diagnosis: A Systematic Review since 2016. IEEE Trans. Instrum. Meas. 2023, 72, 3508221. [Google Scholar] [CrossRef] [Scilit]
- Yan, Z.; Liu, H. SMoCo: A Powerful and Efficient Method Based on Self-Supervised Learning for Fault Diagnosis of Aero-Engine Bearing under Limited Data. Mathematics 2022, 10, 2796. [Google Scholar] [CrossRef] [Scilit]
- Wen, B.; Liu, S.; Zhang, C. Mechanical Vibration, 2nd ed.; Metallurgical Industry Press: Beijing, China, 2011; ISBN 978-7-5024-5648-1. [Google Scholar]
- Hao, H.; Yang, Z.; Zhang, H.; Zhou, D.; Cao, Y.; Zhao, W. Test Modeling of an Engine Mounting System Based on Equivalent Distributed Mass Points. J. Vib. Meas. Diagn. 2024, 44, 891–899. [Google Scholar] [CrossRef]
- Cocconcelli, M.; Troncossi, M.; Mucchi, E.; Agazzi, A.; Rivola, A.; Rubini, R.; Dalpiaz, G. Numerical and Experimental Dynamic Analysis of IC Engine Test Beds Equipped with Highly Flexible Couplings. Shock Vib. 2017, 2017, 5802702. [Google Scholar] [CrossRef] [Scilit]
- Ewins, D.J. Modal Testing: Theory, Practice and Application, 2nd ed.; Research Studies Press: Baldock, UK, 2000; ISBN 978-0-86380-218-8. [Google Scholar]
- Zou, X.; Zhang, H.; Jiang, Z.; Zhang, K.; Xu, Y. Toward Accurate Extraction of Bearing Fault Modulation Characteristics with a Novel Time–Frequency Modulation Bispectrum and Modulation Gini Index Analysis. Mech. Syst. Signal Process. 2024, 219, 111629. [Google Scholar] [CrossRef] [Scilit]
- Zou, X.; Zhang, K.; Liu, T.; Jiang, Z.; Xu, Y. An Overlapping Group Sparse Variation Method for Enhancing Time–Frequency Modulation Bispectrum Characteristics and Its Applications in Bearing Fault Diagnosis. Measurement 2025, 249, 117066. [Google Scholar] [CrossRef] [Scilit]
- Sharma, A.; Patra, G.K.; Naidu, V.P.S. Bispectral Analysis and Information Fusion Technique for Bearing Fault Classification. Meas. Sci. Technol. 2024, 35, 015124. [Google Scholar] [CrossRef] [Scilit]
- Zhang, X.D. Modern Signal Processing, 3rd ed.; Tsinghua University Press: Beijing, China, 2015; ISBN 978-7-302-40869-7. [Google Scholar]
- Roache, P.J. Perspective: A Method for Uniform Reporting of Grid Refinement Studies. J. Fluids Eng. 1994, 116, 405–413. [Google Scholar] [CrossRef] [Scilit]
- Vanhollebeke, F.; Helsen, J.; Peeters, J.; Vandepitte, D.; Desmet, W. Combining Multibody and Acoustic Simulation Models for Wind Turbine Gearbox NVH Optimisation. In Proceedings of the International Conference on Noise and Vibration Engineering (ISMA2012) and International Conference on Uncertainty in Structural Dynamics (USD2012); Katholieke Universiteit Leuven, Department of Mechanical Engineering: Leuven, Belgium, 2012; Volume 6, pp. 4463–4477. [Google Scholar]
- Martin, G.; Balmès, E.; Chancelier, T. Improved Modal Assurance Criterion Using a Quantification of Identification Errors per Mode/Sensor. In Proceedings of the ISMA 2014, Leuven, Belgium, 15–17 September 2014; pp. 2509–2522. [Google Scholar]
- Hinich, M.J. Testing for Gaussianity and Linearity of a Stationary Time Series. J. Time Ser. Anal. 1982, 3, 169–176. [Google Scholar] [CrossRef] [Scilit]
- Theiler, J.; Eubank, S.; Longtin, A.; Galdrikian, B.; Farmer, J.D. Testing for Nonlinearity in Time Series: The Method of Surrogate Data. Phys. D 1992, 58, 77–94. [Google Scholar] [CrossRef] [Scilit]
- Ehrich, F.F. Observations of Nonlinear Phenomena in Rotordynamics. J. Syst. Des. Dyn. 2008, 2, 641–651. [Google Scholar] [CrossRef] [Scilit][Green Version]
- Tiwari, M.; Gupta, K.; Prakash, O. Effect of Radial Internal Clearance of a Ball Bearing on the Dynamics of a Balanced Horizontal Rotor. J. Sound Vib. 2000, 238, 723–756. [Google Scholar] [CrossRef] [Scilit]

Disclaimer/Publisher’s Note: The statements, opinions and data contained in all publications are solely those of the individual author(s) and contributor(s) and not of MDPI and/or the editor(s). MDPI and/or the editor(s) disclaim responsibility for any injury to people or property resulting from any ideas, methods, instructions or products referred to in the content. |
© 2026 by the authors. Licensee MDPI, Basel, Switzerland. This article is an open access article distributed under the terms and conditions of the Creative Commons Attribution (CC BY) license.