


Abstract
Deflecting vanes are a common means of attitude control for electric ducted fan (EDF) vehicles. However, vane forces are mostly measured at a single operating condition, and the usable deflection range is usually assumed. A four-vane vectoring module fitted to a 70 mm EDF was tested on a static rig. Axial and normal forces were measured at six vane angles up to 25° and eight throttle settings from 10% to 80%. Rotational speed and exhaust velocity were measured, and smoke visualized the deflected jet. The vanes turned the force through less than the commanded angle. At each commanded angle, this shortfall varied by no more than 1.5° with throttle from 40%. At 20°, the effective vectoring angle was 16.0° to 17.2°. The thrust vectoring efficiency peaked at 20° at every throttle setting, from 40% to 20.9%. Beyond 20°, the normal force decreased and the resultant continued to fall. Hence, 20° was the best setting tested. At 80% throttle and 20°, the normal force was 1.56 N, and the resultant was 72% of the 7.89 N reference thrust. For control design, one relation between commanded and effective angle holds from 40% throttle, and commands beyond 20° add no control force.
1. Introduction
Electric ducted fans have emerged as a prevalent propulsion option for unmanned aerial vehicles capable of vertical take-off and landing (VTOL). The shroud enhances static thrust for a certain disk area and protects the rotor while functioning in proximity to individuals or buildings. These characteristics are ideal for confined space operations, and a wide range of hybrid VTOL designs currently incorporates ducted fans in various capacities [1]. Reviews of ducted fan aerodynamics state that the duct enhances the static thrust relative to an open propeller of the same size [2,3]. A ducted fan by itself generates thrust in a singular direction. The source of attitude control must originate from an alternative system. Vectoring the jet represents the most common choice, and in configurations with a single fan or tandem fans, it is the only logical option available.
The most common thrust vectoring technologies exhibit three main technological approaches [4]. The first category, fluidic thrust vectoring mechanisms, alters the flow direction using a secondary stream and has no moving components. The control effect is attained with reduced weight at the expense of a lower thrust coefficient [4,5,6]. The second category is Distributed Electric Propulsion, which generates a thrust vector from multiple independently regulated fans or multirotor systems [7]. The units need to be separated to generate a moment; thus, the pathway is inaccessible to an individual fan or a coaxial pair. The mechanical route contains two approaches: one rotates the nozzle, and the other places a deflector blade in the exhaust. Rotating nozzle and gimbal mechanisms adjust the exhaust trajectory, allowing the jet to pivot across almost the entire specified angle; nevertheless, they significantly increase weight and size [4,5]. The same method is also employed in ducted fan vehicles by tilting the whole fan in a gimbal [8,9]. Deflector blades have been applied to rocket propulsion since the development of guided missiles, where they are referred to as jet vanes [10]. Post-exit vanes were also flight-tested on the NASA F-18 High Alpha Research Vehicle, with three vanes around each nozzle [11]. In a scale cold-jet test of this system, a single 30° deflected vane reduced the axial thrust by 18%. Also, the vanes were only functional when they reached the edge of the exhaust plume. They are recognized for their minimal actuation torque and rapid response rate. The methodology is referred to by several names throughout nearly all communities that implement it. Deflector blade, jet vane, control vane, control flap, and guide vane all refer to the same device, although the outcomes associated with these terms have not been standardized. The term ‘vane’ is used for all of them in the following sections.
The metrics applied to characterize vectoring efficiency originated from the fluidic thrust vectoring category. Das et al. presented the effective thrust vectoring angle and the thrust vectoring efficiency pertaining to the ACHEON nozzle [12]. Kara and Kurtuluş used identical concepts in two consecutive optimization analyzes of a Coanda-based system [6,13]. Luo et al. rephrase them in a corresponding manner, along with a deflection efficiency that assesses the orientation of the applied force relative to the specified geometric angle [4]. The three investigations are computational; however, the definitions are geometric and are equally applicable to observed forces. Experimental studies within the same field have previously employed them in that manner. Banazadeh et al. measured axial and lateral forces on a compact gas turbine using load cells, adjusted the engine throttle position, and documented the thrust vector angle throughout this range [14]. They additionally assessed the deflection independently using thermal imagery and compared the results. Tanveer and Ahmad performed a study on a co-flow rig equipped with electric ducted fans and documented the deflection angle based on the measured force components [15]. Kara et al. visualized the flow in a Coanda-based fluidic thrust vectoring system using the smoke-wire technique [16].
Exit vanes have been used for a long time for control of ducted fan vehicles. Preliminary full-scale tests showed that exit vanes were more efficient than inlet vanes [2]. Abrego and Bulaga measured the side force of two exit vanes with trailing edge flaps on a 38-inch ducted fan in a wind tunnel [17]. The flaps were deflected over ±40° and the side force increased with flap deflection. Graf et al. noted that the nose-up pitching moment in forward flight limits a ducted fan vehicle, despite the control vanes aft of the duct [18]. Thus, they looked at the control devices positioned on the lip of the duct. The experimental research on mechanical vectoring has taken an alternative trajectory. Farras et al. constructed a single-axis prototype including a gimballed nozzle and documented its closed-loop pitch performance [19]. Pütsep et al. examined a tandem fan tail sitter that derives its roll and pitch control from servo-operated vanes in the exhaust, and characterized the propulsion unit but not the vanes [20]. Muehlebach and D’Andrea measured the static relationship between vane angle and thrust for a ducted fan equipped with an exit nozzle, specifically during the near-hover operating condition [21]. Naldi and Marconi measured lift, drag, and lateral force on an individual vane of a ducted fan robot via a load cell [22]. Jacobsen constructed a four-vane mono-copter using published airfoil polars for the lift and drag coefficients, with a predetermined validity range [23]. Söğütcü and Sümer measured the lift and drag of vanes on a stationary rocket motor apparatus over various vane angles [10].
Vane forces have been measured in several configurations. However, most of these measurements were taken at a single operating condition. Abrego and Bulaga changed fan speed but measured only side force [17]. Zhang and Barakos also note that there is little experimental research on the influence of guide vanes [2]. Therefore, the turning of the force and the loss of axial thrust have not been reported simultaneously throughout a range of fan speeds for ducted fan vanes in the studies reviewed here. In addition, these ducted fan studies do not report the vectoring metrics that the fluidic thrust vectoring category applies to measured forces. Test stands designed for electric ducted fans have focused on non-vectored propulsion [24,25,26,27]. In ducted fan research, the operational deflection range is typically predetermined by design or assumed, rather than determined by measurement. However, vane saturation was seen in the flying testing of a ducted fan vehicle by Cheng and Pei, which resulted in crashes [28]. This range is thus of practical importance.
In this study, a deflecting vane vectoring module fitted to a 70 mm electric ducted fan was investigated experimentally. Four flat vanes inside a housing downstream of the duct outlet are actuated by separate servos. Axial and normal forces are measured on separate load cell channels throughout a set of vane angles and throttle configurations. Rotational speed is documented throughout the whole range, and exhaust speed is noted over a significant portion. Therefore, the operating point is described by the rotational speed and the exhaust velocity in addition to the throttle command. The effective thrust vectoring angle, thrust vectoring efficiency, deflection efficiency, and normalized resultant force are calculated from the measured force pairs. Smoke visualization of the deflected jet provides qualitative evidence of the jet spreading, independent of the load cells.
2. Materials and Methods
2.1. Ducted Fan and Vectoring Module
A commercial electric ducted fan (EDF) equipped with a thrust vectoring module of our own design is the device being tested. A picture of the assembly is depicted in Figure 1. The fan is a 70 mm FMS (Shenzhen FMS Hobby Co., Ltd., Shenzhen, China) model featuring a twelve-blade rotor. It is powered by a brushless inner-runner motor rated at 1900 kV, utilizing an 80 A electronic speed controller, and is powered by a six-cell lithium polymer battery (7000 mAh, 45C).
Figure 1.
EDF and thrust vectoring system assembly.
The diameter of the duct outlet is 70 mm, while the rotor radius is 35 mm. The rotor hub is 30 mm in diameter. The chord of the rotor blade is 20 mm and remains uniform throughout the span. The rotor is presented in Figure 2a.
Figure 2.
(a) EDF rotor with 70 mm diameter, (b) thrust vectoring vane.
The vectoring module contains four planar vanes inside a housing downstream of the EDF exit. Every vane is 3D printed using PLA. Flat plates were selected as a baseline geometry that is easy to fabricate and replicate. The aerodynamic properties of flat plates with low aspect ratios are recorded [29,30]. The vanes of earlier ducted fan research employed symmetrical airfoil profiles [21,22]. The chord is 81.2 mm, and the thickness is 3.0 mm, resulting in a thickness ratio of 3.7%. The width narrows from 24.0 mm at the front edge to 16.0 mm at the back edge, resulting in a planform area of a single vane measuring 1624 mm2. The chord surpasses the diameter of the duct exit, which gives a chord-to-diameter ratio of 1.16. The four vanes together present 6496 mm2 of planform against a duct exit area of 3848 mm2. Each vane is hinged 29.5 mm posterior to its leading edge, at 0.363 of the chord. The configuration of the vane is presented in Figure 2b.
The EDF contains six stator blades positioned downstream of the rotor. The module’s housing extends the duct beyond the EDF outlet. The cross-section changes from a 70 mm circular shape to a square with an internal width of 59 mm within the first 40 mm. The leading edges of the vanes are positioned at the end of this transition. The vanes are completely contained within the square section, maintaining a clearance of 1.37 mm between their outer side edges and the housing wall. The housing ends 3.8 mm beyond the trailing edges of the vanes. The pivot axis of the rig (Section 2.2) is positioned 4.8 mm downstream from the rotor’s rear face. Figure S1 presents the dimensions of the EDF and the thrust vectoring module.
The four vanes form two orthogonal pairs. One set redirects the jet in pitch, while the other alters it in yaw. The pitching pair is the only component that is deflected in the current experiment, whereas the yawing pair remains constant at zero. Four independent vanes are included as the module is designed for a subsequent closed-loop control study. The rotor applies a reaction torque to the airframe around the duct axis, necessitating that the vanes be deflected differentially instead of as two static pairs.
Every vane is controlled by an individual EMAX ES08MDII digital servo (EMAX Model, Shenzhen, China). The servos and EDF throttle are controlled by a Matek H743-WING V3 (Matek Systems, Shenzhen, China) autopilot utilizing ArduPilot (ArduPlane 4.6.3) via MAVLink from a host computer. The dual servos of the pitching configuration operate in contrary directions, ensuring that both vanes direct the jet uniformly.
2.2. Test Rig and Instrumentation
The test unit is mounted on a structure that rotates around a horizontal axis. The whole system moves freely in the longitudinal axis (axial thrust direction) and rotates freely around the lateral axis (pitching axis). Two load cells were installed in the test rig. One is located at the end of the longitudinal axis, which measures axial thrust. The other is located under the thrust vectoring system orthogonally, which measures the normal force component caused by vane deflection. The EDF and the thrust vectoring module with all four vanes, servos, linkages, the autopilot and the electric speed controller (ESC) are carried by the moving structure as shown in Figure 1. Forces between the vanes, linkages, and the duct are all internal and do not have any effect on the measurement system. The load cells measure only the net external forces on it, which are the reaction to the jet momentum and aerodynamic forces on the vanes and the duct. The 6S battery is placed on the fixed base. Only the power cables and the autopilot’s USB cable travel to the mobile structure, and both were left loose. Their fixed contribution and the weight of the assembly are removed by the tare described in Section 2.5. Each vane weighs around 5 g. Adjusting the pitching angle to 25° displaces the center of mass of each vane by under 2 mm, resulting in a variation of around 0.2 g in the normal channel reading. The complete system is presented as a 3D model and top view of the test rig in Figure 3.
Figure 3.
(a) 3D model, (b) top view of the test rig.
An Interface SM-100N load cell (Interface Inc., Scottsdale, AZ, USA) with a capacity of 100 N, or 10,197 g, serves as the axial channel. An Interface SM-50N with a 50 N capacity, or 5099 g, is the normal channel. They are both SM Mini series S-type cells. An Interface BSC2-1 dual-channel amplifier is used to read both at an excitation of 4.2 V. The amplifier samples at 10 kHz after digitizing each channel to 16 bits. The serial output’s data rate can be adjusted to a maximum of 1000 Hz. In the present experiments, the data transmission rate was established at 10 Hz for each channel. Its zero and sensitivity drifts are both 0.001% per degree Celsius, and its accuracy class is 0.1%. Both cells deflect 0.08 mm at their rated capacity. The deflections at the highest mean readings of the test matrix are 0.006 mm on the axial cell and 0.004 mm on the normal cell. The deflection of the normal cell rotates the moving structure about the rig pivot axis by 0.003°. The natural frequency of the cell without load is 600 Hz for the SM-50N and 1000 Hz for the SM-100N. All reported forces are averaged over 2.9 s at a constant set point (Section 2.4). Therefore, the dynamic response of the cells does not enter the reported mean forces.
A UNI-T UT373 (Uni-Trend Technology, Dongguan, China) non-contact optical tachometer is used to monitor rotational speed. The rotor’s front face is covered with a strip of reflective tape, and the tachometer is directed toward it via the duct inlet.
A Testo 416 (Testo SE & Co. KGaA, Titisee-Neustadt, Germany) vane anemometer is used to measure exhaust velocity. Its accuracy is ±(0.2 m/s + 1.0% of the reading), its resolution is 0.1 m/s, and its range is 0.6 to 40 m/s. The probe was positioned about 50 mm downstream of the vectoring module on the jet axis. Instead of sampling a single spot, the vane, which is 16 mm broad, averages the flow throughout around 5% of the jet area.
2.3. Force Components and Performance Parameters
In the plane where the vanes deflect, the two load cells split the force generated by the thrust vectoring system into a component along the undeflected jet axis and a component perpendicular to it. These are referred to as the normal component FN and the axial component FA throughout, and they match the channels reported as COM3 and COM4, respectively. The native unit of the calibrated load cell output, gram-force, is used to record both. Newton equivalents are only mentioned at the beginning. The designated vane angle δ refers to the geometric angle established by the servos for the vanes, measured from the duct axis, and is deemed positive when it yields a positive normal component. Only the two vanes of the pitching set are deviated; the yawing set always remains at zero. The force configuration and the two moment arms are depicted in Figure 4.
Figure 4.
Force system of the vectoring unit. The moment balance about the rig pivot axis relates Fcell to FN through the arms acell and avane, giving Equation (1). Red arrows denote forces; double-headed arrows denote dimensions. The dashed vertical line passes through the rig pivot axis.
The two channels are measured differently. The axial component is measured directly from a load cell oriented with the jet axis. The normal force is measured by a second load cell, which is perpendicular to the jet axis and placed 70 mm (acell) away from the rig pivot axis. To calculate the normal force generated by the vanes, the following equations were used:
where dLE (81 mm) is the distance between the rig pivot axis and the leading edge of the vane. c (81.2 mm) is the chord length of the vanes. From Equation (2) avane is approximately 105 mm. For an attached flow over a thin airfoil, the center of pressure is located at the quarter-chord. Ortiz et al. [29] examined flat plates for aspect ratios from 0.4 to 9.0 at Reynolds numbers of 6 × 10⁴ to 2 × 10⁵. Between 25° and 90°, the center of pressure of these plates lies closer to the mid-chord than to the quarter-chord at most incidences. The vanes in this study have an aspect ratio of 0.35 (based on maximum width, Section 2.1). Their Reynolds number is 1.5 × 10⁵ to 2.5 × 10⁵ from 40% throttle (Table S1). The commanded angles of 5° to 25° lie at and below 25°, the lowest non-zero incidence measured by Ortiz et al. [29]. At these smaller incidences, the center of pressure of a flat plate lies closer to the quarter-chord than at the incidences measured by Ortiz et al. [29]. So, the center of pressure is taken at 0.30c between the quarter-chord and mid-chord. At all commanded angles, the same position is used. Every quantity derived from the normal channel is inversely proportional to avane. Section 2.5 quantifies the sensitivity to a fixed position, and the effect of a movement with the commanded angle is examined in Section 4.7.
FN = Fcell(acell/avane)
avane = dLE + 0.30c
The pivot axis, jet axis, and the line of action of the axial load cell are all positioned at the same height, resulting in the axial component generating no moment around the pivot and being absent from the normal channel.
Equations (3) and (4) define the effective thrust vectoring angle and the efficiency of thrust vectoring. Both concepts originate from Das et al. [12], who presented them for a Coanda-based vectoring nozzle, while Kara and Kurtuluş utilize the identical definitions [6,13]. The difference between the geometric angle at which a vectoring is set and the angle of the force it produces is standard in thrust vectoring literature, where these two terms are named as the geometric thrust vectoring angle and the thrust vector angle, respectively [4]. These two terms are defined as δ and θeff in this study. Their ratio θeff/δ, known in the literature as the deflection efficiency [4] and their difference θeff − δ are used here to state how much input turning is delivered.
where Fref is the reference thrust. In Das et al. [12], Fref represents the thrust under the single flow condition, specifically when the jet exits the nozzle without deflection. The present matrix covers eight throttle settings; hence Fref is individually defined at each setting as the axial component recorded at zero deflection. Equation (4) then expresses the normal force as a percentage of the thrust available at the same operating point. A single baseline for the entire matrix would cause η to correlate with fan thrust instead of the vanes’ turning efficiency. Fref represents the axial component rather than the resultant when deflection is zero. The two are distinguished by the residual normal force described in Section 3.3.
θeff = tan−1(FN/FA)
η = (FN/Fref) × 100
The magnitude of the resultant of the two components is defined as in Das et al. [12]:
Because the reference is the axial component alone, the normalized resultant (F/Fref) is slightly more than one at zero commanded deflection when a residual normal force is present. Since FN = F × sinθeff, Equations (3)–(5) combine into η = 100(F/Fref) × sinθeff. The thrust vectoring efficiency therefore combines the turning of the force vector with the retention of its magnitude. The decline of the axial component in relation to the identical reference is expressed as a percentage:
For a fan with fixed geometry, the thrust is expected to vary with the square of the rotational speed [31]:
where ρ = 1.204 kg/m3 is the air density at 20 °C and sea-level pressure. D = 70 mm duct exit diameter and N is the rotational speed in revolutions per minute (rpm). Both ρ and D remain constant during tests; hence, the value presented in Section 3.2 is the consolidated ratio T/N2, expressed in units of g·rpm−2. Because N is expressed in rpm rather than in revolutions per second, and because ρ and D4 are absorbed into it, this ratio is not the conventional dimensionless thrust coefficient. Only its relative variation over the throttle range is interpreted here, and no comparison is made with dimensionless values from the literature.
T = kρN2D4
Chord-based Reynolds numbers are formed in terms of the following:
where c is a chord length and V is the corresponding reference velocity. Air properties are ν = 1.51 × 10⁻⁵ m2s−1 at 20 °C and sea level pressure. There are two reference conditions that should not be interchanged. The vane Reynolds number utilizes the vane chord c = 81.2 mm as the characteristic length and the recorded exhaust velocity as the flow rate; it is a nominal value because the exhaust velocity was measured downstream of the module (Section 2.2) and not at the vanes. The rotor Reynolds number utilizes the blade chord c = 20 mm and the relative velocity observed by the blade section at 75% of the rotor radius, which is typically regarded as indicative in blade element analysis [32]:
where U is the tangential speed of the section, R = 35 mm is the rotor radius, Vax is the axial velocity through the rotor, taken as the measured exhaust velocity.
2.4. Test Matrix and Procedure
The test matrix has eight throttle settings and six ordered vane angles, totaling 48 scenarios. 0°, 5°, 10°, 15°, 20°, and 25° are vane angles. In increments of 10%, the throttle settings range from 10% to 80%. To maintain safe temperatures for the motor and speed controller over the numerous runs that the matrix necessitates, higher values were not employed.
The autopilot pulse width controls both the throttle and the vane servos. The throttle commands operate within a range of 1180 to 1740 µs in consistent 80 µs increments. The commands for the pitching pair are 1500, 1400, 1300, 1215, 1130, and 1050 µs corresponding to the six angles sequentially. The pulse width for each test was predetermined with the fan turned off. It was adjusted until a manufacturer-calibrated mechanical protractor (T-STAHL, Öncel A.Ş., Izmir, Türkiye) indicated the required angle on the vane surface. The protractor has a 1° scale increment across the 0–180° range. The center point was positioned on the vane hinge axis, with its zero aligned horizontally, parallel to the duct axis. Each angle was adjusted to within ±0.5°, half of a single scale division. The two vanes of the pitching pair were adjusted separately. Identical pulse widths were employed at each throttle position.
At each set point, the throttle and vane commands were held for 3 s before recording. So the fan was at a stable operating point when the samples were taken. This was followed by 2.9 s of recording 30 samples on each channel. The 30 samples come from one continuous recording and are not independent repetitions. No set point was repeated. The whole matrix was recorded in one run of 303 s, without a pause for cooling. Successive set points were approximately 6.4 s apart. Before the run, the control program was checked for about 30 min at low throttle. The battery voltage was 22.2 V at the start of the run. The battery voltage and current were not recorded during the run. The outer loop was made up of the vane angle, and the inner loop was made up of the throttle.
2.5. Data Reduction and Uncertainty
Each of the 48 test points is presented as the average of the 30 samples collected at that point, with the standard deviation of those samples reported as the scatter. Scatter values are given alongside the data in Section 3.3 and Table S3. The relative scatter is reported only at zero deflection, since at greater deflections the axial mean approaches zero and the ratio increases correspondingly.
At 70% and 80% throttle, the exhaust velocity exceeds the 40 m/s upper range of the anemometer. The two absent velocities are estimated from a regression of the recorded exhaust velocities against the measured rotational speeds. The fit uses the six set points at which both quantities were measured, so no estimated value enters the regression. It is constrained to pass through the origin, since zero rotational speed must correspond to zero exhaust velocity. The fitted relation and the point-by-point ratio v/N are reported in Section 3.2.
The fits of thrust against the square of the rotational speed and against the square of the exhaust velocity are constrained in the same way, since zero speed must correspond to zero thrust. For all constrained fits, the coefficient of determination is referenced to the mean of the data, so that it is comparable with the R2 of an unconstrained fit.
Each load cell was calibrated with a set of precision weights (1 mg to 200 g; PHYWE Systeme GmbH, Göttingen, Germany) prior to the tests. The weights were applied directly on the cell in four steps: 50, 150, 350 and 550 g. A straight line through the tared zero was fitted to the four amplifier readings. The slope serves as the conversion coefficient from amplifier counts to gram-force. The axial channel has a factor of 1.968 g per count, and the normal channel has a factor of 0.512 g per count. The output of the amplifier changes in single-count increments. Thus, these numbers denote the smallest force changes that the two channels can record. On the normal channel, a step of 0.512 g at the load cell corresponds to 0.34 g of vane normal force after Equation (1). Both increments are less than the instrument thresholds established in the following paragraph, ±5.1 g on the axial channel and ±1.7 g on the vane normal force. The normal load cell has the highest reading of 238.2 g, which is still within the calibrated range. The axial value is over 550 g at eight of the 48 test locations, as high as 804.0 g at 80% throttle and zero deflection. The conversion factor is applied at these points above the highest calibration load. The linearity of the cell is specified over its entire capacity of 10,197 g (Section 2.2) and 804.0 g is 7.9% of this capacity. The weights were added to the cells and not through the rig. Hence the calibration does not verify the moment arms of Equation (1). The cells were tared before starting the run with the fan off and the vanes at zero deflection. They were not tared again in the run.
The load cells are characterized by a non-linearity of ±0.03% and a hysteresis of ±0.02% of the full scale. These yield ±5.1 g on the axial channel and ±1.7 g on the vane normal force after Equation (1). Because they are referred to full scale, they matter most where the readings are smallest. The vane angle is set to within ±0.5° (Section 2.4). This term enters δ but not θeff, which is derived from the forces alone. The uncertainty of each derived quantity is given using the first-order propagation. Each input term is multiplied by the partial derivative of the quantity with respect to that input, and the products are combined in quadrature. θeff is a function of FN and FA. θeff/δ depends on θeff and δ. η depends on FN and Fref, which is measured by the axial channel. The instrument terms are specification limits. Hence, the resulting bands are limits rather than standard uncertainties. These bands form the systematic part of the uncertainty. The standard deviation of the 30 samples forms the random part at each set point (Table S3). It also contains the fluctuations of the rotational speed within a set point. The 30 samples are not independent (Section 2.4). Hence, the standard deviation itself is used as the random part, rather than the standard error of the mean. For the difference in two commanded angles at the same throttle setting, e.g., 20° and 25°, the bands of the two readings are combined in quadrature. The non-linearity error is similar at the adjacent loads and partially cancels in such a difference. The hysteresis error does not cancel, because the two readings have separate load histories. Fref is common to all commanded angles for a given throttle setting. Thus, only the normal channel term contributes to the difference in η between two angles. At a commanded angle of 20°, the band on θeff is ±5.7° at 20% throttle and ±0.8° at 40%. Therefore, the angle-derived metrics of Section 3.4 and Section 3.5 are only applicable to throttle levels of 40% or greater. Table S6 lists each contribution and the combined band at every test point from 40% throttle.
The chordwise position of the center of pressure is an additional source of uncertainty in the normal channel. It was not measured, and it is located between the quarter chord and the mid-chord (Section 2.3). All quantities obtained from the normal channel exhibit an inverse relationship with the moment arm avane (Equations (1), (2) and (4)). Assigning the vane force to the quarter chord increases all normal forces by 3.7%, whereas assigning it to the mid-chord decreases them by 13.7%. A fixed position scales FN and η by the same factor at every test point. Hence, it changes their magnitude but not the angle at which η peaks. The location of the center of pressure is one unknown and is the same for all test points. If this location were merged in quadrature with the instrument bands, the band on the difference between two angles would also be widened. However, a common factor scales the difference in FN and η between two angles but cannot reverse its sign. The interval between the quarter-chord and the mid-chord is also not symmetric around 0.30c. Thus, the center of pressure term is given as a separate interval next to the instrument bands in Table S6. For example, the instruments indicate that θeff at 20° and 80% throttle is 16.0 ± 0.2°. The center of pressure interval for this value was +0.6°/−2.1°. The axial component is the major component of the resultant force. Thus, the normalized resultant changes by less than 0.01 at each test point from 40% throttle. The center of pressure is assumed not to move with the commanded angle. No correction has been applied for the position of the center of pressure. The effect of a movement with the commanded angle is examined in Section 4.7.
No bias has been removed from the recorded forces at any point in this study. Two systematic features are present in the data and are documented as measured. The first is a residual normal force at zero commanded deflection, which increases with throttle. The second is an offset on the axial channel that is dependent on deflection and increases with the specified vane angle. Both are characterized in Section 3.3 and discussed in Section 4.4 and Section 4.5.
For comparison, the derived quantities are also reported with the zero-deflection residual subtracted from the normal component at the same throttle setting (Section 3.5).
2.6. Flow Visualization
The deflected flow was visualized using smoke at a consistent throttle position of 40% with six vane angles, which is described in Section 2.4. Only the pitching vanes were deflected, and no force was measured throughout these runs. This configuration is the minimum level at which the angle-derived metrics are documented. The angular velocity at that setting is 17,844 revolutions per minute, the exhaust speed is 28.5 m per second, and the vane Reynolds number is 1.5 × 10⁵ (Table S1).
Smoke was produced by an ATE-AEROTECH (Aerodynamic Test Equipment Ltd, Heathfield, UK) wind tunnel smoke generator. A peristaltic pump delivers medicinal-quality white oil to the probe tip. A low-voltage heating coil at the end vaporizes the oil, achieving a vaporizer dissipation of as much as 90 W. The probe was positioned along the duct axis roughly 30 mm in advance of the rotor face. The smoke consequently traverses the rotor and the array of vanes before exiting the duct.
The jet was captured with a camera with a 24 mm equivalent focal length and an aperture of f/1.78, at a resolution of 1920 × 1080 and a frame rate of 30 frames per second. The camera was positioned approximately 300 mm from the jet axis, with its optical axis orthogonal to the deflection plane. The light source was a single Sofirn SP10 Pro LED flashlight (Shenzhen City Jinba Technology Co., Ltd., Shenzhen, China), equipped with a Samsung LH351D (Samsung Electronics, Suwon, Republic of Korea) emitter operating at 5000 K. The chamber was dark and sealed, lacking any alternative means of air circulation.
A matte black panel was positioned behind the jet to serve as an angular scale. Radial lines are marked on it from 0° to 90° in increments of 10°, with the vertex of the scale aligning with the vane pivot axis. The camera was directed toward that vertex. Radial orientations are thereby maintained in the image regardless of the separation between the jet and the panel.
A total of thirty-two frames were gathered for each vane angle. Frames were extracted from the recording with FFmpeg (version 8.0.1) [33]. The frames of each vane angle were then combined into a single image with ImageMagick (version 7.1.1-43) [34] using the evaluate-sequence median operator. This replaces the value of each pixel with the median of the values it takes across the sequence. The mean, minimum, maximum, and bitwise-and combinations were also evaluated. The median provided the most distinct smoke trace boundary and was chosen, as it suppresses transient filaments while preserving the persistent part of the smoke trace.
3. Results
3.1. Baseline Performance at Zero Deflection of the Vanes
All four vanes are placed at zero-degree deflection angles. The axial thrust increased non-linearly with throttle from 59.9 ± 1.7 g (0.59 N) at 10% throttle to 804.0 ± 5.4 g (7.89 N) at 80% throttle (Figure 5a). 30 samples were acquired at each set point to calculate the mean and standard deviation. A complete data set of baseline performance values is listed in Table S1 in the Supplementary Materials. The largest relative deviation occurred at the lowest throttle input, where the absolute force is smallest. At 20% throttle and above, the standard deviation stayed below 1.2% of the mean, indicating good short-term stability of the force signal at each set point.
Figure 5.
Baseline performance at zero deflection of vanes. (a) throttle vs. axial thrust, (b) throttle vs. rotational speed (rpm), (c) throttle vs. exhaust velocity (m/s).
The rotational speed increased from 8406 rpm to 28,940 rpm as the throttle increased from 10% to 80%. The relation between throttle and rotational speed was almost linear, with R2 = 0.9990, as shown in Figure 5b. Corresponding PWM inputs are given in Table S1. When the throttle increased from 10% to 80%, the rotational speed advanced by a factor of 3.44. In the meantime, thrust increased by a factor of 13.4. However, a purely quadratic relationship with rotational speed would have resulted in a factor of 11.9, indicating that the ratio T/N2 varies across the examined range. This is detailed in Section 3.2.
The exhaust velocity recorded on the jet axis approximately 50 mm downstream of the vectoring module rose from 13.7 m/s to 38.0 m/s when the throttle increased from 10% to 60%, as shown in Figure 5c. At 70% and 80%, the flow surpassed the anemometer’s upper limit of 40 m/s, rendering direct readings invalid; the values represented as open triangles, 42.2 m/s and 46.2 m/s, were extrapolated from the regression of the recorded velocities against the measured rotational speeds detailed in Section 2.5 and are consistently labeled as such (Table S1). The consistency of the two speed measurements, which supports the use of rotational speed as a predictor for the two unmeasured points, is examined in Section 3.2.
The vane Reynolds number uses the 81.2 mm vane chord as the reference length and the exhaust velocity as the local flow speed. Air properties are those at sea level and 20 °C, with ν = 1.51 × 10⁻⁵ m2/s. The value varies from 7.4 × 10⁴ at 10% throttle to 2.5 × 10⁵ at 80%. The vanes therefore operate at Reynolds numbers on the order of 105 throughout the matrix. The rotor Reynolds number, based on the blade relative velocity at 75% of the rotor radius, ranges from 3.6 × 10⁴ to 1.22 × 10⁵ over the same throttle range. The specific values of both at each set point are given in Table S1.
3.2. Scaling of the Thrust with Rotational Speed and Exhaust Velocity
Momentum theory indicates that the thrust of a fixed geometry fan varies with the square of the rotational speed and with the square of the exhaust velocity. Both relations were tested against zero-angle data as shown in Figure 6. The raw data that is used to plot this figure is given in Table S2. A linear fit of thrust against rotational speed, which gives T = 9.413 × 10⁻⁷·N2 with R2 = 0.9968 using eight measurements, is shown in Figure 6a. The fit between thrust and exhaust velocity gives T = 0.3566·v2 with R2 = 0.9961 by using six measured velocity points. Because zero exhaust velocity and zero rotational speed must also equal zero thrust, the fits are restricted to pass through the origin. The high R2 values show consistency with the expected quadratic scaling. They do not validate the absolute force, because an error in the axial calibration factor would scale every thrust value equally and leave R2 unchanged.
Figure 6.
Thrust at zero deflection against (a) the square of the rotational speed and (b) the square of the exhaust velocity.
The rotational speed and exhaust speed measurements are mutually consistent. A linear regression of the six measured exhaust velocities against the corresponding measured rotational speed gives v = 1.5978 × 10⁻³·N with R2 = 0.9988, constrained to pass through the origin. The point-by-point ratio v/N stays between 1.564 × 10⁻³ and 1.630 × 10⁻³ m·s−1 per rpm. It deviates from its mean by no more than 2.3%, with no systematic drift (Table S2). The tachometer and the anemometer depend on different physical mechanisms and agree to within that spread, which is itself the order of the anemometer accuracy quoted in Section 2.2.
The measured thrust can also be compared to the momentum flux of the exhaust jet. Momentum theory gives the thrust of a jet as T = ρAv2, if the jet leaves the duct with a uniform velocity v over its exit area A. In the present EDF, the jet leaves through the exit area between the 30 mm hub and the 70 mm duct wall. Therefore, A is 3142 mm2. With the air density of Section 2.3, the momentum flux coefficient ρA is 0.386 g·s2·m−2 in gram-force units. The fit of thrust against the square of the exhaust velocity (Figure 6b) gives T = 0.3566v2. Therefore, the fitted coefficient (0.3566 g·s2·m−2), is 92% of the momentum flux coefficient. The measured thrust-to-momentum flux ratio, T/(ρAv2), was between 0.80 and 0.95 at the six throttle levels with measured exhaust velocity. The exhaust velocity is a single reading on the jet axis, 50 mm downstream of the vectoring module (Section 2.2). The velocity profile throughout the exit area was not measured. Thus, the comparison of the momentum flux does not calibrate the axial channel. The comparison indicates that the observed thrust is consistent in magnitude with the jet momentum flux.
The variations in test points from the fit are not randomly distributed but increase with throttle. The calculated coefficients are listed in Table 1. The ratio T/N2 starts at 8.48 × 10⁻⁷ g·rpm−2 at 10% throttle, takes its lowest value of 8.05 × 10⁻⁷ g·rpm−2 at 20% throttle, and then increases to 9.60 × 10⁻⁷ g·rpm−2 at 80% throttle. The ratio is therefore 13% higher at the top of the range than at 10% throttle. A similar increase of 13% was observed in the ratio T/v2 from 10% to 60% throttle. The behavior is not consistent with a drift in either speed instrument because the exhaust velocity and rotational speed agree to within ±2.3% and exhibit no relative trend. Instead, the thrust grows slightly faster than the quadratic scaling, which is consistent with the departure already mentioned in Section 3.1. A possible source of this variation is discussed in Section 4.1.
Table 1.
Axial thrust normalized by the square of the rotational speed and by the square of the exhaust velocity at each throttle setting, at zero vane deflection.
The T/v2 values at 70% and 80% throttle (asterisks in Table 1) use exhaust velocities computed from the rotational speed. Hence, they are not independent of T/N2 and are excluded from the comparison above. The rotational speeds, exhaust velocities and their squares used in these fits are listed in Table S2.
3.3. Force Components Under Different Vane Deflections
Increasing vane angles reduces the axial component and generates a normal component at each throttle setting, as shown in Figure 7. Raw data to produce this figure is given in Table S3. Each value is the average of the 30 samples collected at that specific set point; the standard deviation remains below 5.8 g on the axial channel and 1.3 g on the normal channel throughout the matrix. At 80% throttle and zero angle, vane axial force was measured as 804 g and reduced monotonically to 458.5 g at 25° and corresponding reductions from 4.7% to 43% relative to the undeflected case are shown in Table 2. The identical sequence persists across all throttle settings from 20% and above: the axial component diminishes consistently with the increased angle, and the drop accelerates more swiftly than the cosine of the deflection angle would imply.
Figure 7.
Force components under different vane deflections: (a) axial thrust components, (b) normal force components.
Table 2.
Axial and normal force components at 80% throttle as a function of commanded vane angle.
The normal component rises with both throttle and commanded angle. However, this increase is not constant. As indicated in Table 2, at 80% throttle it rises from 36.2 g (0.36 N) at zero deflection to 158.8 g (1.56 N) at 20° and then reduces to 154.9 g (1.52 N) at 25°. The normal force at 25° is less than the normal force at 20° for every throttle setting. From 30% throttle, the decrease in FN from 20° to 25° is 2.0% to 23.5%. The normal load cell reading before Equation (1) does not depend on the center of pressure. This reading decreases by the same percentages (Table S3) from 20° to 25°.
The normal axis channel does not read exactly zero when no deflection is commanded. The residual force changes sign across the throttle range, running −0.2, −2.1, −3.7 and 0.0 g up to 40% throttle and then rising to +4.3 g at 50% and +36.2 g (0.36 N) at 80%, which is 4.5% of the axial thrust at the same point (Table 3). Consequently, it increases with throttle even though the commanded angle remains zero at each of these points. The source is analyzed in Section 4.4.
Table 3.
Residual normal force at zero commanded vane deflection.
The axial channel yields measurements that cannot be interpreted as thrust: at 10% throttle, the recorded axial component is negative for all deflections from 10° and above, attaining −25.5 g at 25°, while at 20% throttle, the measurement at 25° is −3.9 g. These values are a measurement artefact rather than a property of the flow, and the associated offset grows with commanded angle, so the axial reductions quoted above and those listed in Table S4 should be read as upper bounds. The corresponding lower bounds are listed in Table S7 (Section 4.5). The origin of the offset and potential solutions is analyzed in Section 4.5.
3.4. Effective Vectoring Angle and Thrust Vectoring Efficiency
The effective vectoring angle, defined from the measured force components as in Equation (3) (Section 2.3), is plotted against the commanded vane angle in Figure 8 for all throttle settings at or above 40%. Throttle points below 40% are excluded from this section and the next. The full-scale uncertainty of the normal channel corresponds to an angle error of several degrees at those settings, as quantified in Section 2.5.
Figure 8.
Effective vectoring angle vs. commanded vane angle.
Two characteristics are prominent. First, the jet is turned through less than the commanded angle at every condition except the smallest, and the shortfall widens as the command increases. At 80% throttle it read 5.0° at a commanded 5°, 8.7° at 10°, 12.3° at 15°, 16.0° at 20° and 18.7° at 25°. Therefore, the ratio θeff/δ falls from 1.005 to 0.747 as the commanded angle increases. The ratio ranges between 0.799 and 0.870 at 15° and 20° and between 0.747 and 0.804 at 25° for all five throttle levels. As a result, at 15° and 20°, around a fifth of the required deflection is not given, and at 25°, a quarter. Second, the relation between commanded and effective angle is almost independent of throttle. At a given non-zero commanded angle, the difference θeff − δ varies by no more than 1.5 ° across the five settings. This holds for the measured normal force. With the zero-deflection residual subtracted, the spread rises to 4.8° (Section 3.5). At zero commanded deflection, the corresponding variation is larger, at 2.6°, but this reflects the residual normal force discussed in Section 3.3 rather than the vane deflection.
The increment in effective angle in every 5°, which is calculated as successive differences in values in Table S4, is not constant. At 80% throttle, the difference between the effective angles at 0° and 5° is 2.4°, then 3.7°, 3.6°, 3.7°, and 2.7°. The same pattern was observed at every throttle value. The last increment is the smallest of the four that follow the first. Therefore, there is noticeably less extra jet deflection when the vanes are commanded beyond 20°.
The thrust vectoring efficiency, which is the normal force expressed as a percentage of the reference thrust (Section 2.3), exhibits the same behavior. The efficiency at each throttle and commanded angle is listed in Table 4. At 80% throttle, efficiency increases from 8.4% at 5° to 13.5% at 10°, 17.4% at 15°, and 19.7% at 20°, and then decreases to 19.3% at 25°. At all five throttle settings, the maximum efficiency was achieved at 20°, with the reduction from 20° to 25° ranging from 0.4 to 2.0 percentage points. The highest vectoring efficiency was achieved at 70% throttle, which is 20.9%. The residual normal force described in Section 3.3 is represented by the non-zero numbers at zero commanded deflection; these values should not be interpreted as vectoring performance.
Table 4.
Thrust vectoring efficiency at each throttle and commanded vane angle.
3.5. Resultant Thrust Loss
The two force components do not simply rotate with the vanes. Their resultant also falls as the commanded angle increases. The normalized resultant force, which is described in Section 2.3, is plotted against vane angle in Figure 9. The data for 80% throttle is given in Table 5. Thrust loss values for all throttle points are given in Table S4. The normalized resultant at 80% throttle falls from 0.957 at 5° to 0.894 at 10°, 0.818 at 15°, 0.718 at 20°, and 0.602 at 25°. Therefore, more than a quarter of the available force is lost at 20° and almost 40% at 25°.
Figure 9.
Normalized resultant force vs. commanded vane angle.
Table 5.
Vectoring performance summary at 80% throttle.
The loss is not increasing at a constant rate. When operating at 80% throttle, the increase from 20° to 25° is over and costs more than two and a half times the step from 0° to 5°. From 60% throttle and upwards, the two steps between 15° and 25° each cost more than any individual step below 15° (Table S4). At 40% and 50% throttle, this ordering does not hold, because the first step from 0° to 5° is inflated there by the deflection-dependent axial offset described in Section 3.3. The combined analysis of the force retention shown here and the effective vectoring angle from Section 3.4 indicates that the maximum force loss and the minimal deflection gain occur within the identical commanded angle range.
The normalized resultant force increases with throttle. It increases from 0.565 at 40% throttle to 0.683 at 60% and 0.718 at 80% at 20° of directed deflection, and from 0.456 to 0.560 and 0.602 at 25°. The throttle trend is unchanged at all commanded angles except between 70% and 80%, where the value at 70% is slightly greater at 10°, 15°, 20°, and 25°. The difference between the two settings is at most 0.024.
Because the resultant contains the residual normal force given in Section 3.3, which adds in quadrature to the axial thrust employed as the reference, the normalized resultant at zero commanded deflection is 1.001 rather than precisely unity.
Table 6 compares the derived quantities at 20° and 25° before and after correction for the residual normal force. In the corrected scenario, the zero-deflection residual given in Table 3 is subtracted from the normal component at the same throttle setting. The corrected values for test points at 40% throttle and above are listed in Table S5. The correction has an insignificant impact on the normalized resulting force, altering it by no more than 0.013. The impact of the correction on the effective vectoring angle rises with throttle, since the residual itself amplifies with throttle (Table 3). At 80% throttle and a commanded angle of 20°, the effective vectoring angle decreases from 16.0° to 12.5° after correction. The thrust vectoring efficiency reaches its peak at 20° across all throttle configurations, with the corrected maximum being 18.2% at 70% throttle. However, the corrected effective vectoring angle reduces as throttle rises. As a result, the difference θeff − δ fluctuates by as much as 4.8° among the five throttle configurations, in contrast to 1.5° for the observed values.
Table 6.
Effective vectoring angle, thrust vectoring efficiency and normalized resultant force at 20° and 25°, without and with subtraction of the zero-deflection residual normal force.
3.6. Smoke Visualization of the Deflected Jet
The smoke images obtained at 40% throttle are shown in Figure 10, one panel for each commanded vane angle. All six panels are the median combined images described in Section 2.6. The angular scale of the background panel is visible in each panel, with its 0°, 10°, 20°, and 30° lines crossing the field of view. The observations below refer to the initial 100 mm downstream of the vane trailing edges.
Figure 10.
Median combined smoke images of the deflected jet at 40% throttle for commanded vane angles of (a) 0°, (b) 5°, (c) 10°, (d) 15°, (e) 20° and (f) 25°. The radial lines are the angular scale described in Section 2.6.
At a commanded deflection of zero degrees, the trace exits from the duct along the 0° line and maintains a linear trajectory over the field of vision (Figure 10a). Its two edges are nearly symmetrical with respect to that line. This serves as the benchmark condition for interpreting the deflected situations.
As the commanded angle rises, the two boundaries of the trace do not move together. The lower boundary remains at or just below 0° at every deflection angle. On the other hand, the upper boundary advances progressively. It lies between the 10° and 20° lines at 5°, reaches the 20° line at 10° and 15°, and passes beyond it towards the 30° line at 20° and 25°. The trace thus expands instead of rotating as a unified entity, and the expansion increases with the commanded angle.
The core of the trace exhibits distinct behavior compared to its upper boundary. At 5° it lies between the 0° and 10° lines. From 10° onwards, it lies between the 10° and 20° lines, closer to the 10° line, and it does not advance further as the command is increased to 20° and 25°. Consequently, the center of the visible trace does not correspond to the effective vectoring angle outlined in Section 3.4, which continues to rise across the same command range.
At 25°, the trace loses the continuous boundary observed at smaller angles (Figure 10f). Separated pockets of smoke appear downstream of the vane trailing edges and the upper boundary becomes ragged. The recording from which all six panels were produced is provided as Video S1 in the Supplementary Materials.
4. Discussion
4.1. The Metrics and Their Reference Frame
The increase in T/N2 presented in Section 3.2 cannot be explained by any drift in either of the speed instruments (Section 3.2). One possible source of this increase is a Reynolds number effect. The rotor Reynolds number, taken from the blade relative velocity at 75% of the radius, runs from 3.6 × 10⁴ to 1.22 × 10⁵ across the matrix (Section 3.1). Airfoil sections working in that range generally perform better as the Reynolds number rises. Brandt and Selig [35] measure the resulting behavior on open propellers at low Reynolds numbers, where the thrust coefficient rises with rotational speed, and note that it is clearest in static thrust. The rig here is static as well, although their propellers are 9 to 11 inches in diameter and are not ducted.
The vane Reynolds number increases within the identical throttle range, from 7.4 × 10⁴ to 2.5 × 10⁵ (Section 3.1), while the thrust is quantified with the vanes installed. A decrease in the vane drag coefficient would enhance the recorded thrust similarly to an enhancement in blade efficiency. Rotor and vane Reynolds numbers rise together. Hence, these measurements do not separate the rotor contribution from the vane contribution. Therefore, the present data do not isolate a Reynolds number effect on the rotor or on the vanes.
Thrust, referred to as throttle percentage, belongs to one combination of fan, controller, and battery. The rotational speed reached at a given percentage depends on the controller and on the state of charge, so the same setting is not the same operating point on another rig. Rotational speed and exhaust velocity carry no such dependence, which is why the regressions of Section 3.2 are built on them rather than on throttle.
At the smallest commanded angles, the differences in deflection efficiency are smaller than the measurement uncertainty. Table S4 shows the ratio rising before it falls at 40%, 50% and 60% throttle, with maxima at 15°, 20° and 10° respectively, and the rises are 0.02 to 0.09. The combined instrument band of the ratio is ±0.10 to ±0.12 at 5° and ±0.02 to ±0.04 at 25° (Table S6). Therefore, those rises are not read as a property of the vanes. The fall from 20° to 25° is 0.04 to 0.11. It exceeds its band at 40%, 60%, 70% and 80% throttle by a factor of 1.5 to 1.9. At 50% throttle, the fall is 0.042 against ±0.046 and is not resolved by the ratio. At that setting, the deterioration beyond 20° is shown by the decrease in normal force itself, from 6.8 g to ±2.4 g.
4.2. The Best Setting Within the Tested Range
The best setting tested is identified by the thrust vectoring efficiency η of Equation (4). From 40% throttle, η is largest at 20° at every throttle setting, with and without the residual normal force subtracted (Table 4 and Table S5). At these throttle settings θeff still increases from 20° to 25°, by 1.6° to 3.2°, while F/Fref decreases by 0.11 to 0.15. Therefore, 25° deflects the force vector more than 20° but produces a lower normal force and a smaller resultant. The declines in η, θeff/δ and F/Fref between 20° and 25° are hereafter called the deterioration beyond 20°. These metrics are derived from the same two load cell signals. From 20° to 25°, FN decreases by 2.8 to 6.8 g and FA by 16 to 96 g at every throttle setting. Hence, the metrics restate these two decreases and do not provide independent evidence of the deterioration beyond 20°. Section 4.7 examines the sensitivity of the decrease in FN to the center of pressure. Angles were commanded in 5° steps. Therefore, 20° is not a precisely determined optimum, and the optimum of η lies between 15° and 25°.
The vanes are short in span and long in chord. Their aspect ratio is 0.35 (24.02/1624 mm2, on the maximum span), and the chord exceeds the duct exit diameter (Section 2.1). Traub [30] investigated rectangular flat plates with aspect ratios between 0.5 and 3. In that study, the vortices on the two side edges provide most of the lift at an aspect ratio of 0.5. The downwash between the two vortices suppresses separation and raises the stall angle, and stall begins when the vortices detach. Traub also finds little sensitivity to the Reynolds number over three orders of magnitude. The present vanes lie below this aspect ratio range, are tapered and operate inside a housing rather than in a uniform stream. Hence, these vanes are expected to stall at a larger angle than a vane of larger aspect ratio, but the present measurements do not establish this. The small decrease in η from 20° to 25°, 0.4 to 2.0 percentage points at the five highest throttle settings (Table 4), is consistent with this expectation.
4.3. Magnitude of the Axial Losses
The axial reductions in Section 3.3 are upper bounds, because an offset is present from 5° onward and cannot be separated from vane drag at larger angles. Its origin is discussed in Section 4.5, where it is demonstrated that, unlike thrust, it does not increase with throttle. As a result, its relative weight is lowest at the highest settings, and only the 70% and 80% throttle may be compared to published loss percentages. All percentages are referred to zero deflection with the vanes fitted, so they also exclude the installation loss of the module itself, and Section 4.7 returns to this.
The closest similar measurement, a two-vane module on an electric ducted fan with a convergent exit nozzle, is given by Muehlebach and D’Andrea [21]. Their vanes are actuated over ±18° and each controls one axis. At full deflection of a single vane, they report 3 N of lateral force against 26.4 N of reference thrust, with a 2 N reduction in the resultant. Their resultant loss is 7.6%, and their delivered angle is about 7.1°. That is their maximum, and it is smaller than the angle delivered at our 10° command (Table S4). Their loss is of the same order as ours at that command, 8% to 11% at 70% and 80% throttle, but the two points are not equivalent. Theirs is a single vane at its limit and ours a pair well inside the range, and our figures still contain the offset of Section 3.3. The two sets of vanes are close in relative size and in Reynolds number (Section 2.1, Table S1), so the two measurements are at least not from different flow regimes. One operating point from one study cannot settle whether the present losses are typical.
4.4. The Residual Normal Force
The normal channel does not read zero when no deflection is commanded. Section 3.3 reports small negative readings below 40% throttle, a passage through zero near 40%, and 36.2 g at 80%, which is 4.5% of the axial thrust there. The commanded angle is zero at all eight points. The largest negative reading is −3.7 g, about twice the ±1.7 g uncertainty of the normal channel (Section 2.5). The record therefore changes sign, running −0.2, −2.1, −3.7, 0.0 and then upward to +4.3 g, and any proposed mechanism has to account for the sign change as well as for the growth above 40%.
That growth is much steeper than the dynamic pressure of the jet. The load cells were tared with the fan stopped (Section 2.5). Hence, the residual is zero at zero dynamic pressure, and the fit against dynamic pressure was constrained through the origin. It gives R2 = 0.65. Fitting against the square of dynamic pressure gives R2 = 0.91 and leaving the exponent free settles it at 3.4. The incidence of a vane is the angle between its chord and the local flow, and it is not zero at these points even though the commanded angle is. Any mechanism that holds the vanes at a fixed effective incidence predicts a force proportional to dynamic pressure alone. Two candidates hold the vanes at a fixed incidence in this way: a build tolerance in the servo linkage and residual swirl leaving the rotor. The measured exponent shows that neither can produce that growth on its own.
Either candidate can instead supply the starting incidence for a mechanism that grows with load. A vane held at a small incidence carries a side load proportional to the dynamic pressure, and that load can bend it. The bending can add to the incidence of the sections behind the hinge, so the force rises faster than the dynamic pressure alone. Elastic deflection of the PLA vanes under aerodynamic load is therefore consistent with the measured exponent, while a rigid vane at the same starting angle is not. The vane deflection was not measured, so this mechanism remains a hypothesis.
Creep of the vane material is a separate candidate and is not supported. Each throttle sweep occupies less than a minute, the jet is at ambient temperature, and PLA stays far below its glass transition. Throttle and elapsed time nonetheless rise together within a sweep, so this record alone does not separate them. Creep of the load cells themselves is a different question, and Section 4.5 takes it up.
The residual normal force is not subtracted from the forces presented in this research. The residual changes sign between 30% and 80% throttle, from −3.7 g to +36.2 g, and both values exceed the ±1.7 g limit of the normal channel. A linear coupling from the axial channel cannot produce this change in sign, because the axial force is positive at every throttle setting. Hence, the residual is treated as a force acting on the assembly during operation. Das et al. [12] likewise document a thrust vector angle of 3.43° under their undeflected reference condition. The subtraction of the residual assumes that it is included unaltered in the normal force at each specified angle. The elastic bending mechanism proposed above does not satisfy this assumption, since the vane load varies with the commanded angle. Thus, the measured and corrected values in Table 6 indicate different quantities. The measured values correspond to the total side force delivered to the vehicle. The corrected values, on the other hand, correspond to the increment produced by the commanded deflection. However, the throttle independence of θeff − δ reported in Section 3.4 is valid only for the measured values.
4.5. Deflection Dependent Axial Offset
At 5° of commanded deflection, the axial force falls by more than the rotation of the force vector accounts for. The unexplained part is 33 to 57 g at every throttle setting, while the jet dynamic pressure changes by a factor of eleven across those settings. A force generated by the flow would scale with that pressure. This offset does not scale with that pressure. Hence, an aerodynamic source is unlikely.
Creep and thermal drift of the load cells are the remaining candidates. The test order invites them, because the angle is the outer loop and elapsed time therefore increases with commanded angle. Both are excluded by size. The smallest unexplained offset, 32.6 g, is thirteen times the ±2.55 g creep specification of the SM-100N cell over twenty minutes. Matching it by thermal drift would need a 118 °C change in cell temperature, against a rated zero shift of 0.275 g/°C.
The servos and linkages are part of the measured assembly as described in Section 2.2. Therefore, a preload between them is an internal force and cannot change the load cell readings. After the force measurement, the vane angle was swept from 0° to 25° on the same rig with the fan off. The load cell measurement never deviated from zero. This check was monitored on the acquisition display and not recorded. The force records have an offset of 33–80 g. Thus, the offset takes place only when the fan works, and a static mechanical effect of the vane motion is excluded as the source of the offset. The axial values do not reveal any regular drift in the 2.9 s acquisition window.
The offset appears at the initial change in vane angle and increases with each following adjustment, reaching approximately 80 g at 25° at 10% throttle. In the testing sequence, any change in the vane angle corresponds with a decrease in throttle from 80% to 10%. Consequently, the vane angle, the rig’s load history, and the passage of time are interdependent and cannot be separated. The unexplained portion at 5° is also smaller at 70% and 80% throttle (33 to 35 g) than at 40% to 60% (49 to 54 g). This divergence is not explained by any of the candidates discussed above. Reordering the matrix in a random sequence, with the load cells zeroed at each vane angle, is necessary to identify the source.
The source of the offset remains unidentified. Nonetheless, its impact on the outcomes can be limited. At 10% throttle, the aerodynamic forces exerted on the vanes are minimal. Hence, the reduction in the axial component by more than the factor cos δ is employed as an estimate of the offset at this throttle setting. This estimate increases from 57 g at 5° to 80 g at 25°. This estimate is added to the measured axial component at each throttle setting. The corrected numbers provide a lower limit of the axial loss while the measured values provide an upper limit. At 5° the unexplained component of the axial fall is 33 to 54 g from 40% throttle. Thus, the estimate is greater than the 5° offset at all throttle positions. At larger angles the offset cannot be separated from the vane drag. Therefore, true values are expected, rather than shown, to lie between the two bounds. The lower bound is weak for small angles. The maximum of the normalized resultant adjusted is 0.036 above unity at 5°. The modified values at each test point from 40% throttle are presented in Table S7.
At 20° the normalized resultant force varies from 0.565 to 0.796 at 40% throttle and 0.718 to 0.797 at 80%. The vectoring angle is between 12.1° and 17.2° at 40% throttle and between 14.4° and 16.0° at 80% throttle. The variation of θeff − δ across the five throttle settings at 20° rises from 1.2° to 2.4° with the adjusted values.
The three indicators of the deterioration beyond 20° are retained when the offset estimate is added to the axial component. The thrust vectoring efficiency at deflected angles is only dependent on the normal channel. Thus, the value and its peak at 20° are independent of the offset. The fall in θeff/δ from 20° to 25° is 0.076 to 0.145 with the adjusted values, against 0.042 to 0.109 with the measured values. At 40% throttle, the adjusted effective vectoring angle at 25° is smaller than at 20°. The normalized resultant falls from 20° to 25° at both bounds, by 0.061 to 0.116 with the adjusted values. Hence, the deterioration beyond 20° is present at both bounds.
4.6. Smoke Images as Qualitative Evidence
Only the pitching pair is deflected, so the other two vanes leave their share of the exhaust untouched. The visible trace is a superposition of turned and unturned flow, and it widens as the command grows instead of rotating as a body. Section 3.6 reports that pattern: the lower boundary stays near the 0° line while the upper boundary advances. The center of such a trace is not the direction of the thrust vector. Its departure from the effective vectoring angle of Section 3.4 is therefore expected, and it is not disagreement between two measurements of the same quantity.
Banazadeh et al. [14] report the same kind of gap from a different technique. Their thermal images of a deflected jet agreed in trend with their load cells. They note that a difference may still exist, because the image shows only the high-temperature region and leaves out the colder part of the mixture, which is deflected as well. An imaged boundary and a measured force need not describe the same portion of the momentum.
The smoke images are the only record of the deflected jet that is independent of the load cells. As described above, the images show the visible smoke trace, not the direction of the force vector. Therefore, the images are used as qualitative evidence and not as a validation of the force-derived angle. The trace expands with increasing commanded angle, and its boundary breaks up at 25° (Section 3.6). At 25° detached pockets of smoke are observed downstream of the trailing edges of the vanes. The images were recorded in a separate run at 40% throttle, without force measurement. The trace was read against radial lines drawn at 10° intervals on the background panel (Section 2.6). Thus, the angular resolution of the images is less than the 5° increment of the commanded angle. The images support the deterioration beyond 20° described in Section 4.2 but do not measure it.
4.7. Limitations
No thrust baseline was measured with the vanes removed. Every loss reported here refers to zero deflection with the vanes fitted and the housing fitted, so the installation loss of the module itself is not contained in any of them. The same omission prevents the rise in T/N2 of Section 4.1 from being divided between the rotor and the vanes. A fall in vane drag with the Reynolds number would raise the measured thrust in the same way as an improvement in blade performance.
The vanes operate within the module housing (Section 2.1), which constitutes a component of the measured assembly. Hence, the recorded forces characterize both the vanes and the housing together. The housing wall could redirect a portion of the deflected flow toward the axis prior to its exit from the module. This confinement may contribute to the shortfall of θeff beneath δ (Section 3.4). The outer side edge of each vane lies 1.37 mm from the wall, which may also weaken the side-edge vortex discussed in Section 4.2. The present data cannot separate these effects from the aerodynamics of the vanes.
The exhaust velocity comes from a single probe. The flow leaving a ducted fan is annular, so a probe on the axis sits in the hub wake. The anemometer vane spans 23% of the exit diameter (Section 2.2), which makes the reading an area average rather than a local one. The probe was held downstream of the module rather than at the vanes. The two highest throttle settings exceed the range of the instrument and are extrapolated (Section 3.1).
Several limits apply to the forces. The offset of Section 4.5 has not been subtracted from any reported value. The scatter on the axial channel exceeds the non-repeatability specification of that cell, ±1.0 g, at 45 of the 48 test points. In the normal channel, the scatter decreases below the respective ±0.5 g at reduced throttle settings, indicating that the specification is not the constraining factor in that scenario. The load cells were calibrated with weights on the cells and not through the rig (Section 2.5). The cross-axis sensitivity of the two channels, the stiffness of the rig frame and the dynamic response of the installed cells were not measured. If the elastic deflection of Section 4.4 is also present at commanded angles, then part of the shortfall in the deflection efficiency is structural rather than aerodynamic.
The center of pressure at 0.30c is an assumption rather than a measurement. Its effect as a fixed position is described in Section 2.5 and Table S6. A fixed position scales FN and η by about the same factor (Section 2.5). Therefore, η peaks at 20° at all fixed positions between the quarter-chord and mid-chord. The center of pressure can also move with the commanded angle. For a vane in uniform flow, the center of pressure shifts from the quarter-chord at small incidence towards the mid-chord at large incidence (Section 2.3). This effect tends to move the center of pressure rearwards with increasing commanded angle. At 25°, the trailing edge of each pitching vane is displaced by 21.8 mm normal to the jet axis, against a housing half-width of 29.5 mm. The rear part of the vane then lies close to the housing wall. This confinement may change the loading of the rear part in either direction. Hence, both a rearward and a forward movement are examined below.
A forward movement of the center of pressure between the commanded angles of 20° and 25° places the center of pressure at 25° closer to the leading edge than at 20°. Equation (1) then converts the same load cell reading into a larger FN at 25°, because the moment arm avane at 25° is shorter. Hence, the decrease in FN from 20° to 25° becomes smaller. The non-linearity and hysteresis limits of the normal channel are ±1.7 g on each value of FN (Section 2.5). For the difference between the values at 20° and 25°, these limits are added in quadrature and give ±2.4 g. Thus, an FN reduction of less than 2.4 g cannot be separated from the instrument error. The FN reduction is less than 2.4 g for a forward movement of 0.03c to 0.09c at 40% to 60% throttle. At 70% and 80% throttle, it is 2.8 g and 3.9 g respectively, with the center of pressure fixed at 0.30c. A forward movement of 0.004c (0.3 mm) and 0.013c (1.1 mm), respectively, brings this decrease below 2.4 g at these two settings. The change in θeff/δ from 20° to 25° is less sensitive to this movement, because the axial component is independent of the center of pressure. At 60% to 80% throttle, the decrease in θeff/δ remains outside its instrument band (Table S6) for a forward movement of up to 0.03c to 0.05c. At 70% and 80% throttle, a forward movement of 1.1 mm or less can make η at 25° indistinguishable from η at 20°. At these two settings, the deterioration beyond 20° is therefore shown by the decrease in θeff/δ and not by the peak of η.
A rearward movement of the center of pressure has the opposite effect. If the center of pressure moves rearward between 20° and 25°, avane at 25° is longer. Equation (1) then converts the same load cell value into a reduced FN at 25°. FN, θeff and η at 25° become smaller, and their decrease from 20° to 25° becomes larger. If the center of pressure moves rearward between 15° and 20°, FN and η become smaller at 20°. The increase in FN from 15° to 20° then becomes smaller. At 40% throttle, a rearward movement of 0.03c reduces this increase below 2.4 g, the same limit as for the decrease from 20° to 25°. At 60% throttle, 0.04c is required, and at 50%, 70% and 80% throttle, 0.14c to 0.15c. Hence, for a movement of up to about 0.03c in either direction between adjacent commanded angles, the increase in η from 15° to 20° and the deterioration beyond 20° remain resolved at every throttle setting. The actual movement requires a pressure measurement on the vane or a computational approach.
The reading of the normal load cell, listed in Table S3, does not depend on the center of pressure. Its non-linearity and hysteresis limits are ±2.55 g, which correspond to ±1.7 g on FN after Equation (1). Combined in quadrature for the difference between the readings at 20° and 25°, these limits give ±3.6 g. The mean reading decreases from 20° to 25° by 4.2 to 10.2 g over the eight throttle settings. This decrease exceeds 3.6 g at every throttle setting. Hence, the moment measured about the rig pivot axis decreases from 20° to 25°, regardless of the position of the center of pressure. A movement of the center of pressure changes only the values of FN, θeff and η derived from this reading.
The force matrix was recorded in one run, and no set point was repeated (Section 2.4). Hence, the scatter shown in Section 3.3 describes short-term stability at each set point, not the repeatability between runs. The standard deviations at 20° and 25° can be coupled with the ±2.4 g band in quadrature. The band on the reduction in FN from 20° to 25° is then ±2.5 to ±2.8 g from 40% throttle. This decrease, from 2.8 to 6.8 g, is beyond this range at all throttle positions from 40%. The temperature shift in the normal cell on FN is 0.09 g/°C. To get to 2.4 g would require a difference in cell temperature of 26 °C between the 20° and 25° blocks. The creep specification for the normal cell is a maximum of 0.85 g on FN for 20 min. The vane angle was the outer loop of the run. Therefore, each larger commanded angle was recorded later, after a longer load history and at a lower battery state of charge. The test order, the battery state, the servo loading and the elapsed time may thus introduce systematic variations that the scatter does not show. The rotational speed was not measured during the force run. During the run, a fall in battery voltage could lower the rotational speed at a given throttle setting. A lower rotational speed reduces both force components by about the same factor. Thus, θeff and θeff/δ are unchanged to the first order, while η and F/Fref are reduced, because Fref was measured first. The 25° block was observed approximately 50 s following the 20° block. Over this interval, a decrease in rotational speed of 1.0% at 70% throttle to 6.2% at 40% would remove the decrease in FN from 20° to 25°. The decrease in θeff/δ from 20° to 25° (Section 4.1) is independent of this effect. A decrease in rotational speed would likewise decrease η at 20° relative to 15°, so it cannot be responsible for the increase from 15° to 20°. The rotational speed and the exhaust velocity were measured together, with the vanes at zero deflection, in a session separate from the force tests. The ratio v/N deviates from its mean by no more than ±2.3% (Section 3.2). In a further session, the exhaust velocity was measured three times from 10% to 60% throttle with the vectoring module removed. The variation in these repetitions was 0.7% to 2.9%. The difference between their mean and the exhaust velocity used in this study (Section 3.1) is no more than 3.5%. Nevertheless, the repeatability of the force measurements between runs remains to be established.
5. Conclusions
The 70 mm EDF deflecting-vane thrust vectoring module was measured at eight throttle settings and six vane angles. In addition, the deflected jet was visualized with smoke at 40% throttle. Hence, the vectoring metrics were measured over an operating range rather than a single condition. The thrust scaled with the square of the rotational speed and of the exhaust velocity, and the two quantities were consistent to within ±2.3%. These fits show consistency with the expected scaling but do not validate the absolute force readings. The operational point is described by the rotational speed and the exhaust velocity, not the throttle command.
The vanes rotated the jet through less than the commanded angle, and the shortfall grew with the command. Maximum thrust vectoring efficiency was at 20° at all throttle settings from 40%. This peak is unaffected by the residual normal force and the axial offset. Therefore, 20° was the best setting tested. However, the measurements do not identify the optimum between 15° and 25°. For the two largest throttle positions, the peak of η at 20° lies within the uncertainty of the center of pressure and of the battery state. The deflection efficiency still falls beyond 20° at these settings. The smoke images show the jet spreading as the commanded angle increases and the trace breaks up at 25°. These images qualitatively support the deterioration beyond 20° but do not validate the force-derived angle.
The residual normal force acts on the assembly during operation. Thus, the findings are presented both with and without subtracting it. Elastic bending of the vanes is proposed for this force, but it remains a hypothesis. The source of the axial offset was not identified. However, its effect was bounded, and the axial losses are given between a lower and an upper bound.
The center of pressure was assumed instead of measured, and the force matrix was recorded in one run. These limitations will be addressed in future work. The source of the axial offset can be identified by repeating the matrix in a randomized order, with the load cells zeroed at each vane angle. In the repeated matrix, the set points at zero deflection will be recorded again at regular intervals, and the battery voltage and rotational speed will be logged. The repeated matrix will also quantify the repeatability between runs. The measurement system will be calibrated as mounted on the rig before the repetition of the matrix. Known weights will be added to the moving structure along the jet axis for the axial channel and at the vane location for the normal channel. At each load the readings of both channels will be recorded. This calibration will verify the moment arms of Equation (1) and the cross-axis sensitivity of the two channels. The optimum setting will be found by a finer angular step between 15° and 25°. The data will be compared to a computational solution for the identical setup including the chordwise load distribution on the vanes. The deflected jet will also be visualized with a laser sheet in the deflection plane. Finally, the flat plates will be replaced by symmetric NACA sections of the same planform, and the module will be subjected to a wind tunnel test with crosswind.
Supplementary Materials
The following supporting information can be downloaded at https://www.mdpi.com/article/10.3390/aerospace13111007/s1, Figure S1. Geometry of the EDF and the vectoring module: (a) manufacturer’s drawing of the EDF [36], (b) dimensioned section of the assembly. Dimensions in mm. Table S1. Baseline performance at zero vane deflection. Table S2. Data used for the thrust scaling fits. Table S3. Complete force-component matrix (48 test conditions). Table S4. Derived vectoring quantities (throttle ≥ 40%). Table S5. Derived vectoring quantities with the zero-deflection residual normal force subtracted (throttle ≥ 40%). Table S6. Uncertainty of the derived vectoring quantities (throttle ≥ 40%). u: instrument band. CoP: center of pressure. pp: percentage points. Table S7. Derived vectoring quantities with the estimated axial offset added to the axial component (throttle ≥ 40%). Video S1. Smoke Visualization.
Author Contributions
Conceptualization, Ü.H.; methodology, Ü.H.; software, Ü.H.; validation, Ü.H. and E.K.; formal analysis, Ü.H. and E.K.; investigation, Ü.H.; resources, Ü.H.; data curation, Ü.H.; writing—original draft preparation, Ü.H.; writing—review and editing, E.K.; visualization, Ü.H.; supervision, E.K.; project administration, Ü.H.; funding acquisition, Ü.H. All authors have read and agreed to the published version of the manuscript.
Funding
This research was funded by the Gaziantep University Scientific Research Projects Unit (BAP) infrastructure research project with grant number HUBF.ÖKAP.25.11.
Data Availability Statement
The datasets produced from the experiments and used for all figures and tables in this study are found in the Supplementary Materials (Tables S1–S7, Video S1 and Figure S1). The unprocessed per-sample force data can be obtained from the corresponding author upon request.
Acknowledgments
During the preparation of this manuscript, the authors used Claude Opus 5.5 (Anthropic) for the purposes of language editing and for checking the reported numerical values against the source data files. The authors have reviewed and edited the output and take full responsibility for the content of this publication.
Conflicts of Interest
The authors declare no conflicts of interest.
Abbreviations
The following abbreviations are used in this manuscript:
| EDF | Electric ducted fan |
| VTOL | Vertical take-off and landing |
| ACHEON | Aerial Coanda High Efficiency Orienting-jet Nozzles |
| PWM | Pulse width modulation |
| SD | Standard Deviation |
| acell | Moment arm from rig pivot axis to the normal load cell |
| avane | Moment arm from rig pivot axis to the vane center of pressure |
| c | Chord length |
| D | Duct exit diameter |
| dLE | Distance between the rig pivot axis and the vane leading edge |
| F | Resultant force |
| FA | Axial force component |
| FN | Vane normal force |
| Fcell | Normal load cell reading |
| Fref | Reference axial thrust at zero deflection |
| N | Rotational speed |
| R | Rotor radius |
| Re | Reynolds number |
| V | Reference velocity |
| Vax | Axial velocity through the rotor |
| v | Exhaust velocity |
| δ | Commanded vane angle |
| η | Thrust vectoring efficiency |
| θeff | Effective vectoring angle |
| ν | Kinematic viscosity of air |
| ρ | Air density |
References
- Rehan, M.; Akram, F.; Shahzad, A.; Shams, T.A.; Ali, Q. Vertical Take-off and Landing Hybrid Unmanned Aerial Vehicles: An Overview. Aeronaut. J. 2022, 126, 2017–2057. [Google Scholar] [CrossRef] [Scilit]
- Zhang, T.; Barakos, G.N. Review on Ducted Fans for Compound Rotorcraft. Aeronaut. J. 2020, 124, 941–974. [Google Scholar] [CrossRef] [Scilit]
- Qian, Y.; Luo, Y.; Hu, X.; Zeng, Z.; Zhang, Y. Improving the Performance of Ducted Fans for VTOL Applications: A Review. Sci. China Technol. Sci. 2022, 65, 2521–2541. [Google Scholar] [CrossRef] [Scilit]
- Luo, Y.; Cui, B.; Zhang, H. Review of Thrust Vectoring Technology Applications in Unmanned Aerial Vehicles. Drones 2025, 9, 689. [Google Scholar] [CrossRef] [Scilit]
- Páscoa, J.; Dumas, A.; Trancossi, M.; Stewart, P.; Vucinic, D. A Review of Thrust-Vectoring in Support of a V/STOL Non-Moving Mechanical Propulsion System. Open Eng. 2013, 3, 374–388. [Google Scholar] [CrossRef] [Scilit]
- Kara, E.; Kurtuluş, D.F. Design Optimization of a Fluidic Thrust Vectoring System Based on Coanda Effect Using Meta-Models. Int. J. Turbo Jet Engines 2025, 42, 483–496. [Google Scholar] [CrossRef] [Scilit]
- Shu, Y.; Meng, Q.; Wei, S.; Ding, M.; Wang, Y.; Long, X.; Ke, Z.; Wei, W. A General Analysis Framework for Multirotor Thrust-Vectoring Vehicles: From Configuration to Modeling to Data-Driven Approaches. Aerosp. Sci. Technol. 2026, 174, 111816. [Google Scholar] [CrossRef] [Scilit]
- Miwa, M.; Shigematsu, Y.; Yamashita, T. Control of Ducted Fan Flying Object Using Thrust Vectoring. JSDD 2012, 6, 322–334. [Google Scholar] [CrossRef] [Scilit]
- Fang, K.-C.; Liao, T.-L.; Lian, F.-L. Design and Full-Pose Control of a Ducted Fan Aerial Robot with Dual-Axis Gimbaled Thrust-Vectoring Mechanisms. In Proceedings of the 2025 IEEE/ASME International Conference on Advanced Intelligent Mechatronics (AIM), Hangzhou, China, 14–18 July 2025; IEEE: New York, NY, USA, 2025; pp. 1–6. [Google Scholar]
- Söğütcü, B.; Sümer, B. Experimental and Numerical Investigation of a Jet Vane of Thrust Vector Control System. In Proceedings of the AIAA Propulsion and Energy 2019 Forum; American Institute of Aeronautics and Astronautics: Indianapolis, IN, USA, 2019. [Google Scholar]
- Bowers, H.; Pahle, W. Thrust Vectoring on the NASA F-18 High Alpha Research Vehicle; NASA Dryden Flight Research Center: Edwards, CA, USA, 1996; p. 34. [Google Scholar]
- Das, S.S.; Páscoa, J.C.; Trancossi, M.; Dumas, A. Computational Fluid Dynamic Study on a Novel Propulsive System: ACHEON and Its Integration with an Unmanned Aerial Vehicle (UAV). J. Aerosp. Eng. 2016, 29, 04015015. [Google Scholar] [CrossRef] [Scilit]
- Kara, E.; Kurtuluş, D.F. Determination of Optimum Parameter Space of a Fluidic Thrust Vectoring System Based on Coanda Effect Using Gradient-Based Optimization Technique. J. Appl. Fluid Mech. 2023, 16, 1974–1988. [Google Scholar] [CrossRef] [Scilit]
- Banazadeh, A.; Saghafi, F.; Ghoreyshi, M.; Pilidis, P. Experimental and Computational Investigation into the Use of Co-Flow Fluidic Thrust Vectoring on a Small Gas Turbine. Aeronaut. J. 2008, 112, 17–25. [Google Scholar] [CrossRef] [Scilit]
- Tanveer, A.; Ahmad, S.M. Exploration of Fluidic Thrust Vectoring Control on a Dynamic Test Rig: Computational and Experimental Analysis. Eng. Proc. 2023, 56, 90. [Google Scholar] [CrossRef] [Scilit]
- Kara, E.; Enderya, M.D.; Kurtuluş, D.F. Smoke-Wire Visualization of the Flow Dynamics through a Fluidic Thrust Vectoring System Based on Coanda Effect. Procedia Struct. Integr. 2025, 72, 85–90. [Google Scholar] [CrossRef] [Scilit]
- Abrego, A.I.; Bulaga, R.W. Performance Study of a Ducted Fan System. In Proceedings of the American Helicopter Society Aerodynamics, Acoustics, and Test and Evaluation Technical Specialists Meeting; American Helicopter Society: San Francisco, CA, USA, 2002. [Google Scholar]
- Graf, W.; Fleming, J.; Ng, W. Improving Ducted Fan UAV Aerodynamics in Forward Flight. In Proceedings of the 46th AIAA Aerospace Sciences Meeting and Exhibit; American Institute of Aeronautics and Astronautics: Reno, NV, USA, 2008. [Google Scholar]
- Farras, N.M.; Jenie, Y.I.; Arifianto, O. Development of a One Axis Thrust Vectoring Control System Demonstrator with Electric Ducted Fan. In Proceedings of the 2021 IEEE International Conference on Aerospace Electronics and Remote Sensing Technology (ICARES); IEEE: Bali, Indonesia, 2021; pp. 1–7. [Google Scholar]
- Pütsep, K.; Nerep, T.; Tiismus, H.; Rassõlkin, A. Development and Testing of Vertical Take-off and Landing Aerial Vehicle with Tandem Electric Ducted Fan Motor. Proc. Est. Acad. Sci. 2023, 72, 184. [Google Scholar] [CrossRef] [Scilit]
- Muehlebach, M.; D’Andrea, R. The Flying Platform—A Testbed for Ducted Fan Actuation and Control Design. Mechatronics 2017, 42, 52–68. [Google Scholar] [CrossRef] [Scilit]
- Naldi, R.; Marconi, L. A Prototype of Ducted-Fan Aerial Robot with Redundant Control Surfaces. J. Intell. Robot. Syst. 2014, 76, 137–150. [Google Scholar] [CrossRef] [Scilit]
- Jacobsen, E.B. Modelling and Control of Thrust Vectoring Mono-Copter. Master’s Thesis, Aalborg University, Aalborg, Denmark, 2021. [Google Scholar]
- Weinstein, R.; Simmons, B.M. Experimental Characterization of an Electric Ducted Fan for the SUSAN 25% Scale Research Vehicle. In Proceedings of the AIAA SCITECH 2024 Forum; American Institute of Aeronautics and Astronautics: Orlando, FL, USA, 2024. [Google Scholar]
- Chu, H.-Q.; Dinh, Q.-N.; Vu, T.-S.; Pham, V.-Y.; Bui, V.-T.; Hoang, N.-M.; Nguyen, T.-K.; Nguyen, D.; Pham, G.-D.; Dinh, C.-T. Static Aero-Propulsion Experiment of an Electric Ducted Fan. Aerospace 2025, 12, 509, Correction in Aerospace 2026, 13, 458. [Google Scholar] [CrossRef] [Scilit]
- Darrah, D.; Eppler, J.; Liu, W.; Anemaat, W.A. Electric Ducted Fan Design and Testing for High Performance UAV Integration. In Proceedings of the AIAA Scitech 2020 Forum, Orlando, FL, USA, 6–10 January 2020. [Google Scholar] [CrossRef] [Scilit]
- Odukoya, O.; Jo, B.W. Experimental Investigation and Performance Evaluation of an Electric Ducted Fan (EDF) for Distributed Propulsion Systems. In Proceedings of the AIAA AVIATION 2026 Forum; American Institute of Aeronautics and Astronautics: San Diego, CA, USA, 2026. [Google Scholar]
- Cheng, Z.-H.; Pei, H.-L. Control Effectiveness Enhancement for the Hovering/Cruising Transition Control of a Ducted Fan UAV. J. Intell. Robot. Syst. 2022, 105, 89. [Google Scholar] [CrossRef] [Scilit]
- Ortiz, X.; Rival, D.; Wood, D. Forces and Moments on Flat Plates of Small Aspect Ratio with Application to PV Wind Loads and Small Wind Turbine Blades. Energies 2015, 8, 2438–2453. [Google Scholar] [CrossRef] [Scilit]
- Traub, L.W. Examination and Prediction of the Lift Components of Low Aspect Ratio Rectangular Flat Plate Wings. Aerospace 2023, 10, 597. [Google Scholar] [CrossRef] [Scilit]
- McCormick, B.W. Aerodynamics, Aeronautics, and Flight Mechanics, 2nd ed.; Wiley: Hoboken, NJ, USA, 1995; ISBN 978-0-471-57506-1. [Google Scholar]
- Leishman, J.G. Principles of Helicopter Aerodynamics; Cambridge University Press: Cambridge, UK, 2006; Volume 2. [Google Scholar]
- FFmpeg (version 8.0.1). Available online: https://ffmpeg.org/ (accessed on 29 August 2026).
- ImageMagick|Mastering Digital Image Alchemy (version 7.1.1-43). Available online: https://imagemagick.org/ (accessed on 29 August 2026).
- Brandt, J.; Selig, M. Propeller Performance Data at Low Reynolds Numbers. In Proceedings of the 49th AIAA Aerospace Sciences Meeting Including the New Horizons Forum and Aerospace Exposition; American Institute of Aeronautics and Astronautics: Orlando, FL, USA, 2011. [Google Scholar]
- 70mm 12-Blade EDF|3060-KV1900 Motor|6S Power. Available online: https://www.fmshobby.com/products/edf-system-70mm-12-blade-6s-power-system-with-3060-kv1900-motor-pro (accessed on 6 October 2026).
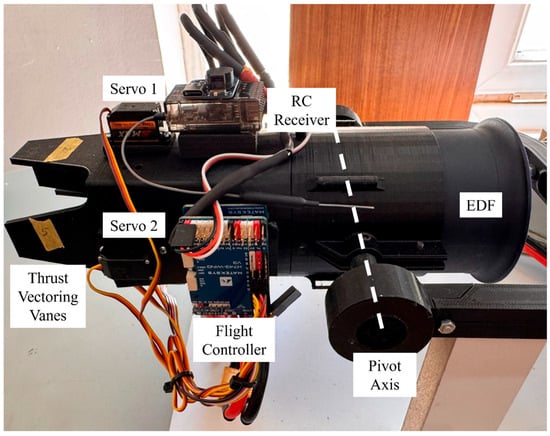
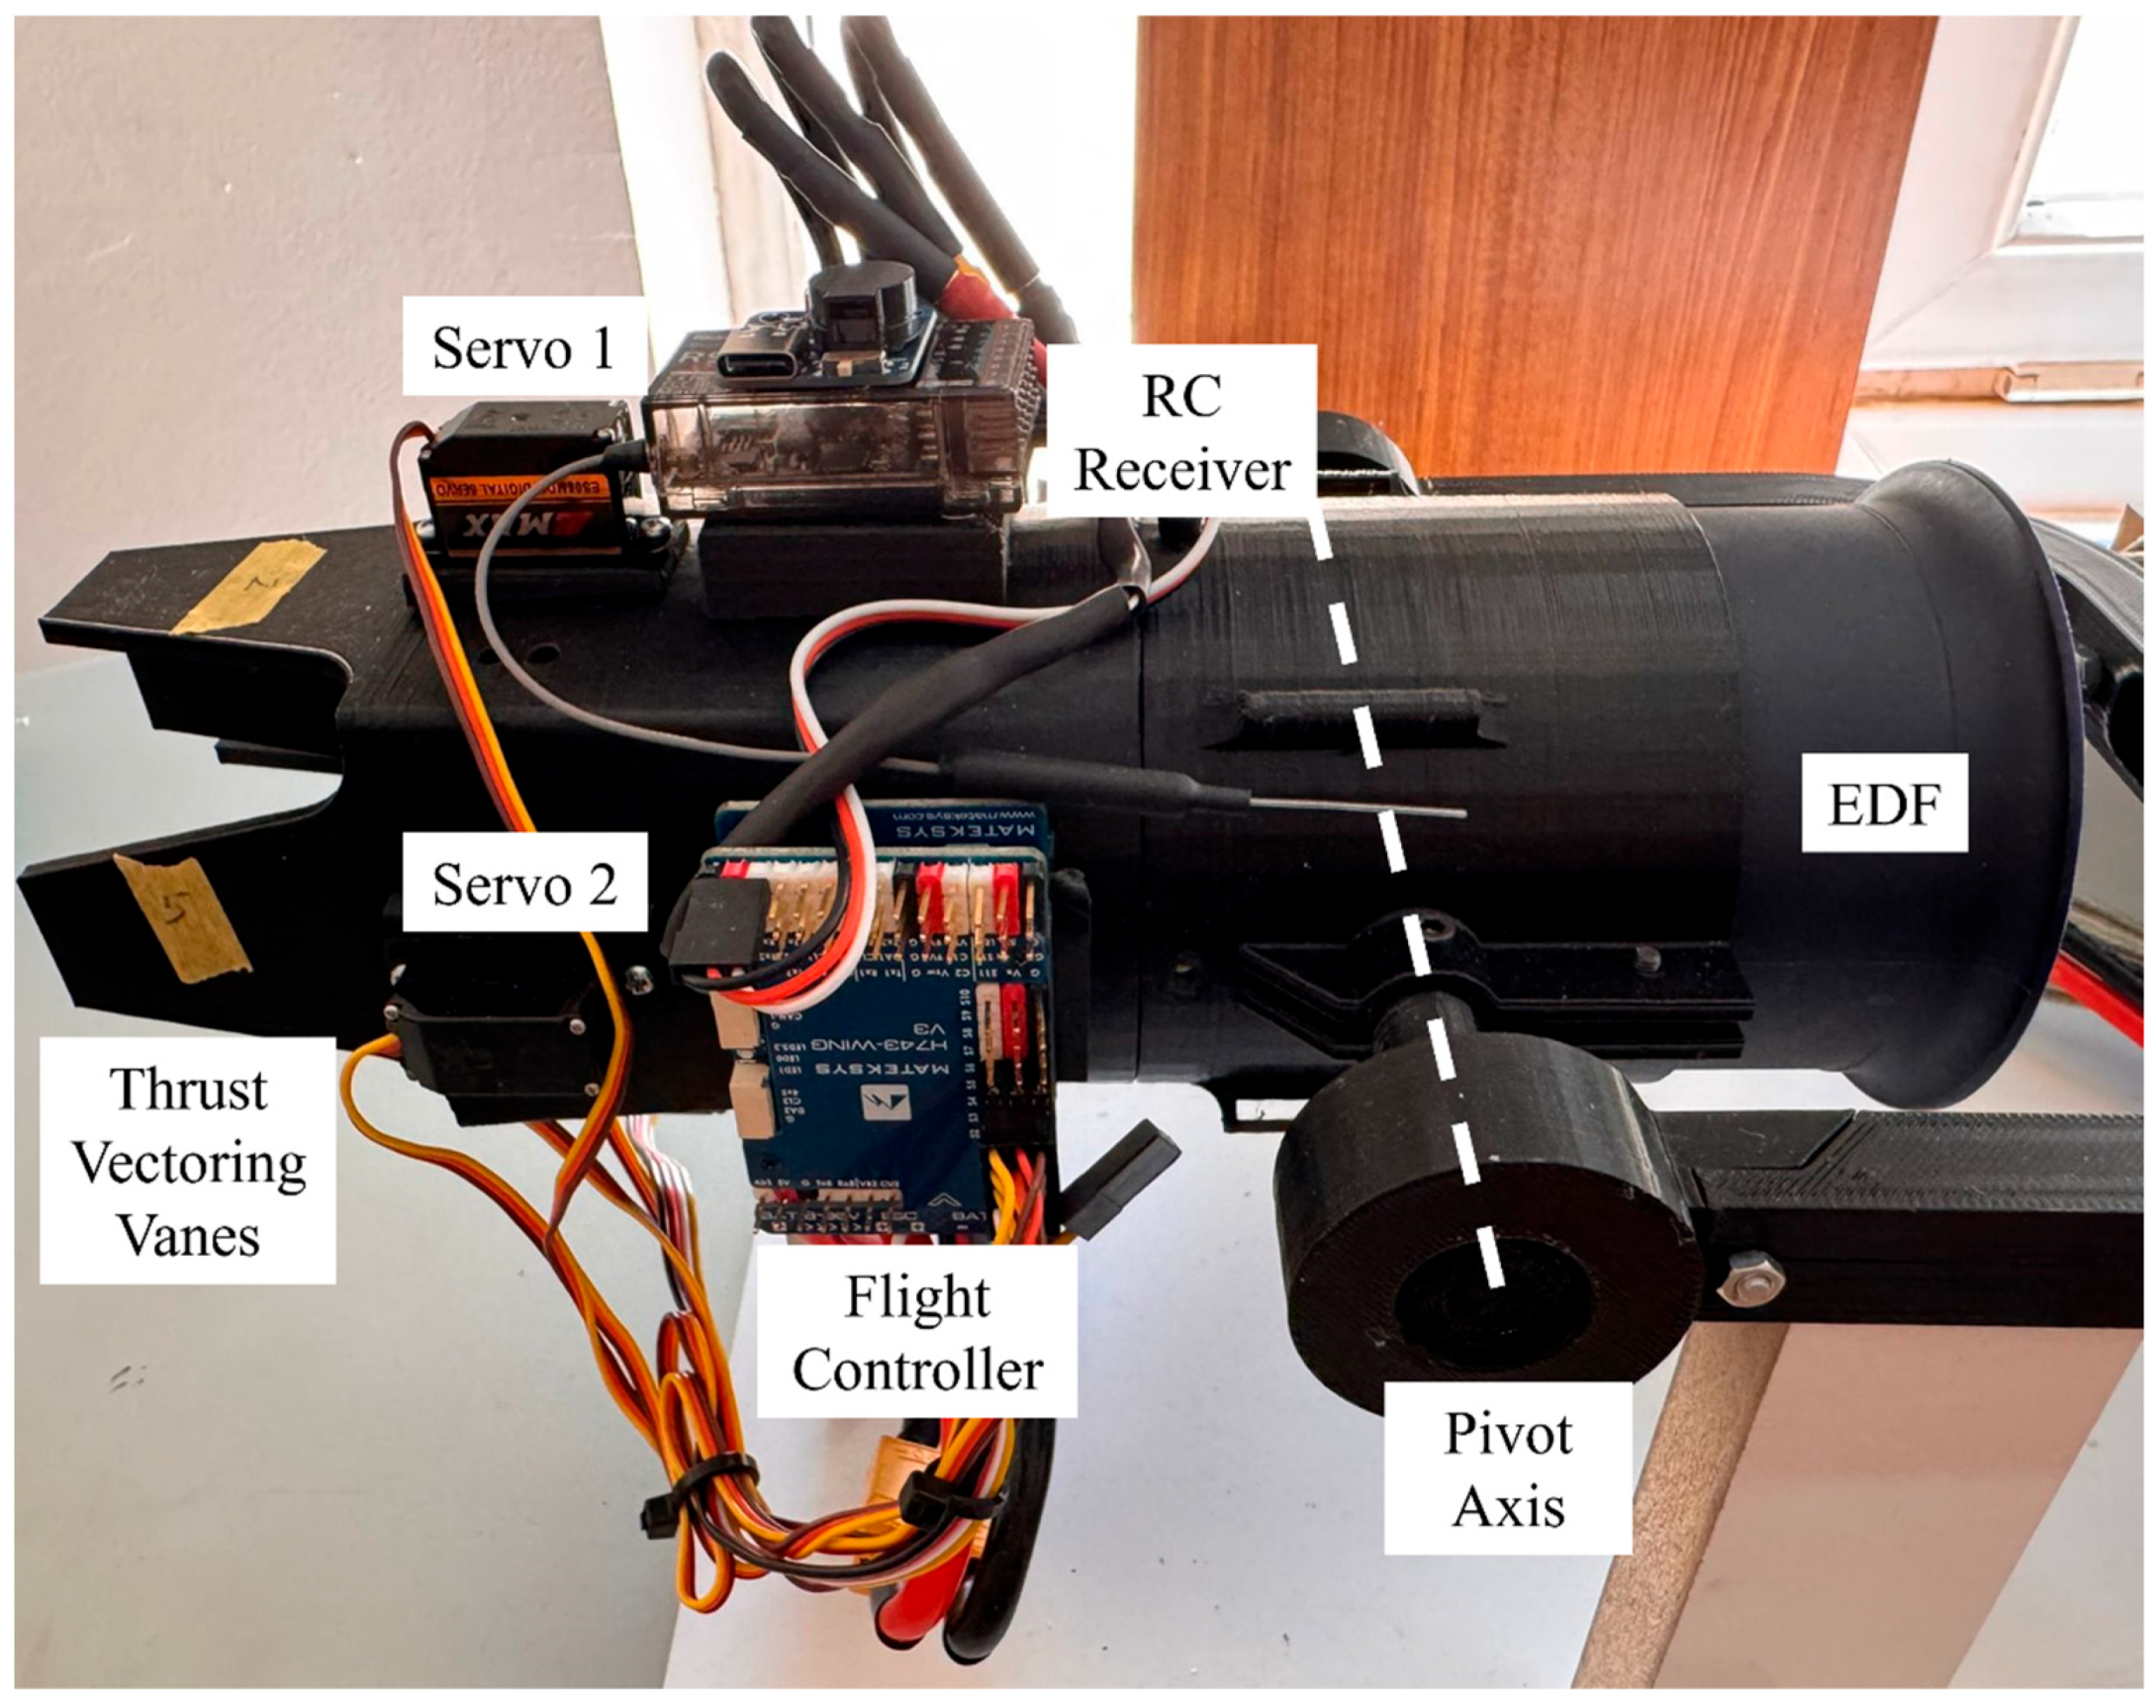
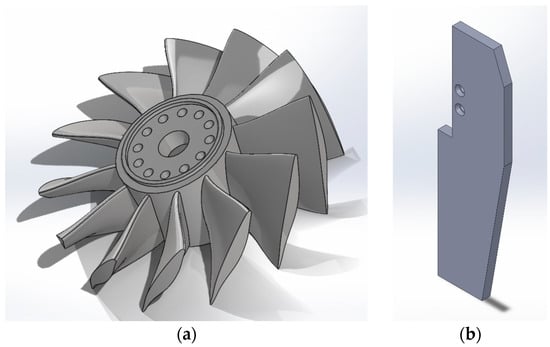
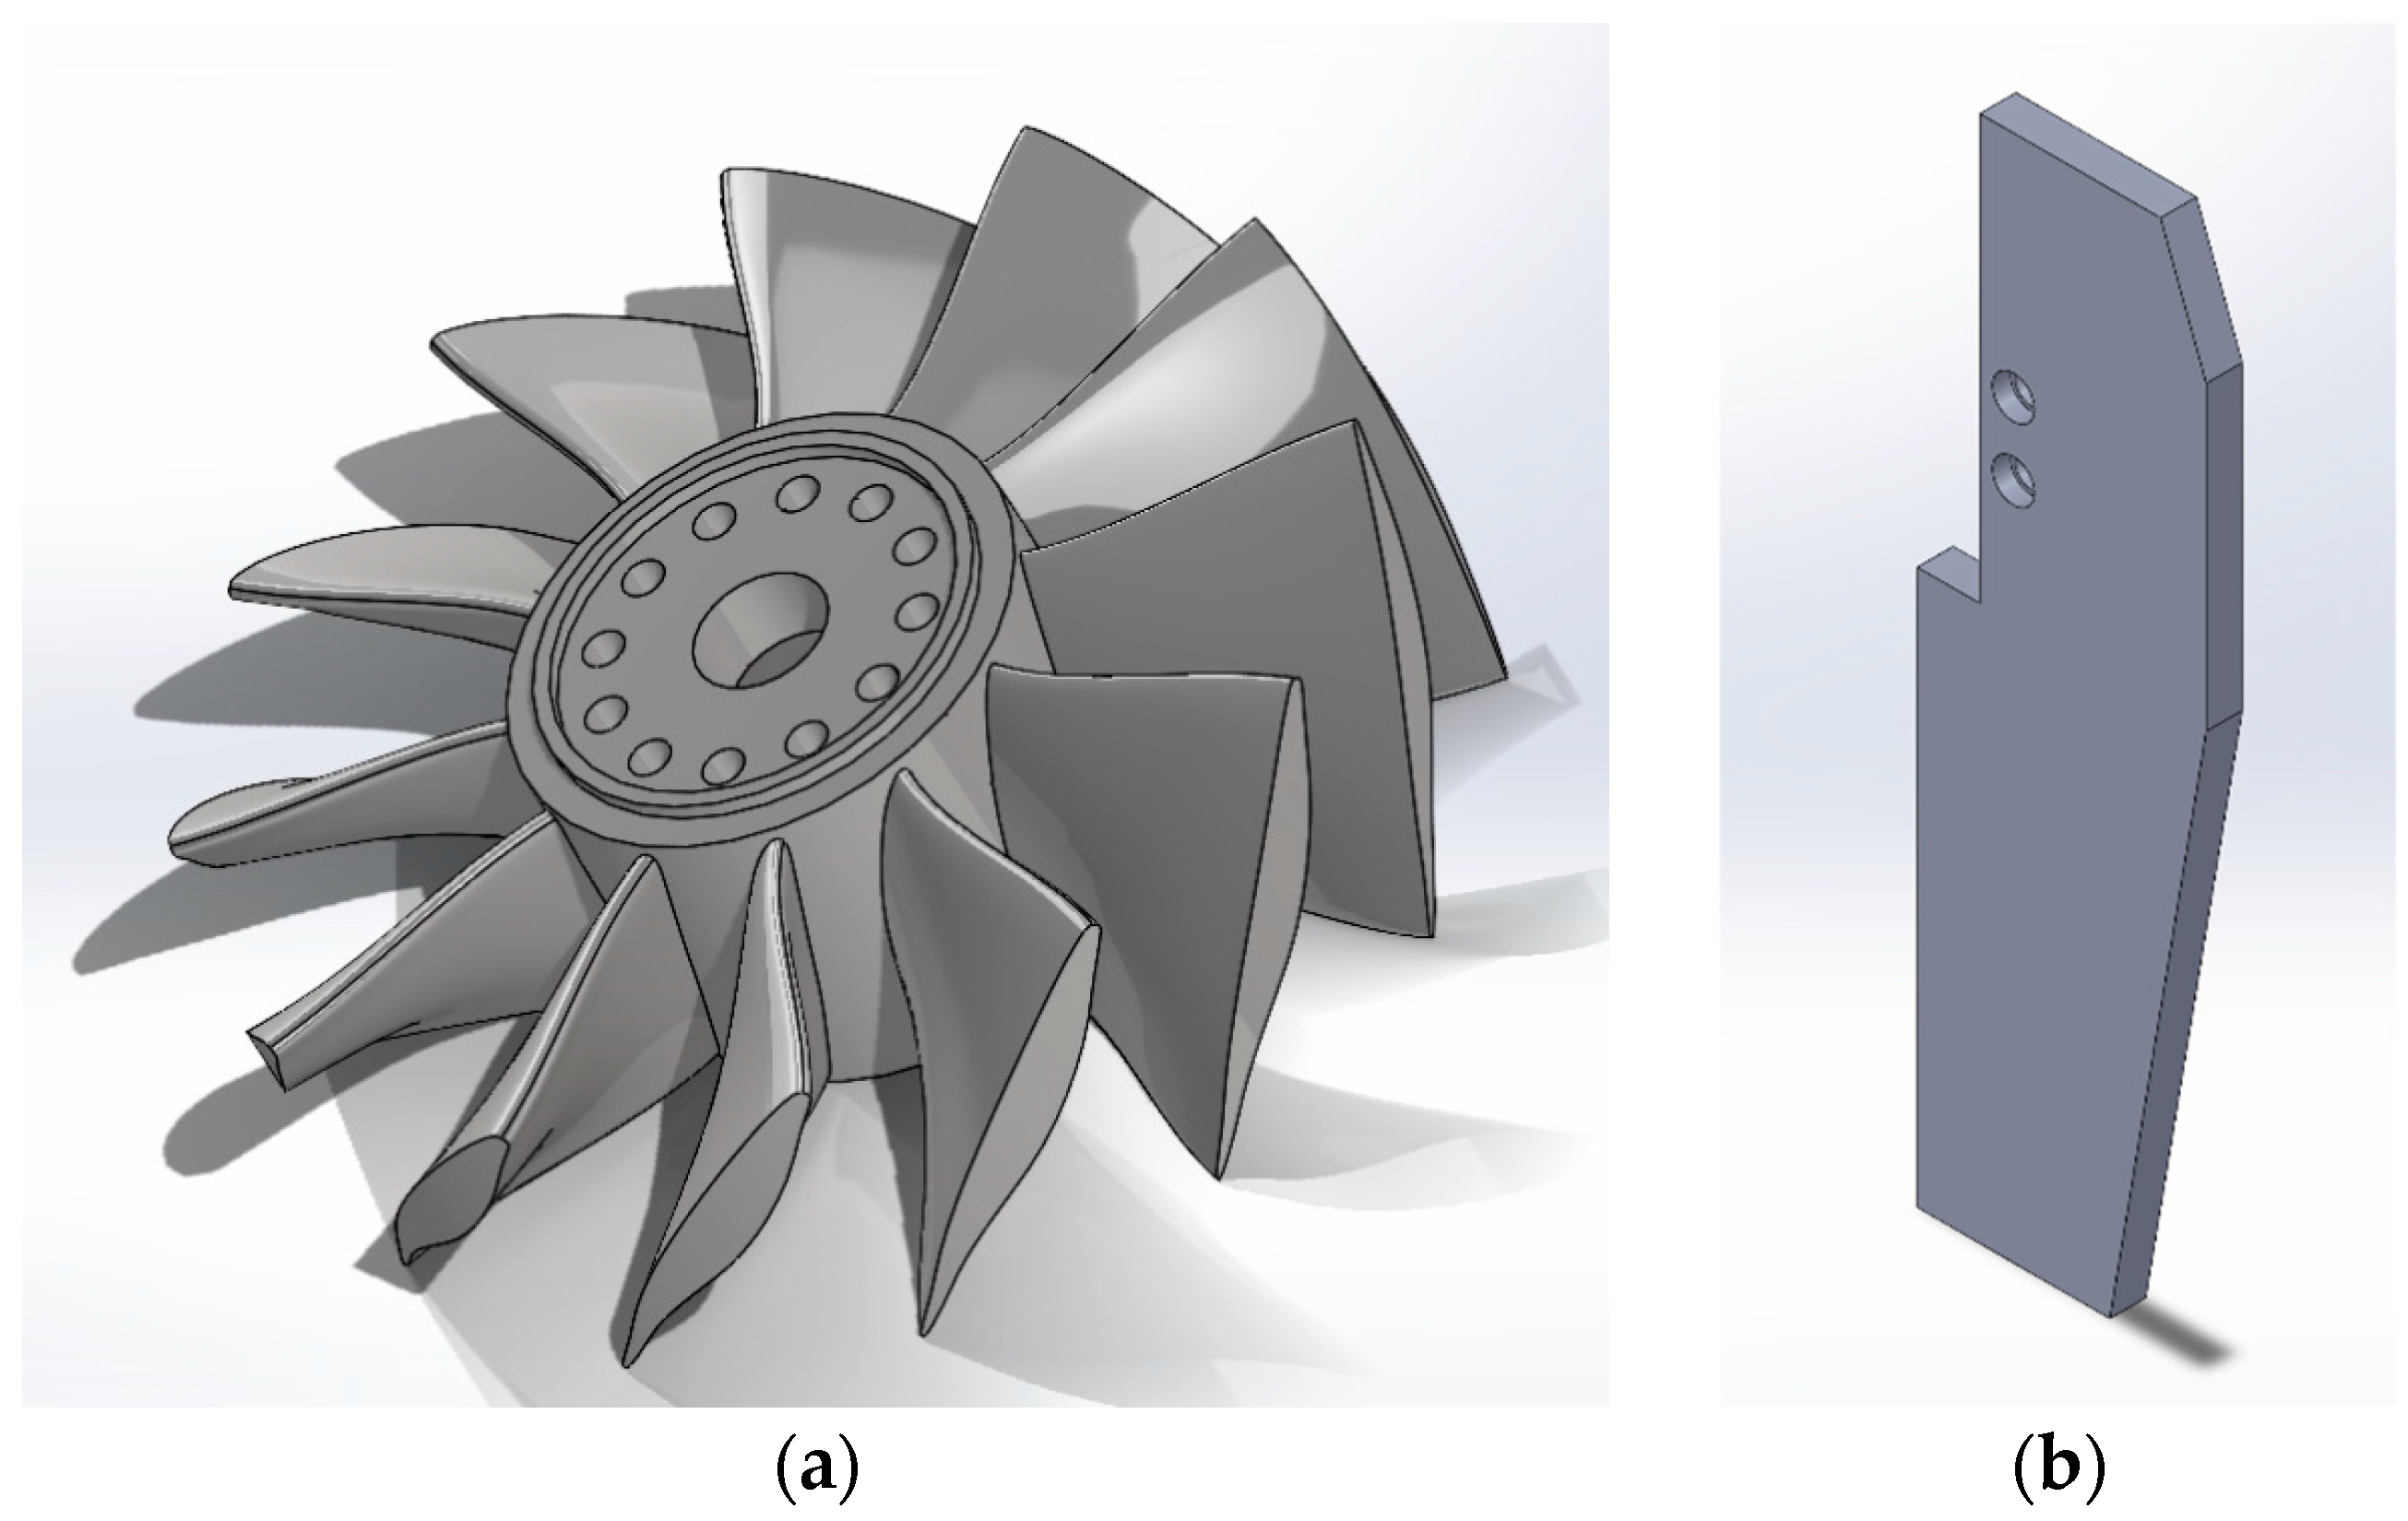
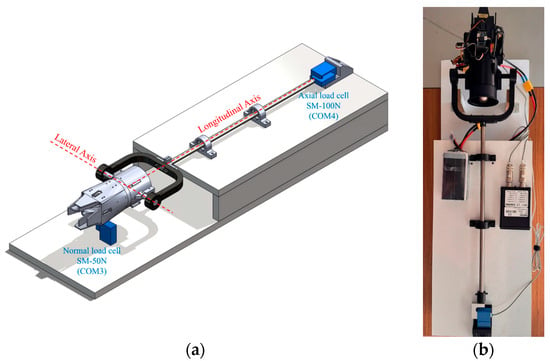
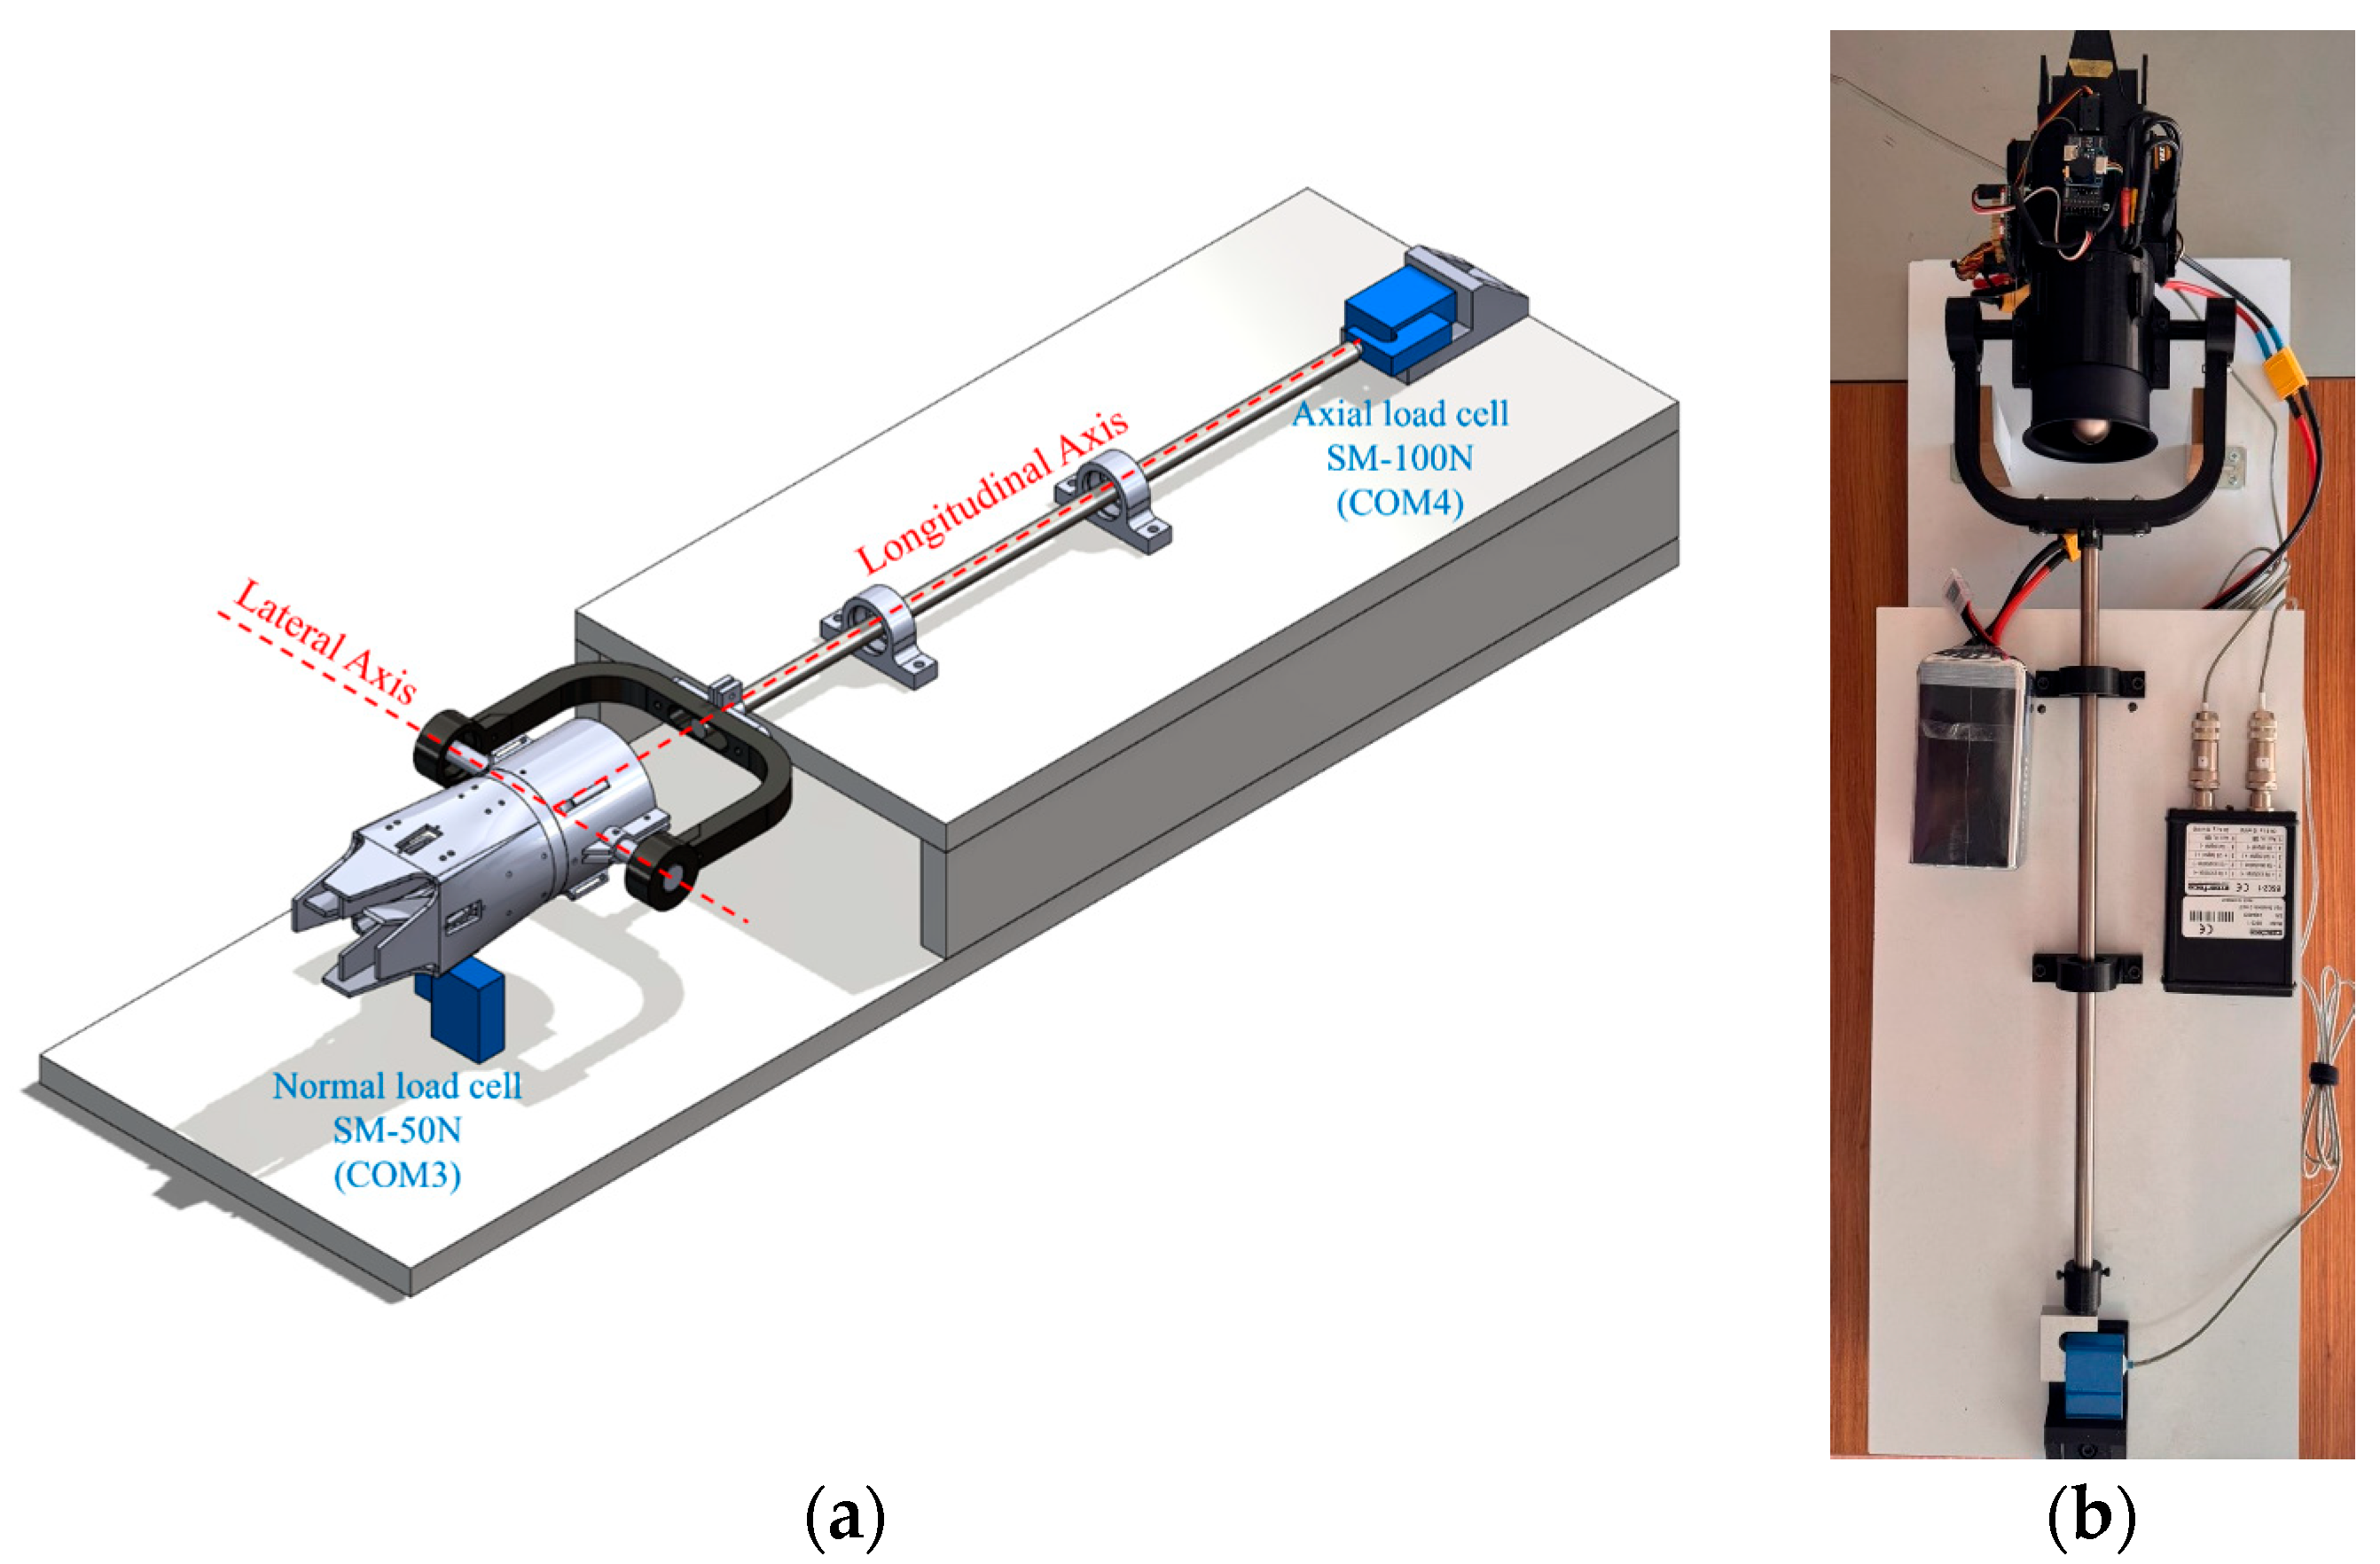
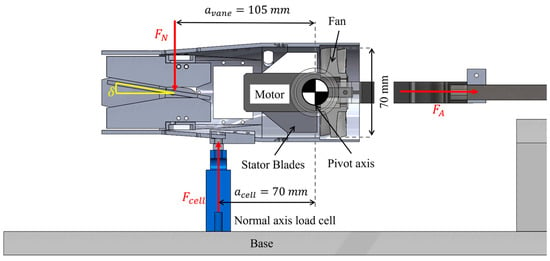
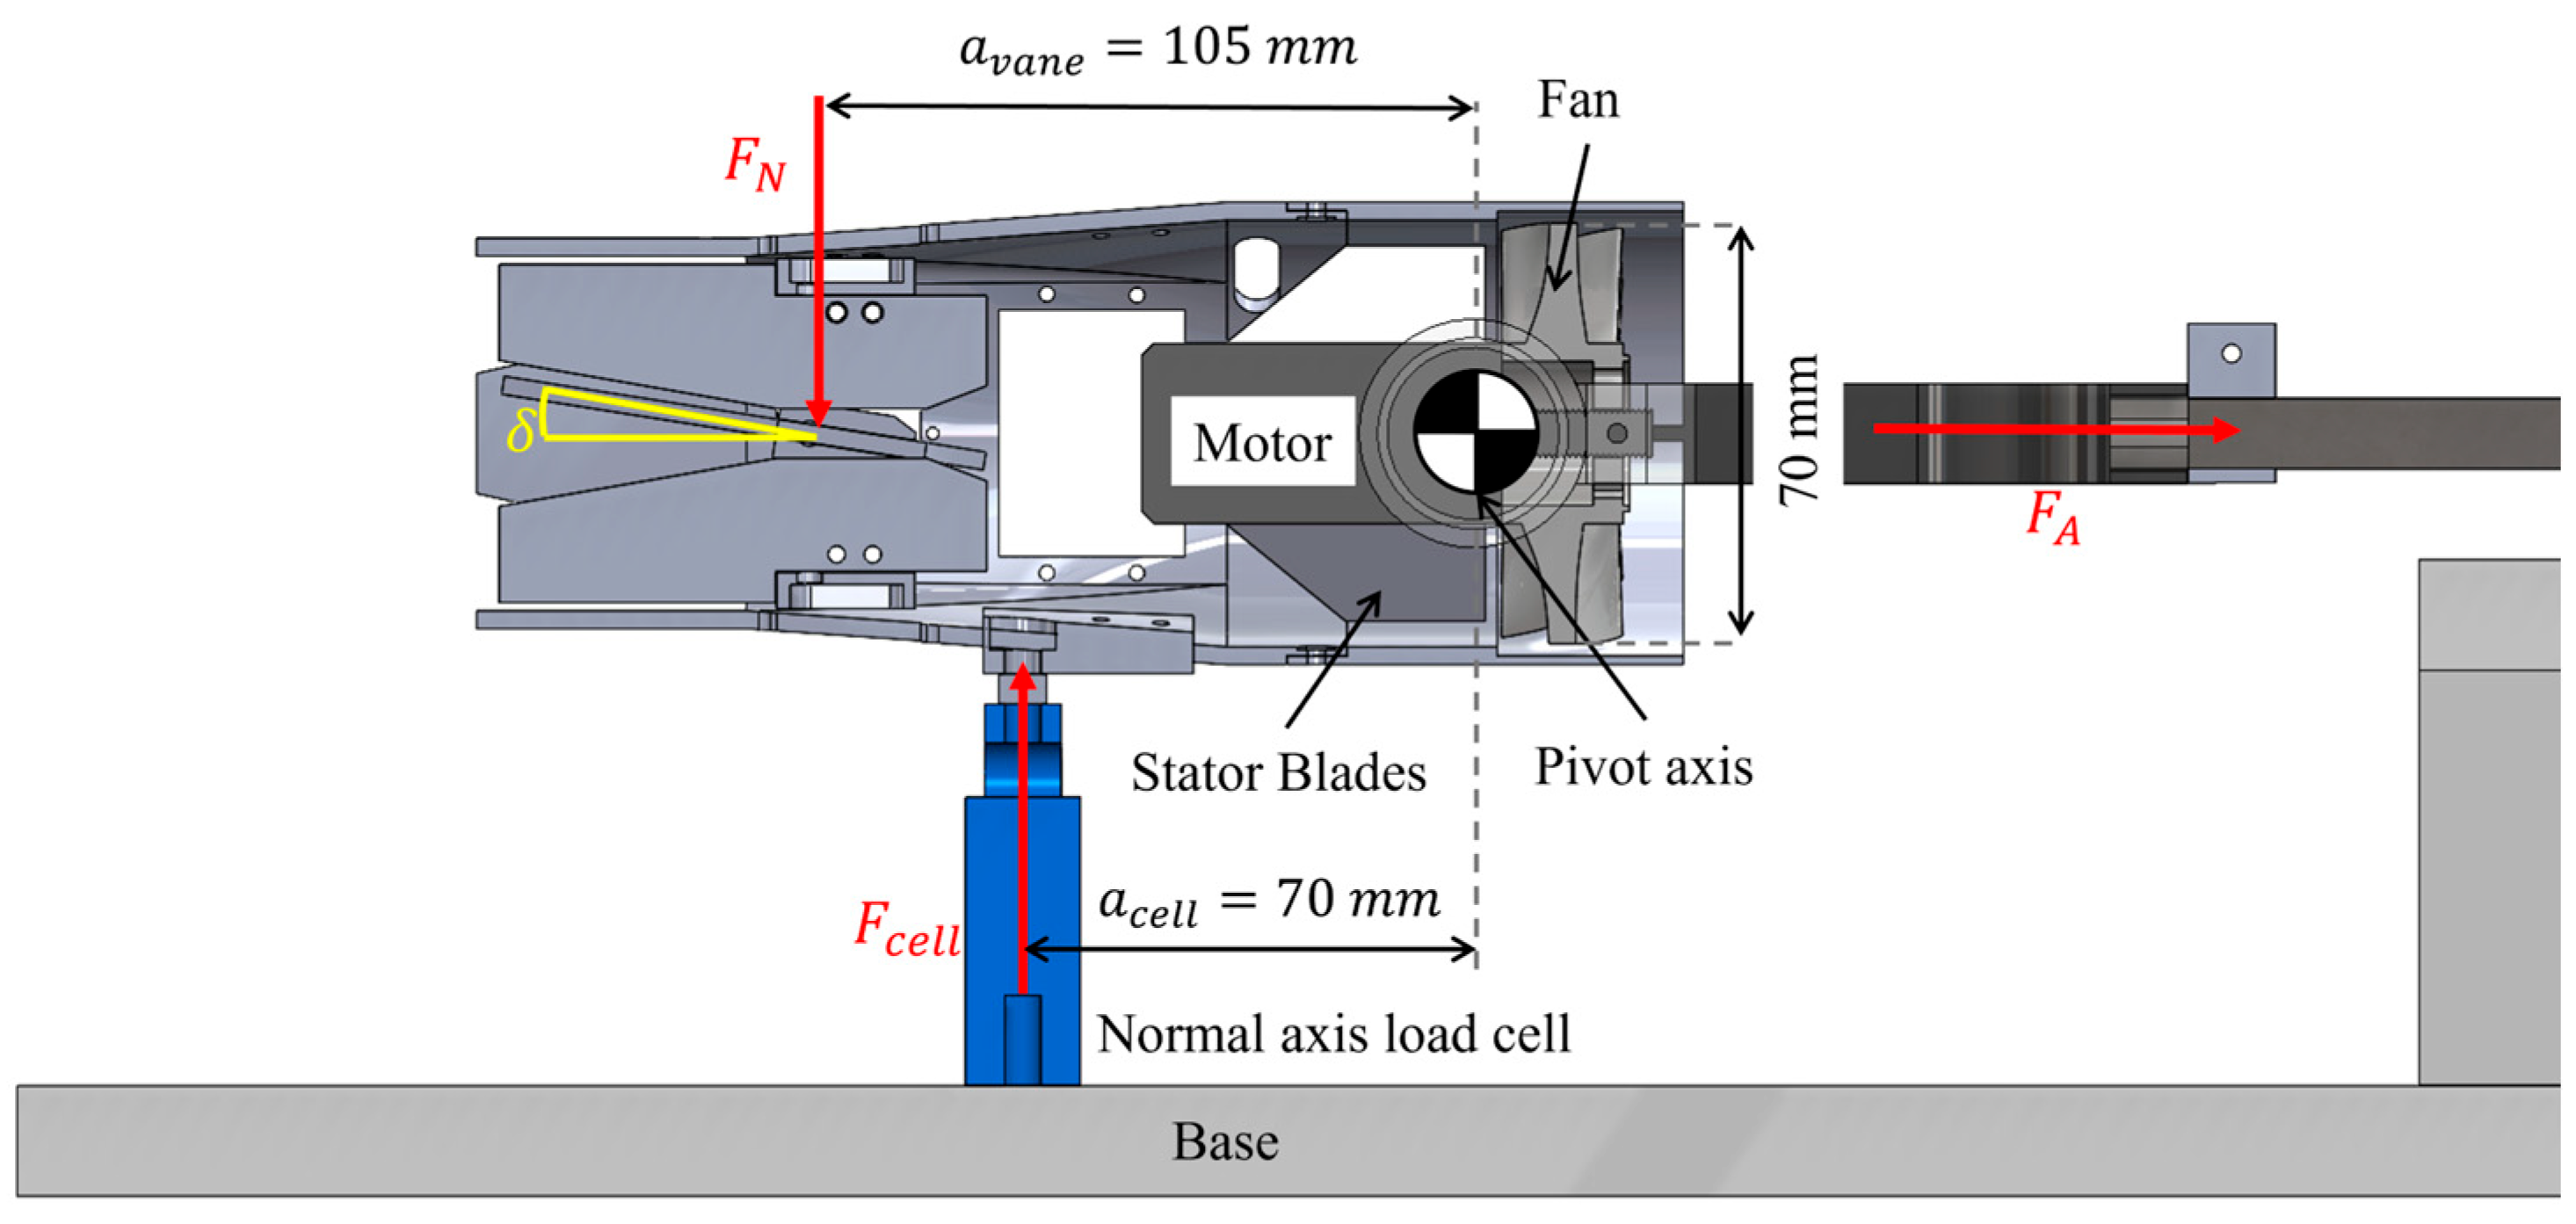
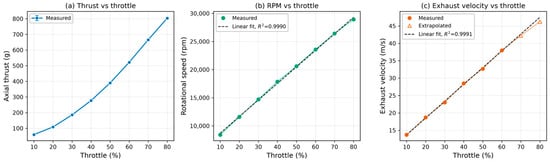
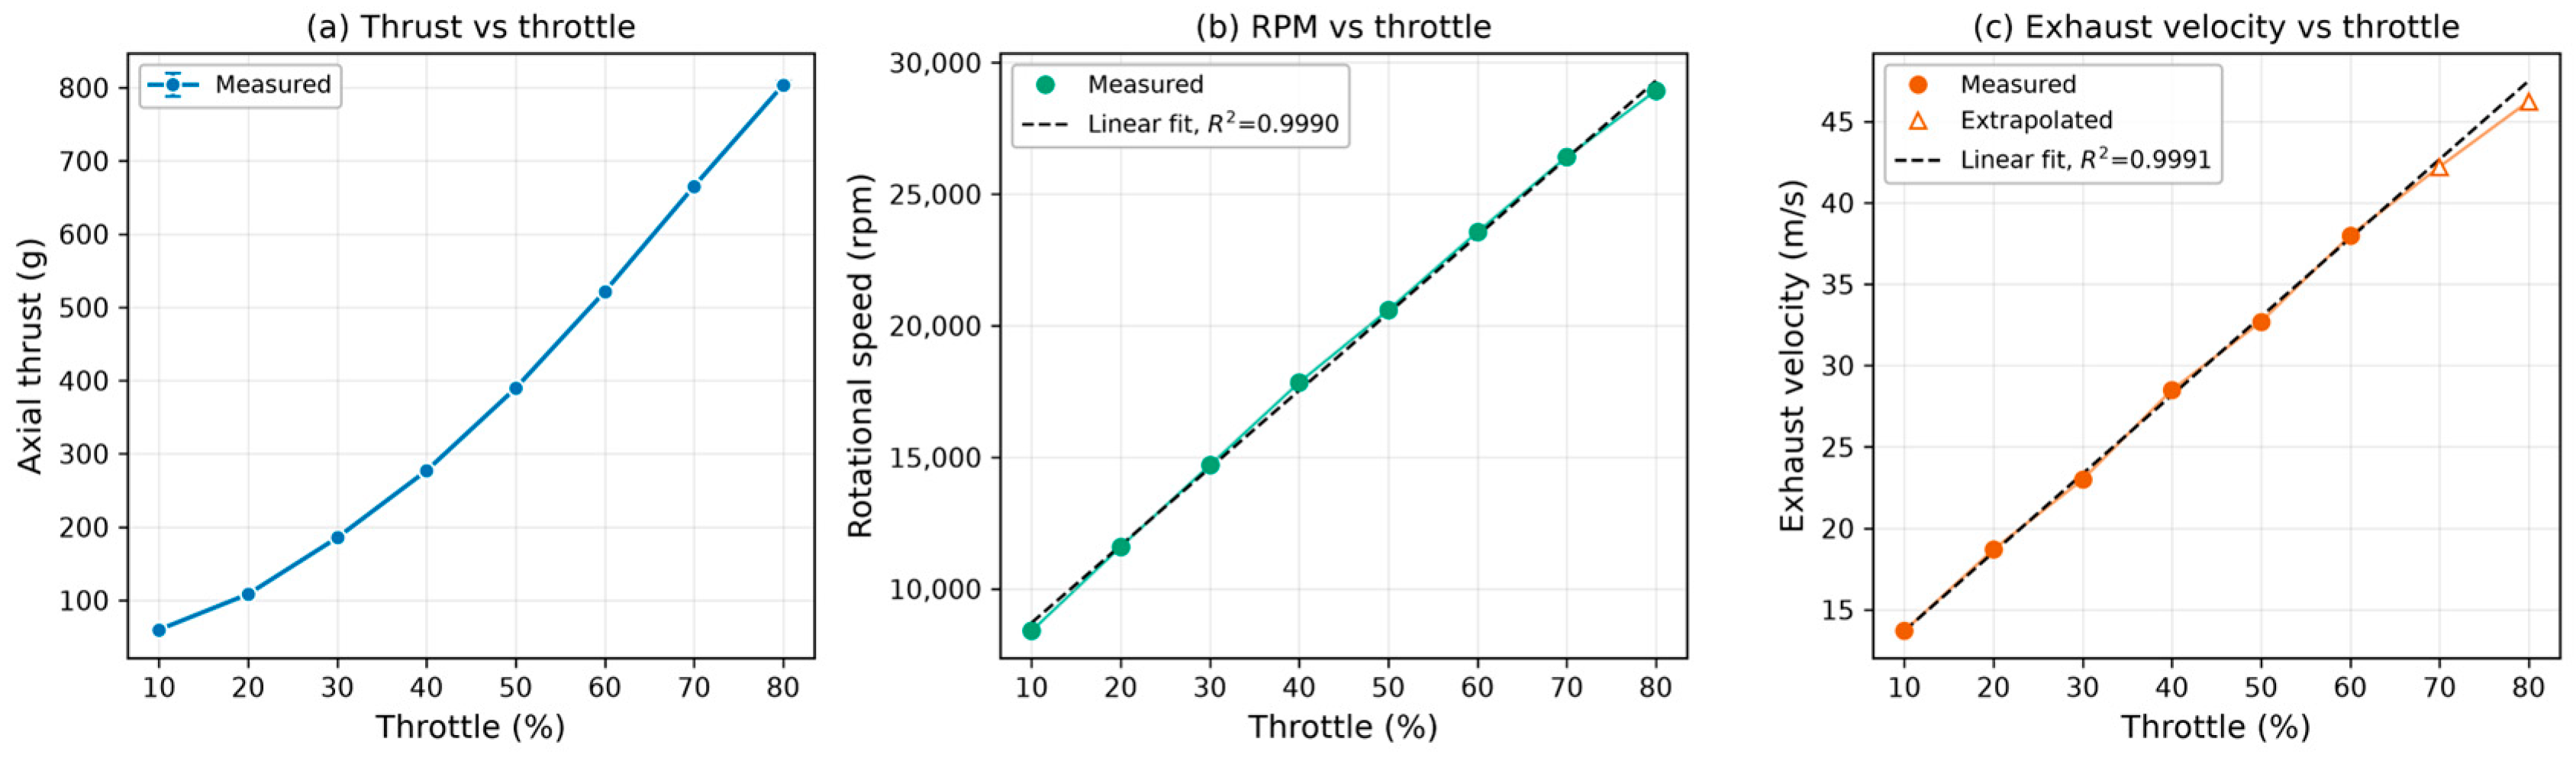
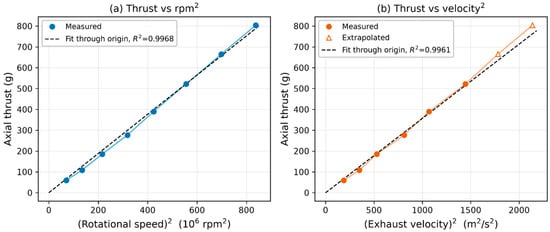
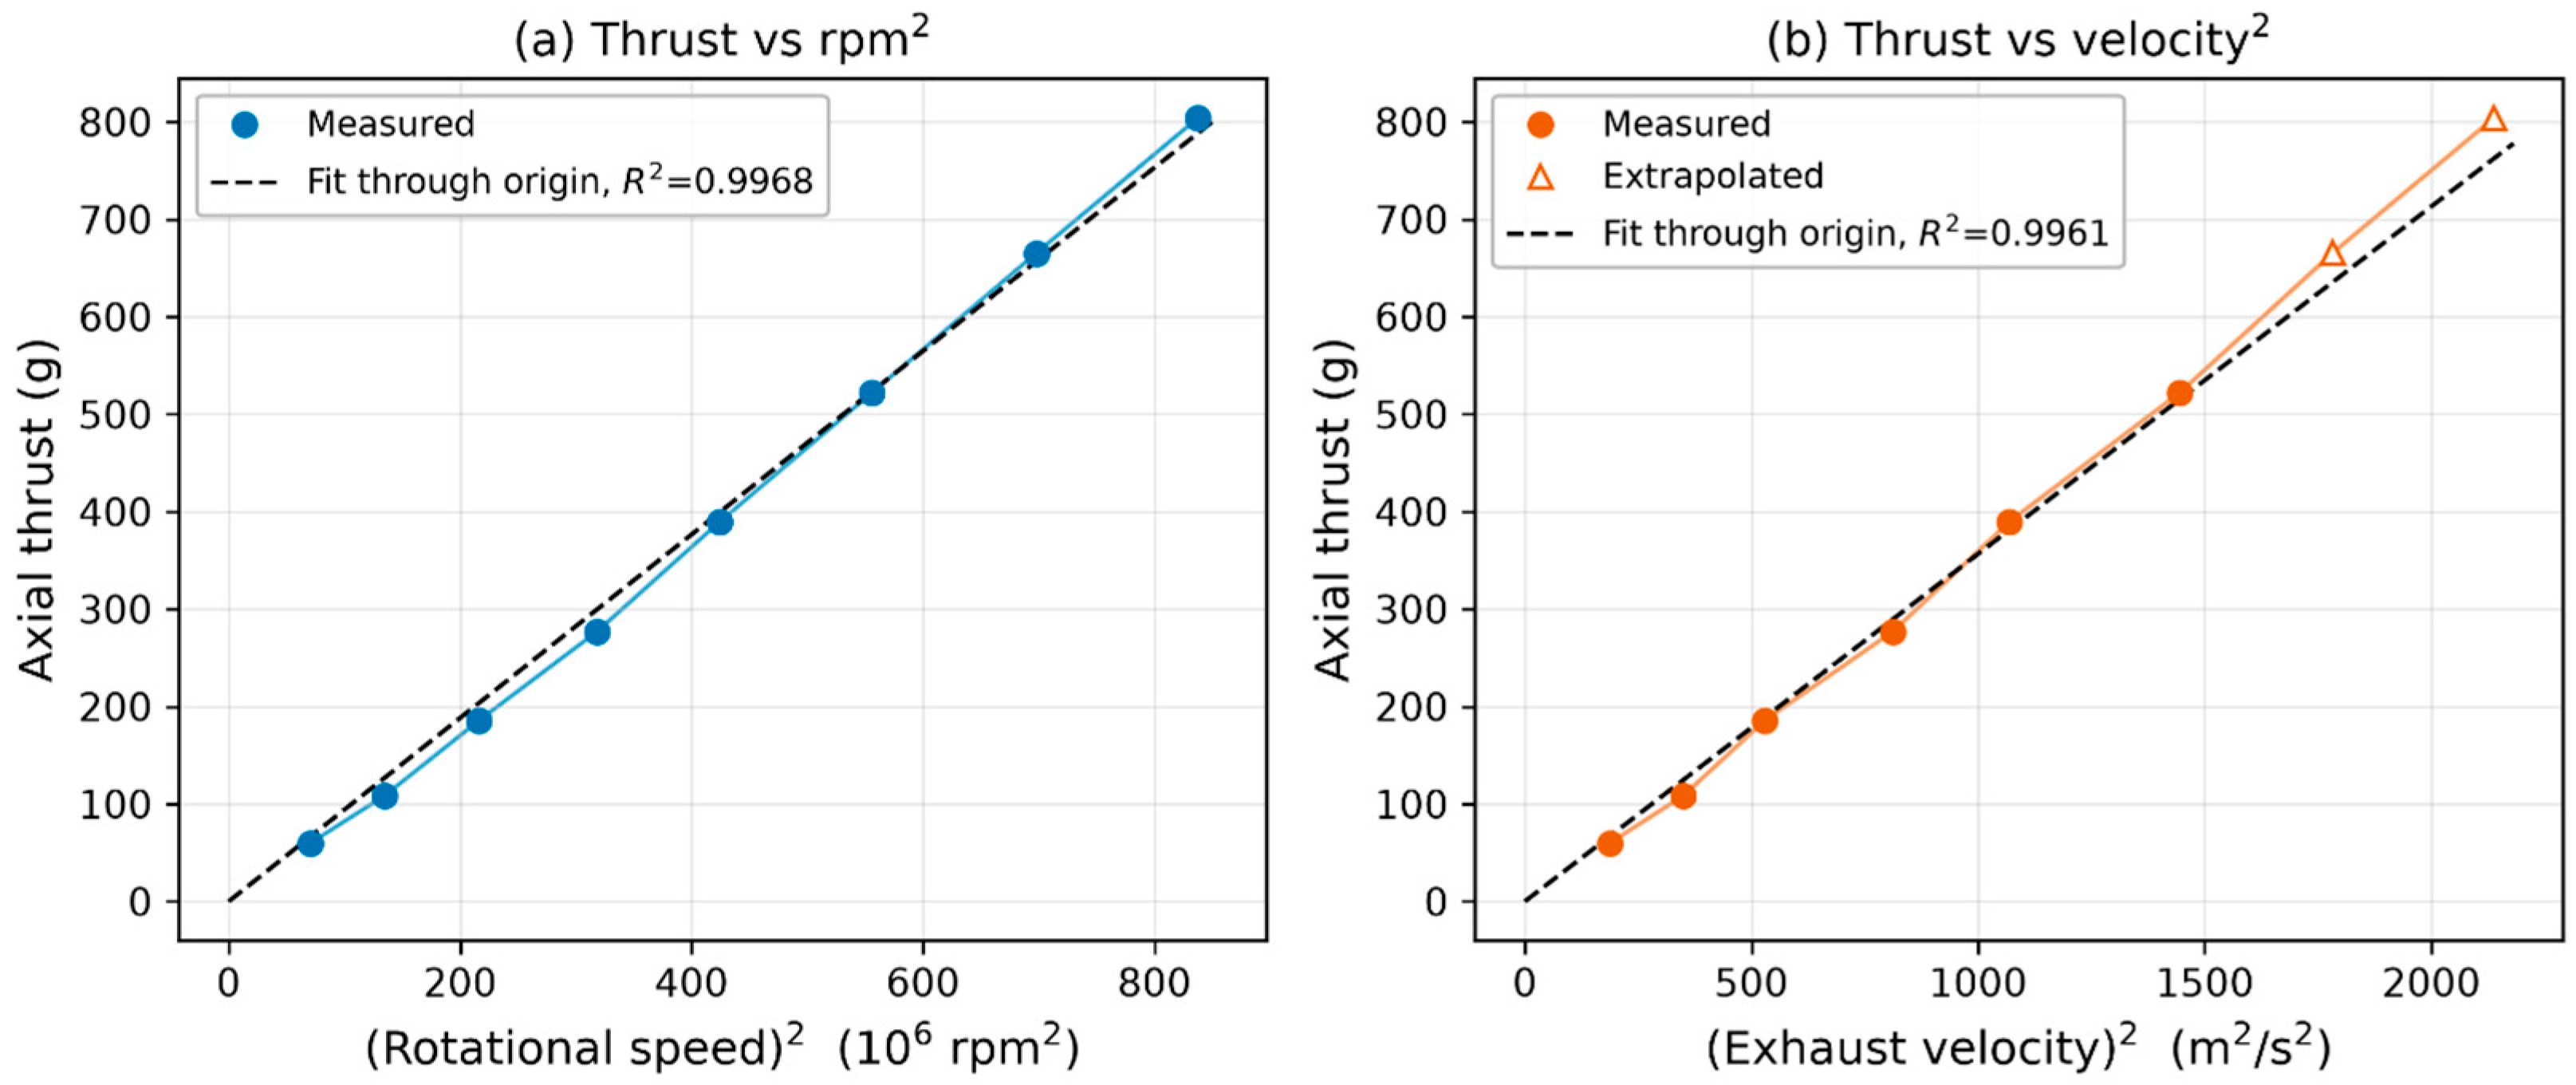
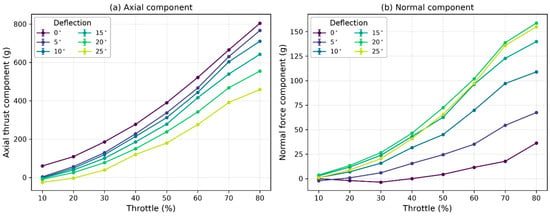
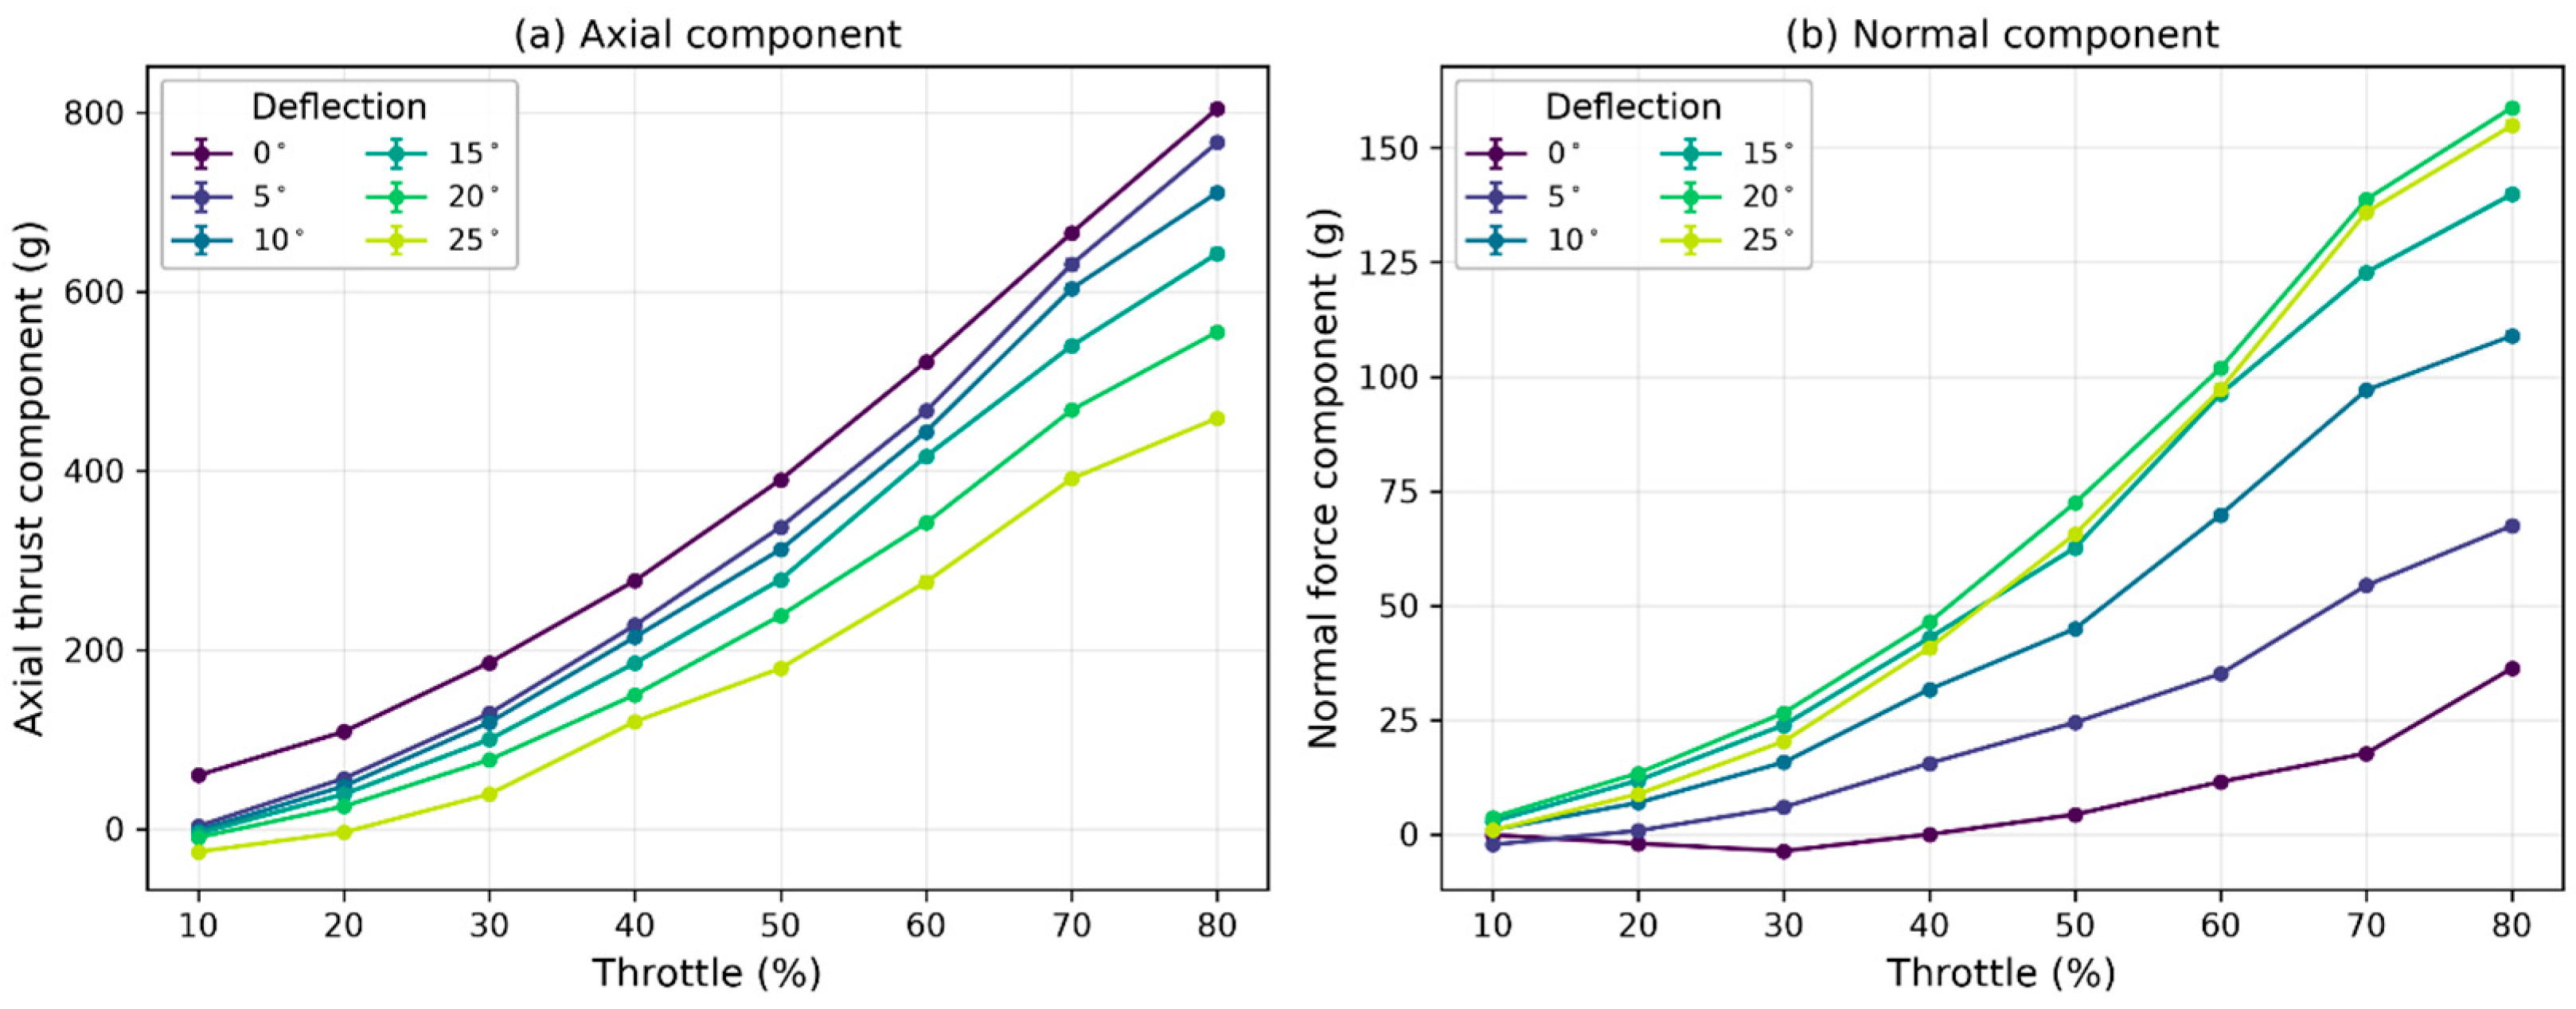
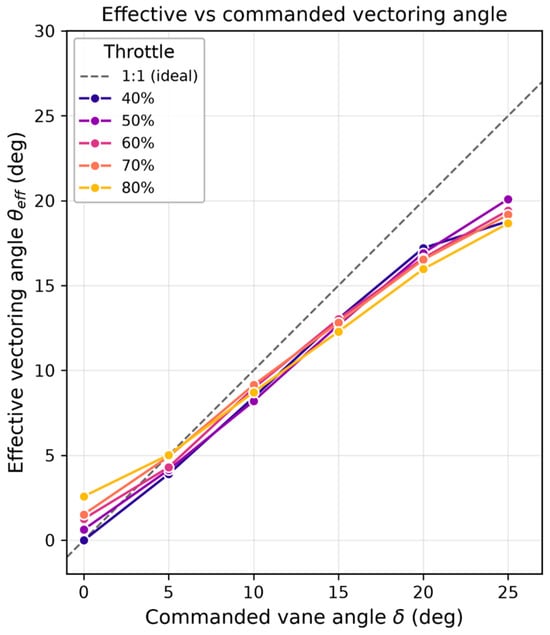
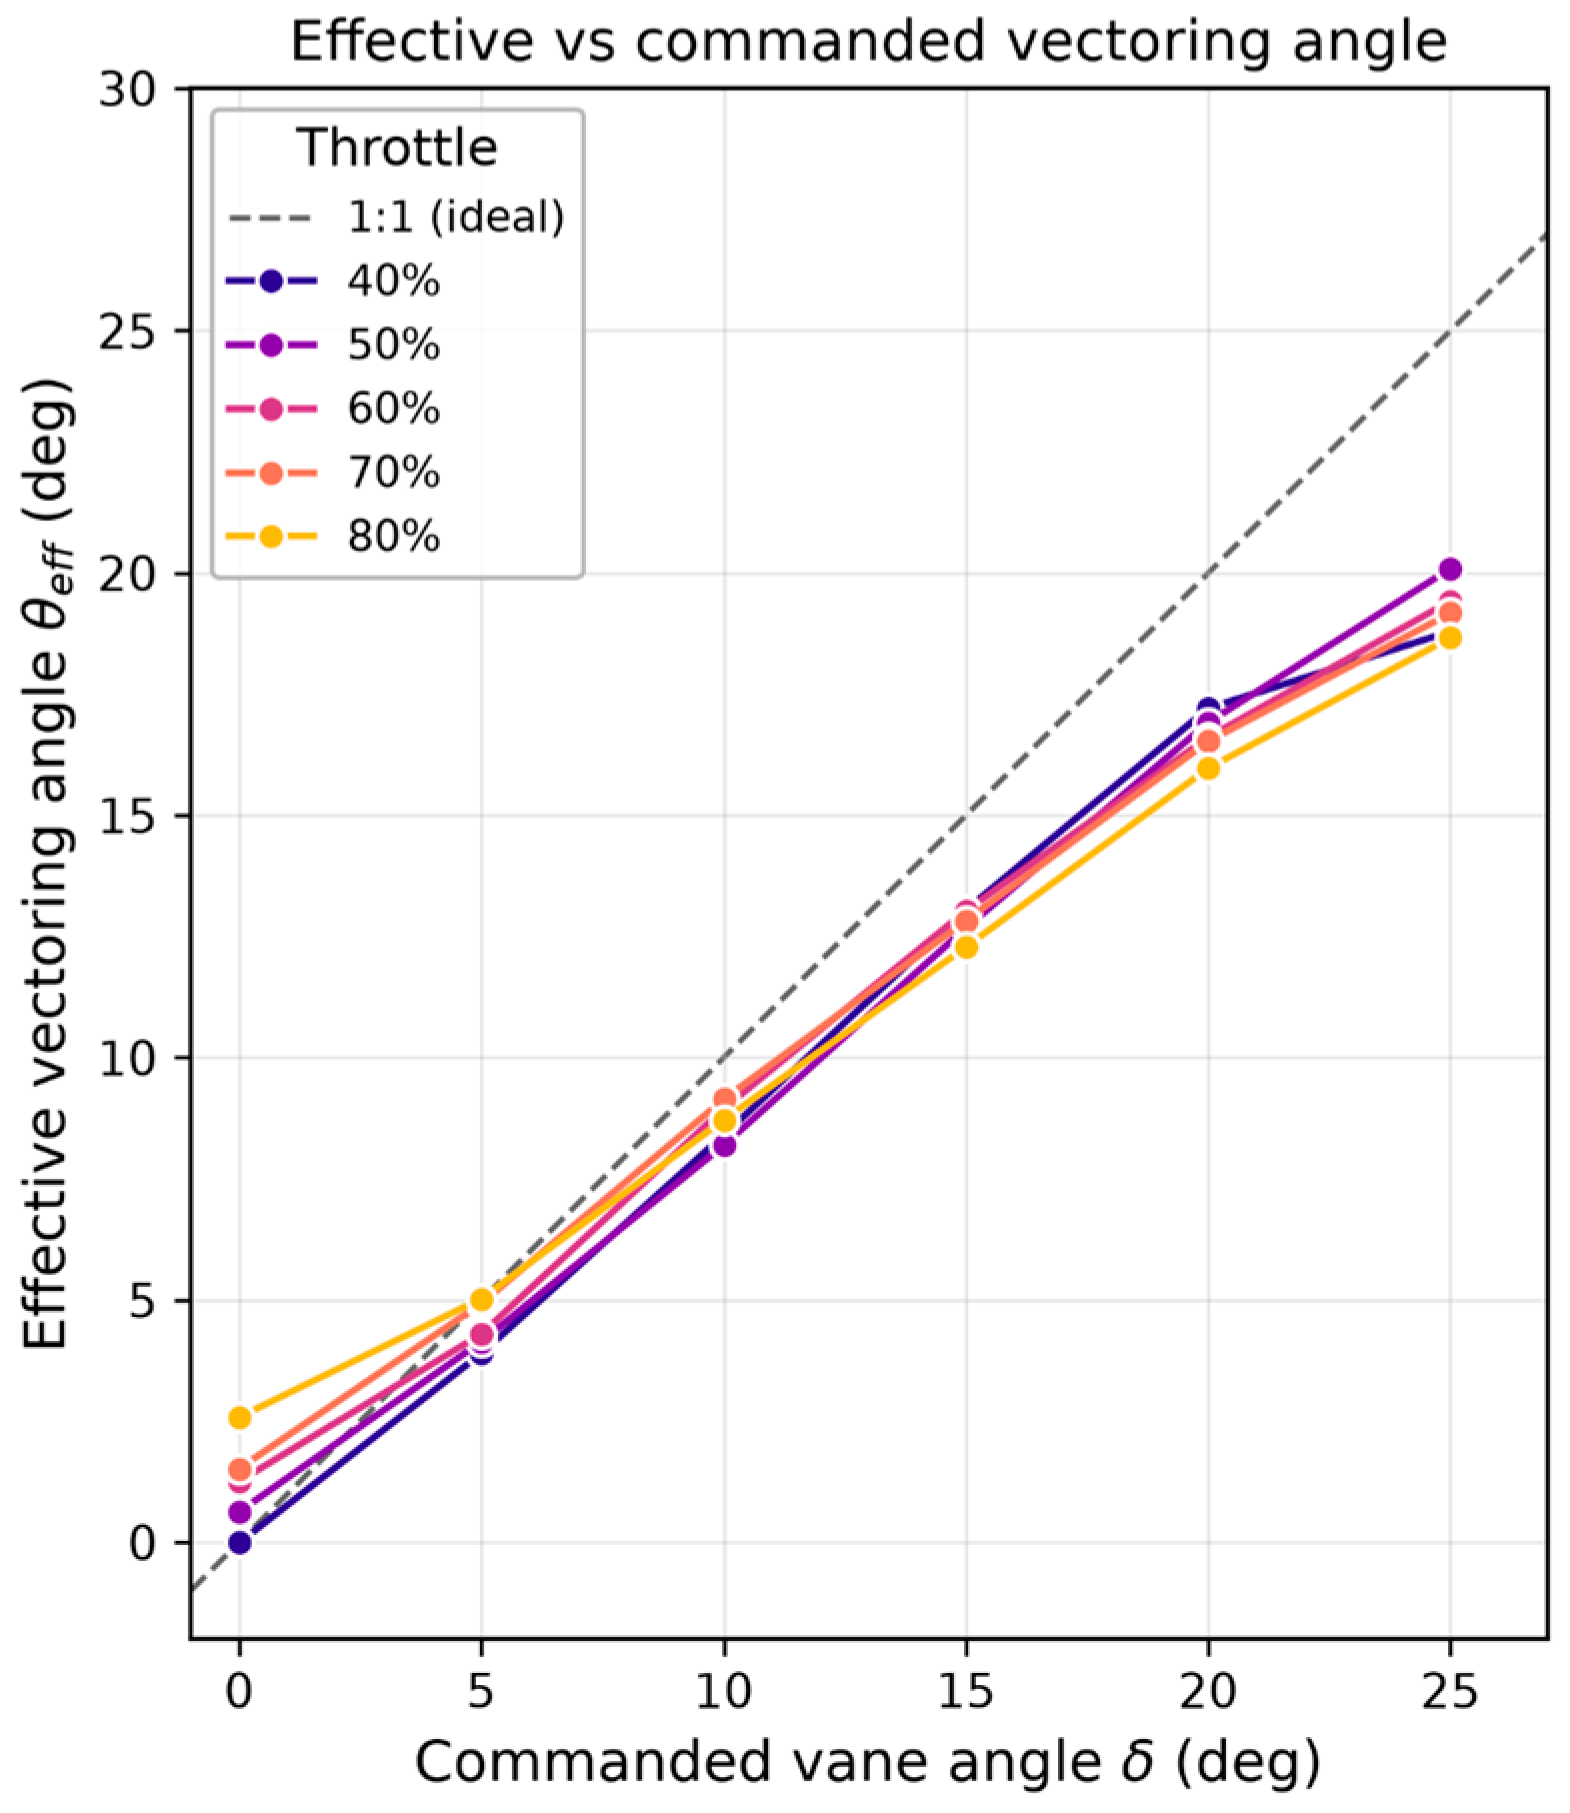
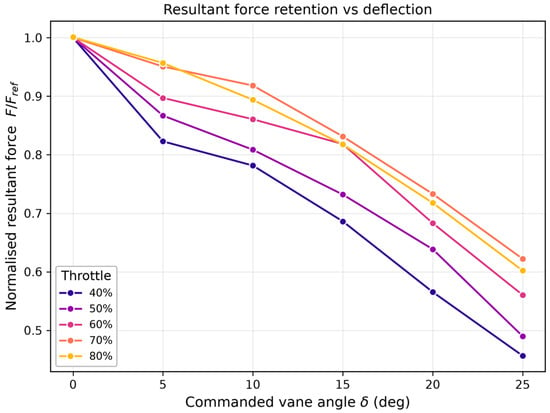
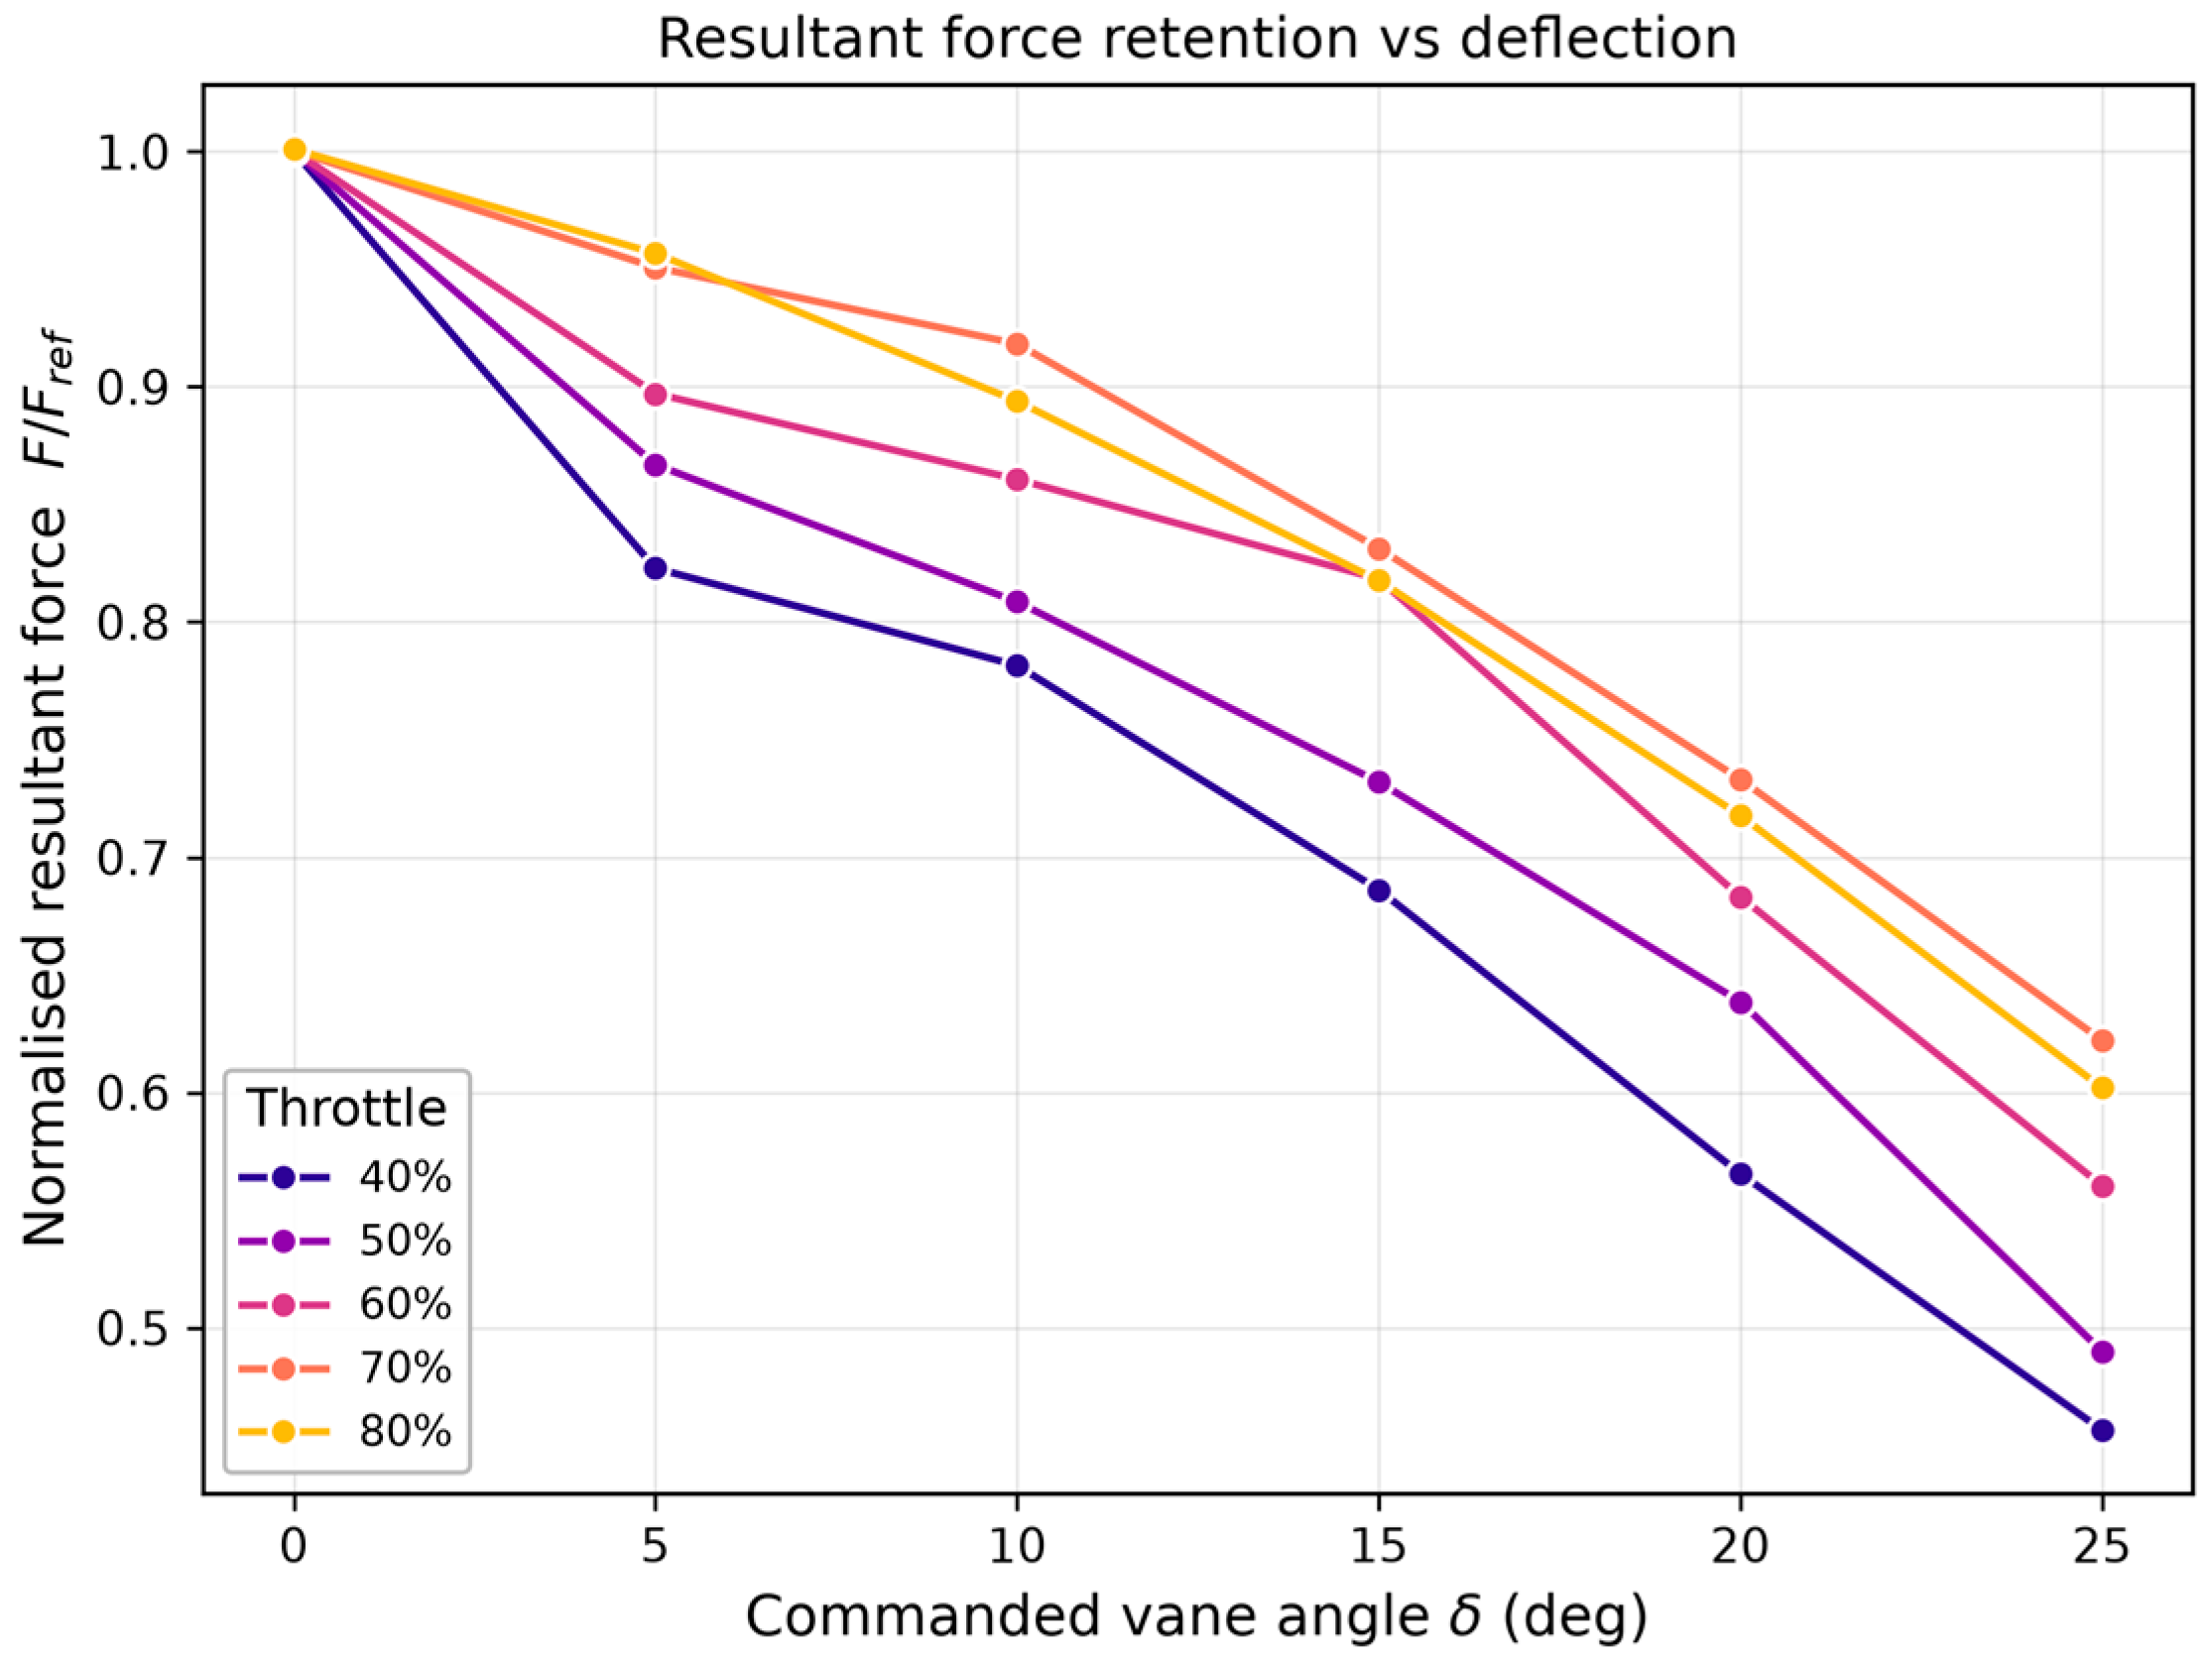
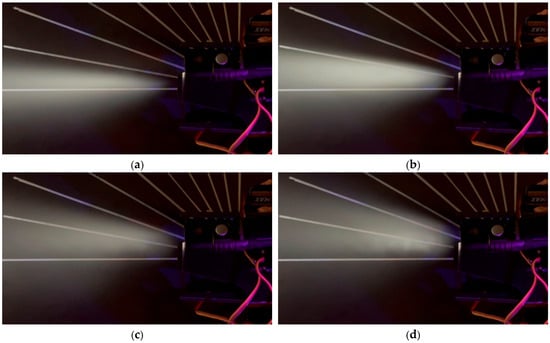
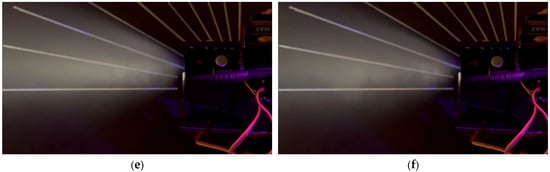
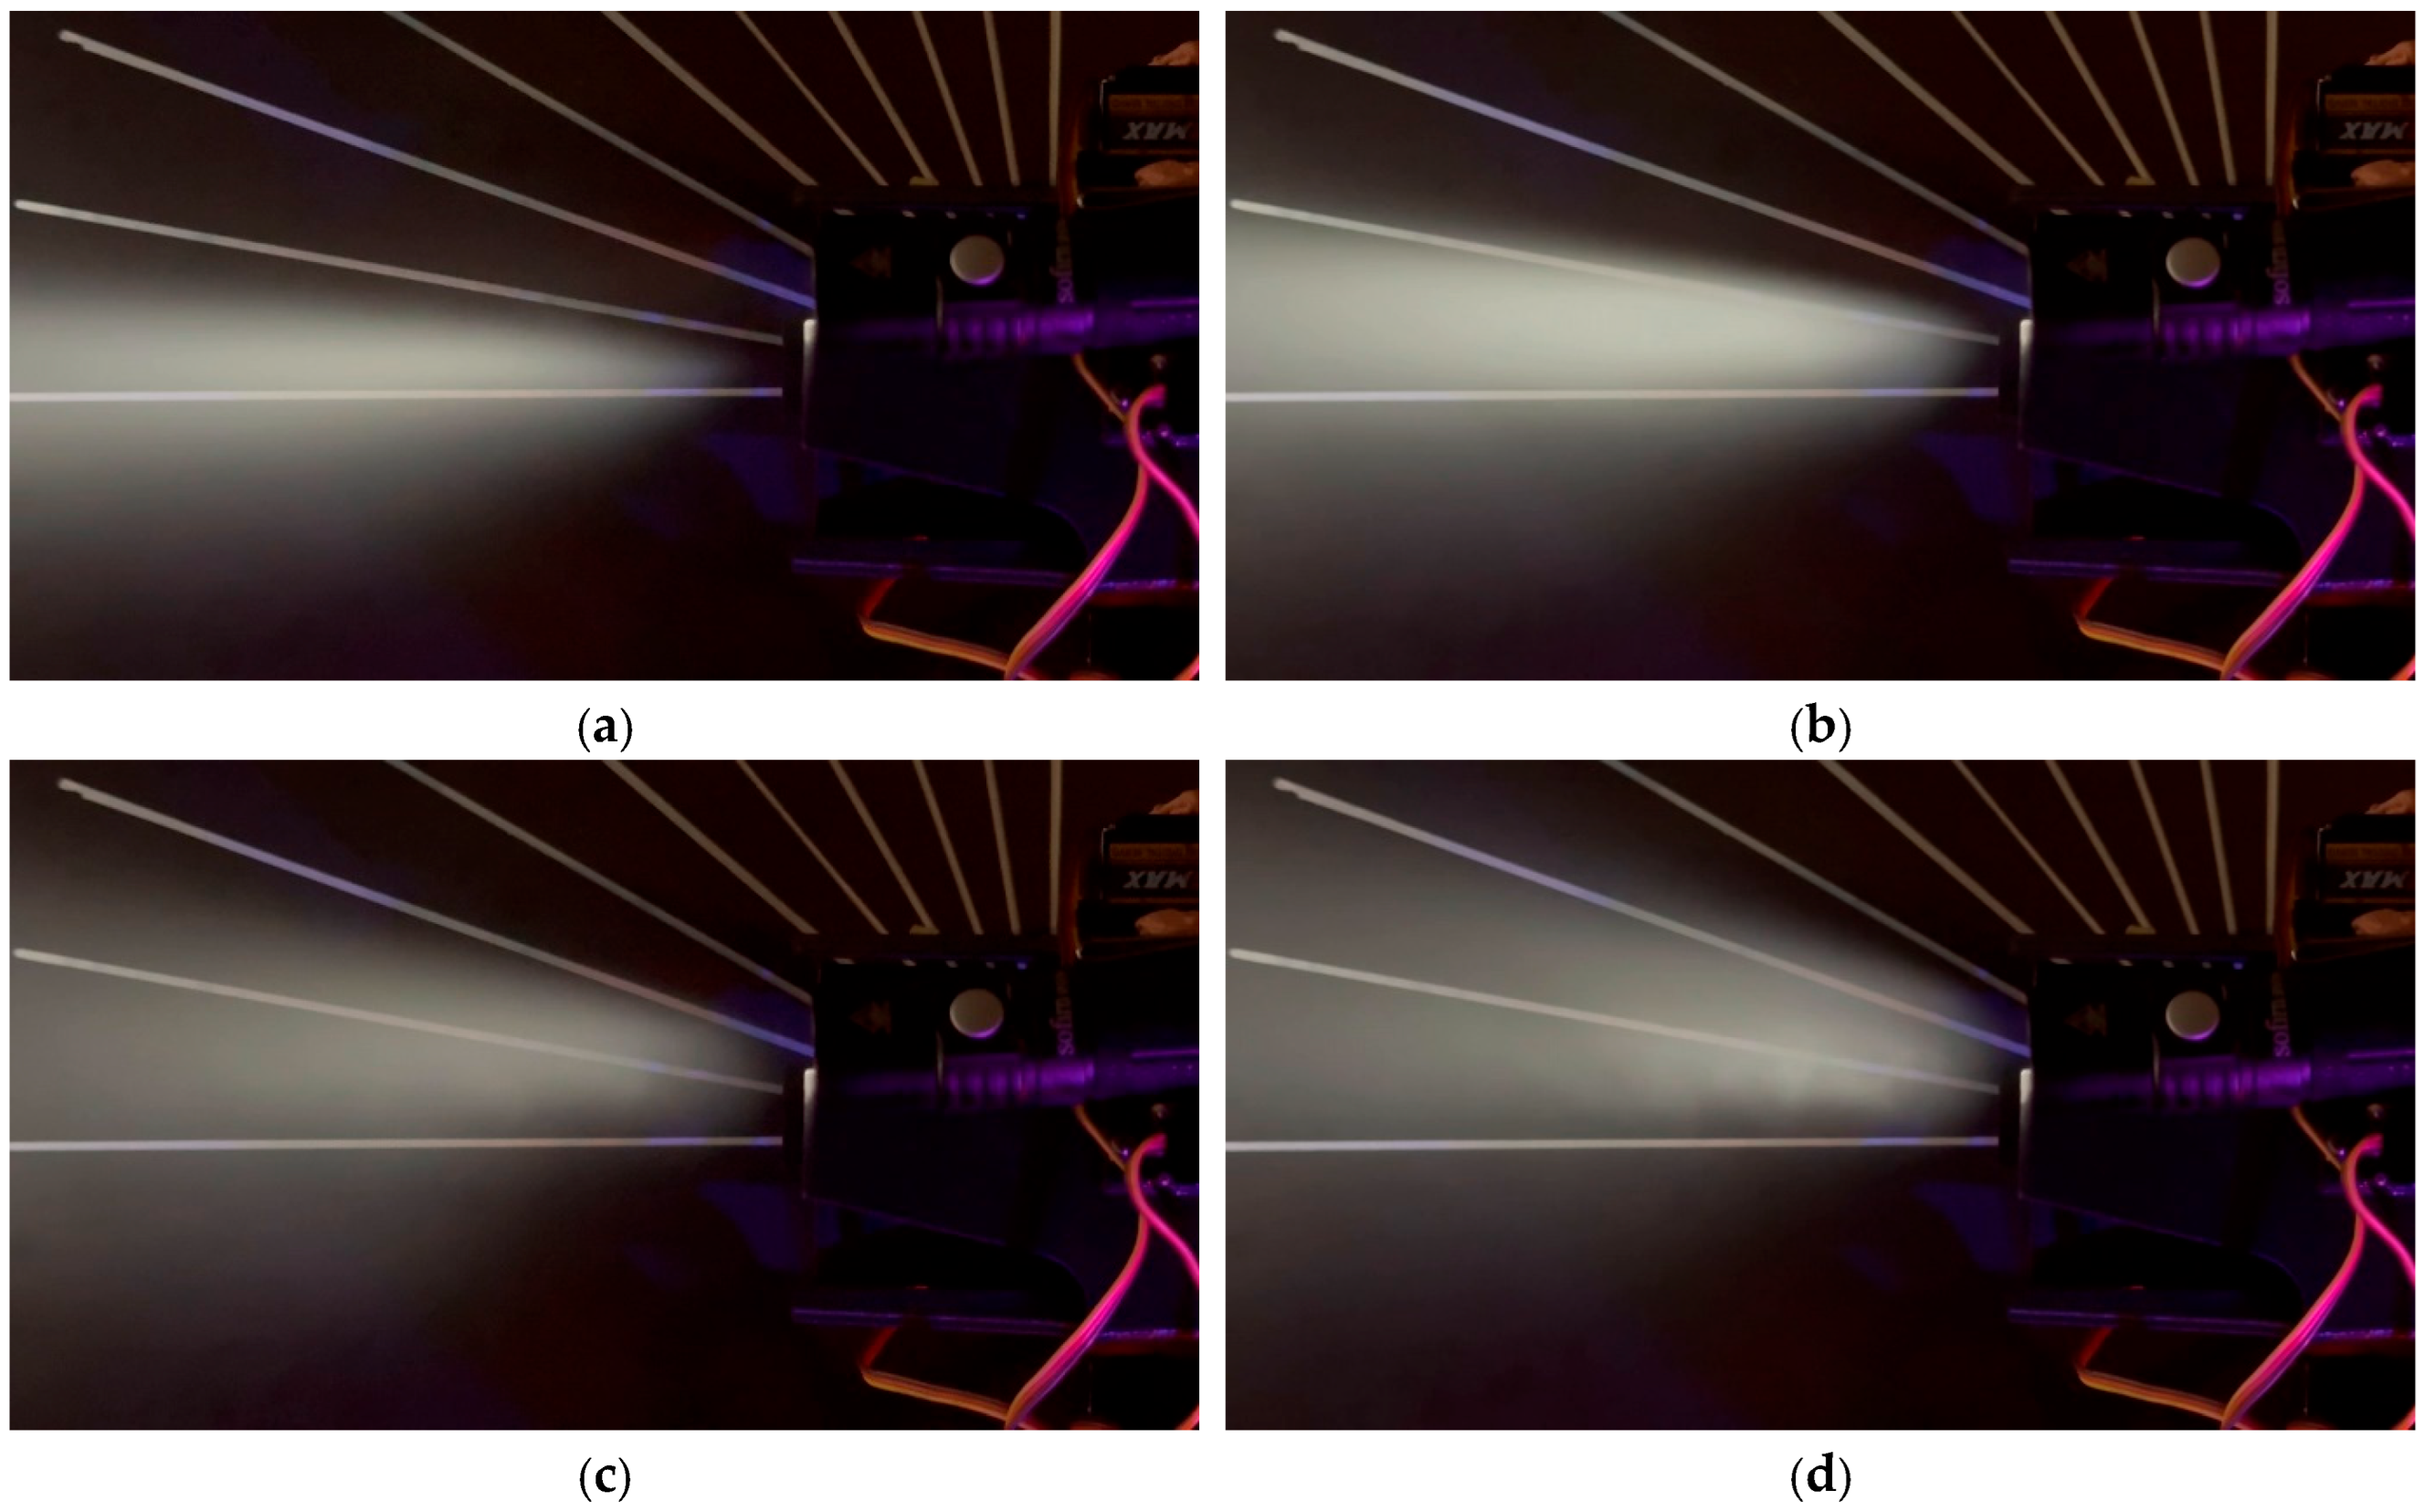
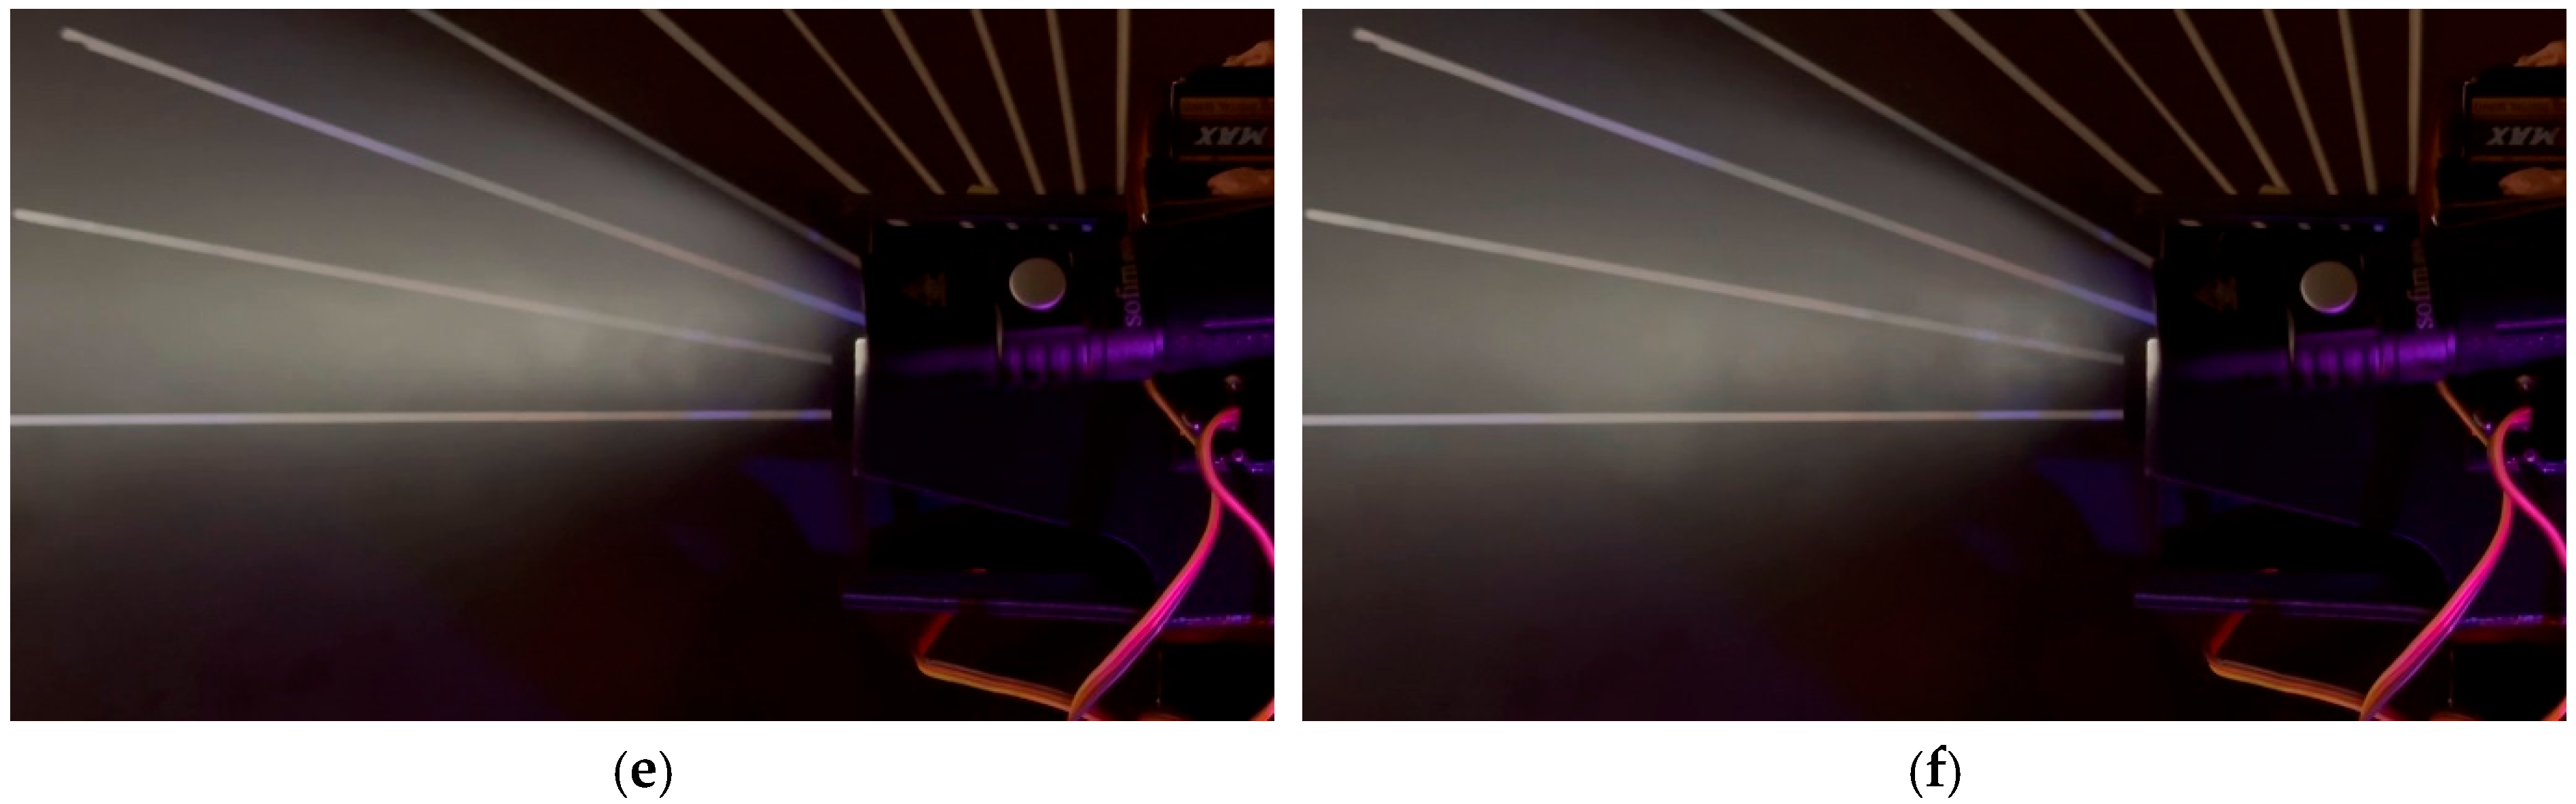

Disclaimer/Publisher’s Note: The statements, opinions and data contained in all publications are solely those of the individual author(s) and contributor(s) and not of MDPI and/or the editor(s). MDPI and/or the editor(s) disclaim responsibility for any injury to people or property resulting from any ideas, methods, instructions or products referred to in the content. |
© 2026 by the authors. Licensee MDPI, Basel, Switzerland. This article is an open access article distributed under the terms and conditions of the Creative Commons Attribution (CC BY) license.