Next Issue
Volume 6, June
Previous Issue
Volume 5, December


Climate, Volume 6, Issue 1 (March 2018) – 18 articles

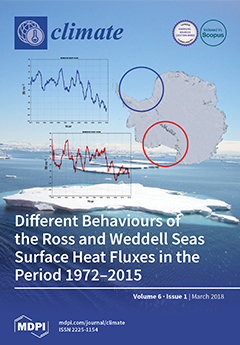
Cover Story (view full-size image): The surface heat fluxes at the atmosphere-ice-ocean interface over the Ross and Weddell Seas (Antarctica) moved from opposite to synchronous during the period 1972-2015. An attempt was made to link these results to the signature of global climate variability through the wavelet analysis of SOI and SAMi in order to suggest a hypothetical mechanism of interaction. The synchronous behavior, observed since 2001, coincided with a change in the energy peak associated to the time scale of the SAM variability, which moved from 32 to 64 months. This change generated a common energy peak for the SAM and ENSO with a lagged in phase relationship between the signals, which possibly influenced the surface heat fluxes variability over both areas. These evidences suggest a change in the dominant mode of variability over the Southern Hemisphere. View this paper
  • Issues are regarded as officially published after their release is announced to the table of contents alert mailing list.
  • You may sign up for e-mail alerts to receive table of contents of newly released issues.
  • PDF is the official format for papers published in both, html and pdf forms. To view the papers in pdf format, click on the "PDF Full-text" link, and use the free Adobe Reader to open them.
Order results
Result details
Section
Select all
Export citation of selected articles as:
26 pages, 7774 KiB  
Article
Assessment and Mitigation Strategies to Counteract Overheating in Urban Historical Areas in Rome
by Flavia Laureti, Letizia Martinelli and Alessandra Battisti
Climate 2018, 6(1), 18; https://doi.org/10.3390/cli6010018 - 18 Mar 2018
Cited by 22 | Viewed by 5799
Abstract
As urban overheating is increasing, there is a strong public interest towards mitigation strategies to enhance comfortable urban spaces, for their role in supporting urban metabolism and social life. The study presents an assessment of the existing thermal comfort and usage of San [...] Read more.
As urban overheating is increasing, there is a strong public interest towards mitigation strategies to enhance comfortable urban spaces, for their role in supporting urban metabolism and social life. The study presents an assessment of the existing thermal comfort and usage of San Silvestro Square in Rome during the summer, and performs the simulation of cooling strategies scenarios, to understand their mitigation potential for renovation projects. The first stage concerns a field analysis of the thermal and radiative environment on the 1st and 2nd of August 2014, including meteorological measurements and unobtrusive observations, to understand how people experience and respond to extreme microclimate conditions. In the second stage, the research proposes scenario simulations on the same day to examine the influence of cool colored materials, trees and vegetative surfaces on thermal comfort. The thermal comfort assessment was based on Physiologically Equivalent Temperature (PET), whereas microclimatic simulations were conducted with CFD calculations (ENVImet v.4.3.1). The first stage shows a strong relationship between lower PET values and attendance rate, depending on daily shading patterns. The second stage shows a relevant improvement of thermal comfort, with PET values of −12 °C comparing to the no-intervention scenario, associated with a combination of cool materials and trees. Full article
Show Figures

Figure 1

12 pages, 1833 KiB  
Article
Different Behaviours of the Ross and Weddell Seas Surface Heat Fluxes in the Period 1972–2015
by Giannetta Fusco, Yuri Cotroneo and Giuseppe Aulicino
Climate 2018, 6(1), 17; https://doi.org/10.3390/cli6010017 - 14 Mar 2018
Cited by 8 | Viewed by 4751
Abstract
Operational analyses and re-analyses, provided by ECMWF for the period 1972–2015, were used to investigate the behaviour of the surface heat fluxes between ocean and atmosphere, estimated via empirical formulae, over the Ross and Weddell Seas. The presence and thickness of sea ice [...] Read more.
Operational analyses and re-analyses, provided by ECMWF for the period 1972–2015, were used to investigate the behaviour of the surface heat fluxes between ocean and atmosphere, estimated via empirical formulae, over the Ross and Weddell Seas. The presence and thickness of sea ice cover, which strongly affects ocean-atmosphere interactions, was estimated through Special Sensor Microwave Imager and Special Sensor Microwave Imager Sounder brightness temperatures. Because of the lack of ice information before 1992, daily averaged ice and snow thickness obtained from the 1992–2012 dataset has been used as a ‘climatological year’ for the 1972–2015 period. The heat loss in the Ross Sea reached its maximum in 2008 (−98 W∙m−2) and its minimum (−58 W∙m−2) in 1980, while in the Weddell Sea, it ranged between −65 W∙m−2 (1999) and −99 W∙m−2 (2015). Results showed that the surface heat fluxes behaviour in the two seas moved from opposite to synchronous during the study period. The wavelet analysis was applied to evaluate if this result might be linked to the signature of global climate variability expressed by El Niño Southern Oscillation (ENSO) and Southern Annular Mode (SAM). The synchronous behaviour of the surface heat fluxes in the Ross and Weddell seas, observed since 2001, coincides with a change in the energy peak associated to the time scale of the SAM variability, which moved from 32 to 64 months during 1990s. This change generates a common energy peak for the SAM and ENSO with a lagged in phase relationship between the signals, possibly influencing the behaviour of the surface heat fluxes. Full article
(This article belongs to the Special Issue Decadal Variability and Predictability of Climate)
Show Figures

Figure 1

12 pages, 3689 KiB  
Article
Recognition of Thermal Hot and Cold Spots in Urban Areas in Support of Mitigation Plans to Counteract Overheating: Application for Athens
by Thaleia Mavrakou, Anastasios Polydoros, Constantinos Cartalis and Mat Santamouris
Climate 2018, 6(1), 16; https://doi.org/10.3390/cli6010016 - 9 Mar 2018
Cited by 83 | Viewed by 6100
Abstract
Mitigation plans to counteract overheating in urban areas need to be based on a thorough knowledge of the state of the thermal environment, most importantly on the presence of areas which consistently demonstrate higher or lower urban land surface temperatures (hereinafter referred to [...] Read more.
Mitigation plans to counteract overheating in urban areas need to be based on a thorough knowledge of the state of the thermal environment, most importantly on the presence of areas which consistently demonstrate higher or lower urban land surface temperatures (hereinafter referred to as “hot spots” or “cold spots”, respectively). The main objective of this research study is to develop a methodological approach for the recognition of thermal “hot spots” and “cold spots” in urban areas during summer; this is accomplished with (a) the combined use of high and medium spatial resolution satellite data (Landsat 8 and Terra-MODIS, respectively); (b) the downscaling of the Terra-MODIS satellite data so as to acquire spatial resolution similar to the Landsat one and at the same time take advantage of the high revisit time as compared to the respective one of Landsat (16 days); and (c) the application of a statistical clustering technique to recognize “hot spots” and “cold spots”. The methodological approach was applied as a case study for the urban area of Athens, Greece for a summer period. Results demonstrated the capacity of the methodological approach to recognize “hot spots” and “cold spots”, revealed a strong relationship between land use and “hot spots” and “cold spots”, and showed that the average land surface temperature (LST) difference between the “hot spots” and “cold spots” can reach 9.1 °K. Full article
Show Figures

Figure 1

10 pages, 396 KiB  
Article
Shifting Hardiness Zones: Trends in Annual Minimum Temperature
by Nir Y. Krakauer
Climate 2018, 6(1), 15; https://doi.org/10.3390/cli6010015 - 9 Mar 2018
Cited by 9 | Viewed by 5923
Abstract
Work published in 2012 revealed that annual minimum temperatures over the coterminous United States (USA) have increased faster than mean temperatures, causing a pronounced poleward shift in the positions of hardiness zones defined by the expected annual minimum temperature. Here, estimates of increases [...] Read more.
Work published in 2012 revealed that annual minimum temperatures over the coterminous United States (USA) have increased faster than mean temperatures, causing a pronounced poleward shift in the positions of hardiness zones defined by the expected annual minimum temperature. Here, estimates of increases in annual minimum temperatures are updated and extended to other land areas where station temperature records are available. Annual minimum temperatures have increased faster than mean temperatures in seasonally cold regions globally, but have warmed at about the same rate as mean temperatures in tropical climates. The mean increase in annual minimum temperature across the available weather stations was 2.0 °C between 1970 and 2016 (or almost 0.5 °C per decade), as compared to an increase of 1.2 °C in mean temperature. Recent cold winters in regions such as Eastern North America did not clearly break with this trend and were within the range of variability seen in past decades. Overall, annual minimum temperatures appear to be increasing steadily, though with considerable inter-annual variability. Full article
(This article belongs to the Special Issue Decadal Variability and Predictability of Climate)
Show Figures

Figure 1

4 pages, 173 KiB  
Editorial
Towards the Integrated Study of Urban Climate, Air Pollution, and Public Health
by Jennifer Salmond, Clive E. Sabel and Sotiris Vardoulakis
Climate 2018, 6(1), 14; https://doi.org/10.3390/cli6010014 - 26 Feb 2018
Cited by 14 | Viewed by 5516
Abstract
Globally, cities are growing at an unprecedented pace, putting pressure on space, existing infrastructure, and resources.[...] Full article
(This article belongs to the Special Issue Urban Climate, Air Pollution, and Public Health)
16 pages, 5505 KiB  
Article
Closing the Gap between Climate Information Producers and Users: Assessment of Needs and Uptake in Senegal
by Issa Ouedraogo, Ndeye Seynabou Diouf, Mathieu Ouédraogo, Ousmane Ndiaye and Robert B. Zougmoré
Climate 2018, 6(1), 13; https://doi.org/10.3390/cli6010013 - 19 Feb 2018
Cited by 58 | Viewed by 9651
Abstract
West Africa is a very vulnerable part of the world to the impacts of climate change due to a combination of exposure and low adaptive capacity. Climate change has induced an increase in rainfall variability which in turn has affected the availability of [...] Read more.
West Africa is a very vulnerable part of the world to the impacts of climate change due to a combination of exposure and low adaptive capacity. Climate change has induced an increase in rainfall variability which in turn has affected the availability of water resources, ecosystem services and agricultural production. To adapt to the increased aridity, farmers have used indigenous and modern coping strategies such as soil and water conservation techniques, the use of drought-tolerant crops and varieties, crop diversification, etc., and lately, climate information services (CIS). The latter, according to the discourses, has positively contributed to suitable decision-making in terms of farming, pastoral and fishing management systems. However, the scientific documentation of the engagement approaches, the uptake of the CIS and the ways the delivered information is being used, as well as feedback from the users, is lacking. Additionally, in most of the cases where CIS are introduced, the disconnect between the users and producers of the CIS seems to undercut large-scale uptake. The objective of this paper is to examine the approach used to involve stakeholders in the CIS uptake process in Senegal. We analyzed the experiences and lessons learnt in the country where various CIS products were introduced using participatory methods (stakeholder consultations, interviews, field demonstrations, training workshops, etc.) and innovative stressors (SMS, voice messages, radios, mobile applications, etc.) to effectively involve producers, technicians and policy-makers. Results showed that 16 relevant CIS have been produced out of 27 identified by the various users; 11 CIS diffusion channels have been developed out of 13 requested; 27 climate advisory bodies (MWGs) have been created in 27 districts out of 30 districts in the study zone; about 6800 users have been trained directly and indirectly to effectively use CIS and about 8500 people are receiving CIS via SMS, voice messaging and emails. The opportunities for CIS uptake as well as the challenges that may impede the long-term sustainability of CIS upscaling in the country are highlighted. Recommendations that will improve and sustain the governance system of CIS in Senegal and the rest of West Africa include the involvement of private sectors in the chain of production, delivery and training, and the inciting of producers to largely subscribe to the weather-based index insurance. Full article
(This article belongs to the Special Issue Climate Services for Local Disaster Risk Reduction in Africa)
Show Figures

Figure 1

21 pages, 3040 KiB  
Article
The Solar Reflectance Index as a Tool to Forecast the Heat Released to the Urban Environment: Potentiality and Assessment Issues
by Alberto Muscio
Climate 2018, 6(1), 12; https://doi.org/10.3390/cli6010012 - 15 Feb 2018
Cited by 40 | Viewed by 10326
Abstract
Overheating of buildings and urban areas is a more and more severe issue in view of global warming combined with increasing urbanization. The thermal behavior of urban surfaces in the hot seasons is the result of a complex balance of construction and environmental [...] Read more.
Overheating of buildings and urban areas is a more and more severe issue in view of global warming combined with increasing urbanization. The thermal behavior of urban surfaces in the hot seasons is the result of a complex balance of construction and environmental parameters such as insulation level, thermal mass, shielding, and solar reflective capability on one side, and ambient conditions on the other side. Regulations makers and the construction industry have favored the use of parameters that allow the forecasting of the interaction between different material properties without the need for complex analyses. Among these, the solar reflectance index (SRI) takes into account solar reflectance and thermal emittance to predict the thermal behavior of a surface subjected to solar radiation through a physically rigorous mathematical procedure that considers assigned air and sky temperatures, peak solar irradiance, and wind velocity. The correlation of SRI with the heat released to the urban environment is analyzed in this paper, as well as the sensitivity of its calculation procedure to variation of the input parameters, as possibly induced by the measurement methods used or by the material ageing. Full article
Show Figures

Figure 1

18 pages, 1353 KiB  
Review
A Conceptual Framework for Vulnerability Assessment of Climate Change Impact on Critical Oil and Gas Infrastructure in the Niger Delta
by Justin Udie, Subhes Bhattacharyya and Leticia Ozawa-Meida
Climate 2018, 6(1), 11; https://doi.org/10.3390/cli6010011 - 12 Feb 2018
Cited by 14 | Viewed by 9493
Abstract
The impact of climate change on the Niger Delta is severe, as extreme weather events have inflicted various degrees of stress on critical oil/gas infrastructure. Typically, assets managers and government agencies lack a clear framework for evaluating the vulnerability of these systems. This [...] Read more.
The impact of climate change on the Niger Delta is severe, as extreme weather events have inflicted various degrees of stress on critical oil/gas infrastructure. Typically, assets managers and government agencies lack a clear framework for evaluating the vulnerability of these systems. This paper presents a participatory framework for the vulnerability assessment of critical oil/gas infrastructure to climate change impacts in the Niger Delta context. Through a critical review of relevant literature and triangulating observational and exploratory data from the field, this paper has developed a conceptual framework with three elements: (1) a preliminary scoping activity; (2) the vulnerability assessment; and (3) mainstreaming the results into institutional asset management codes. Scoping involves the definition of research aims and objectives, review of prevailing climate burdens and impacts, exploratory investigation, screening for new (planned) assets and selection of relevant infrastructure. The emphasis on screening for planned infrastructure is to facilitate the incorporation of sustainable adaptive capacities into the original design of identified systems. A conceptual framework for vulnerability assessment is presented as a robust systematic iterative model for the evaluation of selected assets using an appropriate methodology. In this study, analytic hierarchy process (AHP) is applied while mainstreaming as part of the research framework is emphasised to aid commercial implementation from an expert-based perspective. The study recommends the use of other suitable methodologies and systematic approaches to test the flexibility of the framework. Full article
(This article belongs to the Special Issue Social-Ecological Systems, Climate and Global Change Impacts)
Show Figures

Figure 1

15 pages, 831 KiB  
Article
How to Design a Park and Its Surrounding Urban Morphology to Optimize the Spreading of Cool Air?
by Jérémy Bernard, Auline Rodler, Benjamin Morille and Xueyao Zhang
Climate 2018, 6(1), 10; https://doi.org/10.3390/cli6010010 - 6 Feb 2018
Cited by 31 | Viewed by 5900
Abstract
Green areas induce smaller increases in the air temperature than built-up areas. They can offer a solution to mitigating the urban heat island impacts during heat waves, since the cool air generated by a park is diffused into its immediate surroundings through forced [...] Read more.
Green areas induce smaller increases in the air temperature than built-up areas. They can offer a solution to mitigating the urban heat island impacts during heat waves, since the cool air generated by a park is diffused into its immediate surroundings through forced or natural convection. The purpose of this study is to characterize the effect of several variables (park size, morphology of surrounding urban area, and wind speed) on the spreading of cool air. A parametric study is performed to run computational fluid dynamics simulations. The air temperature entering the computational domain was set at 35 °C, and the 2-m high surface included within the 34 °C isotherm was defined as an indicator of cool air spreading. The effects of park shape and orientation were negligible in comparison with size effects. The number of buildings was better correlated with the cooled surface area than the typical urban parameters identified in the literature (i.e., building density, aspect ratio, or mean building height). Since the number of buildings is obviously related to the number of streets, this result suggests that the greater the number of streets around a park, the wider the area that cool air spreads. Full article
Show Figures

Figure 1

16 pages, 1582 KiB  
Article
Best-Fit Probability Distributions and Return Periods for Maximum Monthly Rainfall in Bangladesh
by Md Ashraful Alam, Kazuo Emura, Craig Farnham and Jihui Yuan
Climate 2018, 6(1), 9; https://doi.org/10.3390/cli6010009 - 31 Jan 2018
Cited by 116 | Viewed by 10935
Abstract
The study of frequency analysis is important to find the most suitable model that could anticipate extreme events of certain natural phenomena e.g., rainfall, floods, etc. The goal of this study is to determine the best-fit probability distributions in the case of maximum [...] Read more.
The study of frequency analysis is important to find the most suitable model that could anticipate extreme events of certain natural phenomena e.g., rainfall, floods, etc. The goal of this study is to determine the best-fit probability distributions in the case of maximum monthly rainfall using 30 years of data (1984–2013) from 35 locations in Bangladesh by using different statistical analysis and distribution types. Commonly used frequency distributions were applied. Parameters of these distributions were estimated by the method of moments and L-moments estimators. Three goodness-of-fit test statistics were applied. The best-fit result of each station was taken as the distribution with the lowest sum of the rank scores from each of the three test statistics. Generalized Extreme Value, Pearson type 3 and Log-Pearson type 3 distributions showed the largest number of best-fit results. Among the best score results, Generalized Extreme Value yielded the best-fit for 36% of the stations and Pearson type 3 and Log-Pearson type 3 each yielded the best-fit for 26% of the stations. The more practical result of this paper was that the 10-year, 25-year, 50-year and 100-year return periods of maximum monthly rainfall were calculated for all locations. The result of this study can be used to develop more accurate models of flooding risk and damage. Full article
Show Figures

Figure 1

19 pages, 2416 KiB  
Article
Trends of Climate Change in Saudi Arabia: Implications on Water Resources
by Qassem Y. Tarawneh and Shakhawat Chowdhury
Climate 2018, 6(1), 8; https://doi.org/10.3390/cli6010008 - 29 Jan 2018
Cited by 102 | Viewed by 18816
Abstract
Climate change is an important factor for sustainable water resource management in the arid and semi-arid countries. In this study, future trends of temperature and rainfall were assessed for several regions in Saudi Arabia. The linear and Mann–Kendall analyses showed an increase of [...] Read more.
Climate change is an important factor for sustainable water resource management in the arid and semi-arid countries. In this study, future trends of temperature and rainfall were assessed for several regions in Saudi Arabia. The linear and Mann–Kendall analyses showed an increase of temperature in all regions and decrease of rainfall in many regions. Following trend analysis, the outputs of the NCAR Community Climate System Model were obtained for three emission scenarios (high: representative concentration pathways RCP8.5; high medium: RCP6; and low: RCP2.6) for the assessment periods of 2025–2044, 2045–2064 and 2065–2084 respectively, and compared with the average values from the reference period (1986–2005). In all emission scenarios, temperature showed an increase from 1986 to 2005 in all regions. For RCP8.5, increase of temperature are in the ranges of 0.8–1.6 °C, 0.9–2.7 °C and 0.7–4.1 °C during 2025–2044, 2045–2064 and 2065–2084 respectively. However, rainfall showed variable patterns with respect to emission scenarios and assessment periods. In most regions, the RCP6 showed decrease in rainfall from the reference period while the RCP8.5 and RCP2.6 showed variable patterns. The increase of temperature and variable pattern of rainfall may increase uncertainty in developing sustainable water resource management strategies. Full article
Show Figures

Figure 1

13 pages, 9011 KiB  
Article
Strategies for Development and Improvement of the Urban Fabric: A Vienna Case Study
by Milena Vuckovic, Aida Maleki and Ardeshir Mahdavi
Climate 2018, 6(1), 7; https://doi.org/10.3390/cli6010007 - 27 Jan 2018
Cited by 12 | Viewed by 6423
Abstract
Numerous studies have shown that densely developed and populated urban areas experience significant anthropogenic heat flux and elevated concentrations of air pollutants and CO2, with consequences for human health, thermal comfort, and well-being. This may also affect the atmospheric composition and [...] Read more.
Numerous studies have shown that densely developed and populated urban areas experience significant anthropogenic heat flux and elevated concentrations of air pollutants and CO2, with consequences for human health, thermal comfort, and well-being. This may also affect the atmospheric composition and circulation patterns within the urban boundary layer, with consequences for local, regional, and global climate. One of the resulting local implications is the increase in urban air temperature. In this context, the present contribution explores urban fabric development and mitigation strategies for two locations in the city of Vienna, Austria. Toward this end, the potential of specific planning and mitigation strategies regarding urban overheating was assessed using a state-of-the-art CFD-based (computational fluid dynamics) numeric simulation environment. The results display different levels of effectiveness for selected design and mitigation measures under a wide range of boundary conditions. Full article
Show Figures

Figure 1

19 pages, 6435 KiB  
Article
Multi-Model Projections of River Flood Risk in Europe under Global Warming
by Lorenzo Alfieri, Francesco Dottori, Richard Betts, Peter Salamon and Luc Feyen
Climate 2018, 6(1), 6; https://doi.org/10.3390/cli6010006 - 24 Jan 2018
Cited by 99 | Viewed by 30635
Abstract
Knowledge on the costs of natural disasters under climate change is key information for planning adaptation and mitigation strategies of future climate policies. Impact models for large scale flood risk assessment have made leaps forward in the past few years, thanks to the [...] Read more.
Knowledge on the costs of natural disasters under climate change is key information for planning adaptation and mitigation strategies of future climate policies. Impact models for large scale flood risk assessment have made leaps forward in the past few years, thanks to the increased availability of high resolution climate projections and of information on local exposure and vulnerability to river floods. Yet, state-of-the-art flood impact models rely on a number of input data and techniques that can substantially influence their results. This work compares estimates of river flood risk in Europe from three recent case studies, assuming global warming scenarios of 1.5, 2, and 3 degrees Celsius from pre-industrial levels. The assessment is based on comparing ensemble projections of expected damage and population affected at country level. Differences and common points between the three cases are shown, to point out main sources of uncertainty, strengths, and limitations. In addition, the multi-model comparison helps identify regions with the largest agreement on specific changes in flood risk. Results show that global warming is linked to substantial increase in flood risk over most countries in Central and Western Europe at all warming levels. In Eastern Europe, the average change in flood risk is smaller and the multi-model agreement is poorer. Full article
Show Figures

Figure 1

22 pages, 15959 KiB  
Article
Micro-Scale Variability of Air Temperature within a Local Climate Zone in Berlin, Germany, during Summer
by Justus A. Quanz, Susanne Ulrich, Daniel Fenner, Achim Holtmann and Jonas Eimermacher
Climate 2018, 6(1), 5; https://doi.org/10.3390/cli6010005 - 17 Jan 2018
Cited by 48 | Viewed by 9758
Abstract
The urban climate, especially the near-surface air temperature ( T ), is influenced to large amounts by urban surface properties on the local-scale. Landscape classification schemes, like the Local Climate Zone (LCZ) concept, classify neighbourhoods on this scale based on their surface properties, [...] Read more.
The urban climate, especially the near-surface air temperature ( T ), is influenced to large amounts by urban surface properties on the local-scale. Landscape classification schemes, like the Local Climate Zone (LCZ) concept, classify neighbourhoods on this scale based on their surface properties, neglecting sub-scale heterogeneity in the urban structure and its potential effects on T . To quantify sub-scale T variability, a measurement campaign with eleven stationary T sensors was conducted within one LCZ (class 2B, compact midrise with scattered trees) in Berlin, Germany, during 22 days in summer 2016. Correlation analyses were performed between observed spatial T differences and micro-scale morphometric parameters around the measurement sites, such as sky view factor and building surface fraction. The results show mean night-time T differences of up to 1 K between the different sites. On a clear, calm and dry day, the daytime difference reached 3 K. At night-time, the variability can be best explained by the building surface fraction within a radius of 50 m. Further, a nocturnal cooling influence of a neighbouring green space could be observed. The observed micro-scale T variability was smaller than T differences to other LCZ classes, highlighting the applicability of the LCZ concept. Full article
Show Figures

Figure 1

5 pages, 178 KiB  
Editorial
Acknowledgement to Reviewers of Climate in 2017
by Climate Editorial Office
Climate 2018, 6(1), 4; https://doi.org/10.3390/cli6010004 - 12 Jan 2018
Viewed by 3106
Abstract
Peer review is an essential part in the publication process, ensuring that Climate maintains high quality standards for its published papers [...]
Full article
30 pages, 8219 KiB  
Article
The Antarctic Centennial Oscillation: A Natural Paleoclimate Cycle in the Southern Hemisphere That Influences Global Temperature
by W. Jackson Davis, Peter J. Taylor and W. Barton Davis
Climate 2018, 6(1), 3; https://doi.org/10.3390/cli6010003 - 8 Jan 2018
Cited by 7 | Viewed by 19622
Abstract
We report a previously-unexplored natural temperature cycle recorded in ice cores from Antarctica—the Antarctic Centennial Oscillation (ACO)—that has oscillated for at least the last 226 millennia. Here we document the properties of the ACO and provide an initial assessment of its role in [...] Read more.
We report a previously-unexplored natural temperature cycle recorded in ice cores from Antarctica—the Antarctic Centennial Oscillation (ACO)—that has oscillated for at least the last 226 millennia. Here we document the properties of the ACO and provide an initial assessment of its role in global climate. We analyzed open-source databases of stable isotopes of oxygen and hydrogen as proxies for paleo-temperatures. We find that centennial-scale spectral peaks from temperature-proxy records at Vostok over the last 10,000 years occur at the same frequencies (±2.4%) in three other paleoclimate records from drill sites distributed widely across the East Antarctic Plateau (EAP), and >98% of individual ACOs evaluated at Vostok match 1:1 with homologous cycles at the other three EAP drill sites and conversely. Identified ACOs summate with millennial periodicity to form the Antarctic Isotope Maxima (AIMs) known to precede Dansgaard-Oeschger (D-O) oscillations recorded in Greenland ice cores. Homologous ACOs recorded at the four EAP drill sites during the last glacial maximum appeared first at lower elevations nearest the ocean and centuries later on the high EAP, with latencies that exceed dating uncertainty >30-fold. ACO homologs at different drill sites became synchronous, however, during the warmer Holocene. Comparative spectral analysis suggests that the millennial-scale AIM cycle declined in period from 1500 to 800 years over the last 70 millennia. Similarly, over the last 226 millennia ACO repetition period (mean 352 years) declined by half while amplitude (mean 0.67 °C) approximately doubled. The period and amplitude of ACOs oscillate in phase with glacial cycles and related surface insolation associated with planetary orbital forces. We conclude that the ACO: encompasses at least the EAP; is the proximate source of D-O oscillations in the Northern Hemisphere; therefore affects global temperature; propagates with increased velocity as temperature increases; doubled in intensity over geologic time; is modulated by global temperature variations associated with planetary orbital cycles; and is the probable paleoclimate precursor of the contemporary Antarctic Oscillation (AAO). Properties of the ACO/AAO are capable of explaining the current global warming signal. Full article
Show Figures

Graphical abstract

20 pages, 4568 KiB  
Article
Regions Subject to Rainfall Oscillation in the 5–10 Year Band
by Jean-Louis Pinault
Climate 2018, 6(1), 2; https://doi.org/10.3390/cli6010002 - 5 Jan 2018
Cited by 15 | Viewed by 5789
Abstract
The decadal oscillation of rainfall in Europe that has been observed since the end of the 20th century is a phenomenon well known to climatologists. Consequences are considerable because the succession of wet or dry years produces floods or, inversely, droughts. Moreover, much [...] Read more.
The decadal oscillation of rainfall in Europe that has been observed since the end of the 20th century is a phenomenon well known to climatologists. Consequences are considerable because the succession of wet or dry years produces floods or, inversely, droughts. Moreover, much research has tried to answer the question about the possible link between the frequency and the intensity of extra-tropical cyclones, which are particularly devastating, and global warming. This work aims at providing an exhaustive description of the rainfall oscillation in the 5–10 year band during one century on a planetary scale. It is shown that the rainfall oscillation results from baroclinic instabilities over the oceans. For that, a joint analysis of the amplitude and the phase of sea surface temperature anomalies and rainfall anomalies is performed, which discloses the mechanisms leading to the alternation of high and low atmospheric pressure systems. For a prospective purpose, some milestones are suggested on a possible link with very long-period Rossby waves in the oceans. Full article
(This article belongs to the Special Issue Decadal Variability and Predictability of Climate)
Show Figures

Figure 1

1144 KiB  
Article
Translating MC2 DGVM Results into Ecosystem Services for Climate Change Mitigation and Adaptation
by Dominique Bachelet, Kenneth Ferschweiler, Timothy J. Sheehan, Benjamin M. Sleeter and Zhiliang Zhu
Climate 2018, 6(1), 1; https://doi.org/10.3390/cli6010001 - 28 Dec 2017
Cited by 9 | Viewed by 4893
Abstract
Ecosystem services (ES) were conceived to emphasize the role of ecological processes in supporting societal needs and to allow their inclusion in the decision-making process. Currently climate change mitigation is one of the most important services ecosystems can provide to enhance sinks of [...] Read more.
Ecosystem services (ES) were conceived to emphasize the role of ecological processes in supporting societal needs and to allow their inclusion in the decision-making process. Currently climate change mitigation is one of the most important services ecosystems can provide to enhance sinks of greenhouse gas emissions as the planet warms and related extreme events take their toll on societies. Because ES cannot always be directly measured and because measurements are often cost prohibitive, process-based models are used to estimate their supply, delivery and/or value. We ran the MC2 dynamic global vegetation model for the conterminous US with/without land use for several future scenarios. We translated results into key ES such as carbon sequestration, which contributes to climate regulation, into a regulatory service or aboveground forest carbon into timber biomass, a provisioning service, and evaluated constraints to maintain them. By comparing projections with/without land use we illustrated differences between managed and natural lands and provided information to help the valuation of societally relevant services. Full article
Show Figures

Figure 1

Previous Issue
Next Issue
Back to TopTop