The Solar Reflectance Index as a Tool to Forecast the Heat Released to the Urban Environment: Potentiality and Assessment Issues


Abstract
:1. Introduction
2. The Solar Reflectance Index (SRI) and Its Calculation
2.1. Surface Radiative Properties and SRI
2.2. Potentiality and Limitations of SRI
3. Sensitivity of SRI Calculation to Input Parameters, and Measurement Issues
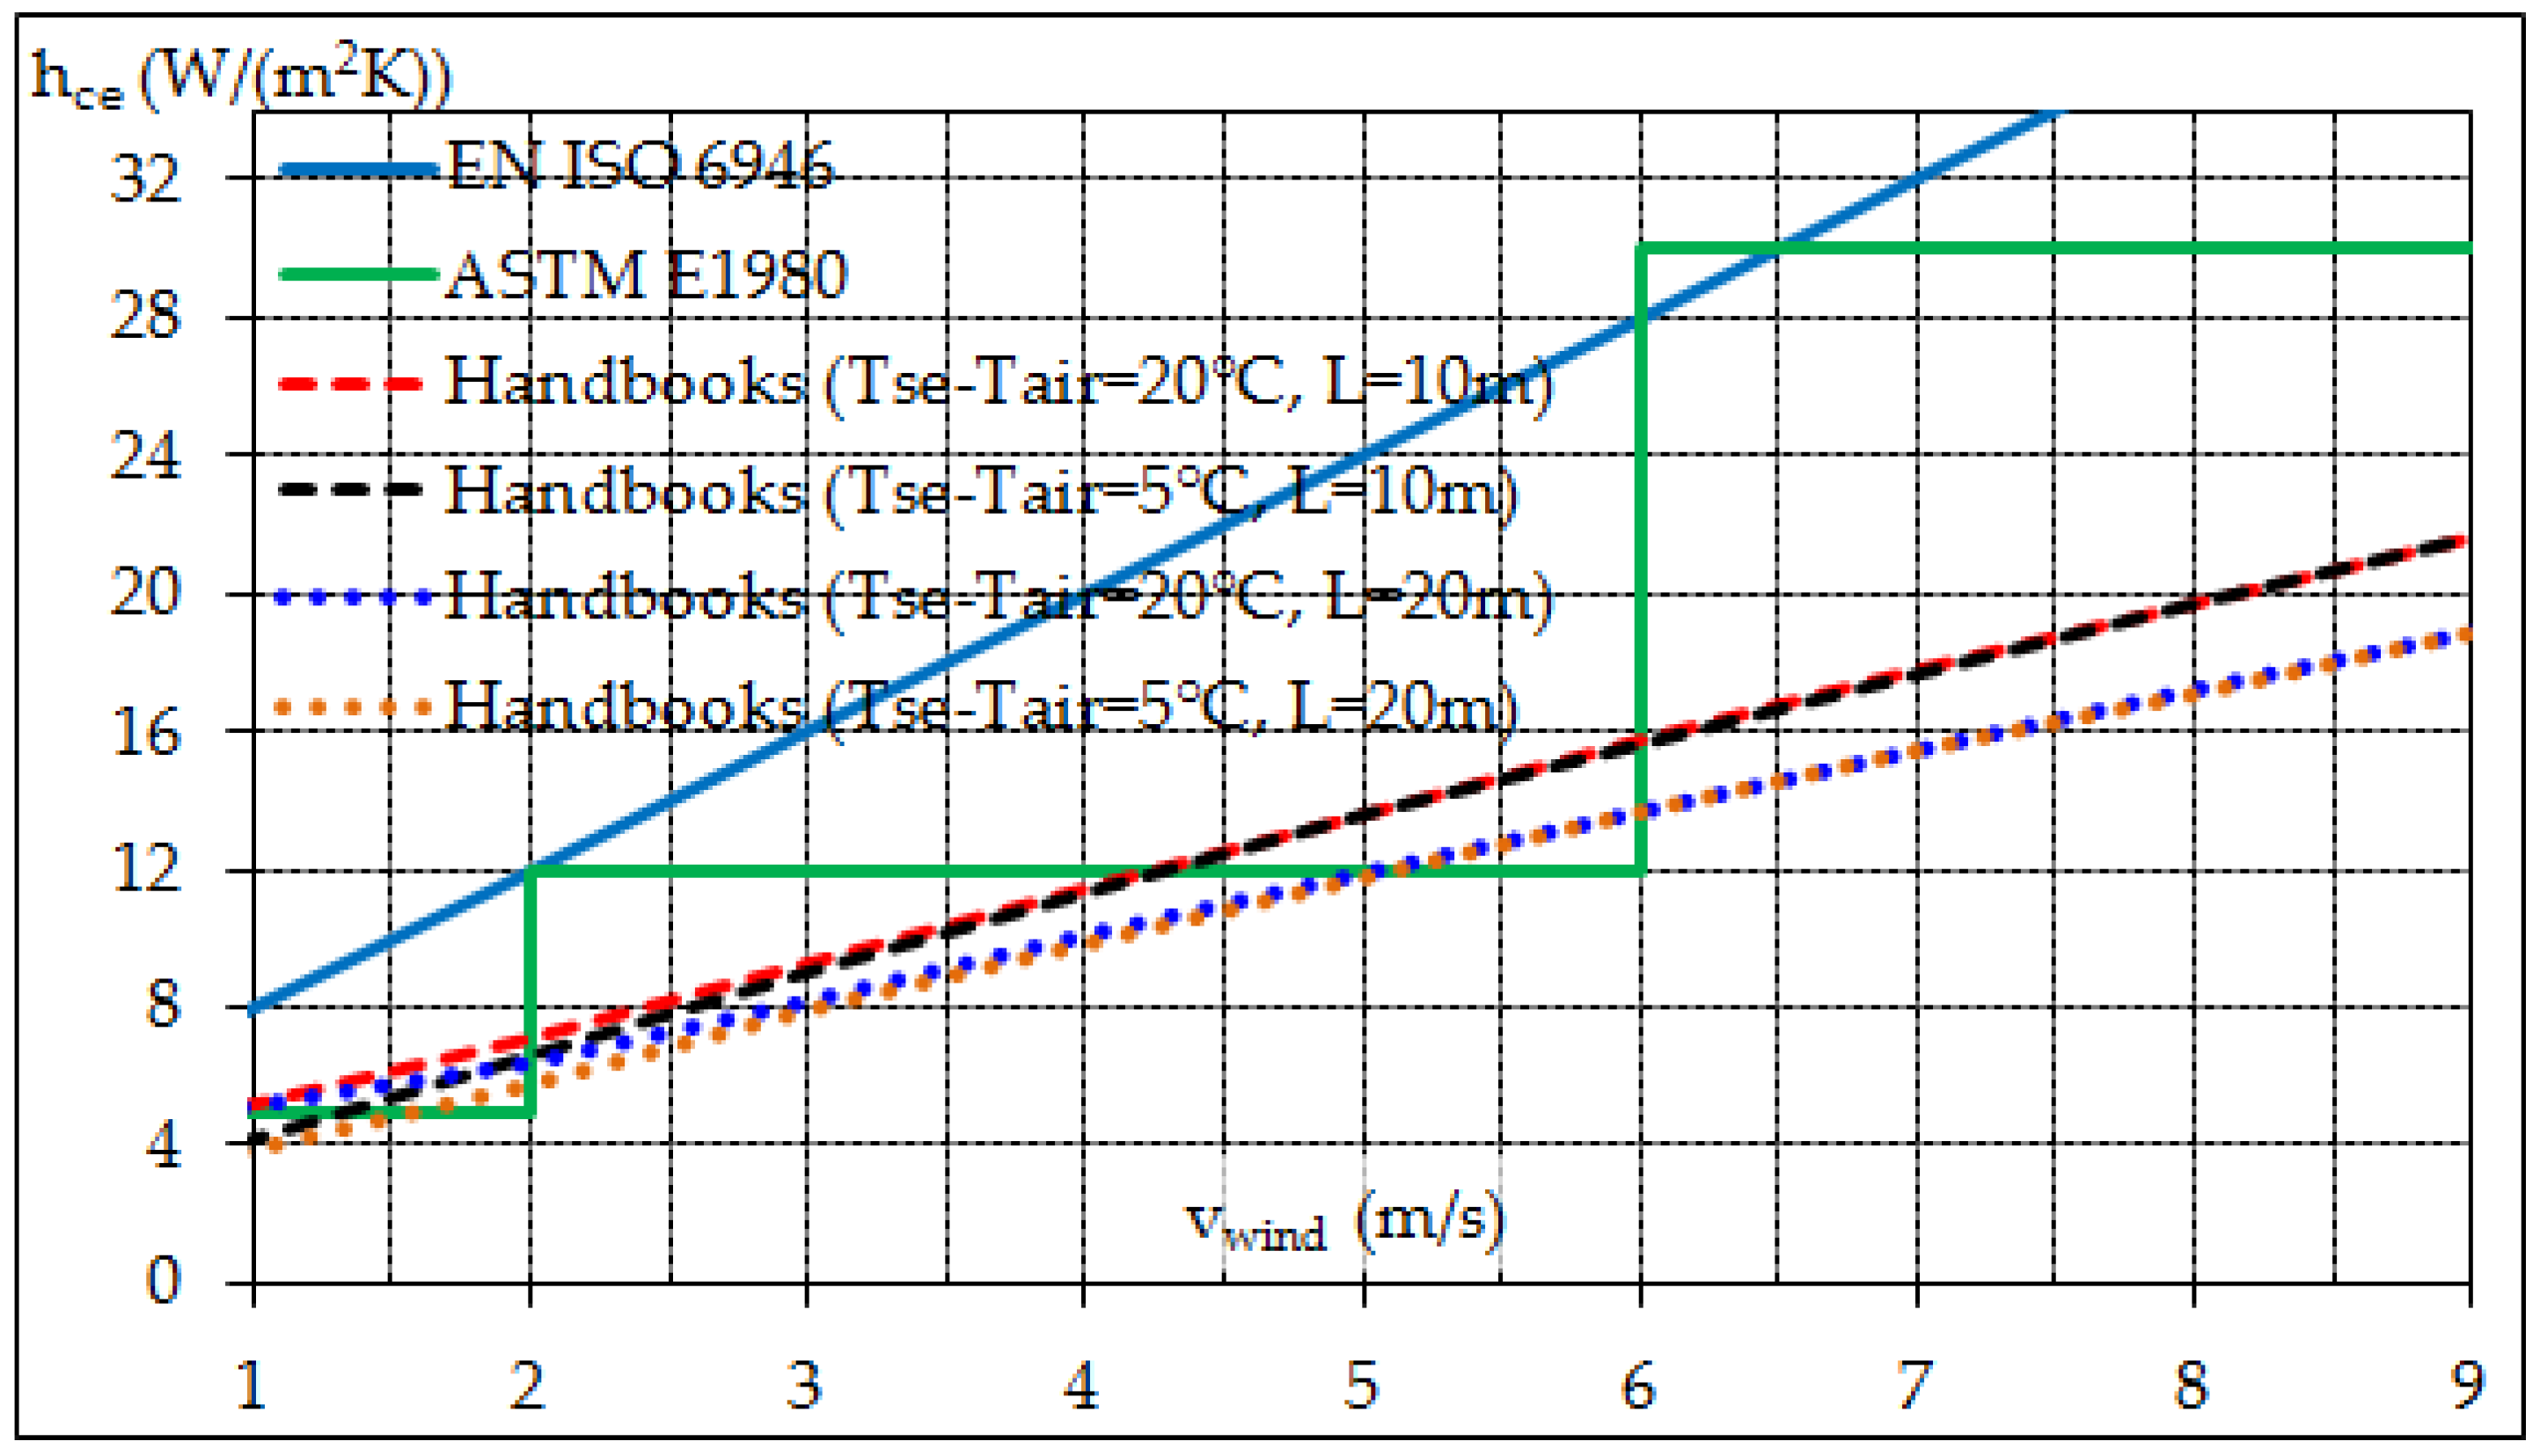
3.1. External Convection Coefficient
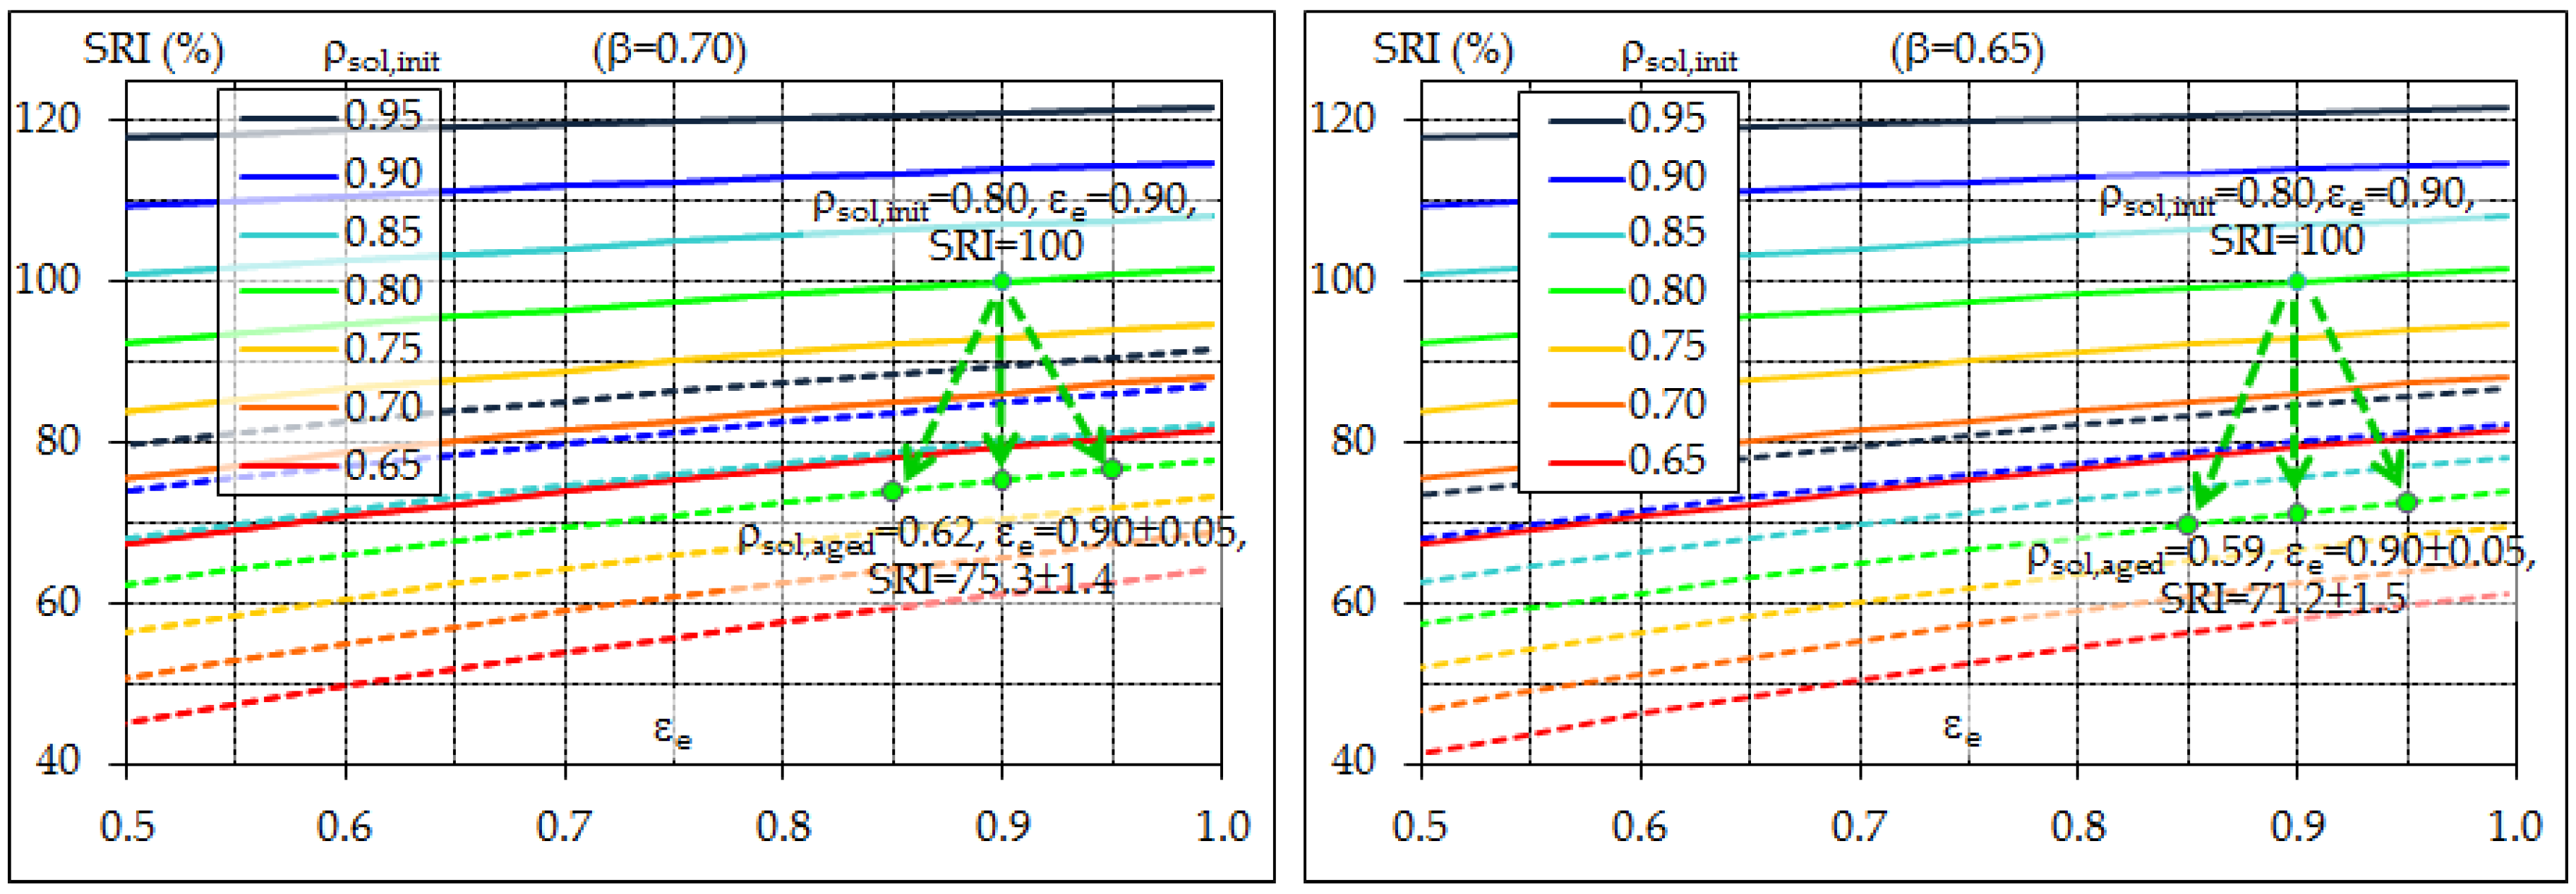
3.2. Assessment of Solar Reflectance and Ageing Issues
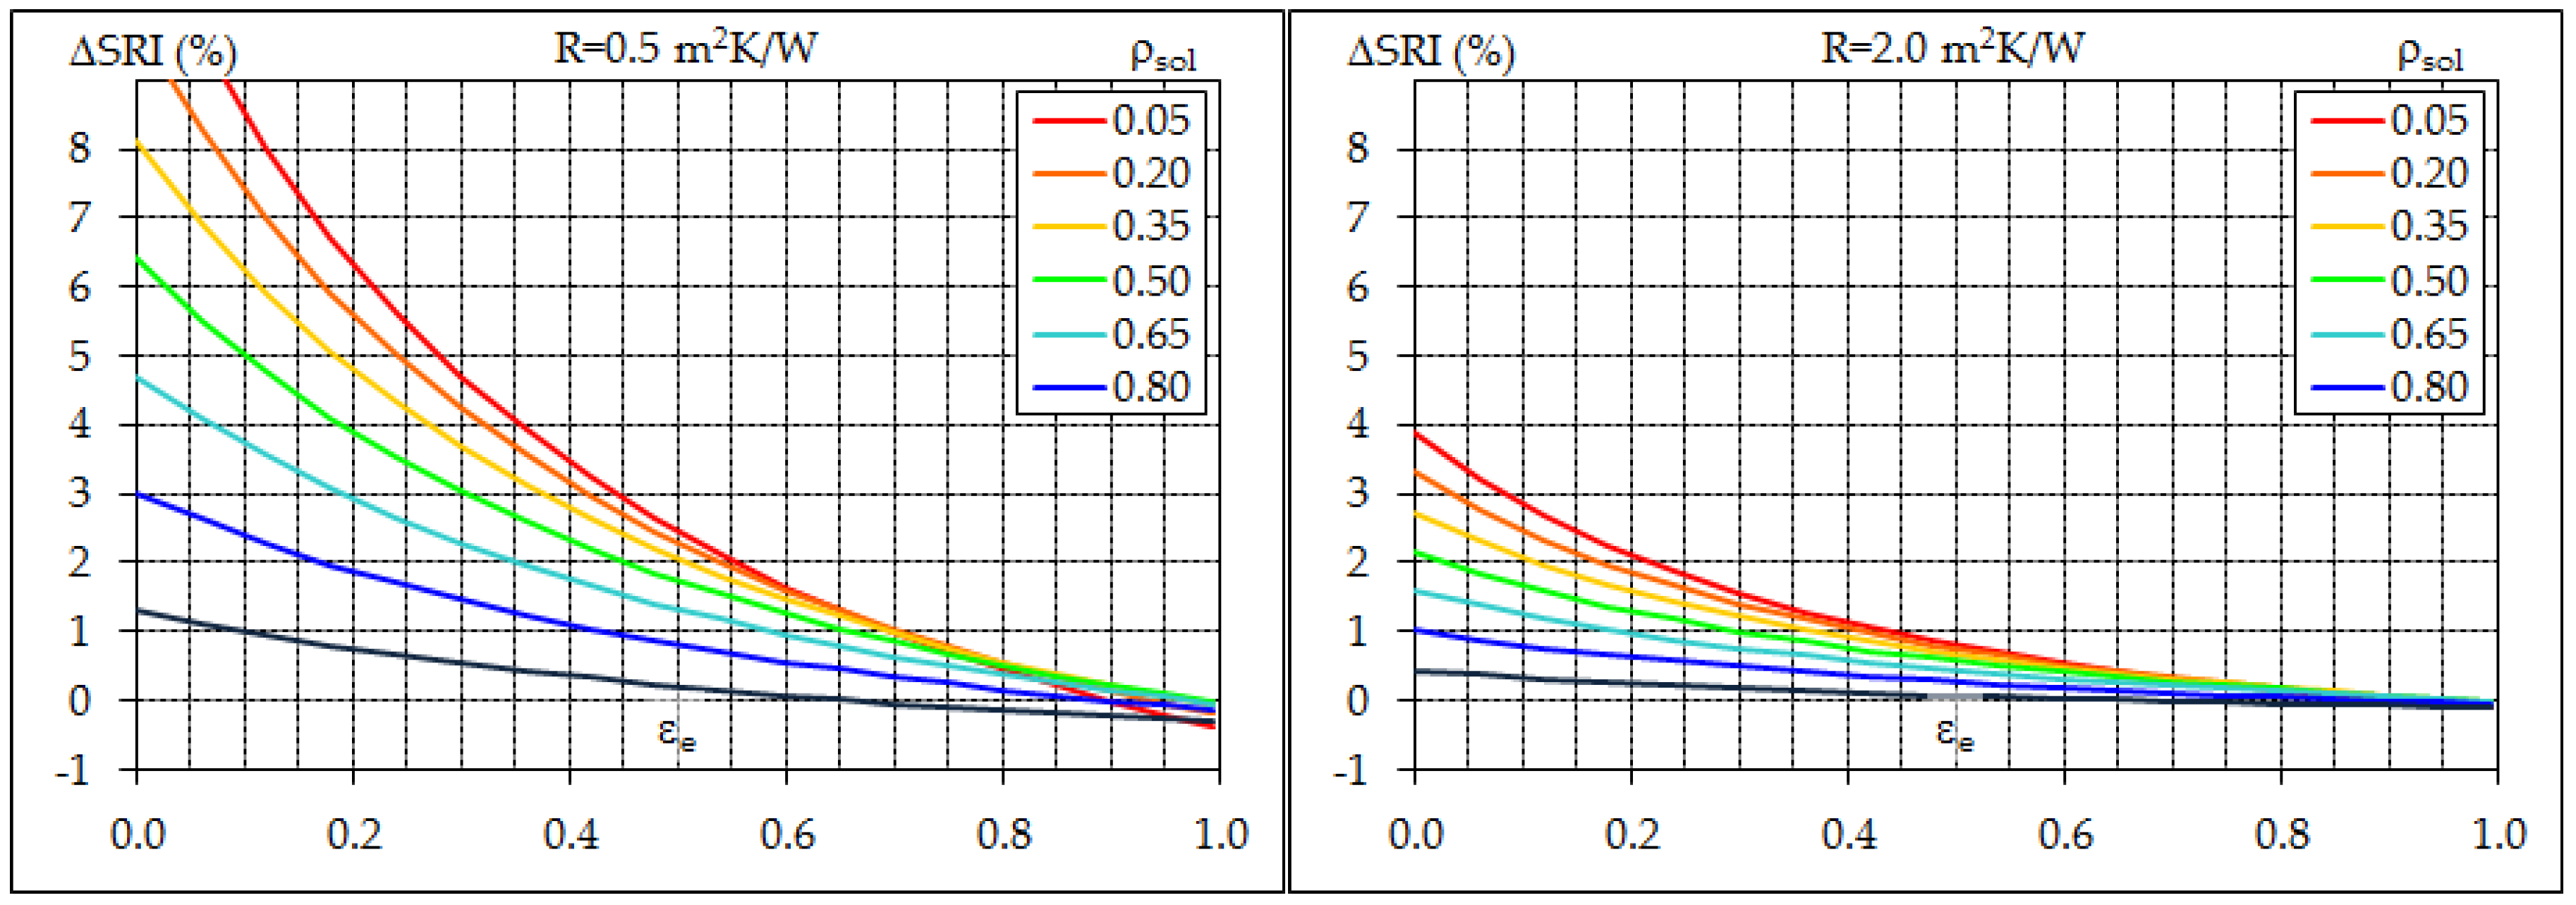
3.3. Assessment of Thermal Emittance
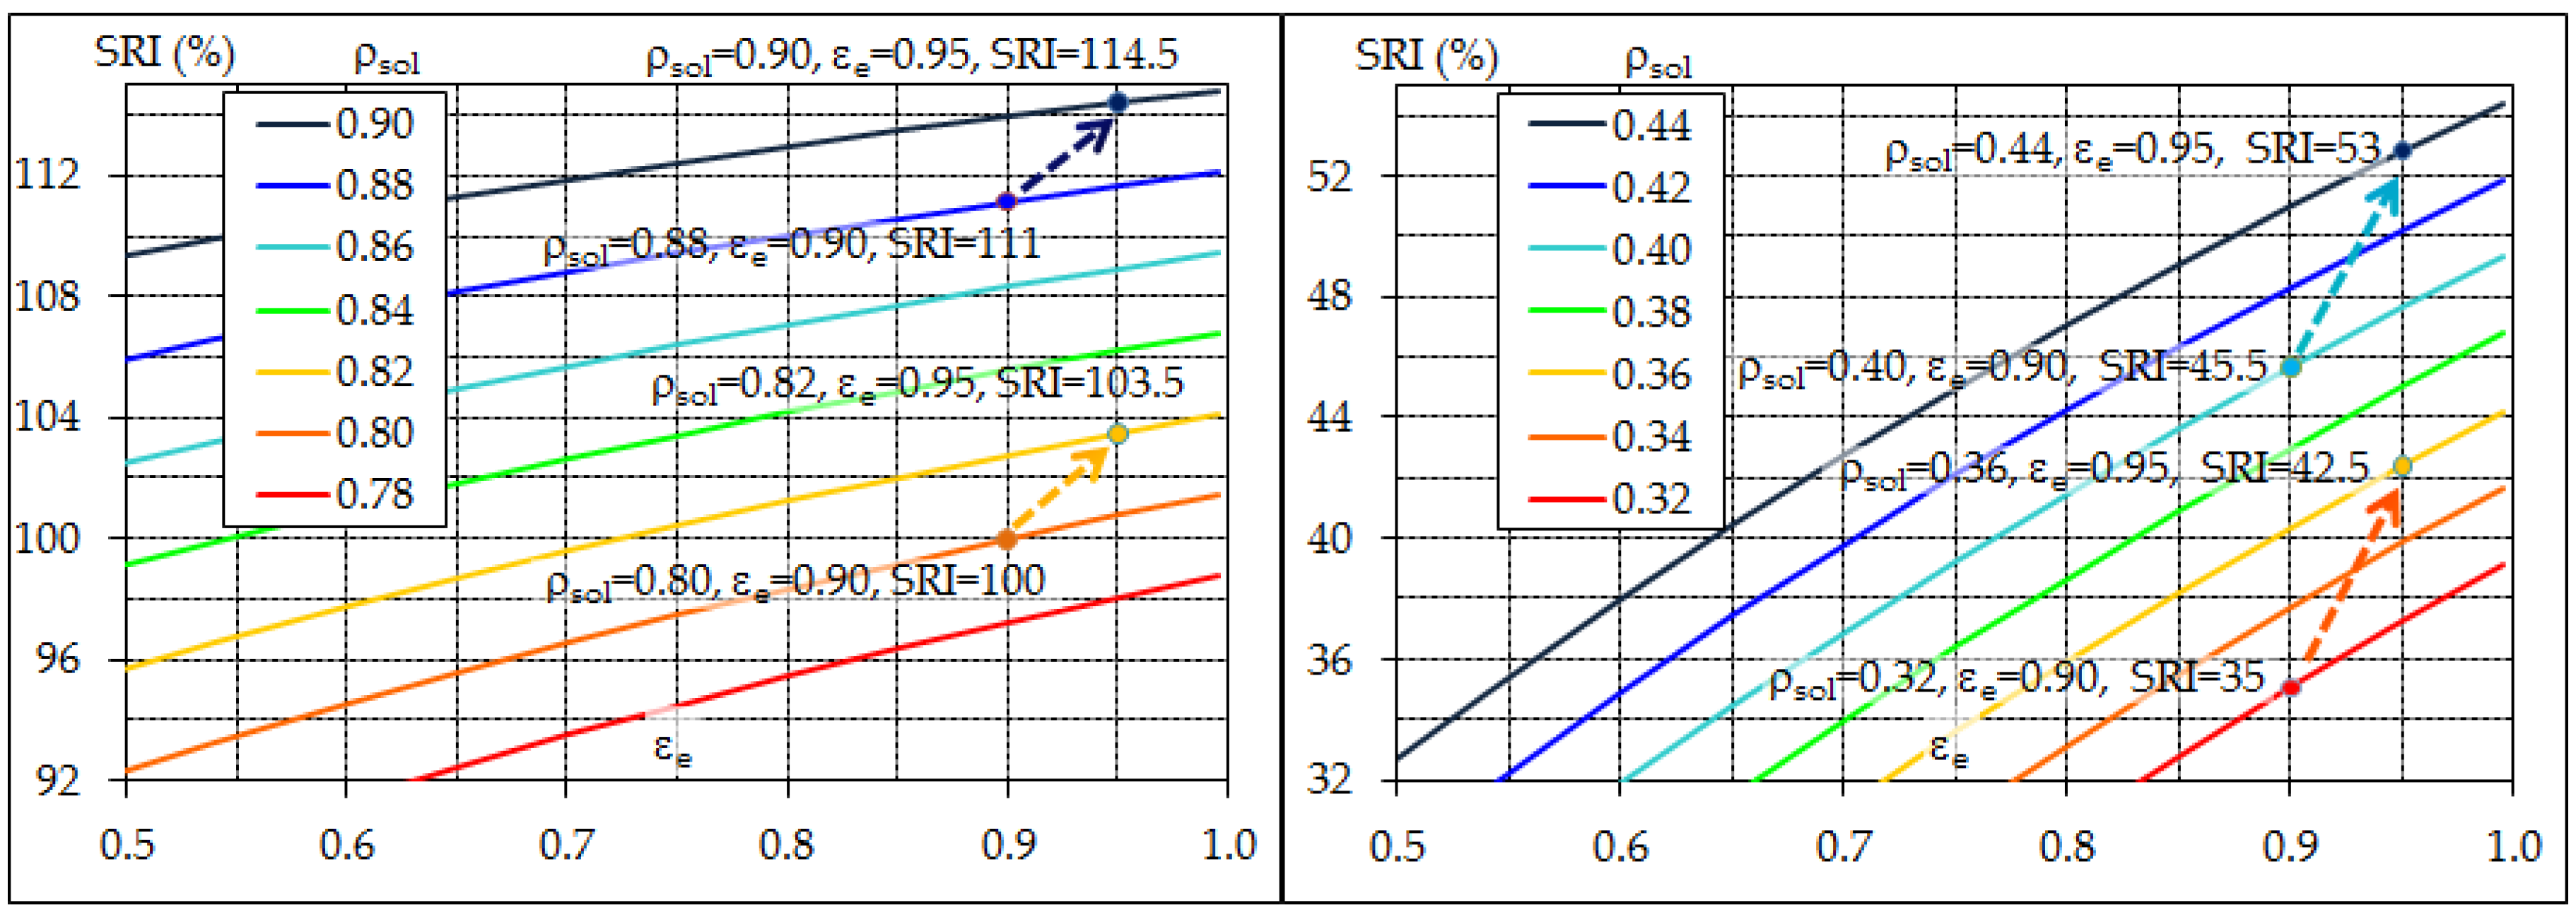
3.4. Combined Effects of Measurement Issues
4. Conclusive Remarks
- The SRI has raised significant interest in the construction sector thanks to its relative ease of calculation and, above all, its effective representation of the thermal behavior of a built surface subjected to solar radiation.
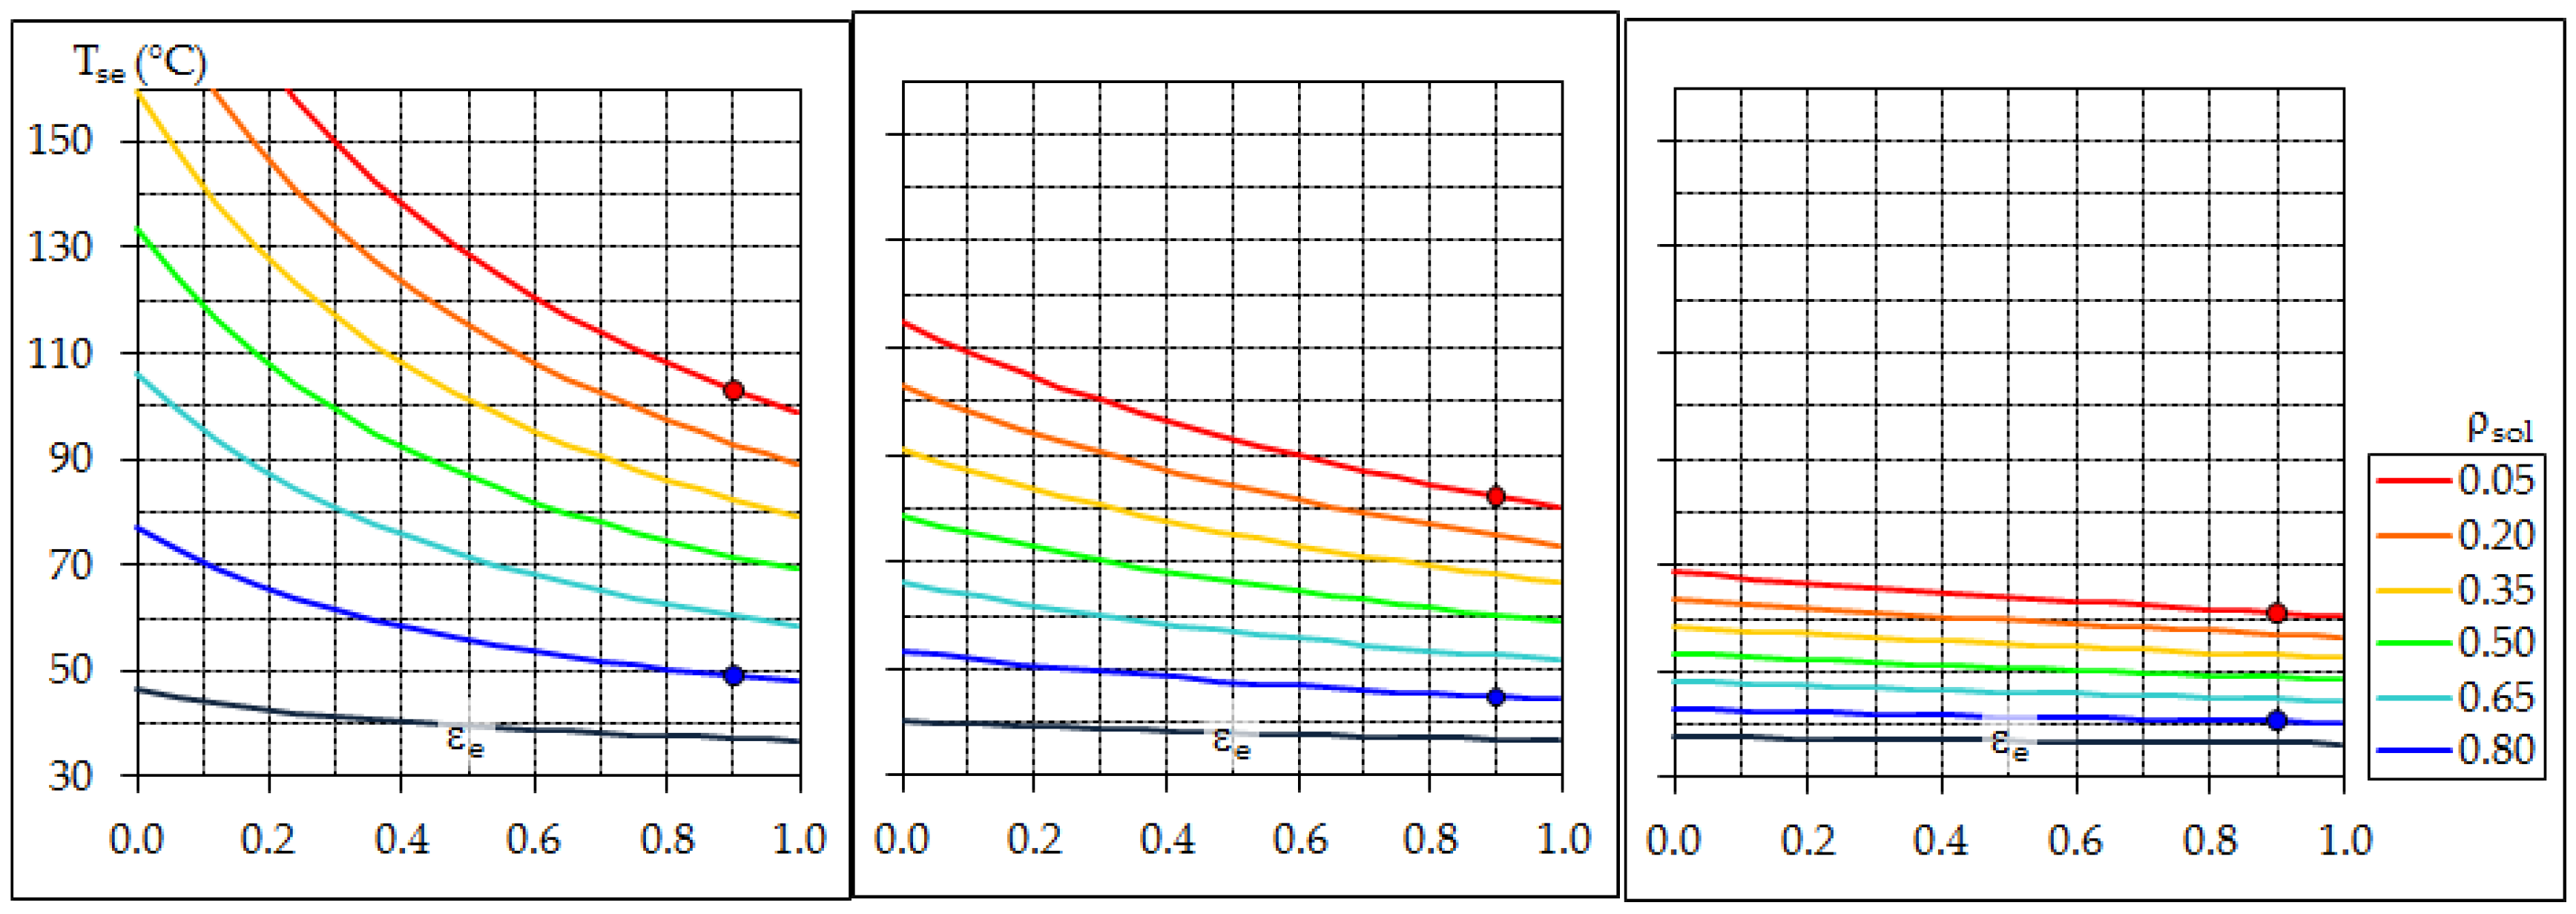
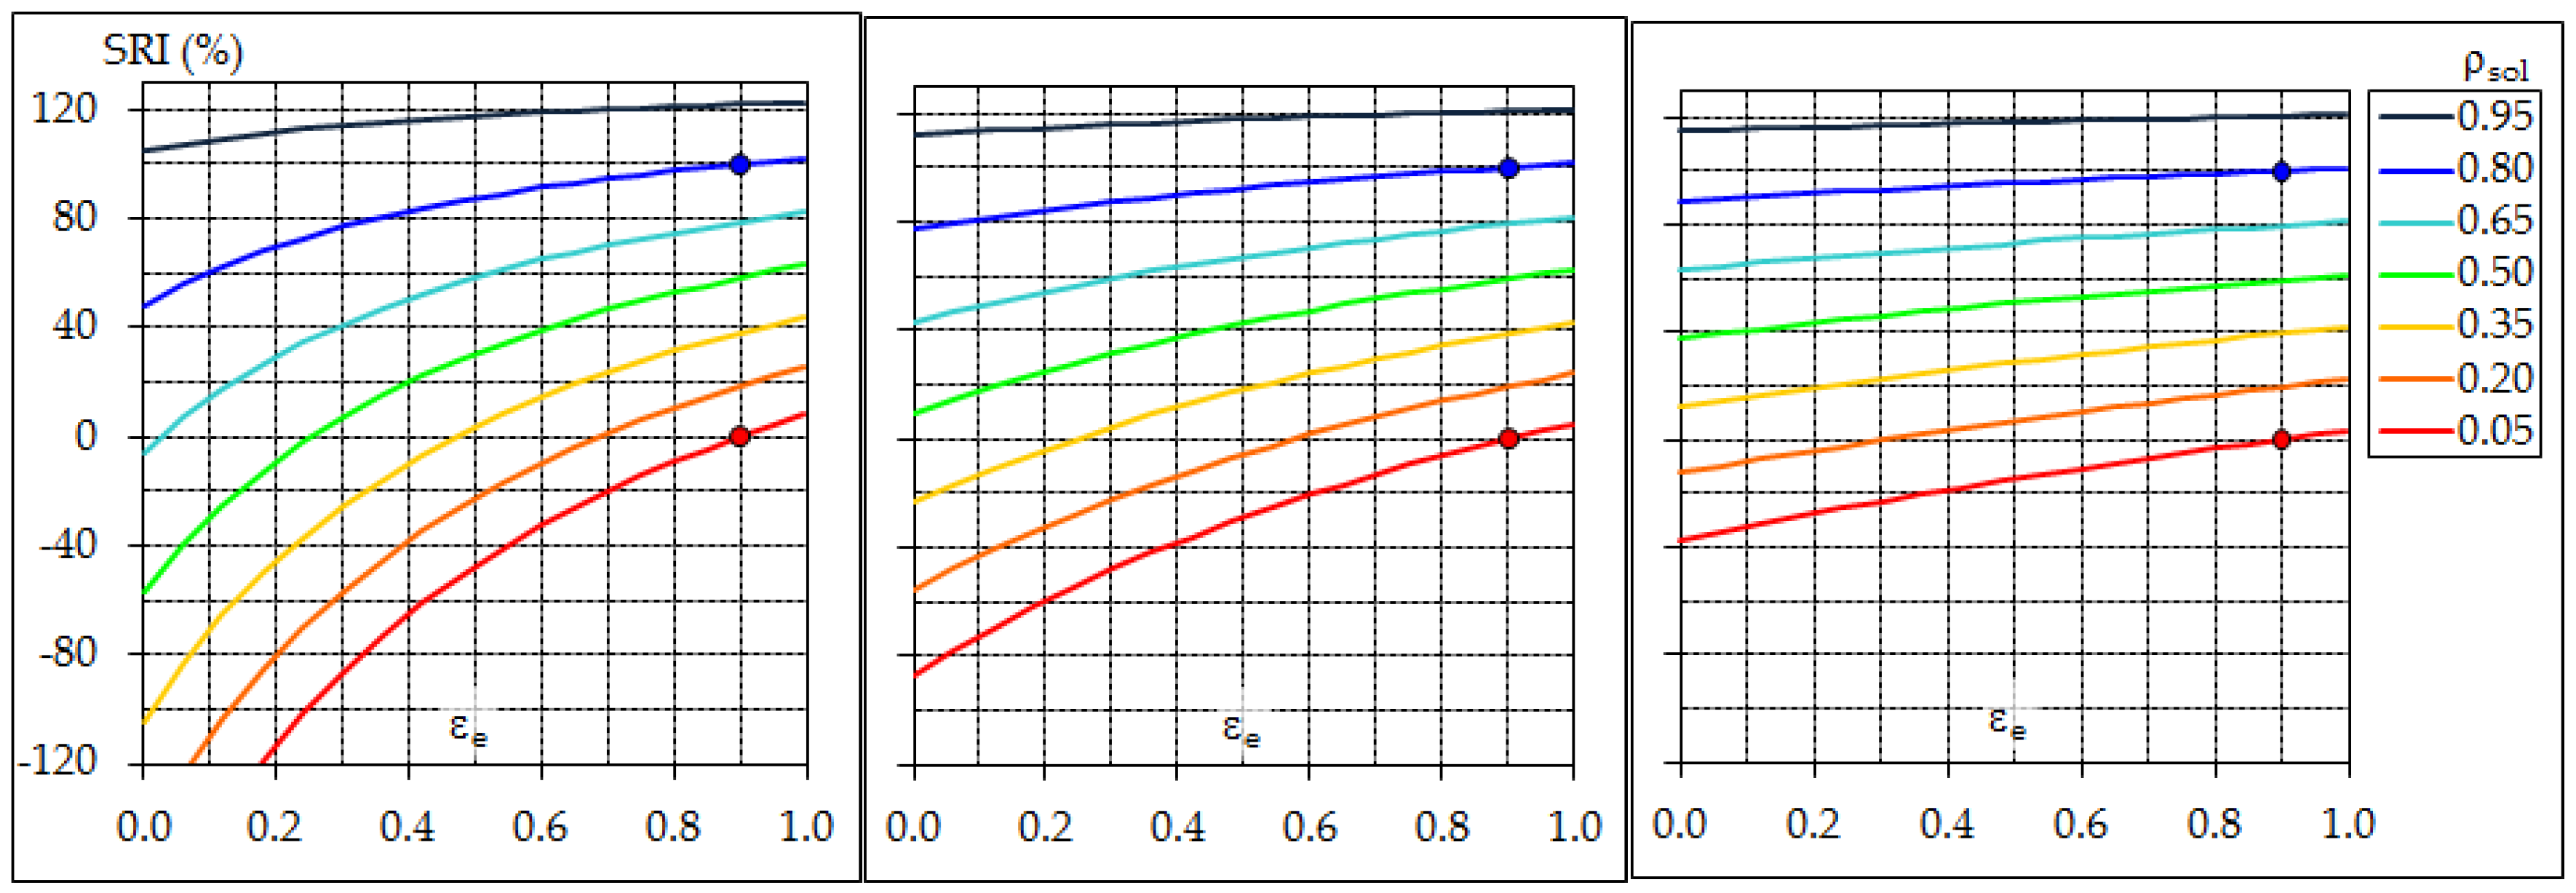
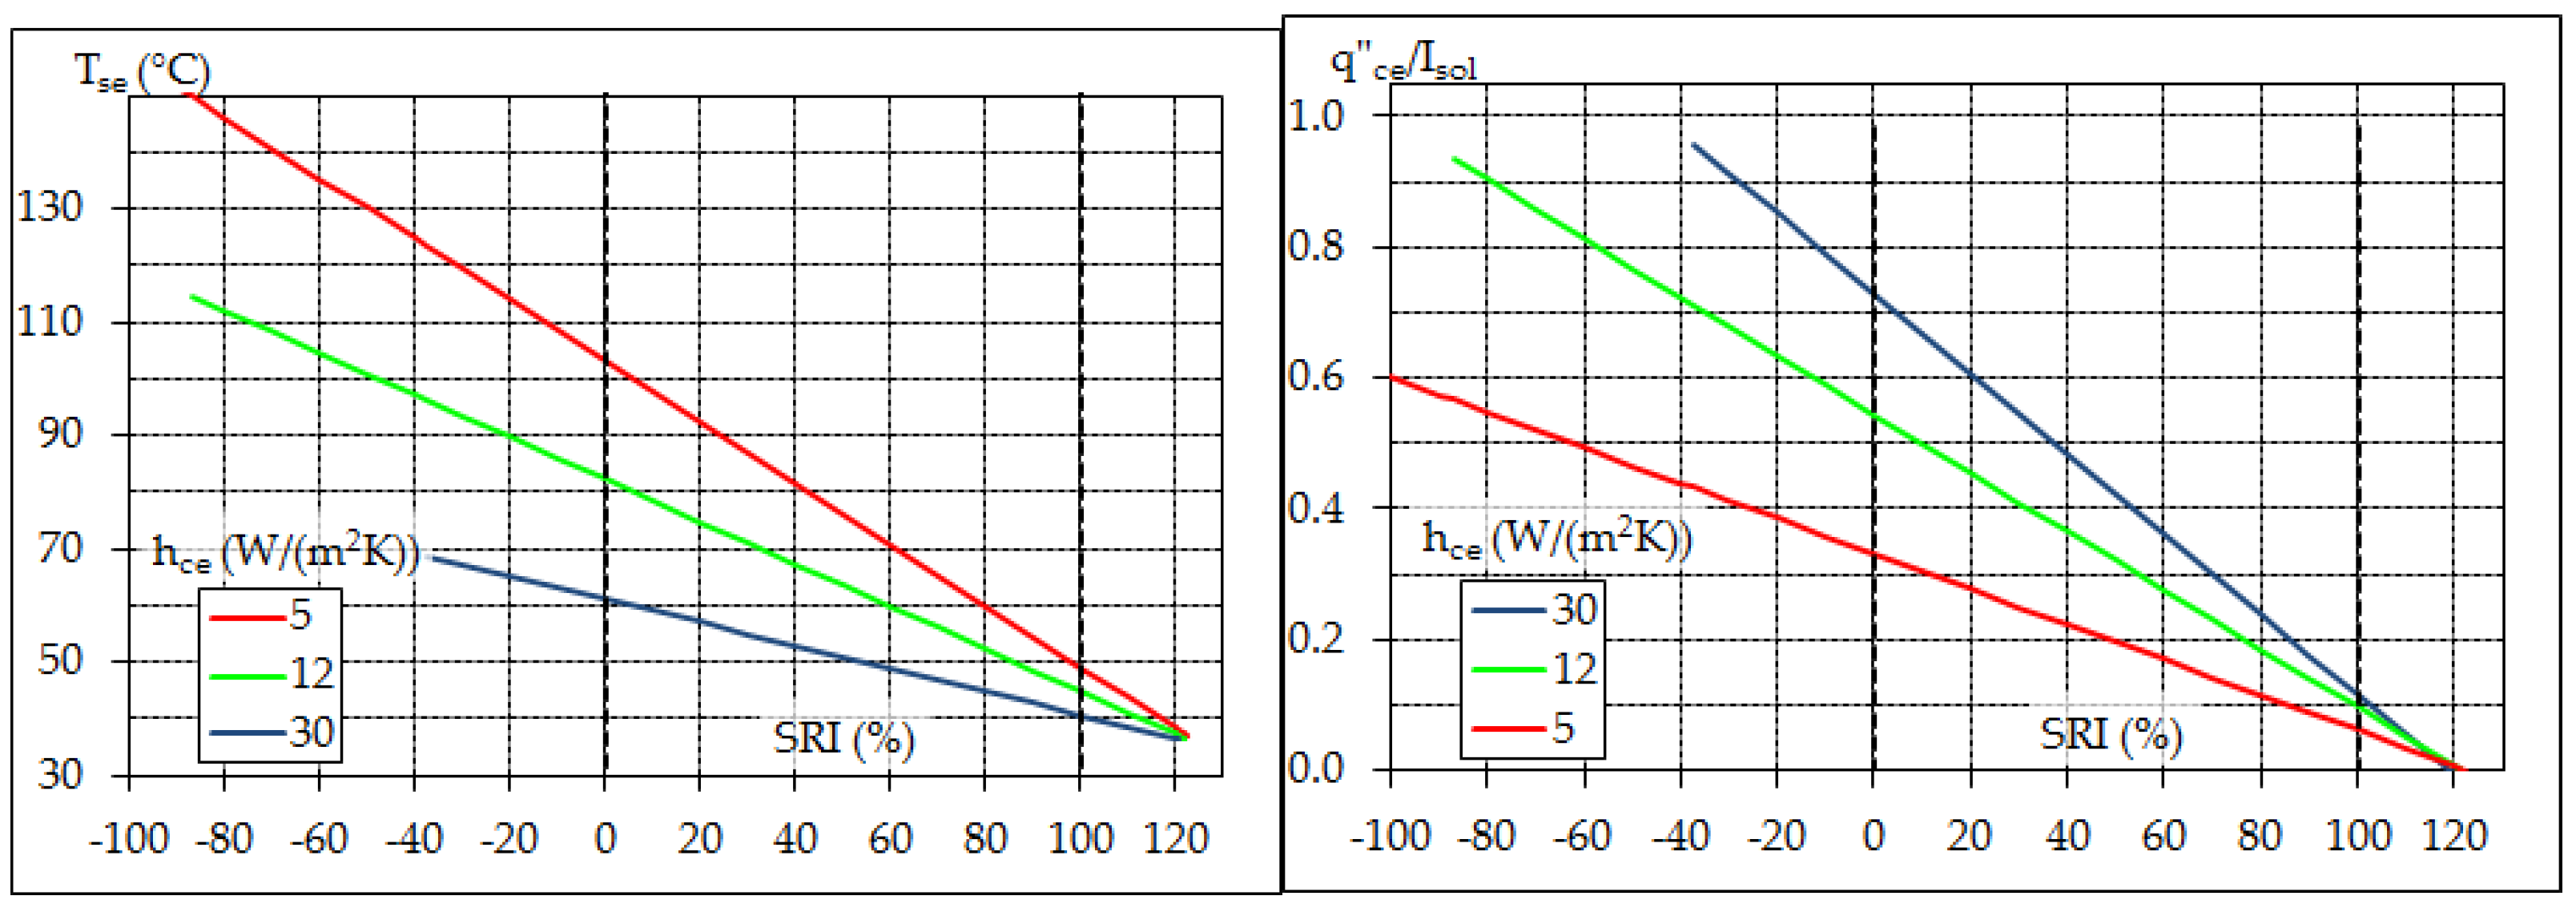
- A linear correlation exists between SRI and both the surface temperature and the fraction of incident solar heat that is transferred to the near ground air. Since a given SRI value can be the result of different pairs of solar reflectance and thermal emittance values, SRI seems a more effective indicator than solar reflectance alone for comparative evaluation of the capability of built surfaces to limit urban warming.
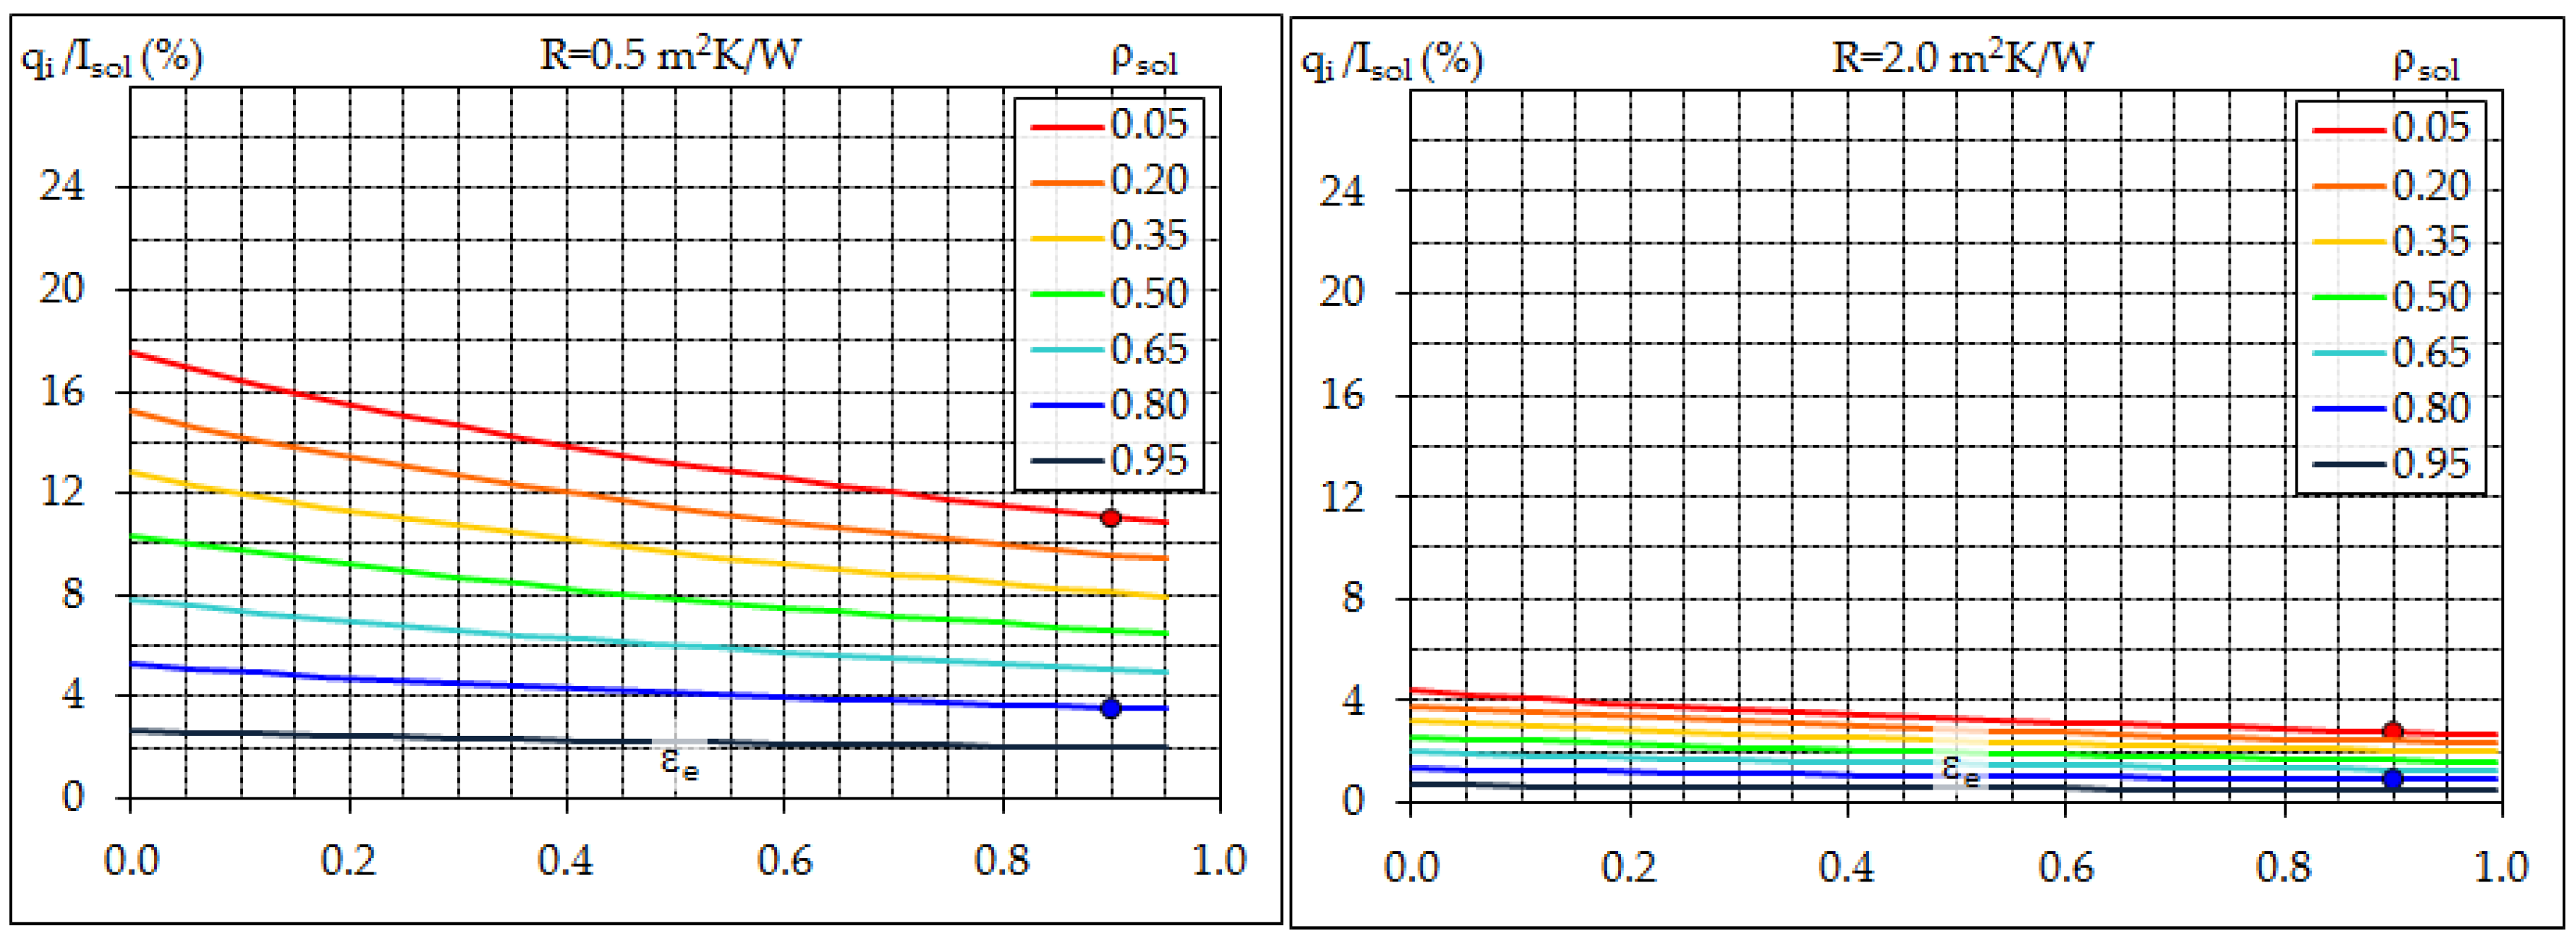
- SRI calculation is based on the hypothesis of an adiabatic irradiated surface and does not consider the insulation or the inertia of the materials below; nonetheless it can work well as an indicator of the heat transmitted to the external near ground air, and therefore of the contribution to urban warming, since the heat flow rate conducted through a roof or into the ground can be lower by one or two orders of magnitude than solar irradiance.
- Values of the convection heat transfer coefficient specified for SRI calculation are arbitrary; nonetheless they are in good agreement with the literature and are therefore reasonable from the perspective of product comparison.
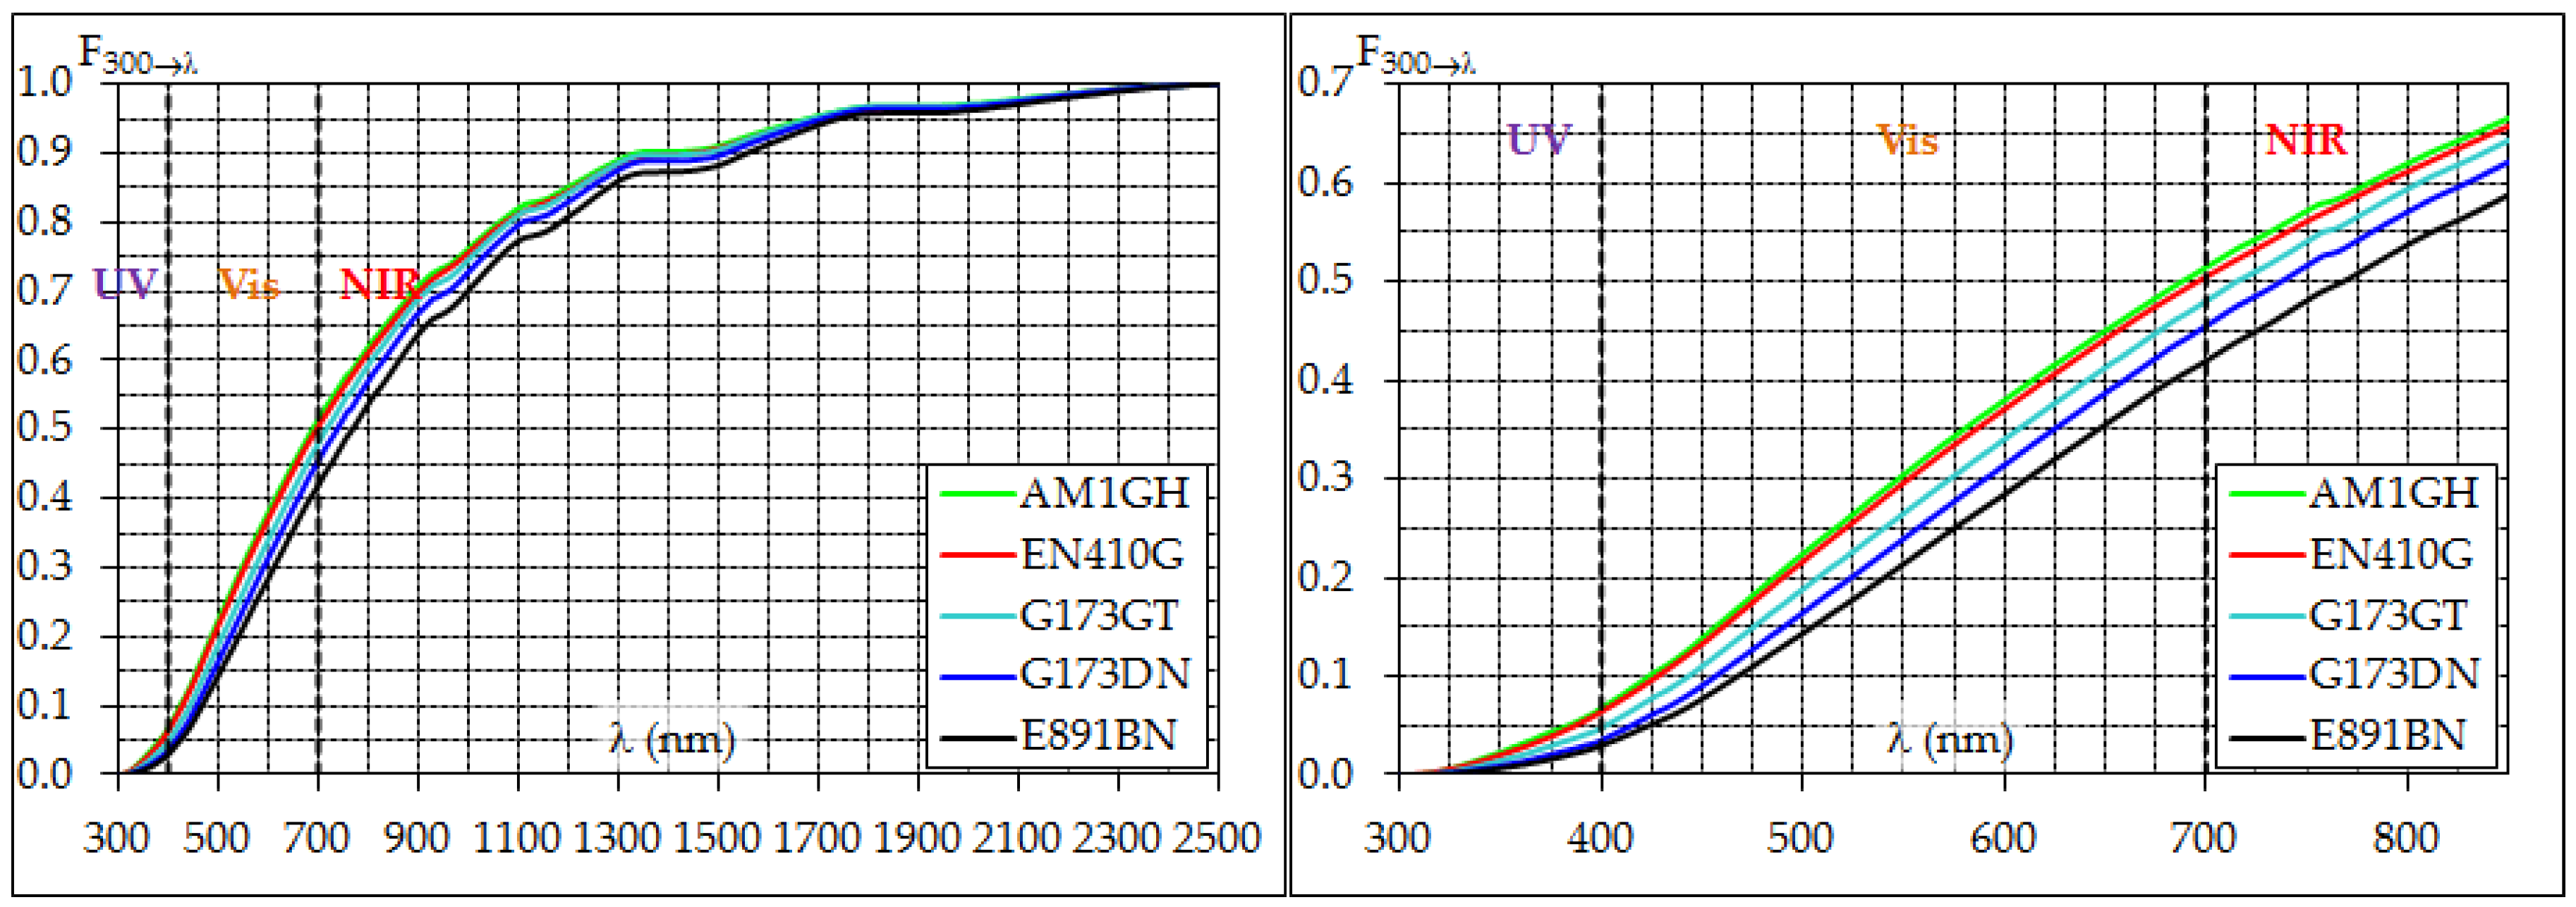
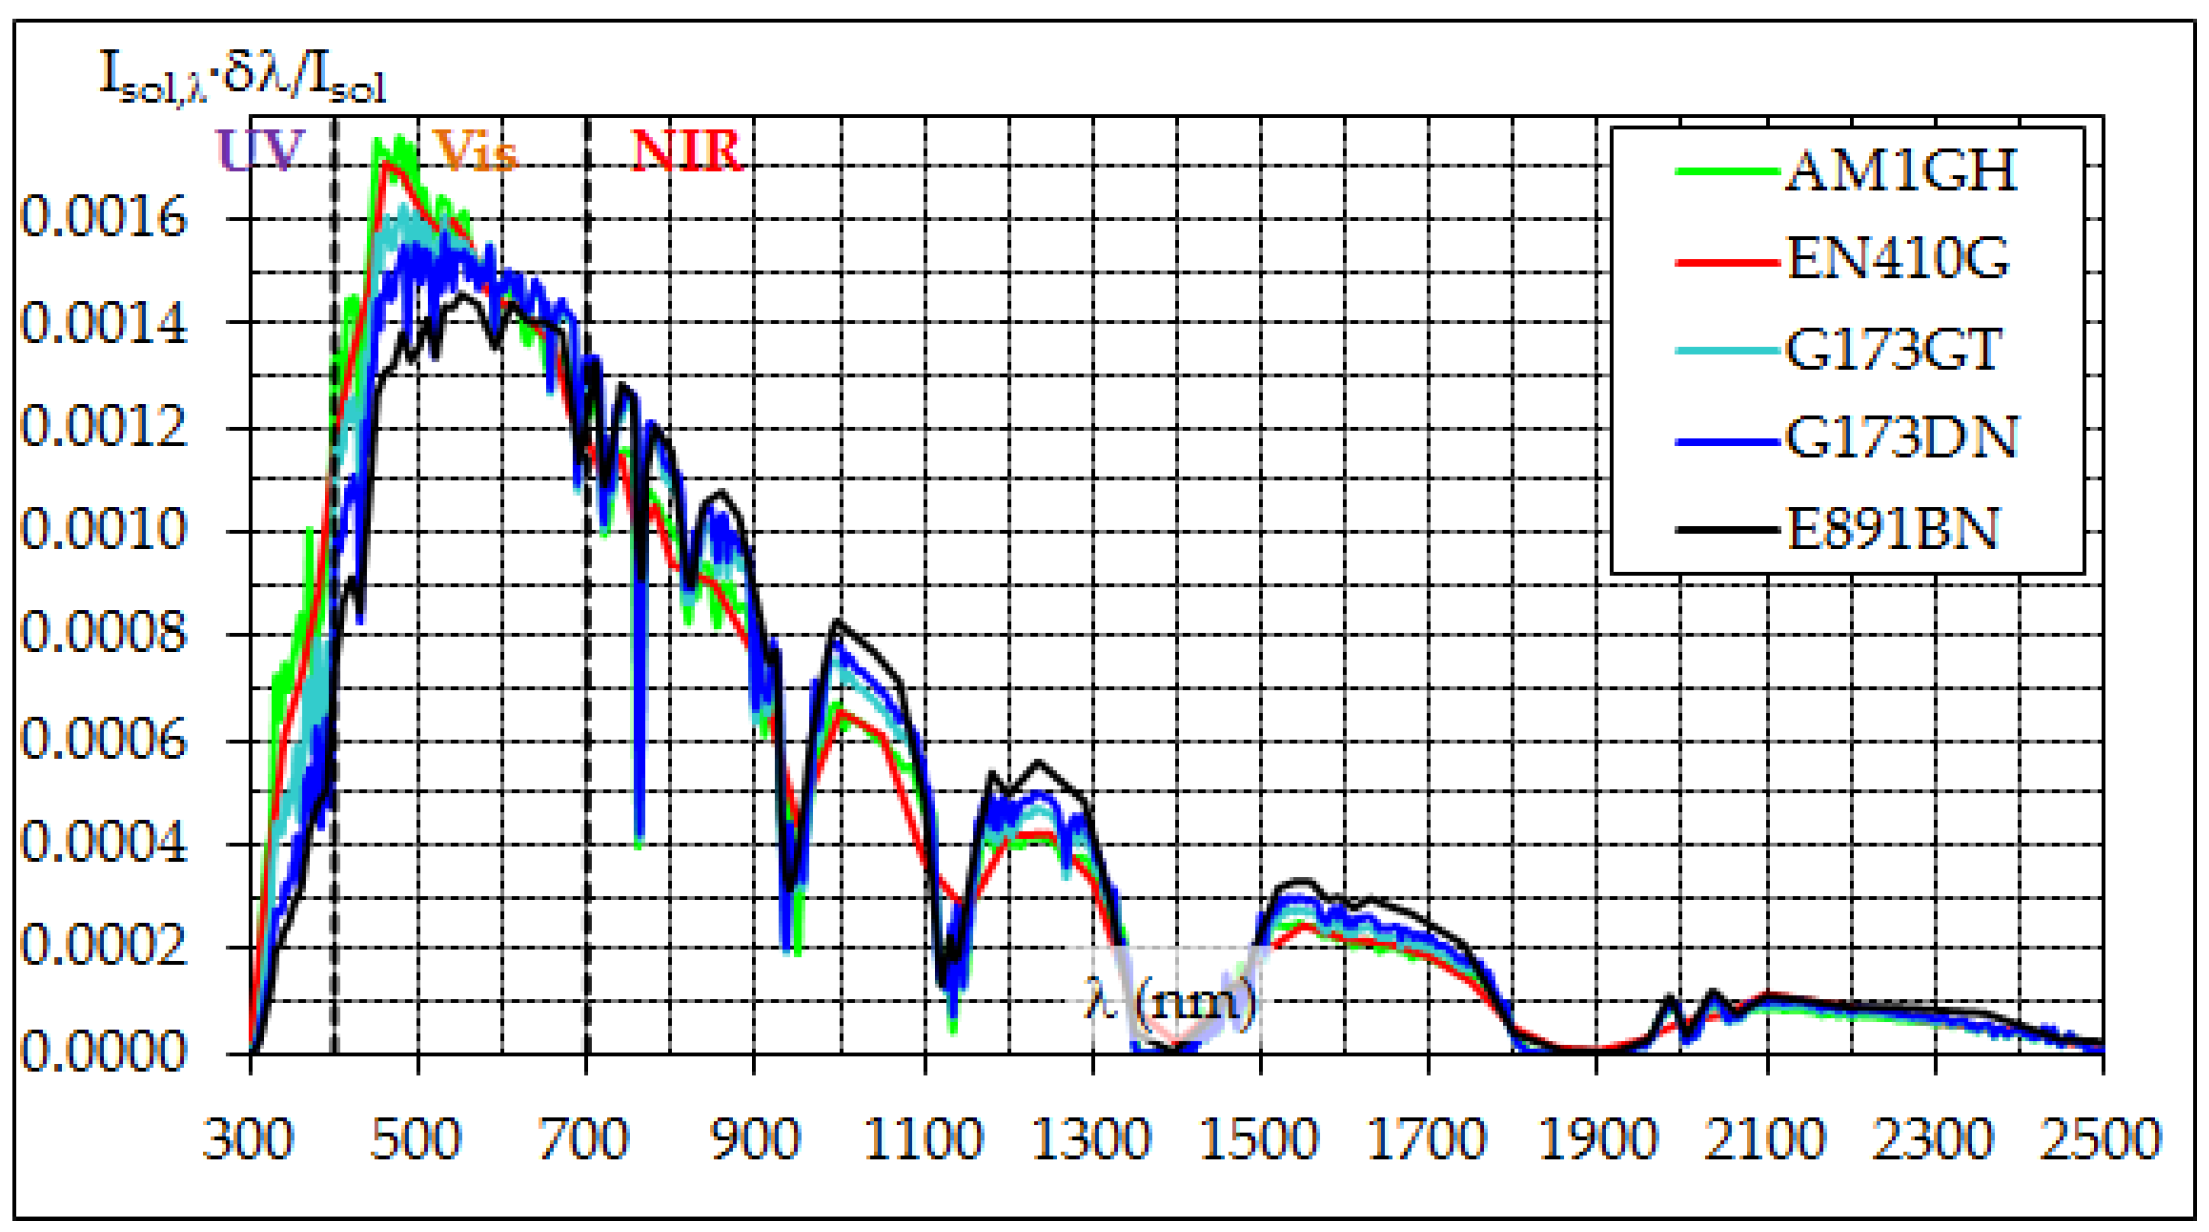
- The standard solar spectra currently recommended in the U.S. by CRRC and allowed in Europe by ECRC to calculate the weighted average of surface reflectivity, considering air mass 1.5 and direct normal radiation, are probably improper for the prediction of annual peak solar heat gain; thus, spectra for air mass 1 global radiation on a horizontal surface have been recommended in recent studies. On the other hand, the adoption of such spectra was shown to lower the measured performance by a non-negligible amount and to potentially inhibit a fair comparison between newly rated and already rated products. The issue still needs to be properly addressed.
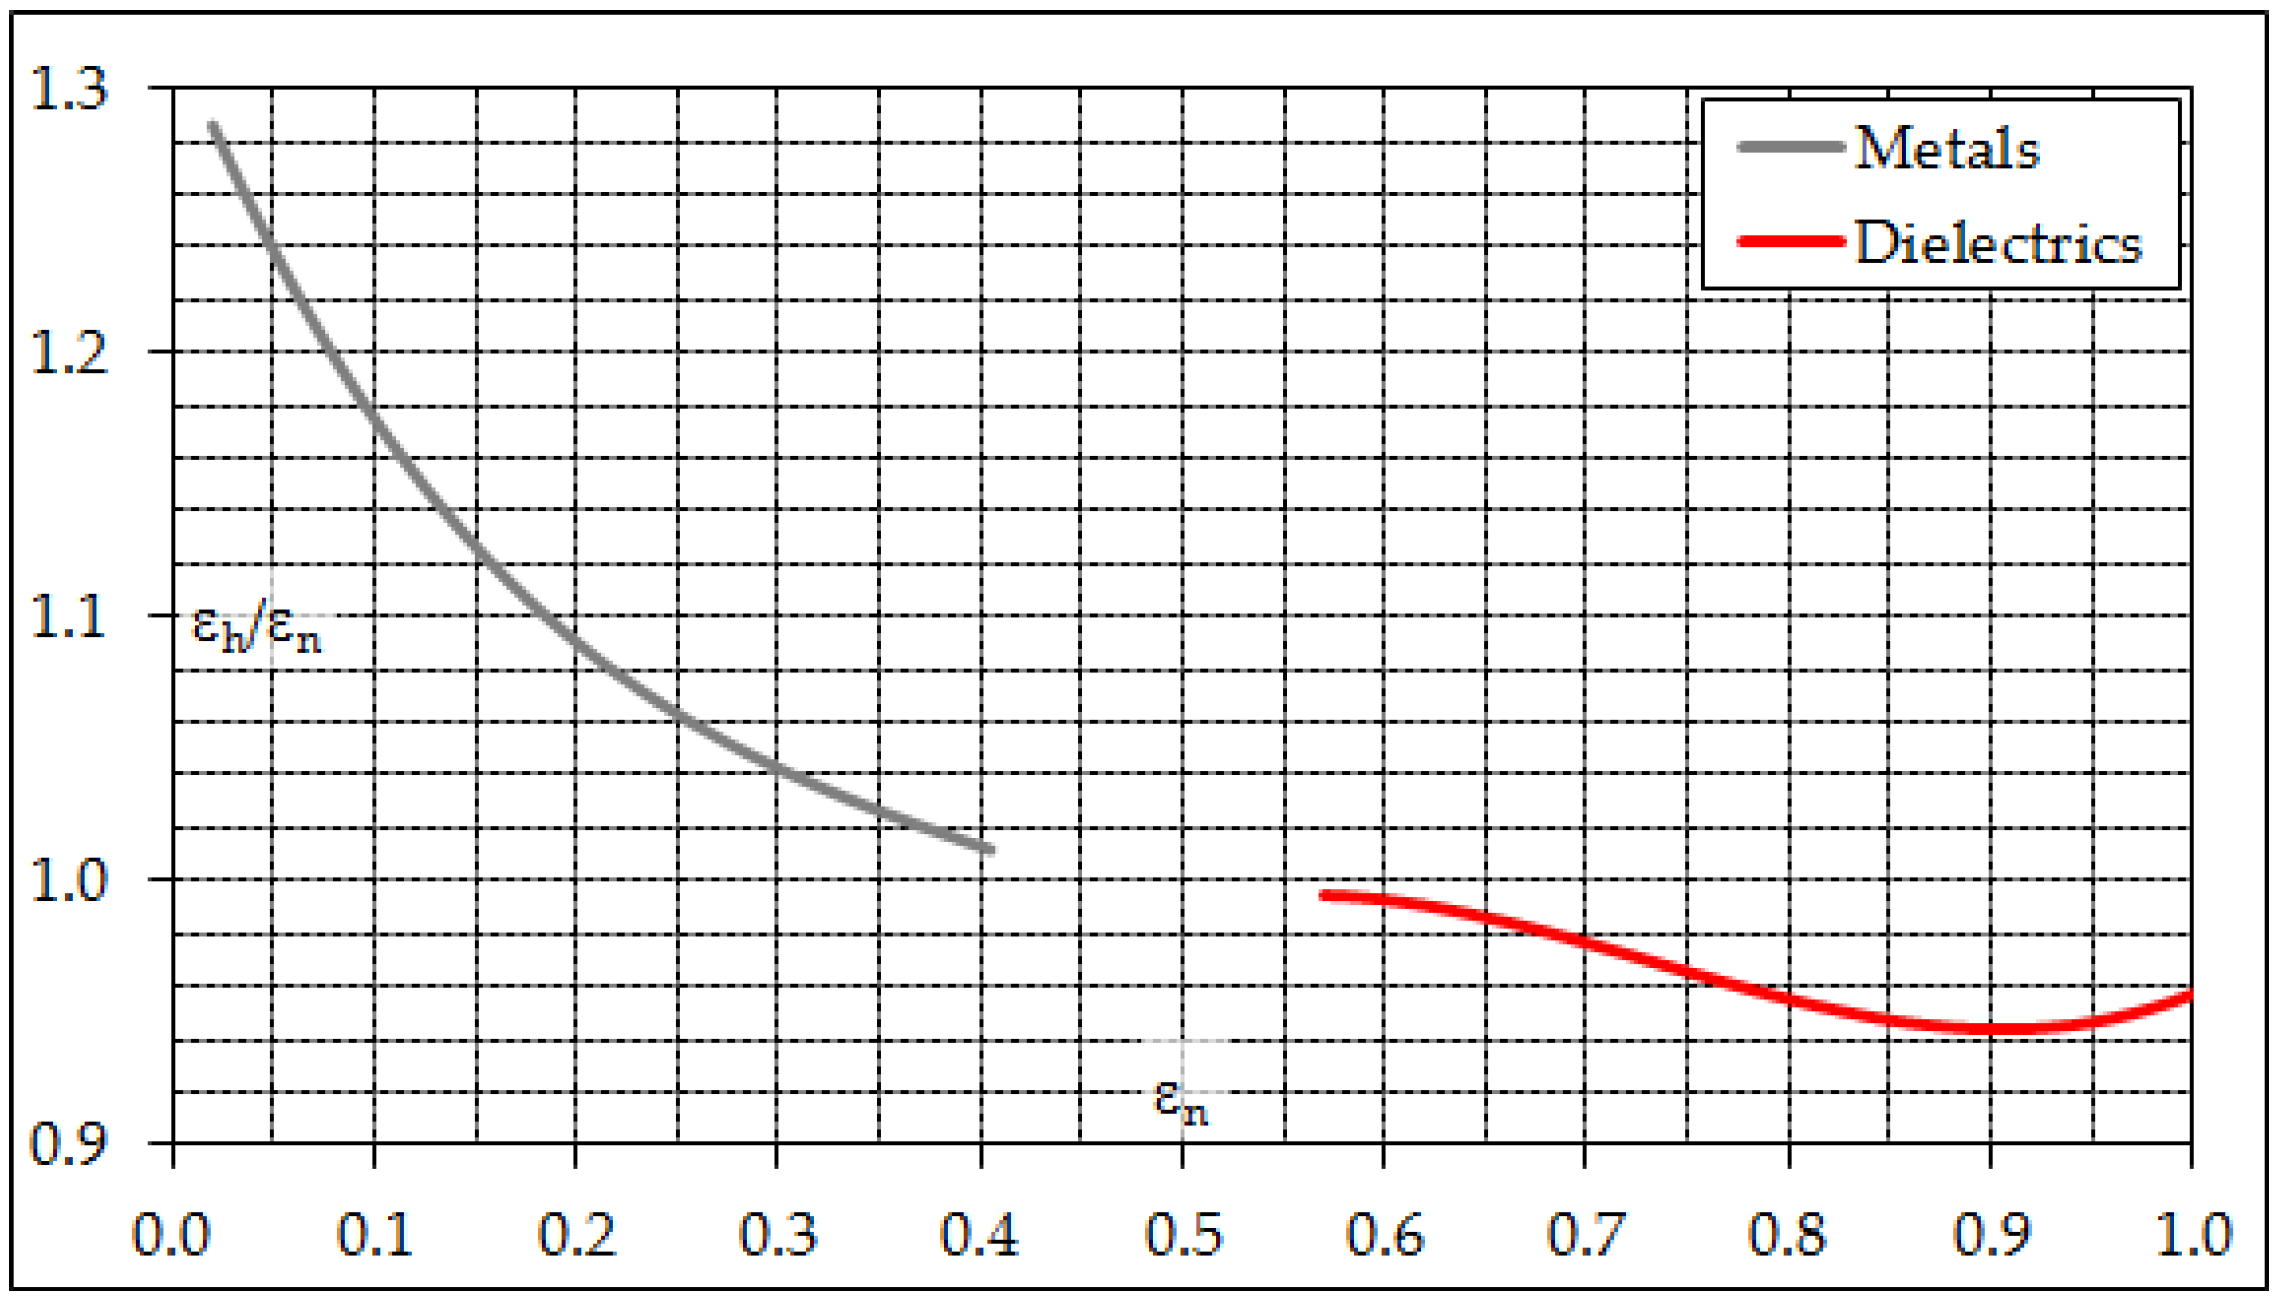
- Two test methods of practical relevance are available to measure thermal emittance, one (ASTM C1371) returning a hemispherical value and the other (EN 15976) a near-normal value. Unless properly corrected, near-normal emittance may represent a non-negligible overestimation of hemispherical emittance, the one relevant to infrared heat transfer between a built surface and the sky.
- The combined use of air mass 1.5 direct normal radiation spectra and near-normal emittance can lead to a significant overestimation of SRI with respect to using air mass 1 global horizontal radiation spectra and hemispherical emittance, especially for surfaces with high or intermediate solar reflectance. The freedom of choice apparently allowed by standard test methods and rating systems may induce such an unfair situation.
- The surface performance achieved after ageing is relevant to the long-term behavior of built surfaces and therefore this should be considered in regulations rather than that initially measured. Nonetheless at least three years are needed for natural ageing—a requisite that is not easily accepted by the industry—and randomly variable conditions are also possible in the weathering sites due to variations in meteorology and air pollution.
- In many countries different from the U.S. the regulations on solar reflective materials are still under development and only initial values of surface properties are considered, or can be provided by product manufacturers. On the other hand, a fast improvement of commercial products and regulations may be impeded by the long time required for natural ageing.
- A recently developed laboratory test method for accelerated ageing—already a standard test method—makes it possible to condense into three days the three-year long process of natural ageing required by CRRC. It proved to be easy and fast to perform, repeatable, and, above all, able to reproduce the reflectance obtained in a wide range of naturally exposed roofing products.
- In order to create a fair global market for solar reflective products, as well as to favor their use where this is still undeveloped, a general alignment is required on measurement methods. The use of a common solar spectrum is desirable for solar reflectance measurement, possibly representative of peak heat load conditions. The use of hemispherical thermal emittance should also be clearly specified. Under these conditions, the effects of both reflectance and emittance can be effectively summarized by the SRI. In order to consider aged values of SRI—that is, those relevant to the long term performance of built surfaces—worldwide use of an accelerated soiling method such as that specified by ASTM D7897 may greatly speed up the development and qualification of durable products, thus favoring the diffusion of specific performance limits intended to improve building energy efficiency and limit urban warming.
Acknowledgments
Conflicts of Interest
References
- United Nations. World Urbanization Prospects: 2014 Revision; United Nations: New York, NY, USA, 2014. [Google Scholar]
- Santamouris, M. Analyzing the heat island magnitude and characteristics in one hundred Asian and Australian cities and regions. Sci. Total Environ. 2015, 512–513, 582–598. [Google Scholar] [CrossRef] [PubMed]
- NASA—Goddard Institute for Space Studies. NASA-GISS, 2017. GISS Surface Temperature Analysis (GISTEMP); NASA—Goddard Institute for Space Studies: New York, NY, USA, 2017. [Google Scholar]
- Santamouris, M. Regulating the damaged thermostat of the cities—Status, impacts and mitigation challenges. Energy Build. 2015, 91, 43–56. [Google Scholar] [CrossRef]
- Santamouris, M.; Cartalis, C.; Synnefa, A.; Kolokotsa, D. On the impact of urban heat island and global warming on the power demand and electricity consumption of buildings—A review. Energy Build. 2015, 98, 119–124. [Google Scholar] [CrossRef]
- Akbari, H.; Pomerantz, M.; Taha, H. Cool surfaces and shade trees to reduce energy use and improve air quality in urban areas. Sol. Energy 2001, 70, 295–310. [Google Scholar] [CrossRef]
- Akbari, H.; Cartalis, C.; Kolokotsa, D.; Muscio, A.; Pisello, A.L.; Rossi, F.; Santamouris, M.; Synnefa, A.; Wong, N.H.; Zinzi, M. Local climate change and urban heat island mitigation techniques—The state of the art. J. Civ. Eng. Manag. 2016, 22, 1–16. [Google Scholar] [CrossRef]
- European Committee for Standardization (CEN). EN ISO 13786:2007—Thermal Performance of Building Components—Dynamic Thermal Characteristics—Calculation Methods; European Committee for Standardization (CEN): Brussels, Belgium, 2007. [Google Scholar]
- ASTM International. ASTM E1980-11—Standard Practice for Calculating Solar Reflectance Index of Horizontal and Low Sloped Opaque Surfaces; ASTM International: West Conshohocken, PA, USA, 2011. [Google Scholar]
- U.S. Green Building Council. LEED v4 for Building Design and Construction; (updated July 8, 2017); U.S. Green Building Council: Washington, DC, USA.
- California Energy Commission. 2016 Building Energy Efficiency Standards for Residential and Nonresidential Buildings—Title 24, Part 6, and Associated Administrative Regulations in Part 1; California Energy Commission: Sacramento, CA, USA, 2015.
- Environmental Protection Agency. ENERGY STAR® Program Requirements—Product Specification for Roof Products—Eligibility Criteria—Version 3.0; Environmental Protection Agency: Washington, DC, USA, 2013.
- Muscio, A.; Akbari, H. An index for the overall performance of opaque building elements subjected to solar radiation. Energy Build. 2017, 157, 184–194. [Google Scholar] [CrossRef]
- Cool Roof Rating Council. ANSI/CRRC S100 (2016)—Standard Test Methods for Determining Radiative Properties of Materials, Properties of Materials; Cool Roof Rating Council: Portland, OR, USA, 2016. [Google Scholar]
- European Cool Roof Council. Product Rating Manual; (November 2014); European Cool Roof Council: Brussels, Belgium, 2014. [Google Scholar]
- European Committee for standardization (CEN). EN ISO/IEC 17025:2005—General Requirements for the Competence of Testing and Calibration Laboratories; European Committee for standardization (CEN): Brussels, Belgium, 2005. [Google Scholar]
- European Committee for standardization (CEN). EN ISO 6946:2007—Building Components and Building Elements—Thermal Resistance and Thermal Transmittance—Calculation Method; European Committee for standardization (CEN): Brussels, Belgium, 2007. [Google Scholar]
- American Society of Heating, Refrigerating and Air-Conditioning Engineers. ASHRAE Handbook Fundamentals 2009; (SI edition); American Society of Heating, Refrigerating and Air-Conditioning Engineers: Atlanta, GA, USA, 2009. [Google Scholar]
- Kakaç, S.; Shah, R.K.; Aung, W. (Eds.) Handbook of Single-Phase Convective Heat Transfer; Wiley-Interscience: New York, NY, USA, 1987; ISBN 978-0-47-181702-4. [Google Scholar]
- Incropera, F.P.; De Witt, D.P. Fundamentals of Heat and Mass Transfer, 5th ed.; John Wiley and Sons: Hoboken, NJ, USA, 2005; ISBN 978-0-47-138650-6. [Google Scholar]
- ASTM International. ASTM E903-12—Standard Test Method for Solar Absorptance, Reflectance, and Transmittance of Materials Using Integrating Spheres; ASTM International: West Conshohocken, PA, USA, 2012. [Google Scholar]
- European Committee for Standardization (CEN). EN 410:2011—Glass in Building—Determination of Luminous and Solar Characteristics of Glazing; European Committee for Standardization (CEN): Brussels, Belgium, 2011. [Google Scholar]
- Levinson, R.; Akbari, H.; Berdahl, P. Measuring solar reflectance—Part I: Defining a metric that accurately predicts solar heat gain. Sol. Energy 2010, 84, 1717–1744. [Google Scholar] [CrossRef]
- Levinson, R.; Akbari, H.; Berdahl, P. Measuring solar reflectance—Part II: Review of practical methods. Sol. Energy 2010, 84, 1745–1759. [Google Scholar] [CrossRef]
- ASTM International. ASTM C1549-09 (Reapproved 2014)—Standard Test Method for Determination of Solar Reflectance Near Ambient Temperature Using a Portable Solar Reflectometer; ASTM International: West Conshohocken, PA, USA, 2014. [Google Scholar]
- ASTM International. ASTM E891-87(1992)—Tables for Terrestrial Direct Normal Solar Spectral Irradiance Tables for Air Mass 1.5 (Withdrawn 1999); ASTM International: West Conshohocken, PA, USA, 1992. [Google Scholar]
- ASTM International. ASTM G173-03(2012)—Standard Tables for Reference Solar Spectral Irradiances: Direct Normal and Hemispherical on 37° Tilted Surface; ASTM International: West Conshohocken, PA, USA, 2012. [Google Scholar]
- Berdahl, P.; Akbari, H.; Levinson, R.; Miller, W.A. Weathering of roofing materials—An overview. Constr. Build. Mater. 2008, 22, 423–433. [Google Scholar] [CrossRef]
- Sleiman, M.; Ban-Weiss, G.; Gilbert, H.E.; Francois, D.; Berdahl, P.; Kirchstetter, T.W.; Destaillats, H.; Levinson, R. Soiling of building envelope surfaces and its effect on solar reflectance—Part I: Analysis of roofing product databases. Sol. Energy Mater. Sol. Cells 2011, 95, 3385–3399. [Google Scholar] [CrossRef]
- Sleiman, M.; Kirchstetter, T.W.; Berdahl, P.; Gilbert, H.E.; Quelen, S.; Marlot, L.; Preble, C.V.; Chen, S.; Montalbano, A.; Rosseler, O.; et al. Soiling of building envelope surfaces and its effect on solar reflectance—Part II: Development of an accelerated aging method for roofing materials. Sol. Energy Mater. Sol. Cells 2014, 122, 271–281. [Google Scholar] [CrossRef]
- Sleiman, M.; Chen, S.; Gilbert, H.E.; Kirchstetter, T.W.; Berdahl, P.; Bibian, E.; Bruckman, L.S.; Cremona, D.; French, L.H.; Gordon, D.A.; et al. Soiling of building envelope surfaces and its effect on solar reflectance—Part III: Interlaboratory study of an accelerated aging method for roofing materials. Sol. Energy Mater. Sol. Cells 2015, 143, 581–590. [Google Scholar] [CrossRef]
- ASTM International. ASTM D7897-15—Standard Practice for Laboratory Soiling and Weathering of Roofing Materials to Simulate Effects of Natural Exposure on Solar Reflectance and Thermal Emittance; ASTM International: West Conshohocken, PA, USA, 2015. [Google Scholar]
- ASTM International. ASTM E1918-16—Standard Test Method for Measuring Solar Reflectance of Horizontal and Low-Sloped Surfaces in the Field; ASTM International: West Conshohocken, PA, USA, 2016. [Google Scholar]
- Levinson, R.; Berdahl, P.; Akbari, H.; Miller, W.A.; Joedicke, I.; Reilly, J.; Suzuki, Y.; Vondran, M. Methods of creating solar-reflective nonwhite surfaces and their application to residential roofing materials. Sol. Energy Mater. Sol. Cells 2007, 91, 304–314. [Google Scholar] [CrossRef]
- Rosenfeld, A.H.; Akbari, H.; Bretz, S.; Fishman, B.L.; Kurn, D.M.; Sailor, D.; Taha, H. Mitigation of urban heat islands: Materials, utility programs, updates. Energy Build. 1995, 22, 255–265. [Google Scholar] [CrossRef]
- Bretz, S.; Akbari, H.; Rosenfeld, A.H. Practical issues for using solar-reflective materials to mitigate urban heat islands. Atmos. Environ. 1998, 32, 95–101. [Google Scholar] [CrossRef]
- Libbra, A.; Muscio, A.; Siligardi, C.; Tartarini, P. Assessment and improvement of the performance of antisolar surfaces and coatings. Prog. Org. Coat. 2011, 72, 73–80. [Google Scholar] [CrossRef]
- Libbra, A.; Muscio, A.; Siligardi, C. Energy performance of opaque building elements in summer: Analysis of a simplified calculation method in force in Italy. Energy Build. 2013, 64, 384–394. [Google Scholar] [CrossRef]
- ASTM International. ASTM C1371-15—Standard Test. Method for Determination of Emittance of Materials Near Room Temperature Using Portable Emissometers; ASTM International: West Conshohocken, PA, USA, 2015. [Google Scholar]
- European Committee for standardization (CEN). EN 15976—Flexible sheets for waterproofing—Determination of emissivity; European Committee for standardization (CEN): Brussels, Belgium, 2011. [Google Scholar]
- Kollie, T.G.; Weaver, F.J.; McElroy, D.L. Evaluation of a commercial, portable, ambient temperature emissometer. Rev. Sci. Instrum. 1990, 61, 1509–1517. [Google Scholar] [CrossRef]
- Devices & Services Co. D&S Technical Note 92-11—Emissometer Model. AE—Hemispherical vs Normal Emittance; Devices & Services Co.: Dallas, TX, USA, 1992. [Google Scholar]
- Devices & Services Co. D&S Technical Note 04-1—Emissometer Model AE—Slide Method for AE Measurements; Devices & Services Co.: Dallas, TX, USA, 2004. [Google Scholar]
- Devices & Services Co. D&S Technical Note 10-2—Emissometer Model AE1—Slide Method for High. Emittance Materials with Low Thermal Conductivity; Devices & Services Co.: Dallas, TX, USA, 2010. [Google Scholar]
- Pini, F.; Ferrari, C.; Libbra, A.; Leali, F.; Muscio, A. Robotic implementation of the slide method for measurement of thermal emissivity of building elements. Energy Build. 2016, 114, 241–246. [Google Scholar] [CrossRef]
- Rubin, M.; Arasteh, D.; Hartmann, J. A correlation between normal and hemispherical emissivity coatings on glass. Int. Commun. Heat Mass Transf. 1997, 14, 561–565. [Google Scholar] [CrossRef]
- National Fenestration Rating Council Inc. NFRC 301-2014[E0A0]—Standard Test Method for Emittance of Specular Surfaces Using Spectrometric Measurements; National Fenestration Rating Council Inc.: Greenbelt, MD, USA.
- Devices & Services Co. D&S Technical Note 11-2—Model. AE1 Emittance Measurements Using a Port. Adapter, Model. AE-ADP; Devices & Services Co.: Dallas, TX, USA, 2011. [Google Scholar]
- Paolini, R.; Zinzi, M.; Poli, T.; Carnielo, E.; Mainini, A.G. Effect of ageing on solar spectral reflectance of roofing membranes: Natural exposure in Roma and Milano and the impact on the energy needs of commercial buildings. Energy Build. 2014, 84, 333–343. [Google Scholar] [CrossRef]


| AM1GH | EN410G | G173GT | G173DN | E891BN | |
|---|---|---|---|---|---|
| UV (300–400 nm) | 6.8 | 6.4 | 4.7 | 3.5 | 3.0 |
| Vis (400–700 nm) | 44.7 | 44.1 | 43.3 | 42.0 | 39.0 |
| NIR (700–2500 nm) | 48.5 | 49.5 | 52.0 | 54.5 | 58.0 |
| Sample | Reference Solar Spectrum | ||||
|---|---|---|---|---|---|
| Lab. code | Description | EN410G | G173GT | G173DN | E891BN |
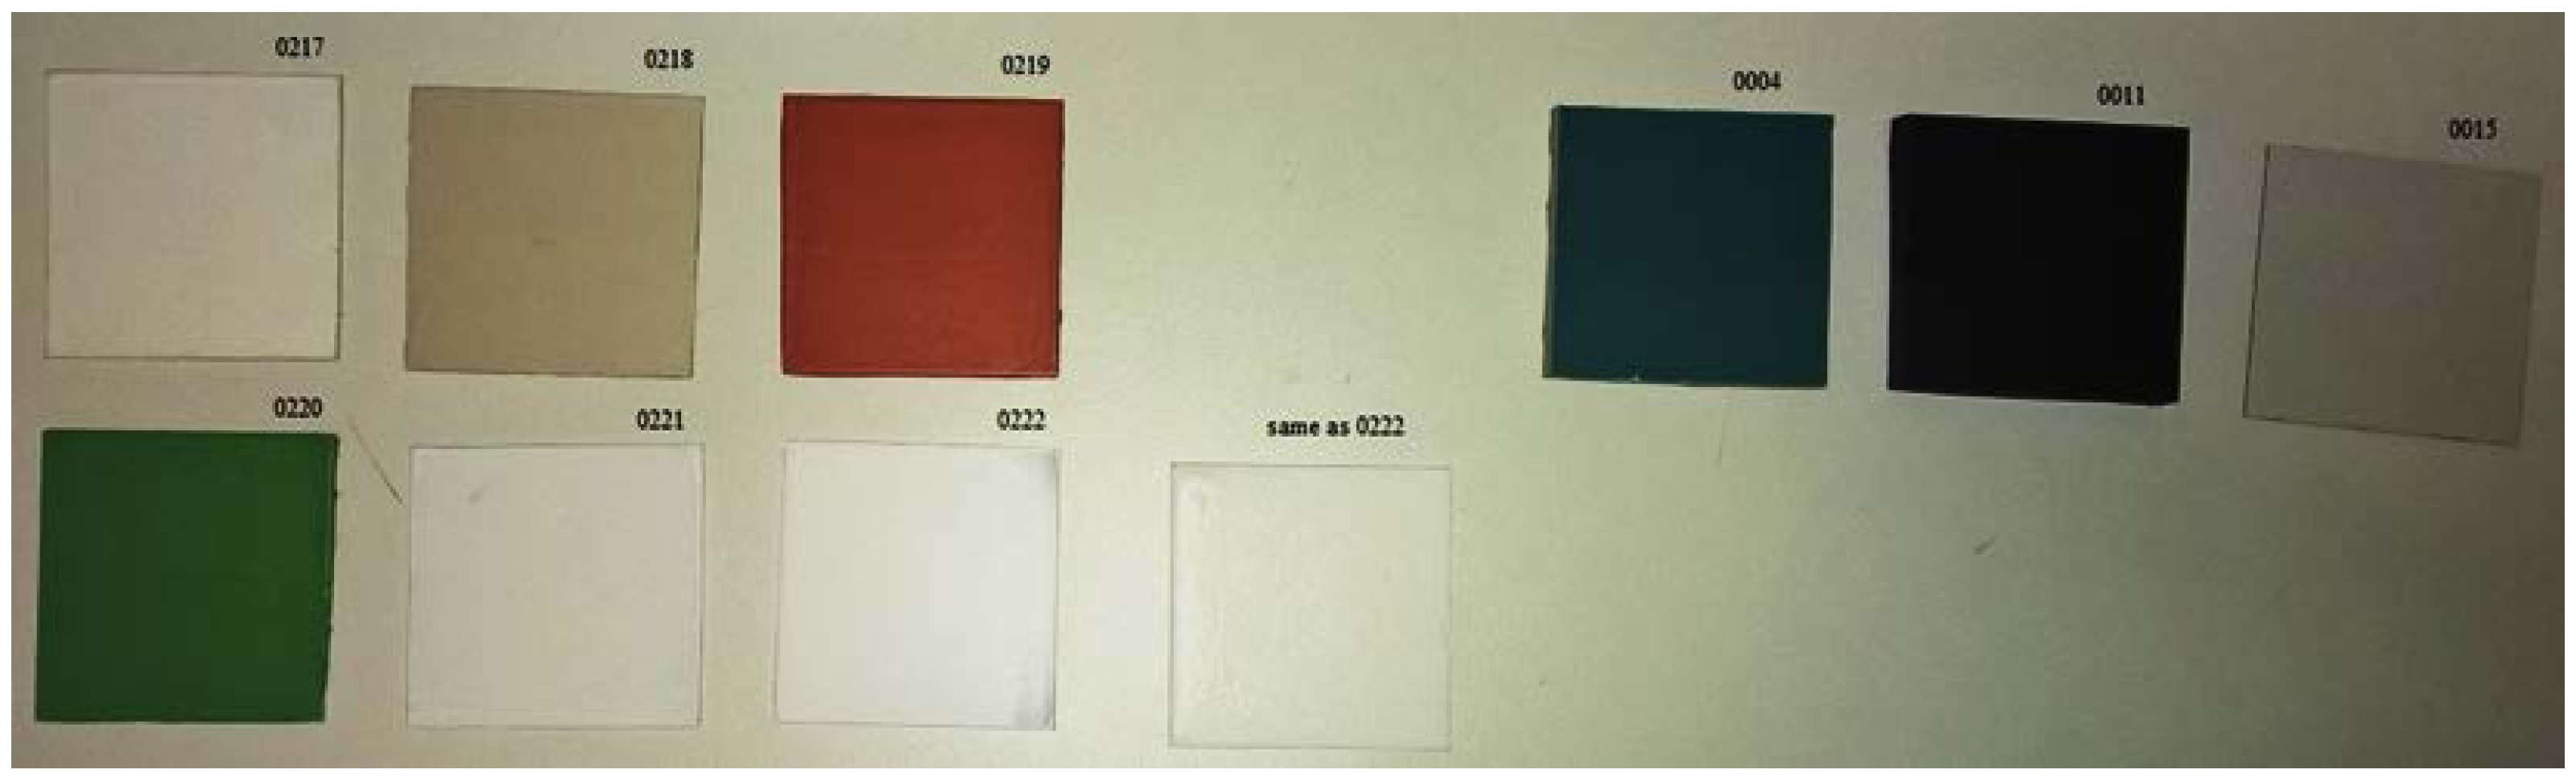
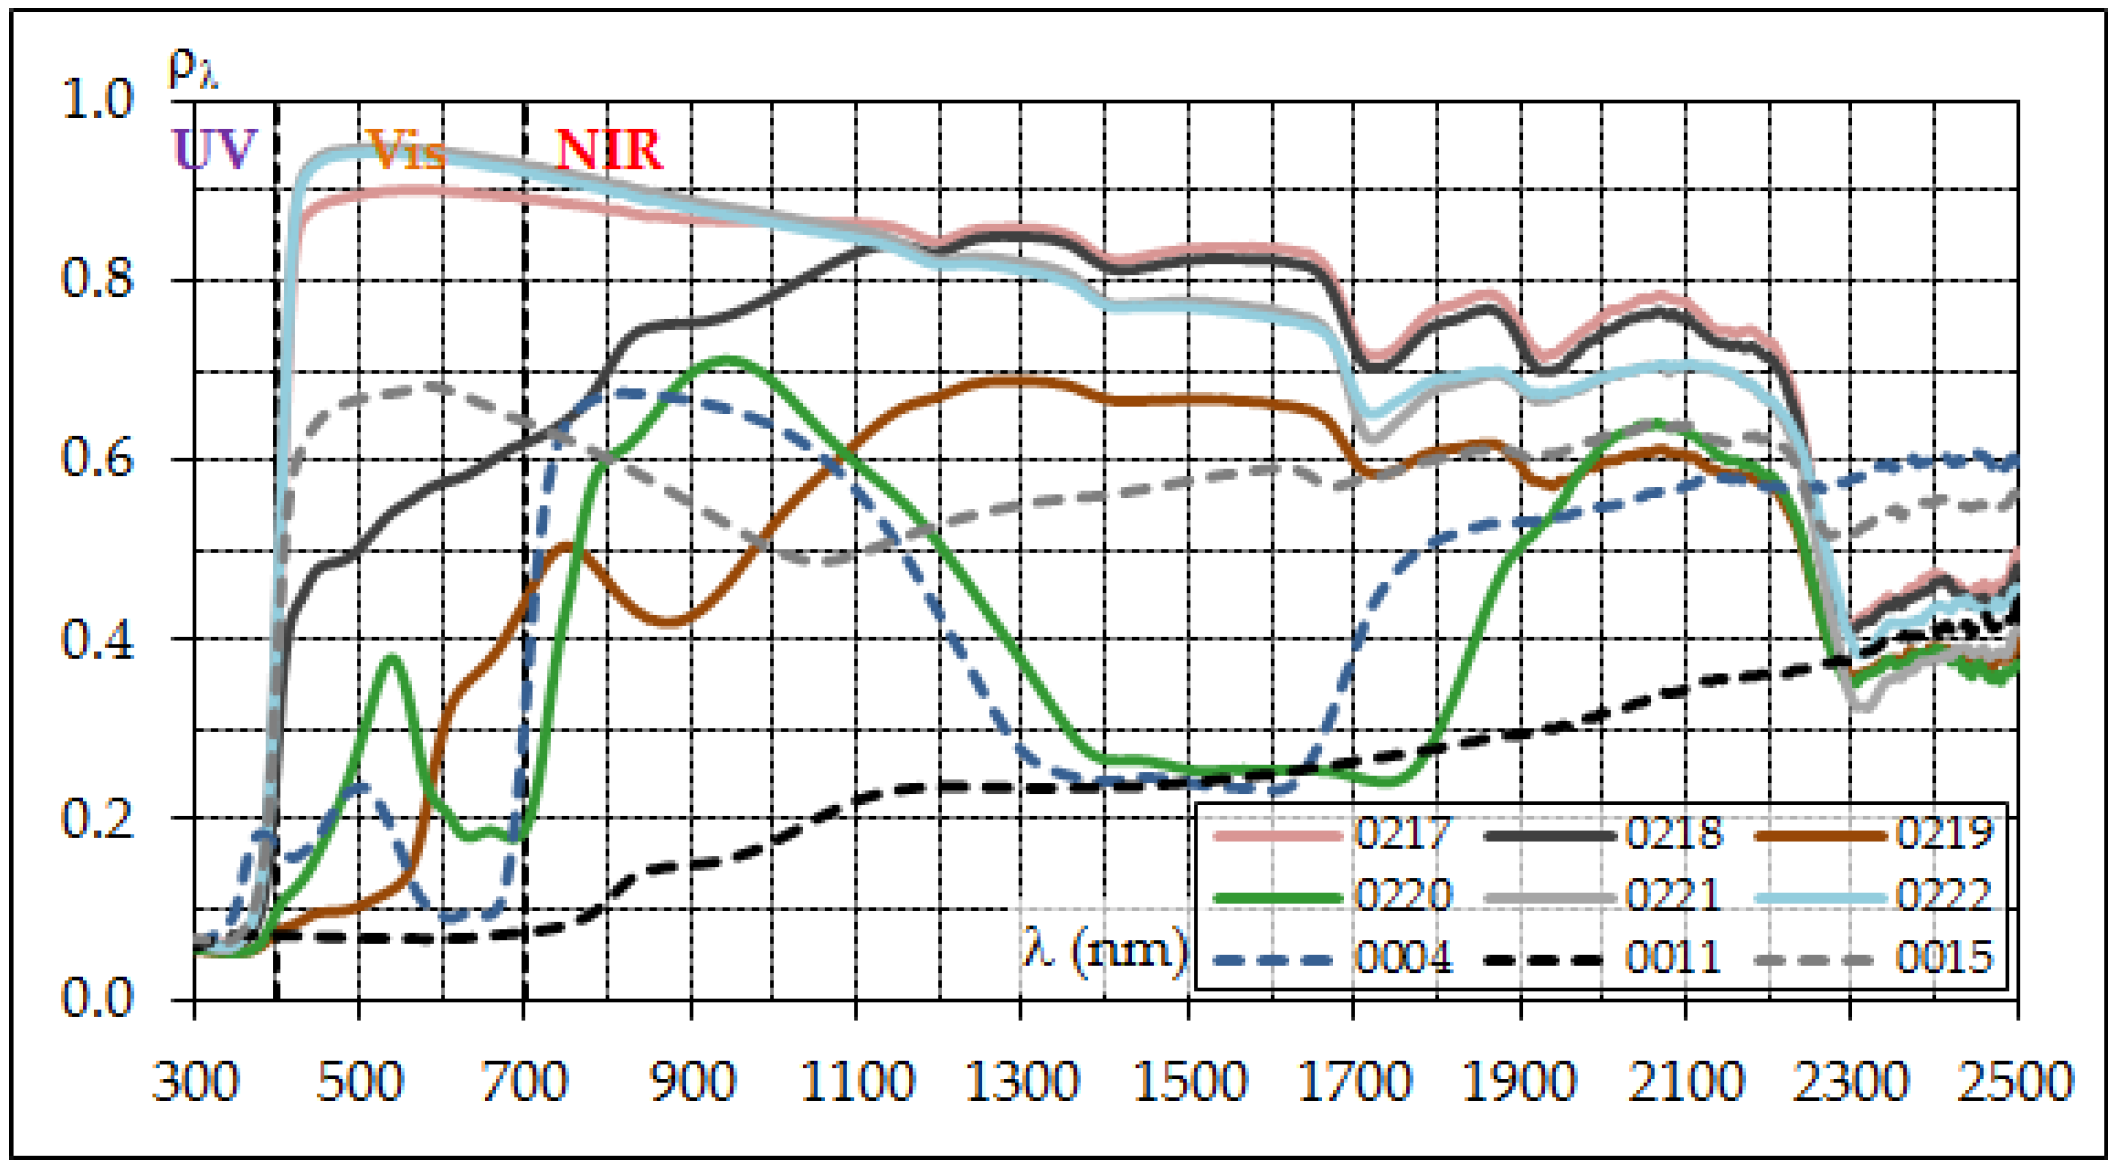
| 0217 | Elastomeric water based paint on aluminum | 0.816 | 0.826 | 0.836 | 0.839 |
| - | 0.799 | 0.810 | 0.815 | ||
| 0218 | Elastomeric water based paint on aluminum | 0.612 | 0.625 | 0.637 | 0.650 |
| - | 0.606 | 0.623 | 0.635 | ||
| 0219 | Elastomeric water based paint on aluminum | 0.359 | 0.372 | 0.385 | 0.401 |
| - | 0.367 | 0.380 | 0.389 | ||
| 0220 | Elastomeric water based paint on aluminum | 0.357 | 0.367 | 0.377 | 0.388 |
| - | 0.358 | 0.367 | 0.378 | ||
| 0221 | Elastomeric water based paint on aluminum | 0.835 | 0.845 | 0.853 | 0.854 |
| 0.817 | 0.826 | 0.828 | |||
| 0222 | Elastomeric water based paint on aluminum | 0.828 | 0.838 | 0.846 | 0.848 |
| - | 0.815 | 0.824 | 0.830 | ||
| 0004 | Engobed ceramic til | 0.347 | 0.356 | 0.365 | 0.377 |
| - | 0.348 | 0.354 | 0.364 | ||
| 0011 | Engobed ceramic til | 0.125 | 0.128 | 0.132 | 0.138 |
| - | 0.125 | 0.128 | 0.133 | ||
| 0015 | Engobed ceramic til | 0.577 | 0.583 | 0.588 | 0.589 |
| - | 0.564 | 0.570 | 0.570 | ||
© 2018 by the author. Licensee MDPI, Basel, Switzerland. This article is an open access article distributed under the terms and conditions of the Creative Commons Attribution (CC BY) license (http://creativecommons.org/licenses/by/4.0/).
Share and Cite
Muscio, A. The Solar Reflectance Index as a Tool to Forecast the Heat Released to the Urban Environment: Potentiality and Assessment Issues. Climate 2018, 6, 12. https://doi.org/10.3390/cli6010012
Muscio A. The Solar Reflectance Index as a Tool to Forecast the Heat Released to the Urban Environment: Potentiality and Assessment Issues. Climate. 2018; 6(1):12. https://doi.org/10.3390/cli6010012
Chicago/Turabian StyleMuscio, Alberto. 2018. "The Solar Reflectance Index as a Tool to Forecast the Heat Released to the Urban Environment: Potentiality and Assessment Issues" Climate 6, no. 1: 12. https://doi.org/10.3390/cli6010012
APA StyleMuscio, A. (2018). The Solar Reflectance Index as a Tool to Forecast the Heat Released to the Urban Environment: Potentiality and Assessment Issues. Climate, 6(1), 12. https://doi.org/10.3390/cli6010012