Article

Recognition of Thermal Hot and Cold Spots in Urban Areas in Support of Mitigation Plans to Counteract Overheating: Application for Athens

by
Thaleia Mavrakou
1,*,
Anastasios Polydoros
1,
Constantinos Cartalis
1 and
Mat Santamouris
2
1
Department of Physics, National and Kapodistrian University of Athens, 15772 Athens, Greece
2
Faculty of Built Environment, University of New South Wales, Sydney 2052, Australia
*
Author to whom correspondence should be addressed.
Climate 2018, 6(1), 16; https://doi.org/10.3390/cli6010016
Submission received: 30 January 2018 / Revised: 5 March 2018 / Accepted: 5 March 2018 / Published: 9 March 2018

Abstract

:
Mitigation plans to counteract overheating in urban areas need to be based on a thorough knowledge of the state of the thermal environment, most importantly on the presence of areas which consistently demonstrate higher or lower urban land surface temperatures (hereinafter referred to as “hot spots” or “cold spots”, respectively). The main objective of this research study is to develop a methodological approach for the recognition of thermal “hot spots” and “cold spots” in urban areas during summer; this is accomplished with (a) the combined use of high and medium spatial resolution satellite data (Landsat 8 and Terra-MODIS, respectively); (b) the downscaling of the Terra-MODIS satellite data so as to acquire spatial resolution similar to the Landsat one and at the same time take advantage of the high revisit time as compared to the respective one of Landsat (16 days); and (c) the application of a statistical clustering technique to recognize “hot spots” and “cold spots”. The methodological approach was applied as a case study for the urban area of Athens, Greece for a summer period. Results demonstrated the capacity of the methodological approach to recognize “hot spots” and “cold spots”, revealed a strong relationship between land use and “hot spots” and “cold spots”, and showed that the average land surface temperature (LST) difference between the “hot spots” and “cold spots” can reach 9.1 °K.

1. Introduction

The thermal environment in several urban areas worldwide has experienced a rapid deterioration, leading to the overheating of cities. The increase of temperature may be attributed to the influence of the radiative properties of urban surfaces and the three-dimensional configuration and heat capacity of buildings [1,2,3,4,5,6]. In response to the increased urban (air and land surface) temperatures and the strong relationship between high urban air temperatures and adverse heat-related health outcomes (e.g., thermal discomfort, mortality, and heat-related illness) [7,8,9,10,11,12], urban planners and decision makers are recognizing the growing need to create more attractive, thermally comfortable, and sustainable cities, especially as urban populations expand and climatic variability and extremes increase [13,14,15]. Results of specific building adaptation studies for Athens, Greece showed that this is possible when appropriate and energy-efficient building technologies are used [16].
In support of mitigation plans, satellite imagery in the thermal infrared (TIR) can be used as a tool to identify thermal “hot spots” and “cold spots” and correlate the state of the thermal environment to land use composition [17,18,19,20]. “Hot spots” and “cold spots” are defined as areas which consistently demonstrate higher or lower land surface temperature (LST), respectively, as compared to their surrounding areas. Taken that areas of high air temperature coincide with areas of LST when coarse spatial resolution data is used (with a resolution >30 m) [13], the recognition of “hot spots” and “cold spots” can also support the extraction of information on the spatial distribution of air temperatures. As a matter of fact, several studies have successfully correlated air and land surface temperatures, while several researchers have successfully estimated air temperature from remote sensing data [21,22,23,24,25,26]. Coutts et al. [13] used very high resolution airborne thermal infrared data in conjunction with Landsat and MODIS data in order to assess the adequacy of satellite TIR data to “hot spot” recognition. They found that Landsat data are suitable for “hot spot” recognition and supportive for mitigation plans to counteract overheating due to the adequate spatial coverage, the free data accessibility, the routine capture, and the well-documented processes and corrections. A disadvantage for the use of Landsat TIR data is the low temporal resolution, as the period between two successive passes of the satellite is 16 days [27,28]. This may result to an unavailability of cloud free images for a long period if only Landsat data are used. To overcome this problem, TIR data from the MODIS instrument on board the Terra satellite are used; such data have a daily temporal resolution, but fall back in spatial resolution (1 km) [29,30,31,32]. To this end, disaggregation methods (i.e., the improvement of the coarser spatial resolution of TIR images by introducing spatial detail from a finer resolution image) for downscaling MODIS TIR need to be applied, so as to match the respective spatial resolution of the Landsat data.
Several disaggregation methods have been suggested in order to enhance the spatial resolution of the TIR data by linking TIR and visible and near infrared (VNIR) data [33,34,35]. These methods utilize the relation between the land cover and the LST; at first the relation between the coarser resolution TIR and VNIR bands is estimated and is thereafter applied at the finer resolution VNIR data in order to obtain finer resolution TIR data [33]. Different disaggregation methods in support of the MODIS LST product have been proposed in literature [36,37], while Bisquert et al. [33] applied and compared many of these methods to MODIS and Landsat sensors. Results showed that the linear regression between the normalized difference vegetation index (NDVI) and LST lead to better results, with RMSE values around ±2 K, compared to other regressions or to more sophisticated approaches (Neural Networks and Data Mining).
The main objective of the current research is to develop a methodological approach for the recognition of “hot spots” and “cold spots” in urban areas during summer; this is accomplished with the combined use of high and medium spatial resolution satellite data in the thermal infrared, from the Landsat 8 and Terra satellites, respectively. A secondary objective is to investigate the relationship of “hot spots” and “cold spots” with land use/land cover. Both objectives support the drafting of mitigation plans for counteracting the overheating of urban areas. The methodological approach for “hot spots” and “cold spots” recognition is presented in Section 2. In Section 3, the methodological approach is applied for the urban area of Athens, and results are discussed accordingly.

2. Methodological Approach

The adopted methodology for the identification of “hot spot” and “cold spot” areas is based on the use of satellite data. These areas are characterized by very high (“hot spots”) and very low (“cold spots”) LST values in multi-temporal satellite images, assuming stable meteorological conditions and very limited, if any, land cover changes. Consequently, the satellite-based approach needs to be replicated for more than one day in order to assess the spatial consistency of the hot and cold spot areas. To this end, the analysis cannot be based merely on Landsat, taken that it overpasses every 16 days. MODIS provides LST data on a daily basis, whereas the application of downscaling allows for LST products at the same spatial resolution as Landsat. The multi-temporal analysis is even more necessary for the implementation of the methodology in other regions that may be characterized by unstable weather conditions, in order to investigate any large spatial variations of the hot/cold spot areas. In the following sections the required steps are described in detail.

2.1. Land Surface Temperature

The estimation of LST was based on the algorithm developed by Jiménez-Muñoz and Sobrino [38,39]. LST is retrieved from only one thermal channel, i.e., TIRS-10 (Equation (1)).
L S T = γ [ ε 1 ( ψ 1 L s e n + ψ 2 ) + ψ 3 ] + δ
where ε is the surface emissivity, L s e n is the radiance of the thermal channel TIRS-10, and γ, δ are two parameters given by
γ = T s e n 2 b γ L s e n ;   δ = T s e n T s e n 2 b γ
where T s e n is the brightness temperature of the thermal channel TIRS 10, b γ = 1324 for TIRS-10, and ψ 1 , ψ 2 , and ψ 3 are atmospheric functions given by
ψ 1 = 1 τ ;   ψ 2 = L d L u τ ;   ψ 3 = L d
where τ is the atmospheric transmission, L d is the downwelling radiance, and L u is the upwelling radiance. These parameters are calculated from the Atmospheric Correction Parameter Calculator provided by NASA (http://atmcorr.gsfc.nasa.gov) [40]. Land surface emissivity (ε) was estimated using the NDVI Thresholds Method as proposed by Sobrino et al. [41].

2.2. Downscaling Modis Data

In this study, the adopted disaggregation method for downscaling MODIS TIR data is based on the linear regression approach that leads to better results, as stated in [33]. Linear regression between Terra MODIS and Landsat 8 TIRS is applied in the event that no Landsat overpass coincides with a MODIS one, with low viewing angle, thus a close Landsat NDVI image is used under the assumption that NDVI remains constant.
Initially, a normalization process needs to be applied to Landsat data in order to minimize the discrepancies that result from the differences in spectral resolution, atmospheric correction, viewing angle, pixel footprint, time acquisition, etc., between the two sensors [33]. Subsequently, according to the disaggregation procedure followed in this study and presented schematically in Figure 1, the relationship between the coarser MODIS NDVI and LST at 960 m is obtained and subsequently applied to the MODIS NDVI at 960 m, resulting in the LST’ 960 m. The residuals as calculated by subtracting the LST’ 960 m from the LST 960 m, were added to the finer LST’ 30 m, which resulted from the application of the initial relationship to the finer Landsat NDVI 30 m, giving eventually the downscaled MODIS LST 30 m.

2.3. “Hot Spot” Recognition

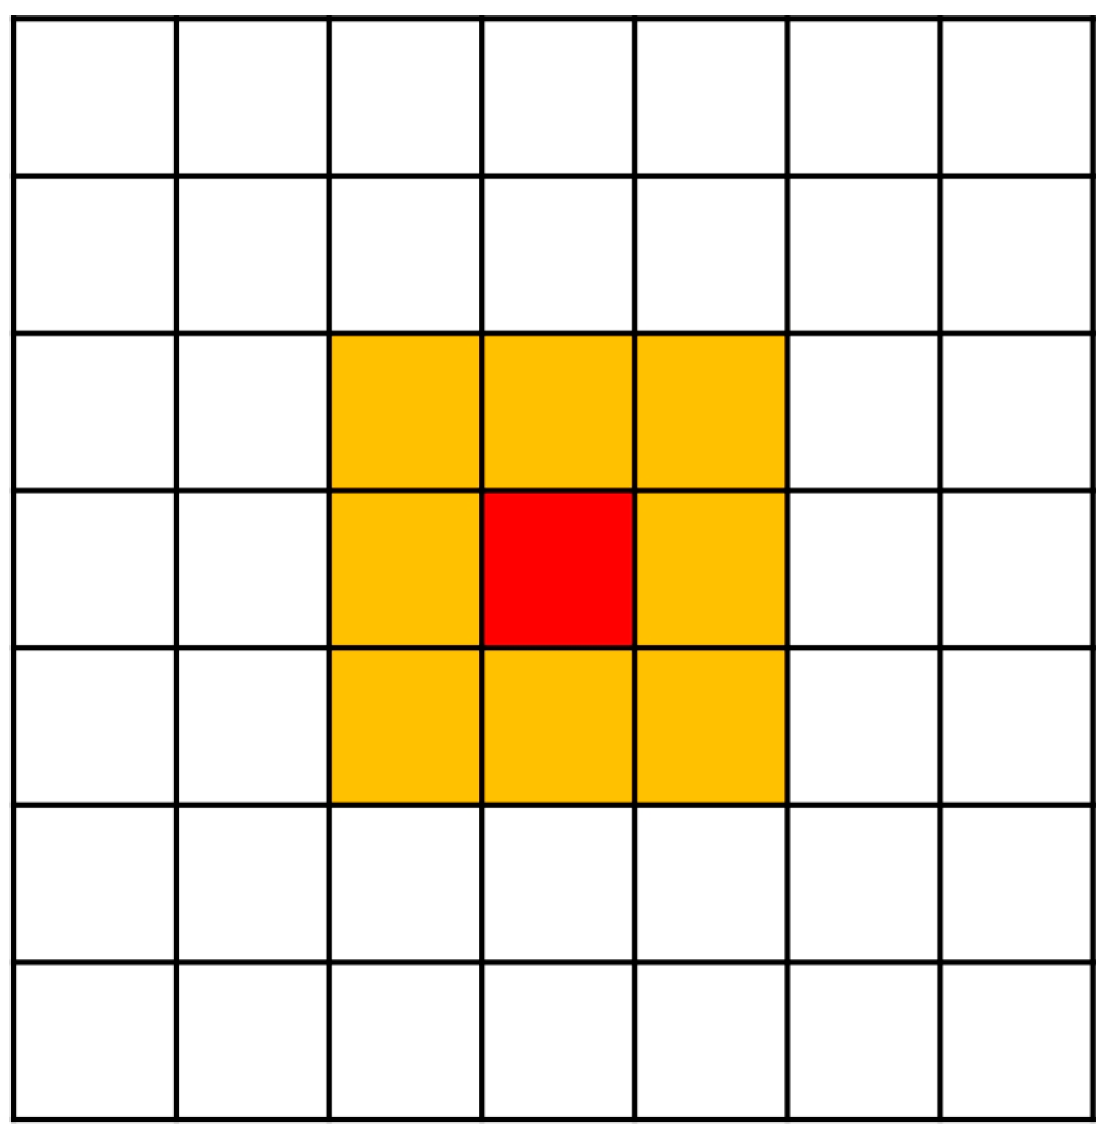
A statistical approach is applied so as to detect—and cluster—the presence of “hot spot” or “cold spot” areas over a study area by calculating G statistics [42] for each pixel in the image, as shown in Equations (2)–(4). The resulting z-scores show where the pixels with either high or low LST values cluster spatially, while they are also measures of statistical significance (Table 1). It is important to note that a pixel with a high LST value may not be a statistically significant “hot spot” if its neighbor pixels have much lower LST values. To be a statistically significant “hot spot”, a pixel must have a high value and be surrounded by other pixels with high values as well. The methodological approach suggests the use of all eight neighbor pixels in addition to the central one, in order to calculate the local sum and subsequently obtain the local average (i.e., local sum/9) of the main pixel (Figure 2). This procedure was selected in order to ensure that LST “hot spots” are related to air temperature “hot spots” given that a larger spatial domain is expected to relate better with the near-surface air temperature source area. This pixel value is then compared to the respective average value of the image (sum of all pixels in the study area/number of pixels in the study area). When the local average is very different from the image average, and the difference is too large to be the result of random chance, a statistically significant z-score is found. For statistically significant positive z-scores, the larger the z-score, the more intense is the clustering of high values (“hot spot”). For statistically significant negative z-scores, the smaller the z-score, the more intense is the clustering of low values (“cold spot”).
G i * = j = 1 n w i , j x j X ¯   j = 1 n w i , j S [ n j = 1 n w i , j 2 ( j = 1 n w i , j ) 2 ] n 1
X ¯ = j = 1 n x j n
S = j = 1 n x j 2 n ( X ¯ ) 2
where Gi* is the resultant G statistics (z-scores and p-values) for pixel i, xj is the LST value for pixel j, wi,j is the spatial weight between pixel i and neighboring pixel j, n is equal to the total number of pixels, X ¯ is the mean LST of all pixels, and S the variance.

3. Application of the Methodological Approach for the Urban Area of Athens, Greece

3.1. Application Area

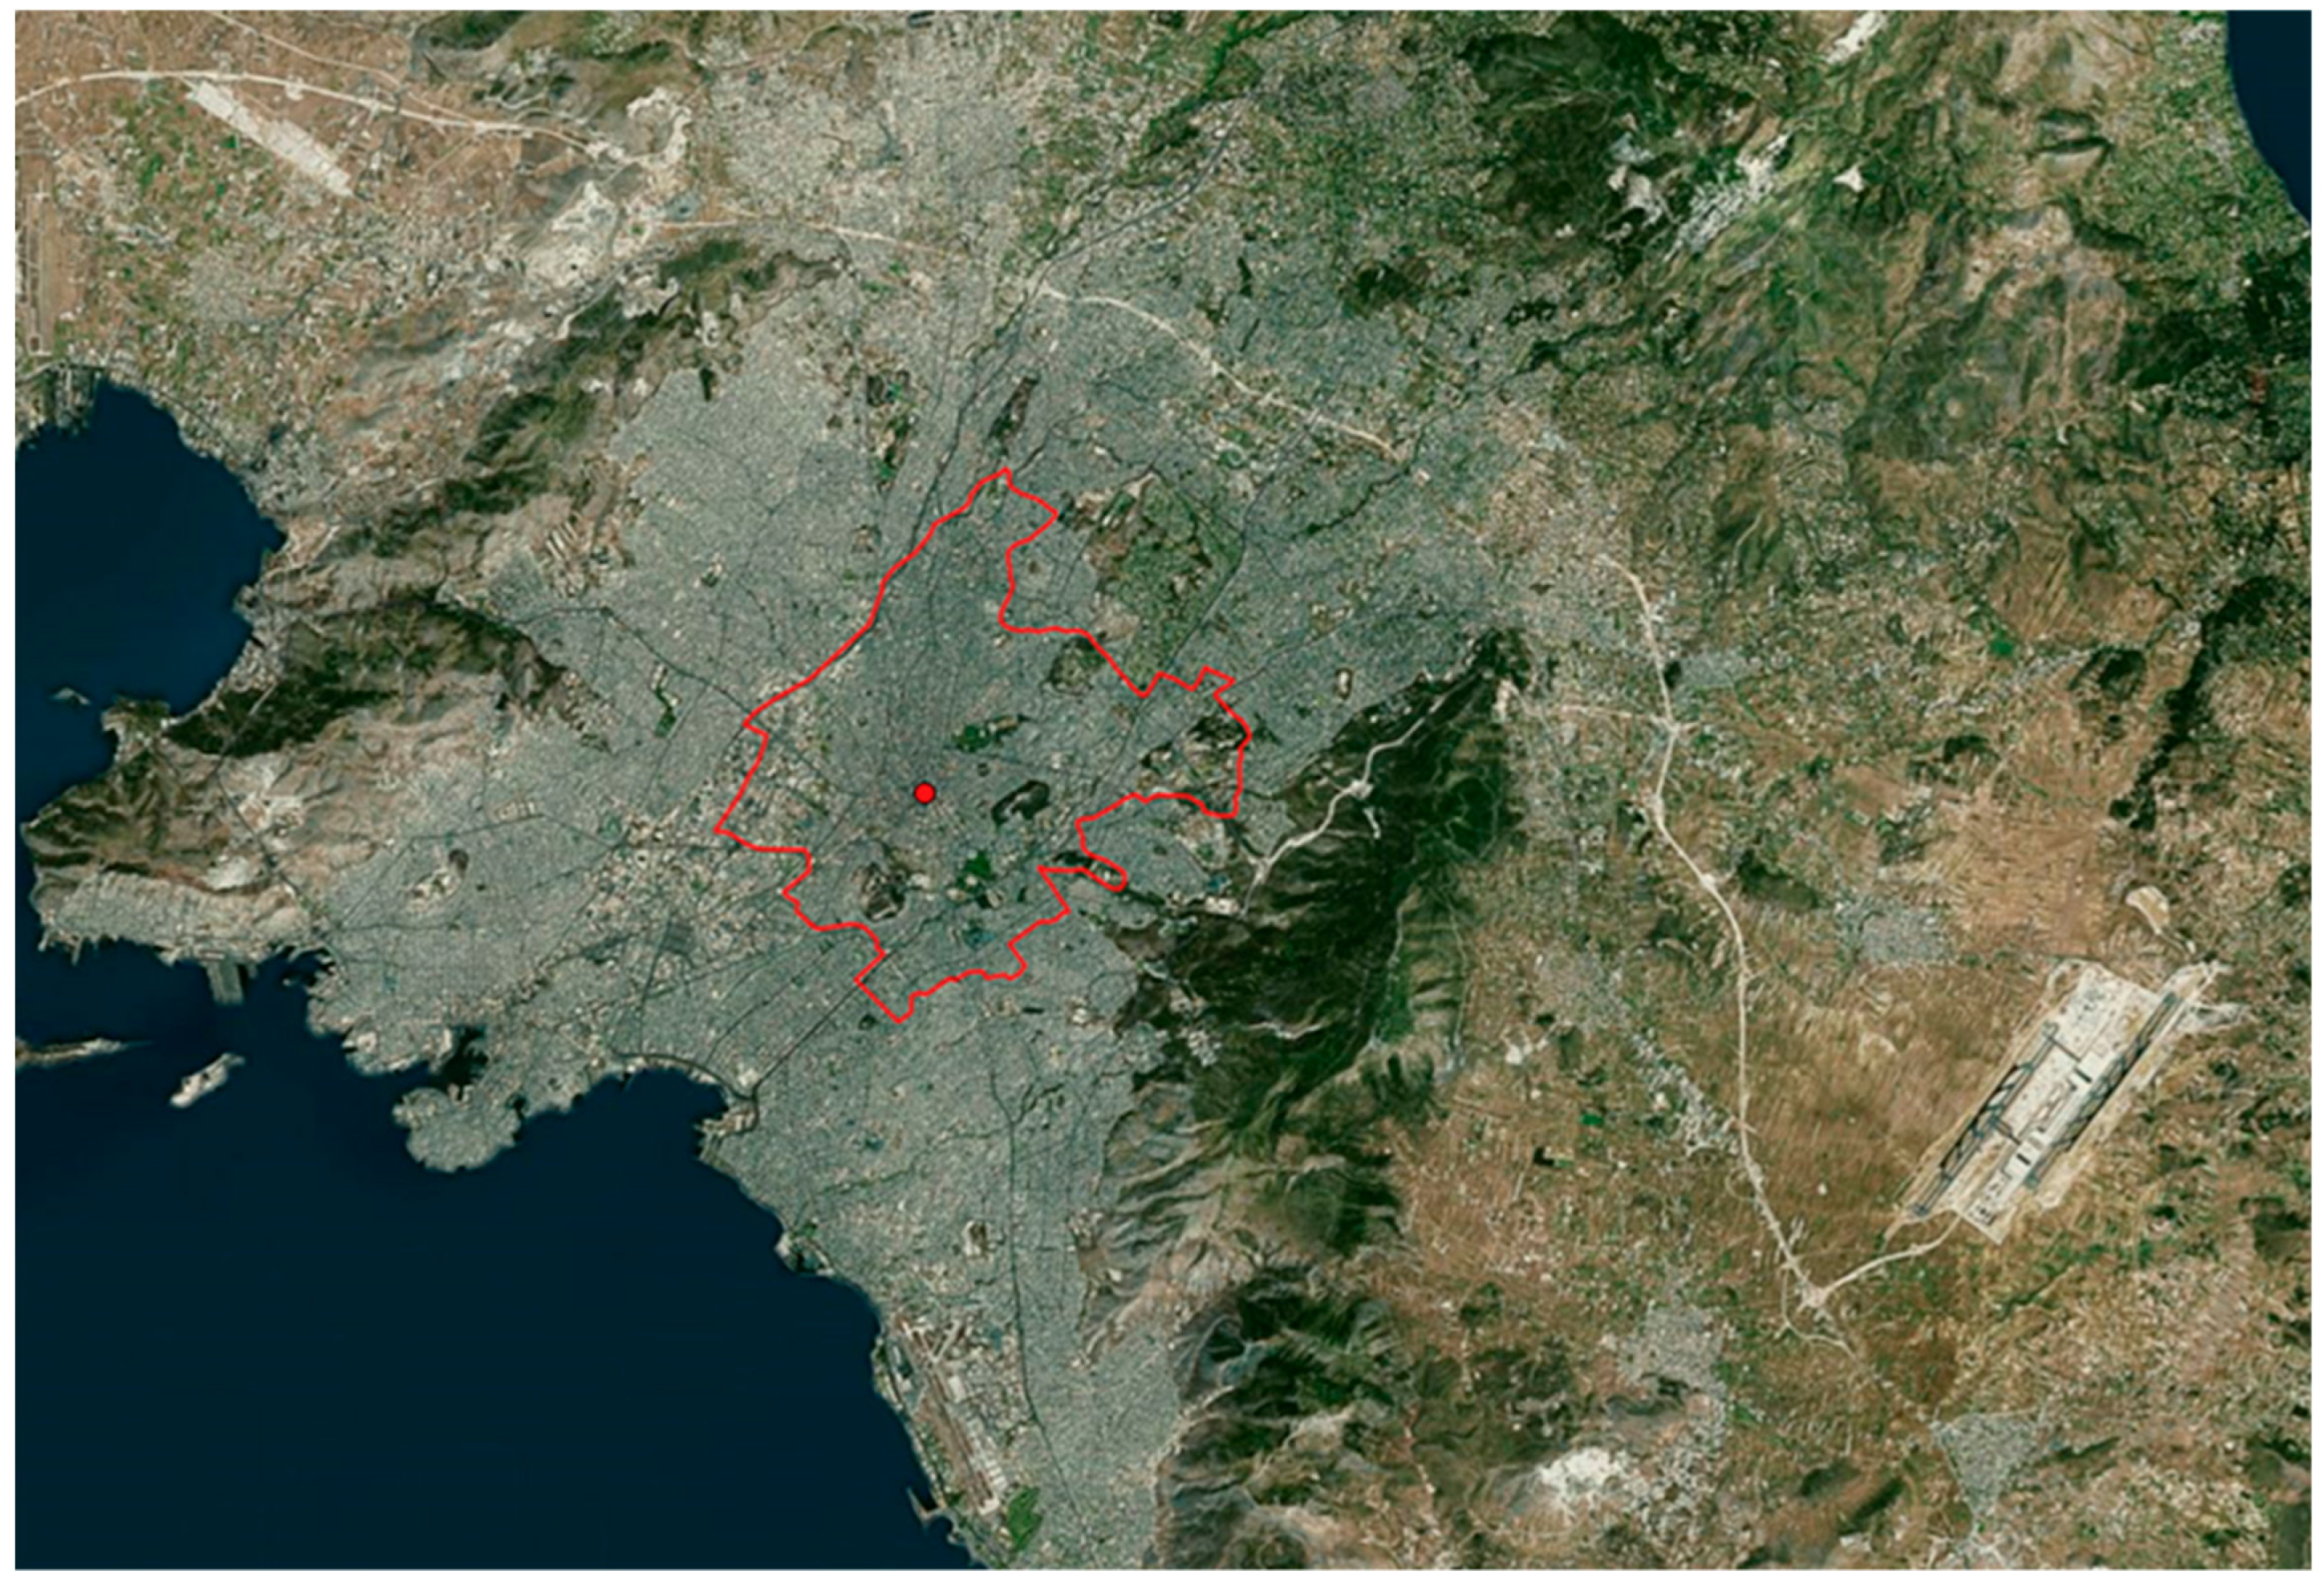
In this section, the methodological approach is applied for the area denoted in Figure 3 with the red polygon representing the Municipality of Athens. The area has coverage of about 39 km2 and includes high-density urban residential areas, commercial and industrial areas, transport modes, and the associated road network. Urban space is characterized in particular by a high degree of mixed land-use, limited green spaces or open public spaces, and limited pathways that allow for the influx of airflow from the surrounding countryside [43,44].

3.2. Data

Landsat 8 images (morning pass) were used in order to calculate the LST of the urban agglomeration of Athens. The acquisition dates were 27 July 2016 and 12 August 2016, and the selection of these dates were in compliance with the need for similar meteorological conditions. As a matter of fact, during this period no precipitation occurred over the Athens basin, while the wind and the temperature regime were similar for all days under study. In particular, clear sky conditions were observed from 26 July 2016 until 12 August 2016, the mean temperature was 30.5 °C, the maximum air temperature was 36.9 °C, the minimum air temperature was 23.4 °C, and the mean wind speed was 5.5 km/h southwards—typical Mediterranean summer conditions.
MODIS LST data from Terra satellite (MOD11A1 product [45]) were selected so as to refer to the acquisition time of the Landsat 8 images. They were used for four days with low MODIS viewing angle (<±30°), as high angles lead to higher errors, between the two Landsat 8 overpasses (27 July and 12 August). These days are the 26th and 28th of July as well as the 2nd and 11th of August. The selected time period along with the acquisition time of the satellite data and the satellite viewing angle are presented in Table 2. In addition, the MODIS Terra VNIR data (MOD13Q1) were used for the NDVI calculation, while the Urban Atlas dataset [46] was employed for the land use analysis.

4. Results and Discussion

4.1. Land Surface Temperature

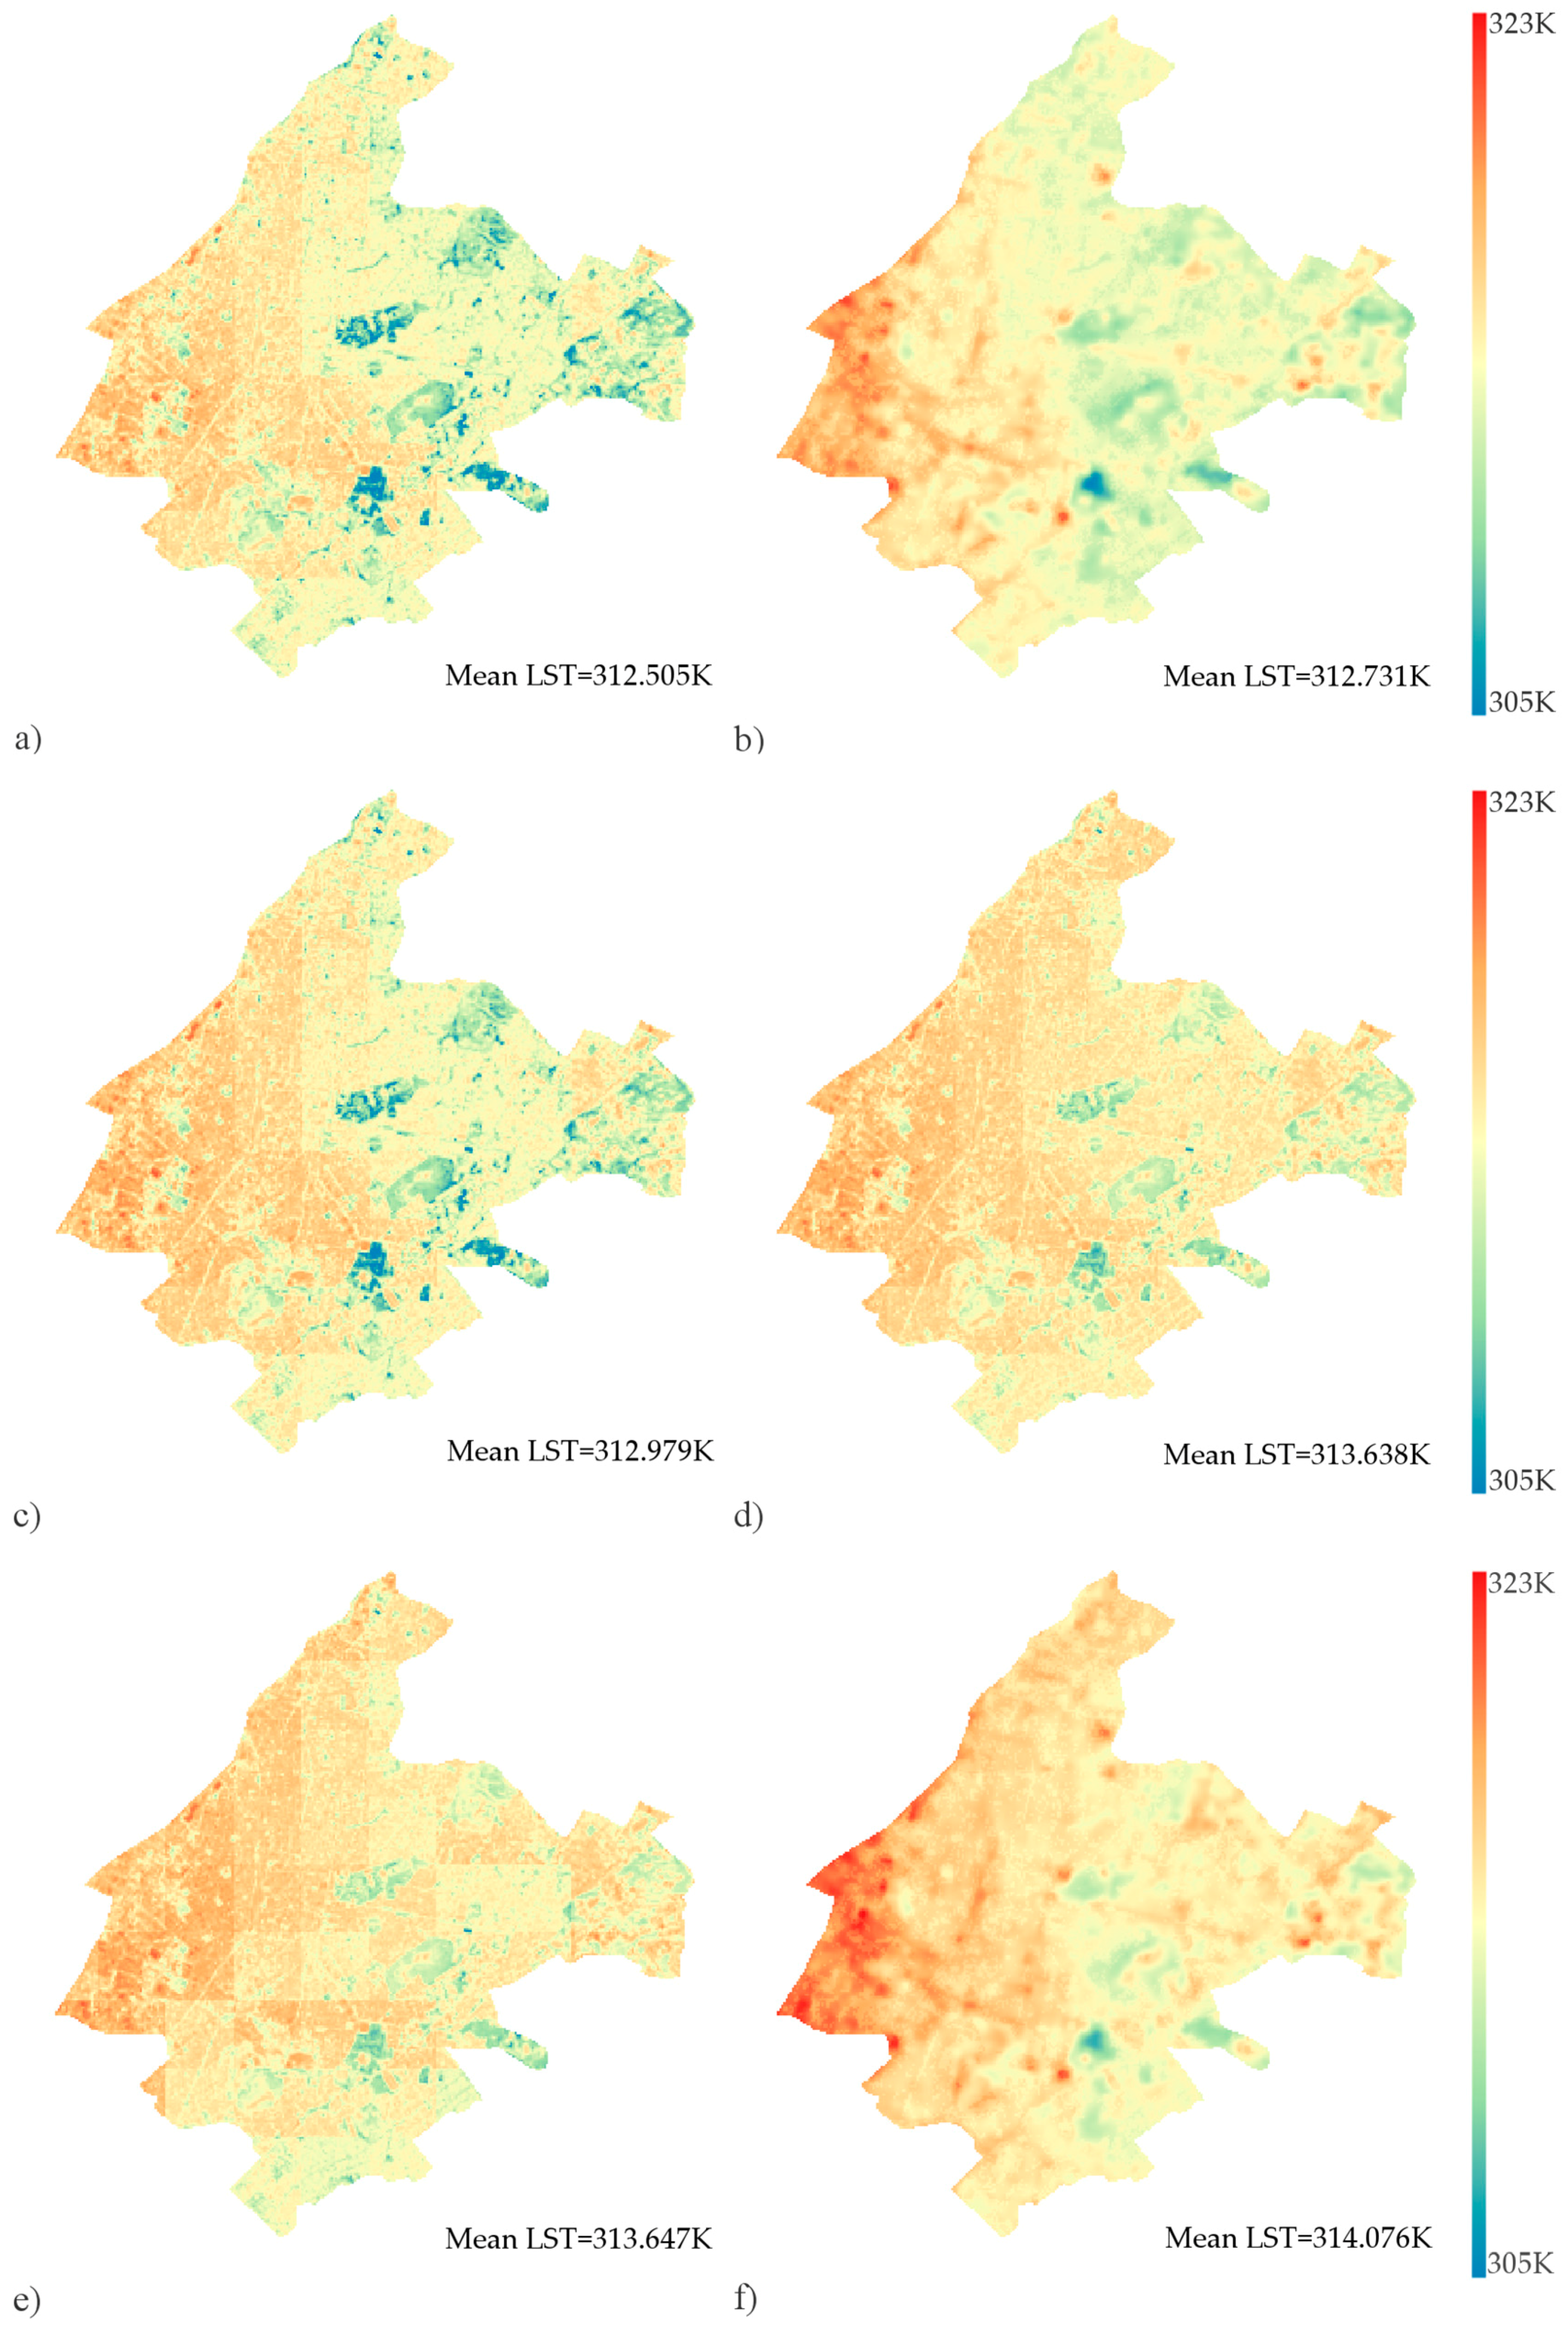
The LST evolution during the period under study is presented in Figure 4. The surface temperature patterns are similar in all images, whilst the mean LST values range from 312.505 °Κ to 314.076 °K, indicating rather stable conditions from the 26th of July to the 12th of August. The latter is in accordance with the stable meteorological conditions characterising the period under study. Furthermore, all images clearly depict that the western part of the Municipality of Athens exhibits higher LST than the eastern part, mainly due to the presence of industrial buildings and the high-density urban areas. On the contrary, the southeastern part shows lower LST as it is less densely built and consists of many urban green areas. Interestingly, small areas inside the boundaries of the municipality of Athens exhibit very high LST values that exceed 319 °K in all cases. This temperature value is much higher than the average LST of the municipality, indicating the presence of “hot spots”. Intra-urban variations of LST are clearly depicted in the Landsat images (Figure 4b,f) and in the downscaled images too (Figure 4a,c–e).
It should be mentioned that the Landsat LST error is typically less than 1.5 K [39] and the accuracy of the MODIS LST product is better than 1 K [47]. Furthermore, a discrepancy of ±1.9 K is observed between MODIS downscaled LST and Landsat LST [33], when Landsat overpass coincided with a MODIS one, the latter with low viewing angle. The summation of the above leads to the worst case scenario error of the downscaled MODIS LST. The above errors do not affect the recognition of the “hot spots” and “cold spots” patterns in the urban area under investigation; this is due to the fact that the recognition is based on differences between local and image averages, rather than to absolute LST values.

4.2. Recognition of “Hot Spots”

The calculation of the G statistics for each LST image resulted in the assignment of a z-value to each pixel. In order to define the “hot spot” areas, the suitable threshold for the z-values (Table 1) was determined as follows. Usually a z-value over 2.58 (99% confidence level) indicates a statistically significant result, but a more rigorous threshold of a z-value over 3.3 (99.9% confidence level) can be used in order to narrow down the number and the extent of the “hot spots”. Comparing the results using both thresholds, it was found out that the less rigorous threshold of 2.58 increases the extent of the “hot spot” areas by 29% and the number of “hot spots” by 27%. Additionally, this threshold increases the extent and the number of “cold spots” by 68% and 109% respectively. Taken the above, the threshold 3.3 of z-value was chosen as the most suitable for this study.
Subsequently, “hot spots” and “cold spots” were determined when a pixel was characterized as a “hot spot” or “cold spot”, respectively, in at least four images (i.e., over 50% of the available data). Based on the above, three categories of “hot spots” and “cold spots” emerged according to the number of times they were recognized. Table 3 provides the statistical analysis for each “hot spot” and “cold spot” category. A gradual change in the minimum, maximum, and mean values is evident. The average LST of a 6-day “hot spot” is 4.43 °K higher than the average LST of the areas that are neither “hot spots” nor “cold spots”. Even the 4-day “hot spots” have a substantial difference from these areas, reaching 2.16 °K. In addition, the average LST difference between the 6-day “hot spots” and the 6-day “cold spots” reaches 9.1 °K.
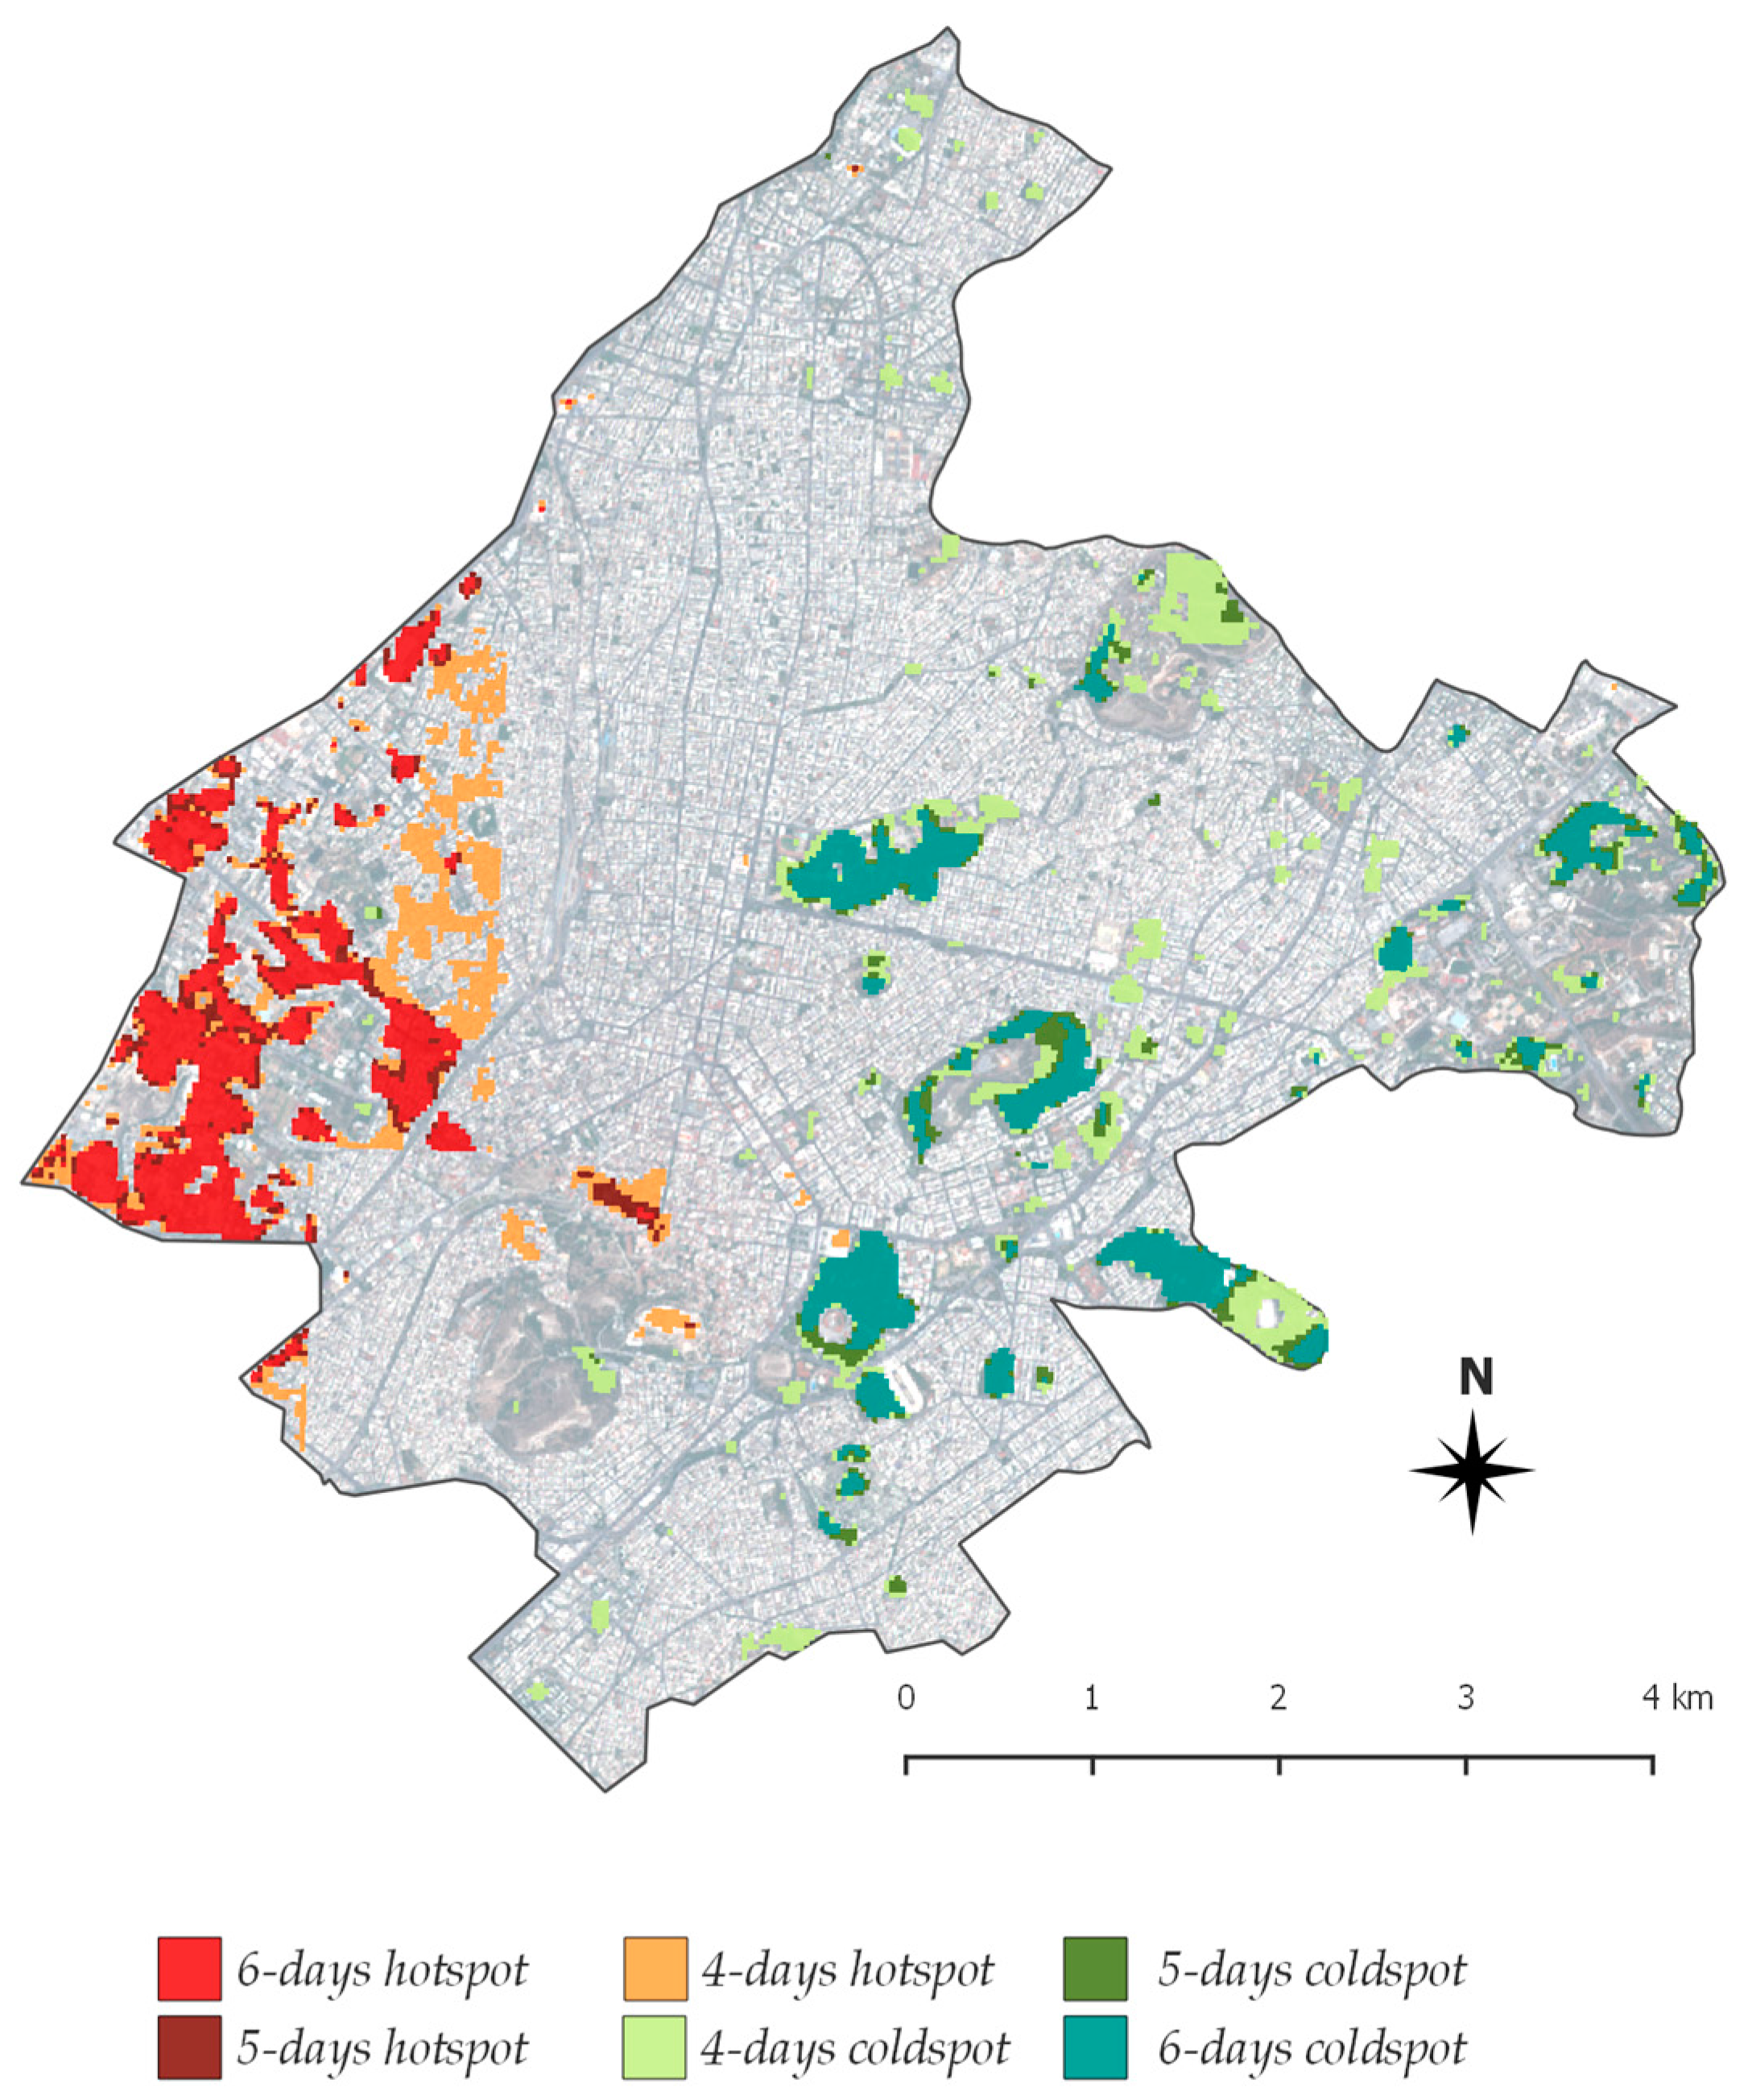
Figure 5 depicts the “hot spots” and “cold spots” of the Municipality of Athens. The majority of the “hot spots” are located in the western part of the city, which has greater LST values. The old industrial area (denoted as A in Figure 5) in the western boundaries of the municipality appears as a large “hot spot” due to the homogeneous land cover of impervious materials and the lack of vegetation. Some of the “hot spots” are located in the historic center of Athens (denoted as B in Figure 5), where major sightseeing places are located. On the contrary, the majority of “cold spots” are located at the eastern part of the municipality in the vicinity of urban green areas.
The extracted map of “hot spots” and “cold spots” in the Municipality of Athens (Figure 5) can be easily processed in Geographic Information Systems (GIS) environment by urban planners and decision makers as it contains geospatial information. Using GIS software, it was calculated that the “hot spots” occupy an area of 2.75 km2 (7% of the total municipality area) and the “cold spots” occupy an area of 2.78 km2. Moreover, various data, such as census, energy consumption, greenery, age of buildings, etc., can be overlaid, thus enabling the design of mitigation plans to counteract overheating.
The above results indicate that further investigation of the “hot spot” and “cold spot” areas is needed in order to examine the relation of land use/land cover with the presence of “hot spots” or “cold spots”. To this end, land use data from the Urban Atlas were used; Table 4 provides the land use information for the municipality of Athens. High-density urban fabric covers more than 45% of the area, while proportions of land are covered by roads (26.73%), industrial and commercial structures (19.83%), and urban parks (15.53%).
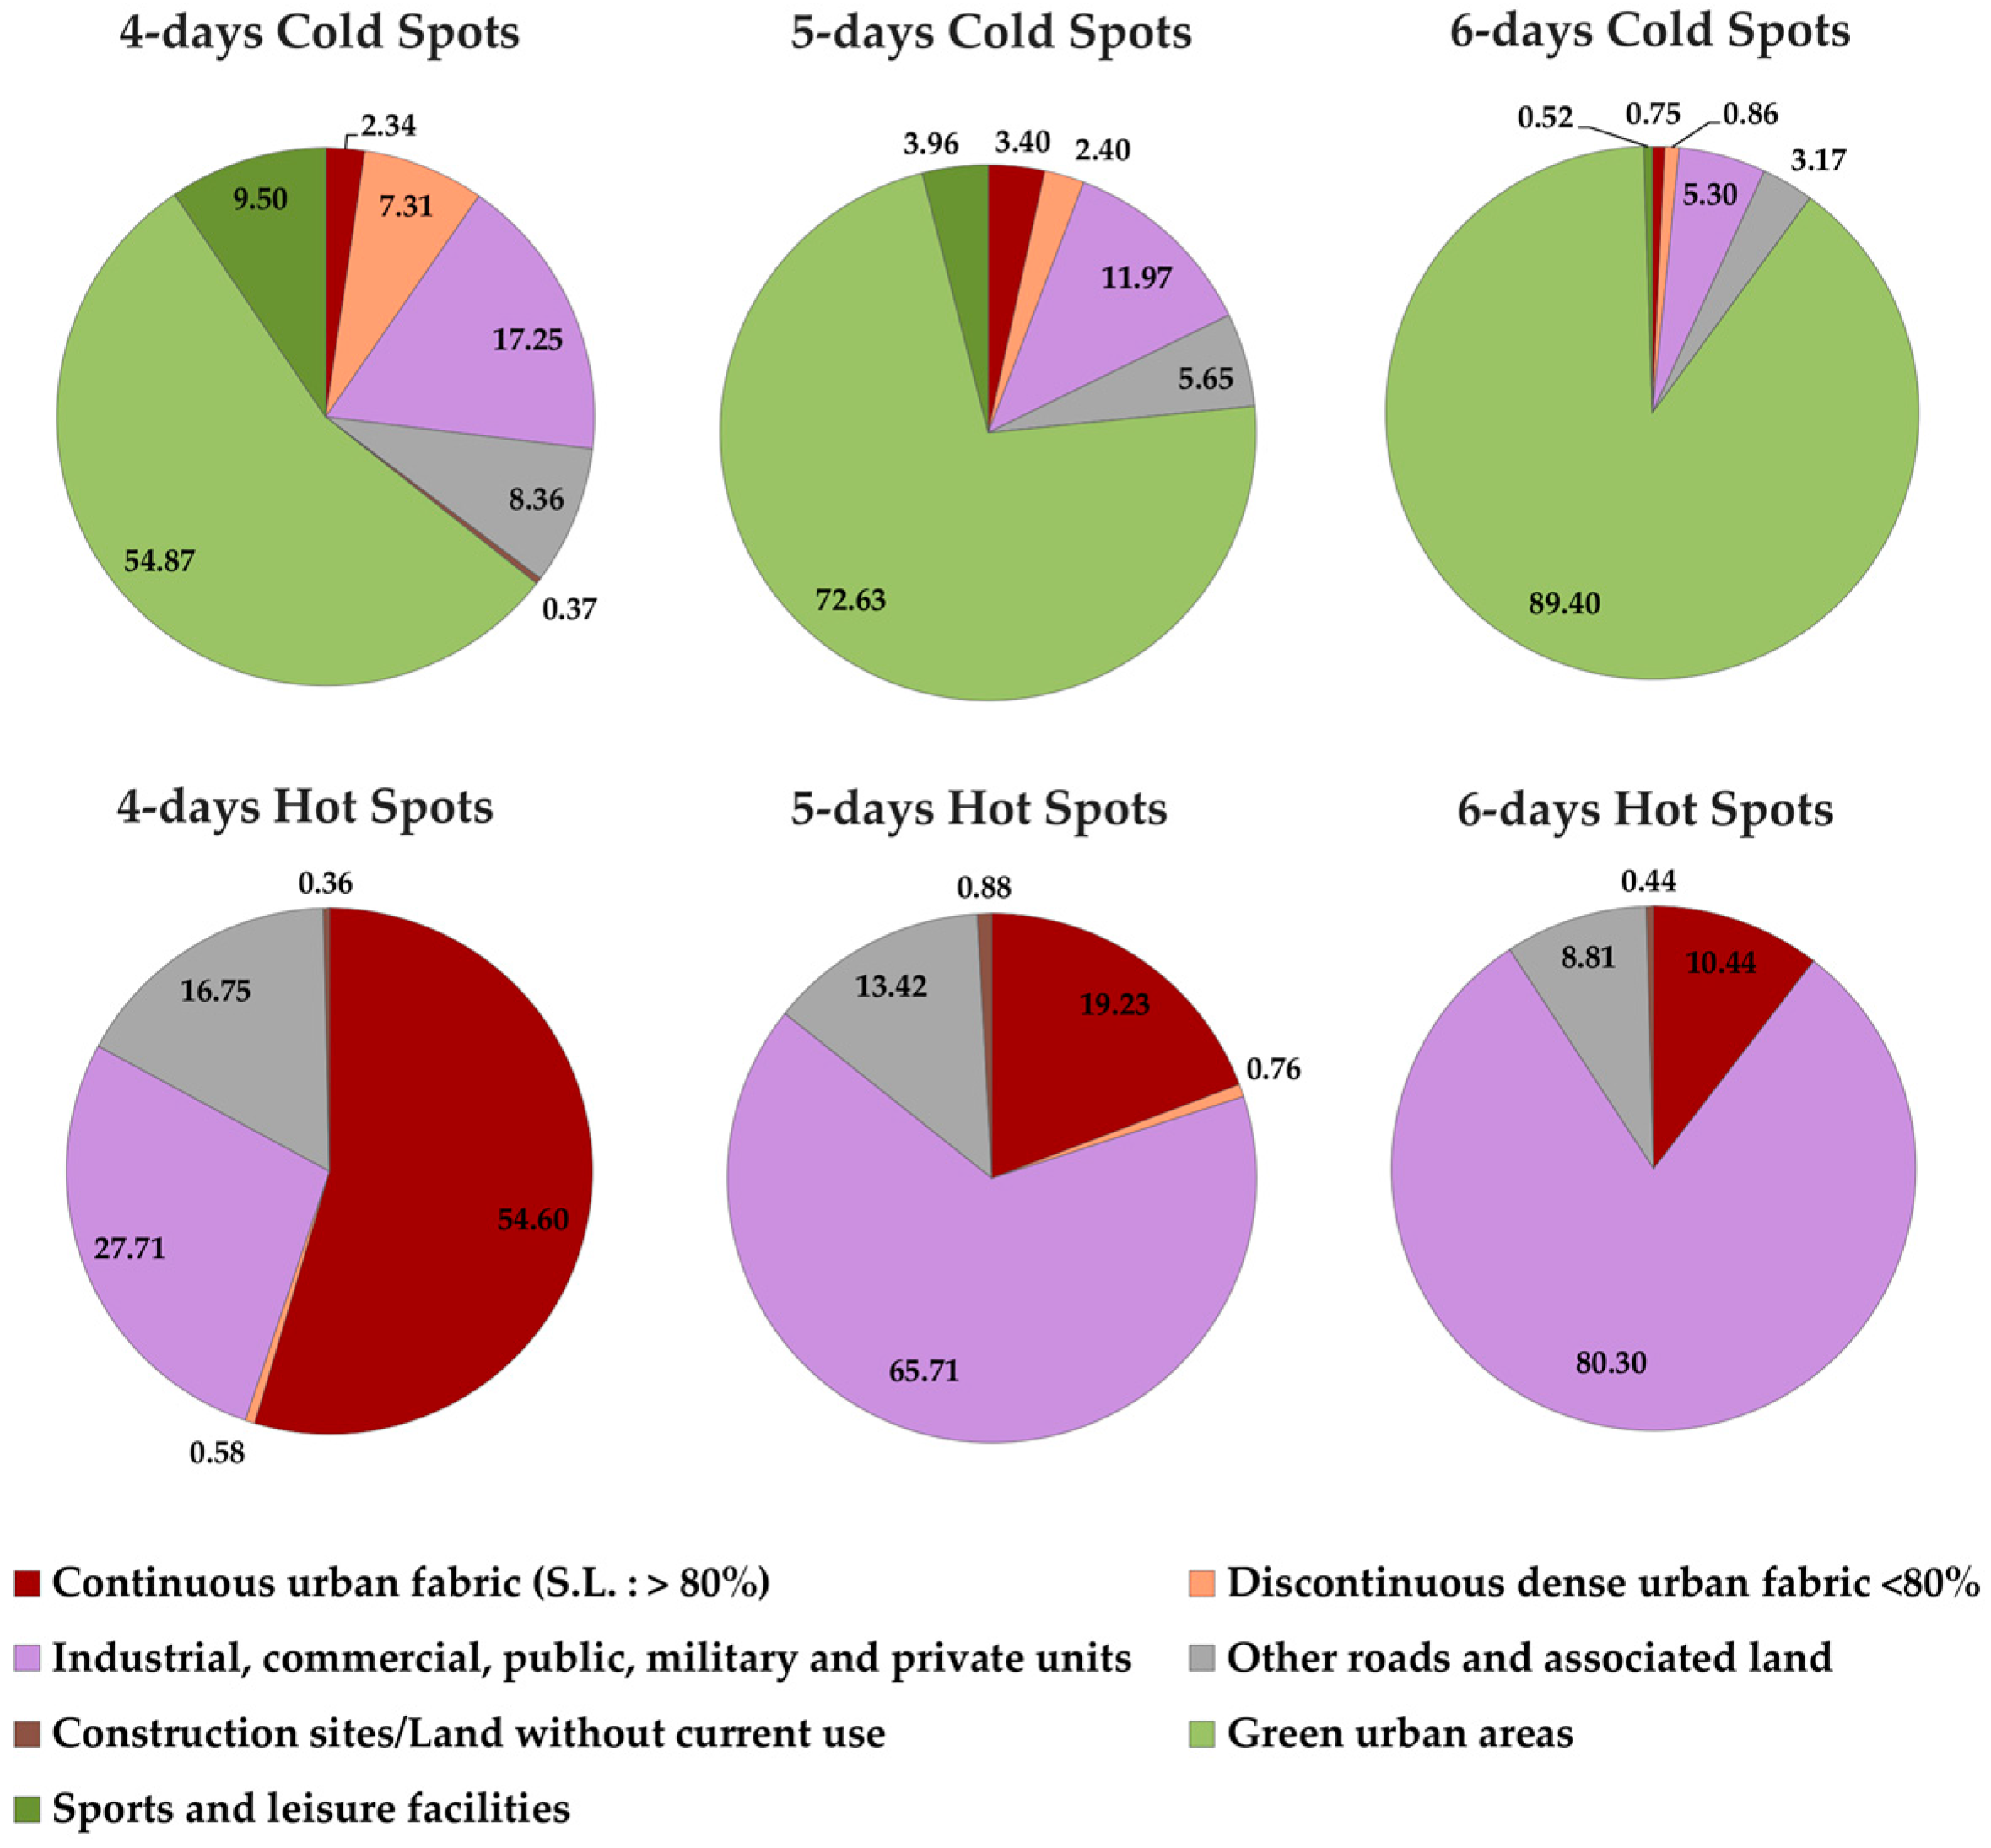
The above results in conjunction with the LSΤ differences as derived between the 6-day and the 4-day “hot spots” (2.27 °K) highlight the need to prioritize the interventions to the 6-day “hot spot” areas. Furthermore, land use analysis (Figure 6) lead to the recognition of various land use patterns in each “hot spot” or “cold spot” category, indicating the need for customized interventions.

5. Conclusions

In this study, a methodological approach was developed in order to support mitigation plans for counteracting overheating in urban areas. The methodological approach recognizes—with the use of satellite remote sensing data in the thermal infrared—areas that consistently demonstrate high or low land surface temperatures during summer time. A critical criterion in the methodological approach is that a pixel (an area) with a high LST value may not be a “hot spot” if its neighbor pixels (areas) have much lower LST values. To be considered as a “hot spot”, a pixel (area) must have high LST value and must be surrounded by pixels (areas) with high LST values as well. This criterion overcomes trivial approaches to represent the thermal environment of urban areas, based merely on the LST value on a pixel by pixel basis.
The methodological approach is based on: (a) the combined use of various satellite data, in order to circumvent—through a downscaling technique—the inherent difficulty which characterizes such data, namely the inverse relationship between spatial and temporal resolutions; (b) the estimation of LST on a daily basis and at a spatial resolution of 30 meters; (c) the statistical analysis of the land surface temperatures so as to recognize and cluster “hot spots” and “cold spots”; and (d) the correlation of the “hot spots” and “cold spots” temporal endurance and spatial extent to land use classes.
The methodological approach was applied for the Municipality of Athens on the basis of six—either original or downscaled—high-resolution LST images during a 16-day summer period; “hot spots” were recognized when a pixel was characterized as a “hot spot” in at least in four images (i.e., over the 50% of the available data) using G statistics.
The average LST of a 6-day “hot spot” is 4.43 °K higher than the average LST of the areas that are neither “hot spots” nor “cold spots”. Even the 4-day “hot spots” have a substantial difference from these areas, reaching 2.16 °K. In addition, the average LST of the 6-day “hot spot” is 2.27 °C higher than the 4-day “hot spots”, whereas the average LST difference between the 6-day “hot spots” and the 6-day “cold spots” reaches 9.1 °K.
Furthermore, land use analysis revealed the strong relationship between land use on the one hand and “hot spots” and “cold spots” on the other. “Hot spots” are almost exclusively covered by industrial/commercial, high-density urban fabric, and street type surface materials. Conversely, “cold spots” have, as expected, an increased presence of urban greenery.
The methodological approach, as developed in this study, is replicable to all urban areas and can be highly supportive to mitigation plans to counteract overheating as it can detect “hot spot” or “cold spot” areas in fine resolution (30 × 30 m). Moreover, various data, such as census, energy consumption, greenery, age of buildings, etc., can be overlaid, thus enabling a thorough design of mitigation plans to counteract overheating. Further work to be done refers to the application of the methodological approach for night time satellite images from MODIS as Landsat night time images are very limited. The successful identification of nighttime “hot spots” will lead to an improved understanding of the thermal environment of the city.

Author Contributions

All authors designed the methodology. Thaleia Mavrakou and Anastasios Polydoros implemented the methodology and performed the necessary statistical analysis; all authors contributed to the analysis of the data and to the drafting of the paper.

Conflicts of Interest

The authors declare no conflicts of interest

References

  1. Oke, T.R. City size and the urban heat island. Atmos. Environ. 1973, 7, 769–779. [Google Scholar] [CrossRef]
  2. Oke, T.R. The energetic basis of the urban heat island. Q. J. R. Meteorol. Soc. 1982, 108, 1–24. [Google Scholar] [CrossRef]
  3. Jenerette, G.D.; Harlan, S.L.; Stefanov, W.L.; Martin, C.A. Ecosystem services and urban heat riskscape moderation: Water, green spaces, and social inequality in Phoenix, USA. Ecol. Appl. 2011, 21, 2637–2651. [Google Scholar] [CrossRef] [PubMed]
  4. Tong, S.; Wong, N.H.; Jusuf, S.K.; Tan, C.L.; Wong, H.F.; Ignatius, M.; Tan, E. Study on correlation between air temperature and urban morphology parameters in built environment in northern China. Build. Environ. 2018, 127, 239–249. [Google Scholar] [CrossRef]
  5. Akbari, H.; Kolokotsa, D. Three decades of urban heat islands and mitigation technologies research. Energy Build. 2016, 133, 834–842. [Google Scholar] [CrossRef]
  6. Santamouris, M. Energy and Climate in the Urban Built Environment; James & James: London, UK, 2001; ISBN 978-1-873936-90-0. [Google Scholar]
  7. Gabriel, K.M.; Endlicher, W.R. Urban and rural mortality rates during heat waves in Berlin and Brandenburg, Germany. Environ. Pollut. 2011, 159, 2044–2050. [Google Scholar] [CrossRef] [PubMed]
  8. Loughnan, M.E.; Tapper, N.; Phan, T.; Lynch, K.; McIn, J. A Spatial Vulnerability Analysis of Urban Populations during Extreme Heat Events in Australian Capital Cities; National Climate Change Adaptation Research Facility (Australia): Southport, Australia; Monash University: Clayton, Australia, 2013; ISBN 978-1-921609-73-2. [Google Scholar]
  9. Dousset, B.; Gourmelon, F.; Laaidi, K.; Zeghnoun, A.; Giraudet, E.; Bretin, P.; Vandentorren, S. Satellite monitoring of summer heat waves in the Paris metropolitan area. Int. J. Climatol. 2011, 31, 313–323. [Google Scholar] [CrossRef]
  10. Stathopoulou, M.I.; Cartalis, C.; Keramitsoglou, I.; Santamouris, M. Thermal remote sensing of Thom’s discomfort index (DI): Comparison with in-situ measurements. SPIE Remote Sens. 2005, 5983. [Google Scholar] [CrossRef]
  11. Giannopoulou, K.; Livada, I.; Santamouris, M.; Saliari, M.; Assimakopoulos, M.; Caouris, Y. The influence of air temperature and humidity on human thermal comfort over the greater Athens area. Sustain. Cities Soc. 2014, 10, 184–194. [Google Scholar] [CrossRef]
  12. Paravantis, J.; Santamouris, M.; Cartalis, C.; Efthymiou, C.; Kontoulis, N. Mortality Associated with High Ambient Temperatures, Heatwaves, and the Urban Heat Island in Athens, Greece. Sustainability 2017, 9, 606. [Google Scholar] [CrossRef]
  13. Coutts, A.M.; Harris, R.J.; Phan, T.; Livesley, S.J.; Williams, N.S.; Tapper, N.J. Thermal infrared remote sensing of urban heat: Hotspots, vegetation, and an assessment of techniques for use in urban planning. Remote Sens. Environ. 2016, 186, 637–651. [Google Scholar] [CrossRef]
  14. IPCC. Contribution of Working Group III to the Fourth Assessment Report of the Intergovernmental Panel on Climate Change; Metz, B., Davidson, O.R., Bosch, P.R., Dave, R., Meyer, L.A., Eds.; Cambridge University Press: Cambridge, UK; New York, NY, USA, 2007; p. 852. ISBN 978-0-521-88011-4. [Google Scholar]
  15. Jabareen, Y.R. Sustainable Urban Forms: Their Typologies, Models, and Concepts. J. Plan. Educ. Res. 2006, 26, 38–52. [Google Scholar] [CrossRef]
  16. Asimakopoulos, D.A.; Santamouris, M.; Farrou, I.; Laskari, M.; Saliari, M.; Zanis, G.; Zerefos, S.C. Modelling the energy demand projection of the building sector in Greece in the 21st century. Energy Build. 2012, 49, 488–498. [Google Scholar] [CrossRef]
  17. Larsen, L. Urban climate and adaptation strategies. Front. Ecol. Environ. 2015, 13, 486–492. [Google Scholar] [CrossRef]
  18. Wang, J.; Ouyang, W. Attenuating the surface urban heat island within the local thermal zones through land surface modification. J. Environ. Manag. 2017, 187, 239–252. [Google Scholar] [CrossRef] [PubMed]
  19. Estoque, R.C.; Murayama, Y.; Myint, S.W. Effects of landscape composition and pattern on land surface temperature: An urban heat island study in the megacities of Southeast Asia. Sci. Total Environ. 2017, 577, 349–359. [Google Scholar] [CrossRef] [PubMed]
  20. Bonafoni, S.; Baldinelli, G.; Verducci, P. Sustainable strategies for smart cities: Analysis of the town development effect on surface urban heat island through remote sensing methodologies. Sustain. Cities Soc. 2017, 29, 211–218. [Google Scholar] [CrossRef]
  21. Gallo, K.; Hale, R.; Tarpley, D.; Yu, Y. Evaluation of the Relationship between Air and Land Surface Temperature under Clear- and Cloudy-Sky Conditions. J. Appl. Meteorol. Clim. 2011, 50, 767–775. [Google Scholar] [CrossRef]
  22. Nichol, J.E.; Fung, W.Y.; Lam, K.S.; Wong, M.S. Urban heat island diagnosis using ASTER satellite images and “in situ” air temperature. Atmos. Res. 2009, 94, 276–284. [Google Scholar] [CrossRef]
  23. Agathangelidis, I.; Cartalis, C.; Santamouris, M. Estimation of Air Temperatures for the Urban Agglomeration of Athens with the Use of Satellite Data. Geoinf. Geostat. Overv. 2016, 4. [Google Scholar] [CrossRef]
  24. Chen, E.; Allen, L.H., Jr.; Bartholic, J.F.; Gerber, J.F. Comparison of winter-nocturnal geostationary satellite infrared-surface temperature with shelter—Height temperature in Florida. Remote Sens. Environ. 1983, 13, 313–327. [Google Scholar] [CrossRef]
  25. Green, R.M.; Hay, S.I. The potential of Pathfinder AVHRR data for providing surrogate climatic variables across Africa and Europe for epidemiological applications. Remote Sens. Environ. 2002, 79, 166–175. [Google Scholar] [CrossRef]
  26. Stathopoulou, M.; Cartalis, C. Downscaling AVHRR land surface temperatures for improved surface urban heat island intensity estimation. Remote Sens. Environ. 2009, 113, 2592–2605. [Google Scholar] [CrossRef]
  27. Gao, F.; Masek, J.; Schwaller, M.; Hall, F. On the blending of the Landsat and MODIS surface reflectance: Predicting daily Landsat surface reflectance. IEEE Trans. Geosci. Remote Sens. 2006, 44, 2207–2218. [Google Scholar] [CrossRef]
  28. Hilker, T.; Wulder, M.A.; Coops, N.C.; Seitz, N.; White, J.C.; Gao, F.; Masek, J.G.; Stenhouse, G. Generation of dense time series synthetic Landsat data through data blending with MODIS using a spatial and temporal adaptive reflectance fusion model. Remote Sens. Environ. 2009, 113, 1988–1999. [Google Scholar] [CrossRef]
  29. Weng, Q.; Fu, P.; Gao, F. Generating daily land surface temperature at Landsat resolution by fusing Landsat and MODIS data. Remote Sens. Environ. 2014, 145, 55–67. [Google Scholar] [CrossRef]
  30. Kim, J.; Hogue, T.S. Evaluation and sensitivity testing of a coupled Landsat-MODIS downscaling method for land surface temperature and vegetation indices in semi-arid regions. J. Appl. Remote Sens. 2012, 6, 063569. [Google Scholar] [CrossRef]
  31. Bindhu, V.M.; Narasimhan, B.; Sudheer, K.P. Development and verification of a non-linear disaggregation method (NL-DisTrad) to downscale MODIS land surface temperature to the spatial scale of Landsat thermal data to estimate evapotranspiration. Remote Sens. Environ. 2013, 135, 118–129. [Google Scholar] [CrossRef]
  32. Mukherjee, S.; Joshi, P.K.; Garg, R.D. A comparison of different regression models for downscaling Landsat and MODIS land surface temperature images over heterogeneous landscape. Adv. Space Res. 2014, 54, 655–669. [Google Scholar] [CrossRef]
  33. Bisquert, M.; Sánchez, J.M.; Caselles, V. Evaluation of disaggregation methods for downscaling MODIS land surface temperature to Landsat spatial resolution in Barrax test site. IEEE J. Sel. Top. Appl. 2016, 9, 1430–1438. [Google Scholar] [CrossRef]
  34. Kustas, W.P.; Norman, J.M.; Anderson, M.C.; French, A.N. Estimating subpixel surface temperatures and energy fluxes from the vegetation index–radiometric temperature relationship. Remote Sens. Environ. 2003, 85, 429–440. [Google Scholar] [CrossRef]
  35. Jeganathan, C.; Hamm, N.A.S.; Mukherjee, S.; Atkinson, P.M.; Raju, P.L.N.; Dadhwal, V.K. Evaluating a thermal image sharpening model over a mixed agricultural landscape in India. Int. J. Appl. Earth Observ. Geoinf. 2011, 13, 178–191. [Google Scholar] [CrossRef]
  36. Ha, W.; Gowda, P.H.; Howell, T.A. A review of downscaling methods for remote sensing-based irrigation management: Part I. Irrig. Sci. 2013, 31, 831–850. [Google Scholar] [CrossRef]
  37. Agam, N.; Kustas, W.P.; Anderson, M.C.; Li, F.; Neale, C.M. A vegetation index based technique for spatial sharpening of thermal imagery. Remote Sens. Environ. 2007, 107, 545–558. [Google Scholar] [CrossRef]
  38. Jiménez-Muñoz, J.C.; Sobrino, J.A. A generalized single-channel method for retrieving land surface temperature from remote sensing data. J. Geophys. Res.-Atmos. 2003, 108. [Google Scholar] [CrossRef]
  39. Jiménez-Muñoz, J.C.; Sobrino, J.A.; Skoković, D.; Mattar, C.; Cristóbal, J. Land surface temperature retrieval methods from Landsat-8 thermal infrared sensor data. IEEE Trans. Geosci. Remote Sens. 2014, 11, 1840–1843. [Google Scholar] [CrossRef]
  40. Barsi, J.A.; Schott, J.R.; Palluconi, F.D.; Hook, S.J. Validation of a web-based atmospheric correction tool for single thermal band instruments. Opt. Photonics 2005, 5882. [Google Scholar] [CrossRef]
  41. Sobrino, J.A.; Raissouni, N.; Li, Z.L. A comparative study of land surface emissivity retrieval from NOAA data. Remote Sens. Environ. 2001, 75, 256–266. [Google Scholar] [CrossRef]
  42. Getis, A.; Ord, J.K. The analysis of spatial association by use of distance statistics. Geogr. Anal. 1992, 24, 189–206. [Google Scholar] [CrossRef]
  43. Chorianopoulos, I.; Pagonis, T.; Koukoulas, S.; Drymoniti, S. Planning, competitiveness and sprawl in the Mediterranean city: The case of Athens. Cities 2010, 27, 249–259. [Google Scholar] [CrossRef]
  44. Papamanolis, N. The main characteristics of the urban climate and the air quality in Greek cities. Urban Clim. 2015, 12, 49–64. [Google Scholar] [CrossRef]
  45. Wan, Z. MODIS Land Surface Temperature Products Users’ Guide. Available online: http://www.icess.ucsb.edu/modis/LstUsrGuide/MODIS_LST_products_Users_guide_C5.pdf (accessed on 19 January 2018).
  46. European Union. Copernicus Land Monitoring Service; European Environment Agency (EEA): Copenhagen, Denmark, 2018. [Google Scholar]
  47. Wan, Z. New refinements and validation of the MODIS land-surface temperature/emissivity products. Remote Sens. Environ. 2008, 112, 59–74. [Google Scholar] [CrossRef]
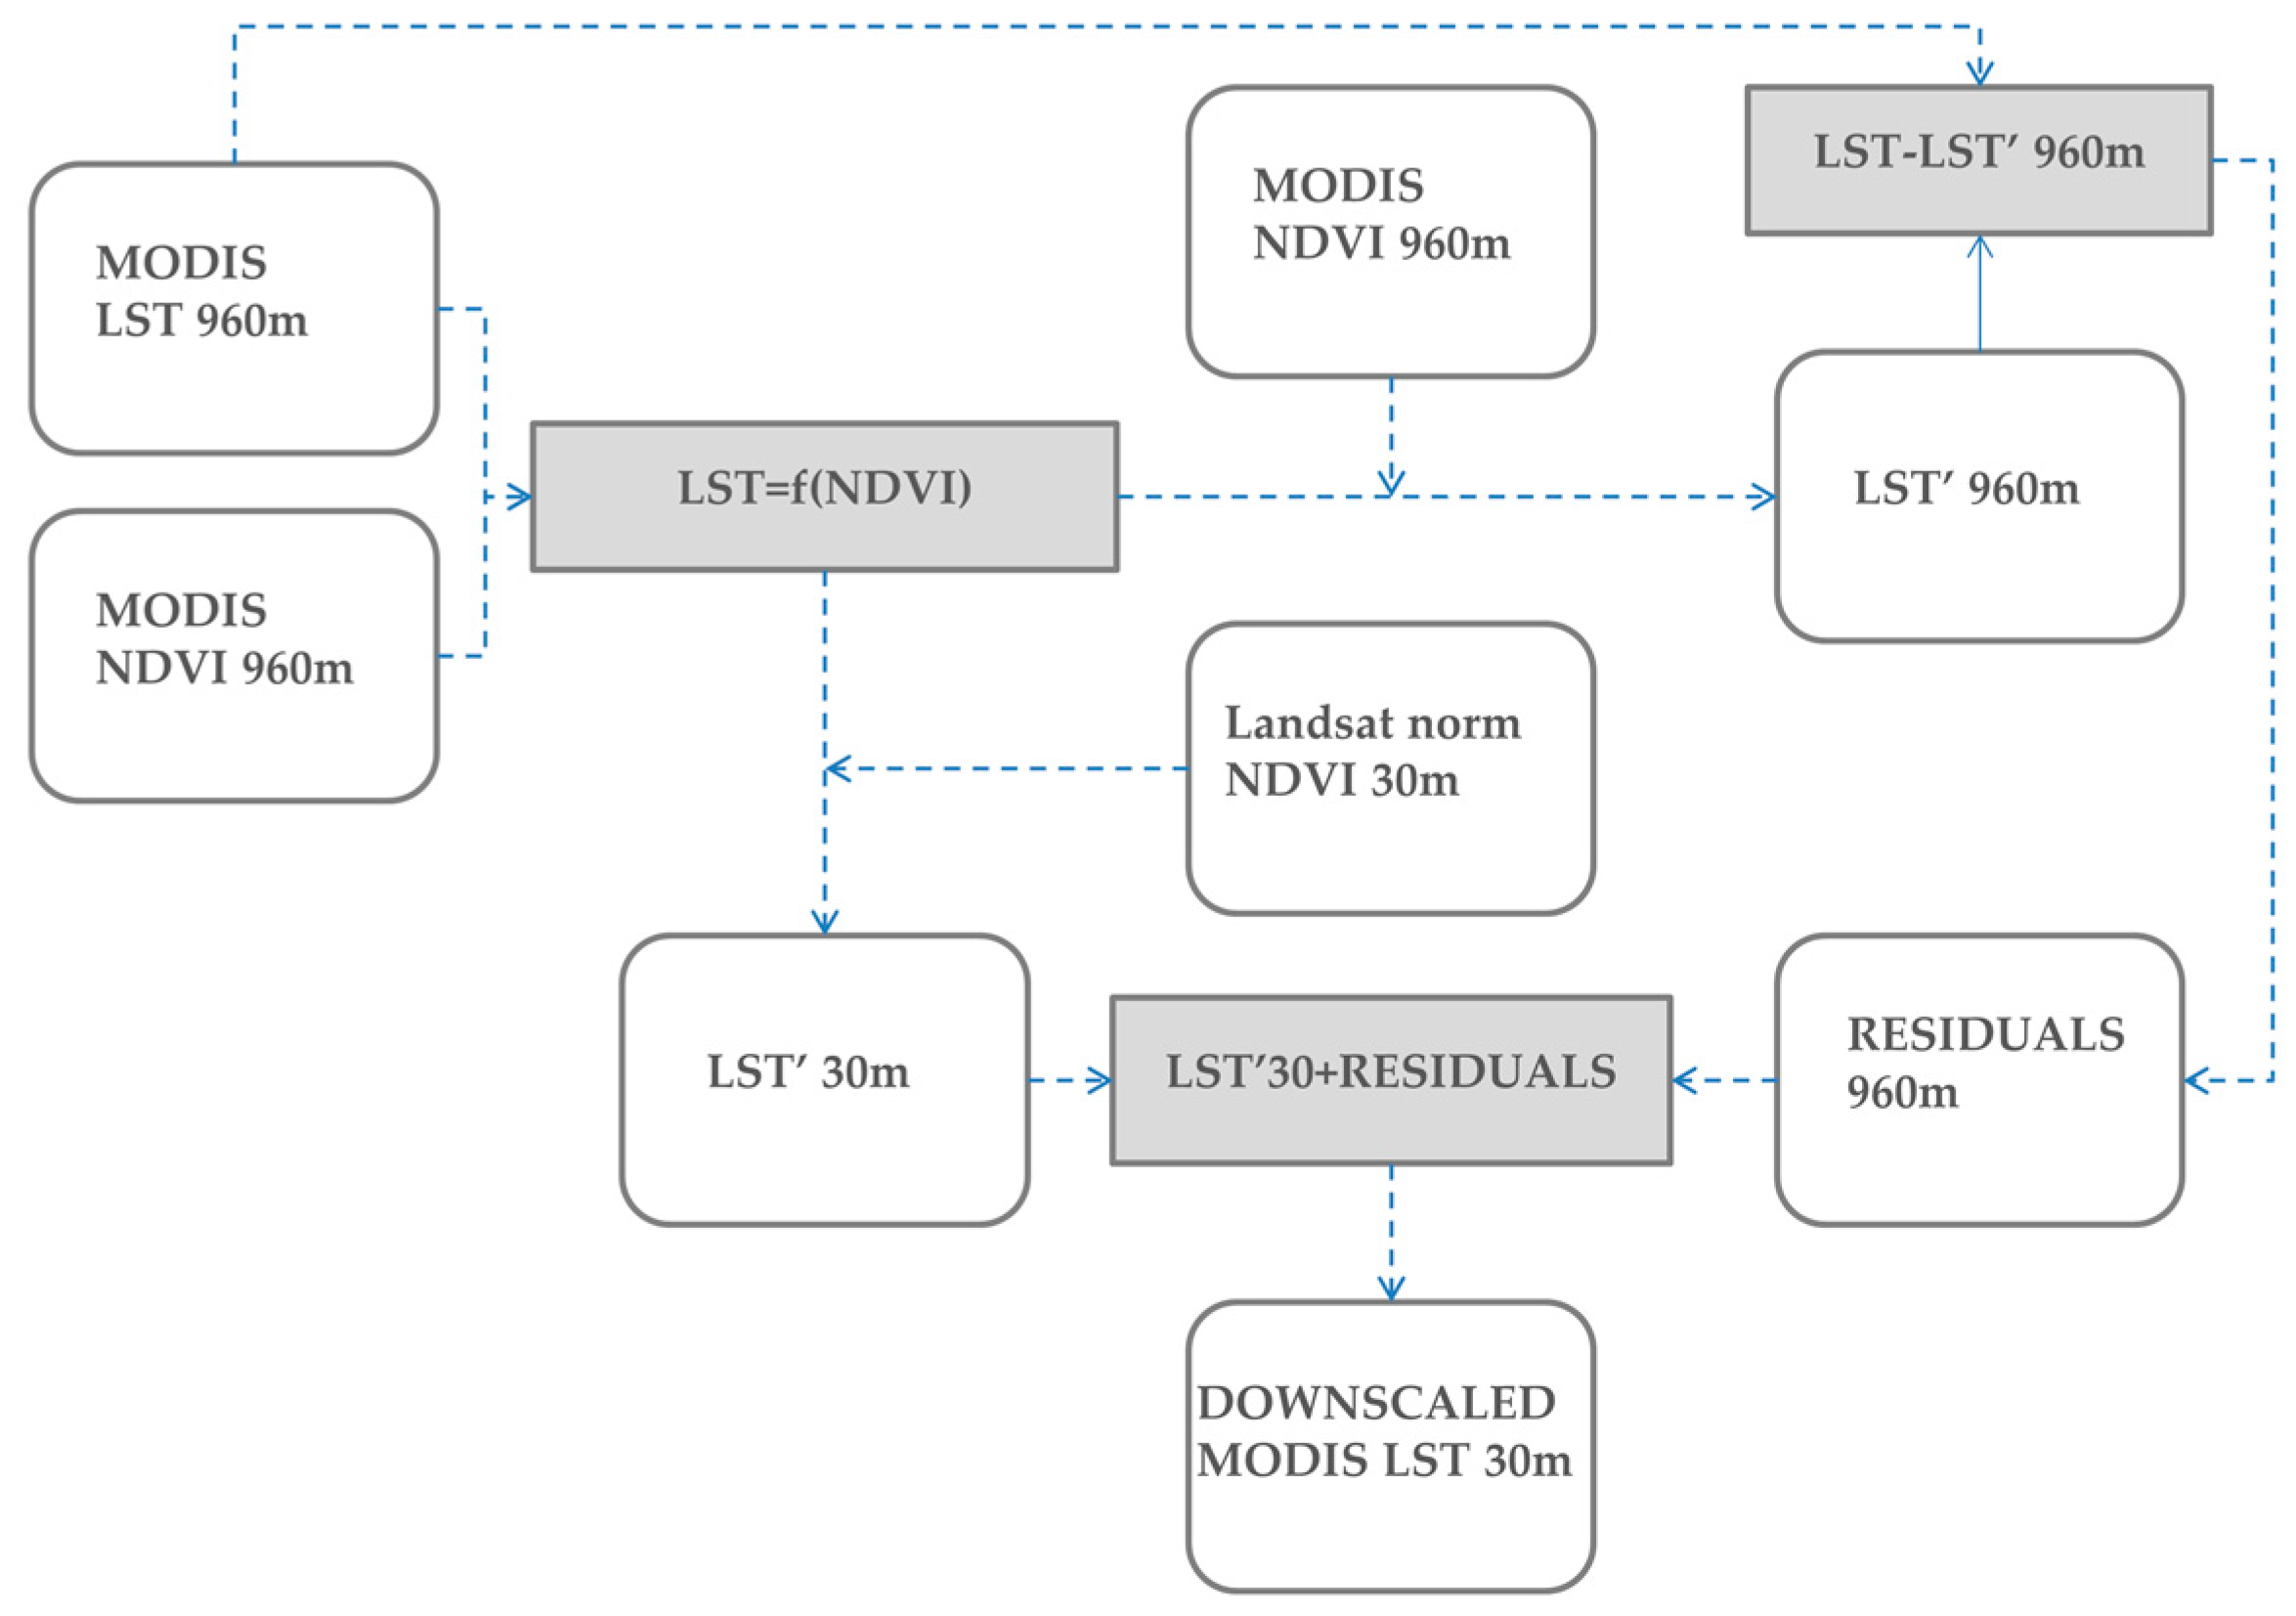
Figure 1. Disaggregation procedure for downscaling MODIS Terra land surface temperature (LST) product.
Climate 06 00016 g001
Figure 2. The calculation of the local LST sum for a pixel under consideration (red) includes all of its neighbors (orange).
Climate 06 00016 g002
Figure 3. The urban agglomeration of Athens and the administrative boundaries of the municipality of Athens (red polygon).
Climate 06 00016 g003
Figure 4. Land surface temperatures of the municipality of Athens for (a) 26/7/2016 (downscaled)—no available Landsat image, (b) 27/7/2016 (Landsat), (c) 28/7/2016 (downscaled)—no available Landsat image (d) 2/8/2016 (downscaled)—no available Landsat image (e) 11/8/2016 (downscaled)—no available Landsat image and (f) 12/8/2016 (Landsat).
Climate 06 00016 g004
Figure 5. Location of the hot/cold spots within Athens Municipality. (A: old industrial area of Athens, B: the historic center of Athens).
Climate 06 00016 g005
Figure 6. Land use percentages of the “hot spot” and “cold spot” categories.
Climate 06 00016 g006
Table 1. Critical p-values and z-scores for different confidence levels.
Significance Level (p Value)Critical Value (z Score)Confidence Level
−0.01z < −3.399.9%
−0.1−3.30 < z < −2.5899%
0−2.58 < z < 2.58-
0.12.58 < z < 3.3099%
0.01z > 3.399.9%
Table 2. Selected dates and characteristics of the LST data.
DaySatelliteSensorAcquisition Time (UTC)View Angle
26/7/2016TerraMODIS09:3715°
27/7/2016Landsat 8TIRS09:05
28/7/2016TerraMODIS09:25−9°
2/8/2016TerraMODIS09:4325°
11/8/2016TerraMODIS09:4214°
12/8/2016Landsat 8TIRS09:05
Table 3. LST statistics for the “hot spots” and “cold spots” categories (in °K).
“Hot Spots”“Cold Spots”
Min.Max.MeanMin.Max.Mean
6-day313.94319.24317.75305.57313.04308.65
5-day313.86318.69316.19306.69312.24309.78
4-day313.11318.37315.48306.19313.56310.38
Table 4. Land use percentages for the municipality of Athens based on the Urban Atlas data.
Land UsePercentage
Continuous urban fabric (S.L.: >80%)45.61
Discontinuous dense urban fabric (S.L.: 50–80%)6.22
Discontinuous medium-density urban fabric (S.L.: 30–50%)0.69
Discontinuous low-density urban fabric (S.L.: 10–30%)0.15
Industrial, commercial, public, military, and private units19.83
Other roads and associated land26.73
Railways and associated land0.56
Construction sites0.04
Land without current use0.17
Green urban areas15.53
Sports and leisure facilities1.44