


Abstract
Changes in the thickness temperature (TT) of the lower atmosphere from 1961 to 2025 were investigated using air pressure data from eight stations in the Central Mountain region of Japan. The stations were located at elevations ranging from 400 m to 1300 m above sea level. The average linear trend in TT at these stations was 0.25 °C per decade, which was close to the air temperature trend at non-urban stations in the surrounding coastal areas. Despite the presence of some divergence in TT trends across the stations, TT is expected to serve as a complementary index for climate change research, since concerns about spatial representativeness and temporal homogeneity exist in air temperature data.
1. Introduction
Monitoring air temperature trends with climate change requires spatially representative and temporally homogeneous data. There are several problems in this regard. One of these is urban bias, or bias induced by local warming around stations in cities. Urban temperatures are trending upward due to intensifying urban heat island effects [1,2,3]. Japan industrialized rapidly in the late 20th century. Consequently, anomalous warming trends detected in both large and small cities could negatively impact accurate climate change monitoring [4,5,6,7]. Furthermore, temperature measurements can be affected by microscale environmental changes around observation sites [8,9,10,11,12,13,14,15]. This problem can arise even at rural stations due to changes in tree cover [9,11,14]. There are also concerns about biases resulting from changes in thermometer specifications or screen types [12,14,16,17,18,19,20]. On the other hand, the IPCC Sixth Assessment Report (AR6) states that “No recent literature has emerged to alter the AR5 finding that it is unlikely that any uncorrected effects from urbanization, or from changes in land use or land cover, have raised global Land Surface Air Temperature (LSAT) trends by more than 10%”, although it adds that “larger signals have been identified in some specific regions, especially rapidly urbanizing areas such as eastern China” [21] (p. 324). It also states that “There is also no clear indication that site-specific data homogeneity issues have had any significant impact on global trends since the early 20th century”. These assessments are based on efforts to compile climate data by avoiding highly urbanized areas and removing the impact of changes in exposure and instrumentation [22,23,24,25]. Nevertheless, statistical analyses cannot eliminate the bias caused by poor representativeness and inhomogeneity, and removing their impact on long-term temperature trends remains challenging.
One way to evaluate the accuracy of long-term warming in surface temperature is to analyze trends in other observational elements and check if they align with changes in surface air temperature. Common elements include sea surface temperature and upper-level temperature. However, temperatures measured by radiosonde sounding have temporal homogeneity issues due to changes in sonde specifications [26,27,28,29], although the tropospheric warming trend obtained from carefully homogenized sonde data is close to that obtained from satellite microwave sounders and the GNSS radio occultation [30,31].
Another approach is to evaluate long-term changes in the thickness temperature (TT) of the lower atmosphere using air pressure data from high-altitude observation sites. Air pressure is less susceptible to local environmental changes compared to temperature and is expected to have superior spatial representativeness. Therefore, TT may serve as complementary information to long-term temperature time series data. Toumi et al. [32] calculated TT trends of the lower atmosphere using pressure data from 12 observatories located above 2000 m worldwide. They discussed its applicability as an indicator of climate change independent of air temperature observations. Similar analyses were conducted for Lhasa [33] and 71 stations [34] on the Tibetan Plateau, and for the summit of Mount Fuji (3776 m above sea level) in Japan [35]. However, maintaining mountain observatories is challenging, and several mountain stations in Japan have closed as remote observation technology has advanced. While the data from Mount Fuji is of high quality and valuable, a large proportion of the hourly data remain undigitized, meaning that only daily data are available.
The aim of the present study is to estimate the long-term variations in TT using pressure data from the Central Mountain region of Japan and to explore its applicability in climate change monitoring. Some stations in this region are located several hundred meters above sea level or higher and have over half a century of continuous meteorological observations with minimal missing data. While these stations are located at relatively lower elevations, which may limit the accuracy of TT estimates, they have the advantage of a larger number of stations and higher temporal resolution of the data. This study analyzes long-term TT changes and compares them with surface air temperature variations at nearby non-urban stations.
2. Data and Procedure of Analysis
2.1. Data
The Japan Meteorological Agency (JMA) operates approximately 150 surface observation stations. These stations observe air pressure at the station level, and data on sea-level pressure are also available for stations located below 800 m above sea level. The data precision is 0.1 hPa. Until the 1980s, observations were conducted manually every three or six hours using Fortin mercury barometers. These were replaced by vibrating cylinder barometers in the 1980s, and automatic hourly observations began in 1990. Capacitance barometers were introduced in the 1990s. To the best of the author’s knowledge, JMA instruments undergo regular maintenance and inspections, and no major biases due to barometer type have been reported.
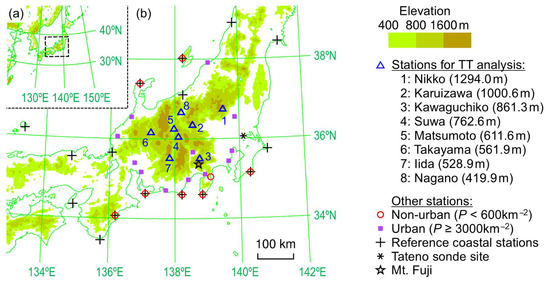
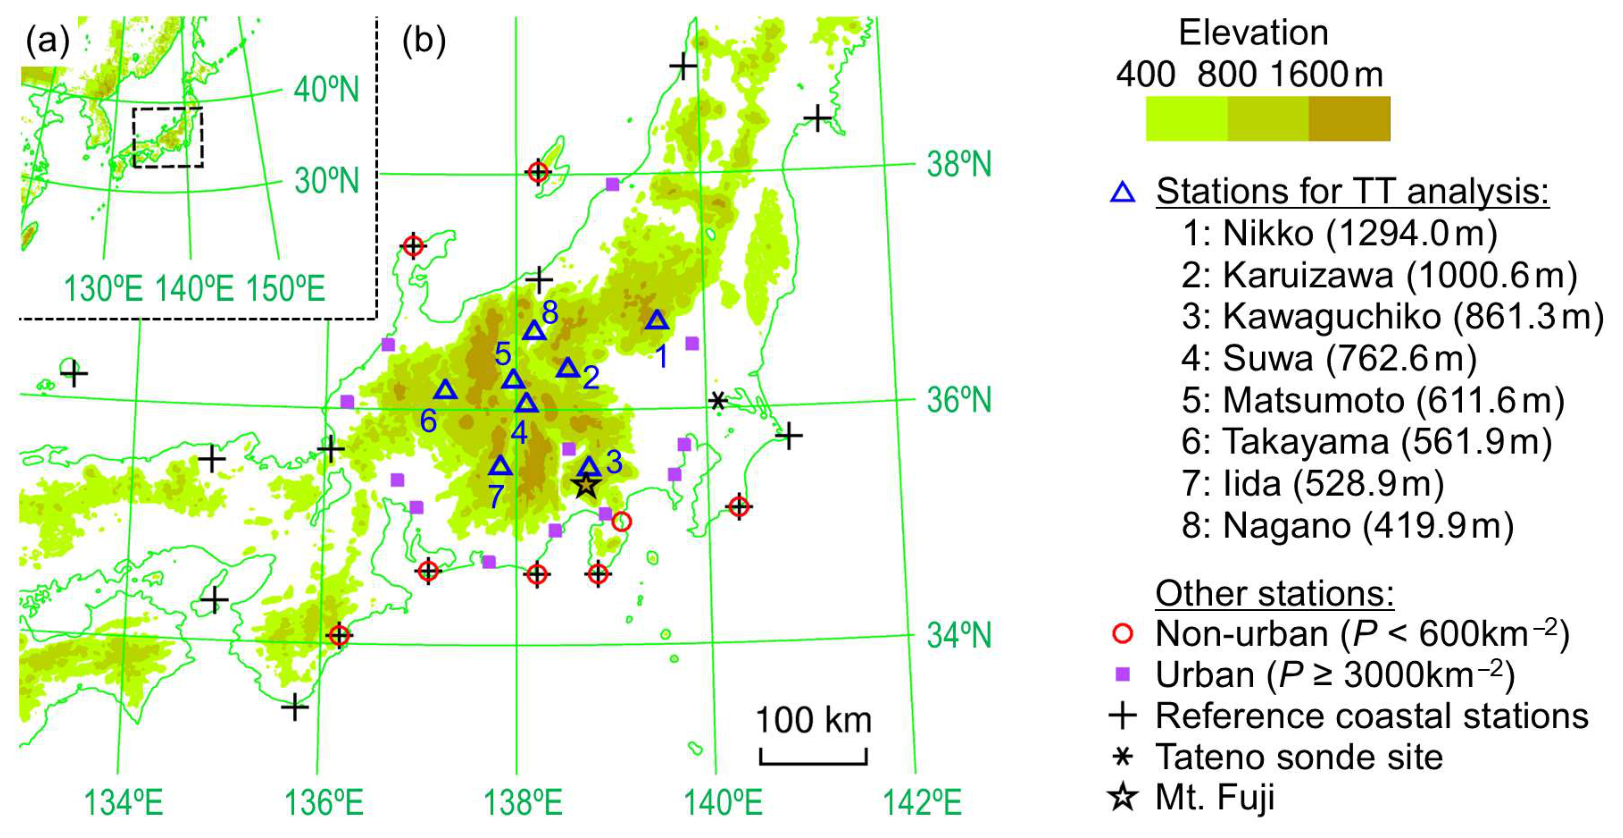
This study focused on eight stations located over 400 m above sea level in the Central Mountain (Chubu Sangaku) region, which broadly refers to the mountainous area in central Honshu. The study period was from 1961 to 2025, for which digital data were available. Figure 1 shows these stations as triangles. The three upper stations (Nikko, Karuizawa, and Kawaguchiko) are on plateaus, and the five lower stations (Suwa, Matsumoto, Takayama, Iida, and Nagano) are in basins. The analysis was made for 0300, 0900, 1500, and 2100 JST (0900 JST = 0000 UTC). Data for Karuizawa are unavailable from April to December 1964. Apart from this, there are 77 missing values across the eight stations, accounting for 0.01% of the total. Barometer elevations are listed in a file provided by the JMA [36].
Figure 1.
Stations used in the study. The area outlined with a dashed line in (a) is shown in (b). The barometer elevation at the stations for TT analysis is shown in parentheses.
To represent the synoptic-scale meteorological conditions of the target region, sea-level pressure, surface air temperature, and vapor pressure data from 16 JMA stations in the surrounding coastal areas were used. The temperature and vapor pressure data have a precision of 0.1 °C and 0.1 hPa, respectively. These stations were selected so that they were not located in large cities. Instead, they were chosen from sites facing the open sea, such as capes and outlying islands, as much as possible. Figure 1 shows these stations marked with crosses as “Reference coastal stations.”
Furthermore, the long-term trends in TT were compared with those in surface air temperature (TS) around the Central Mountain region. For this purpose, eight JMA stations with an ambient population density below 600 km–2 were defined as non-urban, and 12 stations with a population density above 3000 km–2 were defined as highly urban. Ambient population density (P) was calculated using 2015 census data with a resolution of 30″ latitude and 45″ longitude, applying a Gaussian weight with an e–1-folding radius of 3 km in a manner similar to previous studies [4,37]. Figure 1 shows these stations as circles and dots. Note that past research has shown that a slight urban warming of less than 0.1 °C decade–1 is detected even at locations with population densities of 100–300 km–2 in Japan [4]. However, since there are so few pristine, non-urban stations providing data dating back to 1961, this study set the non-urban threshold at 600 km–2, acknowledging the presence of slight urban effects. All eight non-urban stations are located in coastal areas.
The above analysis was conducted by correcting discontinuities in temperature and vapor pressure data using the same method as in a previous study [37]. The correction was based on comparing the differences in observed values between the target station and stations within 300 km of it. This comparison covered the five years prior to relocation and the five years following it. The correction was performed separately for each month and each hour.
2.2. Procedure of Analysis
The calculation of TT was based on the following equation derived from the hydrostatic equation:
where Tv is the thickness virtual temperature, g (=9.8 m s–2) is gravitational acceleration, R (=287 J kg–1 K–1) is the gas constant for dry air, H is the barometer elevation, pg is the station-level pressure, and ps is the sea-level pressure. Then TT was obtained as
where q is the vapor mixing ratio. For TT values to represent the regional low-level temperature, ps needs to represent the sea-level pressure of the synoptic field. In this study, the ps value at the target station was estimated by horizontally interpolating the ps values at the 16 reference coastal stations. The interpolation was based on the least squares condition
where ps(k) is the sea-level pressure at the k-th coastal station, xk and yk are the eastward and northward distances of the k-th station from the target station, , r* = 300 km, and a, b, and ⟨ps⟩ are the least-squares coefficients. The interpolation radius of influence, r*, was set to 300 km, taking into account the spatial density of the reference stations and the horizontal scale of spatial variations in the synoptic field. The estimated sea-level pressure at the target station is given by ⟨ps⟩. The mixing ratio (q) was calculated using the station-level pressure, temperature, and vapor pressure for the reference stations and then interpolated horizontally in the same way as ps.
The next chapter presents time series and trends of TT and TS for the period from 1961 to 2025. To remove differences in climatic values due to stations, months, and times of day, the time series are presented as departures from the mean values for the first 20 years (1961–1980). Trends over the 65-year period were calculated using linear regression. The annual mean trend is based on annual mean values, not the average of the monthly trends. Similarly, the daily mean trend is based on daily mean values.
2.3. Data Check
During the analysis process, it was found that some of the pg data were incorrect. To check the data, an estimate of pg was calculated by applying the hydrostatic equation to the ps and Tv values, which were interpolated from the reference stations. The validity of recorded pg values that deviated by 5 hPa or more from the estimation was determined by comparing them with values from preceding and following times and/or nearby stations. When an error was identified, the correct value was estimated. Corrections to the ps data were made in a similar manner.
All erroneous data were from before 1990, in which automated observations were introduced. Of the eight stations used to calculate TT, 183 erroneous pg data were identified, representing 0.054% of the total data from 1961 to 1989. The error was 10 hPa in 75% of cases, while in some cases it was as large as 30 hPa. Errors of a few hectopascals cannot be detected using the current method, but it is unlikely that they will have a significant impact on the results. Nevertheless, this is acknowledged as a limitation of the analysis.
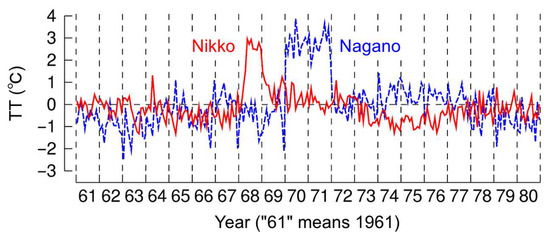
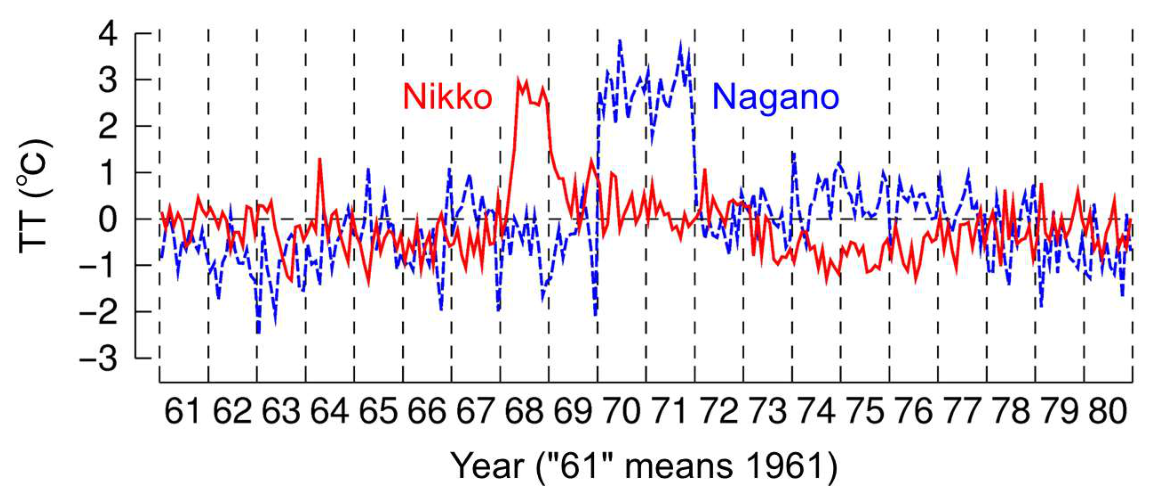
In addition to these individual errors, anomalies on an annual scale were observed at Nikko and Nagano. Figure 2 shows the time series of the monthly mean TT (departure from the 1961–1980 average) at the two stations. From 1968 to early 1969, the values at Nikko were unnaturally high, reaching 2–3 °C above the surrounding periods. From 1970 to 1971, the values at Nagano were around 3 °C higher. These displacements show little seasonal variation and are commonly observed for all times of day. It is unlikely that these deviations are due to climatological factors. Instead, some sort of instrumental or operational bias is suspected, although the specific cause remains unknown. If the cause is barometer bias, then the values would be approximately 1.3 hPa for Nikko and 0.4 hPa for Nagano. If the cause is barometer elevation bias, the values would be 11–12 m and 3–4 m, respectively. For this study, the TT data for each two-year period were not used, although analyses including these data were conducted for comparison purposes.
Figure 2.
Monthly TT time series for Nikko and Nagano from 1961 to 1980. Departure from the 20-year average for each month are shown.
3. Results
3.1. Time Series of Thickness Temperatures (TT)
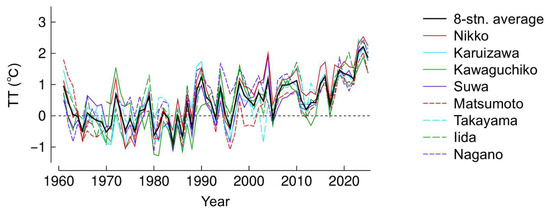
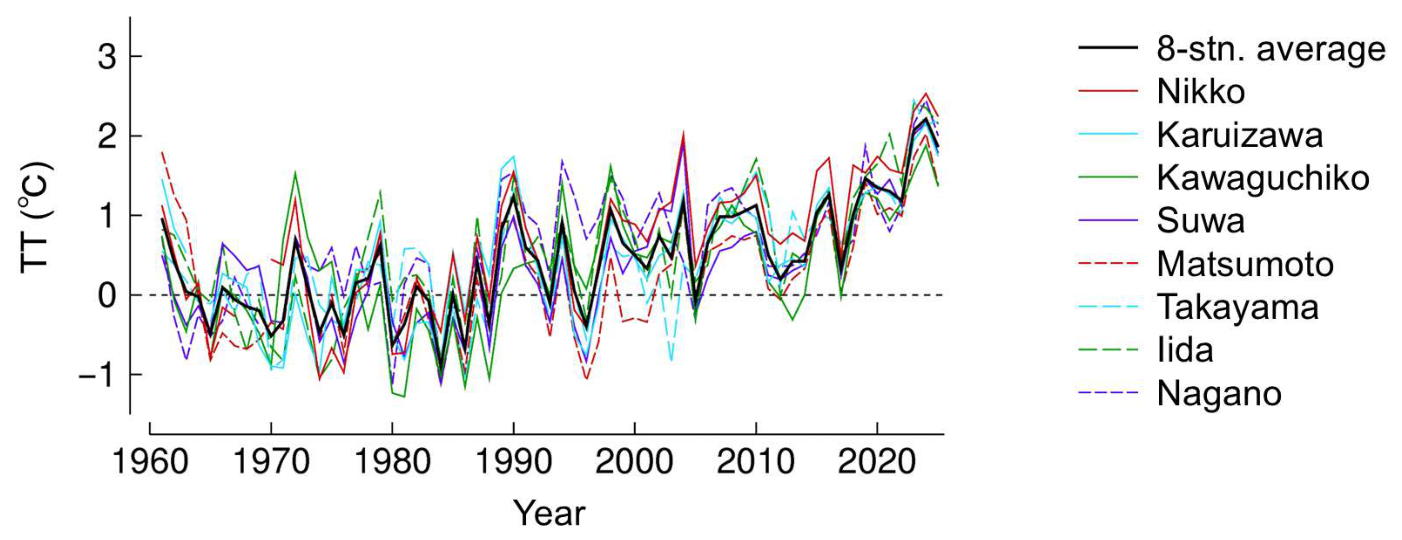
Figure 3 shows the time series of the annual mean values of TT at each station, as well as the average TT across all eight stations. There is year-to-year fluctuation of the order of 1 °C, which is nearly in phase across stations. Additionally, an upward trend is observed toward the end of the period. By the 2020s, TT is 1 to 2 °C higher than in the early part of the period.
Figure 3.
Time series of annual mean TT for each station and the average over the eight stations. Departures from the 1961–1980 average are shown.
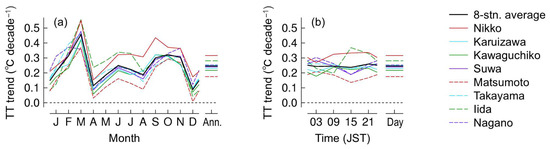
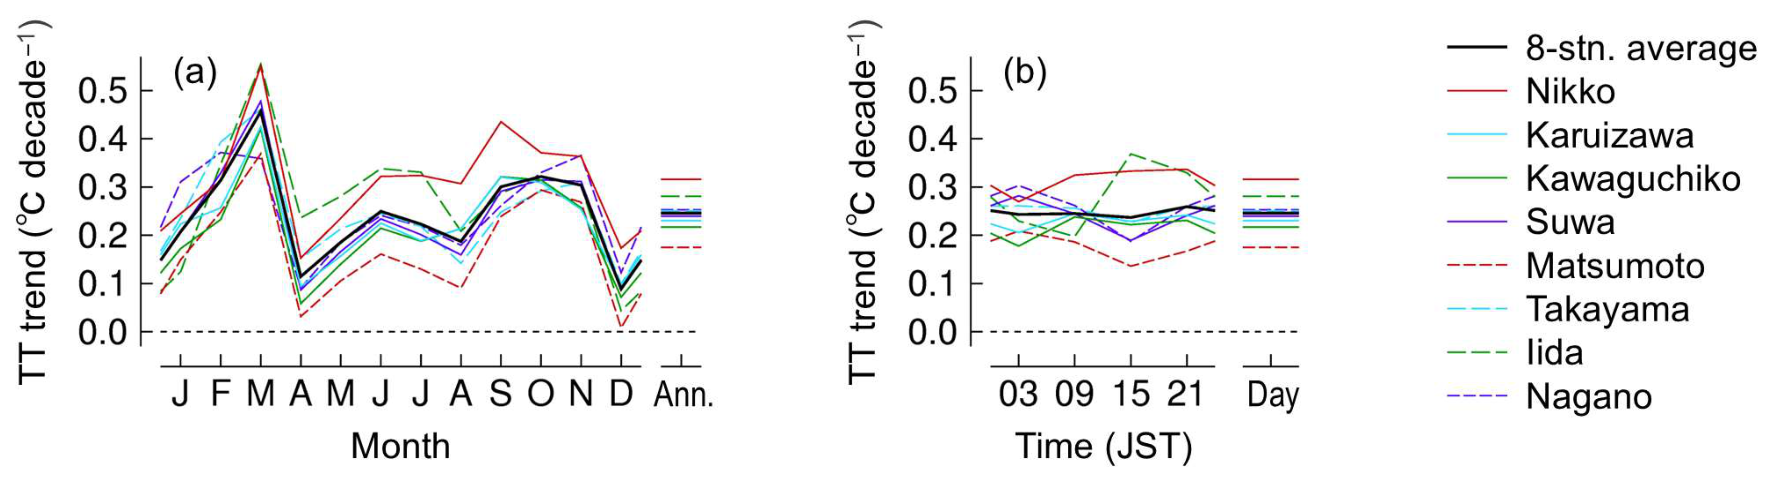
Figure 4a shows the linear trend of TT for each month. The average trend across the eight stations is positive throughout the year, with an annual mean trend of 0.25 °C decade–1. However, trends vary by station. The annual mean trend ranges from 0.32 °C decade–1 at Nikko to 0.17 °C decade–1 at Matsumoto. The unbiased standard deviation (SD) of the annual mean trends across the eight stations is 0.042 °C decade–1. On the other hand, seasonal variation patterns in the TT trend are largely consistent across stations, with trends in March (≈0.5 °C decade–1) and from September to November (≈0.3 °C decade–1) being larger than those in other months.
Figure 4.
Linear trend of TT by (a) month and (b) time of day. The annual trend in (a) and the daily trend in (b) are identical.
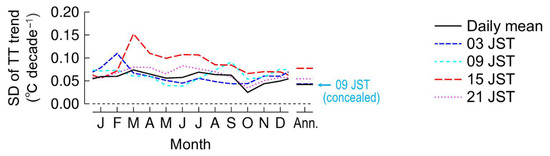
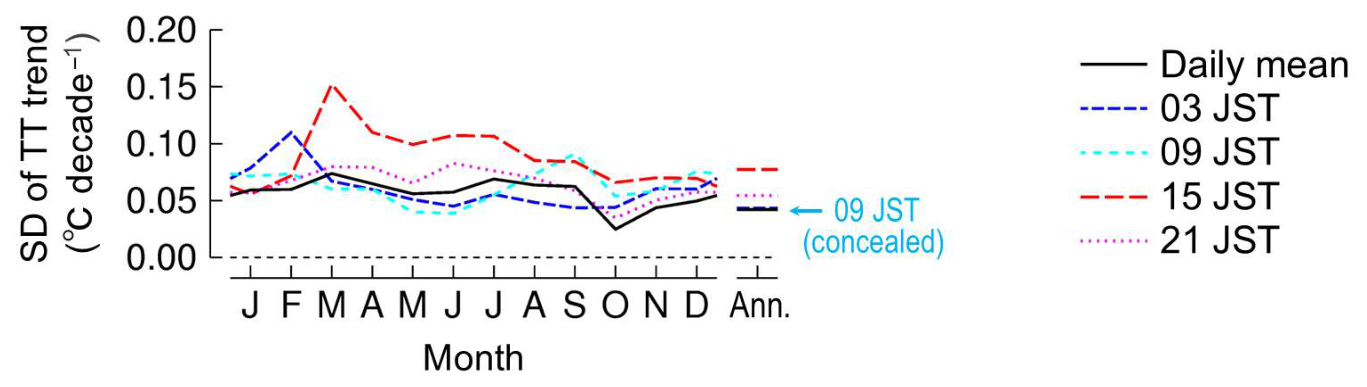
Figure 4b shows the trends in TT by time of day. The average trend across the eight stations remains nearly constant throughout the day. However, the trend varies among stations. Some stations have a higher trend during the daytime, while others have a lower trend. There is greater variation in trends among stations during the daytime than at night. Figure 5 shows the SD of the TT trends across the eight stations for each month and observation time of day. The SD is particularly large at 1500 JST, especially from spring to summer. From March to July, the SD at 1500 JST is three times larger or more than the SD of the annual and daily mean TT.
Figure 5.
Standard deviation (SD) of TT over the eight stations by month and time of day.
3.2. Comparison of TT and Surface Air Temperature (TS) Trends
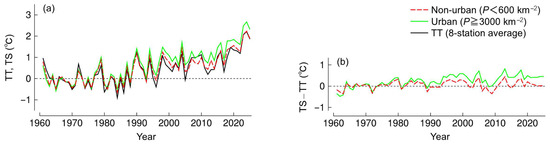
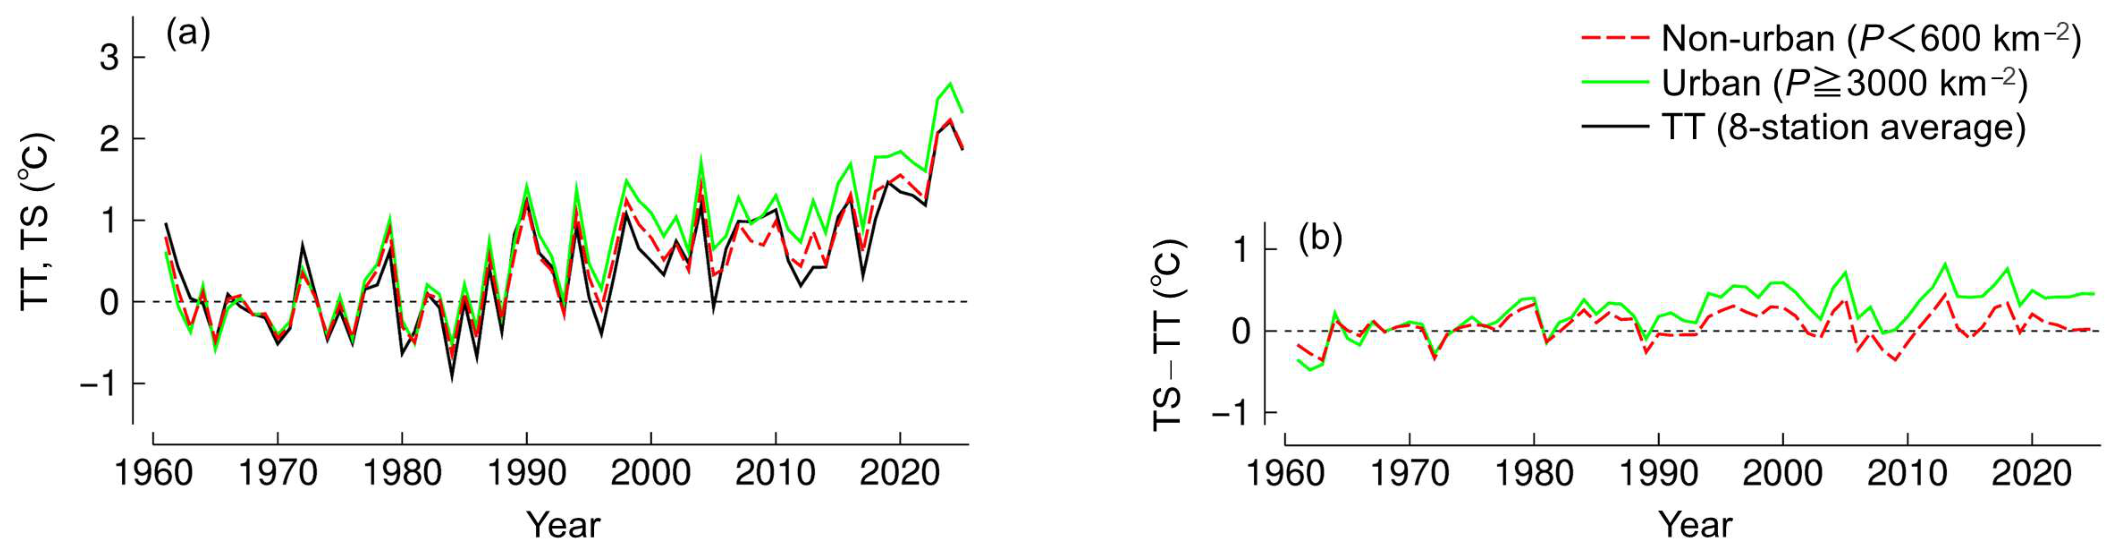
Figure 6a shows the time series of the annual mean surface air temperature (TS) averaged over the eight non-urban stations with P < 600 km–2 and the 12 highly urban stations with P ≥ 3000 km–2, alongside the eight-station average TT. For the non-urban stations, the TS exhibits interannual changes that are similar to the TT, with an annual mean trend of 0.27 °C decade–1, which is close to the TT trend of 0.25 °C decade–1. TS trends at individual non-urban stations vary by site. The standard deviation of the annual mean TS trend across the eight non-urban stations is 0.031 °C decade–1, nearly three-quarters of the SD of the TT trend. On the other hand, the linear trend in TS at the urban stations is larger than that at the non-urban stations, with an annual mean trend of 0.35 °C decade–1. Figure 6b shows the departure of TS from TT, or TS–TT. There is almost no upward trend in TS–TT at non-urban sites, whereas TS–TT at urban sites is increasing. Note that TS–TT at the urban stations has barely increased since the mid-1990s, which is consistent with the recent deceleration of urban warming in Japan [38].
Figure 6.
Same as Figure 3, but (a) surface air temperatures (TS) at 8 non-urban and 12 urban locations, along with the 8-station average TT, and (b) departures of TS from the 8-station average TT. For all items, the departure from the 1961–1980 average is shown.
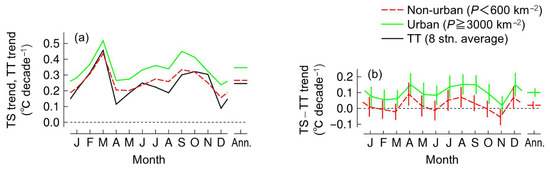
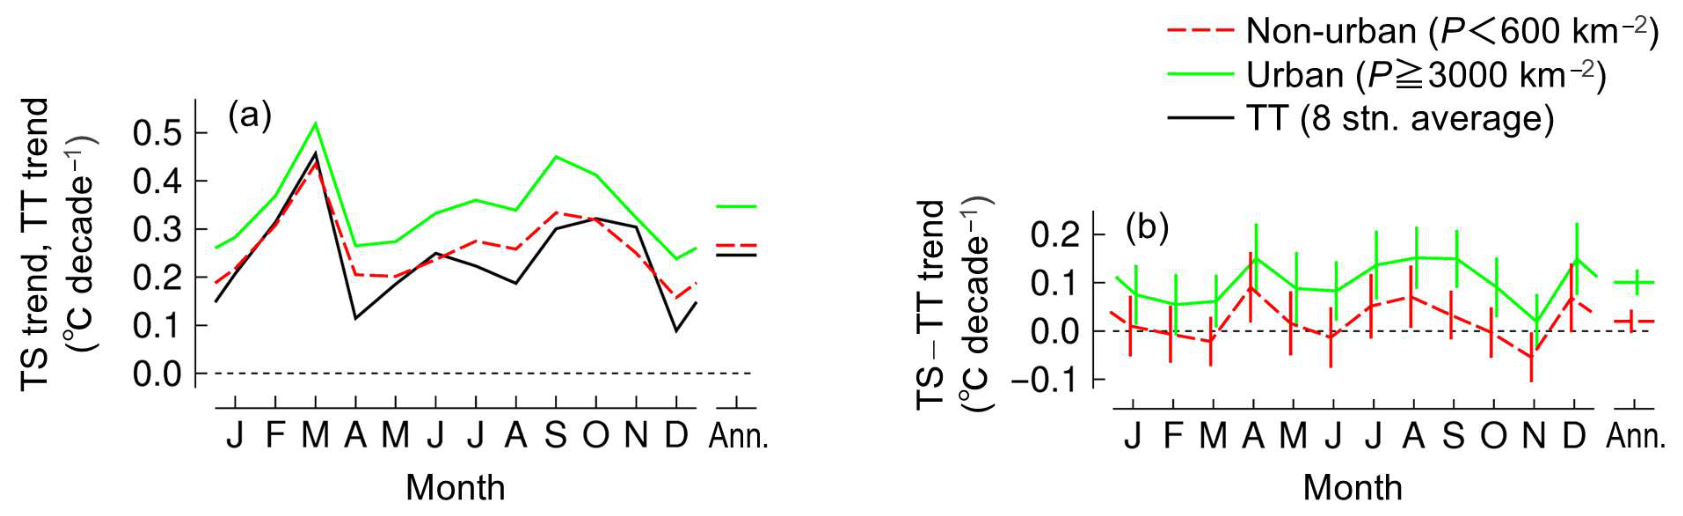
Figure 7 shows the monthly and annual trends in TS and TS–TT for the non-urban and urban stations. The annual variation in the trend for the non-urban stations closely resembles the TT trend, with high values in March and from September to November. The trends for the urban stations exhibit positive displacement throughout the year, with no noticeable seasonal changes in the levels of displacement.
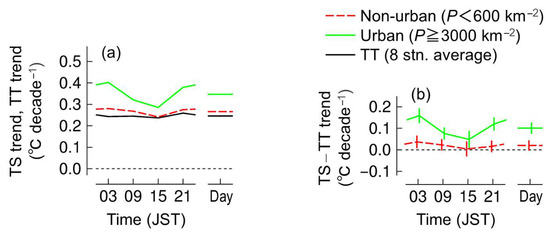
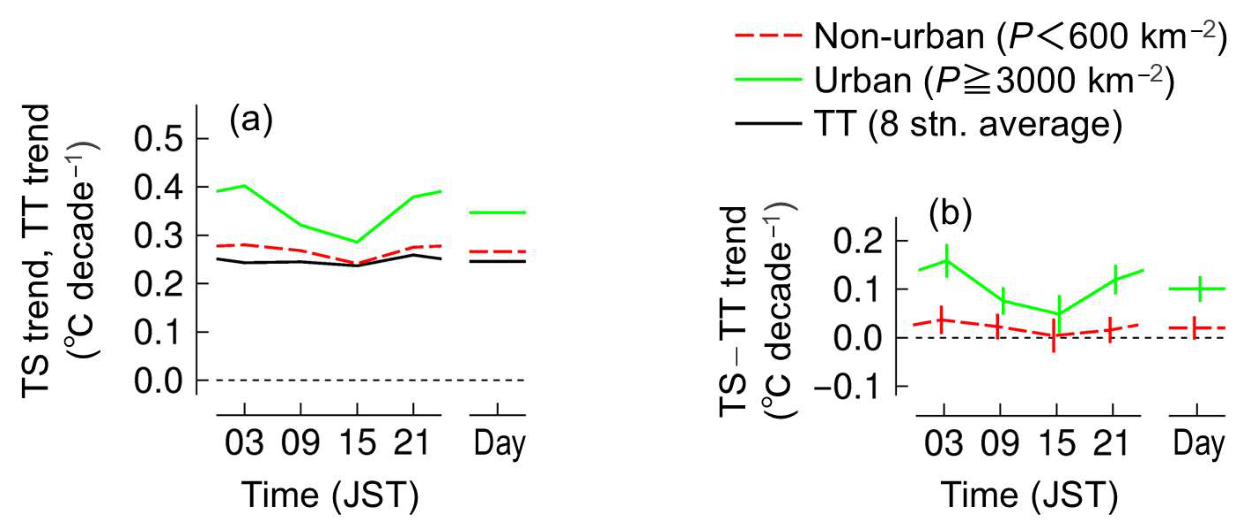
Figure 8 shows the TS and TS–TT trends by time of day. For the urban stations, the trend is higher at night than during the day. This day–night asymmetry is a common feature of urban warming [1,2,4,6,37]. The non-urban stations also exhibit a slight day–night difference. The linear trend of the temperature difference between 1500 and 0300 JST (1500 minus 0300) at the non-urban stations is –0.039 °C decade–1, which is statistically significant at the 1% level. This suggests that the non-urban stations may have experienced some degree of urbanization as well, as noted in Section 2.2.
Figure 8.
Trends over time of day for (a) TS and TT, and (b) TS-TT. The vertical bars in (b) represent the 95% confidence ranges.
3.3. Comparison of Results from Different Options in the TT Analysis
The TT analysis involves several arbitrary options. To examine how TT trends depend on these options, calculations were performed with the following modifications:
- (1)
- the average TT value for the eight stations was calculated using the elevation of each station as a weight;
- (2)
- the questionable data from Nikko (1968–1969) and Nagano (1970–1971) were included;
- (3)
- r* = 500 km was used for Equation (3) instead of r* = 300 km; and
- (4)
- virtual temperature was used for TT instead of air temperature.
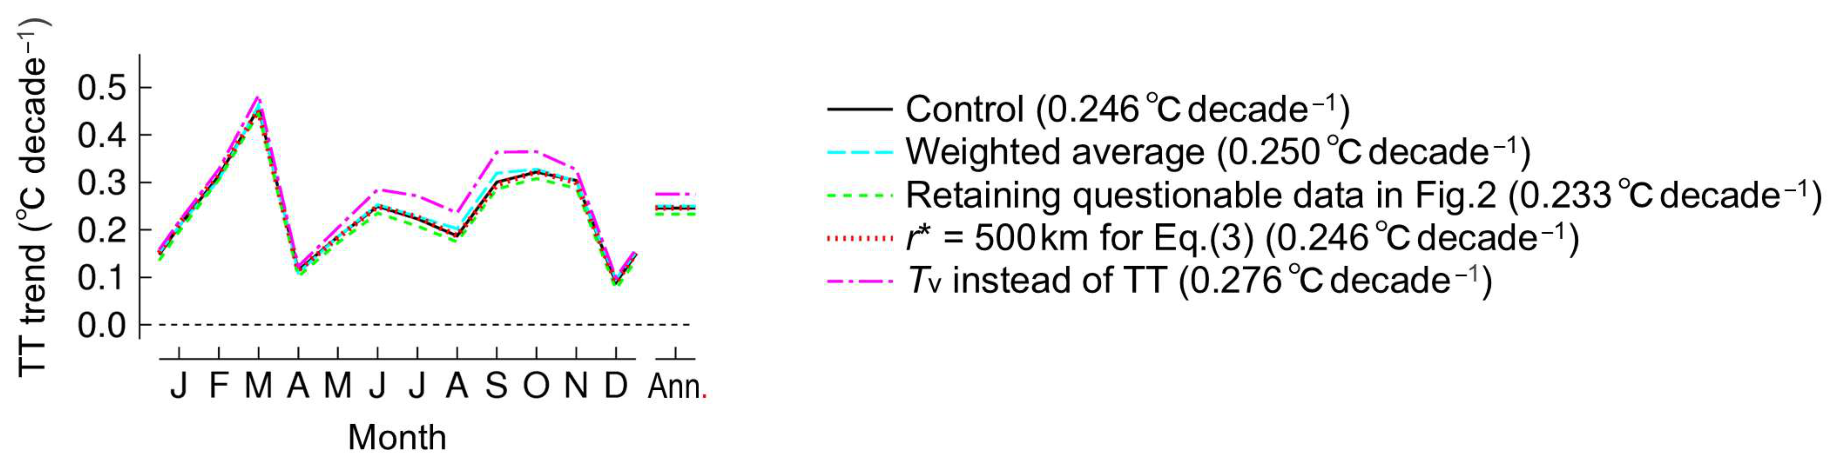
Figure 9 shows the monthly and annual mean values of the TT trend. For condition (4), the trends are higher than the air temperature-based TT by 0.03 °C decade–1 on the annual mean and by up to 0.06 °C decade–1 during the warm season. This difference is primarily due to the increase in moisture accompanying the warming trend. The annual mean temperature and mixing ratio in the Central Mountain region are approximately 12 °C and 8 g kg–1, respectively. According to the Clausius-Clapeyron relationship, a 1 °C increase in temperature (T) is accompanied by a roughly 7% increase in mixing ratio (q) if relative humidity remains constant. Thus, substituting T ≈ 285 K, q ≈ 8 g kg–1, and TT trend ≈ 0.25 °C decade–1 into Equation (2) yields an increase in virtual temperature of TT trend × 0.61 × 0.07Tq ≈ 0.024 °C decade–1, which is close to the aforementioned value.
Figure 9.
Monthly trends in the 8-station average TT for different analysis options. The annual mean trend is shown in parentheses.
The trends obtained under conditions (1) through (3) are nearly identical to those from the main analysis, with a maximum difference of 0.02 °C decade–1, which is smaller than the SD of the trends among the stations. This suggests that minor technical details in the analysis have a minimal impact on the results. However, the inherent uncertainties in the data and the impact of the complex topography of the study area were not accounted for in the analysis in Figure 9. The limitations of this analysis associated with these factors will be discussed at the end of the next chapter.
4. Discussion
This study used air pressure data from stations in the Central Mountain region of Japan to assess the long-term change in TT from 1961 to 2025. These stations are located between 400 m and 1300 m above sea level, which is lower than the stations used in previous studies [32,33,34,35]. Since TT is inversely proportional to ln ps–ln pg (Equation (1)), the accuracy of TT estimation may decline as station elevation decreases. Nevertheless, year-to-year variations in TT were similar across stations, and the long-term average TT trend was close to the surface air temperature trend at surrounding non-urban stations. Furthermore, the TT trend is consistent with the low-level warming rate observed by radiosondes. The 850 hPa temperature trend at Tateno, east of the Central Mountains (Figure 1), was calculated to be 0.18 °C decade–1 for the period from 1958 to 2014 after correcting for biases arising from differences in sonde types [39]. For the roughly same period of 1961 to 2014, the average TT trend across the eight stations is 0.17 °C decade–1, which is close to the aforementioned value. Thus, this study demonstrates that TT analysis using data from relatively low-elevation stations can capture climate change with reasonable accuracy, provided that multiple sites are employed and data checks are conducted. Therefore, TT analysis can provide complementary data to surface and sonde observations, which often face challenges regarding spatial representativeness and temporal homogeneity.
However, the TT trends vary among stations, raising concerns about the reliability of the results. One possible cause of this variability is the complex topography of the target region. Previous studies have shown topographically induced distortion of atmospheric fields in the region [40,41], whereas this study estimates the synoptic-scale atmospheric field using simple interpolation from coastal stations. Using a more sophisticated method may improve the accuracy of the analysis. On the other hand, the scatter of TT trends is particularly large during the day (1500 JST) from spring to summer, suggesting a thermal effect as a cause of the scatter. In the basins of the Central Mountain region, daytime heating has been found to cause a pressure drop of 1 hPa or more [42]. It is possible that long-term changes in the surface heat balance have been accompanied by basin-specific trends in daytime pressure and, consequently, in TT. A detailed investigation of these aspects is left to future research.
Additionally, this analysis suggests inherent uncertainties in the data. While the case shown in Figure 2 is obviously unnatural, smaller fluctuations are found elsewhere. For example, Figure 2 shows slight positive and negative anomalies at Nagano and Nikko, respectively, around 1975. Similar fluctuations are observed at all stations throughout the entire analysis period and may be caused by non-climatic factors such as biases in pressure or elevation data. However, the cause of these fluctuations cannot be identified. Thus, uncertainty in the data may be an inevitable limitation of the approach to analyzing long-term climate change based on TT. Nevertheless, since this study uses data from eight stations rather than one, the influence of any site-specific biases has likely been reduced.
5. Summary
- Using air pressure data from 1961 to 2025, interannual variations in the thickness temperature (TT) of the lower atmosphere were calculated for eight stations located at elevations of 400 m to 1300 m in the Central Mountain region of Japan.
- Long-term changes in TT show close agreement with changes in surface air temperature (TS) at non-urban coastal stations surrounding the Central Mountain region. The linear trend in the annual mean TT averaged across the eight stations is 0.25 °C decade–1, while the TS trend for eight non-urban stations is 0.27 °C decade–1.
- The TT data show unexplained year-to-year fluctuations that may arise from non-climatological sources, and the linear TT trends vary among stations, which may limit the reliability of TT analysis. Nevertheless, since other methods also have their pros and cons, TT can serve as an independent indicator of long-term climate change insensitive to environmental or instrumental changes.
Funding
This research received no external funding.
Data Availability Statement
The data used in the study were obtained from the website of the Japan Meteorological Agency (https://www.data.jma.go.jp/obd/stats/etrn/index.php (accessed on 21 June 2026)).
Acknowledgments
The author is grateful to two anonymous reviewers for valuable comments.
Conflicts of Interest
The author declares no conflicts of interest.
Abbreviations
The following abbreviations are used in this manuscript:
| IPCC | Intergovernmental Panel on Climate Change |
| JMA | Japan Meteorological Agency |
| SD | Standard deviation |
| TS | Surface air temperature |
| TT | Thickness temperature |
References
- Oke, T.R.; Mills, G.; Christen, A.; Voogt, J.A. Urban Climates; Cambridge University Press: Cambridge, UK, 2017; 546p, ISBN 978-11-074-2953-6. [Google Scholar] [CrossRef] [Scilit]
- Fujibe, F. Climatological Study of Urban Climate and Heat and Cold Mortalities in Japan; Springer Nature: Singapore, 2023; 203p, ISBN 978-981-99-4385-2. [Google Scholar] [CrossRef] [Scilit]
- Ren, G.; Sun, X.; Zhang, P.; Wen, K.; Tysa, S.K.; Liu, Y.; Zhang, S.; He, J.; Qin, Y.; Om, K.-C.; et al. Progress and uncertainty in studies of contemporary land climate warming rate: From globe to region. J. Geogr. (Chigaku Zasshi) 2025, 134, 379–399. Available online: https://www.jstage.jst.go.jp/article/jgeography/134/4/134_134.379/_article/-char/en (accessed on 10 August 2026).
- Fujibe, F. Detection of urban warming in recent temperature trends in Japan. Int. J. Climatol. 2009, 29, 1811–1822. [Google Scholar] [CrossRef] [Scilit]
- Das, L.; Annan, J.D.; Hargreaves, J.C.; Emori, S. Centennial scale warming over Japan: Are the rural stations really rural? Atmos. Sci. Lett. 2011, 12, 362–367. [Google Scholar] [CrossRef] [Scilit]
- Katata, G.; Connolly, R.; O’Neill, P. Evidence of urban blending in homogenized temperature records in Japan and in the United States: Implications for the reliability of global land surface air temperature data. J. Appl. Meteorol. Climatol. 2023, 62, 1095–1114. [Google Scholar] [CrossRef] [Scilit]
- Katata, G.; Nakayama, R.; Fujibe, F.; Maeda, S. Reconstruction of the background air temperature record in Japan (1916–2023): Implications for climate change and urbanisation bias in the 20th century. Int. J. Climatol. 2025, 45, e70141. [Google Scholar] [CrossRef] [Scilit]
- Mahmood, R.; Foster, S.A.; Logan, D. The GeoProfile metadata, exposure of instruments, and measurement bias in climatic record revisited. Int. J. Climatol. 2006, 26, 1091–1124. [Google Scholar] [CrossRef] [Scilit]
- Runnalls, K.E.; Oke, T.R. A technique to detect microclimatic inhomogeneities in historical records of screen-level air temperature. J. Clim. 2006, 19, 959–978. [Google Scholar] [CrossRef] [Scilit]
- Pielke, R., Sr.; Nielsen-Gammon, J.; Davey, C.; Angel, J.; Bliss, O.; Doesken, N.; Cai, M.; Fall, S.; Niyogi, D.; Gallo, K.; et al. Documentation of uncertainties and biases associated with surface temperature measurement sites for climate change assessment. Bull. Am. Meteorol. Soc. 2007, 88, 913–928. [Google Scholar] [CrossRef] [Scilit]
- Pielke, R.A., Sr.; Davey, C.A.; Niyogi, D.; Fall, S.; Steinweg-Woods, J.; Hubbard, K.; Lin, X.; Cai, M.; Lim, Y.-K.; Li, H.; et al. Unresolved issues with the assessment of multidecadal global land surface temperature trends. J. Geophys. Res. Atmos. 2007, 112, D24S08. [Google Scholar] [CrossRef] [Scilit]
- Trewin, B. Exposure, instrumentation, and observing practice effects on land temperature measurements. WIREs Clim. Change 2010, 1, 490–506. [Google Scholar] [CrossRef] [Scilit]
- Fall, S.; Watts, A.; Nielsen-Gammon, J.; Jones, E.; Niyogi, D.; Christy, J.R.; Pielke, R.A., Sr. Analysis of the impacts of station exposure on the U.S. Historical Climatology Network temperatures and temperature trends. J. Geophys. Res. Atmos. 2011, 116, D14120. [Google Scholar] [CrossRef] [Scilit]
- Sugawara, H.; Kondo, J. Microscale warming due to poor ventilation at surface observation stations. J. Atmos. Ocean. Technol. 2019, 36, 1237–1254. [Google Scholar] [CrossRef] [Scilit]
- Wallis, E.J.; Osborn, T.J.; Taylor, M.; Jones, P.D.; Joshi, M.; Hawkins, E. Quantifying exposure biases in early instrumental land surface air temperature observations. Int. J. Climatol. 2024, 44, 1611–1635. [Google Scholar] [CrossRef] [Scilit]
- Hubbard, K.G.; Lin, X. Reexamination of instrument change effects in the U.S. Historical Climatology Network. Geophys. Res. Lett. 2006, 33, L15710. [Google Scholar] [CrossRef] [Scilit]
- Oyler, J.W.; Dobrowski, S.Z.; Ballantyne, A.P.; Klene, A.E.; Running, S.W. Artificial amplification of warming trends across the mountains of the western United States. Geophys. Res. Lett. 2015, 42, 153–161. [Google Scholar] [CrossRef] [Scilit]
- Ma, C.; Fassnacht, S.R.; Kampf, S.K. How temperature sensor change affects warming trends and modeling–An evaluation across the state of Colorado. Water Resour. Res. 2019, 55, 9748–9764. [Google Scholar] [CrossRef] [Scilit]
- Harrison, R.G.; Burt, S.D. Quantifying uncertainties in climate data: Measurement limitations of naturally ventilated thermometer screens. Environ. Res. Commun. 2021, 3, 061005. [Google Scholar] [CrossRef] [Scilit]
- Harrison, R.G.; Burt, S.D. Accuracy of daily extreme air temperatures under natural variations in thermometer screen ventilation. Atmos. Sci. Lett. 2024, 25, e1256. [Google Scholar] [CrossRef] [Scilit]
- IPCC. Climate Change 2021: The Physical Science Basis. Contribution of Working Group I to the Sixth Assessment Report of the Intergovernmental Panel on Climate Change; Masson-Delmotte, V., Zhai, P., Pirani, A., Connors, S.L., Péan, C., Berger, S., Caud, N., Chen, Y., Goldfarb, L., Gomis, M.I., et al., Eds.; Cambridge University Press: Cambridge, UK, 2021; 2391p. [Google Scholar] [CrossRef] [Scilit]
- Jones, P. The reliability of global and hemispheric surface temperature records. Adv. Atmos. Sci. 2016, 33, 269–282. [Google Scholar] [CrossRef] [Scilit]
- Menne, M.J.; Williams, C.N.; Gleason, B.E.; Rennie, J.J.; Lawrimore, J.H. The Global Historical Climatology Network monthly temperature dataset, Version 4. J. Clim. 2018, 31, 9835–9854. [Google Scholar] [CrossRef] [Scilit]
- Trewin, B.; Braganza, K.; Fawcett, R.; Grainger, S.; Jovanovic, B.; Jones, D.; Martin, D.; Smalley, R.; Webb, V. An updated long-term homogenized daily temperature data set for Australia. Geosci. Data J. 2020, 7, 149–169. [Google Scholar] [CrossRef] [Scilit]
- Osborn, T.J.; Jones, P.D.; Lister, D.H.; Morice, C.P.; Simpson, I.R.; Winn, J.P.; Hogan, E.; Harris, I.C. Land surface air temperature variations across the globe updated to 2019: The CRUTEM5 data set. J. Geophys. Res. Atmos. 2021, 126, e2019JD032352. [Google Scholar] [CrossRef] [Scilit]
- Thorne, P.W.; Brohan, P.; Titchner, H.A.; McCarthy, M.P.; Sherwood, S.C.; Peterson, T.C.; Haimberger, L.; Parker, D.E.; Tett, S.F.B.; Santer, B.D.; et al. A quantification of uncertainties in historical tropical tropospheric temperature trends from radiosondes. J. Geophys. Res. Atmos. 2011, 116, D12116. [Google Scholar] [CrossRef] [Scilit]
- Kobayashi, E.; Noto, Y.; Wakino, S.; Yoshii, H.; Ohyoshi, T.; Saito, S.; Baba, Y. Comparison of Meisei RS2-91 rawinsondes and Vaisala RS92-SGP radiosondes at Tateno for the data continuity for climatic data analysis. J. Meteorol. Soc. Jpn. 2012, 90, 923–945. [Google Scholar] [CrossRef] [Scilit][Green Version]
- Hoshino, S.; Sugidachi, T.; Shimizu, K.; Kobayashi, E.; Fujiwara, M.; Iwabuchi, M. Comparison of GRUAN data products for Meisei iMS-100 and Vaisala RS92 radiosondes at Tateno, Japan. Atmos. Meas. Tech. 2022, 15, 5917–5948. [Google Scholar] [CrossRef] [Scilit]
- Madonna, F.; Tramutola, E.; Sy, S.; Serva, F.; Proto, M.; Rosoldi, M.; Gagliardi, S.; Amato, F.; Marra, F.; Fassò, A.; et al. The new Radiosounding HARMonization (RHARM) data set of homogenized radiosounding temperature, humidity, and wind profiles with uncertainties. J. Geophys. Res. Atmos. 2022, 127, e2021JD035220. [Google Scholar] [CrossRef] [Scilit]
- Sherwood, S.C.; Meyer, C.L.; Allen, R.J.; Titchner, H.A. Robust tropospheric warming revealed by iteratively homogenized radiosonde data. J. Clim. 2008, 21, 5336–5350. [Google Scholar] [CrossRef] [Scilit]
- Steiner, A.K.; Ladstädter, F.; Randel, W.J.; Maycock, A.C.; Fu, Q.; Claud, C.; Gleisner, H.; Haimberger, L.; Ho, S.-P.; Keckhut, P.; et al. Observed temperature changes in the troposphere and stratosphere from 1979 to 2018. J. Clim. 2020, 33, 8165–8194. [Google Scholar] [CrossRef] [Scilit]
- Toumi, R.; Hartell, N.; Bignell, K. Mountain station pressure as an indicator of climate change. Geophys. Res. Lett. 1999, 26, 1751–1754. [Google Scholar] [CrossRef] [Scilit]
- Moore, G.W.K. Surface pressure record of Tibetan Plateau warming since the 1870s. Q. J. R. Meteorol. Soc. 2012, 138, 1999–2008. [Google Scholar] [CrossRef] [Scilit]
- You, Q.; Jiang, Z.; Moore, G.W.K.; Bao, Y.; Kong, L.; Kang, S. Revisiting the relationship between observed warming and surface pressure in the Tibetan Plateau. J. Clim. 2017, 30, 1721–1737. [Google Scholar] [CrossRef] [Scilit]
- Tsutsumi, Y. Multidecadal trends in thickness temperature, surface temperature, and 700-hPa temperature in the Mount Fuji region, Japan, 1965–2016. J. Clim. 2018, 31, 8305–8312. [Google Scholar] [CrossRef] [Scilit]
- Japan Meteorological Agency. Outline of Surface Observation and Station List. Available online: https://www.data.jma.go.jp/stats/data/mdrr/man/kansoku_gaiyou.html (accessed on 30 June 2026). (In Japanese)
- Fujibe, F. Evaluation of the contributions of year-specific climate anomaly, nationwide warming, and urban warming to hot summers in Japan. Atmosphere 2025, 16, 435. [Google Scholar] [CrossRef] [Scilit]
- Fujibe, F. Recent decelerating trends of urban warming in Japan. SOLA 2024, 20, 116–121. Available online: https://www.jstage.jst.go.jp/article/sola/20/0/20_2024-016/_article/-char/en (accessed on 10 August 2026).
- Kobayashi, E. Temperature trend considering historical changes of radiosonde (Part 2). J. Aerol. Obs. 2016, 74, 17–26. Available online: https://www.jma-net.go.jp/kousou/information/journal/2016/pdf/74_17_Kobayashi.pdf (accessed on 30 June 2026). (In Japanese)
- Yoshino, M.M. Climate in a Small Area: An Introduction to Local Meteorology; University of Tokyo Press: Tokyo, Japan, 1975; 549p, ISBN 978-4-13-066037-2. [Google Scholar]
- Suzuki, R. Recent progress in mesoscale climatology. Geogr. Rev. Jpn. Ser. B 1996, 69, 185–193. [Google Scholar] [CrossRef] [Scilit][Green Version]
- Kuwagata, T.; Sumioka, M. The daytime PBL heating process over complex terrain in central Japan under fair and calm weather conditions. Part III: Daytime thermal low and nocturnal thermal high. J. Meteorol. Soc. Jpn. 1991, 69, 91–104. [Google Scholar] [CrossRef] [Scilit] [PubMed]
Disclaimer/Publisher’s Note: The statements, opinions and data contained in all publications are solely those of the individual author(s) and contributor(s) and not of MDPI and/or the editor(s). MDPI and/or the editor(s) disclaim responsibility for any injury to people or property resulting from any ideas, methods, instructions or products referred to in the content. |
© 2026 by the author. Licensee MDPI, Basel, Switzerland. This article is an open access article distributed under the terms and conditions of the Creative Commons Attribution (CC BY) license.