


Abstract
Many airports now consider implementing urban-cooling measures as proven strategies to reduce energy use and improve environmental conditions. Studies have also shown that reflective surfaces on roofs and grounds can have beneficial effects on thermal environment and airport workers’ productivity. To date, no studies have been undertaken to specifically assess whether any effects on aircraft performance would also result from implementing these measures. In this exploratory study, high-resolution micrometeorological modeling and remote-sensing analysis were undertaken to quantify the potential reductions in fuel use and, thus, emissions from aircraft taxiing on cooler surfaces. The results suggest small but non-zero benefits in terms of emissions and takeoff-roll distances. Using the Dallas–Ft. Worth International Airport (DFW) as a case study and Boeing 737 aircraft type as an example, it is found that if taxiways and shoulders albedo is increased to 0.35, an average of 2.3 kg CO2 can be saved per single taxi-out or taxi-in operation around midday and about 1.5 kg CO2 earlier in the morning or later in the evening. It is also found that even though runways albedo remains unchanged, cooler air advected over runways from modified taxiways can reduce the takeoff-roll distance by an average of 3% around midday that tapers off to an average of 1% early in the morning or late evening. Indeed, these are small effects per single taxi-in or taxi-out operation but when scaled by some 2000 arrivals and departures per day at DFW, saving 4000–5000 kg CO2 per day, and if further scaled by the number of eligible airports, the impacts become significant. Furthermore, the effects reported here are from taxiway and shoulder modifications alone; if combined with the effects from cool roofs and other cool ground surfaces at terminals, tarmacs, ramps, and parking areas, the benefits will add up significantly. Limitations in this study, that would be addressed in future work, include simplifying assumptions regarding aircraft-engine performance, specifications, and aircraft types mix and operations.
1. Introduction
Cool roofs and pavements are recognized as effective measures in mitigating urban heat and in producing negative radiative forcing [1,2]. Many cities and airport authorities worldwide are now expressing interest in implementing cool surfaces as a measure to locally offset the effects of overheating, reduce cooling energy use, and improve thermal-environmental conditions.
By virtue of their large surface areas and amounts of heat-absorbing building and ground-surface materials, airports both exert a strong effect on local microclimates [3,4] as well as present an excellent opportunity to act as a potential countermeasure, i.e., a source of cooler air benefiting both an airport campus and its surrounding communities. Such cooling can also benefit airliners and airport workers, especially those outdoors at ramps, and improve productivity [4].
A large body of numerical studies and observational field campaigns, too numerous to list here, has been dedicated to understanding and quantifying the effects of cooler surfaces, including cool roofs and pavements, on surface and ambient conditions, energy use, thermal comfort, biogenic and anthropogenic emissions, and air quality [5,6,7,8,9,10,11,12,13,14,15,16].
On the other hand, there is also a large number of detailed studies on aircraft engine performance in varying operational and environmental conditions, fuel efficiency, and emissions both for on-the-ground and airborne states but mostly from a large-scale climate change perspective [17,18,19,20,21].
However, and to the best of this author’s knowledge, no study to date has attempted to bridge these two different research pathways to specifically examine whether installation of cooler taxiways and shoulders might impart any effects on on-the-ground aircraft performance and emissions. The goal in this exploratory work is to evaluate whether such effects exist at all and if they should be acknowledged and accounted for. This could provide additional information to policy makers and airport planners to account for when taxiways and shoulders become due for maintenance or replacement.
To be clear, this study is not advocating cool taxiways and shoulders for the sole purpose of aircraft performance improvement, as this is not justifiable—it only quantifies what potential additional “bonus” or “free” benefits could be garnered if cool taxiways and shoulders were implemented for some other purposes such as for structural considerations or as part of a strategy to cool down an airport campus and surrounding urban areas.
This study examines only the effects of cooler taxiways and shoulders, not the total effects of modifying all eligible surfaces in an airport, which are typically much larger. The goal here is to roughly estimate the potential for fuel-use and CO2 emissions savings from taxiing over cooler surfaces as well as the potential reductions in takeoff-roll distance as a result of decreased density altitude.
Taxiing is a major source of pollutant emissions at airports [21] and several alternate approaches to streamline it have been proposed to cut down on fuel use during the taxi phase [17]. Some studies went further and quantified the fuel-saving benefits of holding aircraft at the gate until more favorable taxi conditions materialize [22]. Thus, it seems, any additional bonus benefits, such as those examined in this paper, would be welcomed by airport authorities and the airlines.
Here, the Dallas–Ft. Worth International Airport (DFW) is used as case study because of its size and climate, as well as availability of emissions information from prior studies [23]. However, the methodology presented here should be applicable to any airport. For this simple study, the Boeing 737 aircraft type is used (737 800 and 737 MAX 8) because fuel-consumption information is available [24] and because this type is one of the most popular worldwide. The focus is on estimating CO2 emissions since it is the main exhaust gas (in addition to water vapor) and a GHG—rates of emission from burning 1 kg of fuel in an engine like the 737’s amount to 3.16 kg CO2; 1.25 kg H2O; 0.012 kg NOx; 0.003 kg CO; 0.0005 kg HC; and 0.001 kg SOx per ICAO/IATA [18]. Any potential implications on other GHG such as N2O and CH4 may be evaluated in follow-up, future work.
The effects of temperature change on pressure and density altitudes as well as takeoff-roll distances have been evaluated [25]. However, these were from a climate-scale perspective rather than surface-specific at airports. In the same context, some studies carried out detailed analysis of meteorological impacts on aircraft CO2 emissions at several world airports for the takeoff and landing phases [26]. Intricate details of aircraft performance, operations, and engine efficiencies have been analyzed [19] and detailed technical specifications are also available [27]. However, since the focus here is on the effects of micrometeorological changes, simplified and averaged aircraft engine properties and operations are assumed.
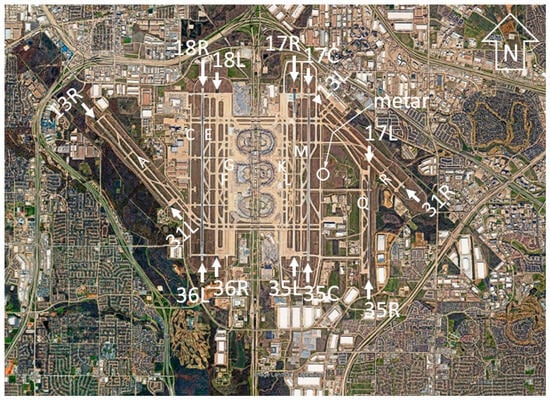
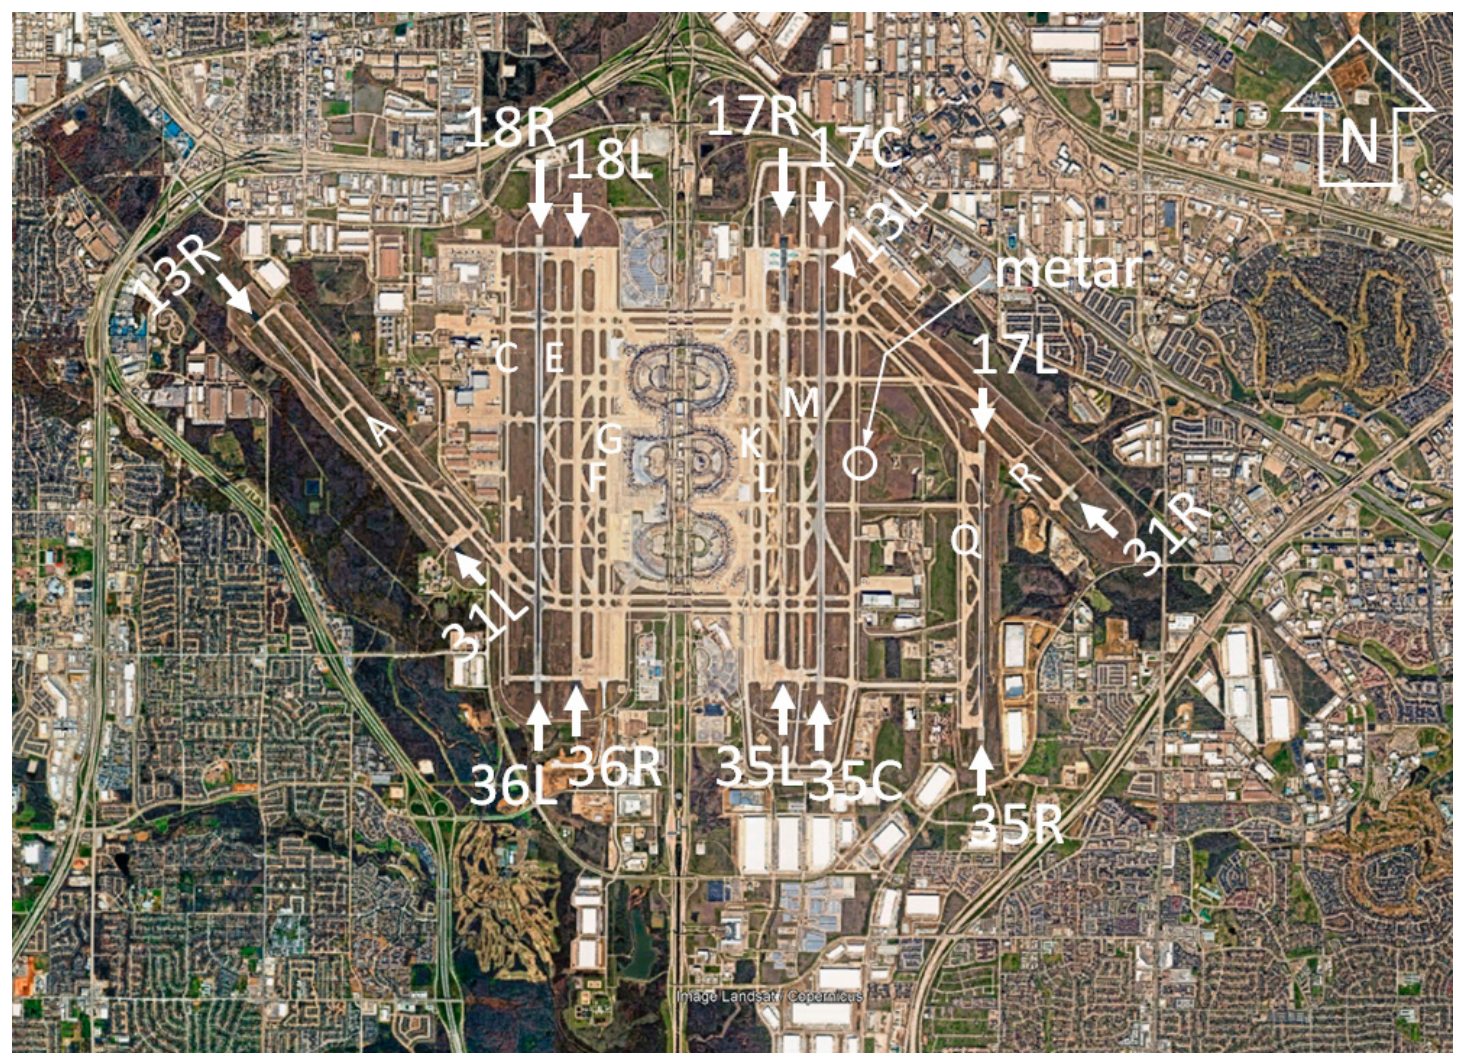
In Figure 1, DFW runways and taxiways are identified with white lettering. There is about O~1.71 km2 in taxiways and shoulders A, C, E, F, G, K, L, M, Q, and R, excluding terminal areas, ramps, aprons, and runways. The location of the METAR station at 32.89743° N, 97.02196° W (per National Weather Service) is also highlighted. Observational data from this station were used in carrying out model performance evaluation (at the exact station location) as discussed in this paper. Runways 13x, 18x, and 17x are used for the dominant south flow (southerly, occurring some 70% of the time), whereas runways 31x, 36x, and 35x are used for the north flow (northerly). Here, x means L or R.
Figure 1.
DFW runways (13x, 18x, 17x, 31x, 36x, 35x) and taxiways (A–R). Location of METAR weather station delineated with white circle (background image credit: Landsat/Copernicus).
DFW has also implemented an innovative system of end-around taxiways (EATs) that loop around the ends of runways, especially 17R/35L and 17C/35C (as seen in Figure 1) to help reduce taxi time by some 3–4 min, but can also increase taxi distance. Per Bureau of Transportation Statistics (https://www.bts.gov/), DFW taxi-out time is 18–20 min on average. However, during peak hours or congested travel times, taxi-out can reach 30–45 min. On the other hand, the arrival taxi-in time is about 13 min on average. The airport accommodates some 2000 daily departures and arrivals.
2. Materials and Methods
2.1. Model and Configuration
This analysis was conducted with the WRF-ARW modeling system [28,29] version 4.1.5 and later that has been modified over the years, for urbanization, by the scientific community. The author has further modified urban parameterizations and customized the related data ingestion and simulation techniques for specific urban applications. Many of these modifications and techniques were adapted from prior work with the urbanized MM5 model, uMM5 [14] that was a predecessor to the urban WRF model [30,31,32,33,34]. The modifications were applied so as to allow for high-resolution and hyper-local modeling, such as presented in this paper, and have been described incrementally [14,16,34,35,36,37]. Techniques developed by author also allow for hybrid parameterization triggers (e.g., calls of different urban parameterizations simultaneously within a single model run) and the direct specifications of site-specific thermophysical properties and parameters (rather than using default, standard tabulated inputs, or indirect climate-zone representations), via modifications to the urban parameterizations in WRF BEP/BEM (multi-layer) and UCM (single layer) models [38,39].
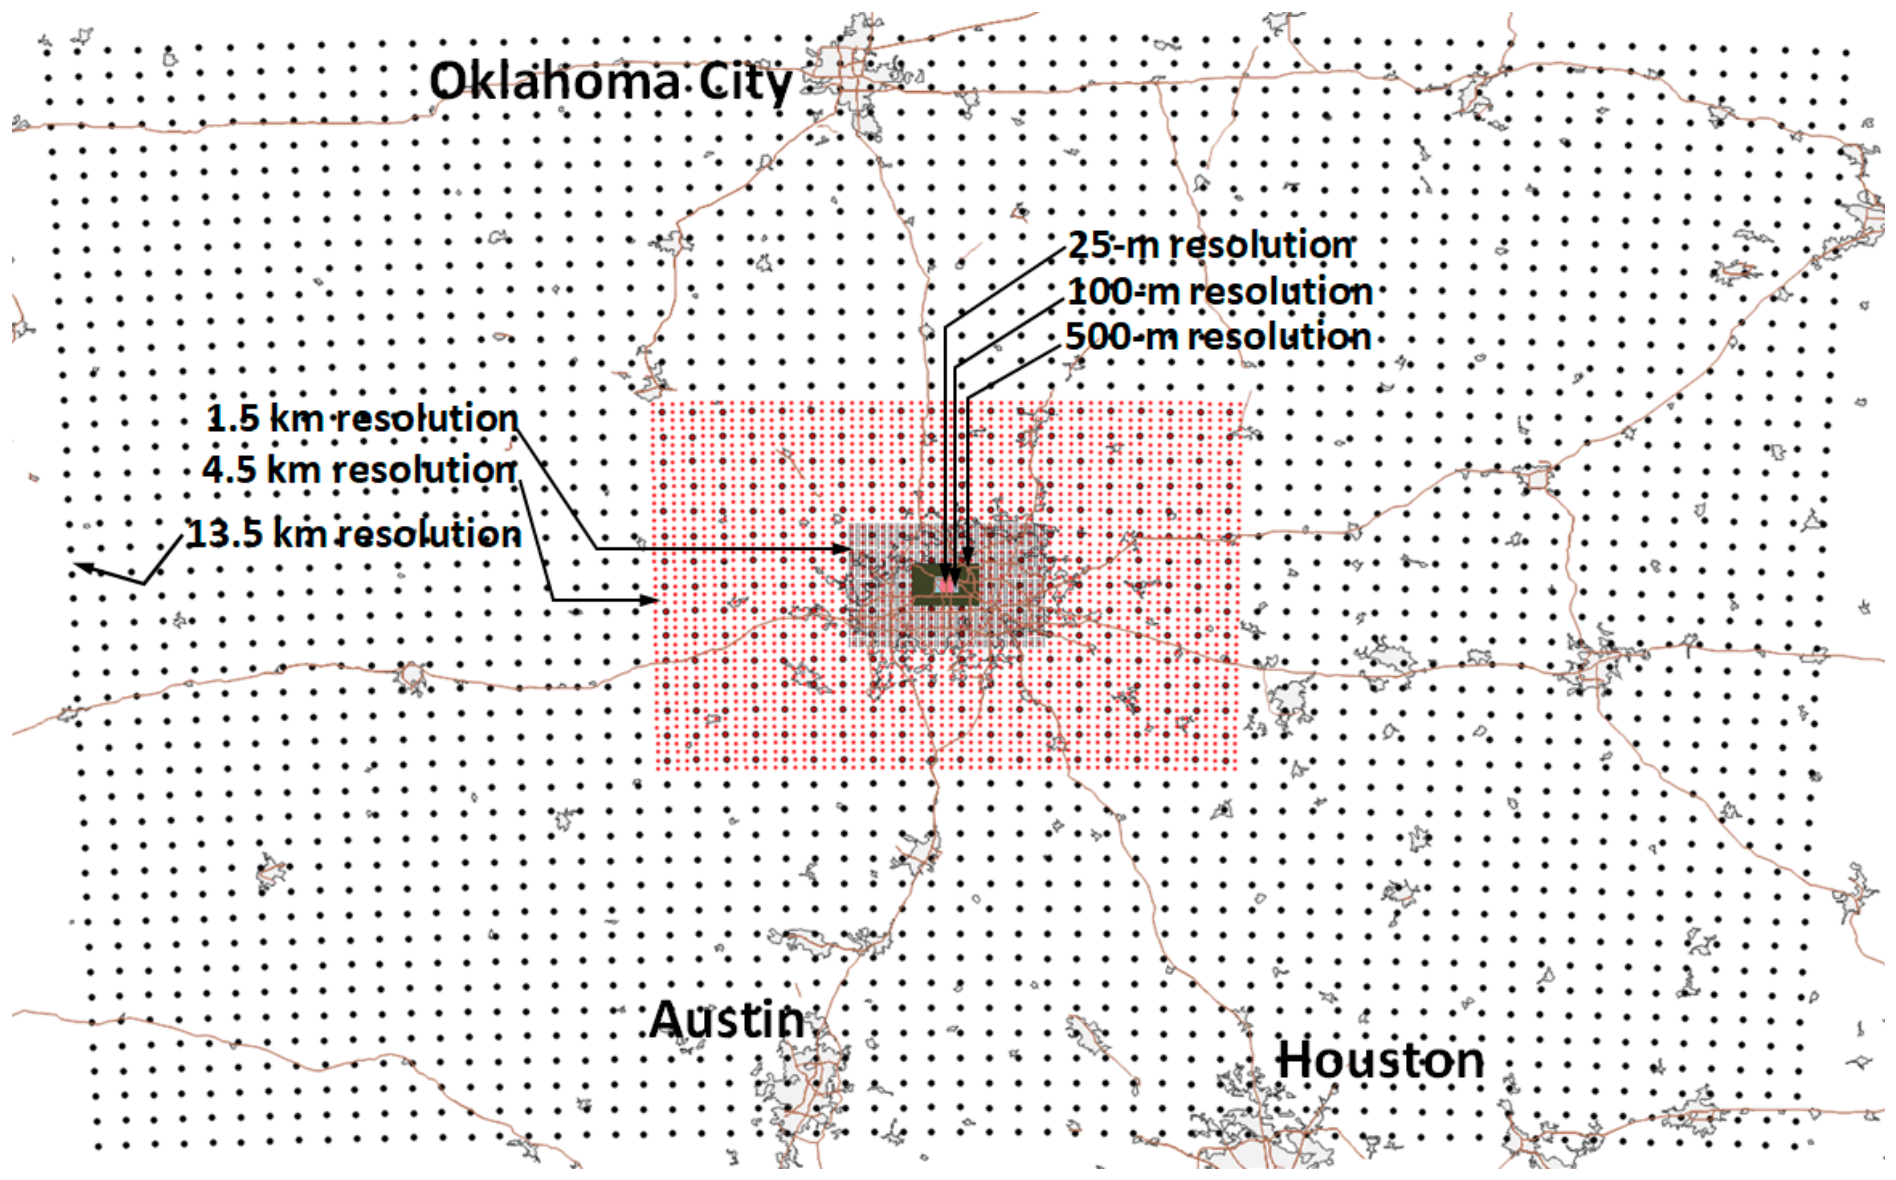
For initial and boundary conditions specified at the coarsest domain, the model was forced with the NCEP-NCAR Reanalysis, NNRP [40] improved for continuation from prior work and 4-dimensional data assimilation was applied. Model grids were configured at horizontal resolutions of 13.5 km, 4.5 km, 1.5 km, 500 m, 100 m, and 25 m (Figure 2). The 100-m and 25-m grids were designated for airport-scale modeling. The vertical resolution is increased as the horizontal grid resolution increases, thus ranging from 30 to 60 vertical levels.
Figure 2.
Model grid configuration and horizontal resolutions: 25 m, 100 m, 500 m, 1.5 km, 4.5 km, 13.5 km.
For short and longwave radiation, the Dudhia scheme and Rapid Radiative Transfer Model (RRTM) were used, respectively [41,42]. In this study, reflectance in the 14 discrete bands of the WRF RRTM was modified so as to skew the albedo increase towards the NIR range (about 4.5x relative to baseline) compared to VIS (about 2.0x), 0.5 ≤ x ≤ 1.0, per glare concerns [5]. For the surface-layer, MOST is used [43] with the boundary-layer TKE parameterization scheme of Bretherton and Park [44]. Other common model setups and configurations, including cumulus parameterizations and microphysics, are described in the above-listed references.
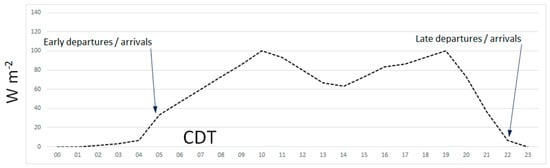
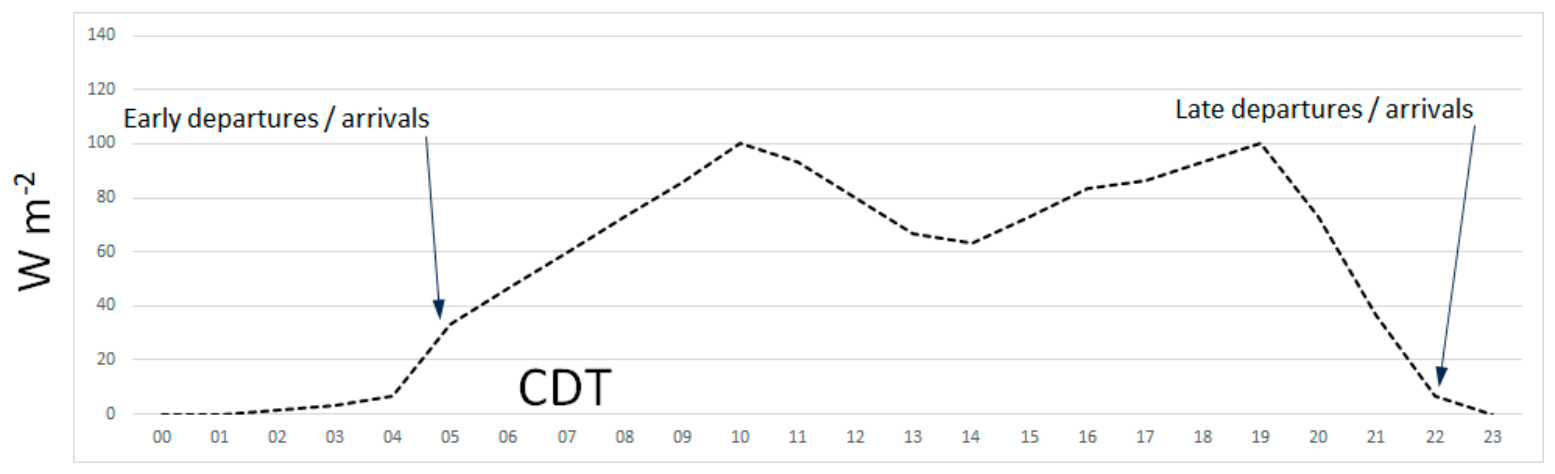
In the innermost domains (100 and 25 m), modified single- and multi-layer urban model parameterizations are used and triggered according to location-specific (grid-point-specific) surface physical and morphological properties in DFW. This is also where anthropogenic heating from aircraft engines is introduced (Figure 3) as an additional source in computing temperature tendencies. Anthropogenic heat-flux calculations are triggered at the taxiway locations shown in Figure 4 (bottom) with two peak values of 100 W m−2 at 1000 and 1900 CDT tapering off to near-zero at 2200 through 0500 CDT (Figure 3) a period with practically no departures or arrivals (per DFW; www.dfwairport.com). The peak value of 100 W m−2 was arrived at by calculating near-idle 737 fuel-flow rates at taxi [27] yielding 3 MW per engine, then scaling 2 engines per aircraft at an average of 5 aircraft concurrently lined up (during peak hours) on each active taxiway, and averaging over the total area of parallel taxiways (Figure 1).
Figure 3.
Approximation of aircraft anthropogenic heat flux at taxiways F, G, K, L.
While engine anthropogenic heat is accounted for in computing the buoyant component of TKE from aircraft, which then enhances vertical mixing and transport of engine wake upward and away from engine and surface levels, the shear production of TKE is not explicitly accounted for in the analysis presented here, as it will require tracking individual aircraft movements, but assumed to be unchanged from base to modified-albedo scenarios. This is an area for future research in potential follow-up work.
This paper presents results for July 2024 as an example of warmer weather patterns in the DFW area as well as nationwide (2024 was a hot year). And although the recent WRF model developments and versions are extremely stable starting right at model initialization, the simulations in this study were nevertheless run with a spin-up period of 72 h prior to the analysis period.
2.2. Characterization of Land-Cover and Surface Properties
Multi-resolution remote-sensing and land-cover data were processed to characterize thermo-physical properties in the study area. This was subsequently used in developing surface input parameters for the various domains of the atmospheric model. Based on the properties of each satellite platform and land-cover dataset, parameters that were derived include: (1) broad-band albedo at 500-, 30-, 20-, and 10-m resolutions depending on platform-specific reflectance bands, (2) NDVI and NDMI at 30-m resolution, (3) land-surface temperature at 70 m resolution, (4) vegetation cover at 30-m resolution, (5) impervious cover at 30-m resolution, (6) roadways at 30-m resolution, and (7) land-use type at 30-m resolution.
Broad-band albedo was computed from MODIS [45], Landsat-9 [46], and Sentinel-2 [47] reflectance bands. Baseline NDVI (normalized difference vegetation index) and NDMI (normalized difference moisture index) were calculated from Landsat-9 bands. Land-surface temperature was acquired from ECOSTRESS [48] and items 4–7 from NLCD-2024 datasets [49].
Additionally, as the spatial resolution and granularity increase, i.e., at the scale of the airport campus and the target areas of interest in the 100-m and 25-m grids, domains are further characterized explicitly in terms of geometrical and physical properties (further overriding the above characterizations), such as with specific building heights and floor areas, street widths and orientations, surface types, roughness elements, vegetation cover, etc., using Google Earth digital model [14,15] and Global Building Atlas [50].
2.3. Characterization of Current Albedo and Technical Potential
Deriving albedo from remote-sensing data can generally follow the methodology of Liang [51]. In this study, baseline broad-band albedo was computed from Sentinel-2 reflectance data at 10-m resolution (Figure 4) using coefficients from Bonafoni et al. [52] specifically tailored for this platform.
Based on these characterizations, there appears to be a significant technical potential for increasing albedo on various elevated and ground surfaces at DFW, e.g., roofs, ramps, aprons, parking areas, roadways, and terminals, except for a few buildings with highly reflective roofs such as Terminal D (Figure 4, top). In this study, albedo is increased only on taxiways and shoulders (Figure 4, bottom) to a target value of 0.35. These surfaces are currently between 0.16 and 0.28 in albedo thus presenting a technical potential range of +0.07 to +0.19. Albedo is assumed unchanged at roofs or other ground surfaces listed above.
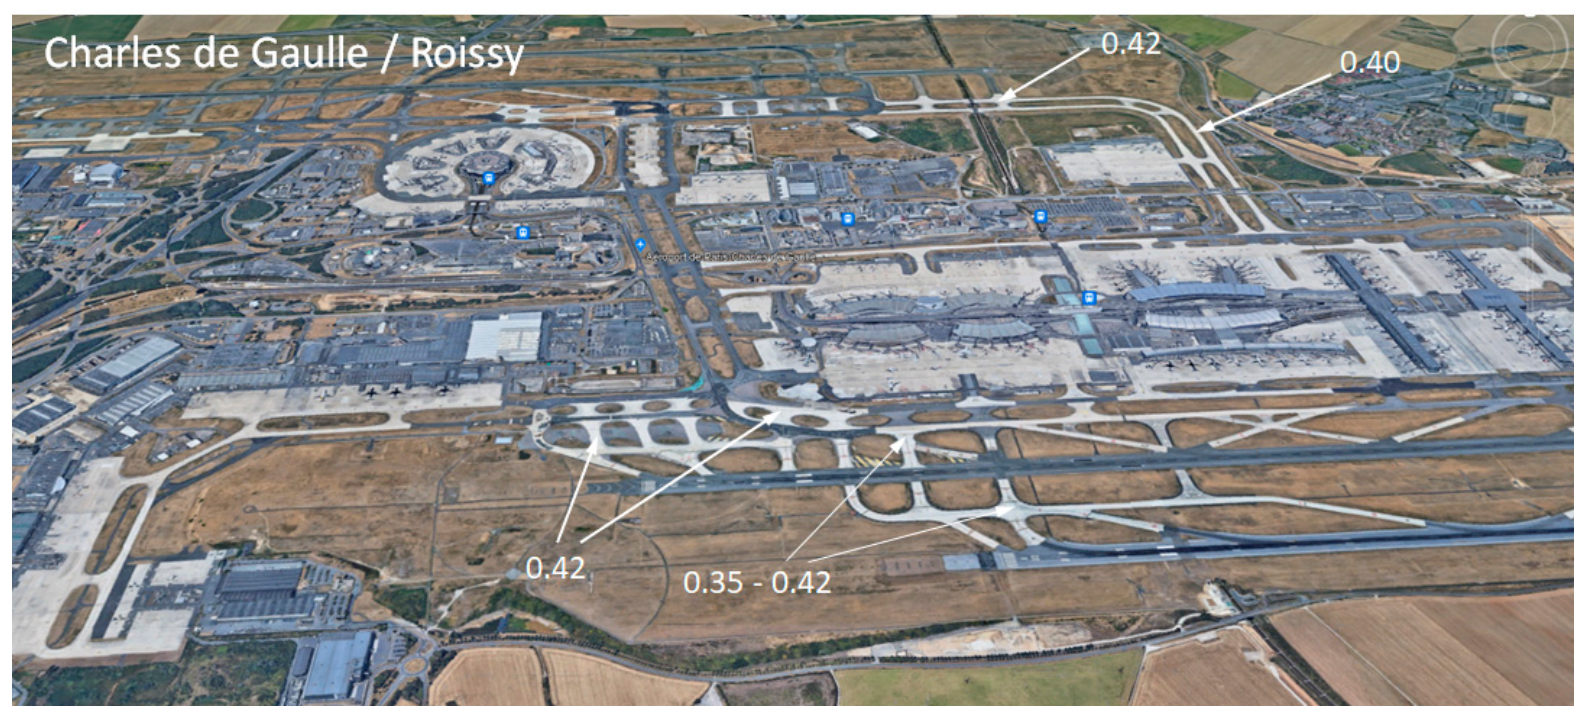
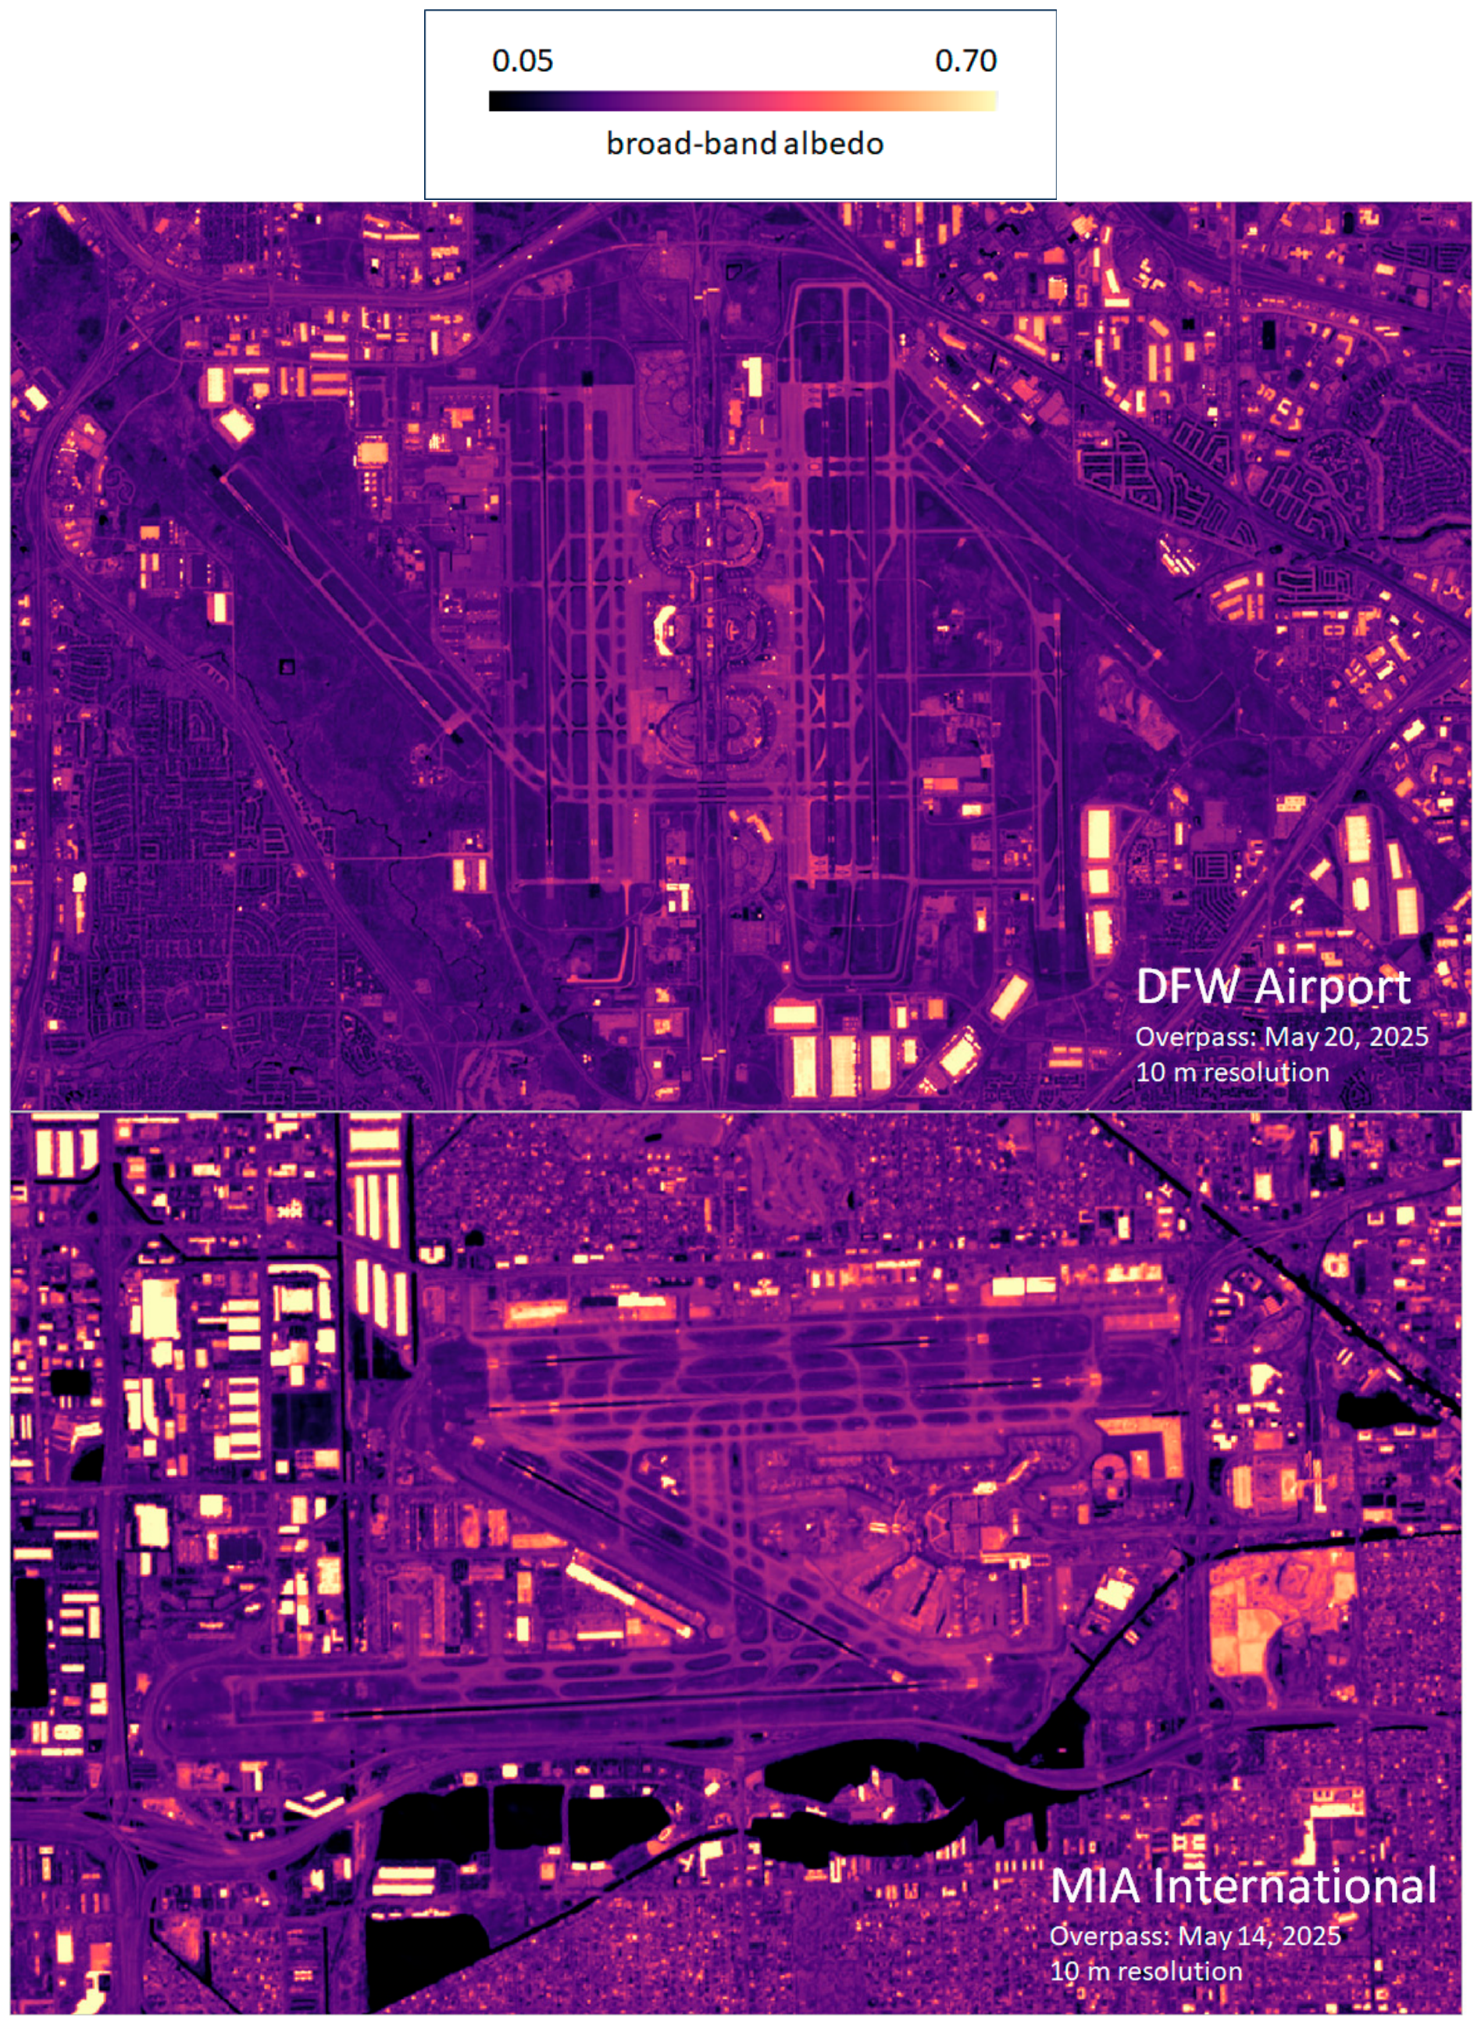
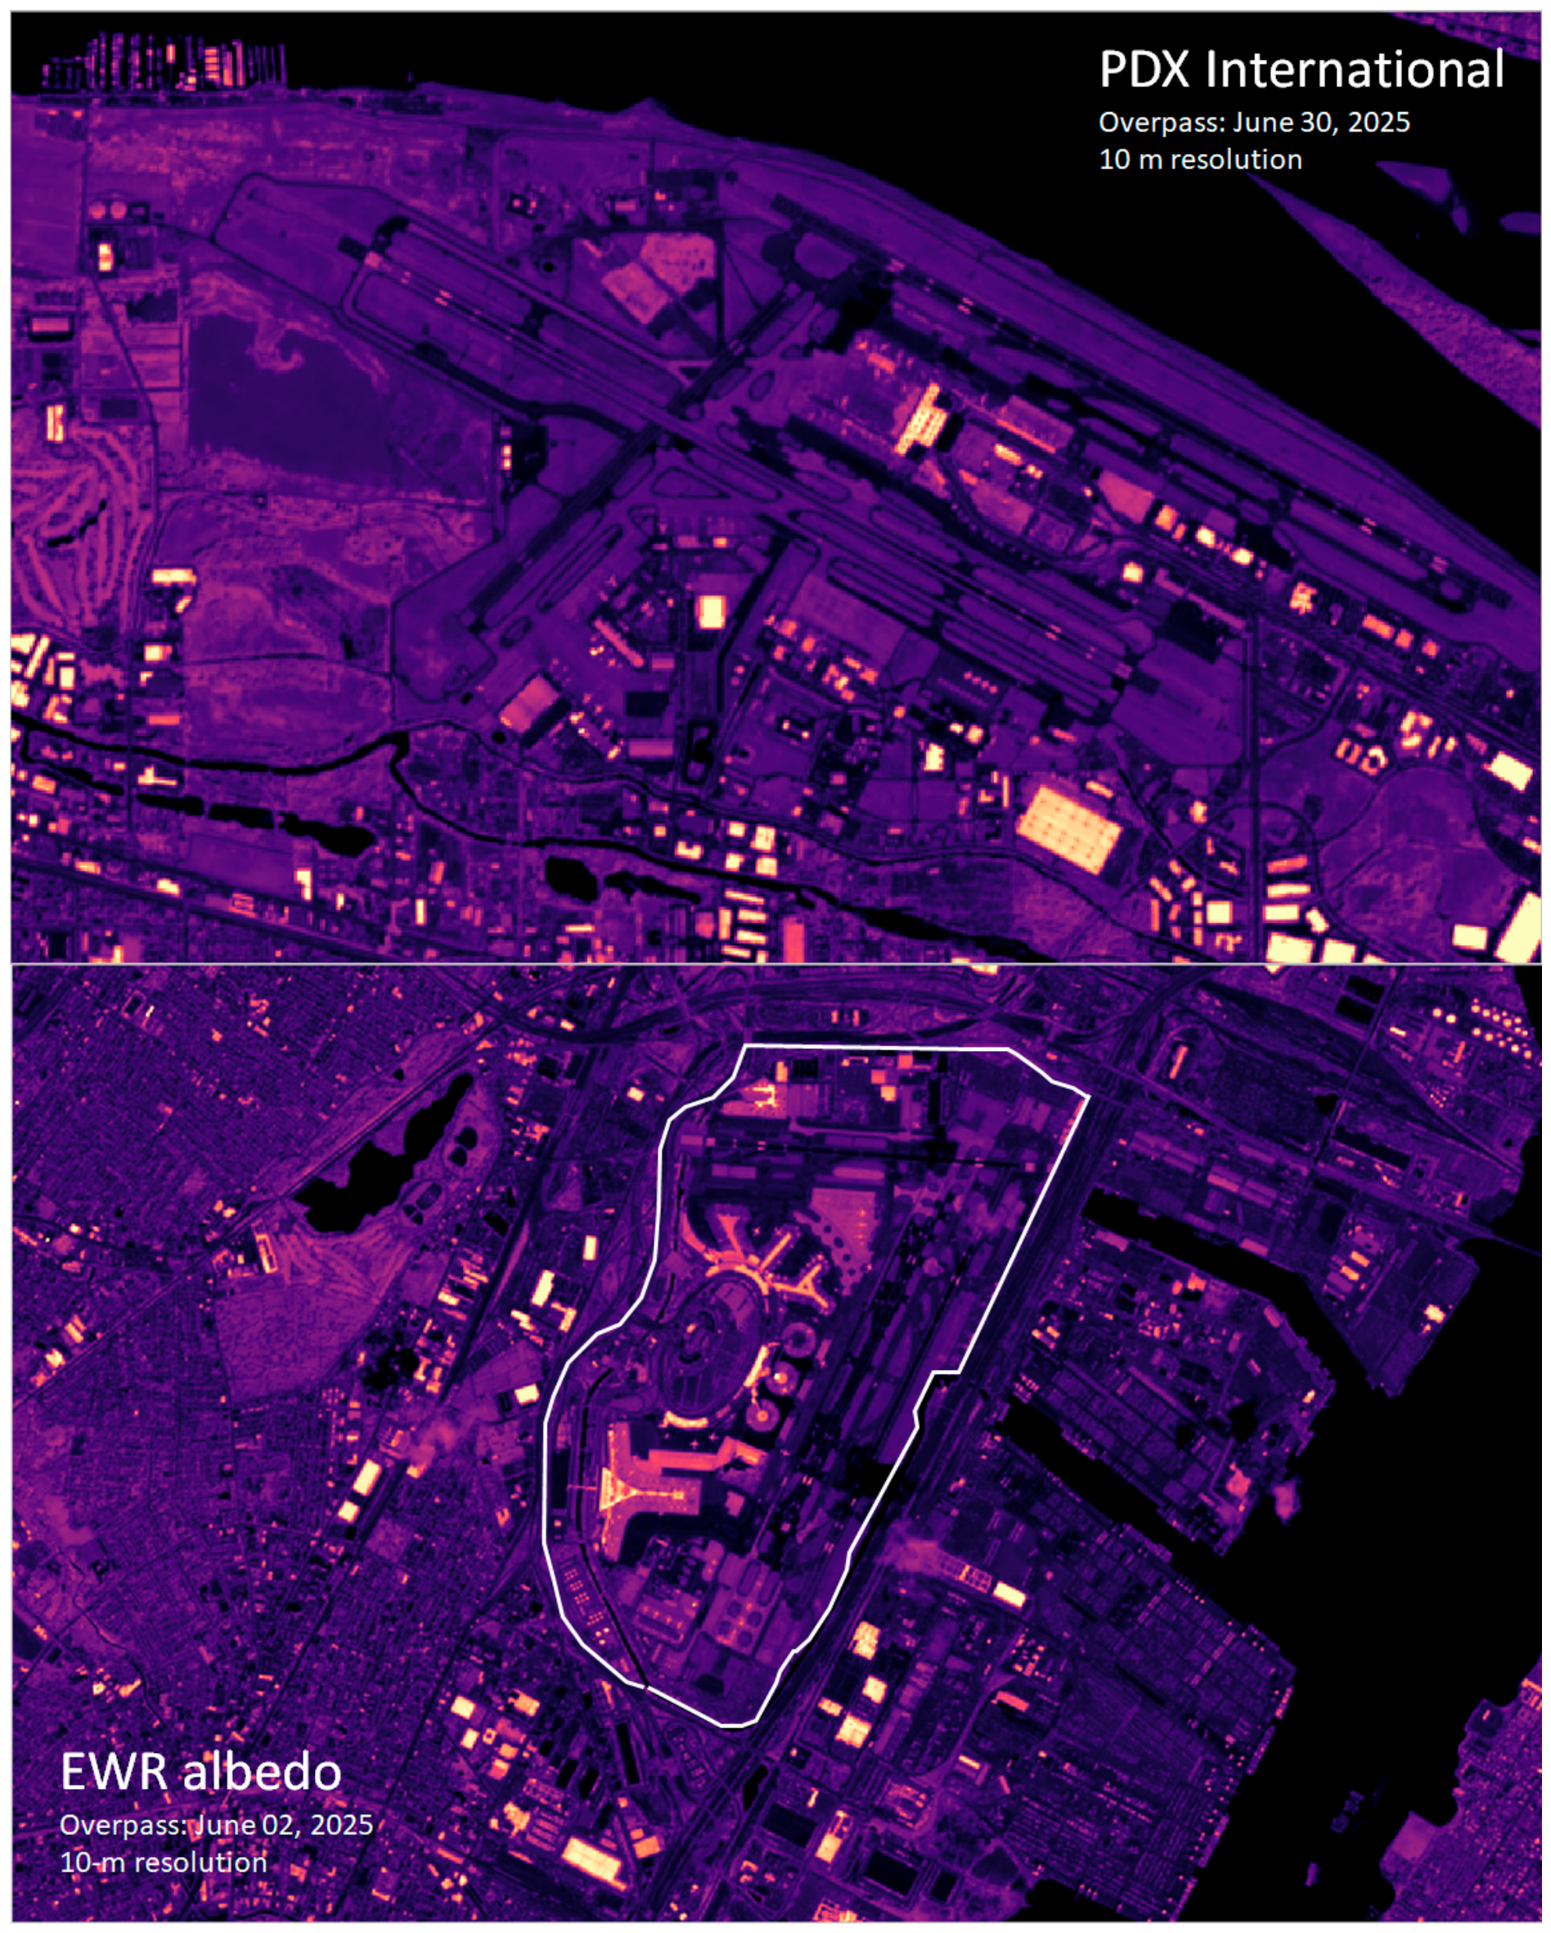
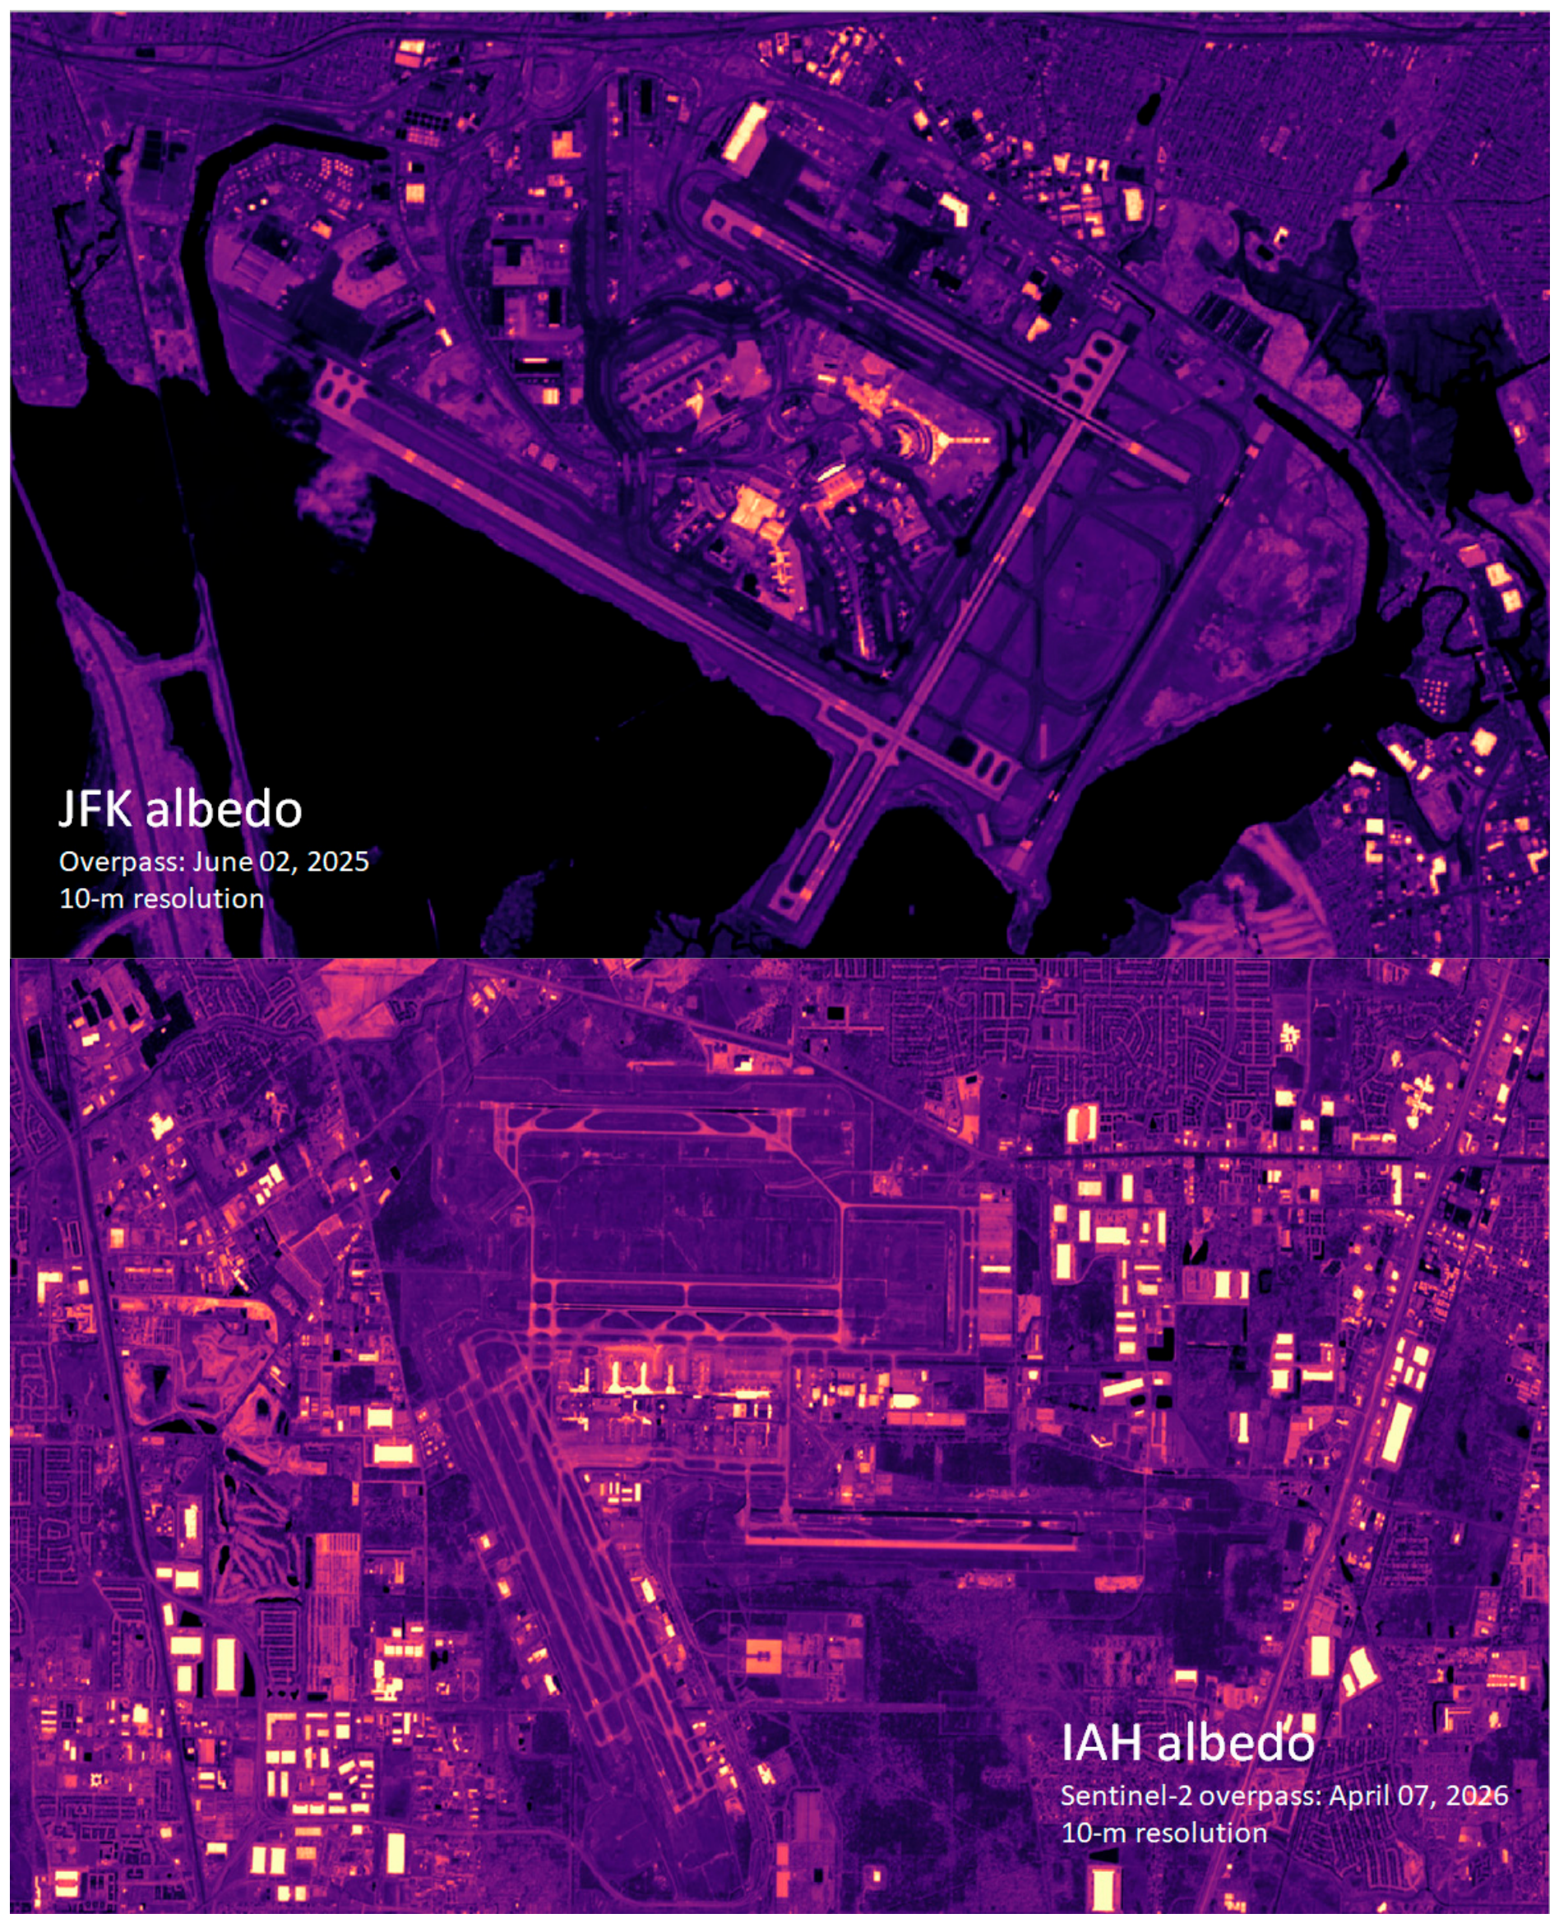
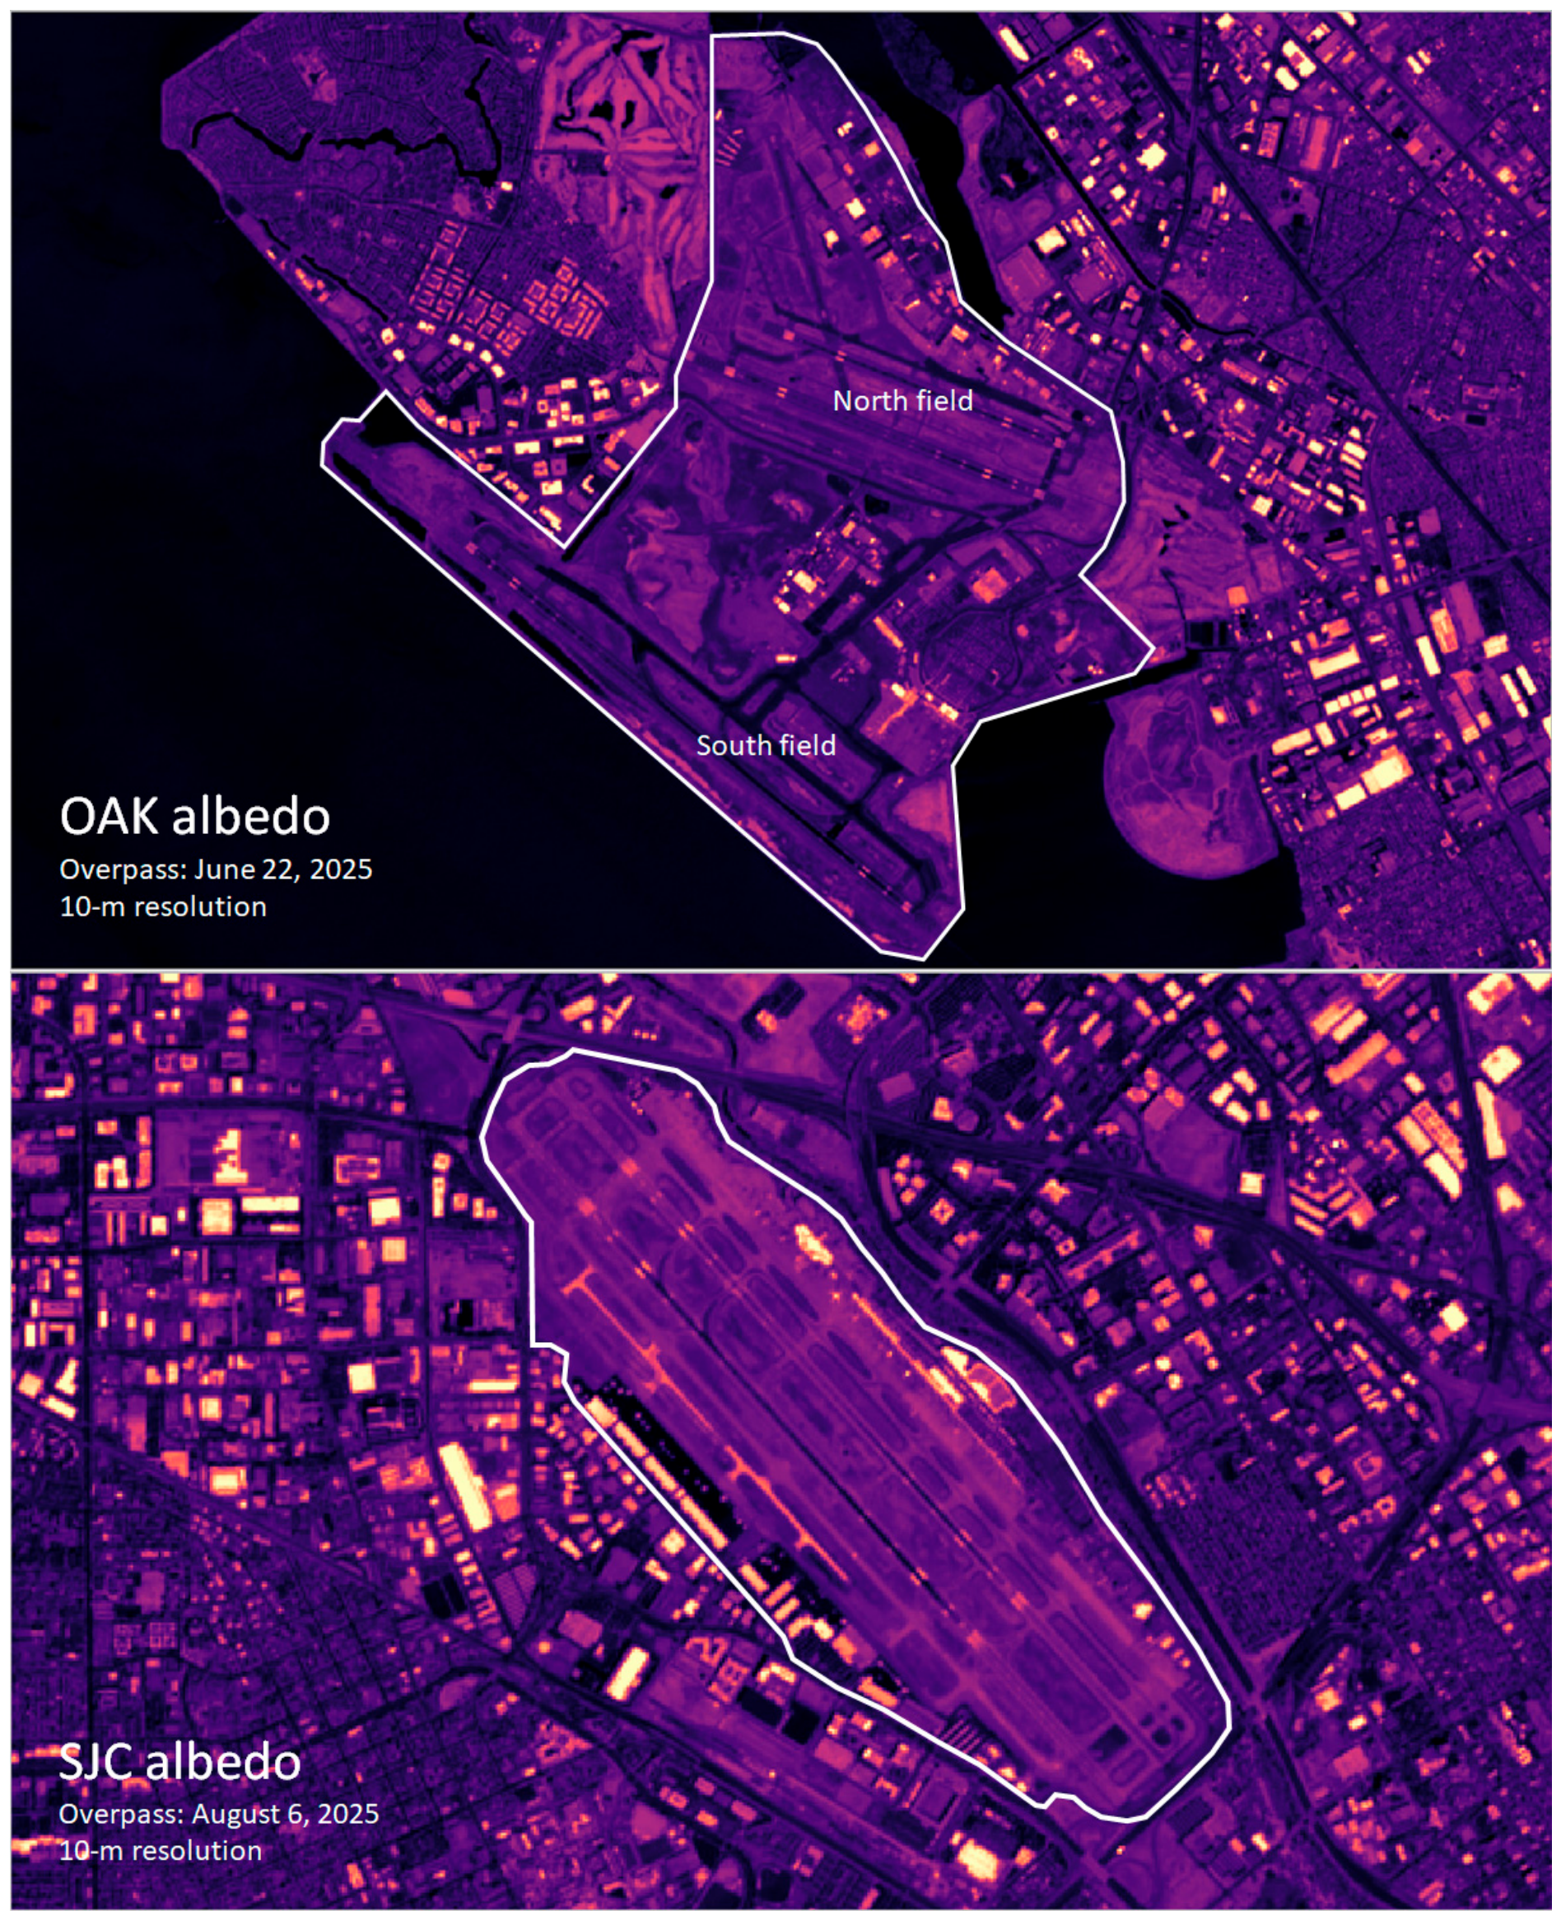
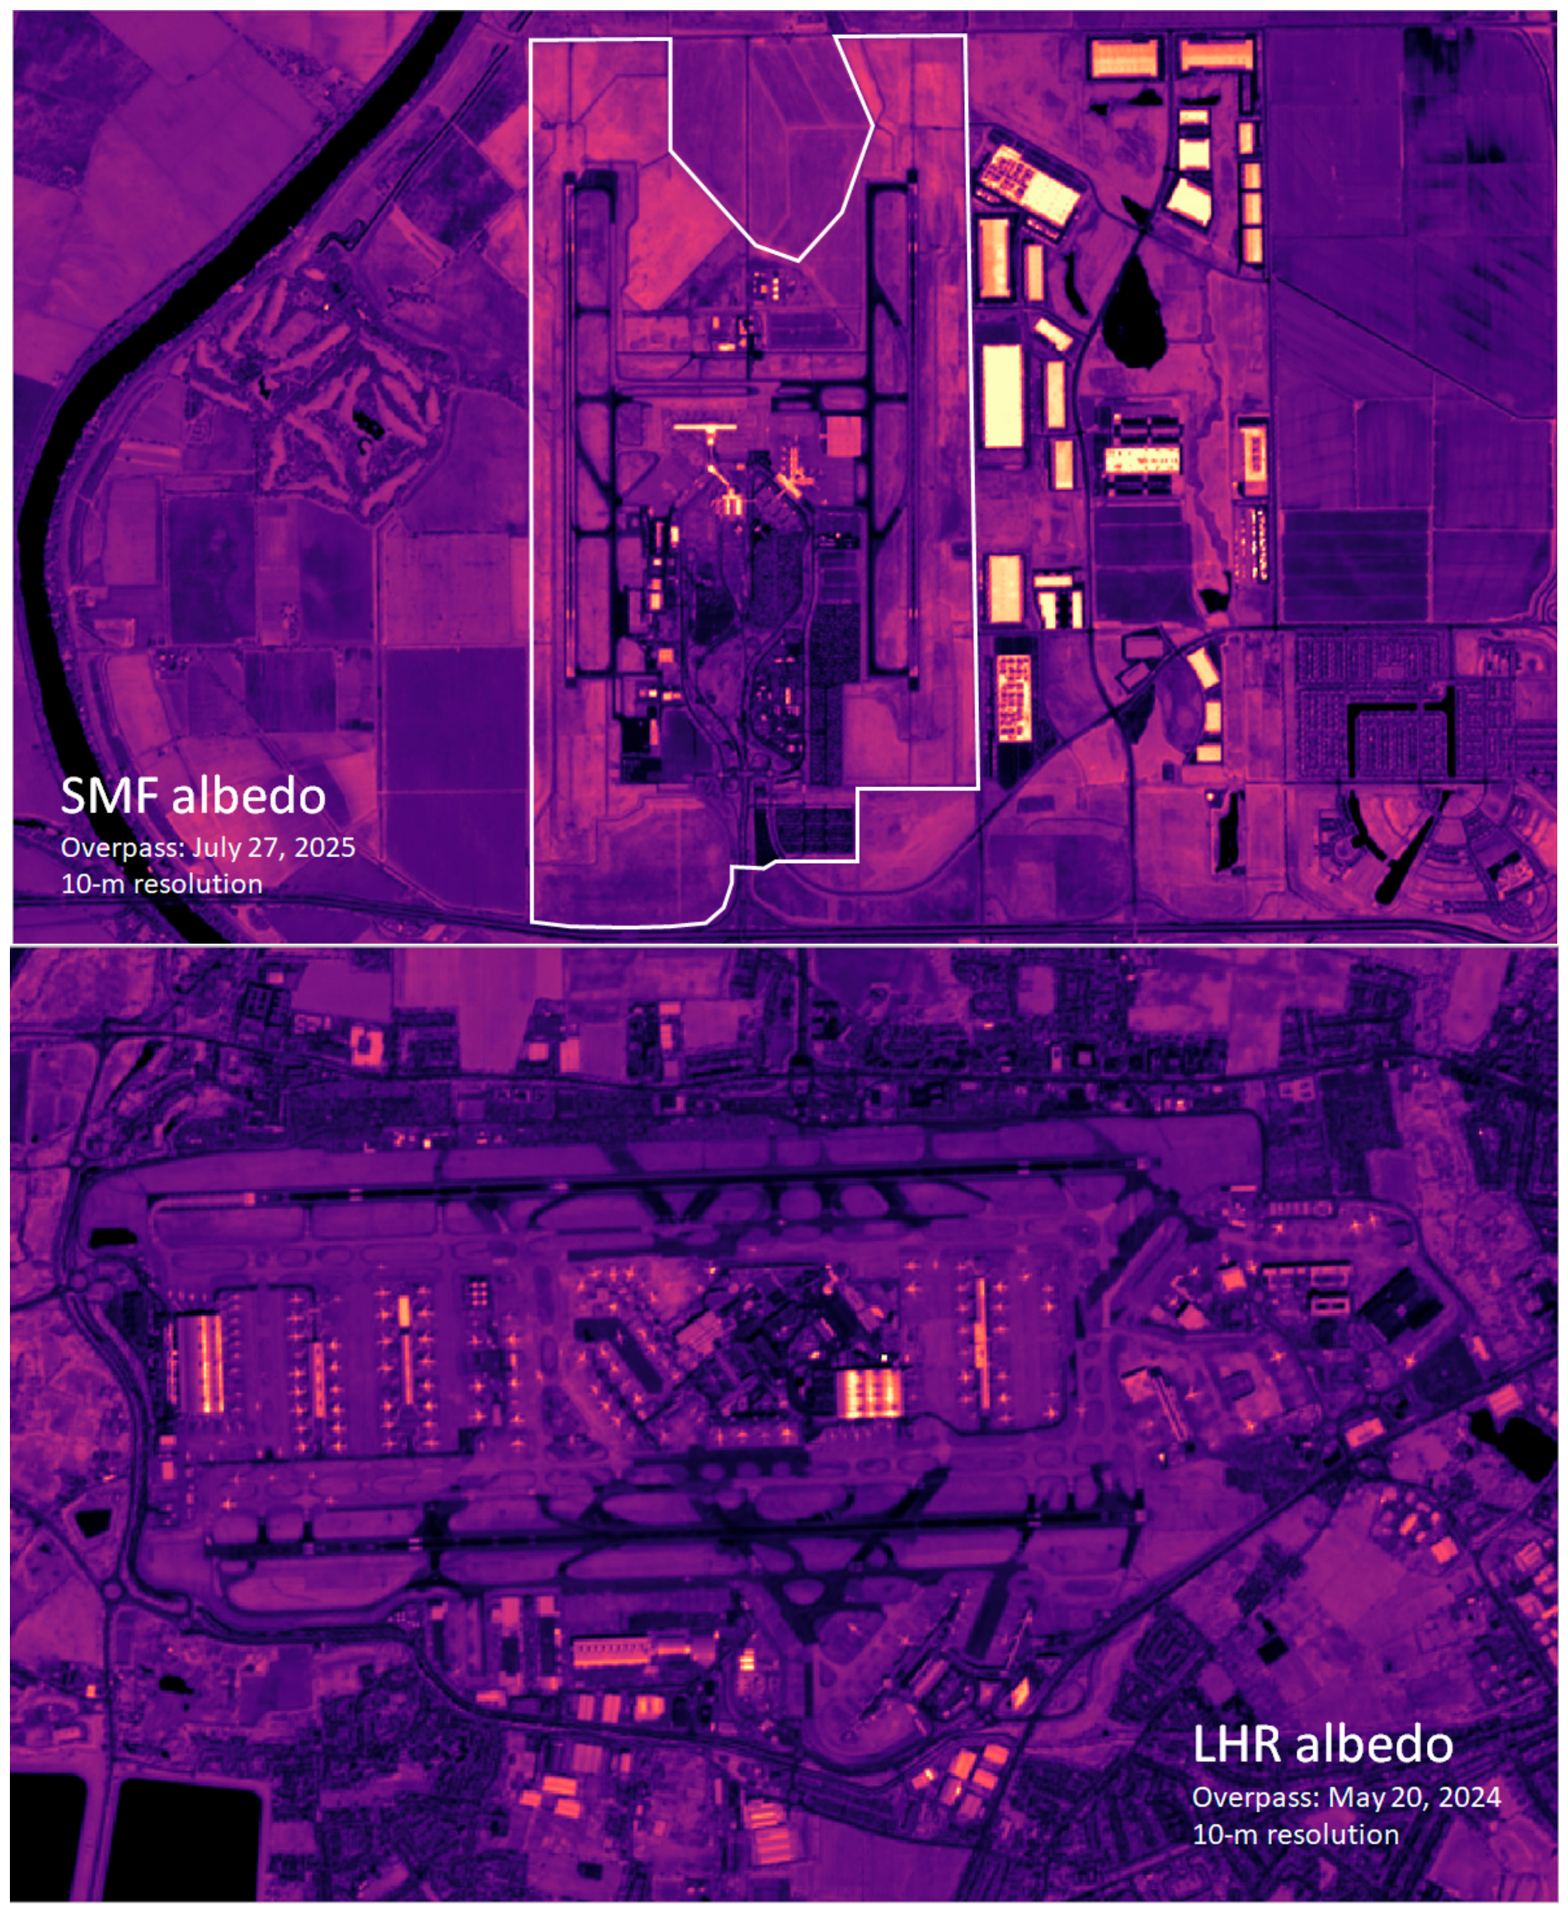
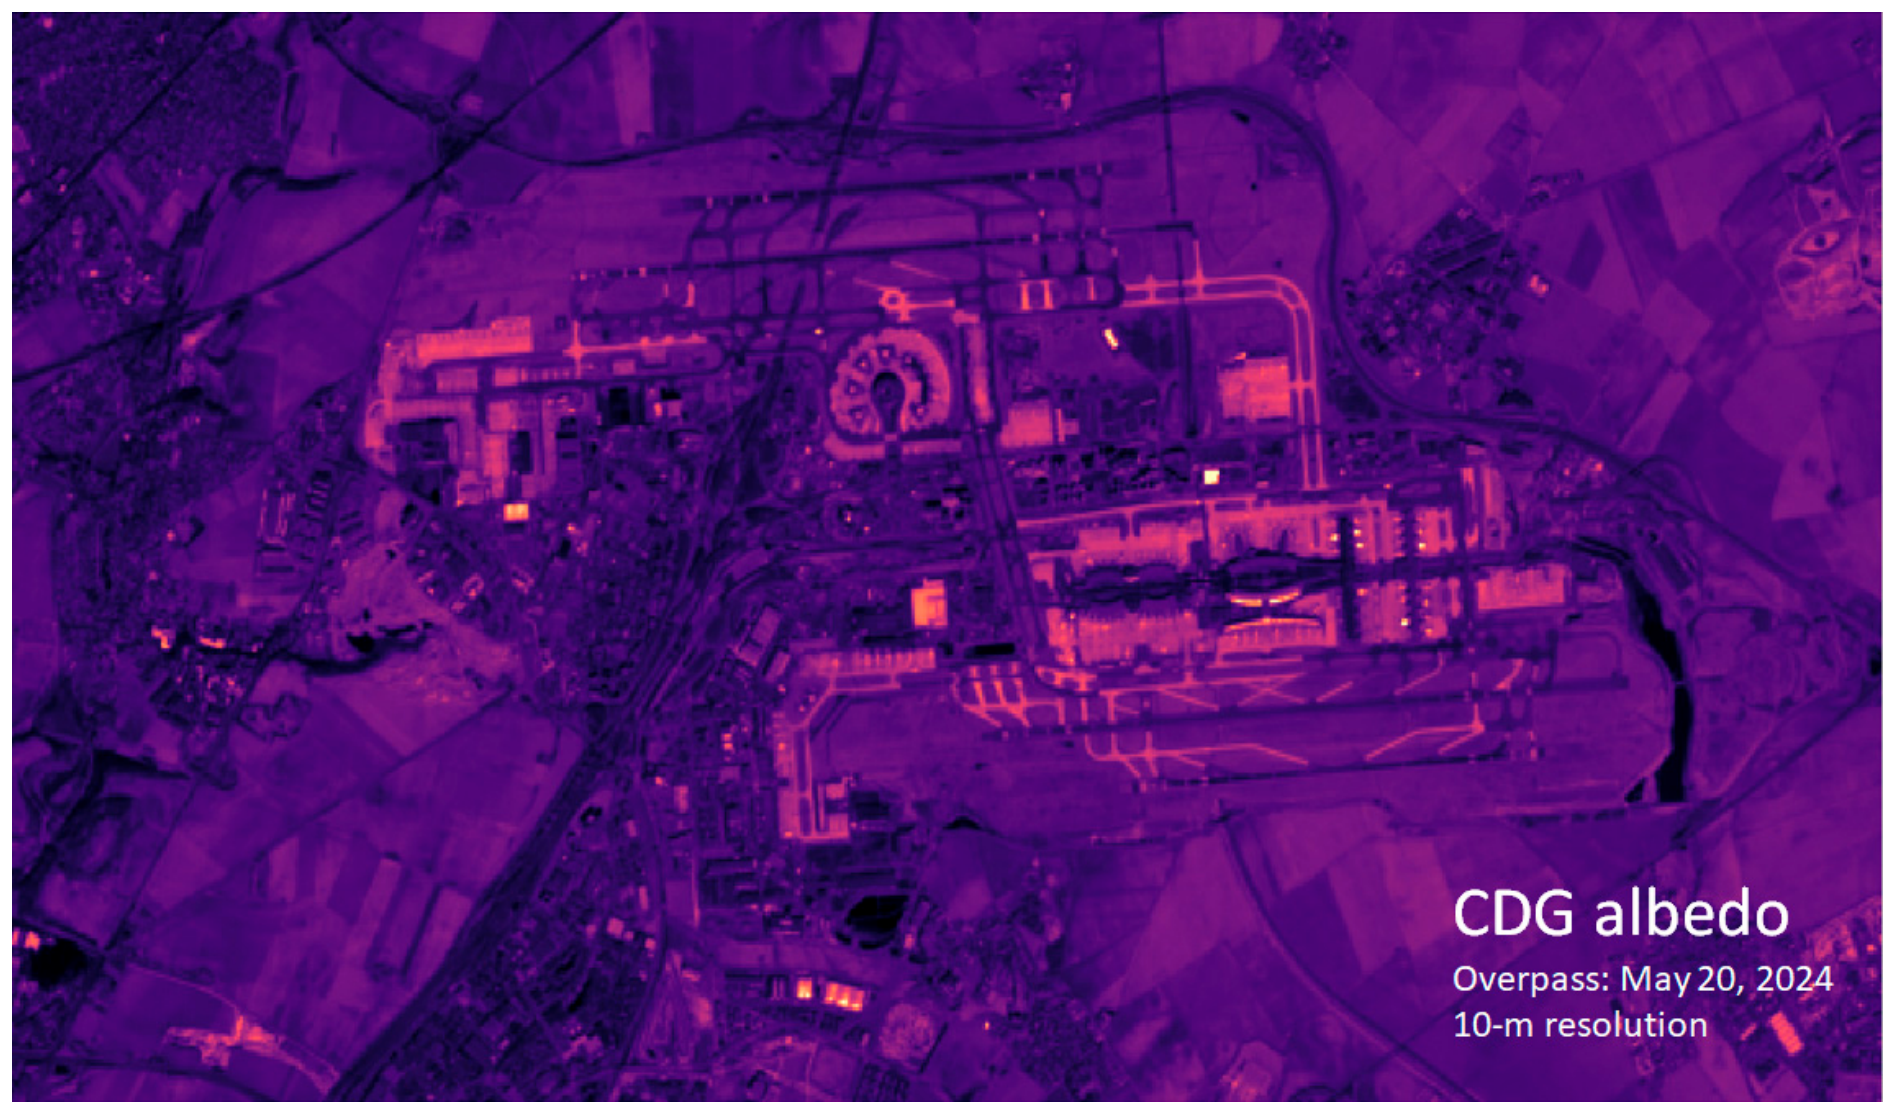
From the analysis of albedo at several airports (see Appendix A), it appears that taxiways albedo can be as high as 0.40–0.42 under current operating conditions, e.g., Charles de Gaulle (Figure 5). Table 1 lists average taxiway and shoulder albedo at those airports and indicates significant technical potential for implementing cooler surfaces. Here, the relatively modest target albedo value of 0.35 is assumed so as to take into account the degradation effects of weathering, soiling, and tire marks. Runways albedo (currently 0.09–0.15 at DFW) is assumed unchanged out of concern for glare, even though this issue has been proven to be moot when using materials that reflect mostly in the NIR range rather than in visible [5]. This was also addressed in Section 2.1.
Table 1.
Average taxiway and shoulder broad-band albedo at select airports. (see Appendix A).
Because the impacted area (taxiways and shoulders) at DFW is large, it can be expected to produce significant cooling near the surface, i.e., at aircraft engine intake height, between 1.0 m (for narrow-body aircraft such as Boeing 737, Airbus A321, and similar) and up to 2.0 m (for wide bodies, such as Boeing 777 and 747, Airbus A380, and similar).
Figure 4.
Broad-band, 10-m resolution albedo computed from Sentinel-2 reflectance (top) and assumed locations of modified taxiways/shoulders highlighted in green (bottom).
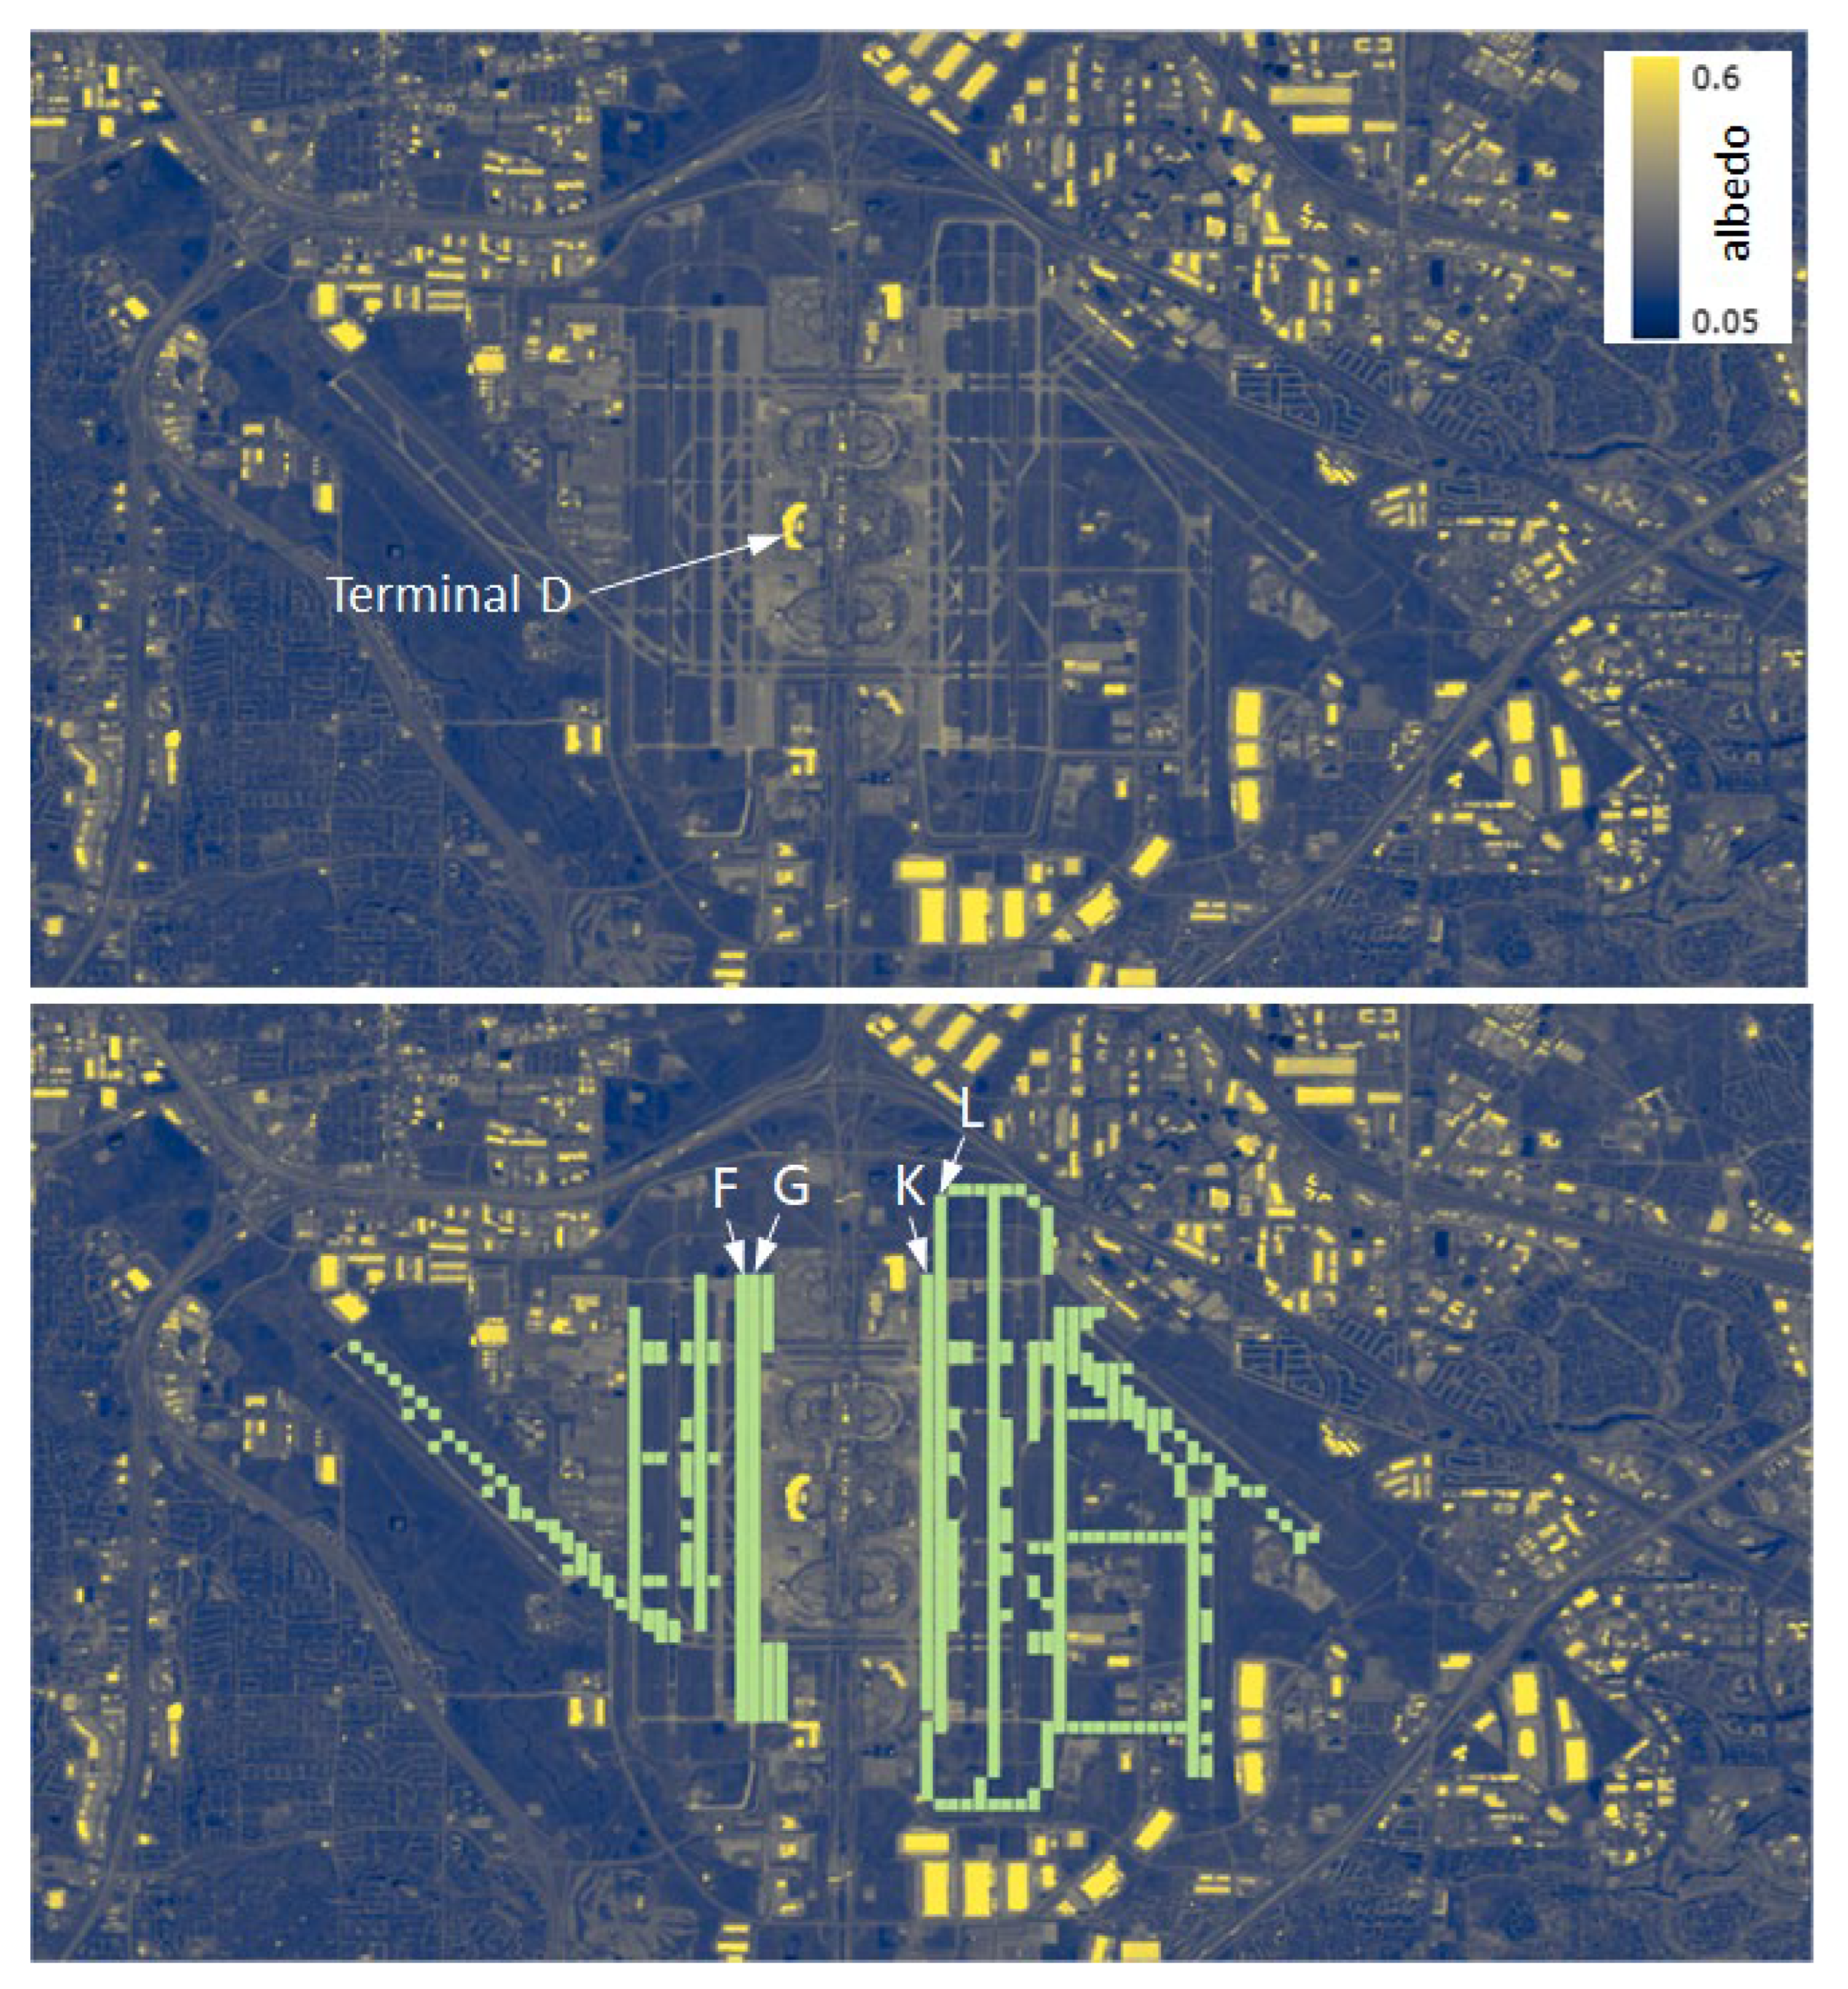
Figure 5.
Broad-band (10 m resolution) albedo computed from Sentinel-2 for Charles de Gaulle airport (CDG).
3. Results
3.1. Model Performance Evaluation (MPE)
MPE was carried out using on-site observational data (NOAA MADIS [53]) from the DFW METAR weather station and model-predicted variables at that location (Figure 1). Here, MPE is presented for the month of July 2024, which is used to demonstrate the potential summertime impacts of cooler taxiways and shoulders. The predicted variables are compared to recommended meteorological-model performance benchmarks [14,54,55]. Of note, these are recommended benchmarks, not required or cast-in-stone thresholds.
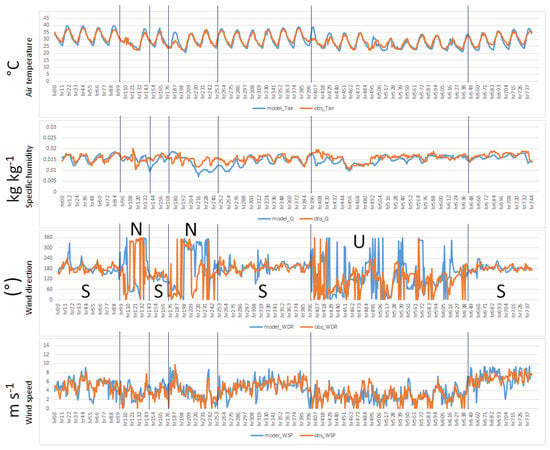
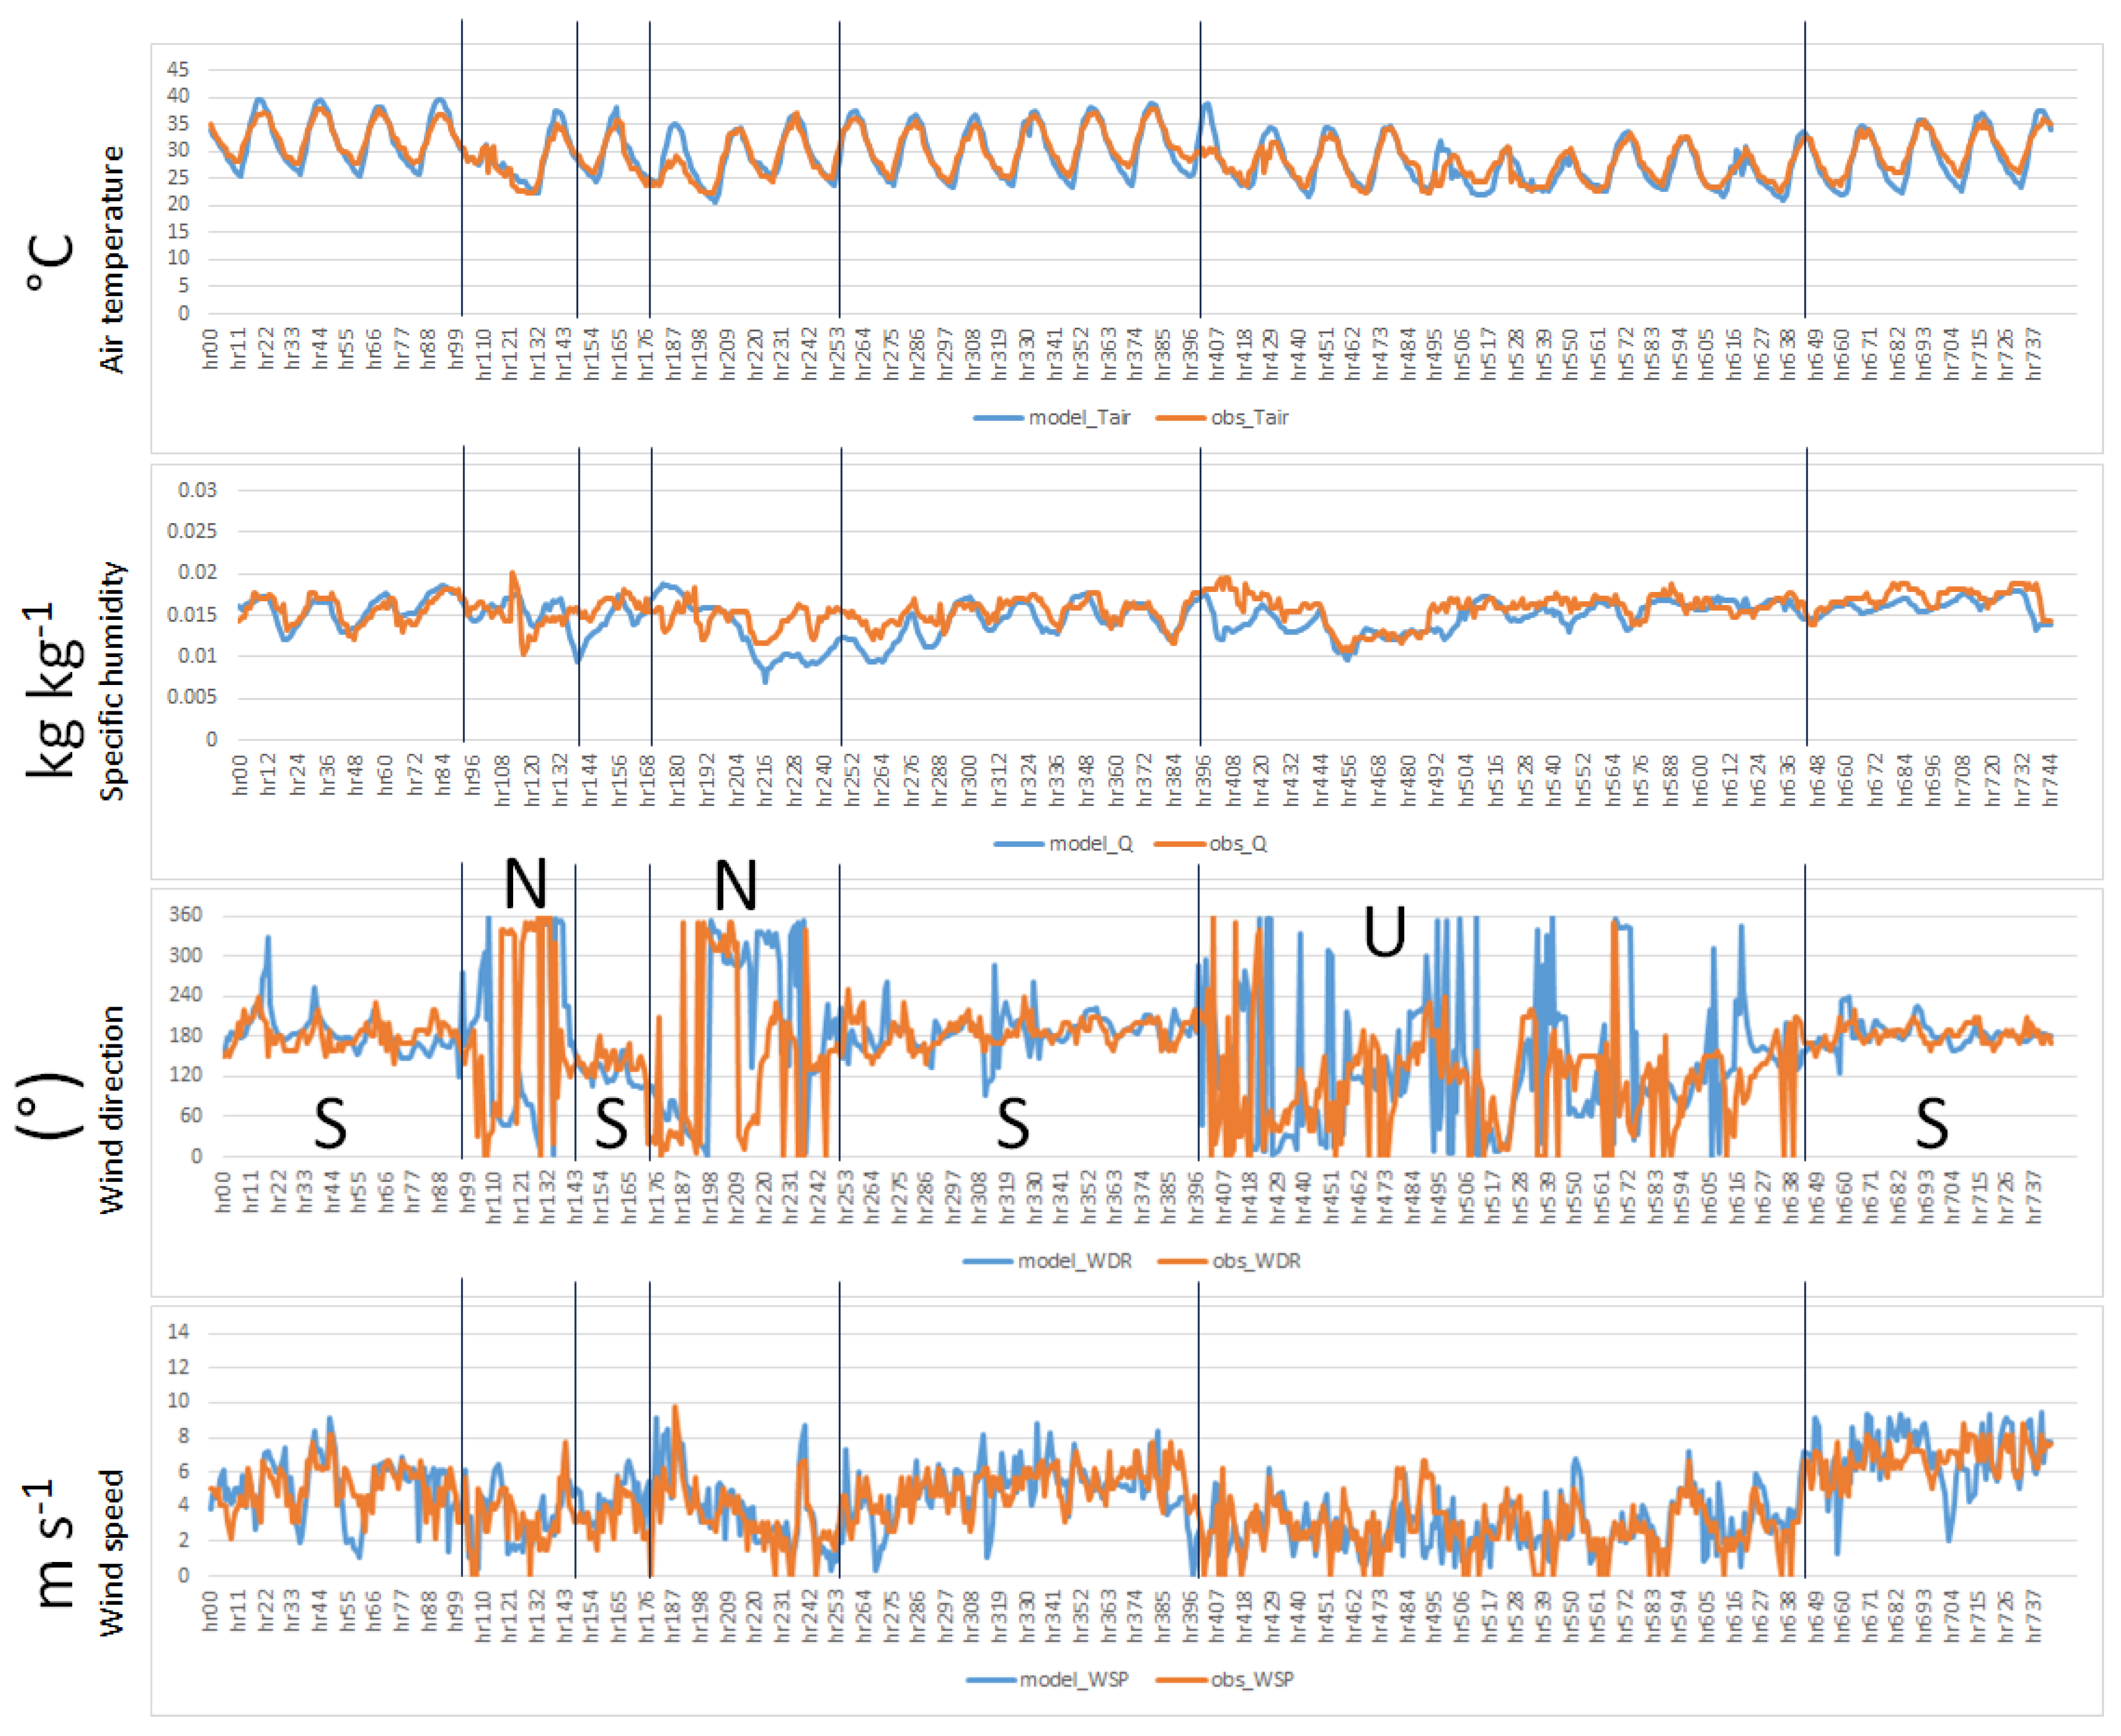
Figure 6 is a time series of observed and modeled air temperature, specific humidity, wind direction, and wind speed at the weather-station location. The vertical lines delineate periods of south flow (S), north flow (N), or unsettled, variable flow (U). To be noted here is that the south flow (southerly winds) is predominant at DFW.
Figure 6.
Modeled (blue) and observed (red) air temperature, specific humidity, wind direction, and wind speed at the METAR weather station location at DFW.
Model’s temperature and specific-humidity performance is very good except for some temperature overprediction around hours 187 and 407 and specific-humidity underprediction at hours 216–264 and around hour 408. For wind direction, the model does reproduce the shifts and tendencies correctly. The reason for noisy signal in the N and U periods is because near 0° and near 360° are essentially from the same direction (northerly) but when adjacent 0° and 360° values are plotted, they result in the large fluctuations seen in Figure 6. Wind speed is well-reproduced both in magnitude and tendency except for a few minor deviations at a few hours.
Numerically, Table 2 provides performance statistics (metrics defined in Equations (1)–(4)) where it can be seen that the model attains all recommended benchmarks. It is to be noted that areas near the terminals and central airport with buildings and extensive pavements are warmer than at the METAR station’s site. Other parts of the domain, including outside of the airport campus, are hotter depending on wind direction, as discussed next in Section 3.2.
Table 2.
Model performance statistics at DFW METAR location. (MB: mean bias; ME: mean gross error; IOA: index of agreement; RMSE: root mean square error).
In Equations (1)–(4), Vp and Vo are predicted and observed parameter values, respectively, N is the number of station-hours of available data, and H is time index. The model’s ability to accurately reproduce the observations at the METAR weather station’s location instills reasonable confidence in its ability to forecast hyper-local micrometeorological conditions.
3.2. Micrometeorological Effects
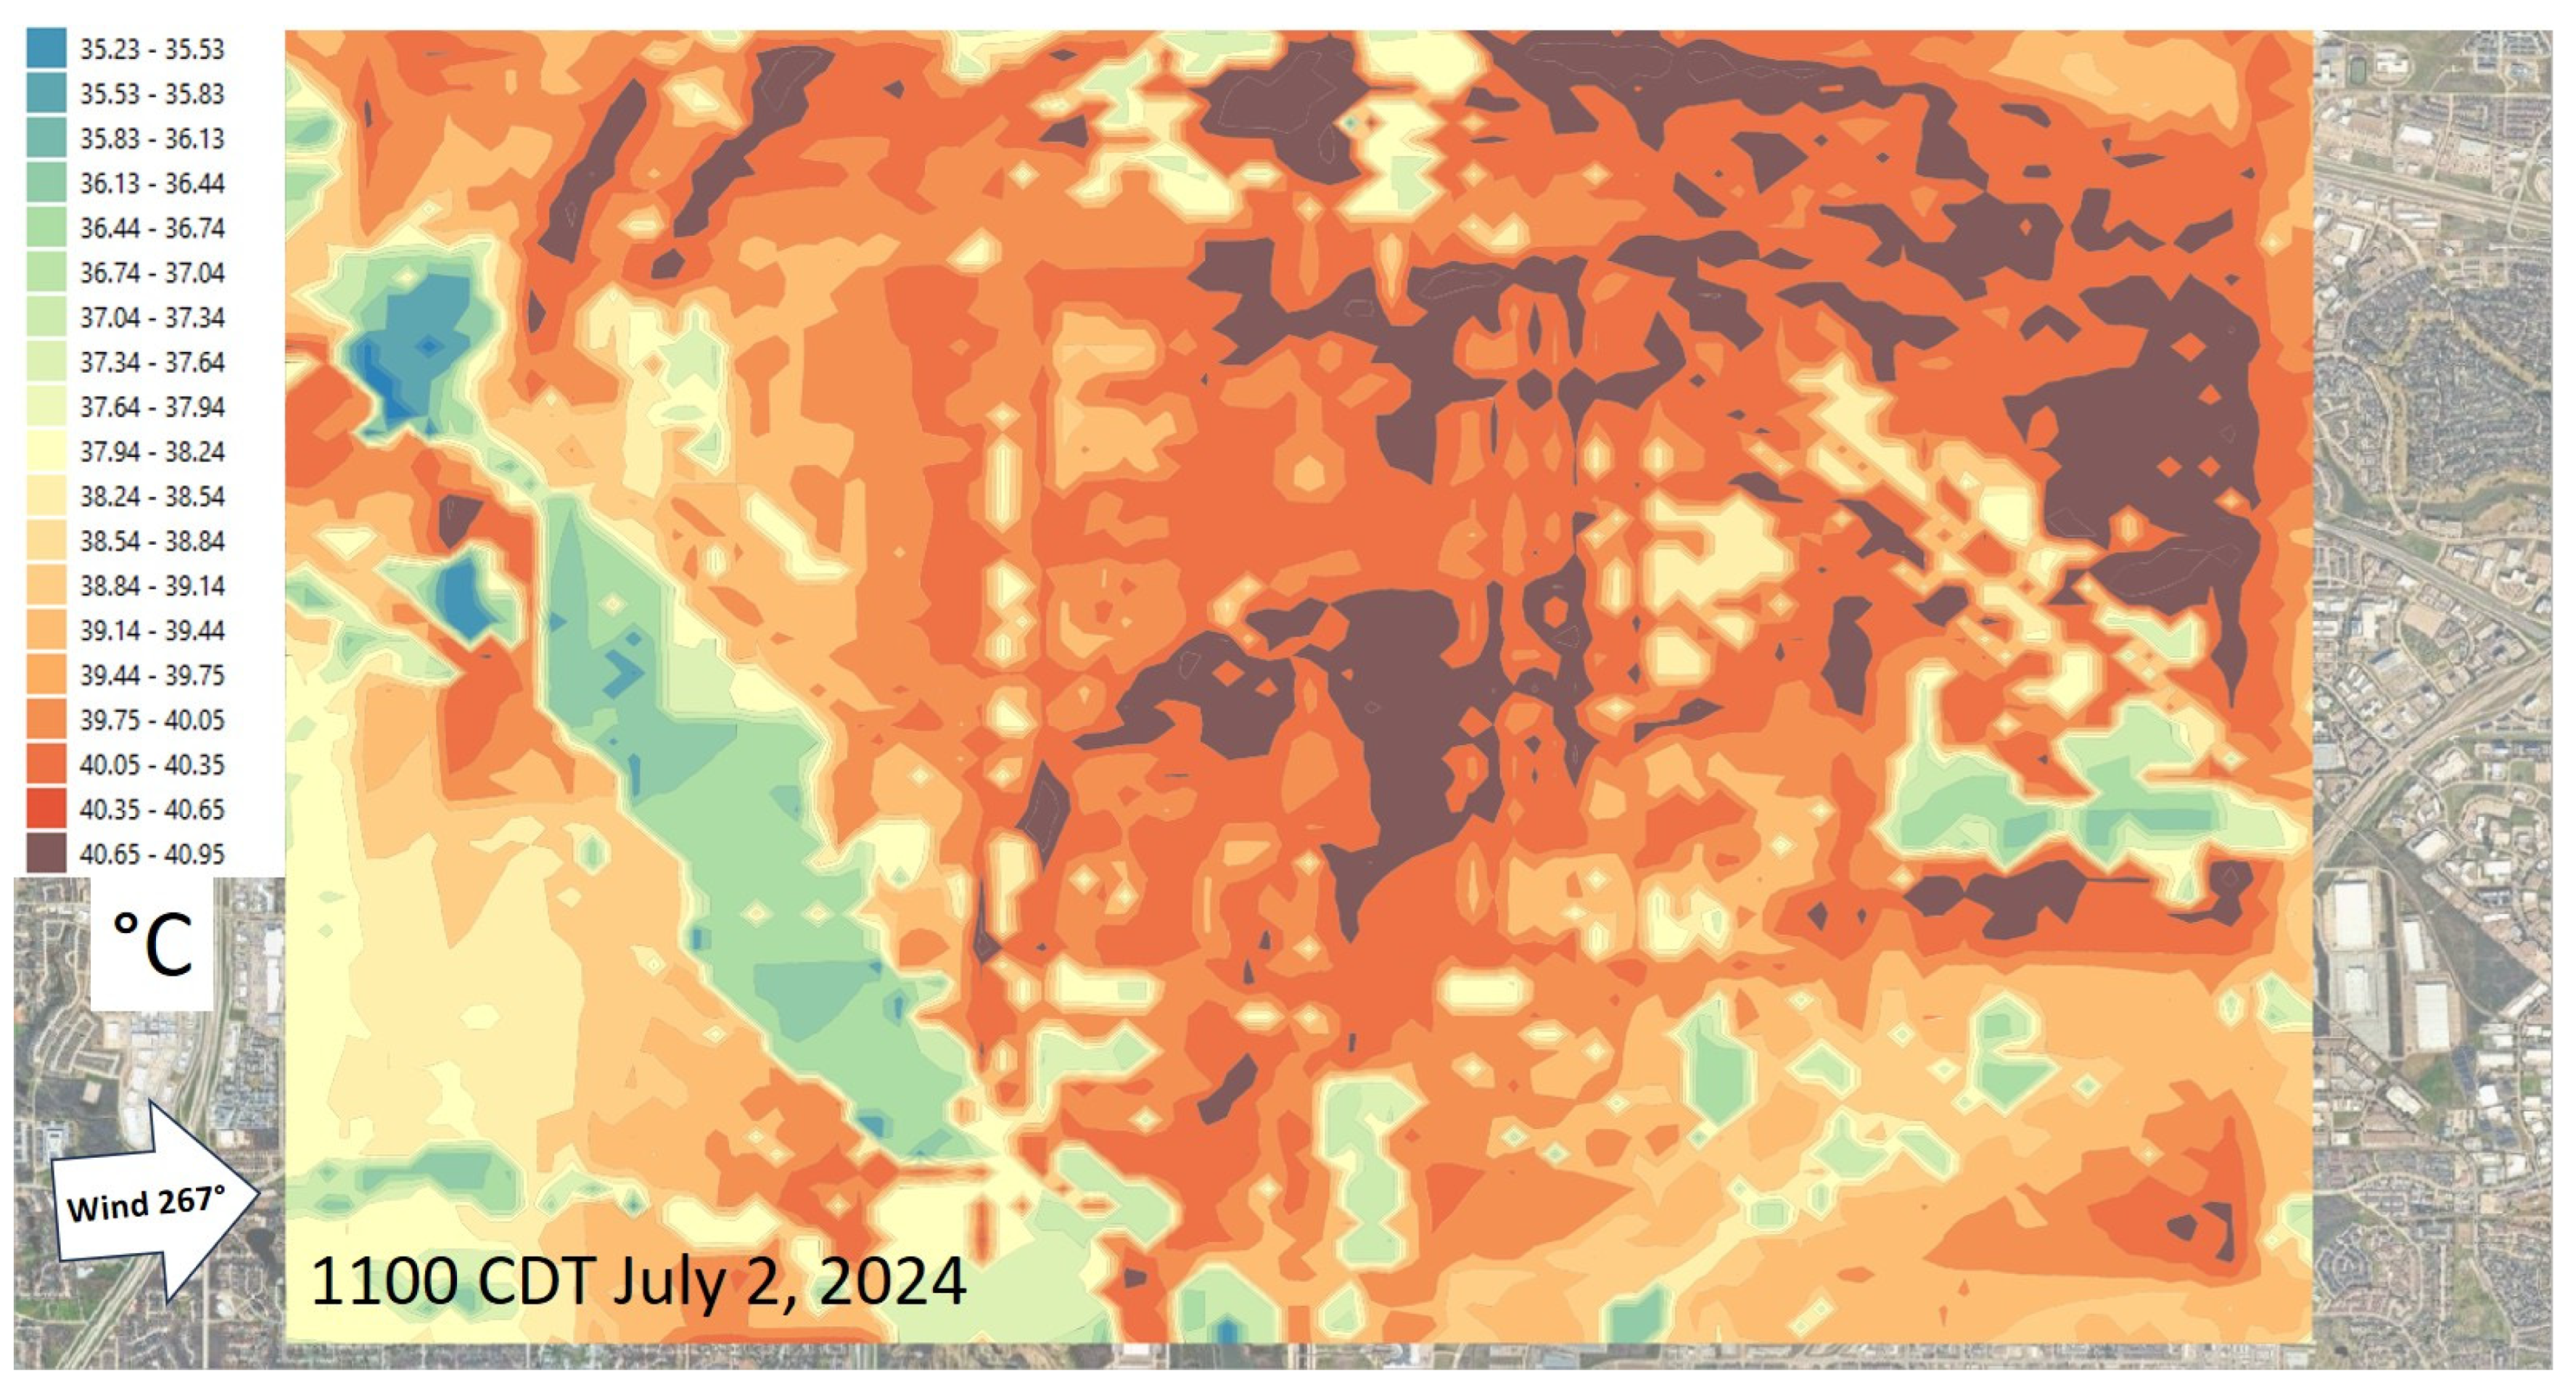
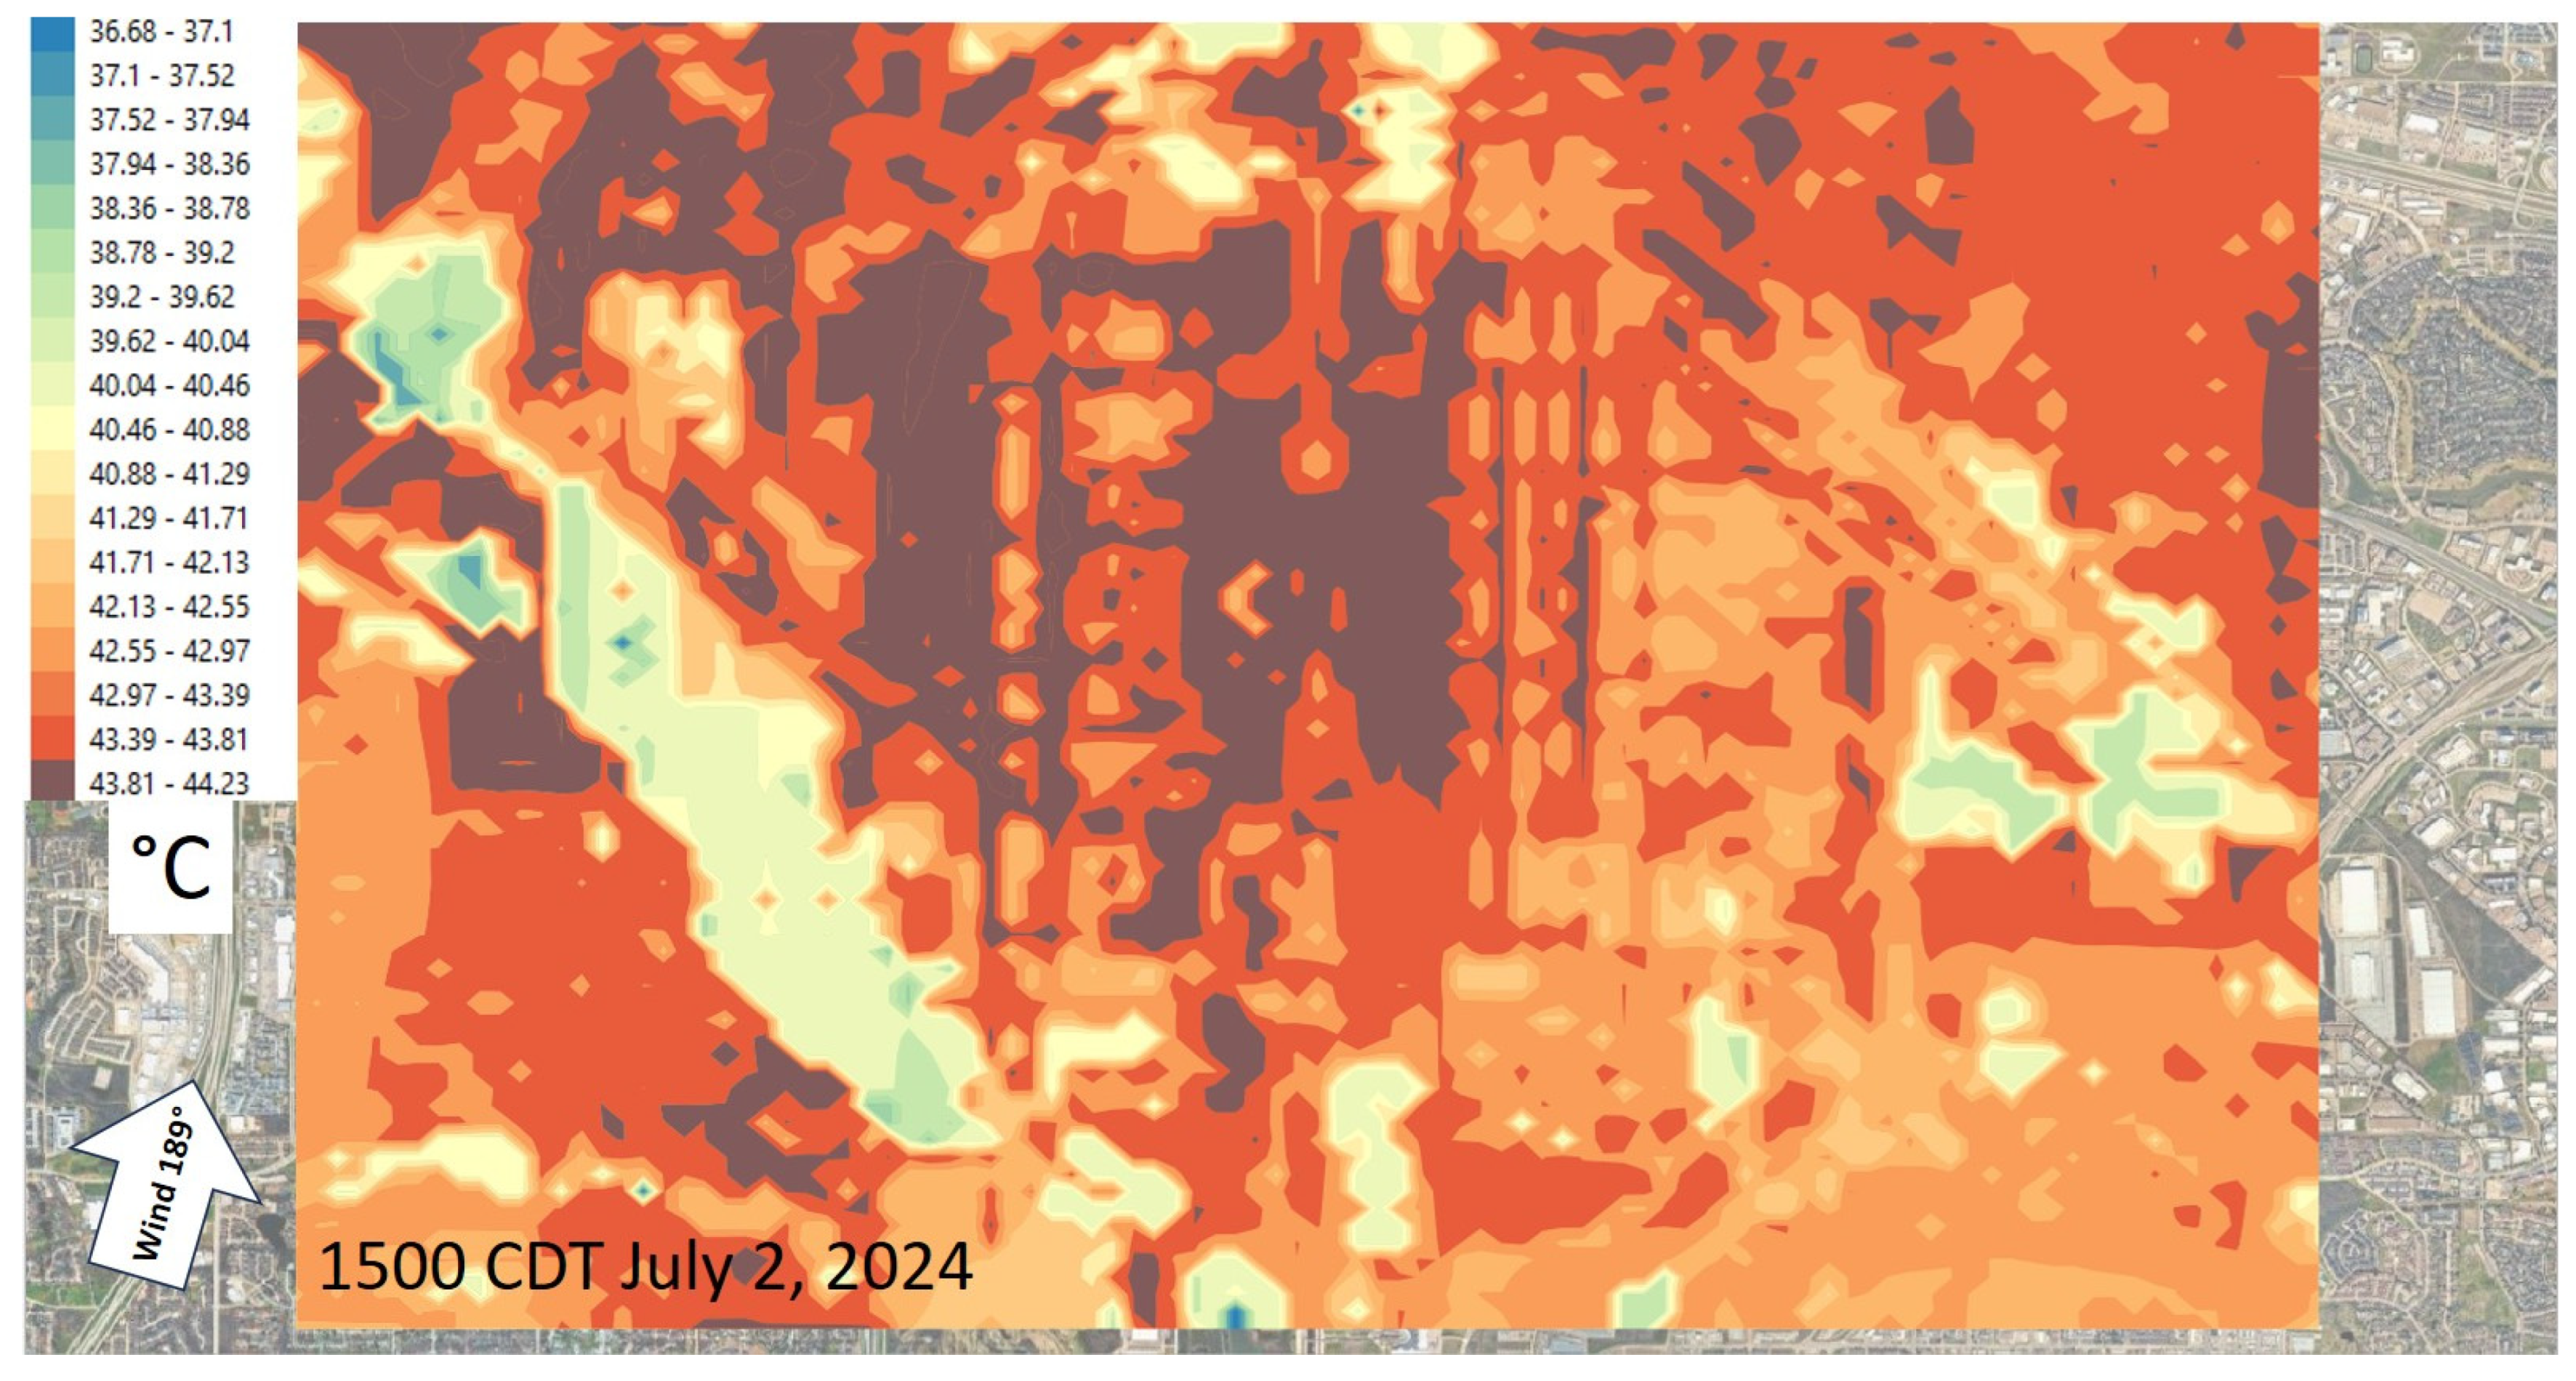
Figure 7 and Figure 8 show the near-surface model temperature fields at two hours on a random day (2 July 2024). Hour 1100 CDT (Figure 7) is a transitional pattern when the wind is westerly whereas Figure 8 is at 1500 CDT showing the typical south flow which is a dominant pattern at DFW. These two random hours are shown to contrast the displacement of warmer air in the central and downwind parts of the airport area. As can be seen at 1100 CDT, the higher temperatures are found mostly in the eastern parts and the central area (around the terminals) is warmer on the eastern side. Runways on the eastern side are also hotter than those on the western part of the airport.
Figure 7.
Near-surface air temperature at 1100 CDT with a westerly flow.
Figure 8.
Near-surface air temperature at 1500 CDT with a southerly flow.
At 1500 CDT (Figure 8), the higher temperatures are displaced towards the north and in the central terminal areas, are displaced north as well. The runways on both side of the terminals have more similar temperatures, unlike at 1100 CDT (Figure 7).
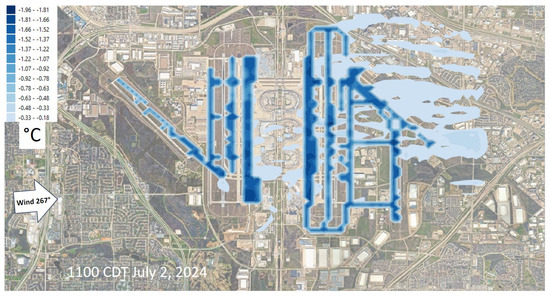
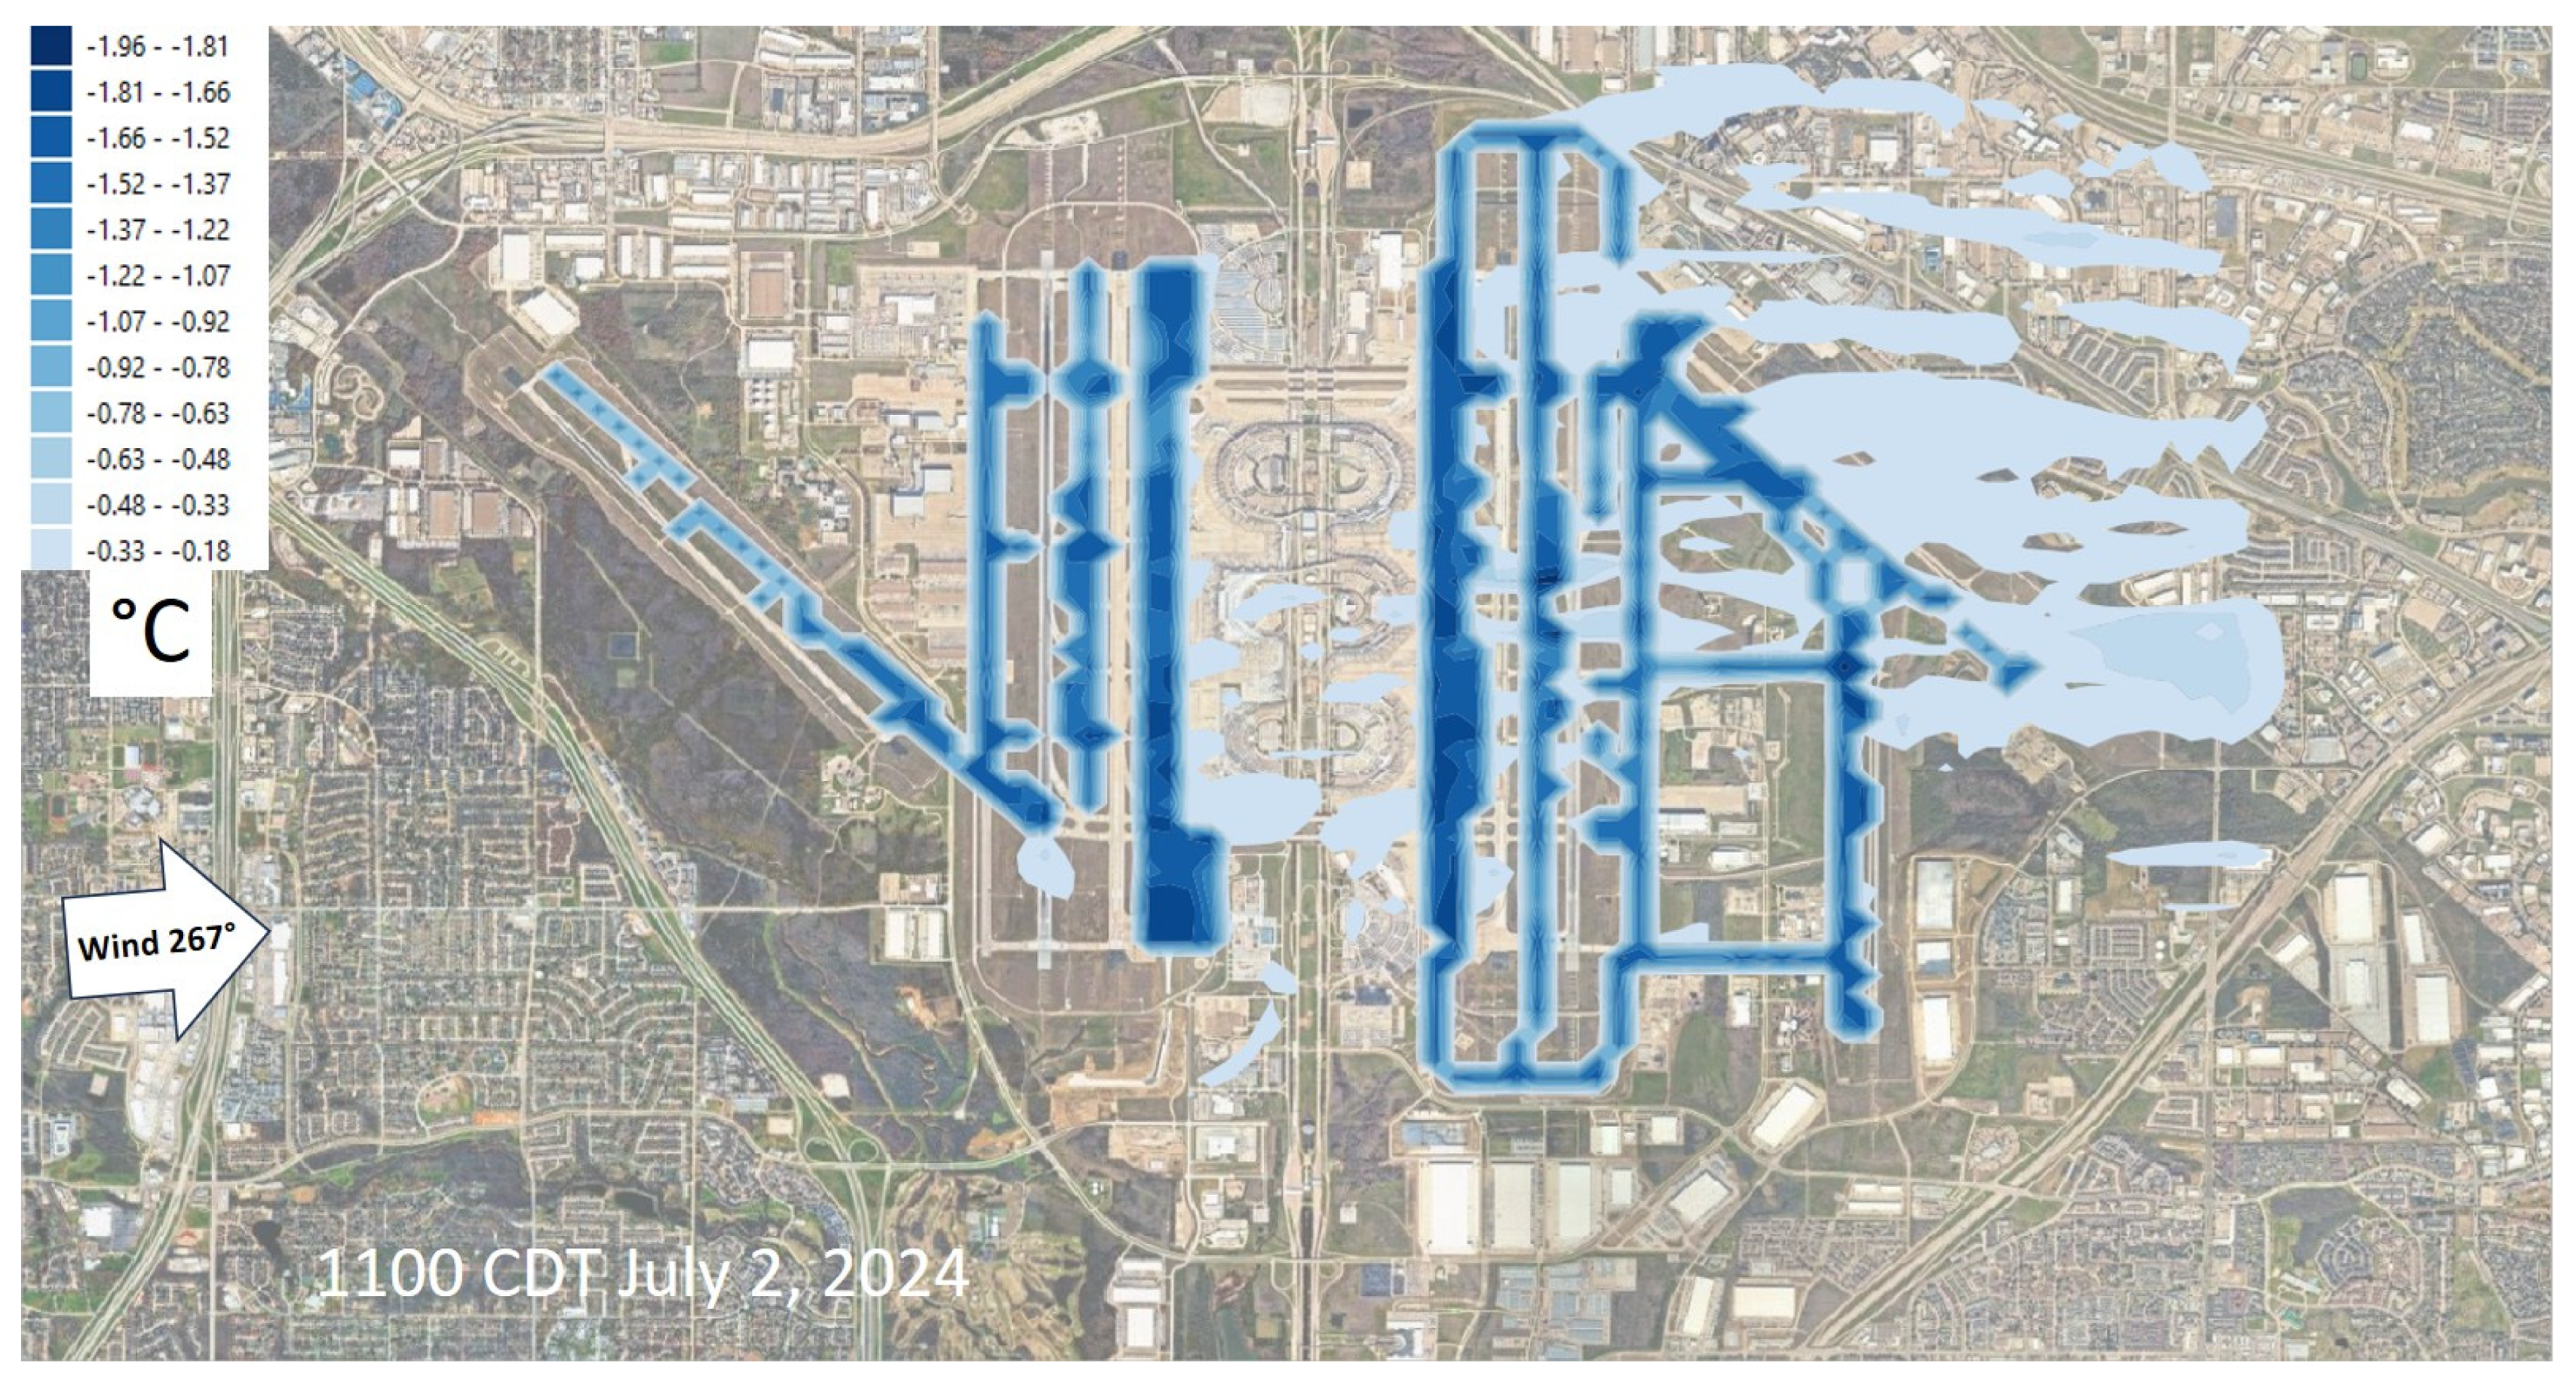
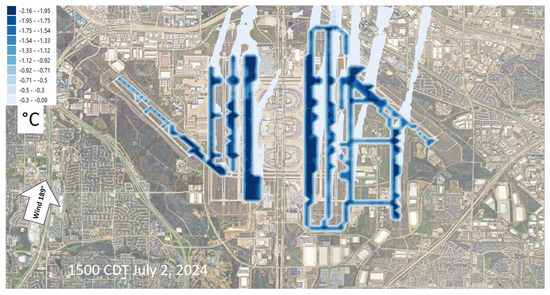
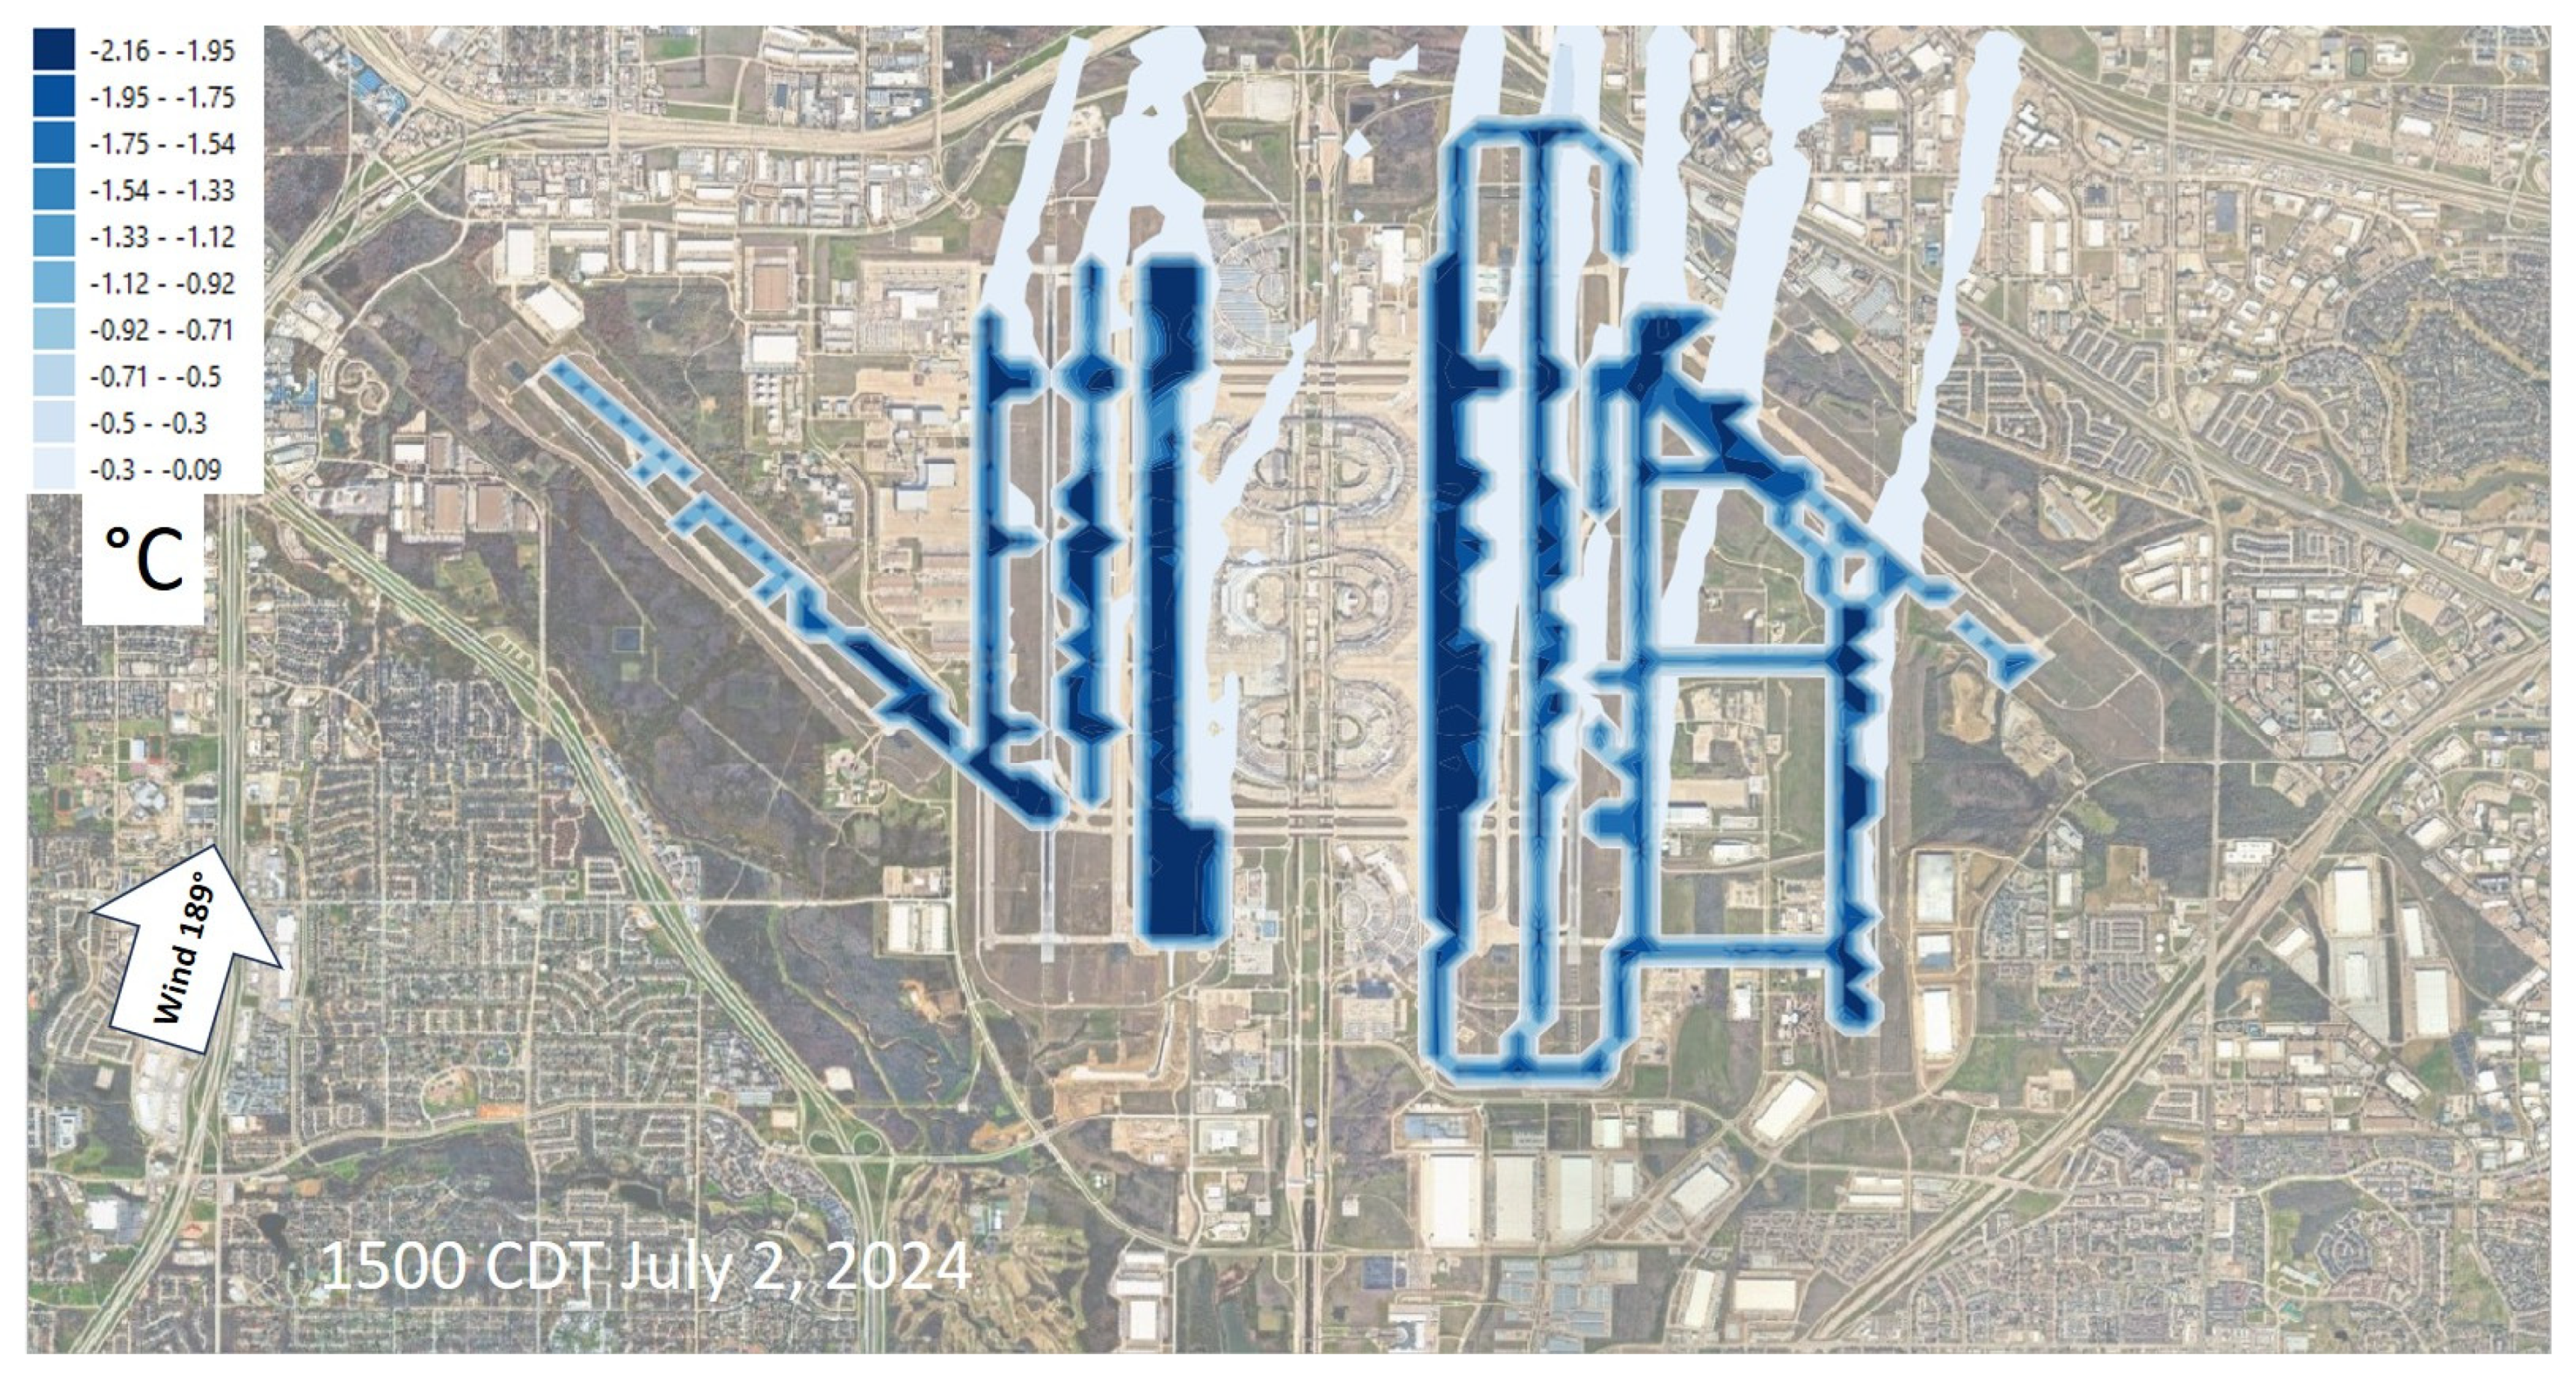
With increased albedo, the large areas of taxiways and shoulders produce significant cooling near the surface, at the height of aircraft engine intakes. Figure 9 and Figure 10 depict the change in air temperature at 1–1.5 m above ground corresponding to hours 1100 and 1500 CDT presented in Figure 7 and Figure 8, respectively. The localized cooling over modified taxiways and shoulders (dark blue) is evident and so is the advection of lowered air temperatures per wind direction (lighter blue color) towards east at 1100 CDT and towards north at 1500 CDT. It can be seen that those plumes of cooler air also affect parts of the surrounding communities outside of the airport as well as several runways (such as 18L/36R, 35L/17R, and 35C/17C during the dominant south flow as in Figure 10) even though albedo of runways per se is unchanged.
Figure 9.
Changes in near-surface air temperature from increased albedo during westerly flow: note the advection of cooler air to eastern parts of campus and surrounding communities.
Figure 10.
Changes in near-surface air temperature from increased albedo during southerly flow: note the advection (plumes) of cooler air towards the north.
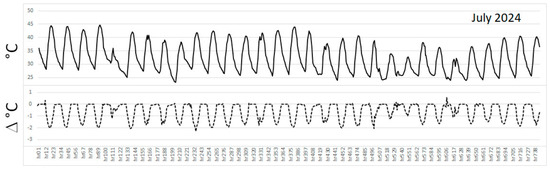
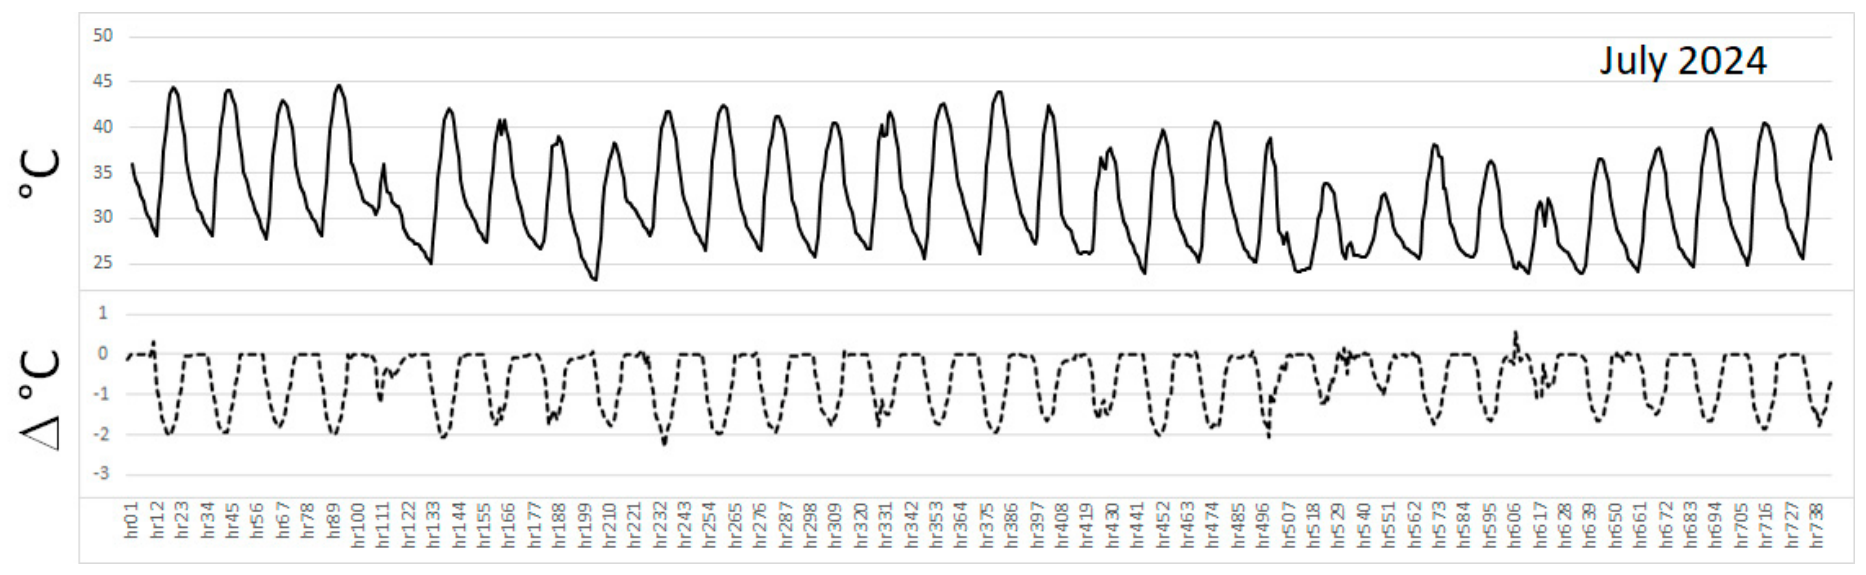
The top part of Figure 11 depicts time series of hourly air temperature averaged at all points along taxiways F, G, K, and L (Figure 4, bottom), an area of about 772,000 m2 out of 1,707,500 m2 of taxiways and shoulders, or about 45%, for the month of July 2024 ranging from a month low of 23 °C to a high of 45 °C. There are overcast conditions around hours 111–133, 518–562, and 606–628. The bottom part of Figure 11 shows the change in air temperature averaged at those same points. The cooling reaches up to 2 °C around midday and tapers off in the evening and early morning hours. At night, the changes average out to close to zero. These temperature changes and reductions are similar to observations in the field and in prior modeling studies [5,35,36] but are slightly larger here because of the extended modified surface areas.
Figure 11.
(Top): Hourly average air temperature at all points along taxiways F, G, K, and L and shoulders for July 2024. (Bottom): hourly change in air temperature (from albedo increase) averaged at those points.
From Figure 11, it is clear that there exists an hourly profile whereby the larger cooling occurs around the times of the highest temperatures and that it tapers off at the hours when temperature drops. Also noticeable is that during overcast conditions, there is smaller decrease in air temperature (smaller albedo effect), as expected. This can be seen especially around hours 111–133, 518–562, and 606–628 (Figure 11, bottom). During such conditions, the temperature reductions (albedo effect) are smaller than 50% of the reductions during clear-sky conditions.
3.3. Taxi and Takeoff-Roll Effects
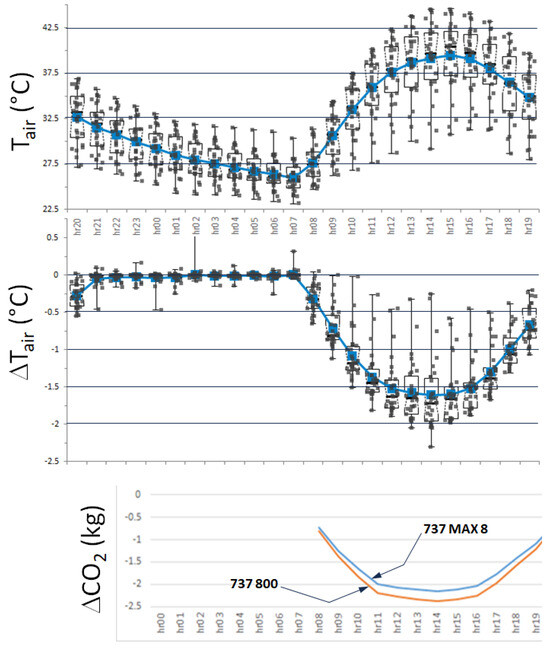
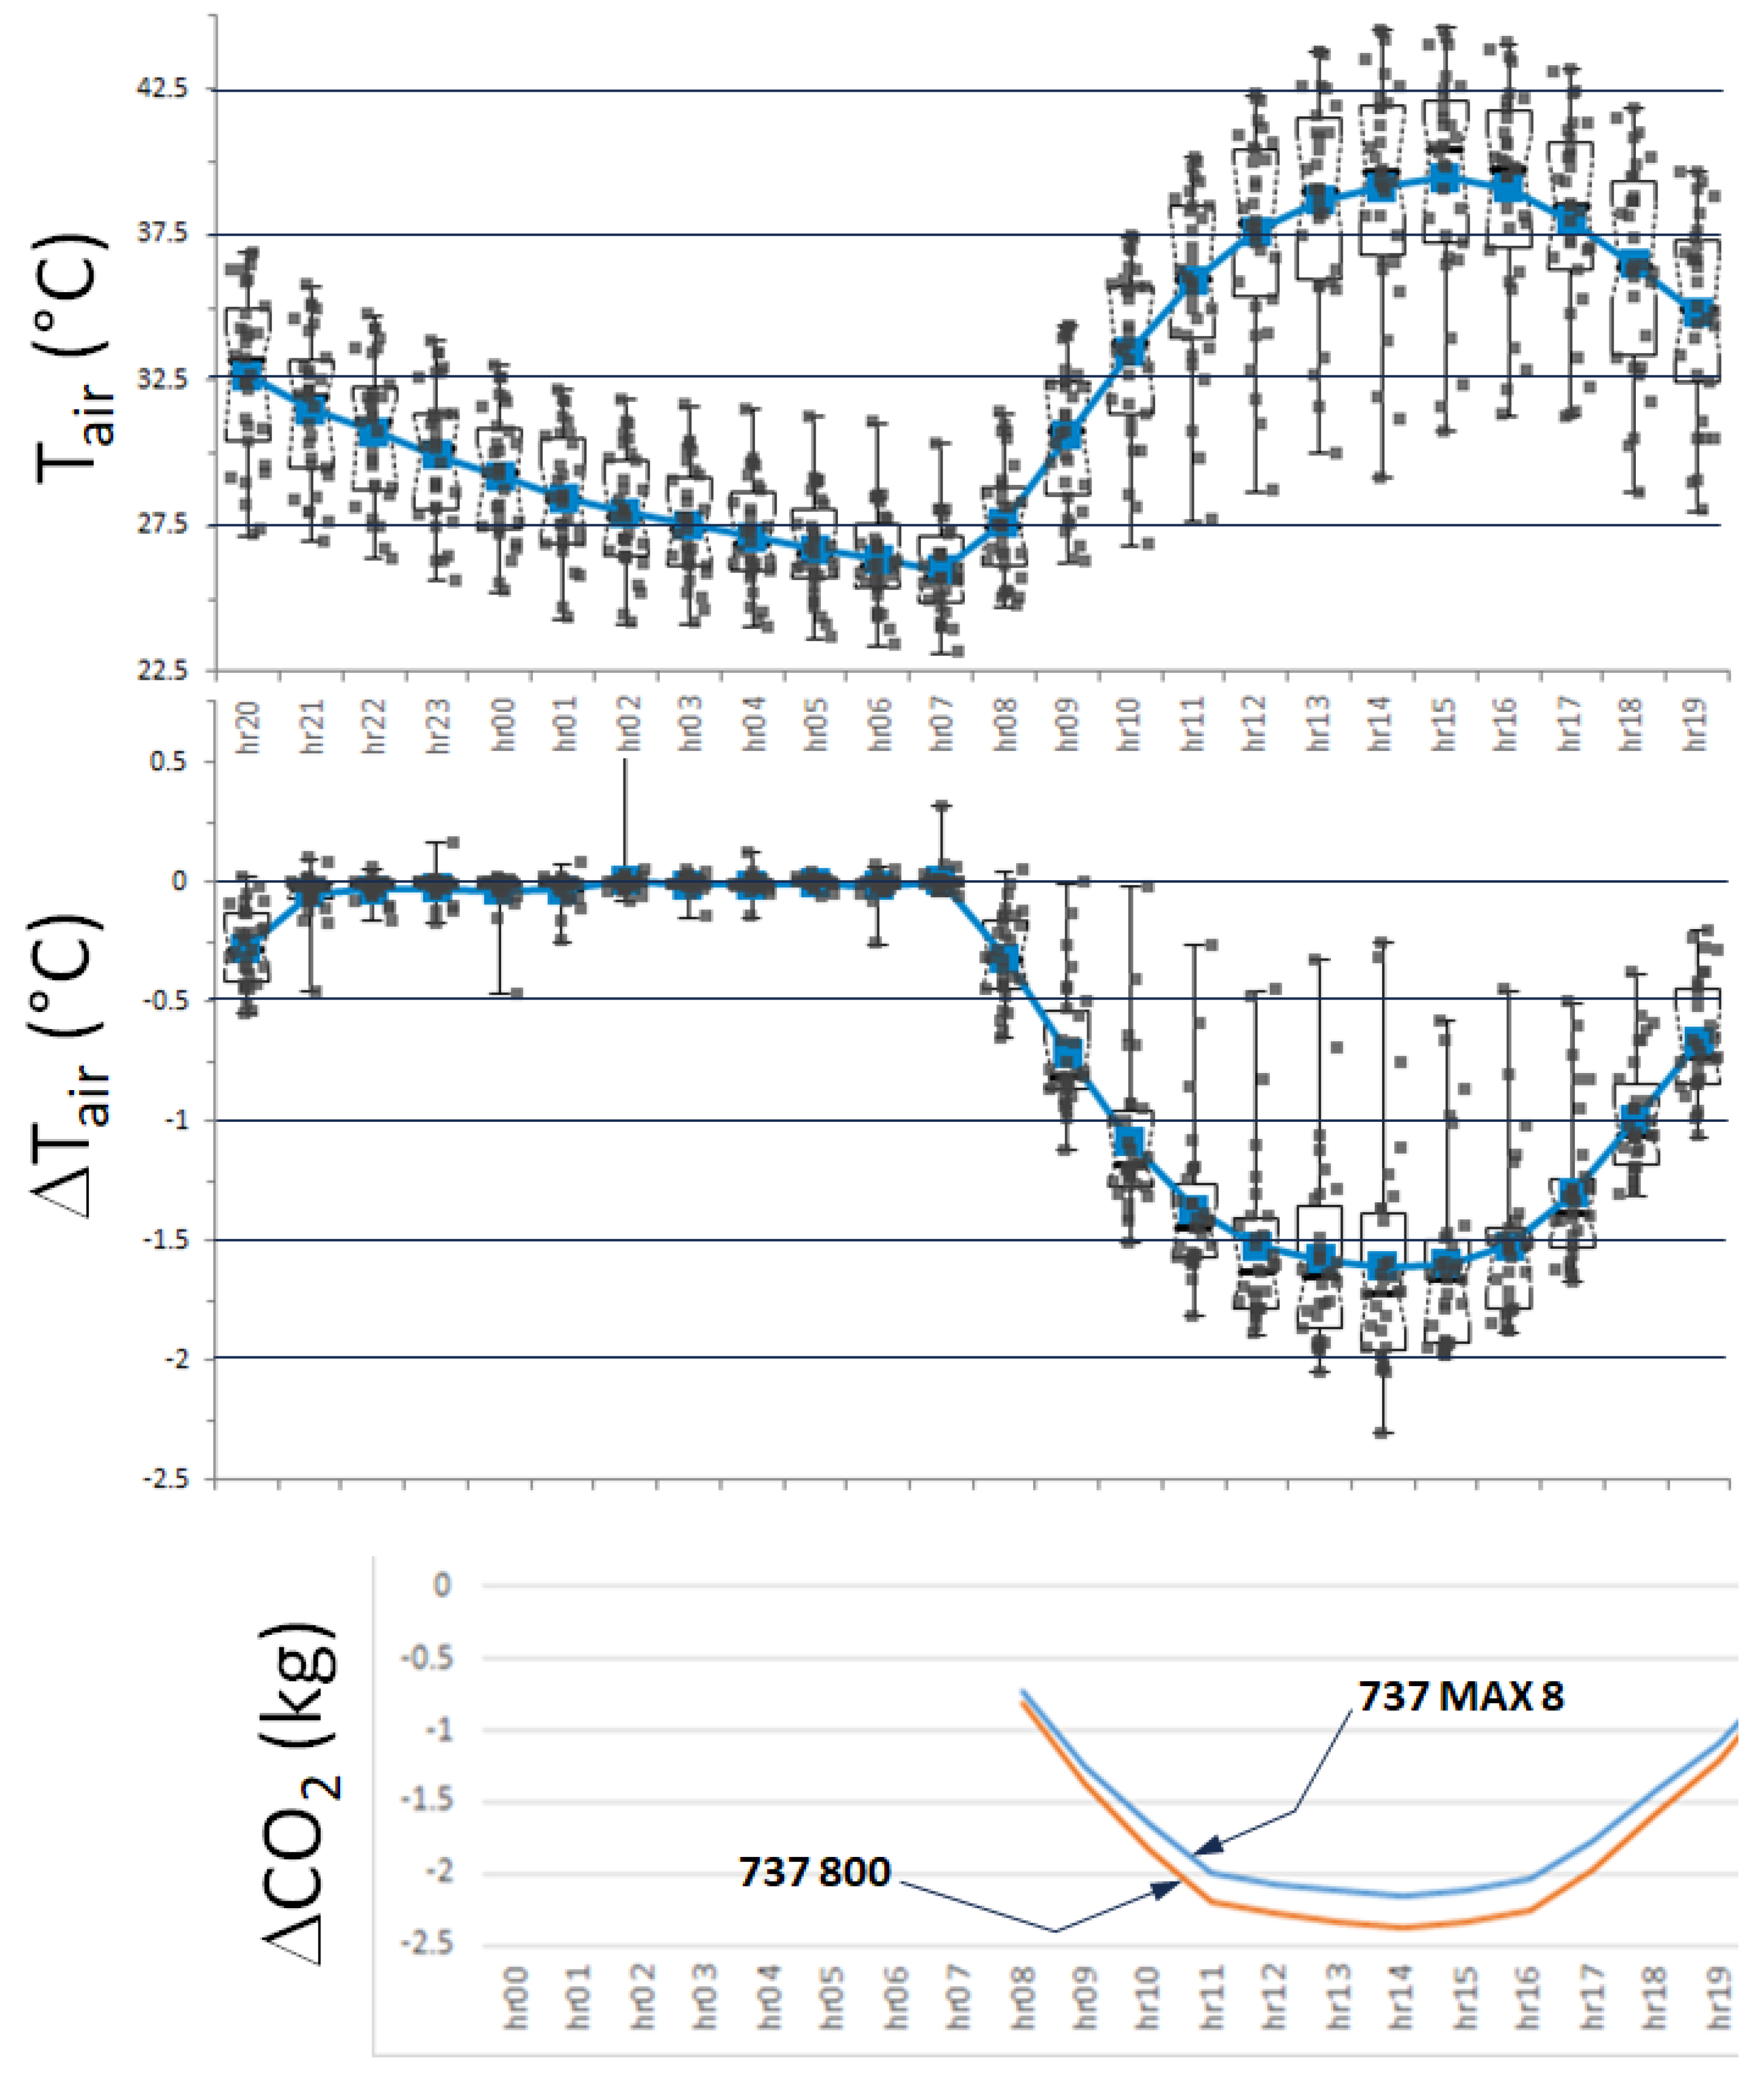
The hourly air temperatures and changes thereof (Figure 11) are then averaged across 31 days in order to characterize a representative day in July 2024, including overcast conditions. This results in the profiles shown at the top and middle of Figure 12 which are then translated into potential equivalent effects on fuel use and CO2 emissions from taxiing over cooler surfaces and to also evaluate any detectable effects in terms of takeoff-roll distance (the latter as a result of cooler air advected over runways). In this section, all reported temperatures are in Celsius except for the term Tair in Equations (5) and (6), where it is in Kelvin.
Figure 12.
(Top): 31-days averaged air temperature over taxiways F,G,K,L and shoulders. (Middle): 31-days averaged change in air temperature over taxiways and shoulders. (Bottom): average change in CO2 emissions per single taxi-in or taxi-out operation of a Boeing 737 aircraft.
Fuel use (kg) during taxi is computed [24] as:
where t is taxi time (seconds), S is number of stops, TU is number of turns, and Tair is air temperature in K. Here, coefficients c1–c4 (Table 3) are used for a Boeing 737 type [19,24].
Table 3.
Boeing 737 coefficients for Equation (5).
Thus, for our purpose, and keeping in mind that both air temperature and changes thereof are time-dependent (as seen in Figure 11 and Figure 12), the change in CO2 emissions per one single taxi-in or taxi-out phase can be computed as:
where c5 is a fuel-to-CO2 conversion factor. For this example, we set t = 1080 (18 min taxiing time), S = 5, and TU = 5 (estimated based on DFW runways configuration) and assume that, over time, they average out to be similar for both taxi-out and taxi-in operations. In Equation (6), ΔTair values are found from the middle graph of Figure 12 which is the change averaged over taxiways F, G, K, and L (Figure 4, bottom).
The bottom part of Figure 12 shows the potential reductions in CO2 emission, as calculated via Equation (6), amounting to up to between 2 and 2.5 kg per single taxi-in or taxi-out phase during the most active hours of the day (out of some 600 kg for a full 737 taxi up to just before setting thrust level for takeoff). These are clearly small but non-zero effects that, when scaled by some 2000 departures and arrivals per day, can become significant at 4000–5000 kg per day per a single airport like DFW. This scaling is an order of magnitude assuming 737-equivalent estimates since fleet-mix data is unavailable at this stage—this would be pursued further in future work.
In terms of takeoff-roll distance, i.e., required runway length, a Koch chart [56] is used to estimate potential reductions resulting from lower density altitudes due to cooler surfaces. While there exist extensive specifications and detailed information on takeoff runway-length requirements for various aircraft types, weights, flap and thrust settings, takeoff configurations, meteorological conditions, including wind speed and direction, density and pressure altitudes, temperature, and so on [19,27], it is not possible to account for all such settings for every single aircraft that is taking off, at least not in this initial study, and so a more statistical or aircraft-type-independent approach is followed instead.
Koch charts implicitly take into account pressure altitude, density altitude, moist adiabatic lapse rate, and air temperature to compute takeoff-roll distances and climb rates. As studies indicate [25], the use of Koch chart in this context is appropriate since it is non-aircraft-type-specific and thus can provide a general order of magnitude assessment of potential effects assuming all other factors unchanged. Here, we also assume no impact on climb rates since the changes in air temperature are confined to near the surface.
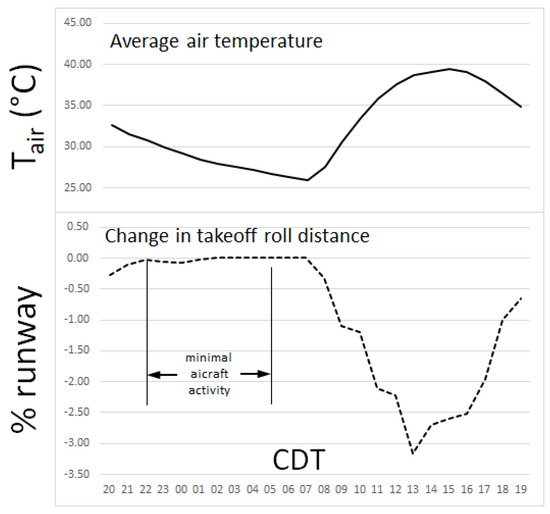
An example for such calculations is a departure from runway 17R during south-flow conditions when cooler air from taxiways K and L is advected over the runway area (e.g., as seen during the random hour in Figure 10). The results are shown in Figure 13 where the top chart is a duplication of the mean of air temperature from top of Figure 12, and the bottom part is the change in takeoff-roll distance in runway percent. Thus, using Koch chart with the values of air temperatures and changes thereof listed in Table 4, along with meteorology-dependent pressure altitude for an elevation of 180 m AMSL (at DFW), the results indicate that the takeoff-roll distance can be reduced by up to 3% at midday tapering off to around 1% early morning and late evening. There are no changes at night (no albedo effects) which is irrelevant here since there are minimal or non-existent arrivals or departures between 2200 and 0500 CDT (per DFW; www.dfwairport.com), as also indicated in Figure 13, bottom.
Table 4.
July-averaged, hourly means of air temperature and change (°C) from Figure 12.
While such reductions in runway length are too small to produce any noticeable on-the-ground fuel savings, they can, in the long term, translate into cumulative benefits that include increased payload, reduced thrust settings (prolong engine life), safer takeoffs especially during hotter days (improved safety margin, because a shorter takeoff roll leaves more remaining runway in case of rejected takeoff), and decreased mechanical component wear (tires, brakes, struts) since a lower density altitude can also mean getting airborne at a lower ground speed, depending on thrust settings.
These effects are a result of cooler air advected over the runways because of increased albedo on nearby taxiways and shoulders, while keeping DFW runways albedo unchanged, as is, at 0.09–0.15 (Section 2.3). If the albedo of runways were also increased by a modest amount to, say, 0.20–0.25, the reductions in takeoff-roll distances would roughly double.
3.4. Limitations and Future Work
This preliminary study aimed to assess the micrometeorological impacts and an order of magnitude of emissions and runway-length reductions that could result from implementing cooler taxiways and shoulders in DFW. In doing so, simplifying assumptions were made at this exploratory stage. Thus, several limitations exist that should be addressed in any potential future follow-on work.
- Additional details of engine specifications should be used in calculating fuel flow, power generation, and wake properties at the taxiing stage
- Instead of relying on a single aircraft type for simplicity, a fleet mix of types at each airport should be used to better distribute relevant calculations of emissions and runway-length reductions
- While this study accounted for the buoyant production of TKE from engine exhaust, the shear component was not. Although this is not as critical on taxiways as it is for runways during takeoff phase, additional research is needed into how engine wake could be parameterized along the taxiways
- The use of Koch charts, while convenient in this preliminary study, needs to be reevaluated and more aircraft-type and settings-specific parameters be used
- In addition to CO2 emissions evaluated in this paper, potential impacts on other pollutants and GHG with significant global-warming potentials should also be evaluated.
4. Conclusions
This study shows that aircraft taxiing on cooler surfaces can save small but non-zero amounts of fuel which, when scaled, can become significant in terms of potential CO2 emissions reductions. Using a Boeing 737 aircraft type, this exploratory analysis simplifies several details about aircraft operations, fleet mix, and engine specifications, with the main objective, here, being to get an initial ballpark estimate of effects that could be expected from implementing cool taxiways and shoulders.
The study does not imply that these surfaces be modified for the sole purpose of improving on-the-ground aircraft operational efficiency but, rather, attempts to quantify the potential bonus beneficial effects that would result from implementing cooler surfaces on taxiways and shoulders as part of broader strategies aimed at cooling down urban areas and airports, saving energy, improving thermal comfort and outdoor worker productivity, as well as increasing the lifespan of pavements.
Scaling to some 2000 departures and arrivals per day at DFW, as an example, indicates that around 4000–5000 kg CO2 could be saved daily from taxiing over cooler surfaces. If this is further scaled by number of days per season or year, number of eligible airports nationally and world-wide, and accounting for various aircraft types and operations, the benefits would be much more significant. Additionally, this study assumes no changes in runways albedo, but if this is also increased by a modest and feasible amount, the reduction in takeoff-roll distance, i.e., required runway length, could double from 3%, as presented in this paper, to 5–7% thus providing greater benefits. Finally, if effects from cooler taxiways and shoulders are combined with those from other surface modifications at the airport, such as cool roofs, tarmacs, ramps, aprons, and parking areas, the benefits would increase significantly.
Thus, these bonus and ancillary benefits of cooler taxiways and shoulders should be recognized, accounted for, and added to those resulting from urban cooling, energy savings, and worker productivity. This information could be useful to policy makers and airport planners to take into account if and when implementing cooler surfaces.
Funding
This research received no external funding.
Data Availability Statement
The original contributions presented in this study are included in the article. Further inquiries can be directed to the corresponding author.
Conflicts of Interest
Author Haider Taha as affiliated by the company Altostratus Inc., The author declare that the research was conducted in the absence of any commercial or financial relationships that could be construed as a potential conflict of interest.
Appendix A
Broad-band albedo derived from 10-m Sentinel-2 [47] reflectance bands for a sample of airports. Satellite overpass dates are provided on each figure.
Figure A1.
Broad-band albedo derived from 10-m Sentinel-2 reflectance data.
References
- Akbari, H. A simplified method to calculate atmospheric CO2 equivalency for changing surface albedo. Urban Clim. 2026, 65, 102795. [Google Scholar] [CrossRef] [Scilit]
- Akbari, H.; Matthews, D. Global cooling updates: Reflective roofs and pavements. Energy Build. 2012, 55, 2–6. [Google Scholar] [CrossRef] [Scilit]
- Gough, W.A.; Leung, A.C.W. Do Airports Have Their Own Climate? Meteorology 2022, 1, 171–182. [Google Scholar] [CrossRef] [Scilit]
- Alahmad, B.; Isachsen, I.; Alwadi, Y.; Taha, H.; Bernheim, A.; Cooke, E.; Wesley, E.; Kats, G.; Spengler, J. A modeling study of cool surfaces and outdoor workers productivity at San Francisco International Airport. PNAS Nexus 2025, 4, 593. [Google Scholar] [CrossRef] [Scilit] [PubMed]
- Taha, H. Micrometeorological effects and thermal-environmental benefits of cool pavements: Findings from a detailed observational field study in Pacoima, California. Environ. Res. Commun. 2024, 6, 035016. [Google Scholar] [CrossRef] [Scilit]
- Akbari, H.; Matthews, H.D.; Seto, D. The long-term effect of increasing the albedo of urban areas. Environ. Res. Lett. 2012, 7, 024004. [Google Scholar] [CrossRef] [Scilit]
- Epstein, S.A.; Lee, S.M.; Katzenstein, A.S.; Carreras-Sospedra, M.; Zhang, X.; Farina, S.C.; Vahmani, P.; Fine, P.M.; Ban-Weiss, G. Air-quality implications of widespread adoption of cool roofs on ozone and particulate matter in southern California. Proc. Natl. Acad. Sci. USA 2017, 34, 8991–8996. [Google Scholar] [CrossRef] [Scilit] [PubMed]
- Gilbert, H.E.; Rosado, P.J.; Ban-Weiss, G.; Harvey, J.T.; Li, H.; Mandel, B.H.; Millstein, D.; Mohegh, A.; Saboori, A.; Levinson, R.M. Energy and environmental consequences of a cool pavement campaign. Energy Build. 2017, 157, 53–77. [Google Scholar] [CrossRef] [Scilit]
- Ko, J.; Schlaerth, H.; Bruce, A.; Sander, K.; Ban-Weiss, G. Measuring the impacts of a real-world neighborhood-scale cool pavement deployment on albedo and temperatures in Los Angeles. Environ. Res. Lett. 2022, 17, 044027. [Google Scholar] [CrossRef] [Scilit]
- Kyriakodis, G.E.; Santamouris, M. Using reflective pavements to mitigate urban heat island in warm climates—Results from a large-scale urban mitigation project. Urban Clim. 2017, 24, 326–339. [Google Scholar] [CrossRef] [Scilit]
- Santamouris, M. Using cool pavements as a mitigation strategy to fight urban heat island—A review of the actual developments. Renew. Sustain. Energy Rev. 2014, 26, 224–240. [Google Scholar] [CrossRef] [Scilit]
- Taleghani, M.; Sailor, D.J.; Ban-Weiss, G. Micrometeorological simulations to predict the impacts of heat mitigation strategies on pedestrian thermal comfort in a Los Angeles neighborhood. Environ. Res. Lett. 2016, 11, 024003. [Google Scholar] [CrossRef] [Scilit]
- Wang, J.; Meng, Q.; Zhang, L.; Zhang, Y.; He, B.J.; Zheng, S.; Santamouris, M. Impacts of the water absorption capability on the evaporative cooling effect of pervious paving materials. Build. Environ. 2019, 151, 187–197. [Google Scholar] [CrossRef] [Scilit]
- Taha, H. Episodic performance and sensitivity of the urbanized MM5 (uMM5) to perturbations in surface properties in Houston TX. Bound.-Layer Meteorol. 2008, 127, 193–218. [Google Scholar] [CrossRef] [Scilit]
- Taha, H. Meso-urban meteorological and photochemical modeling of heat island mitigation. Atmos. Environ. 2008, 42, 8795–8809. [Google Scholar] [CrossRef] [Scilit]
- Taha, H. Urban surface modification as a potential ozone air-quality improvement strategy in California: A mesoscale modeling study. Bound.-Layer Meteorol. 2008, 127, 219–239. [Google Scholar] [CrossRef] [Scilit]
- Cao, F.; Tanh, T.Q.; Gao, Y.; You, F.; Zhang, J. Calculation and analysis of new taxiing methods on aircraft fuel consumption and pollutant emissions. Energy 2024, 277, 127618. [Google Scholar] [CrossRef] [Scilit]
- Cui, A.; Lei, Y.; Li, Y. Protocol to calculate aircraft emissions for international air routes in South America. START Protoc. 2022, 4, 101952. [Google Scholar] [CrossRef] [Scilit] [PubMed]
- Knacker, T.; Dannewald, T.; Kirschstein, T. Estimation of aircraft fuel consumption and emissions during taxiing processes. Transp. Res. Part D 2026, 155, 105330. [Google Scholar] [CrossRef] [Scilit]
- Kale, U. Assessing the impact of climate change on aircraft engine performance during different flight phases (take-off and cruise) and the environmental consequences. Aircr. Eng. Aerosp. Technol. 2024, 96, 912–920. [Google Scholar] [CrossRef] [Scilit]
- Chen, Y.; Quan, L.; Yu, J. Aircraft Taxi Path Optimization Considering Environmental Impacts Based on a Bilevel Spatial–Temporal Optimization Model. Energies 2024, 17, 2692. [Google Scholar] [CrossRef] [Scilit]
- Hao, L.; Ryerson, M.S.; Kang, L.; Hansen, M. Estimating fuel burn impacts of taxi-out delay with implications for gate-hold benefits. Transp. Res. Part C Emerg. Technol. 2017, 80, 454–466. [Google Scholar] [CrossRef] [Scilit]
- Nikoleris, T.; Gupta, G.; Kistler, M. Detailed estimation of fuel consumption and emissions during aircraft taxi operations at Dallas/Fort Worth International Airport. Transp. Res. Part D Transp. Environ. 2011, 16, 302–308. [Google Scholar] [CrossRef] [Scilit]
- Khadilkar, H.; Balakrishnan, H. Estimation of aircraft taxi fuel burn using flight data recorder archives. Transp. Res. Part D 2012, 17, 532–537. [Google Scholar] [CrossRef] [Scilit]
- Zhou, Y.; Zhang, N.; Li, C.; Liu, Y.; Huang, P. Decreased takeoff performance of aircraft due to climate change. Clim. Change 2018, 151, 463–472. [Google Scholar] [CrossRef] [Scilit]
- Liu, X.; Mao, C.; Yue, S.; Ji, Q.; Wang, C. Meteorological impacts on aviation carbon emissions during takeoff and landing at 25 major global airports. Transp. Econ. Manag. 2025, 3, 346–365. [Google Scholar] [CrossRef] [Scilit]
- Boeing Commercial Airplanes. 737 Airplane Characteristics for Airport Planning; Boeing Commercial Airplanes Technical Report D6-58325-6; Boeing Commercial Airplanes: Renton, WA, USA, 2013. [Google Scholar]
- Powers, G.; Huang, X.Y.; Klemp, B.; Skamarock, W.; Dudhia, J.; Gill, O.; Duda, G.; Barker, D.; Wang, W. A Description of the Advanced Research WRF; NCAR Technical Note NCAR/TN-475+STR; National Center for Atmospheric Research: Boulder, CO, USA, 2008. [Google Scholar]
- Skamarock, W.C.; Klemp, J.B.; Dudhia, J.; Gill, D.O.; Liu, Z.; Berner, J.; Wang, W.; Powers, J.G.; Duda, M.G.; Barker, D.M.; et al. A Description of the Advanced Research WRF Version 4; NCAR Technical Note NCAR/TN-556+STR; National Center for Atmospheric Research: Boulder, CO, USA, 2019; p. 145. [Google Scholar] [CrossRef]
- Dupont, S.; Otte, T.L.; Ching, J.K.S. Simulation of meteorological fields within and above urban and rural canopies with a mesoscale model. Bound.-Layer Meteorol. 2004, 113, 111–158. [Google Scholar] [CrossRef] [Scilit]
- Dupont, S.; Mestayer, P.G.; Guilloteau, E. Parameterization of the urban water budget with the submesoscale soil model. J. Appl. Meteorol. Climatol. 2006, 45, 624–648. [Google Scholar] [CrossRef] [Scilit]
- Dupont, S.; Mestayer, P.G. Parameterization of the urban energy budget with the submesoscale soil model. J. Appl. Meteorol. Climatol. 2006, 45, 1744–1765. [Google Scholar] [CrossRef] [Scilit]
- Martilli, A.; Clappier, A.; Rotach, M.W. An urban surface exchange parameterization for mesoscale models. Bound.-Layer Meteorol. 2002, 104, 261–304. [Google Scholar] [CrossRef] [Scilit]
- Chen, F.; Kusaka, H.; Bornstein, R.; Ching, J.; Grimmond, C.S.B.; Grossman-Clarke, S.; Loridan, T.; Manning, K.; Martilli, A.; Miao, S.; et al. The integrated WRF/urban modeling system: Development, evaluation, and applications to urban environmental problems. Int. J. Climatol. 2010, 31, 273–288. [Google Scholar] [CrossRef] [Scilit]
- Taha, H. Development of an urban heat mitigation plan for the Greater Sacramento Valley, California, a Csa Koppen climate type. Sustainability 2021, 13, 9709. [Google Scholar] [CrossRef] [Scilit]
- Taha, H. Meteorological, air-quality, and emission-equivalence impacts of urban heat island control in California. Sustain. Cities Soc. 2015, 19, 207–221. [Google Scholar] [CrossRef] [Scilit]
- Ching, J.; Brown, M.; Burian, S.; Chen, F.; Cionco, R.; Hanna, A.; Hultgren, T.; McPherson, T.; Sailor, D.; Taha, H.; et al. National urban database and access portal tool, NUDAPT. Bull. Am. Meteorol. Soc. 2009, 90, 1157–1168. [Google Scholar] [CrossRef] [Scilit]
- Salamanca, F.; Martilli, A.; Tewari, M.; Chen, F. A study of the urban boundary layer using different urban parameterizations and high-resolution urban canopy parameters with WRF. J. Appl. Meteorol. Climatol. 2011, 50, 1107–1128. [Google Scholar] [CrossRef] [Scilit]
- Kusaka, H.; Kondo, H.; Kikegawa, Y.; Kimura, F. A simple single-layer urban canopy model for atmospheric models: Comparison with multi-layer and slab models. Bound.-Layer Meteorol. 2001, 101, 329–358. [Google Scholar] [CrossRef] [Scilit]
- Kistler, R.; Kalnay, E.; Collins, W.; Saha, S.; White, G.; Woollen, J.; Chelliah, M.; Ebisuzaki, W.; Kanamitsu, M.; Kousky, V.; et al. The NCEP-NCAR 50-year reanalysis: Monthly means CD-ROM and documentation. Bull. Am. Meteorol. Soc. 2001, 82, 247–267. [Google Scholar] [CrossRef] [Scilit]
- Dudhia, J. Numerical study of convection observed during the Winter Monsoon Experiment using a mesoscale two-dimensional model. J. Atmos. Sci. 1989, 46, 3077–3107. [Google Scholar] [CrossRef] [Scilit]
- Mlawer, E.J.; Taubman, S.J.; Brown, P.D.; Iacono, M.J.; Clough, S.A. Radiative transfer for inhomogeneous atmospheres: RRTM, a validated correlated-k model for the longwave. J. Geophys. Res. Atmos. 1997, 102, 16663–16682. [Google Scholar] [CrossRef] [Scilit]
- Monin, A.S.; Obukhov, A.M. Basic laws of turbulent mixing in the surface layer of the atmosphere. Contrib. Geophys. Inst. Slovak Acad. Sci. 1954, 24, 163–187. [Google Scholar]
- Bretherton, C.S.; Park, S. A new moist turbulence parameterization in the community atmosphere model. J. Clim. 2009, 22, 3422–3448. [Google Scholar] [CrossRef] [Scilit]
- Vermote, E.; Wolfe, R. MODIS/Terra Surface Reflectance Daily L2G Global 1km and 500m SIN Grid V061; NASA Land Processes Distributed Active Archive Center: Sioux Falls, SD, USA, 2021. [CrossRef]
- Earth Resources Observation and Science (EROS) Center. Landsat 8–9 Operational Land Imager/Thermal Infrared Sensor, Level-2 Surface Reflectance; U.S. Geological Survey: Reston, VA, USA, 2020. [CrossRef]
- European Space Agency (ESA). Copernicus Sentinel Data (2026); European Space Agency (ESA): Paris, France, 2026. [Google Scholar]
- Hook, S.; Hulley, G. ECOSTRESS Swath Land Surface Temperature and Emissivity Instantaneous L2 Global 70 m v002; NASA Land Processes Distributed Active Archive Center: Sioux Falls, SD, USA, 2022. [CrossRef]
- Multi-Resolution Land-Characteristics Consortium (MRLC). National Land Cover Databases; Multi-Resolution Land-Characteristics Consortium (MRLC): Sioux Falls, SD, USA, 2024.
- Zhu, X.X.; Chen, S.; Zhang, F.; Shi, Y.; Wang, Y. Global Building Atlas: An open global and complete dataset of building polygons, heights and LoD1 3D models. Earth Syst. Sci. Data 2025, 17, 6647–6668. [Google Scholar] [CrossRef] [Scilit]
- Liang, S. Narrowband to broadband conversions of land surface albedo I: Algorithms. Remote Sens. Environ. 2001, 76, 213–238. [Google Scholar] [CrossRef] [Scilit]
- Bonafoni, S.; Sekertekin, A. Albedo retrieval from Sentinel-2 by new narrow-to-broadband conversion coefficients. IEEE Geosci. Remote Sens. Lett. 2020, 17, 1618–1622. [Google Scholar] [CrossRef] [Scilit]
- National Oceanic and Atmospheric Administration (NOAA) Earth System Research Laboratory; University Corporation for Atmospheric Research. NOAA/ESRL MADIS METAR Data; The National Oceanic and Atmospheric Administration (NOAA): Silver Spring, MD, USA, 2026. Available online: https://madis.ncep.noaa.gov/madis_metar.shtml (accessed on 19 March 2026).
- Nedbor-Gross, R.; Henderson, B.H.; Davis, J.R.; Pachon, J.E.; Rincon, A.; Guerrero, O.J.; Grajale, F. Comparing standard to feature-based meteorological model evaluation techniques in Bogotá, Colombia. J. Appl. Meteorol. Climatol. 2017, 56, 391–413. [Google Scholar] [CrossRef] [Scilit]
- Emery, C.; Tai, E.; Yarwood, G. Enhanced Meteorological Modeling and Performance Evaluation for Two Texas Ozone Episodes; Environ Final Report 31984-11; Texas Natural Resource Conservation Commission (TNRCC): Austin, TX, USA, 2001; 235p. Available online: https://www.researchgate.net/publication/225089610_Enhanced_meteorological_modeling_and_performance_evaluation_for_two_Texas_ozone_episodes (accessed on 19 March 2026).
- Federal Aviation Administration (FAA). Density Altitude; Report FAA-P-8740-2 • AFS-8; Federal Aviation Administration: Washington, DC, USA, 2008. Available online: https://www.faasafety.gov/files/events/nm/nm09/2013/nm0951144/density_altitude.pdf (accessed on 19 March 2026).

Disclaimer/Publisher’s Note: The statements, opinions and data contained in all publications are solely those of the individual author(s) and contributor(s) and not of MDPI and/or the editor(s). MDPI and/or the editor(s) disclaim responsibility for any injury to people or property resulting from any ideas, methods, instructions or products referred to in the content. |
© 2026 by the author. Licensee MDPI, Basel, Switzerland. This article is an open access article distributed under the terms and conditions of the Creative Commons Attribution (CC BY) license.