


Abstract
Mediterranean low-pressure systems or cyclones are responsible for many extreme events affecting the region. This study presents a comprehensive analysis of Mediterranean cyclones from 1940 to 2024 using high-resolution ERA5 reanalysis data. This study implements a detection algorithm based on geopotential height minima on three different pressure levels (1000 hPa, 850 hPa and 700 hPa). Cyclone tracks in this study are constructed by linking identified low-pressure centers at successive time steps using a nearest neighbor tracking algorithm. The number of cyclones at 1000 hPa is filtered by matching them with upper levels and restricting them within 150 km from the coast, covering the entire Mediterranean region, which we divided into three subregions: the western Mediterranean, the eastern Mediterranean, and the Black Sea. Seasonal analysis was performed for winter (December–February), spring (March–May), summer (June–August), and autumn (September–November). Our results have recorded 39,933 individual cyclone tracks, where the majority (25,265 cyclones; 63.3%) are short-lived (24–72 h). Regionally, the western Mediterranean has the highest cyclone density, followed by the Black Sea and the eastern Mediterranean. While there is only a small increase in total numbers, a notable increase in cyclone activity is observed during the summer months, particularly in August, with a statistically significant rise of 18.4% since 1980 across the whole Mediterranean region. In the western Mediterranean, this August intensification was even 23.8%. As a result of this, the annual peak of cyclone activity has shifted from May/June to August.
1. Introduction
The Mediterranean basin is a hotspot for the development of low-pressure systems that have strong impacts on weather extremes such as heavy precipitation, strong winds, and coastal flooding [1,2]. These lows are referred to as “Mediterranean low-pressure systems” or “Mediterranean cyclones”, where we will use the latter term throughout the paper. These cyclones are primarily caused by baroclinic instability and adiabatic processes, like extra-tropical storms [2,3]. They are generally smaller and shorter-lived than cyclones that form over open oceans of mid-latitudes [3]. In combination with the strong spatial and temporal variability in the Mediterranean climate [4,5], this makes it difficult to detect and track them [6]. Although some Mediterranean cyclones originate from Atlantic low-pressure systems intruding into the region, approximately 85% of cyclones are estimated to form within the Mediterranean basin itself [3].
Due to air–sea thermodynamic disequilibrium, Mediterranean cyclones can further intensify into strong hurricane-like systems, which are generally described as Medicanes [7], which can occur in any season. Medicanes are responsible for many extreme weather events, such as extreme rainfall and strong winds. For instance, “Daniel”, which occurred in the eastern Mediterranean from 3 to 11 September 2023, caused severe damage in several countries, including Greece, Turkey, Bulgaria, and Libya, and claimed approximately 10,000 casualties, with damages estimated to cost over USD 20 billion [8]. Medicanes are particularly common in the eastern Mediterranean and a similar phenomenon is also observed in the western Mediterranean.
Climate change is intensifying in the Mediterranean region and temperatures there are rising faster than the global average [2]. It is important to investigate the impact of climate change on the frequency of cyclones in the Mediterranean. However, the small size and complex properties of these systems make them challenging to identify and represent in climate models [9,10]. Regional climate model simulations suggest that a 3 °C increase in sea surface temperature could favor the formation of true hurricanes in the Mediterranean, although these models do not provide clear estimates of the fluctuations in cyclone intensity and frequency [11]. Some studies, including Med-CORDEX projections, suggest that a 2 °C temperature increase would lead to a decrease in the frequency of Mediterranean cyclones but an increase in their intensity [12]. A decrease in cyclone frequency is associated with intensification of anticyclonic conditions, while an increase in intensity is linked to higher sea surface temperatures.
A widely used method for identifying cyclones involves detecting local minima of geopotential height (gph) that coincide with the core of low-pressure systems [13]. This method has been frequently employed in global and regional cyclone tracking studies that particularly focus on the Mediterranean [14]. The gph minima-based method also has some limitations in the Mediterranean, primarily due to the small spatial extent of Mediterranean cyclones compared to those in other regions. The region’s complex topography often distorts pressure fields [15], and baroclinic interactions can lead to rapid cyclone intensification and dissipation [6].
Recent developments include the application of machine learning techniques [16]. Cyclone statistics can vary considerably between datasets with different spatial and temporal resolutions, even when using the same tracking methods [17]. High-resolution datasets allow for the capturing of a larger number of systems with more detailed characteristics [18]. Geopotential height minima at specified pressure levels, often used to track cyclones, are also filtered to remove transient noise by applying constraints based on spatial coherence and a minimum duration [13].
This study analyzes the cyclone frequency in the Mediterranean region from 1940 to 2024 using ERA5 reanalysis data. Cyclones are tracked independently at three pressure levels (1000 hPa, 850 hPa, and 700 hPa) to apply a vertical matching criterion. Only captured cyclones that were matched at one of the upper levels were retained. This filtering removes systems that occur only at one level, caused by several factors.
In this study, the Mediterranean region is defined as the Mediterranean Sea, the Black Sea and a 150 km inland buffer zone along the coast. The aim is to track low-pressure systems from the Mediterranean itself that are directly affecting the region. Investigating long-term variability in the frequency of low-pressure systems is crucial for understanding cyclogenesis and seasonal triggering mechanisms.
Despite extensive research on Mediterranean cyclones, significant uncertainties regarding their long-term variability exist due to the differences in detection methods, spatial resolution, and inconsistencies in datasets. In particular, existing studies rely on detection methods applied to a single pressure level or matching criteria implemented between two vertical pressure level fields, often limited to shorter time periods. This can inhibit the representation of the vertical structure and long-term evolution of these systems. To overcome these limitations, this study uses ERA5 reanalysis data over an extended period from 1940 to 2024 and applies multi-stage matching criteria, which enable more precise identification of Mediterranean cyclones and provide a comprehensive assessment of their frequency and long-term variability in the region.
Section 2 describes the materials and methods, including data sources (Section 2.1), the detection and tracking algorithm (Section 2.2), and multi-stage matching and filtering criteria (Section 2.3). Section 3 presents results discussing annual distribution (Section 3.1), and seasonal distribution (Section 3.2) detailing the frequency of cyclones in winter (December–January–February, DJF), spring (March–April–May, MAM), summer (June–July–August, JJA), and autumn (September–October–November, SON) across the entire Mediterranean region (Section 3.2.1) and its subregions: the western (Section 3.2.2) and eastern Mediterranean (Section 3.2.3) and the Black Sea (Section 3.2.4). Further sections compare monthly cyclone activity over two periods (1940–1980 vs. 1981–2024; (Section 3.3)) and examine cyclone duration (Section 3.4). Section 4 concludes the study with a summary of the main findings and a following Appendix A, where annually resolved plots have been discussed.
2. Data and Methodology
This study implements multi-step and multi-stage algorithms for detection of low-pressure systems and tracking of cyclones over the entire Mediterranean Sea using ERA5 reanalysis data. The methodology combines feature detection, spatiotemporal tracking, and multi-level matching to identify cyclones at three pressure levels, ensuring robust identification of cyclones present at different levels. The method used for cyclone detection and tracking is based on local minima of geopotential height (gph).
The results are visualized using annual monthly and seasonal plots (1940–2024) and mean monthly and seasonal (1941–2020) plots for decades. Monthly plots illustrate the observed monthly frequencies with the corresponding seasonal means, while decadal plots emphasize the variation in mean monthly and seasonal averages.
Long-term trends in cyclone frequency are evaluated using the non-parametric Mann–Kendall test (MK) [19] for the whole period from 1940 to 2024. The associated Sen’s slope [20] estimator was used to quantify the rate of change in cyclones per year. A Mann–Whitney test (MW) [21] was used to identify the direction and significance of trends between the two periods discussed in Section 3.3. The statistical significance of each trend was assessed using the corresponding p-value (p = 0.05).
2.1. Data
This study used ERA5 reanalysis data [22] from the European Centre for Medium-Range Weather Forecasts (ECMWF), covering the period of (1940–2024), corresponding to ≈28 km in latitude and ≈20 km in longitude in our study area. ERA5 is selected because of its high spatial (0.25°) and temporal (hourly) resolution, its advanced data assimilation system and its long-term coverage (1940 to present), which together provide a better representation of Mediterranean cyclones compared to previous reanalysis datasets.
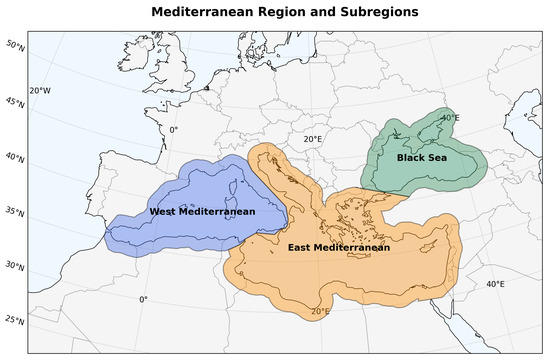
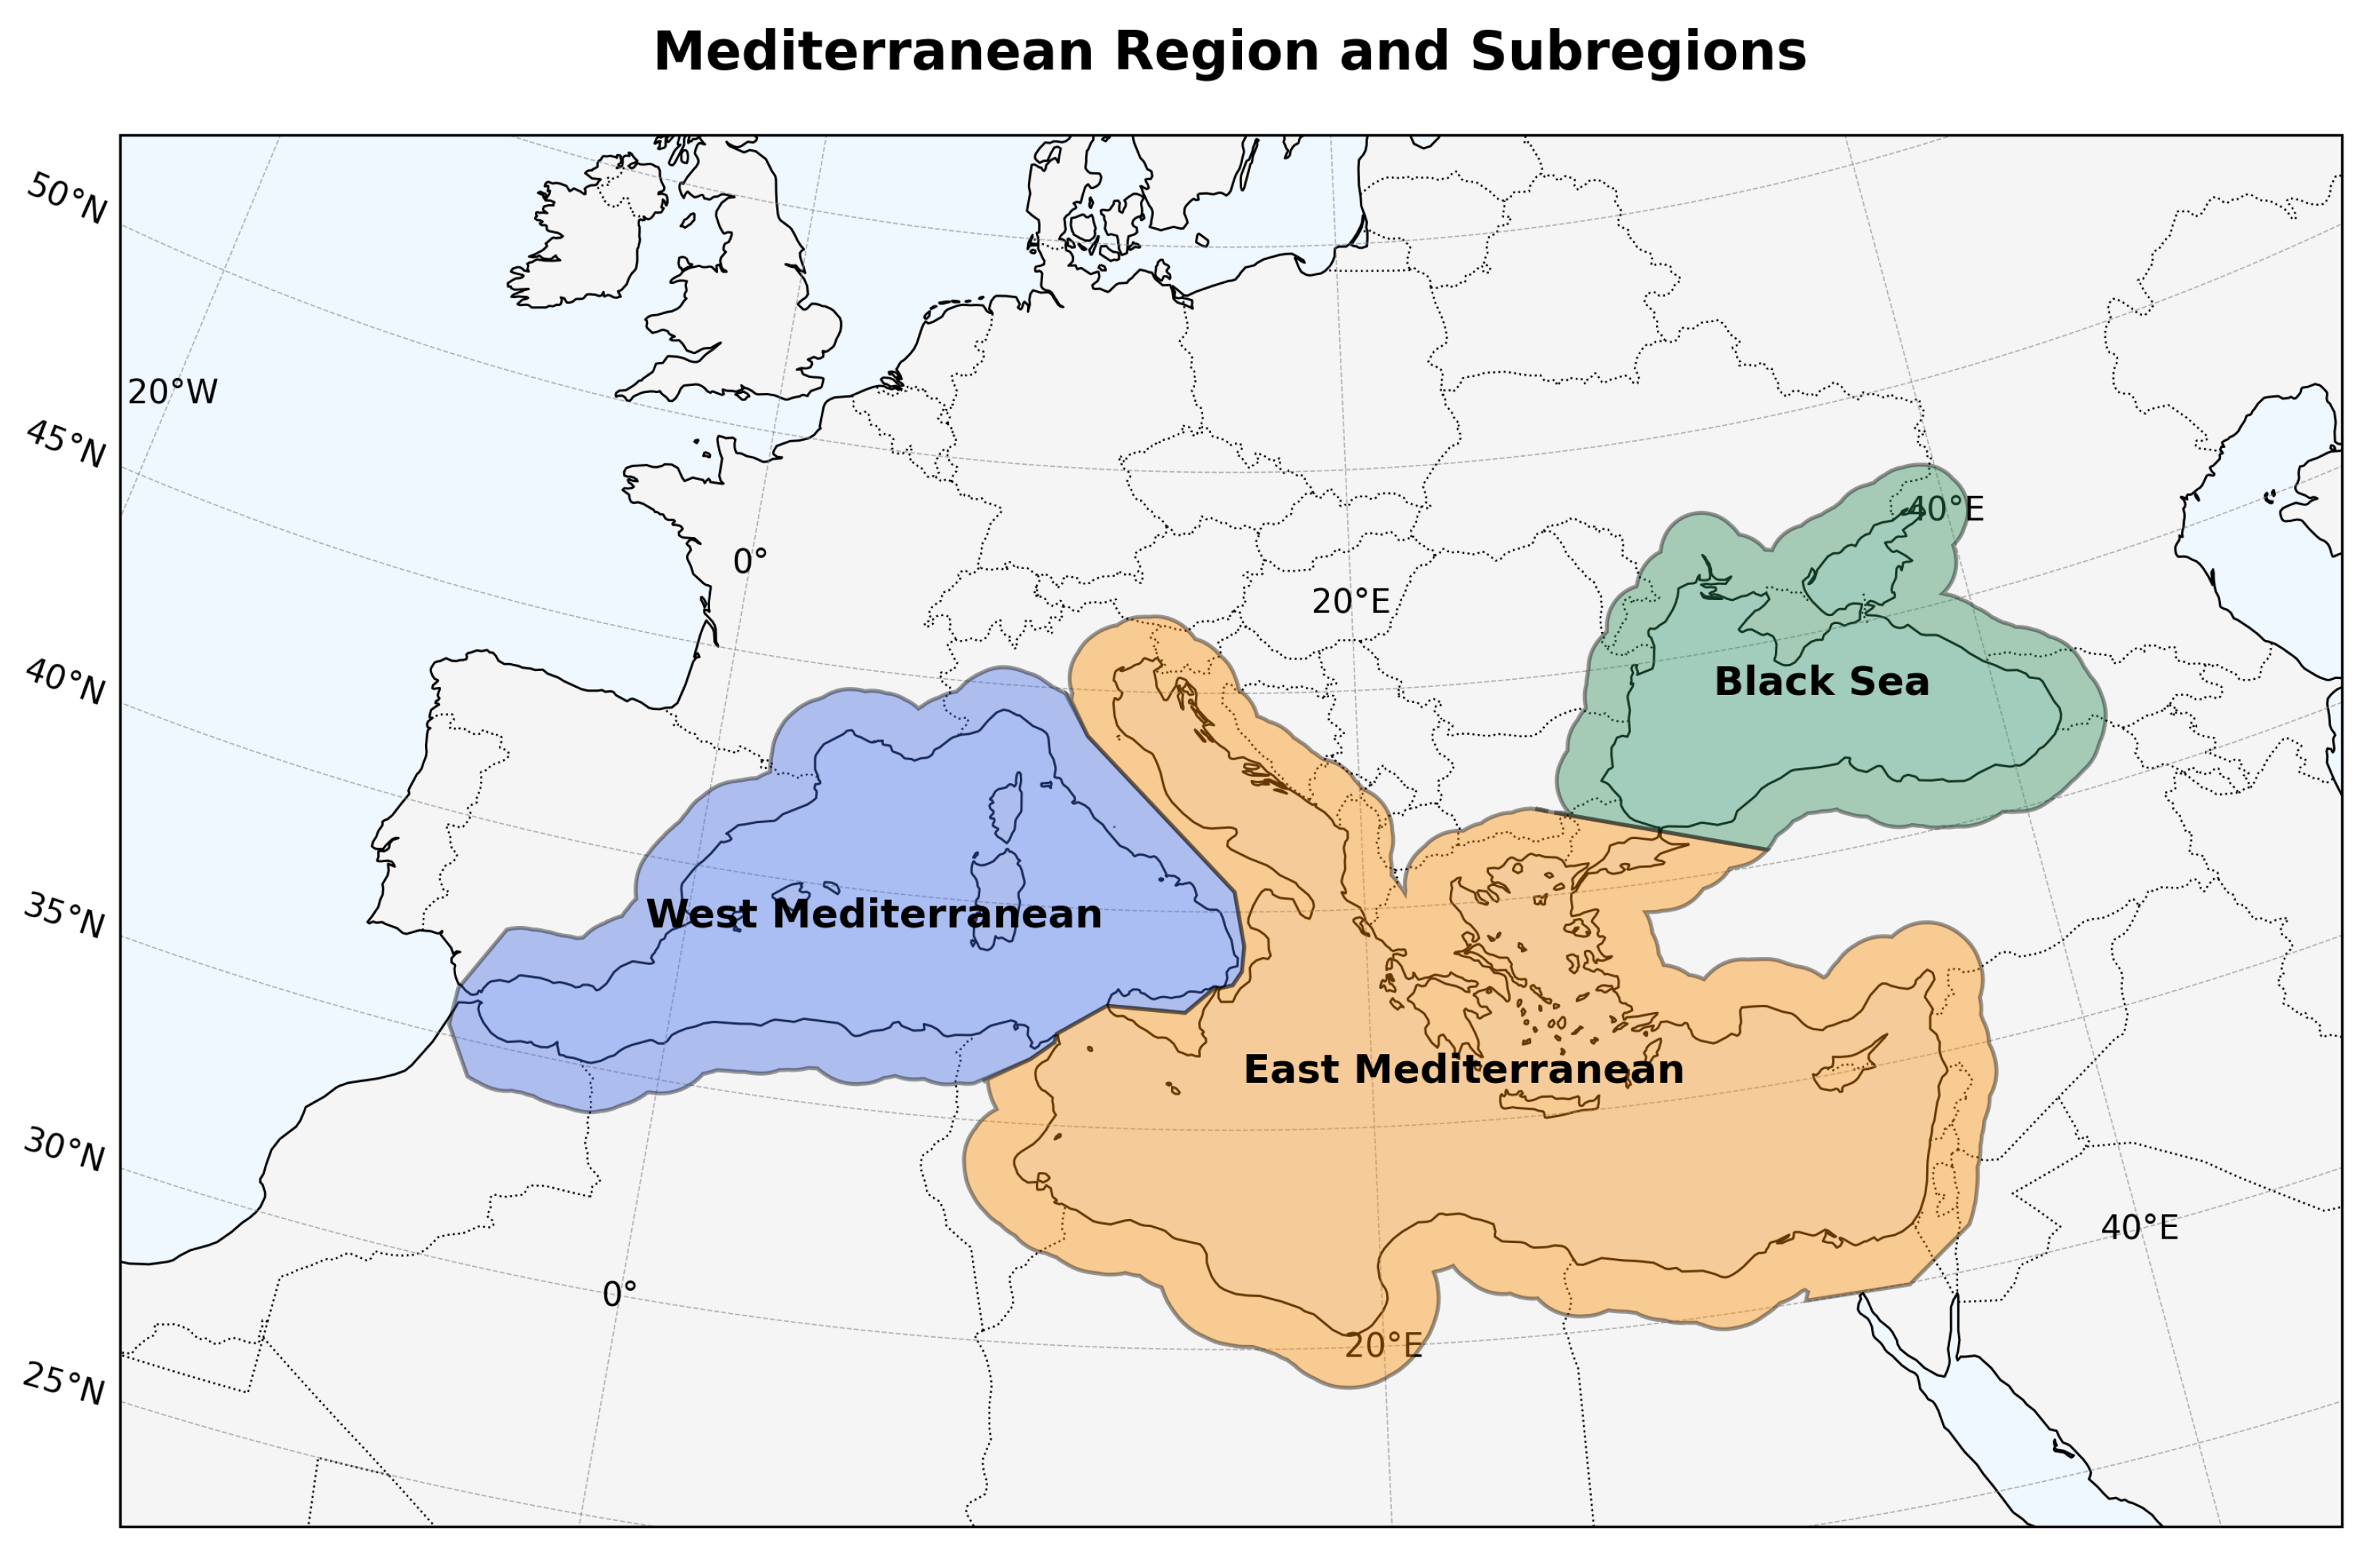
The geopotential height (Z) is used at three pressure levels (1000 hPa, 850 hPa and 700 hPa) for the analysis. Cyclones are first tracked within a domain (26 to 55 N, 12 W to 44 E) in order to understand the complete life cycle of the cyclones. In the second step, we only count the cyclones emerging or appearing over the Mediterranean Sea and its surrounding land within a 150 km range from the coast. Based on the area selected, the entire Mediterranean region (5.07 million km2) is divided into two sub basins, i.e., east (2.79 million km2) and west (1.38 million km2). The Black Sea (0.89 million km2), which is technically a part of the eastern Mediterranean, has been separated to distinguish and discuss it separately while comparing the two prominent basins as illustrated in Figure 1. These divisions of the Mediterranean into western and eastern regions follow the standard hydrographic classification defined by the International Hydrographic Organization. This division is widely used and provides a consistent geographical framework for regional analysis.
Figure 1.
The Mediterranean sea and its two subregions (east and west) based on the boundaries established by the International Hydrographic Organization in its 3rd edition [23], with the limit defined by a line from Cape Paci to Cape Peloro in the strait of Messina and then to Cape Lilibeo and Cape Bon in the strait of Sicilia. The regions are then coupled by additional adjustment to divide Sicily and mainland Italy between both basins, and the Black Sea is further separated from the eastern Mediterranean through the Bosporus Strait.
2.2. Detection and Tracking
The algorithm developed in this study follows 3 of the 4 steps used by Hofstätter et al. [24,25], but slightly differs in value selection and filtering criteria. The three steps of analysis include detection of low-pressure systems at time t based on local minima, association of cyclone between time t and and finally removal of spurious cyclone tracks through filtering criteria.
Previous studies have shown that cyclone identification is sensitive to both data resolution and filtering thresholds. A lower spatial and temporal resolution of data does not allow for a good coverage of very small and short-lived systems, thus decreasing the cyclone track density and cyclone counts [26]. The number of cyclones are also dependent on the chosen algorithm and the dataset used [13,14,27]. It is particularly difficult to detect weak, thermally driven summer systems, which may be short-lived, especially over low-resolution dataset. The complex topography of the region can also distort classical identification fields like mean sea-level pressure [5].
In this study, the algorithm and monitoring criteria on a higher-resolution dataset allow for the detection of weak systems neglected when using a coarser resolution. Additional constraints are applied, which is explained in the next section (Section 2.3). For each pressure level at hourly time steps, the geopotential height is smoothed by using a 2D Gaussian filter to minimize the noises while retaining the synoptic scale features. The smoothing kernel is given as:
where (standard deviation in grid-index space), corresponding to ≈20–28 km in our study domain. While, x and y are the zonal and meridional distances from the point for which the smoothing is calculated; as this parameter increases, the smoothing on the gph field becomes stronger. This implies that spatial variability at scales below ≈60–80 km is strongly attenuated, while larger-scale structures are retained.
For the detection of low-pressure systems, a grid point value is considered as a minimum if it has a lower value than all the surrounding 8 grid points [28]. This approach may introduce a bias toward slower-moving systems, as fast-moving cyclones may not always exhibit a well-defined minimum at a given time step. Cyclones in the Mediterranean generally move slower and fast-moving systems are relatively rare compared to other cyclones in the Northern Hemisphere [29], suggesting that this bias is likely limited in the present study.
Cyclone centers in the smoothed field for each hourly time step are identified as the local minimum in the geopotential height field. This can equivalently be achieved by detecting the local maximum over an inverted geopotential height field . Initial center detection is applied within a window whose center has a lower value than its eight neighboring points. At the same time t, another local minimum is only considered as an independent low-pressure system if it has a minimum distance of 3 grid points in each direction (≈75 km at our resolution).
Tracks are configured by associating the identified minima centers between the two time steps by using a nearest neighbor approach [4,30]. To form a continuous track, cyclone positions at time t (, ) were linked to successive coordinates at time (, ). The great spatial distance range d between the two time steps is calculated as:
where km is the Earth’s mean radius, and .
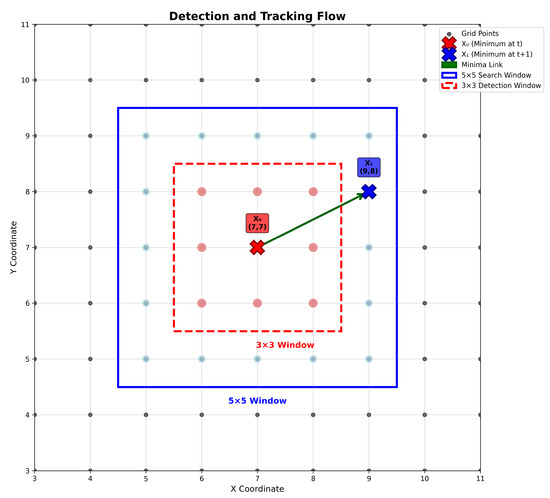
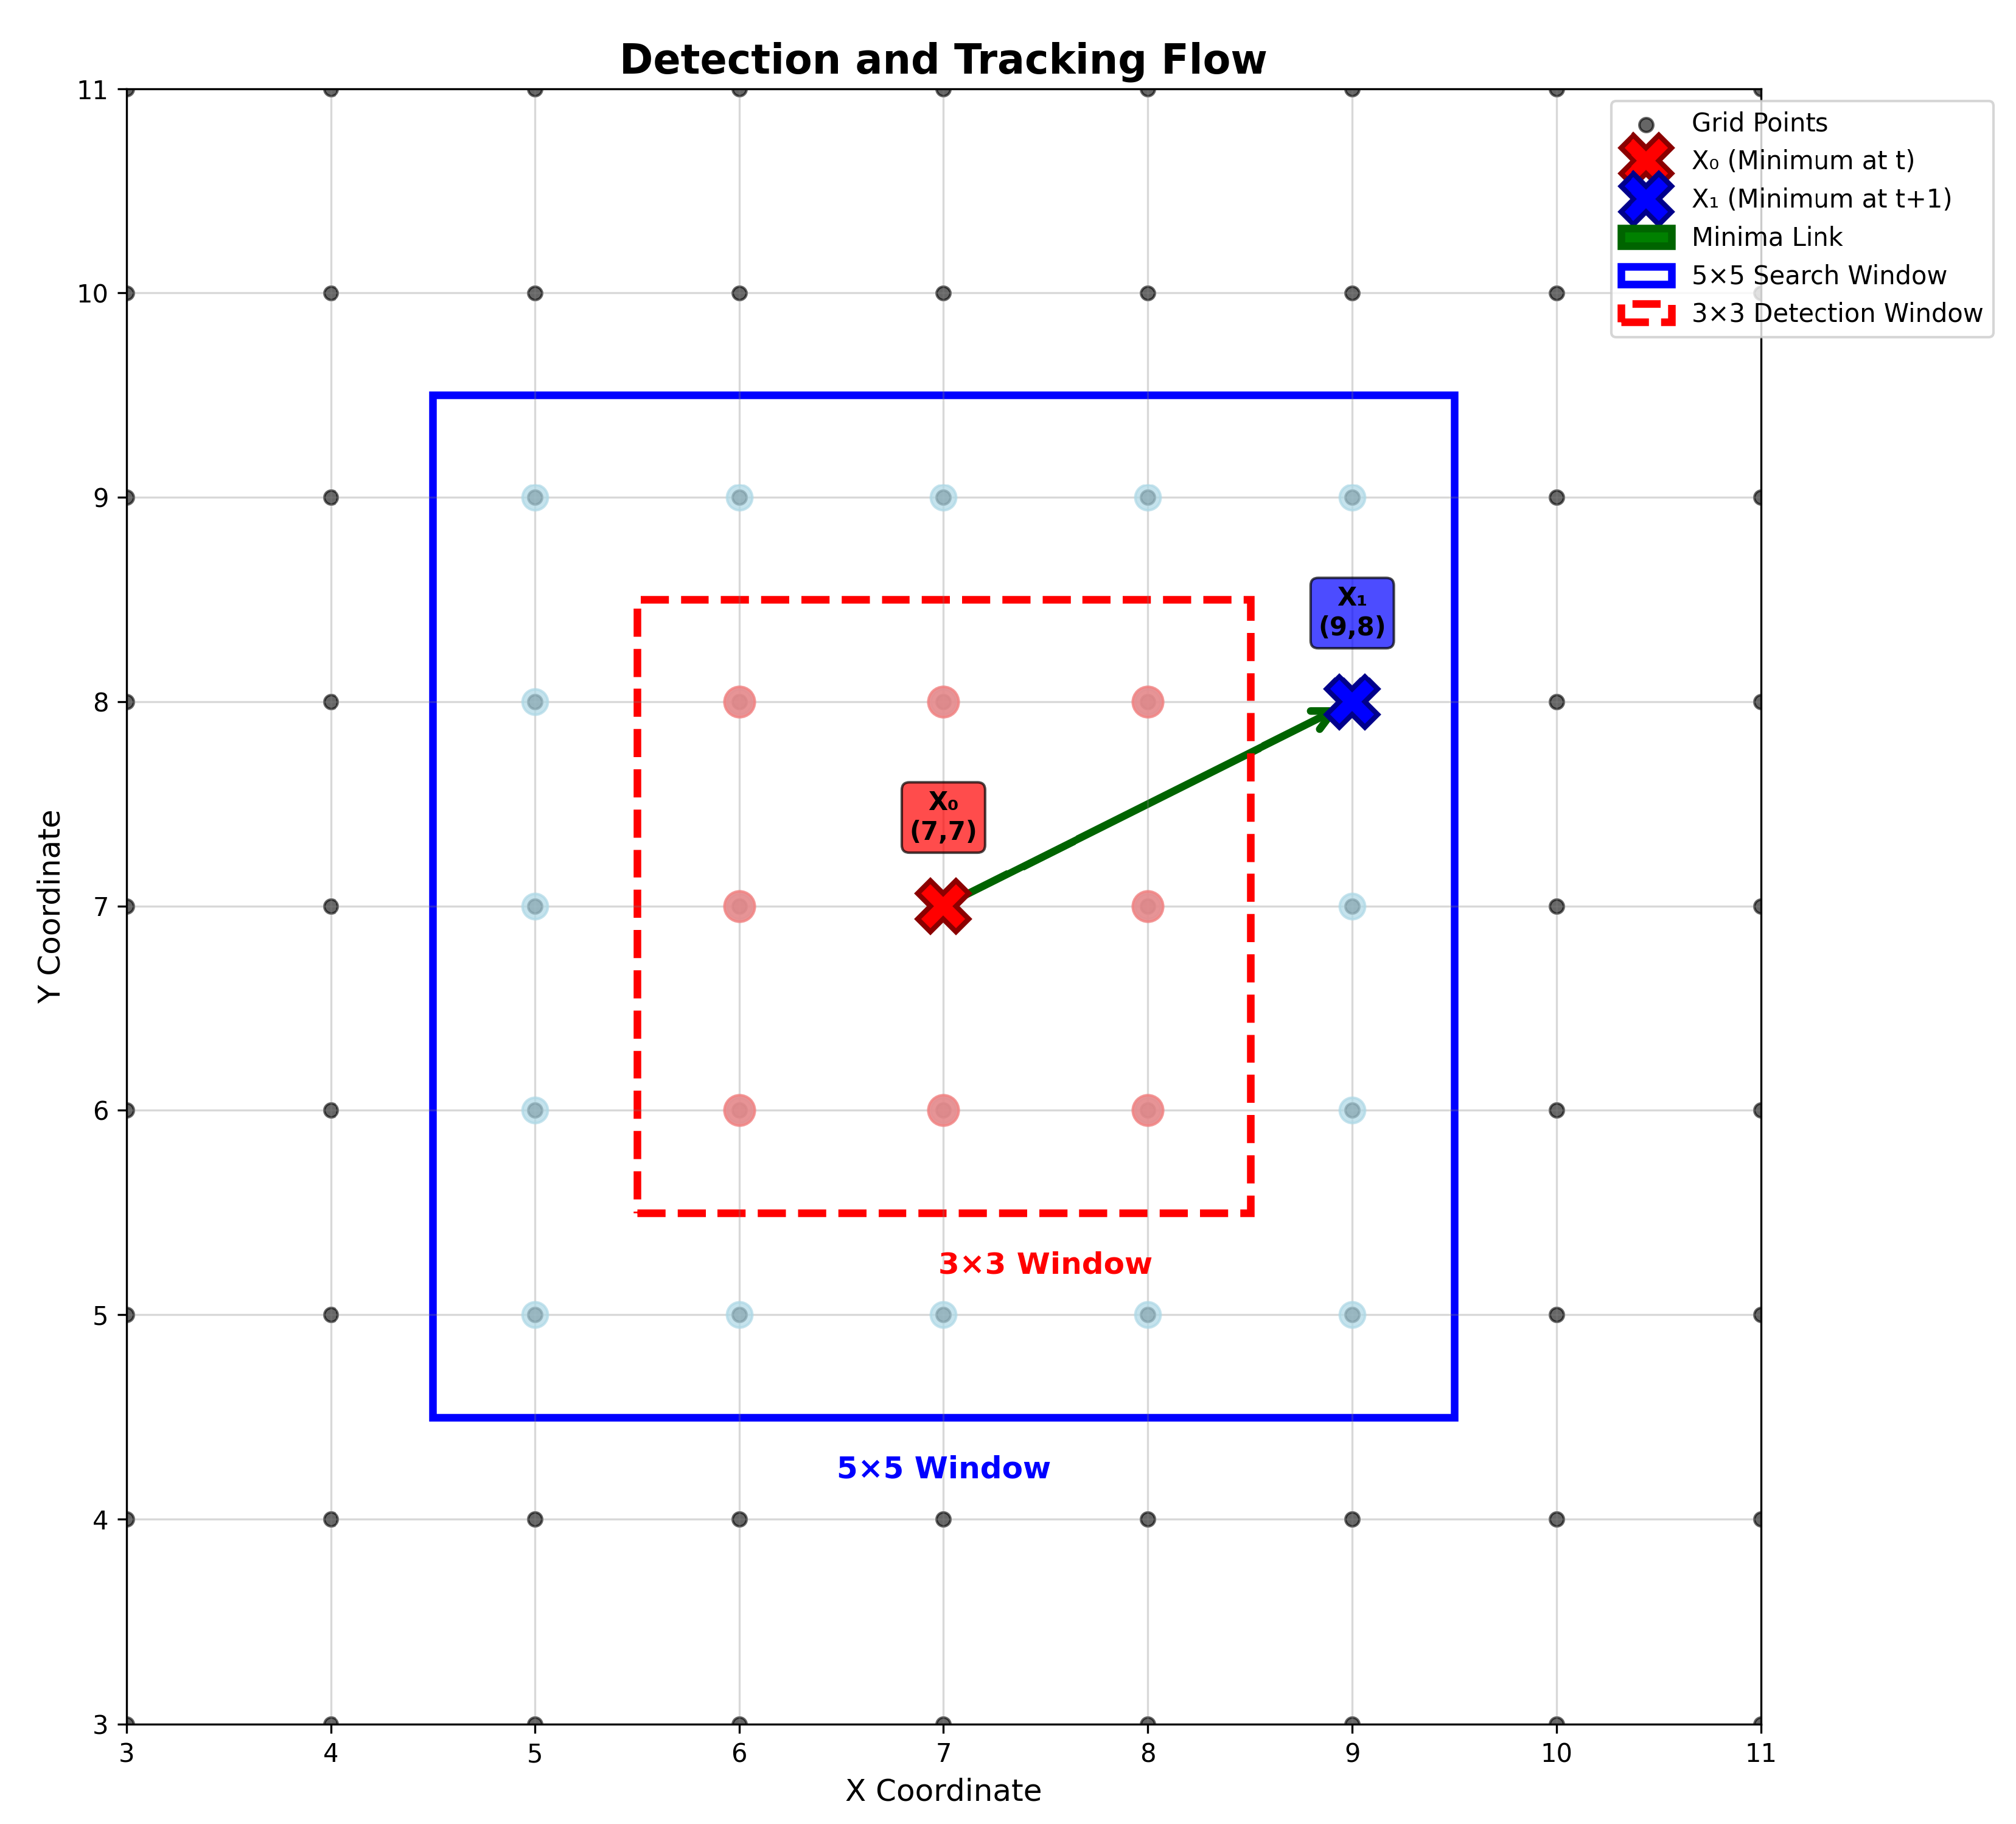
The maximum shift between the two time steps is limited to two grid points in any direction, i.e., from position (7, 7) to any position within the window in blue defined in Figure 2, corresponding to ≈40 to ≈65 km, depending on direction.
Figure 2.
Methodology for detecting and tracking minima in a discrete grid. The red dashed line delimits the 3 × 3 detection window around , in which local minima are identified at time t. The solid blue line represents the 5 × 5 search window used at time to find minima associated with . The green arrow illustrates the temporal relationship between the positions of successive minima, thus showing the tracking process from detection to tracking.
If no cyclonic center is detected at the next hourly stage, the algorithm searches for a suitable minimum within the same spatial window for up to twelve hours. If no continuity is found during these twelve hours, the track is concluded. A similar 12 h criterion has also been used in a previous study [31], while a 24 h criterion has been used for matching one event at two different pressure levels [32].
2.3. Multi-Level Matching and Filtering Criteria
To study the significant cyclones with strong characteristics, the tracks are further filtered to obtain reasonable results. To reduce spurious identifications, only tracks covering a minimum displacement of 600 km are retained. This spatial threshold is consistent with established practices for filtering out short-lived, quasi-stationary disturbances and isolating meteorologically relevant cyclones [13,33]. To isolate vertically coherent systems and mitigate the inclusion of shallow surface noise, a multi-level matching procedure was implemented. The tracks are first identified at three atmospheric levels independently, and then tracks at 1000 hPa (near surface) are retained only if they match with the tracks at 850 hPa or 700 hPa or with both levels. Remaining tracks that could not be matched to either the level of 850 hPa or 700 hPa were discarded as likely shallow surface noise.
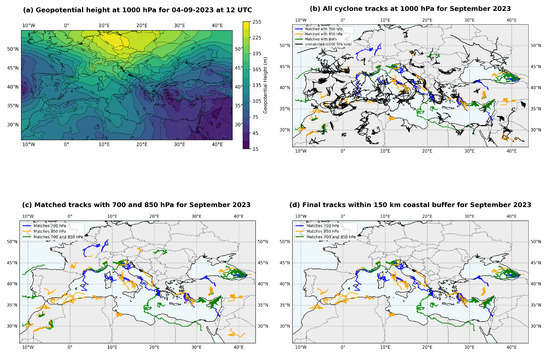
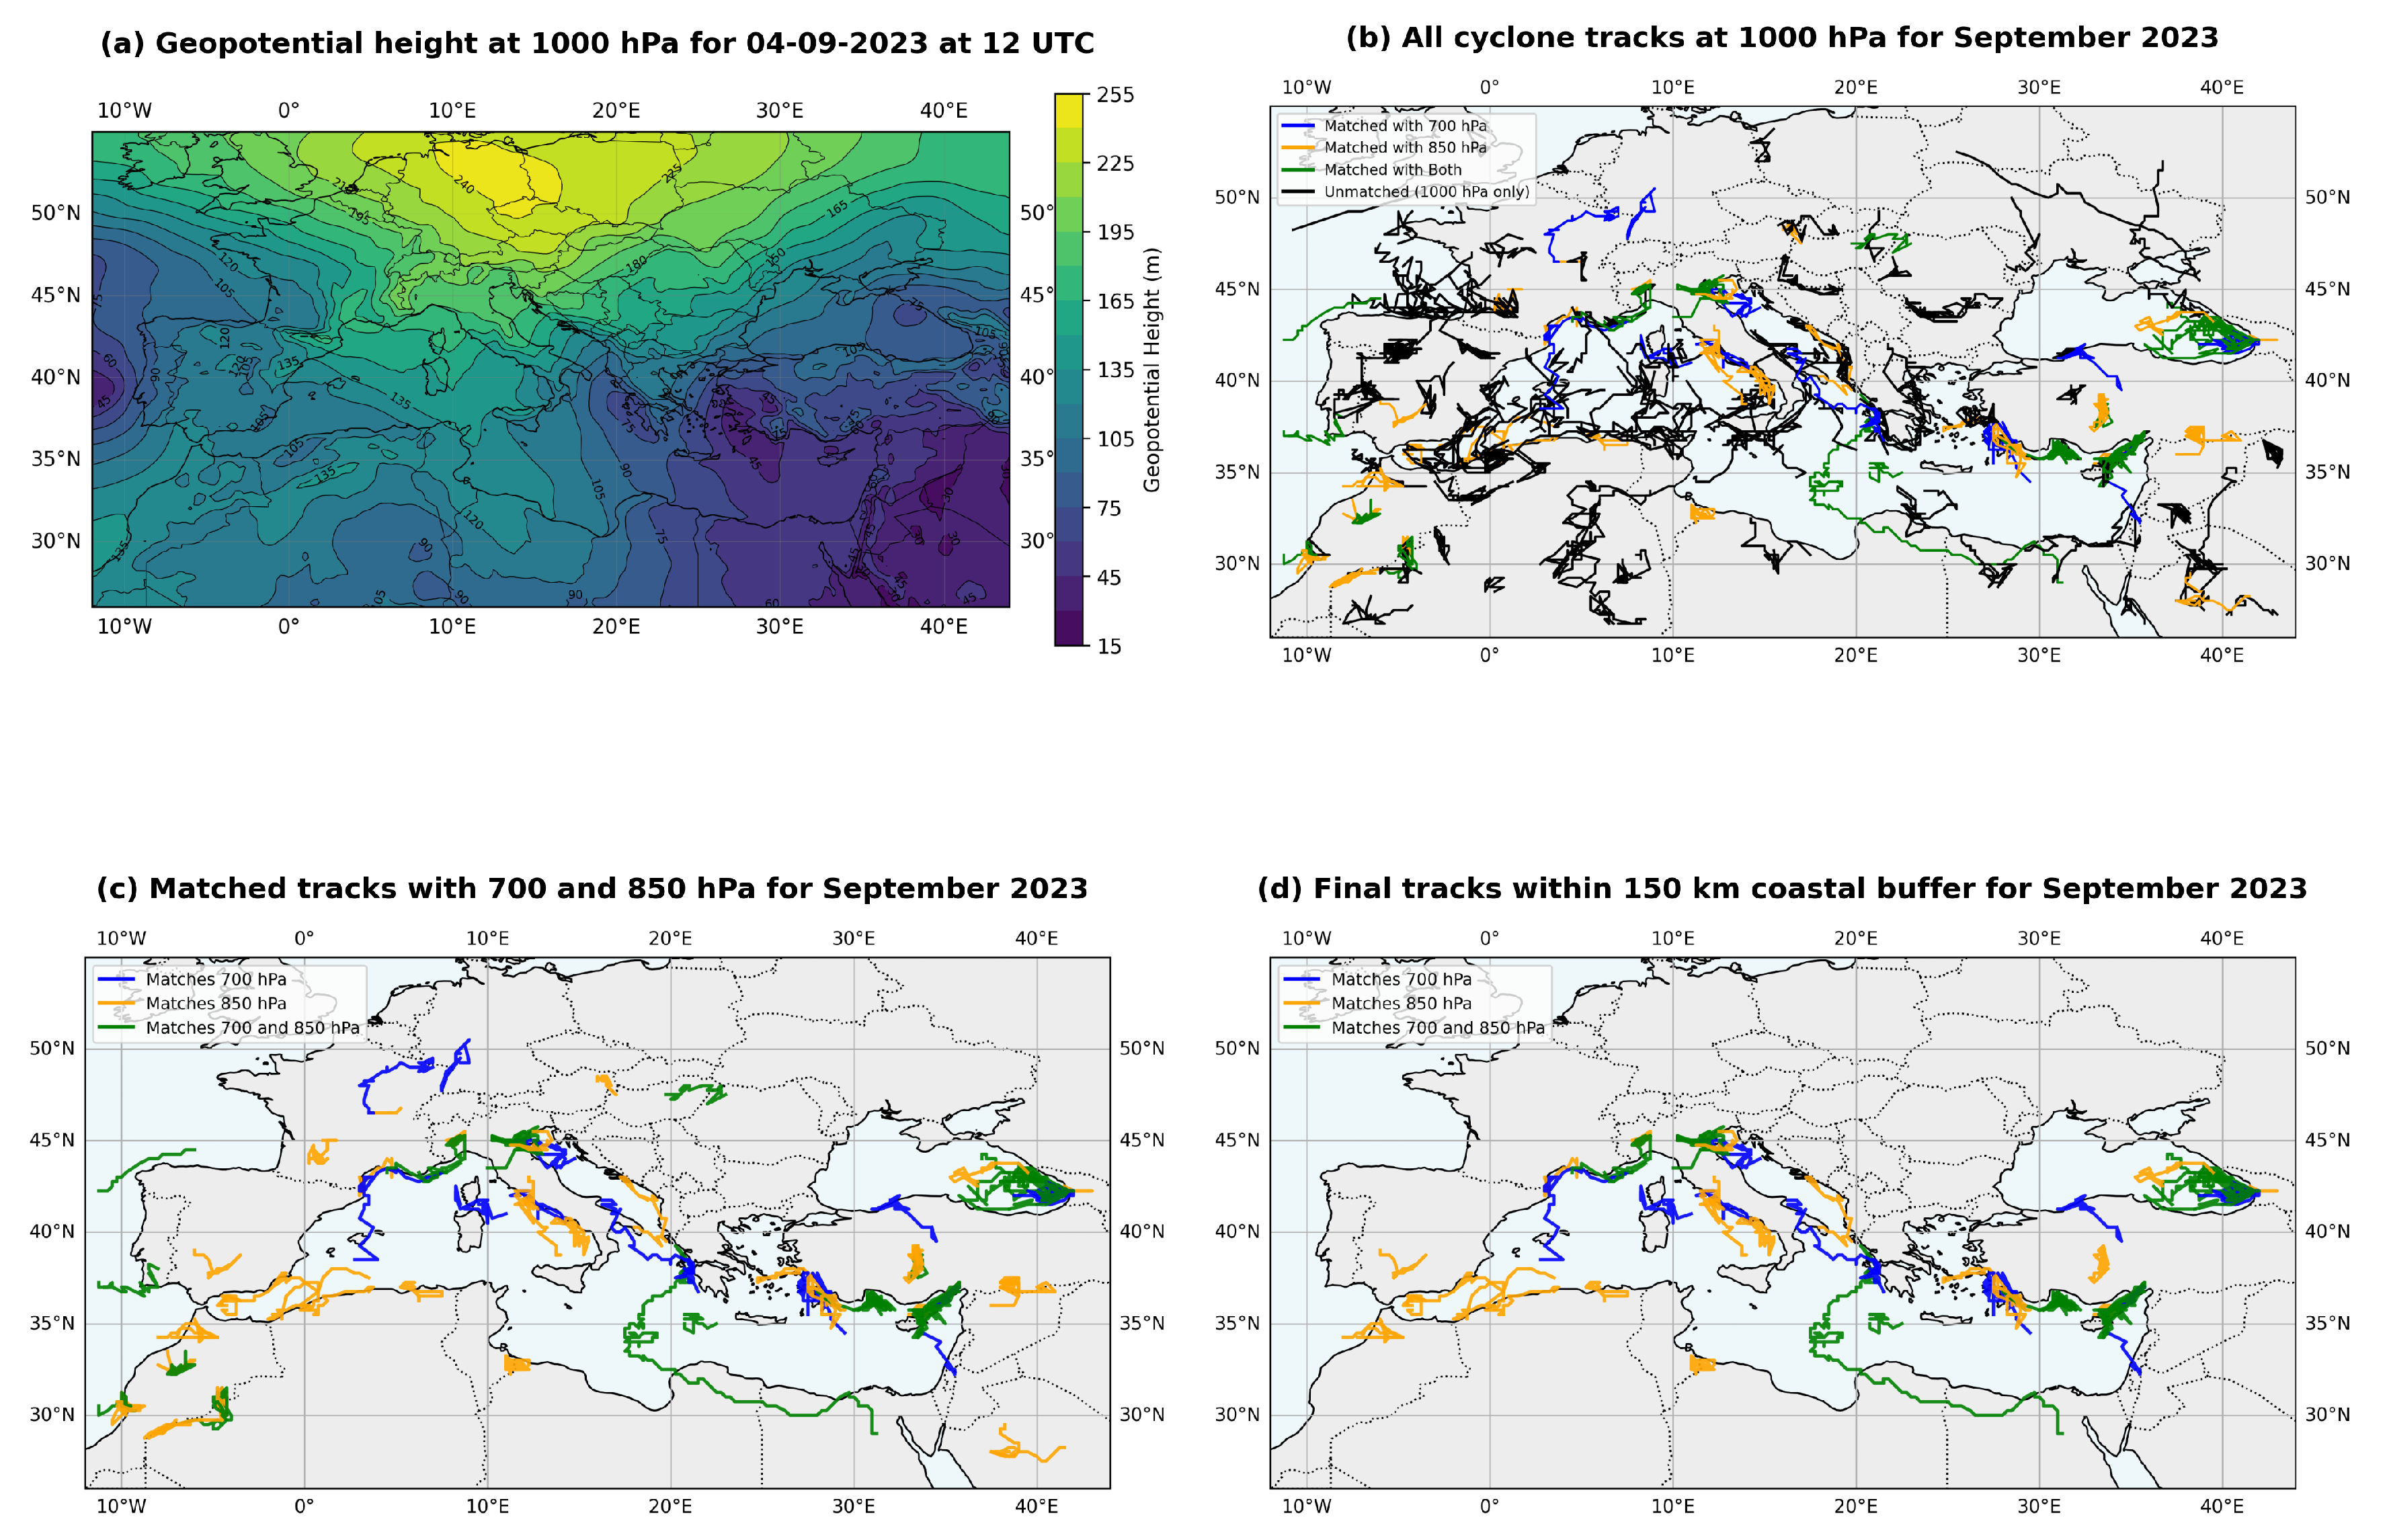
Multi-level matching was performed using spatial and temporal overlap criteria. For a match to occur, tracks need to share at least 6 h of concurrent activity, with mean separation distances not exceeding 200 km for 850 hPa and 300 km for 700 hPa, since surface lows can be displaced hundreds of kilometers from their associated upper-level features [34]. This methodology for validating vertical coherence is adapted from the multi-level approach of Hofstätter et al. [25], where a temporal overlap of 18 h and a median distance of less than 1000 km was used for a specific cyclone type (Vb). The multi-step cyclone detection and tracking workflow, including identification, tracking, vertical matching, and filtering, is illustrated in Figure 3.
Figure 3.
Illustration of the multi-step cyclone detection and tracking workflow. (a) Geopotential height of 1000 hPa on 4 September 2023 at 12 UTC, showing the pressure field pattern over the Mediterranean region. (b) All cyclone tracks detected at 1000 hPa based on local minima in gph and combined tracks according to the nearest neighbor approach. (c) Vertically matched cyclone tracks associated with 700 hPa and/or 850 hPa levels. (d) Final set of tracks at 1000 hPa restricted to those within 150 km of the Mediterranean coastline, representing cyclones directly influencing the basin.
Our study aims to capture a full spectrum of Mediterranean cyclones, which are typically of smaller scale, likely thermal lows. A stricter distance threshold (200–300 km) is necessary to ensure a genuine vertical stack and to avoid erroneously linking separate, co-existing systems within the complex Mediterranean environment. Therefore, we selected the 1000 hPa level as our primary reference to capture the maximum population of low-pressure systems, including those with strong surface expressions. The multi-level matching then serves to distinguish deep, vertically coherent cyclones from shallow surface noise, which is more prevalent at 1000 hPa. This strategy ensures a more comprehensive census of Mediterranean cyclones while maintaining a focus on meteorologically significant, deep systems.
The tracks are restricted to being in the Mediterranean region; therefore, any track that did not have at least one point within the defined Mediterranean polygon (including a 150 km inland coastal buffer) is excluded in order to study the systems appearing within the region or directly affecting the region.
It is important to note that this study does not apply intensity- or temperature-based filtering. Consequently, the observed systems may include weak, thermally driven low-pressure systems over the entire Mediterranean, particularly in summer. While the requirement for multi-level matching with 850 hPa and/or 700 hPa levels reduces the number of thermal lows, it does not entirely exclude them. The resulting dataset therefore represents a class of low-pressure systems explained in the section, and not exclusively intense baroclinic cyclones. However, strong and intense systems that are more frequent in winter would provide additional insight and allow for a more direct comparison with previous studies; this is beyond the scope of the current work and can be a good direction for future research.
3. Results and Discussion
3.1. Annual Cyclone Distribution
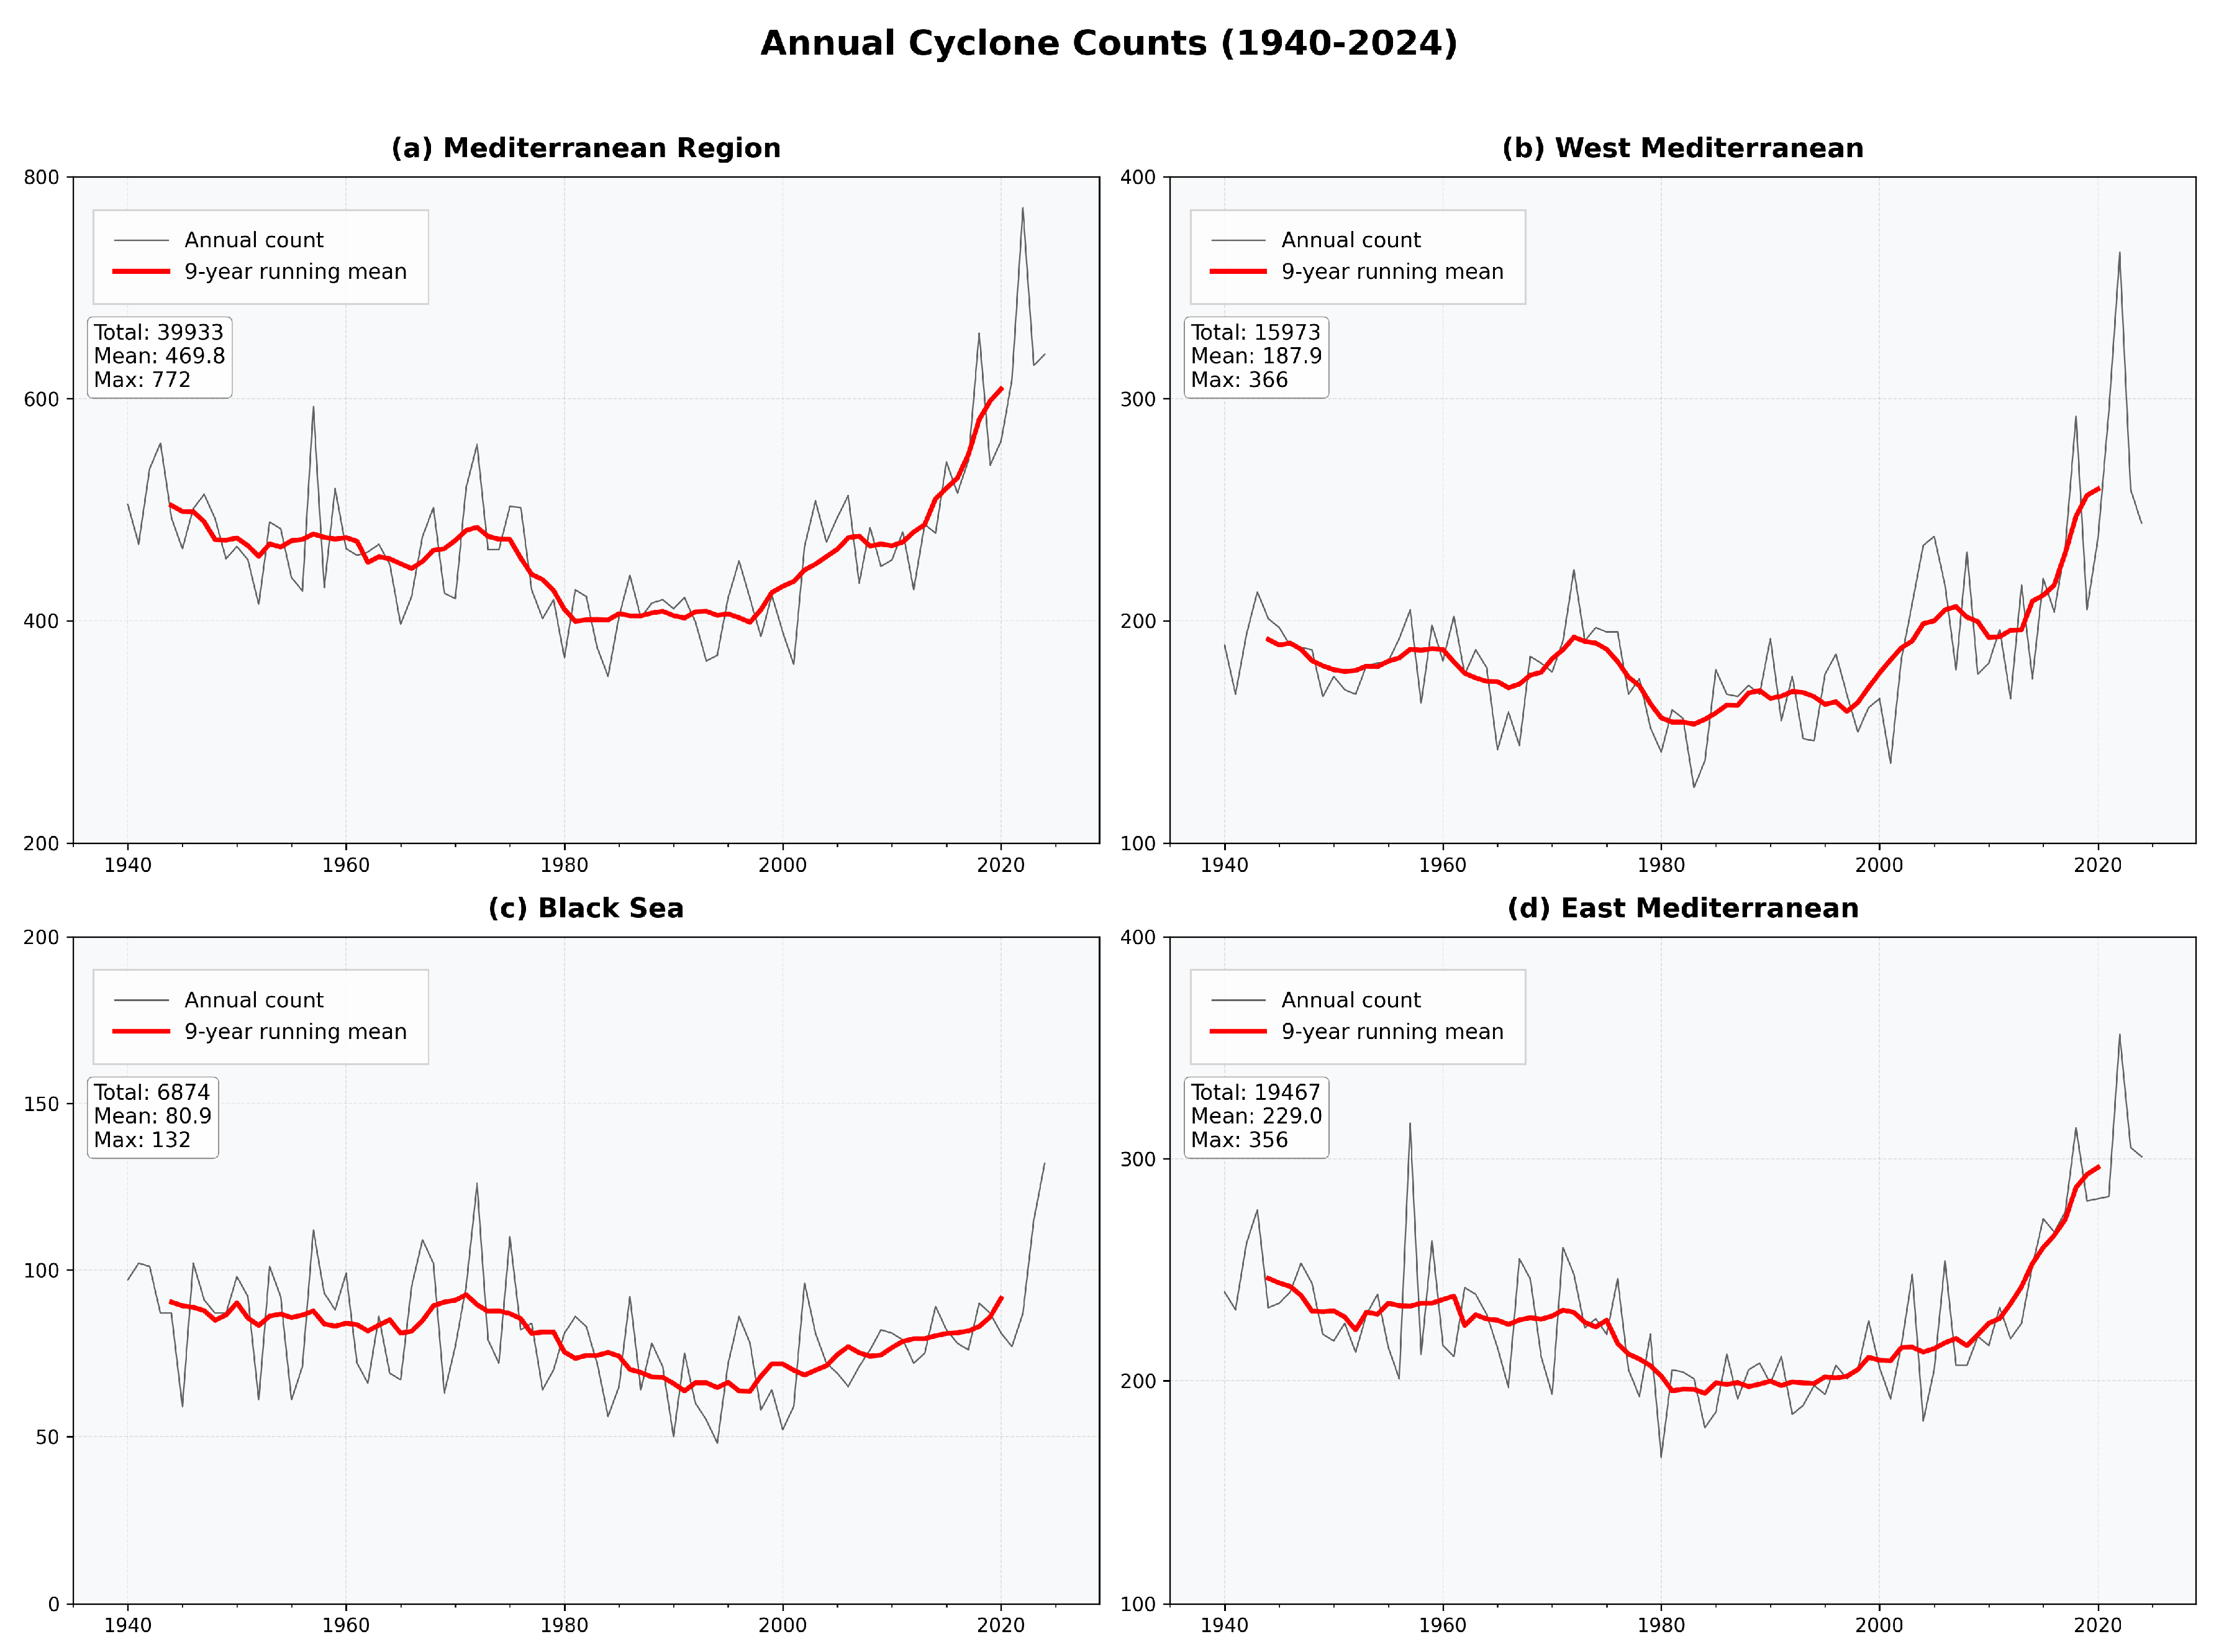
Figure 4 presents the annual cyclone frequency and the corresponding 9-year running mean for the whole study period of the entire Mediterranean region (a), and the three subregions, as defined in Section 2.1. Over the entire Mediterranean region (Figure 4a), 39,933 (0.78/100 km2) cyclone tracks were identified in total, corresponding to a mean annual frequency of 469.8 ± 15.3 (95% CI) cyclones, where the annual cyclone counts ranged between 350 and 772. Almost half of the cyclones (19,467, 0.69/100 km2) were observed in the eastern Mediterranean (average: 229 ± 7.5, range: 166–365). The west Mediterranean follows closely behind with a total of 15,973 (average: 187.9 ± 7.9, range: 125–366, 1.15/100 km2). The Black Sea, as the smallest basin, has the lowest cyclone frequency (total: 6874, average: 80.9 ± 3.6, range: 48–132, 0.76/100 km2).
Figure 4.
Interannual variability of cyclone track counts in the entire Mediterranean region from 1940 to 2024. The plots represent each region, where annual counts are presented by gray lines and their corresponding running means over 9 years by red lines. The y-axis scale differs between the regions, while it stays the same for the east and the west Mediterranean, allowing for a better comparison.
All regions show high interannual fluctuation; however, the 9-year moving average reveals a clear pattern of cyclonic activity that extends over several decades (Figure 4). In the Mediterranean and its subregions, distinct phases can be identified: a period of slightly decreasing cyclone frequency until ≈1980 is followed by an overall increasing trend with marked intensification after ≈1995. The consistency of the temporal trend across different regions suggests a major shift after ≈1980 in cyclonic activity, following the introduction of satellite observations after 1979 [22].
Sen’s slope reveals an increase of 0.12 cyclones per year for the entire region and the whole period from 1940 to 2024, corresponding to an overall 2.2% increase. A non-parametric Mann–Kendall test, however, reveals no significant trend (p = 0.69; = 0.03). This is not too surprising, given the large interannual variability and the general behavior discussed earlier, whereby a declining trend until ≈1980 followed by an overall increase neutralizes the annual trend over the study period. Based on the major shift between the two periods, we will separately look for a trend after 1980; therefore, we will later discuss different sub-periods (Section 3.3) and, in Section 3.2, we investigate whether trends are more pronounced in different seasons.
Previous studies have revealed significant variations in the number of cyclones in the Mediterranean depending on the detection and monitoring methods used. For example, the comparative IMILAST project [14], which evaluated 15 different detection and tracking methods using ERA Interim data for the period 1989–2009, found significant differences in cyclone statistics and highlighted the sensitivity of the results to methodological choices. Similarly, Lionello et al. [29] applied 14 of these methods over a longer period (1979–2008) and highlighted an annual number of cyclones ranging from 62 to 474 in the entire Mediterranean region (using a similar definition to ours).
The relatively higher number of cyclones identified in this study can be attributed to several factors. Methodological differences play a crucial role: the choice of variables (e.g., geopotential height relative to mean sea level pressure or vorticity), the identification methods, the filtering criteria, thresholds (such as minimum displacement) and differences in tracking algorithms.
Another important factor is the underlying dataset and its resolution. The use of high-resolution ERA5 reanalysis data (0.25° and hourly output) allows for better detection of small-scale, short-lived cyclones compared to ERA Interim (1.5° and 6 h resolution). A coarser resolution fails to capture small-scale cyclones [27]; however, we have not discussed a systematic comparison of our method with respect to the sensitivity of the data resolution.
Cyclone numbers can also vary with respect to the data preprocessing, such as smoothing, which can affect results. Considering these factors, the higher number of cyclones detected in this study is consistent with the use of high-resolution data and a detection model that covers a broader range of cyclonic systems.
3.2. Seasonal Cyclone Distribution
3.2.1. Mediterranean Region
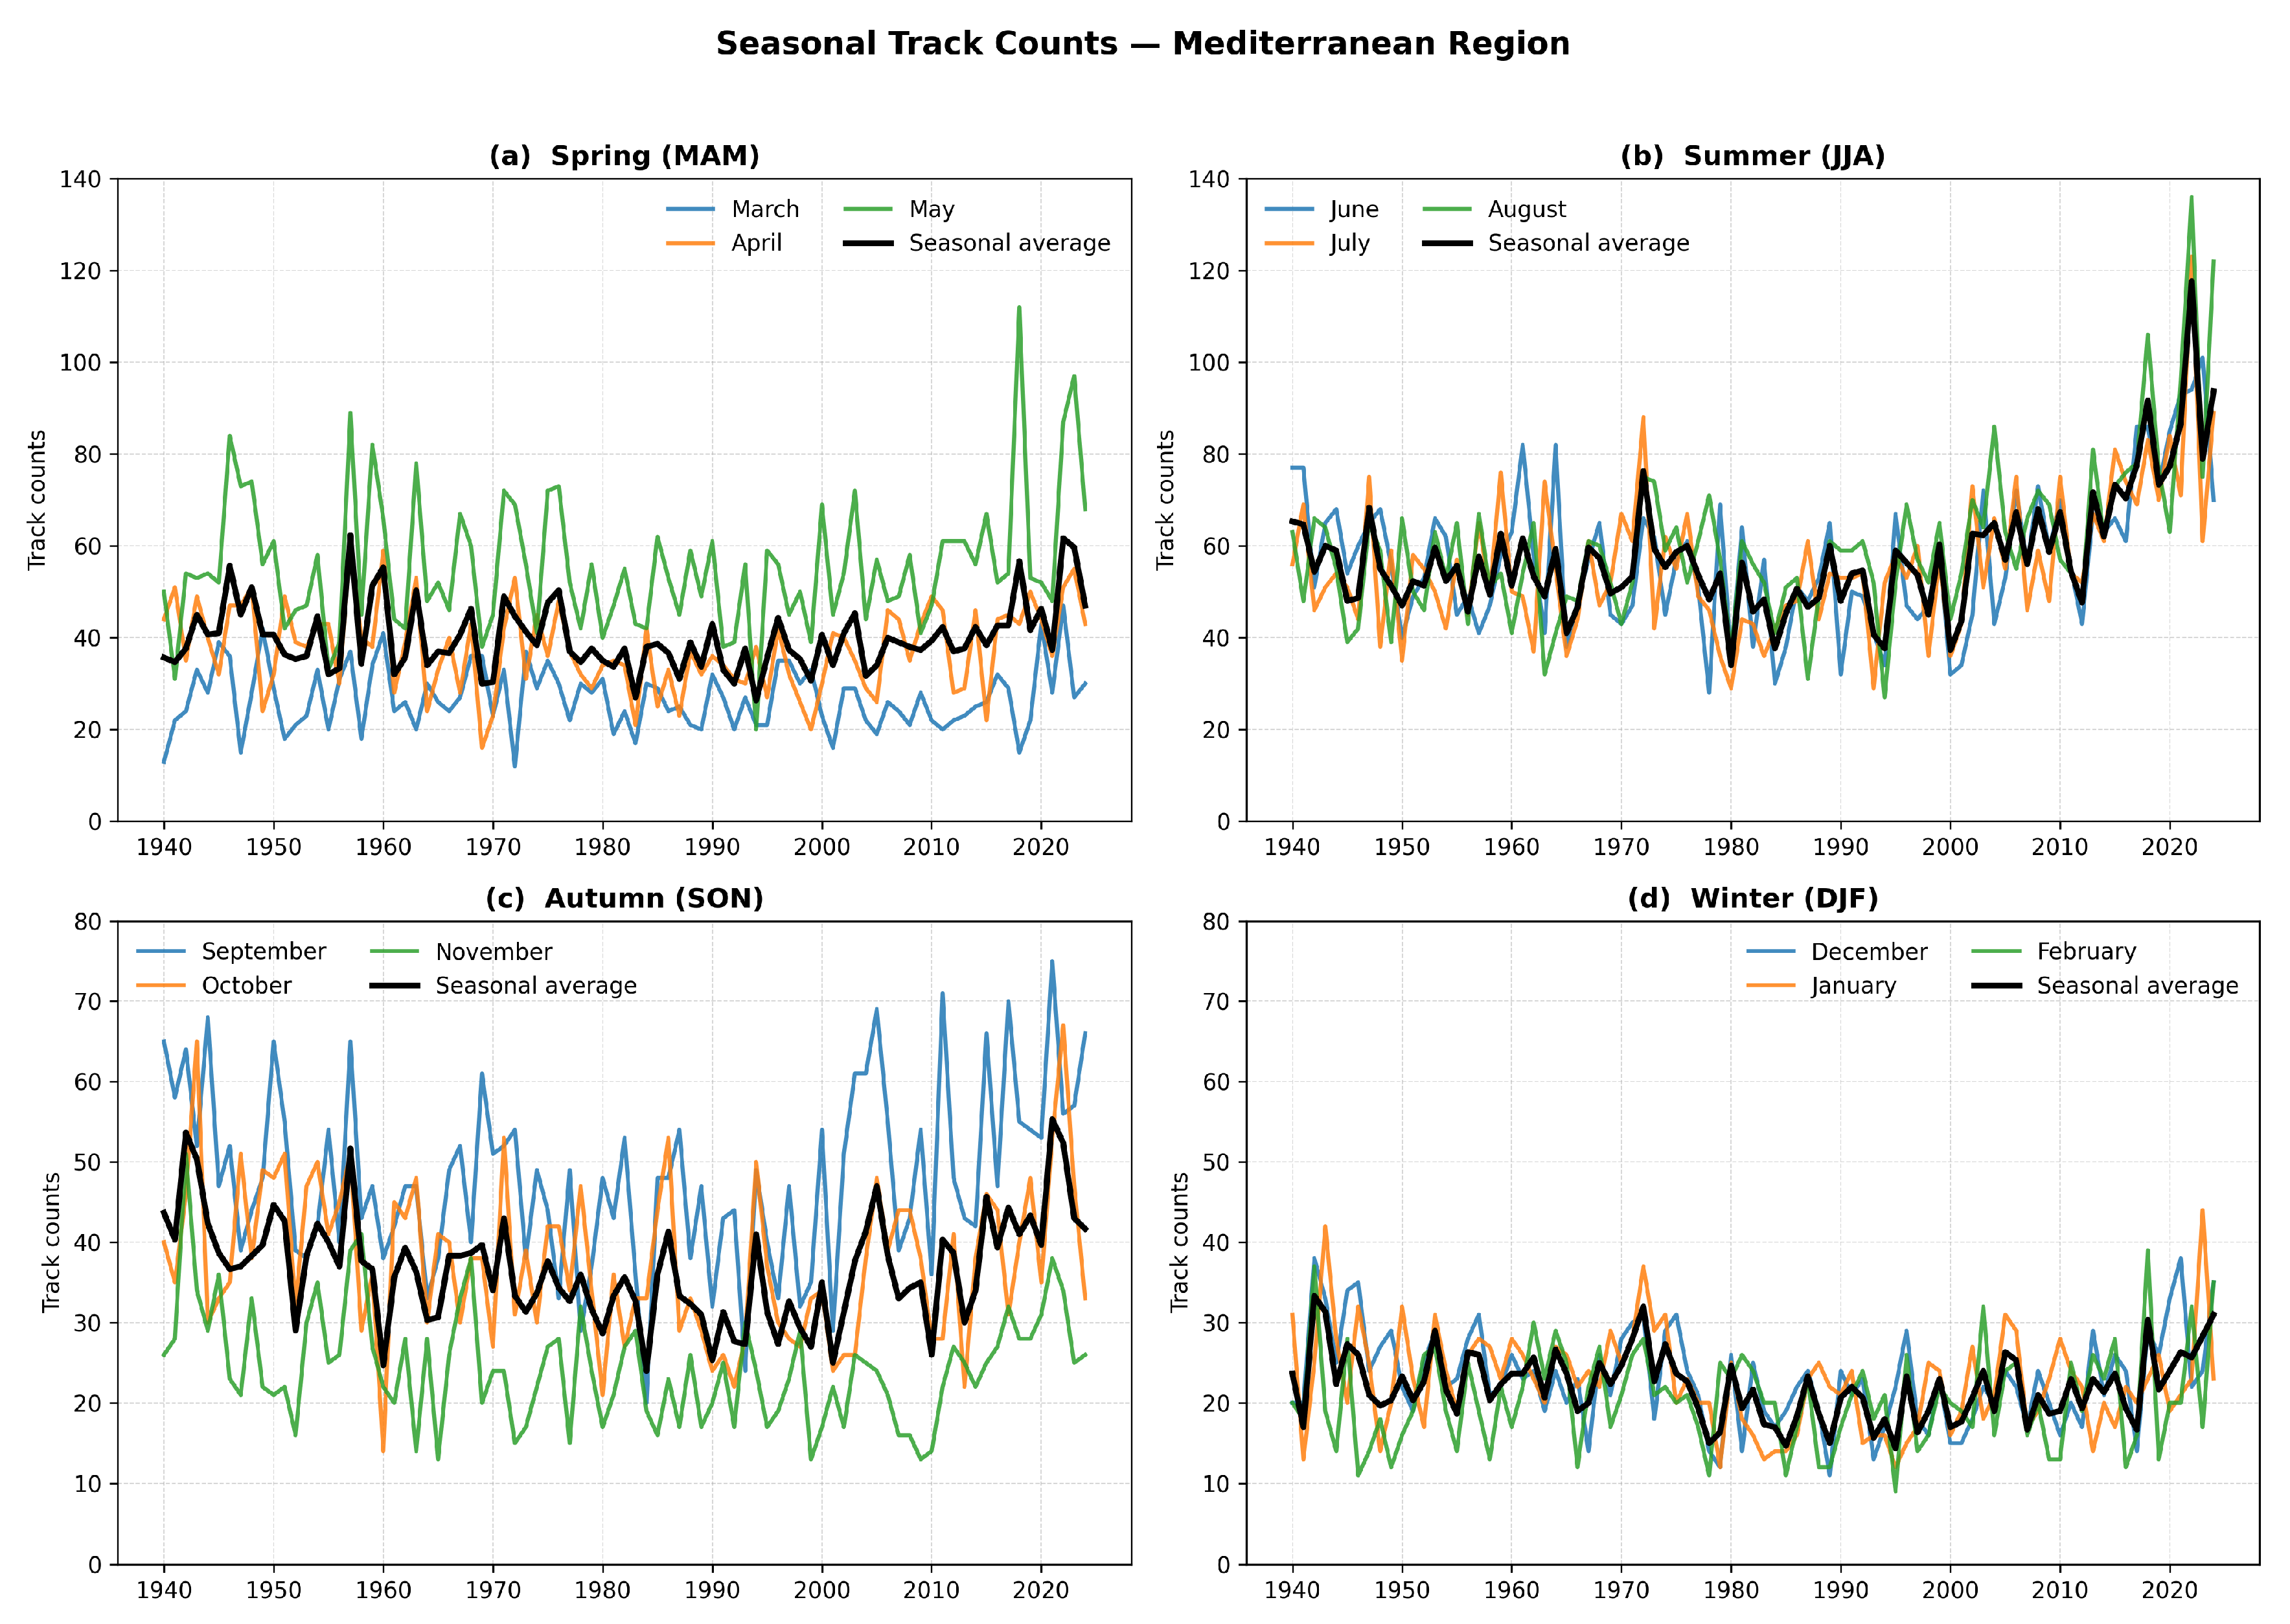
Figure 5 illustrates the monthly and mean seasonal cyclone frequency in the entire Mediterranean region for each year from 1940 to 2024. Here, seasonal frequencies are calculated by taking averages of all monthly cyclone counts within each season. Spring (MAM) shows interannual fluctuations with an average of ≈40 cyclones, where peak (62.3) activity is recorded in 1957 and the lowest (26.3) activity in 1994. Highest numbers are observed in summer (JJA), with a seasonal average of 57.8 cyclones per year, a minimum of 34.0 in 1980 and a maximum of 117.7 in 2022. Autumn (SON) and winter (DJF) exhibit relatively lower seasonal averages of 36.7 and 22.1 cyclones, respectively. Winter cyclones ranged between 43 and 100, where maximum activity was recorded in 1942 and a minimum in 1995. In autumn, this range was recorded as between 72 and 166, where it reached its maximum in 2021 and a minimum in 1984.
Figure 5.
Interannual variability of monthly (actual) and seasonal (average) cyclone track counts in the Mediterranean region from 1940 to 2024. The plots representing each season show the monthly time series (see legend) and the corresponding seasonal mean (black line). The y-axis scale differs between the upper and lower plots to optimize the visibility of the interannual and seasonal variability.
Total seasonal counts presented in Table A1 (Appendix A) show a clear summer maximum and a winter minimum. Summer, as the peak season, has an average of 173.4 ± 8.5 cyclones, accounting for more than one-third of the annual total over the study period. This is followed by spring and autumn with a mean seasonal total of 120.0 ± 4.8 and 110.2 ± 4.8 cyclones, respectively. Winter, normally the stormiest season in extra tropical regions, is the quietest period in the Mediterranean, with a mean seasonal total of 66.2 ± 2.7 cyclones.
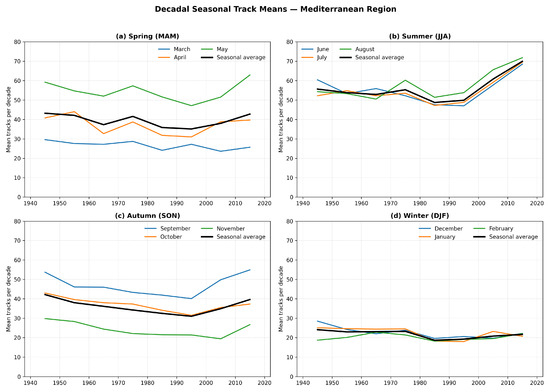
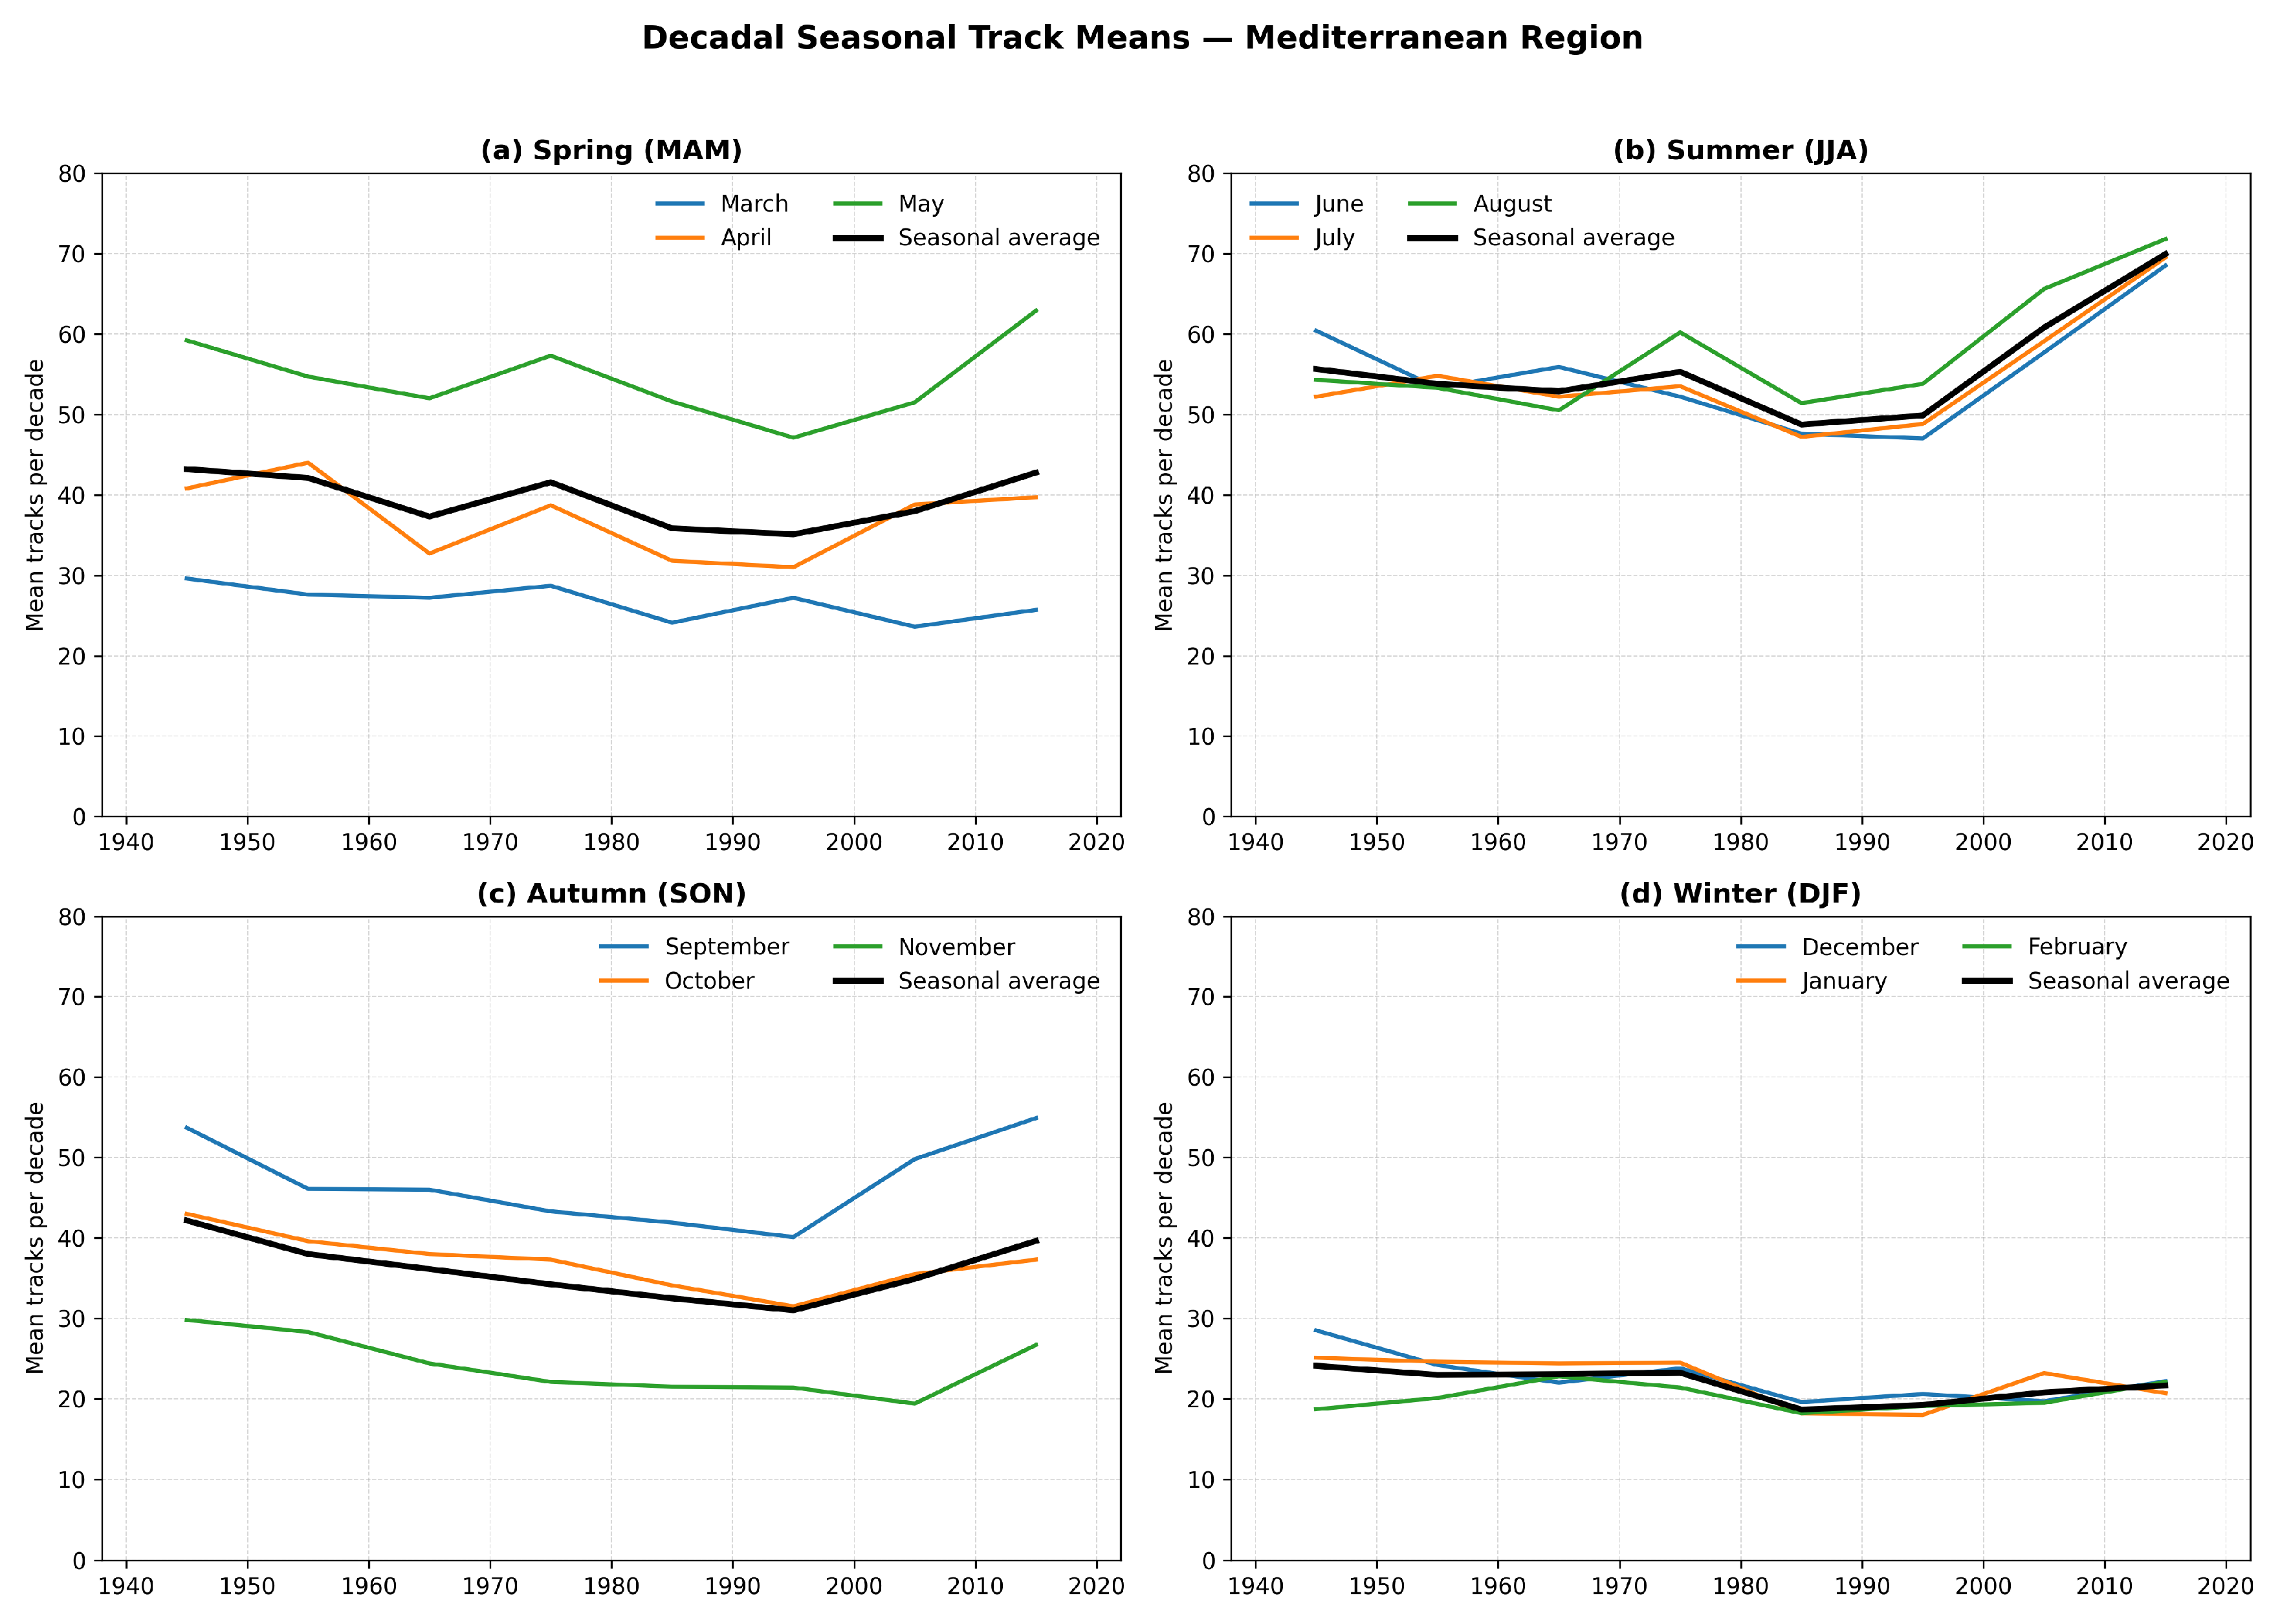
To better see long-term variations, Figure 6 presents a comparison of mean decadal monthly cyclone frequencies (colored lines) and their seasonal averages (black line) for each decade (1941–1950 to 2011–2020) based on calendar year aggregates. On a monthly level, decadal mean cyclone frequencies indicate that August (60.0 ± 3.7) is the most active month, closely followed by June (57.2 ± 3.4) and July (56.2 ± 3.3). On the contrary, February (20.5 ± 1.3) is the month with the lowest cyclone frequency. In spring, May (55.4 ± 3.2) has a consistently higher cyclone frequency, while March (26.8 ± 1.5) has the lowest. In autumn, September (48 ± 2.4) shows consistently higher values than October (37.7 ± 2.1) and November (24.5 ± 1.5).
Figure 6.
Mean monthly number of cyclones (colored lines) and seasonal average (black line) for each decade from 1941–1950 to 2011–2020 in the Mediterranean region. The values for each decade are plotted at the midpoint of the corresponding decade, and the four panels represent each season.
Looking at long-term changes, we find a slight increase in spring cyclone frequency after 1990, which, however, follows a slight decrease over the earlier decades, leading to almost equal numbers at the start and at the end of the study period. A similar behavior can be observed in Autumn. Also, in winter, there is no systematic change over the study period. In summer, however, a marked intensification of cyclone activity is evident, where seasonal totals, which ranged between 146.1 and 166 during the first five decades of the study period, increased to 215.4 in the last decade. This aggregated view underlines that the general increase in cyclone numbers in Figure 4 is primarily a summer phenomenon and suggests that thermal influences and summer dynamics are the main drivers of cyclone numbers in the basin.
A non-parametric Mann–Kendall test for seasonal trend analysis based on annually resolved data reveals no significant trends for all seasons, except for summer (p = 0.0016; = 0.233). Sen’s slope reveals an increase of 0.52 summer cyclones per year, corresponding to an increase of 30.3% change between 1940 and 2024.
The composite climatology of Mediterranean cyclones is characterized by a pronounced warm season, and complex decadal variability. While the frequencies have remained stable in all the other seasons, a significant increase in summer cyclone activity in recent decades is a notable feature of the regional climate.
In the following sections, we will analyze if this general behavior is similar in all subregions. Thereby, we focus on long-term changes based on decadal averages, while the annually resolved plots can be found in Appendix A.
3.2.2. West Mediterranean
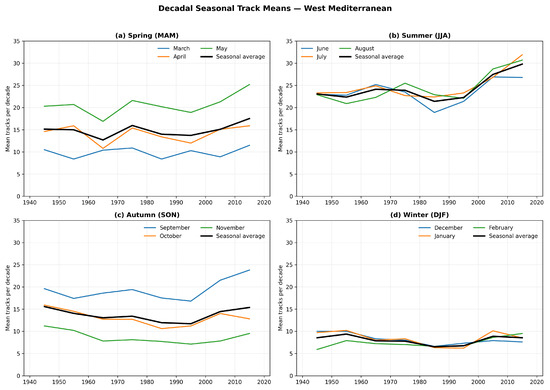
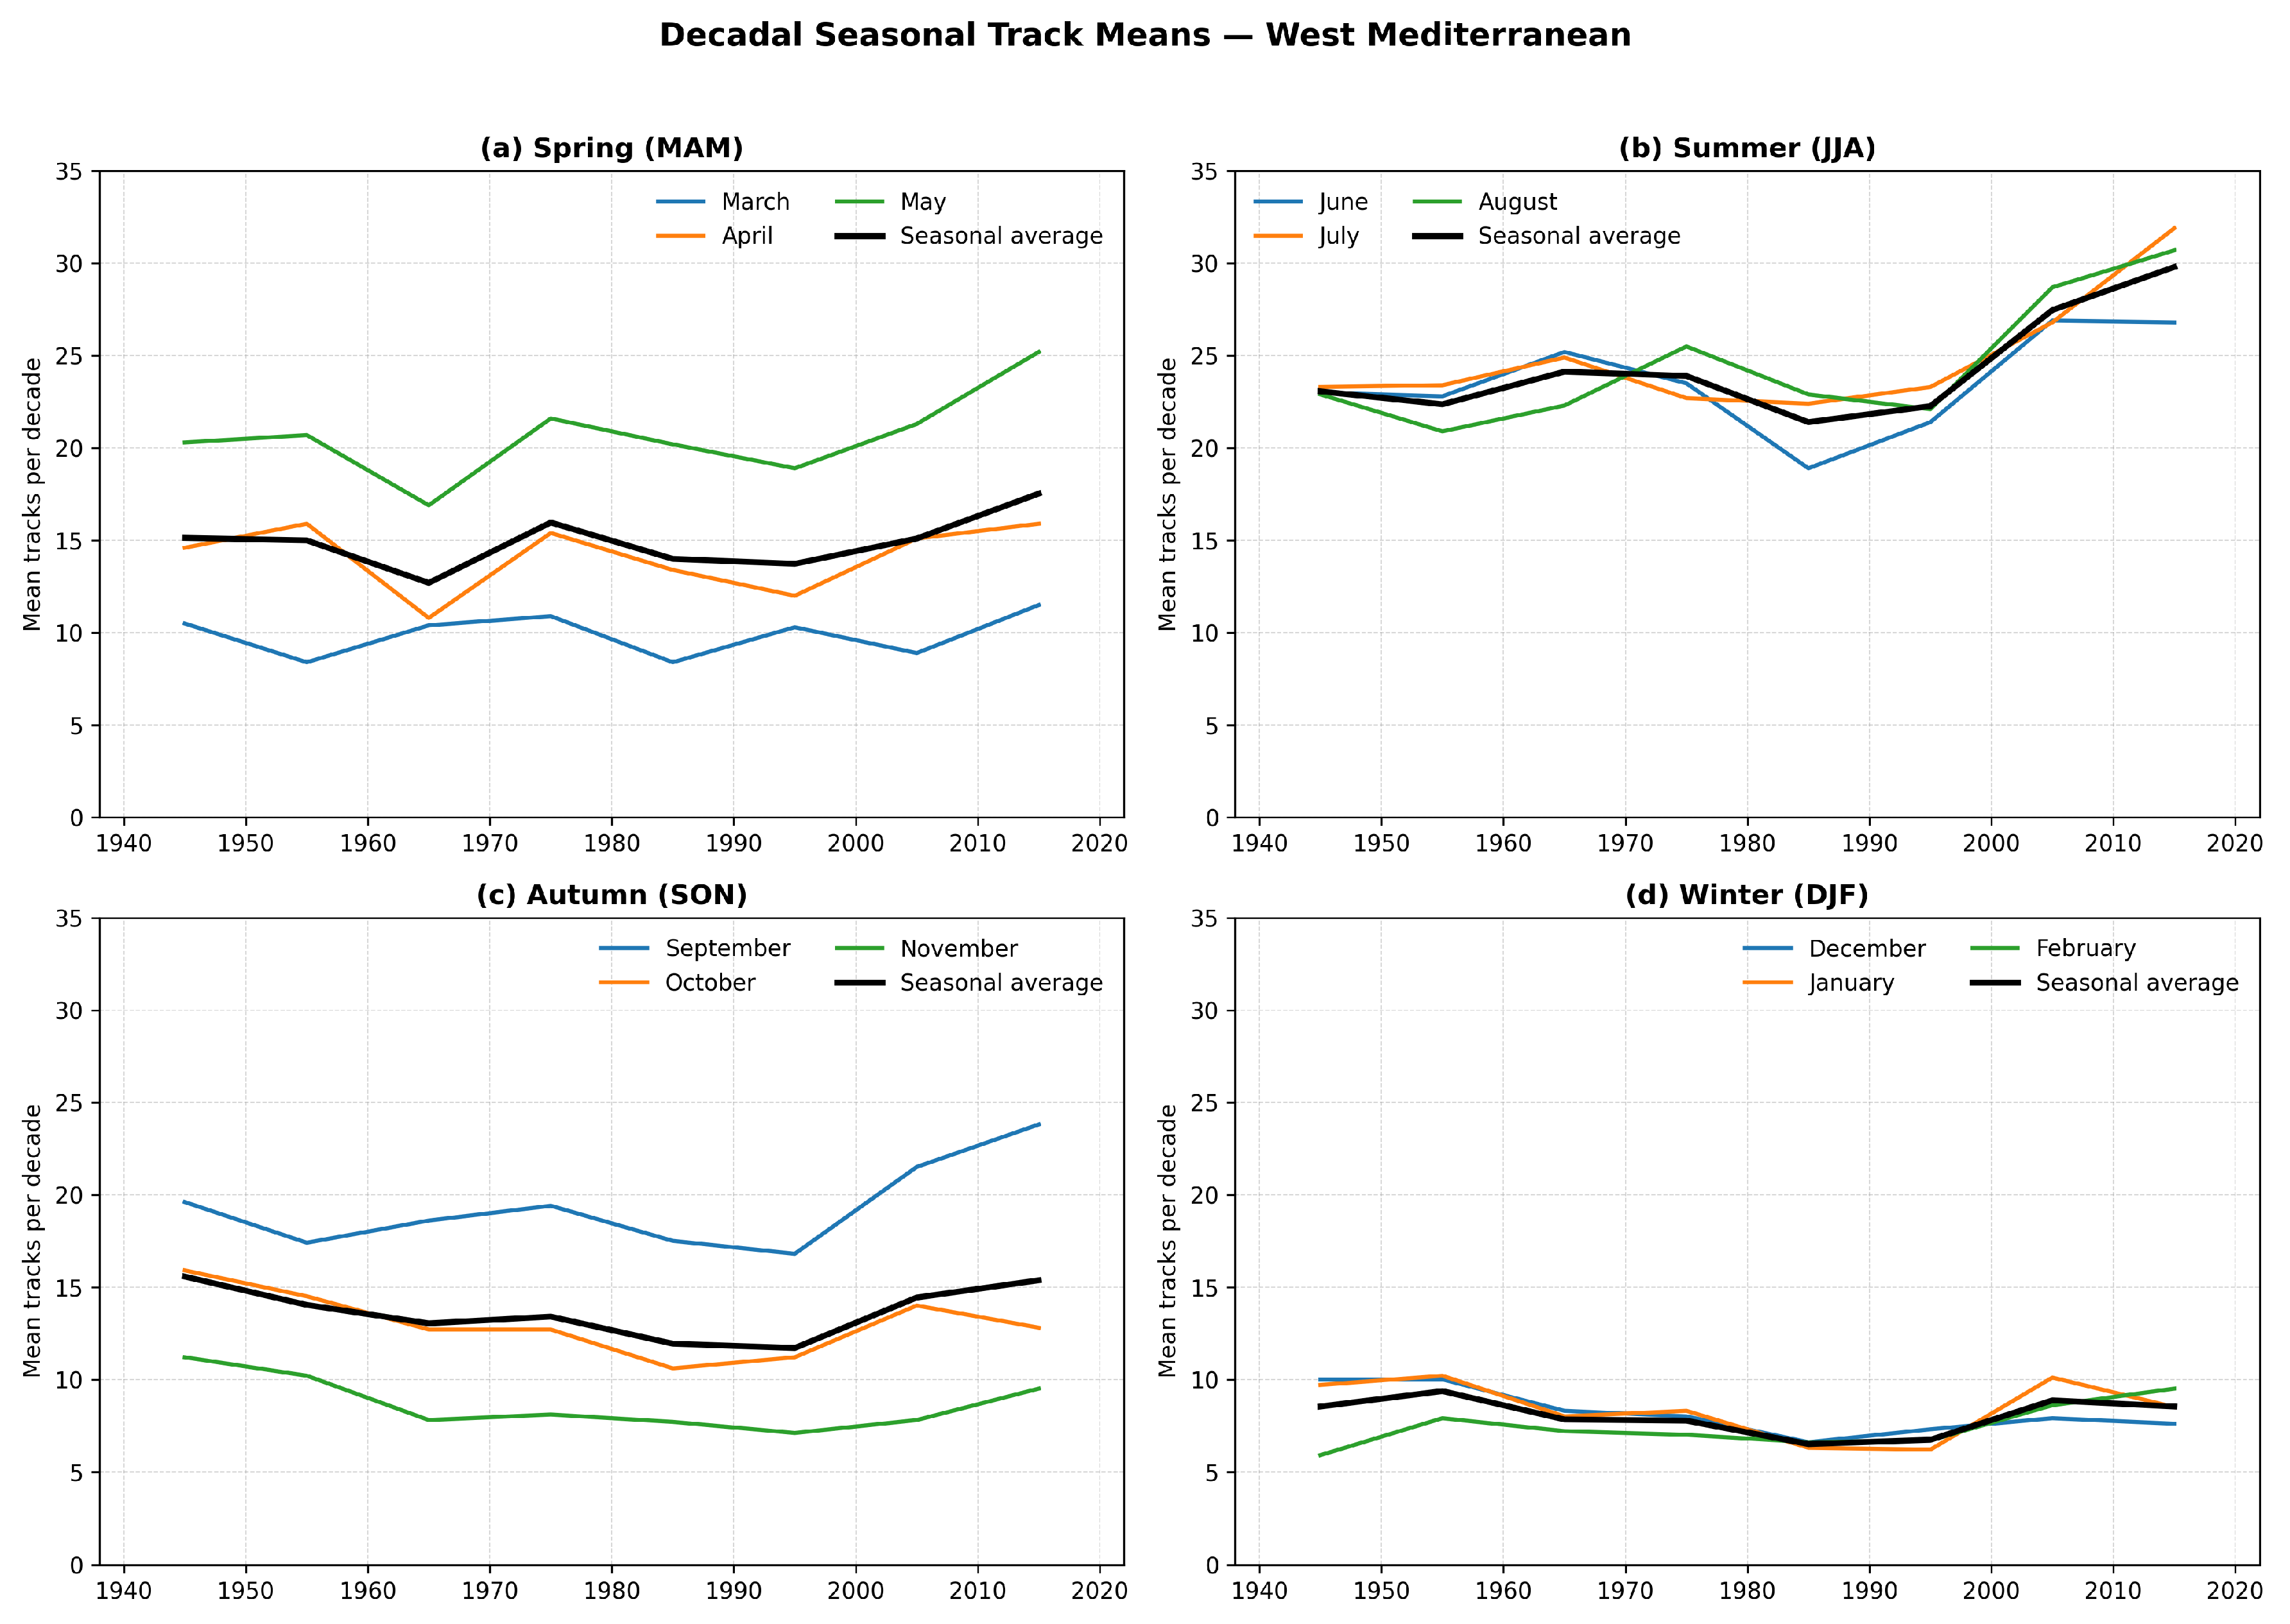
For a better visualization of long-term changes in the number of cyclones, Figure 7 compares the mean monthly variation with seasonal averages over the decades from 1941–1950 to 2011–2020. On a monthly level, mean decadal cyclone frequencies confirm that August (26.0 ± 2.2) is the most active month, closely followed by July (25.5 ± 1.9) and June (24.4 ± 1.6). On the contrary, February (7.6 ± 0.7) is the least active month. May (21.2 ± 1.5) consistently shows higher values than the other months in spring. In autumn, cyclone frequency is the highest in September (19.8 ± 1.4), while October (13.5 ± 1.2) and November (8.7 ± 0.9) represent lower values.
Figure 7.
Mean monthly number of cyclones (colored lines) and seasonal average (black line) for each decade from 1941–1950 to 2011–2020 in the western Mediterranean basin. The values for each decade are plotted at the midpoint of the corresponding decade, and the four panels represent each season.
Investigating long-term changes over the decades from 1941 to 2020, Sen’s slope reveals a slight increase in spring (15.6%) cyclone frequency, mainly reinforced by May, that is evident in the last three decades (1991–2020). On the other hand, a stable decreasing behavior has been observed in autumn (−10.2%) and winter (−13.2%) over the eight decades. On the contrary, a gradual increase in summer (27.1%) has been observed over the decades, visible after 1980.
Regarding the overall long-term trends, there is a significant trend observed in spring (p = 0.0095; = 0.191) and summer (p = 0.0004; = 0.259). In spring, Sen’s slope reveals a yearly increase of 0.10 cyclones, corresponding to a 20.7% change over the entire period, while, for summer, the increase amounts to 0.28 cyclones per year, corresponding to a 39.1% change. The presented trend in the region’s response to climate variability could be compared to other subregions in the Mediterranean.
Despite differences in the estimation of cyclone densities, the findings of Picornell et al. [33] align with our results, showing a winter minimum and a summer maximum. Projections for the annual number of cyclones in the Mediterranean region from the Med-CORDEX ensemble, combining different regional climate system models (RCSMs), indicate a ≈50% long-term decline comparing the two periods (2075–2099 and 1981–2005) over most part of the western Mediterranean [12]. The numbers of cyclones are projected to increase in winter and decrease in summer for the region [12]. In this context, it is interesting to note that we observed an increase in summer and in annual numbers over our observation period.
3.2.3. East Mediterranean
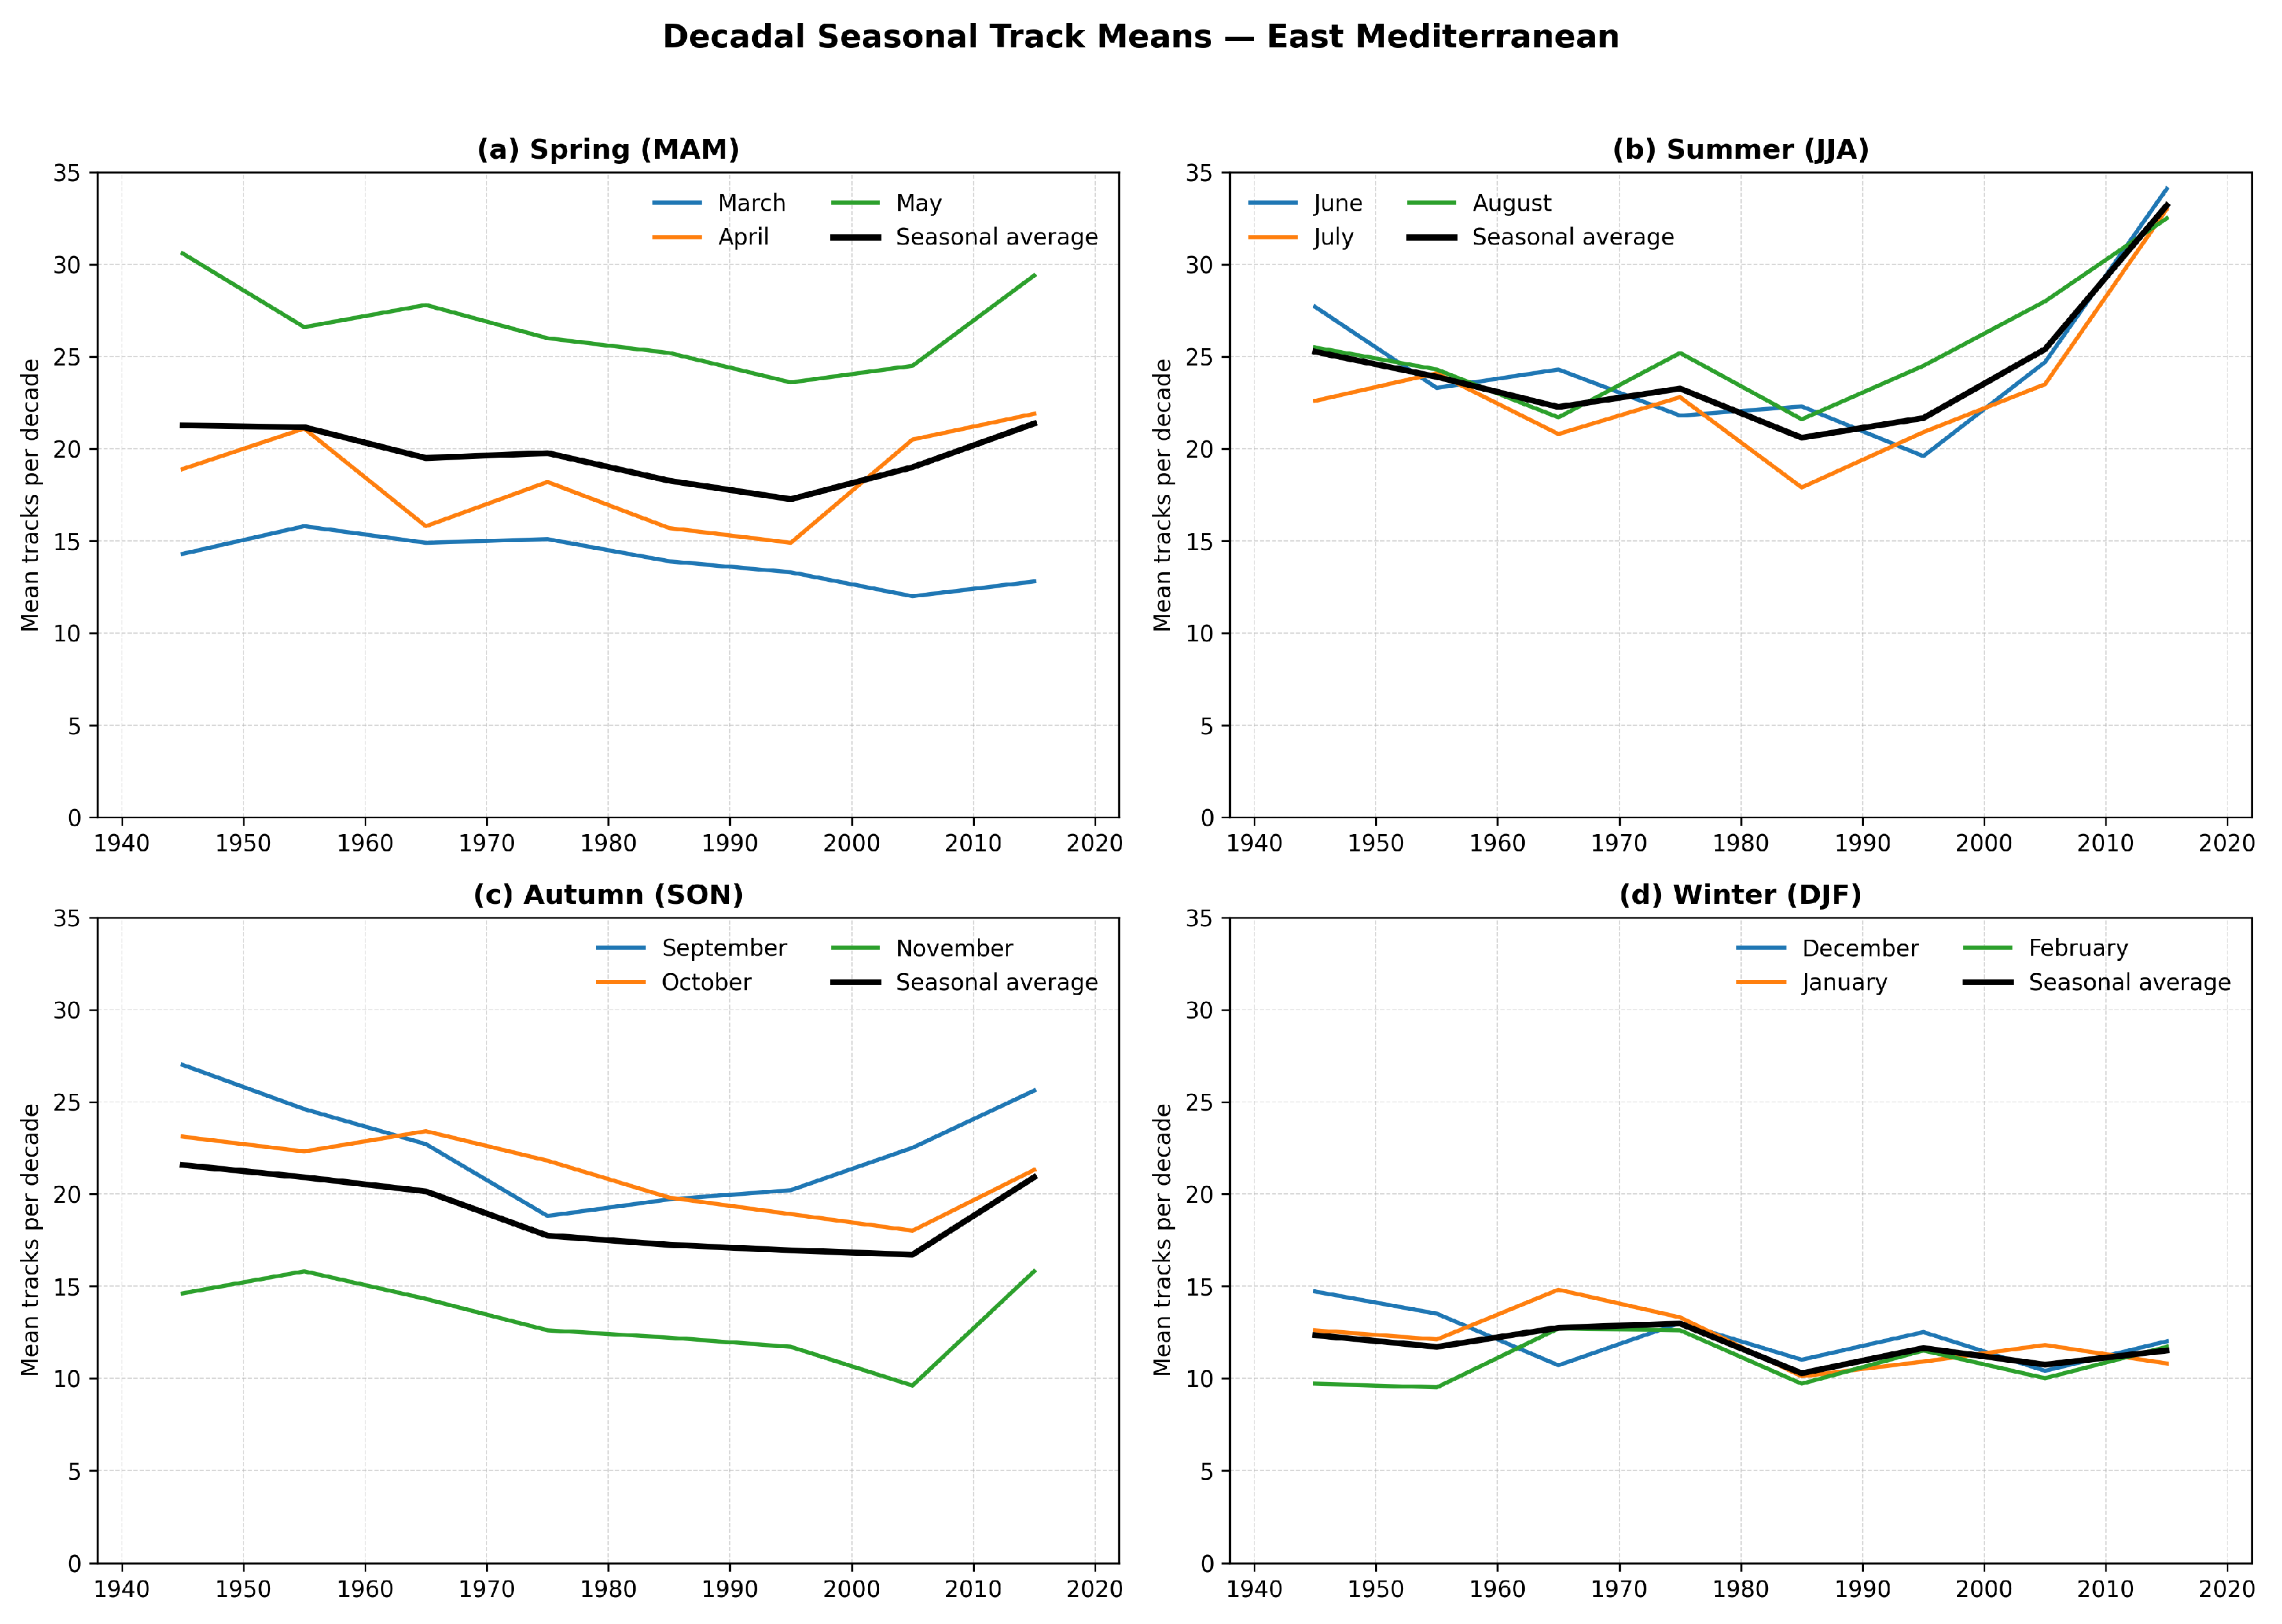
To see long-term changes, Figure 8 compares mean monthly cyclone frequencies with seasonal averages over the decades from 1941–1950 to 2011–2020. May represents the highest mean value (27.0 ± 1.8) of cyclone frequency, followed by August (26.3 ± 1.6) and June (25.5 ± 1.9). February (11.1 ± 0.8) is the least active month, followed by January (12.1 ± 0.9) and December (12.5 ± 0.8). In autumn, a moderate frequency of cyclone distribution is visible in September (19.8 ± 1.4), followed by October (13.5 ± 1.2) and November (8.7 ± 0.9).
Figure 8.
Mean monthly number of cyclones (colored lines) and seasonal average (black line) for each decade from 1941–1950 to 2011–2020 in the eastern Mediterranean basin. The values for each decade are plotted at the midpoint of the corresponding decade, and the four panels represent each season.
Regarding long-term changes based on Sen’s slope from 1941 to 2020, spring shows a decline of −13.5% in cyclone numbers. Autumn and winter show slight declines of −22.7% and −9.2%, respectively. Despite having higher frequencies than the western Mediterranean, a stronger decline in autumn and a weaker decrease in spring and winter suggest that the cyclone behavior is responding differently in the eastern basin.
There is a significant trend over the study period in summer according to a Mann–Kendall test (p = 0.0139, = 0.182). Sen’s slope reveals a yearly increase of 0.227 cyclones in the eastern Mediterranean, corresponding to a 31.5% change. Unlike the western Mediterranean, there is no significant trend in spring.
In contrast to the other mid-latitude patterns, where cyclogenesis is more favorable in winter, the eastern Mediterranean is identified by high cyclone frequency during the warm season, mainly affected by thermal influences [4]. Our results regarding an increase in summer are in line with the observed increase in cyclone frequency toward the late 20th century [29], which has been linked to altered large-scale circulation patterns and regional warming.
The increase observed in autumn during the last two decades (2001–2020) could be linked to increased baroclinic activity and higher sea surface temperatures, from the accumulation of summer heat, as discussed by Cavicchia et al. [1].
3.2.4. Black Sea
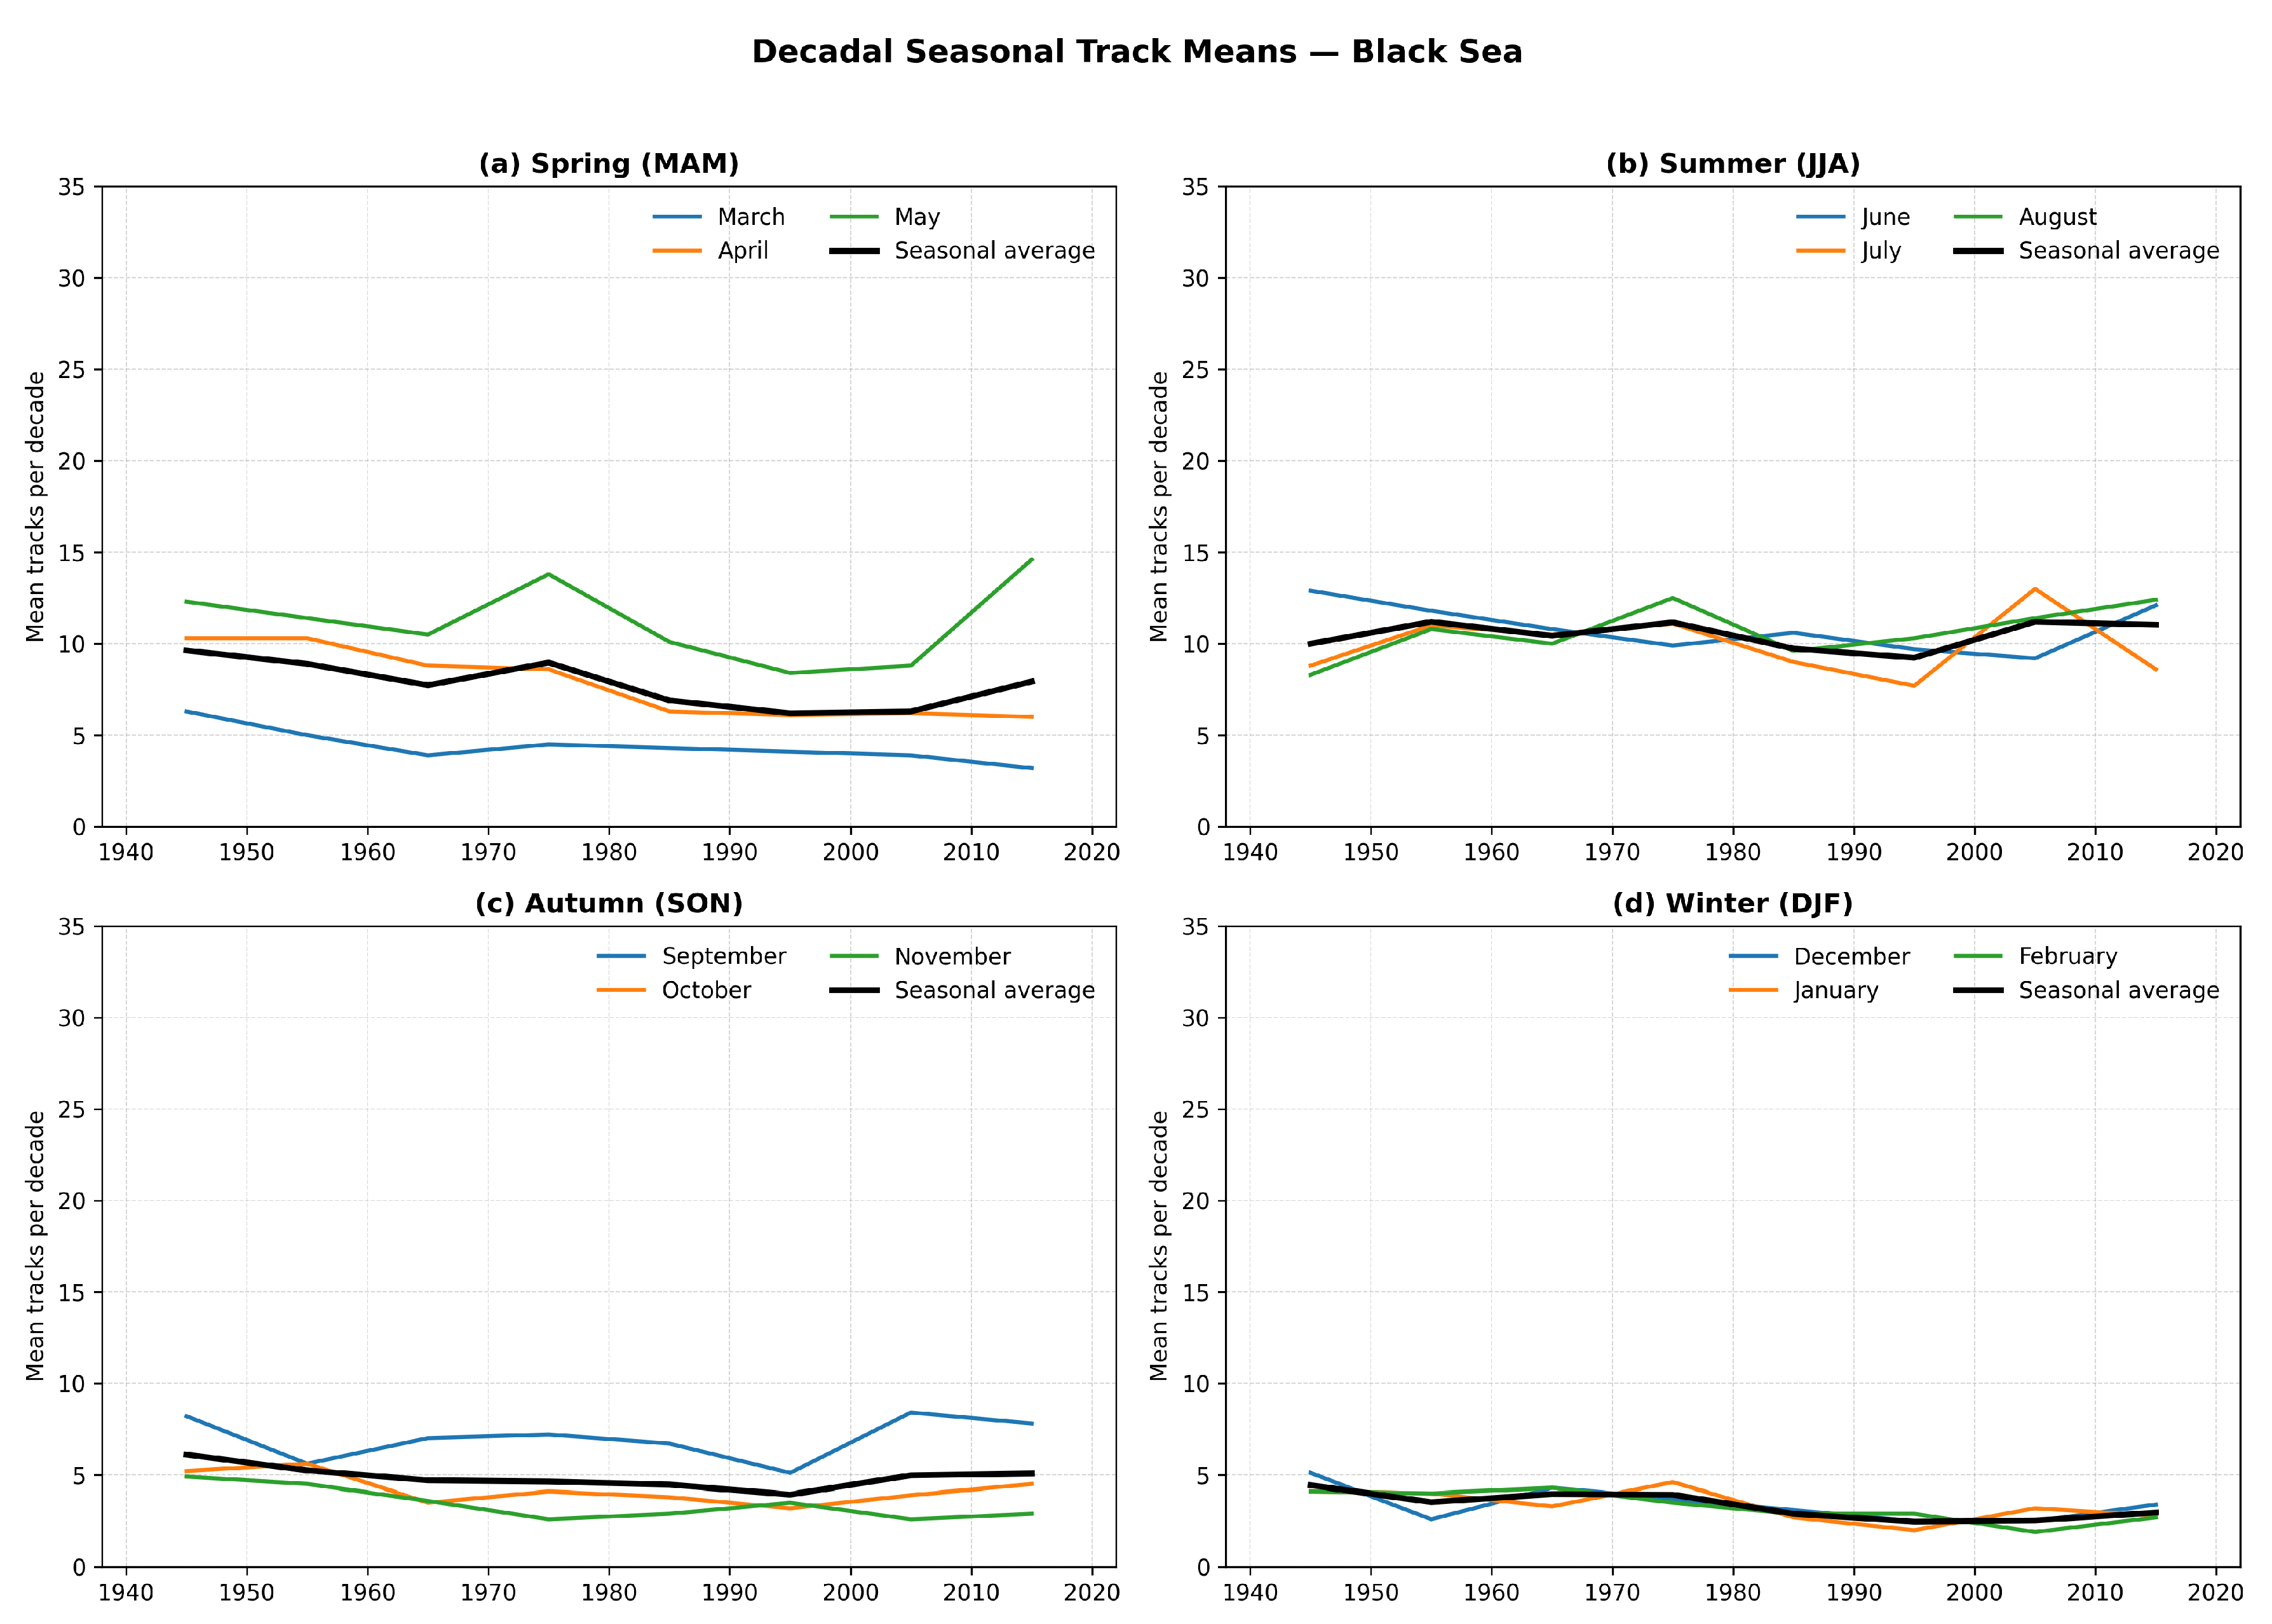
The decadal mean monthly and seasonal frequencies in the Black Sea from 1941–1950 to 2011–2020 are shown in Figure 9. In contrast to the other basins, May is the most active month, with (11.3 ± 1.2) cyclones, followed by June (11 ± 1.1) and August (10.9 ± 0.9). February is the least active month (3.3 ± 0.5), closely followed by December, January and November with a mean value of 3.6.
Figure 9.
Mean monthly number of cyclones (colored lines) and seasonal average (black line) for each decade from 1941–1950 to 2011–2020 in the Black Sea. The values for each decade are plotted at the midpoint of the corresponding decade, and the four panels represent each season.
Looking at long-term changes between the first (1941–1950) and the last (2011–2020) decade based on Sen’s slope, April shows the highest decline (−49.4%) in the number of cyclones, contributing to a −34.3% decrease in spring. On the contrary, the highest increase is observed in August, with an additional 4.1 cyclones (34.1%), but still contributes to a −0.5% decline in summer. In autumn, a mean cyclone frequency of 6.1 is recorded in the first decade and 5.1 in the last decade, accounting for a decline of −20.4%. In winter, a mean cyclone frequency of 4.3 is recorded in the first decade and 2.9 in the last decade, accounting for a decline of −40.6%.
A notable feature of the long-term analysis in the region shows declining trends in cyclone frequency for all the seasons except summer. The non-parametric analysis indicates a significant decreasing trend (p = 0.0012, = −0.238) for the number of cyclones during winter, where Sen’s slope reveals a yearly decrease of −0.056 (−37.8%) cyclones.
The Black Sea is characterized as a zone with frequent cyclones, with a smoother annual distribution with high events of cyclogenesis occurring in August and low events in January [4]. However, the downward trend in winter indicates that the Black Sea is a sensitive region reacting differently to factors affecting cyclogenesis mechanisms.
3.3. Periodic Comparison (1940–1980 vs. 1981–2024)
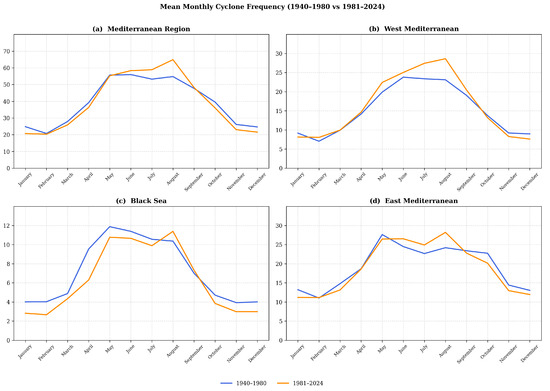
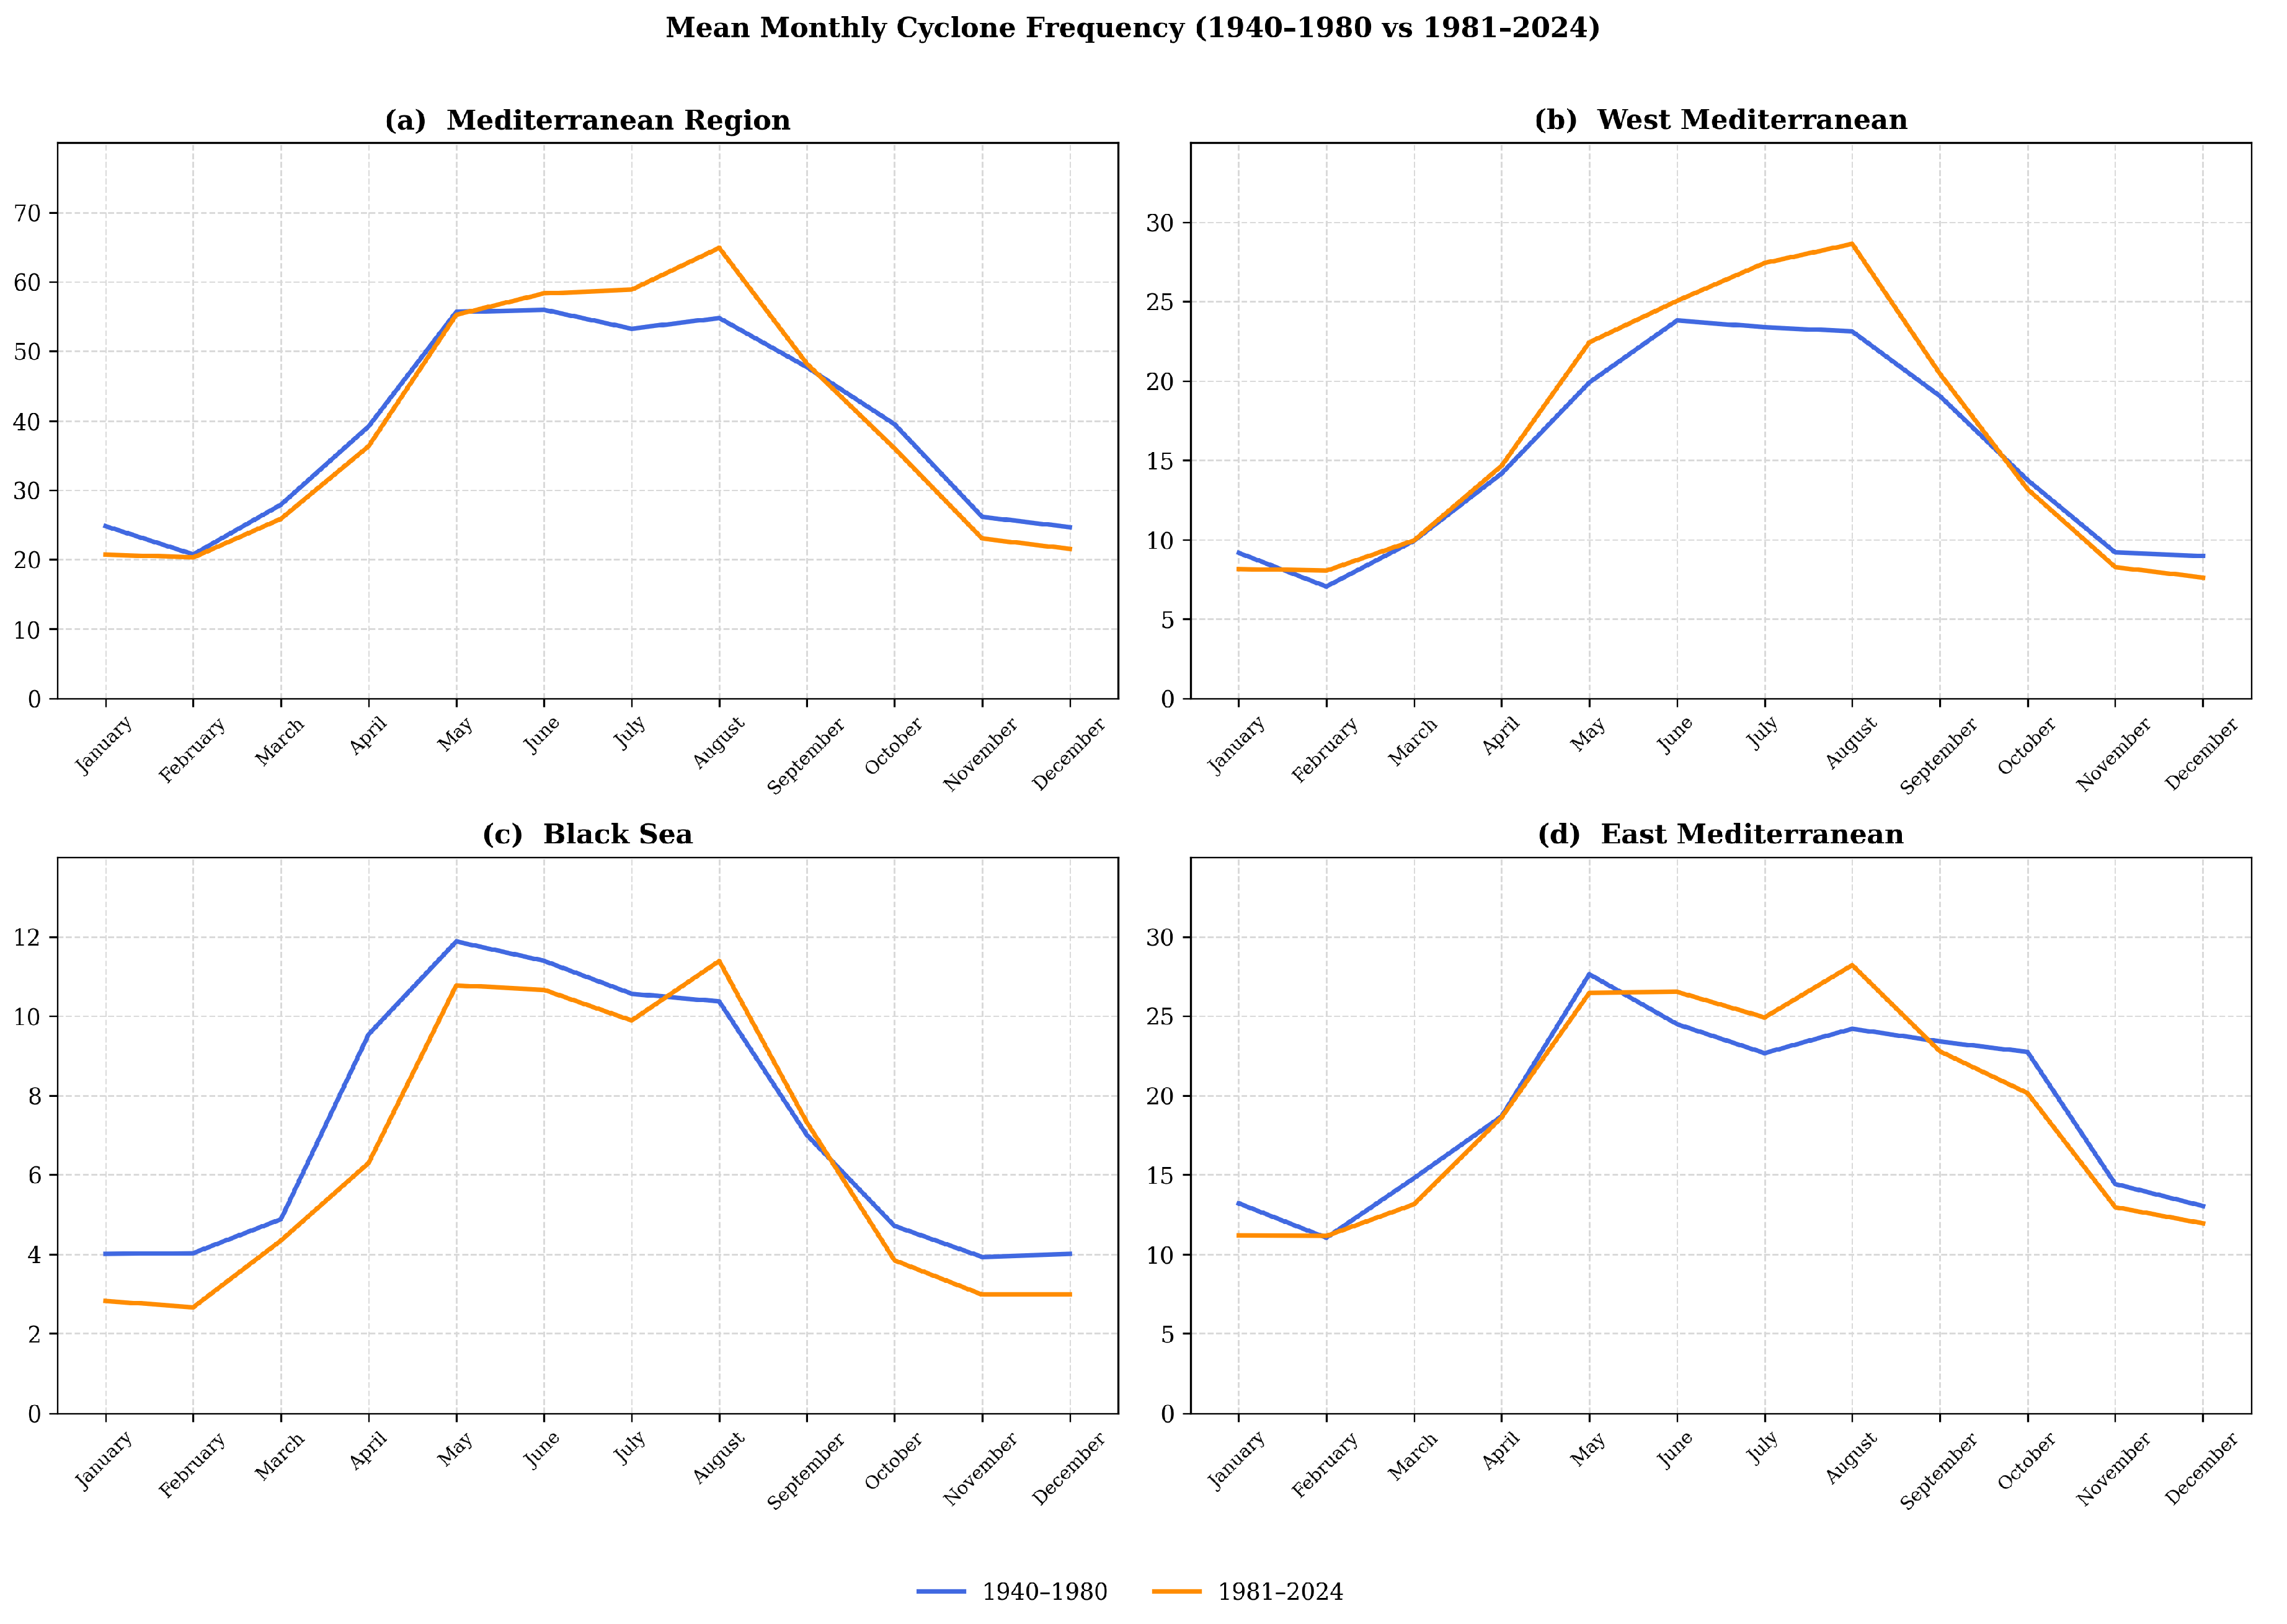
A comparative analysis of the monthly mean frequency of cyclones between the periods 1940–1980 and 1981–2024 (Figure 10), reveals notable changes in the annual cycle in the entire Mediterranean and its subregions. During the first period (1940–1980), peak cyclonic activity occurred in May in most regions, whereas in the eastern Mediterranean, the peak activity is observed in June. The peak activity is shifted to August in the second period (1981–2024).
Figure 10.
Average monthly cyclone frequencies for the period 1940–1980 (blue) and 1981–2024 (orange) in the entire Mediterranean and its subregions. The y-axis represents the average number of cyclones per month, where the same axis scale is adapted for the east and the west Mediterranean for a better comparison.
During the first period, the lowest activity for each respective region is observed in February across most regions, whereas in the eastern Mediterranean, the lowest activity is observed in January. However, during the second period, the lowest activity is observed in February in all the regions, except the western Mediterranean, where the lowest is recorded in December.
Our comparison between the two periods reveals only a small increase of 1.7% based on mean annual cyclone frequency in the entire Mediterranean region, but we can see a clear seasonal redistribution. We find a significant decline in cyclone activity during winter (−10.9%, p = 0.0041) and a visible, although not statistically significant, increase in summer (11.0%, p = 0.1395).
While the increase is prominently visible during summer (JJA), we note that the August peak intensified significantly across the entire region (p = 0.0139, 18.4%). In the subregions, the increases amount to 16.6% (eastern Mediterranean), 23.8% (western Mediterranean) and 9.8% (Black Sea). These results suggest that the general maximum of cyclone activity has shifted toward the warmer months in recent decades.
Comparing the sub basins, the eastern Mediterranean experienced a significant decline in cyclone frequency during autumn (−7.7%, p = 0.0272) and in January (−15.3%, p = 0.0164). In the western Mediterranean, we find a sustained but not significant increase in the number of cyclones during summer (15.4%) and spring (6.9%); however, there is a significant increase in August (23.8%, p = 0.0334). The Black Sea region, on the other hand, shows an overall significant decline (−12.0%, p = 0.0020), particularly in winter (−29.7%, p = 0.0001).
Previous studies, including the review by Flaounas et al. [3], reported that winter has maximum numbers of cyclone activity in the Mediterranean. These systems are primarily associated with intense baroclinic systems, strongly influenced by using intensity-based filtering criteria. The climatological analysis by Alpert et al. [18] showed that applying a minimum pressure gradient threshold can reduce the number of summer cyclones by up to 70%. This suggests that a large proportion of the recorded summer systems are likely weak, thermally driven low-pressure systems. While vertical coherence is partially enhanced by the matching criteria explained in Section 2.3, which do not completely exclude weak or shallow systems. Neu et al. [14] discussed that the number of cyclones is highly dependent on the detection algorithms and thresholds used, with some methods detecting significantly weak and moderate systems. These results underscore the importance of detection criteria for interpreting cyclone climatology and suggest that our dataset represents a broader class of low-pressure systems.
The detected trends in summer support the observations that increased thermal forcing, driven by rising sea surface temperatures, favors cyclogenesis mechanisms. A monthly analysis of cyclones in the Mediterranean from 1979 to 2008 by Lionello et al. [29] highlights marked peaks during May and August, consistent with our findings. Their multi-method analysis identified a seasonal distribution similar to our findings and no significant long-term trend in the cyclone totals. However, they did not identify a change in the seasonal cyclone, since their observation period was shorter and did not cover the marked changes during the past ≈15 years.
Although ERA5 provides a high-resolution and dynamically consistent reanalysis dataset, uncertainties persist for earlier periods, particularly before the satellite era. The number of observations assimilated in ERA5 increased from ≈0.75 million per day on average in 1979 to ≈24 million per day in 2019 [22]. It is noted that, based on our results, cyclone numbers have increased in summer in the satellite era.
3.4. Cyclone Duration
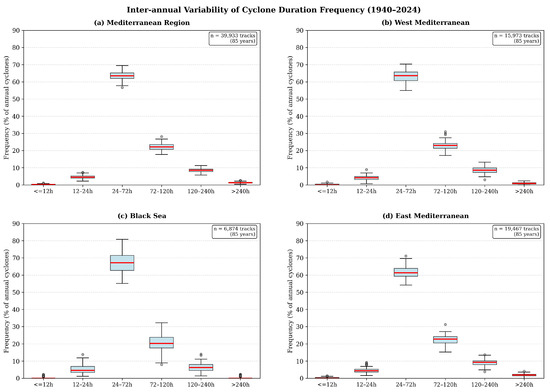
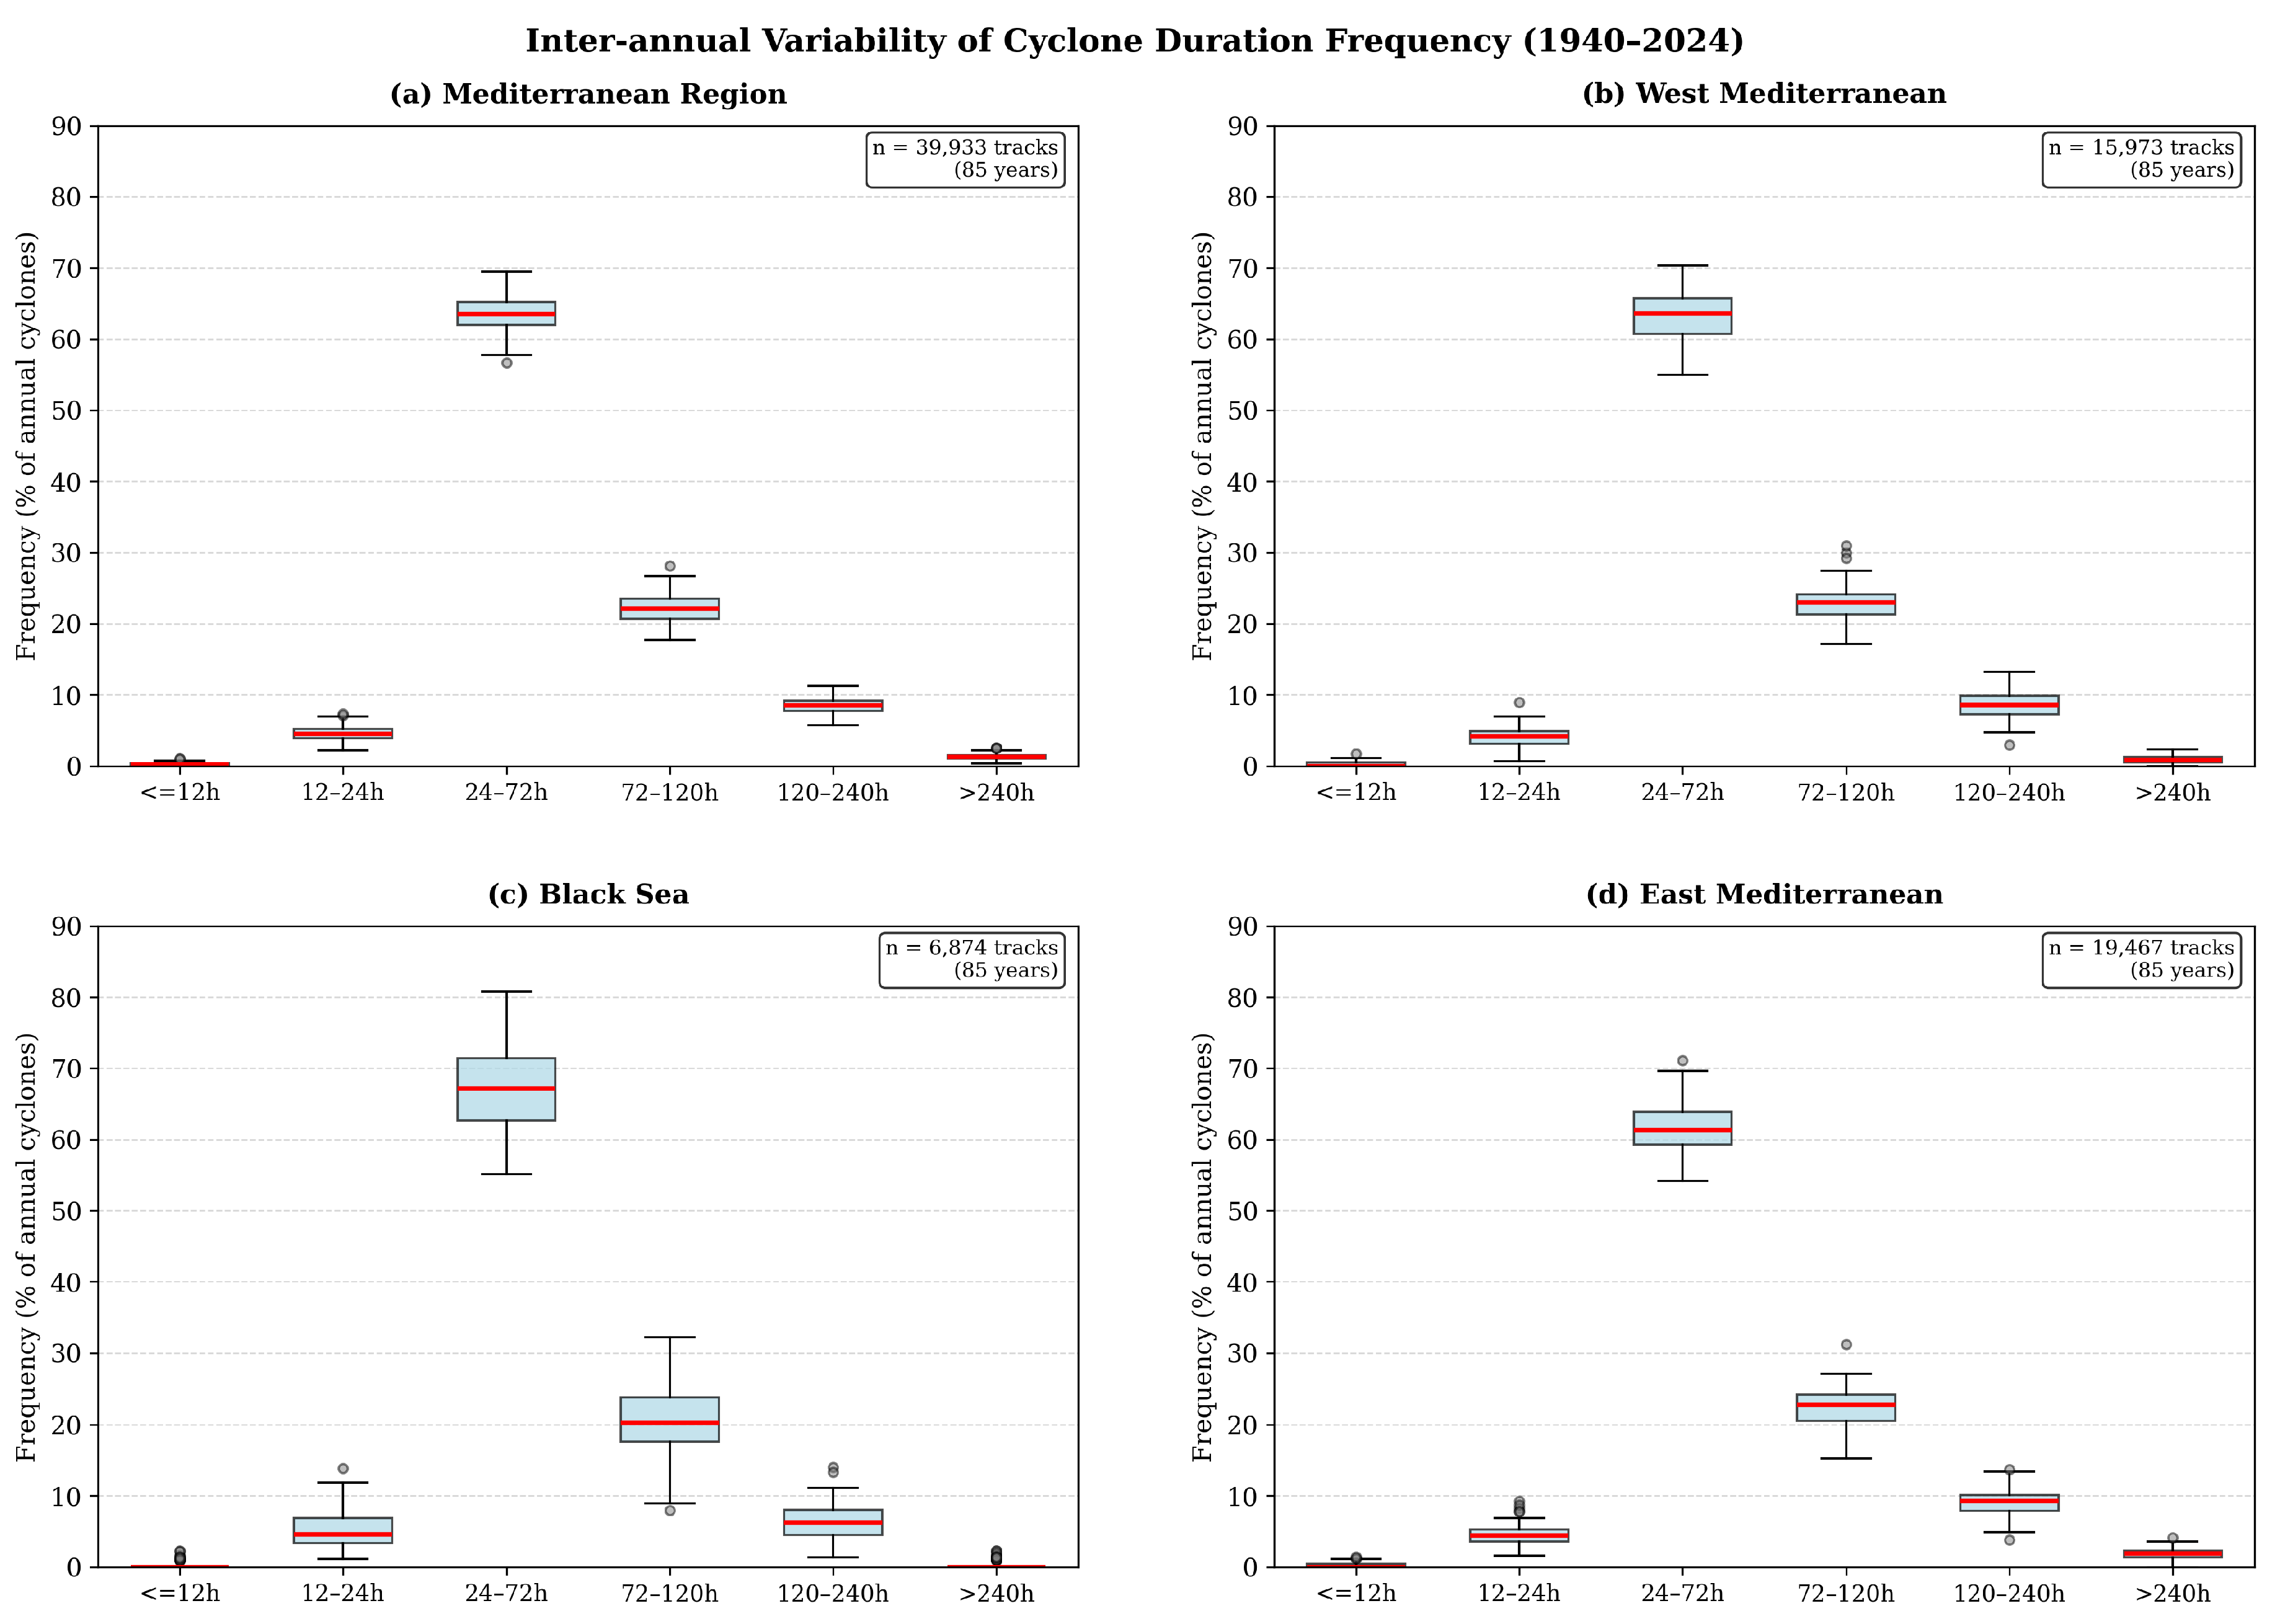
The distribution of cyclone duration in Table 1 shows that 63.3% of the cyclones in the entire Mediterranean region (Figure 11a) are observed with a duration from 24 to 72 h. The second common group, with a duration of 72 to 120 h, accounts for 22.2% of the cyclones, followed by cyclones persisting for 120 to 240 h, representing 8.4% of the total distribution. Storm Daniel, which occurred in September 2023 (Figure 3), belongs to this group, with a duration of 10 days. The small variance of the data in Figure 11a suggests that the interannual variability in cyclone duration frequencies is low and that the lifetime distribution remains stable over time, although the total numbers change.
Table 1.
Cyclone duration summary.
Figure 11.
Interannual variability in cyclone duration across the Mediterranean and its subregions from 1940 to 2024. Each box represents the yearly interquartile range of cyclone lifetimes category, with the central line denoting the mean duration. Circles indicate outliers, where the frequency falls beyond the interquartile range.
Very short-lived cyclones (≤12 h) are exceptionally rare: only 0.2% of the cyclones were able to cover at least 600 km distance in 12 h or less. On the other hand, the category of long-lived cyclones (>240 h), which represents 1.3% of the cyclones, is of scientific interest. Long-lived cyclones, having an average duration of more than 12 days, suggest that persistent cyclones can lead to extended periods affecting weather conditions.
A comparison of cyclone duration in the eastern and the western Mediterranean reveals slight differences. Cyclones lasting more than 240 h are more frequent in the eastern Mediterranean (1.8%) than in the western Mediterranean (0.9%). This suggests that conditions for persistent cyclones are generally more favorable in the eastern Mediterranean. For a short and a medium duration category of cyclones, both regions exhibit almost similar distributions. In the 24–72 h category, the western Mediterranean reveals a slightly higher frequency (63.1%) compared to the eastern Mediterranean (61.7%), while in the 72–120 h range, the frequencies are 23.0% in the western Mediterranean and 22.5% in the eastern Mediterranean.
The Black Sea shows a similar distribution to the other subregions with a comparatively lower frequency in longer durations. For the 120–240 h category, the cyclone frequency is 6.4%, and for the >240 h category, it is 0.3%. Regional variation is small, highlighting similar life cycle patterns in the Mediterranean region and its sub regions.
A typical Mediterranean cyclone life cycle falls within a short temporal scale, identified as weaker systems [29], even when identified by different tracking criteria. The duration of cyclones is closely linked to their type and intensification process. Intense systems frequently undergo a transition from a baroclinic to a hybrid or subtropical character, which is a process that can prolong their lifespan through intensification by the release of latent heat from the ocean [6].
Table 2 shows statistically significant trends in cyclone frequency for different duration categories across the regions between 1940 and 2024. Overall, the results indicate an increase in cyclone frequency in the Mediterranean region with pronounced trends during summer. In particular, long-lasting cyclones (120–240 h and >240 h) show a substantial increase, with percentage changes exceeding 30% based on Sen’s slope.
Table 2.
Significant trends in cyclone frequency based on Mann–Kendall test and Sen’s slope estimator (1940–2024). Only statistically significant results () are shown.
At the regional level, the western Mediterranean shows a steady increase in cyclone frequency, especially during the summer. Significant upward trends are observed for cyclones with a duration (24–240 h), where percentage changes range from approximately 30% to 40%. In the eastern Mediterranean, increasing trends are also observed, particularly for long-lasting cyclones (>120 h), with an increase exceeding 42.4%. In contrast, the Black Sea represents downward trends in cyclone frequency, especially during the winter months.
4. Summary and Conclusions
Our analysis detected 39,933 (0.78/100 km2) tracks over the entire Mediterranean region. The eastern Mediterranean records the highest number of cyclone tracks (19,467), followed by the western Mediterranean (15,973), while the Black Sea has the lowest total (6874). However, the western Mediterranean has the highest cyclone density (1.15 per 100 km2) compared to the Black Sea (0.76 per 100 km2) and the eastern Mediterranean (0.69 per 100 km2). The eastern Mediterranean, being the largest sub basin with the highest total, has the lowest concentration of cyclones per area.
Based on annually resolved numbers, Sen’s slope reveals an increase of 0.12 cyclones per year for the entire region over the study period, corresponding to an overall 2.2% increase with no significant trend. While annual totals reveal no significant trends, we find a significant summer increase over the entire region (30.3%). Significant summer increases in the number of cyclones are also evident in the eastern (31.5%) and the western Mediterranean (39.1%). In the western Mediterranean, we also find a significant increase in spring (20.7%), while the Black Sea shows a significant decrease in winter (−37.8%).
Comparing two periods (1940–1980 and 1981–2024), peak cyclonic activity is observed in May/June during the first period but in August during the second period. This leads to an increase in cyclone frequency during summer, while activity is reduced during winter and autumn.
Our analysis reveals that the majority (63.1–67.4%) of cyclones in the entire Mediterranean and its subregions shows durations ranging from 24 to 72 h. The second common group shows durations of 72 to 120 h (20.4–23.0%), followed by cyclones persisting for 120 to 240 h (6.4–9.1%).
A notable feature of our study is not a uniform annual increase or decrease in cyclone numbers but rather seasonal changes in the annual pattern of cyclonic activity. We have noted an increase in the warmer months after 1980 in the satellite era, and a more pronounced increase after ≈1995 in the modern satellite era. However, this increase cannot be solely attributed to the enhanced availability of observations in the satellite era, as a similar trend is not consistently observed across other seasons.
Despite the uncertainties identified in the projection of IMILAST [14] in cyclone behavior, the warming of the Mediterranean surface indicate that cyclones will encounter thermodynamic conditions. These conditions are favorable for intensification and transition of cyclones to tropical-like storms. This has implications for extreme weather events, precipitation, and water management.
Author Contributions
Conceptualization, M.A.K. and U.F.; methodology, M.A.K. and U.F.; software, M.A.K.; validation, M.A.K. and U.F.; formal analysis, M.A.K.; investigation, M.A.K. and U.F.; resources, U.F.; data curation, M.A.K.; writing—original draft preparation, M.A.K.; writing—review and editing, U.F.; visualization, M.A.K.; supervision, U.F.; project administration, M.A.K. and U.F.; funding acquisition, U.F. All authors have read and agreed to the published version of the manuscript.
Funding
This research was funded by the Arqus European University Alliance through the Arqus Talent Scholarship Fund and by the University of Graz.
Data Availability Statement
The data used for this study are freely available in the ECMWF ERA5 reanalysis dataset. The specific data for this study comprise hourly ERA5 pressure level data from 1940 to the present, recalculated on a regular 0.25° grid for latitude and longitude. These data are available in the Copernicus Climate Data Store at the following link https://cds.climate.copernicus.eu/datasets/reanalysis-era5-pressure-levels?tab=overview (accessed on 20 April 2026).
Acknowledgments
The authors gratefully acknowledge the University of Graz for financial support and all the resources and tools needed for this research. We also gratefully acknowledge the Arqus European University Alliance for its financial support through the Arqus Talent Scholarship. Their support was essential to the success of this research project.
Conflicts of Interest
The authors declare no conflicts of interest.
Appendix A
It should be noted that the values shown in Figure A1, Figure A2 and Figure A3 are seasonal averages calculated from monthly cyclone counts while the values in Table A1 represent the mean seasonal counts over the entire study period. Therefore, the values in the figures represent approximately one-third of the values in the table.
Figure A1 presents the monthly and average seasonal cyclone variation in the western Mediterranean over the study period. Here, seasonal averages of cyclone frequency are calculated from the monthly counts each year. In spring, the minimum (8.0) number of cyclones has been recorded in 1983, followed by a slight increase with some variations, reaching a maximum (29.6) in 2022. Similar to the entire Mediterranean region, the highest number of cyclones in the region is observed in summer, where it exhibits a seasonal mean of 25.3 cyclones per year over the study period, with a minimum (15.0) in 1980 and a maximum (60.0) in 2022. On the other hand, autumn and winter represent lower seasonal averages of 14.0 and 8.1 cyclones, respectively. In autumn, cyclone numbers ranged between 5.3 and 26.3, where the highest value is recorded in 2021 and the lowest in 1960. Winter cyclone counts ranged between 3.6 and 12.3, with a maximum activity in 1942 and a minimum in 1984.
Figure A1.
Interannual variability of monthly (actual) and seasonal (average) cyclone track counts in the western Mediterranean basin from 1940 to 2024. The plots representing each season show the monthly time series (see legend) and the corresponding seasonal mean (black line). The y-axis scale differs between the upper and lower plots to optimize the variability between seasons.
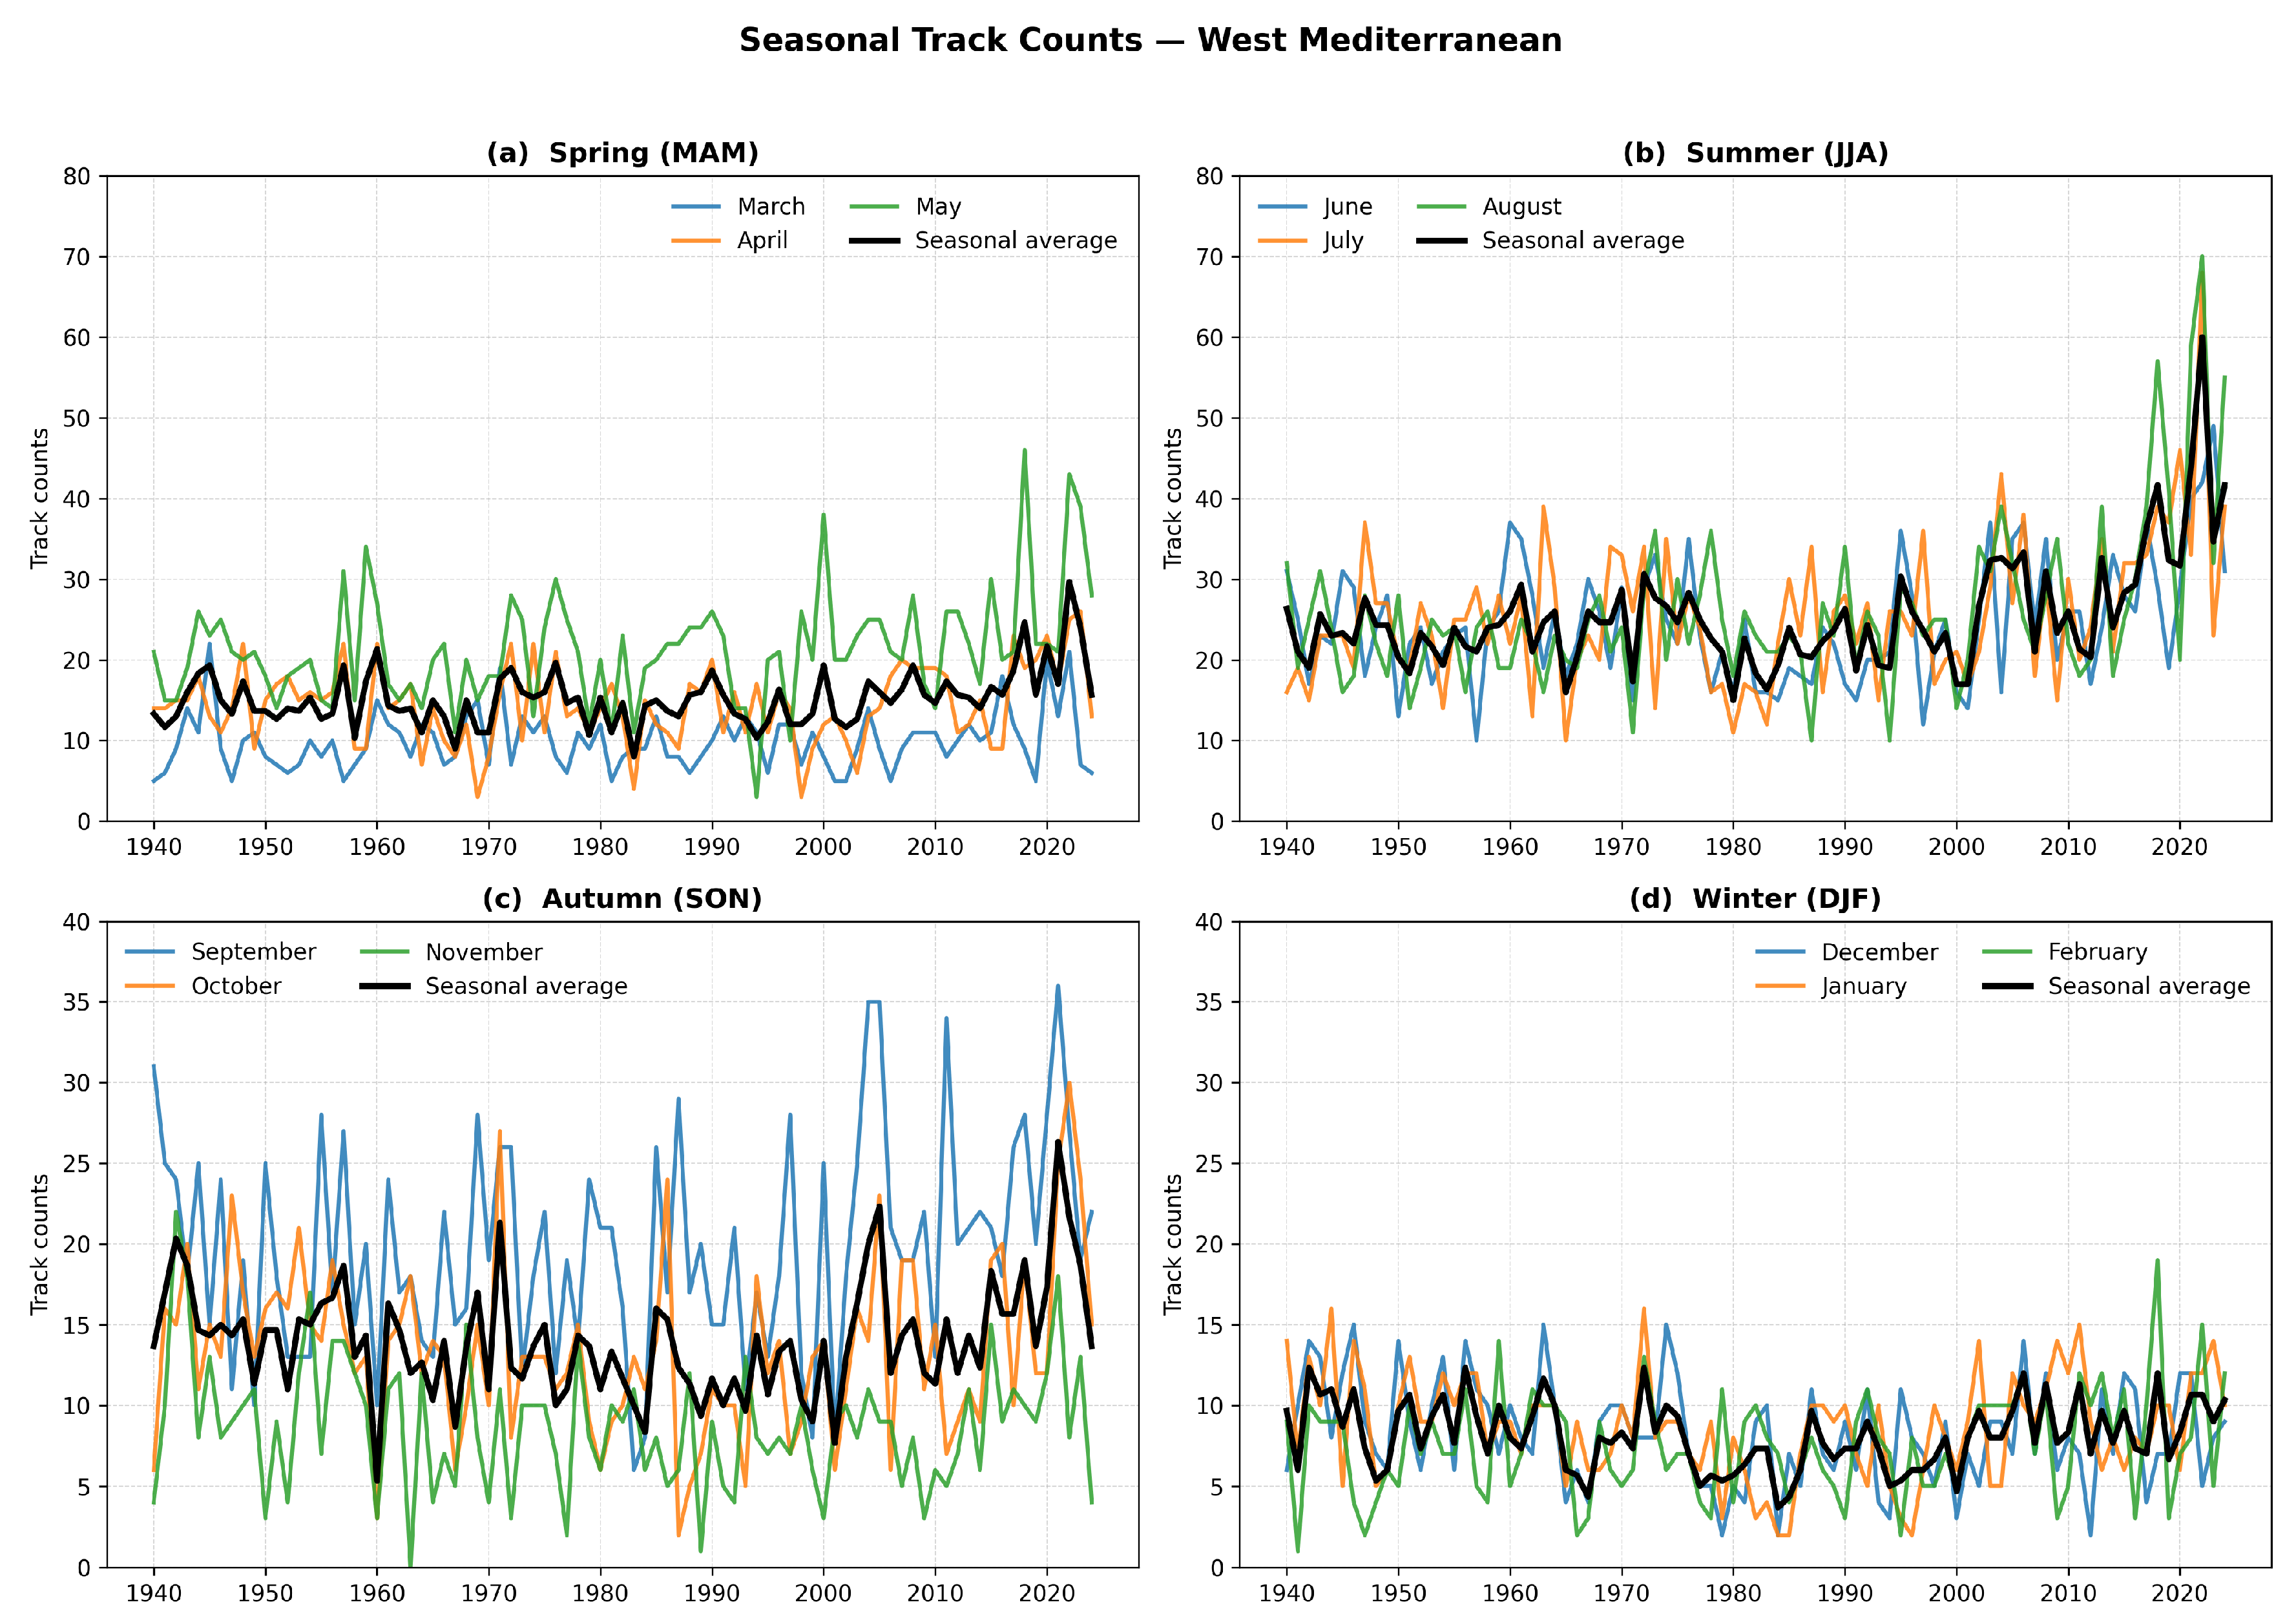
Further results, based on the 85-year mean seasonal counts in the western Mediterranean over the study period, presented in Table A1, confirm that summer has the maximum cyclone counts, with a frequency of 75.9 ± 4.4 (95% CI) cyclones. On the contrary, winter shows about one-third of this frequency (24.5 ± 1.3). Spring shows moderate behavior, with 45.6 ± 2.2 cyclones, closely followed by autumn, with 42.0 ± 2.2 cyclones.
Table A1.
Regional monthly and seasonal summary. The significant trend values () are presented with bold numbers.
The eastern Mediterranean, being the biggest sub basin, shows a defined cyclone climatology, characterized by the highest annual cyclone frequency. Figure A2 presents the monthly and seasonal average cyclone variation in the eastern Mediterranean basin. Seasonal means of cyclone activity indicate stable numbers during all the seasons except in summer. In spring, the minimum (11.3) number of cyclones has been recorded in 2004, and the highest (32.0) in 1957. Like in the western Mediterranean, the highest value of cyclones in the region is observed in summer, with a seasonal mean of 25.2 cyclones per year. The minimum (13.3) value of cyclones in summer is recorded in 1980 and a maximum (48.6) in 2022. Autumn and winter represent lower seasonal means of 19.3 and 11.9 cyclones, respectively. The number of cyclones ranged between 9.3 and 30.6 in autumn, where the highest value is observed in 1957 and the lowest in 1996. Winter cyclone counts ranged between 7.0 and 17.3, where an activity maximum is recorded in 1971 and a minimum in 1941.
Figure A2.
Interannual variability of monthly (actual) and seasonal (average) cyclone track counts in the eastern Mediterranean basin from 1940 to 2024. The plots representing each season show the monthly time series (see legend) and the corresponding seasonal mean (black line). The y-axis scale differs between the upper and lower plots to optimize the variability between seasons.
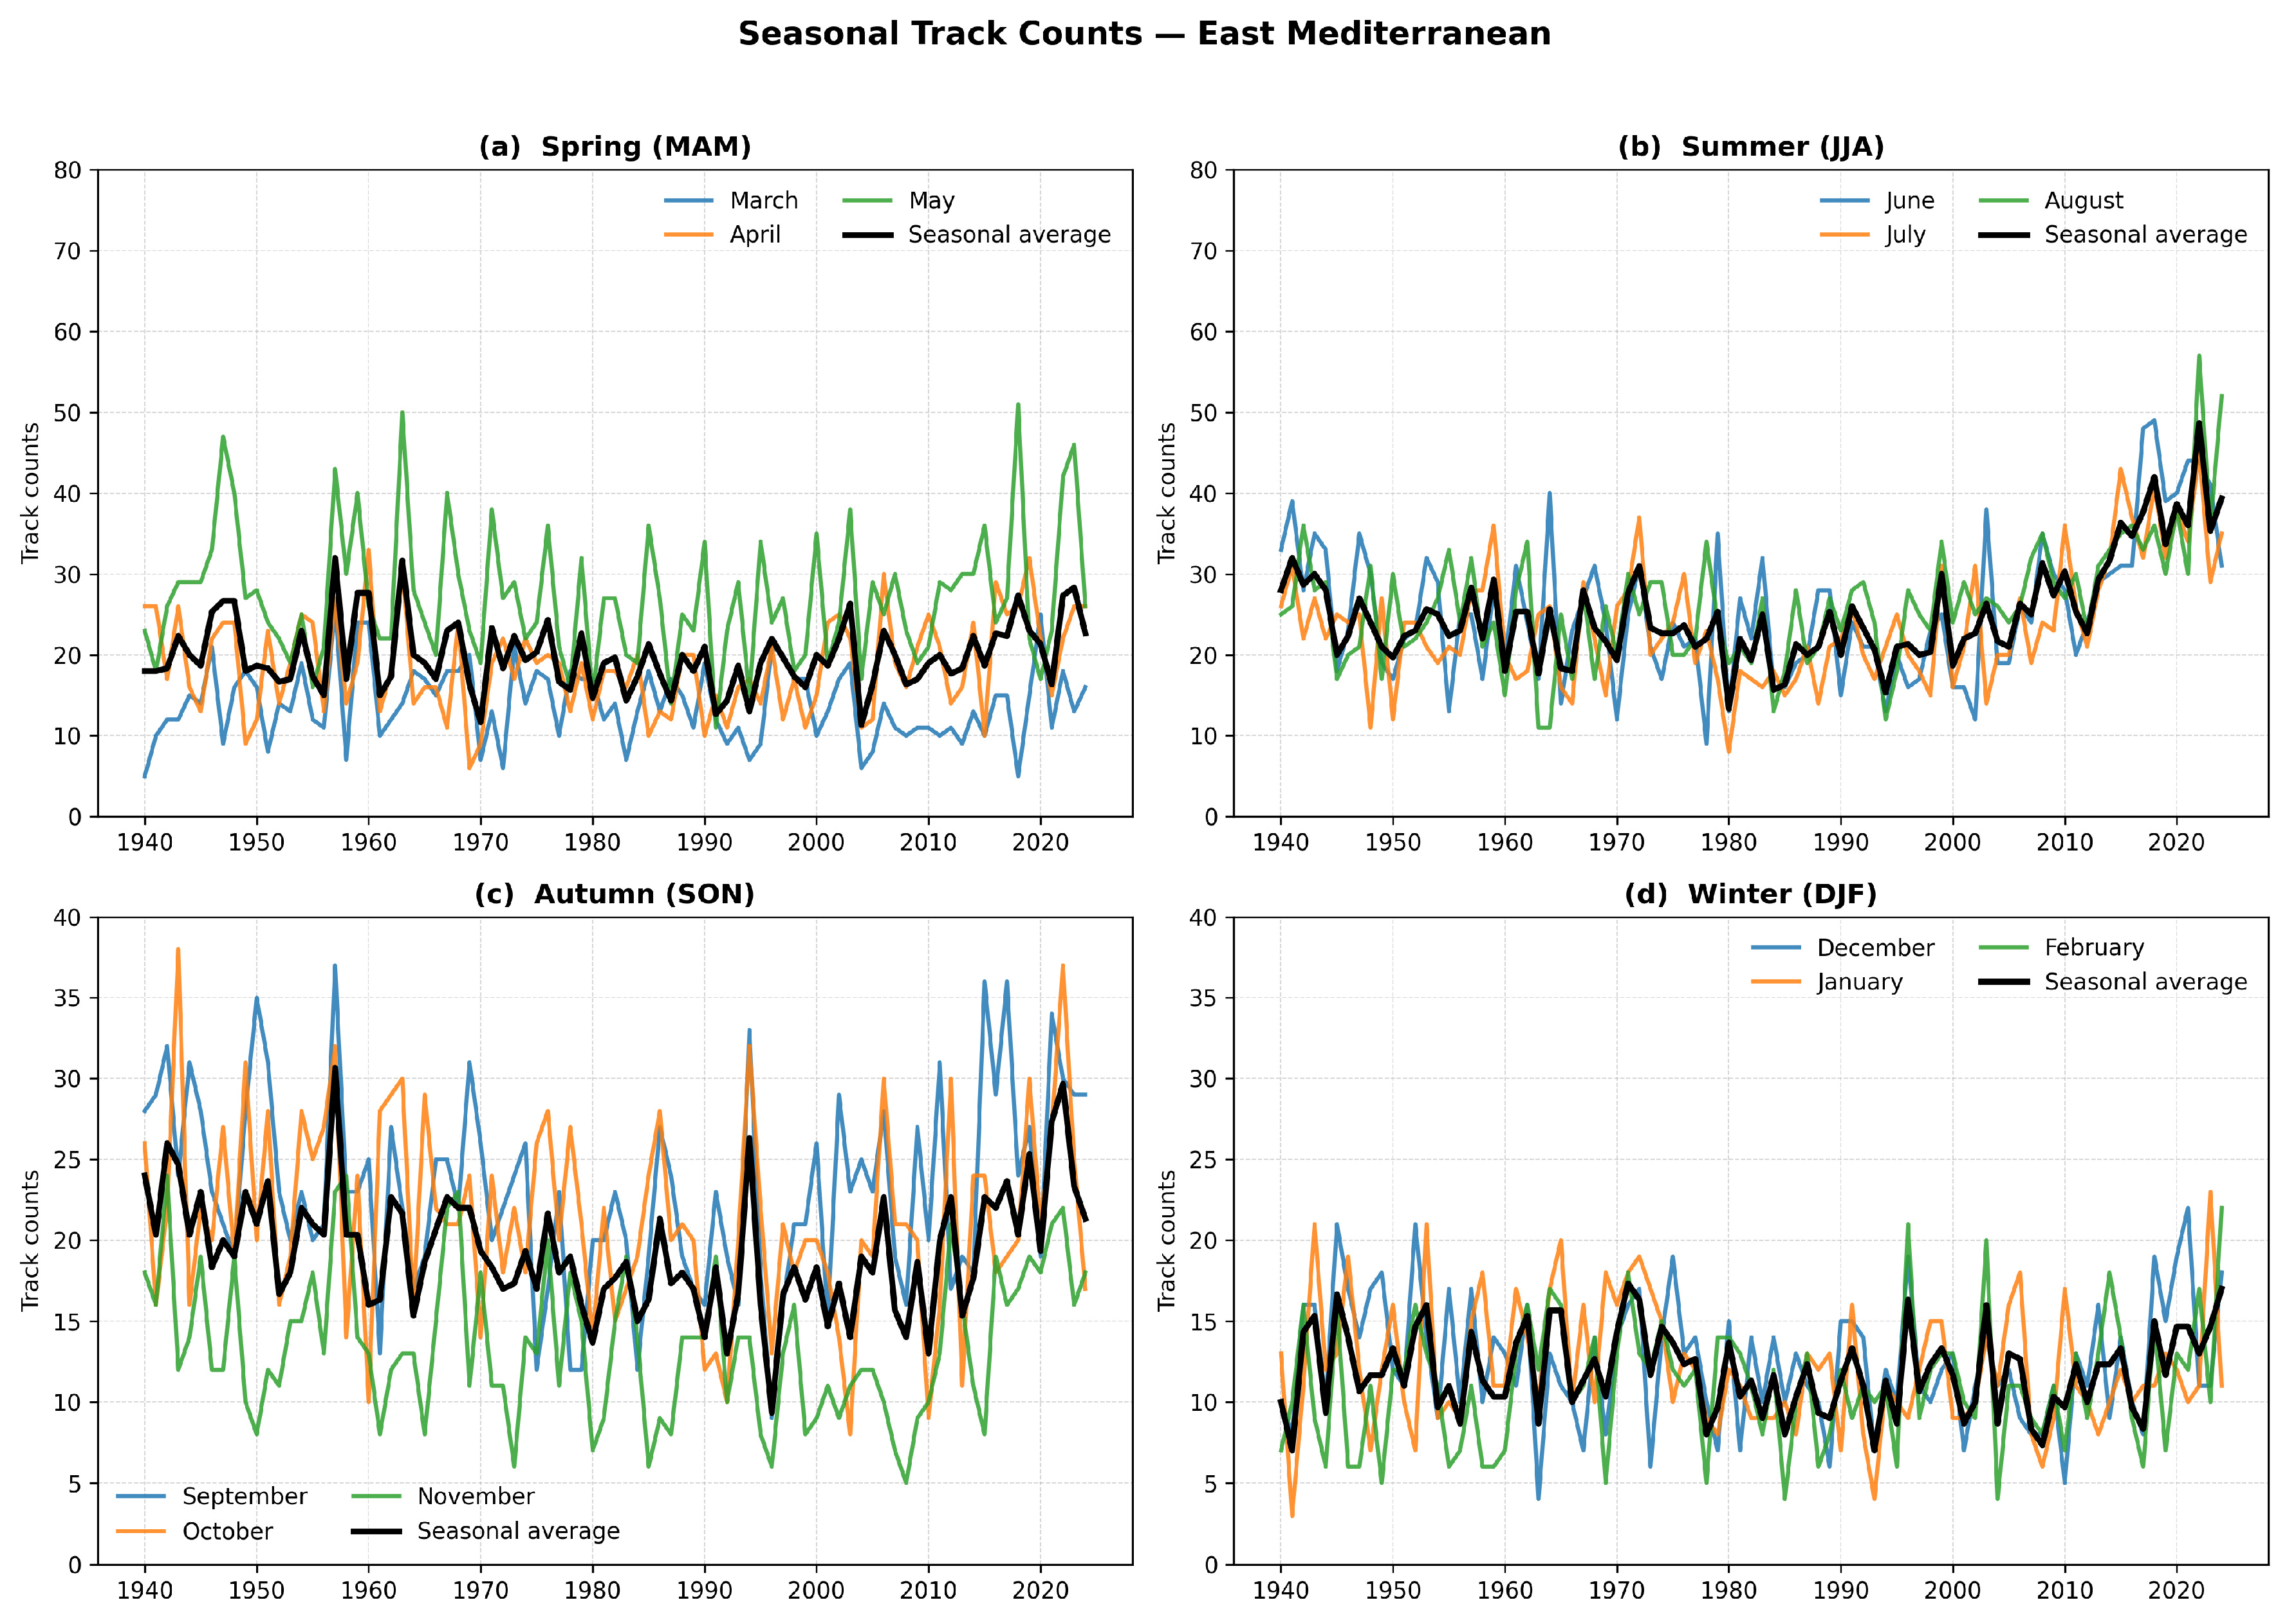
Further results based on the 85-year mean seasonal totals in the eastern Mediterranean (Table A1) confirm that summer has the highest (75.6 ± 4.0) mean value of cyclones over the study period, which is, however, slightly lower than the mean value in the western Mediterranean (75.9 ± 4.4). Except for summer, all seasons represent higher mean cyclone frequencies than in the western Mediterranean. Summer is followed by spring, with a mean of 59.6 ± 2.7, and autumn, with a mean of 58.1 ± 2.4 cyclones. Winter represents a mean (35.7 ± 1.7) that is approximately half that of summer.
The Black Sea, although geographically connected to the Mediterranean Sea, exhibits a different cyclone climatology, with stable average numbers during all seasons and no increase in summer. As a smaller, enclosed basin with distinct atmospheric factors, it has the lowest cyclone frequency among the regions analyzed. Figure A3 presents the monthly and seasonal mean cyclone frequencies in the Black Sea for each year, where seasonal averages are based on monthly counts. Spring shows a mean of 7.9 cyclones over the study period. A maximum average (19.0) of cyclones for spring is recorded in 1946 whereas a minimum (3.3) is recorded in 1992. Summer has a maximum mean value of 10.7 cyclones. Autumn and winter show comparatively lower seasonal means of 5 and 3.4 cyclones, respectively. The seasonal minimums of cyclones are recorded for autumn (1.3) and winter (0.6) in 1990 and 1989, whereas maximums for autumn (9.6) and winter (7.0) are recorded in 2024 and 1972, respectively.
Figure A3.
Interannual variability of monthly (actual) and seasonal (average) cyclone track counts in the Black Sea from 1940 to 2024. The plots representing each season show the monthly time series (see legend) and the corresponding seasonal mean (black line).
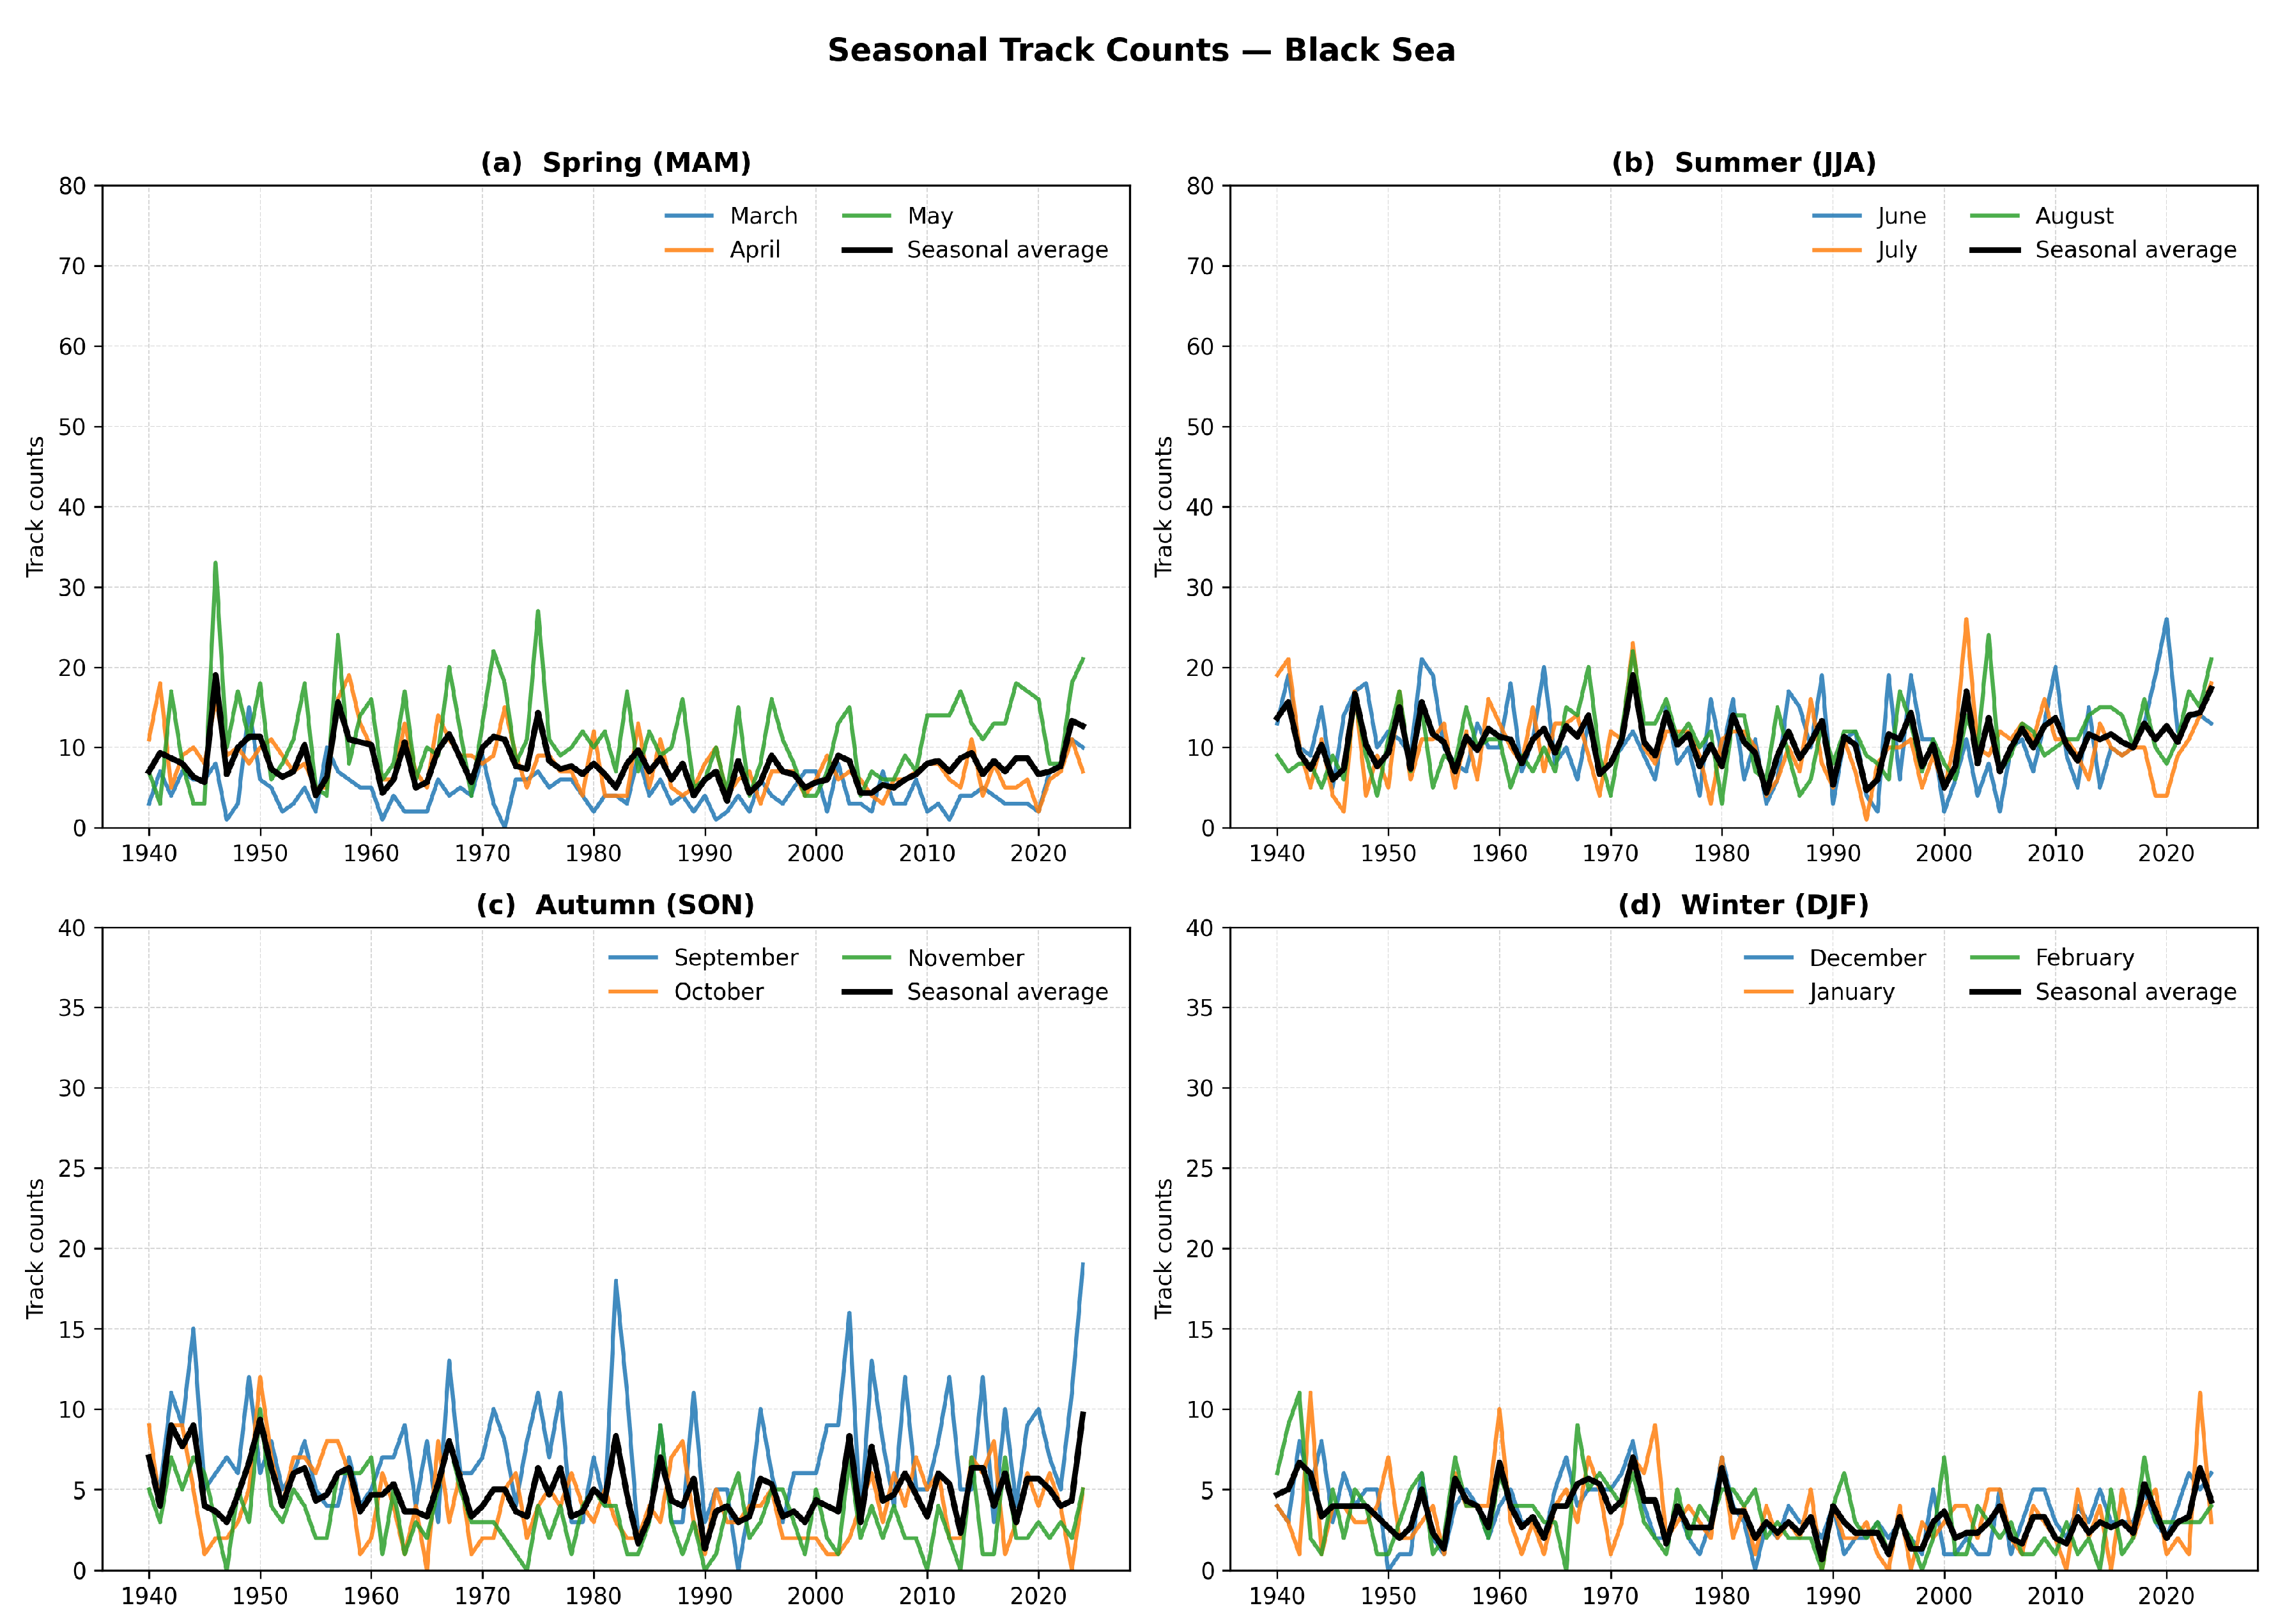
Further analysis based on 85-year mean seasonal totals, presented in Table A1, reveals that summer is the most active season, with a frequency of 32.1 ± 1.9 cyclones, accounting for 39.6% of the annual total. This is followed by spring, with 23.8 ± 1.7 cyclones, while autumn and winter are comparatively lower, with 14.9 ± 1.1 and 10.2 ± 0.9 cyclones, respectively.
References
- Cavicchia, L.; von Storch, H.; Gualdi, S. A long-term climatology of medicanes. Clim. Dyn. 2014, 43, 1183–1195. [Google Scholar] [CrossRef] [Scilit]
- Khodayar, S.; Kushta, J.; Catto, J.L.; Dafis, S.; Davolio, S.; Ferrarin, C.; Flaounas, E.; Groenemeijer, P.; Hatzaki, M.; Hochman, A.; et al. Mediterranean cyclones in a changing climate: A review on their socio-economic impacts. Rev. Geophys. 2025, 63, e2024RG000853. [Google Scholar] [CrossRef] [Scilit]
- Flaounas, E.; Davolio, S.; Raveh-Rubin, S.; Pantillon, F.; Miglietta, M.M.; Gaertner, M.A.; Hatzaki, M.; Homar, V.; Khodayar, S.; Korres, G.; et al. Mediterranean cyclones: Current knowledge and open questions on dynamics, prediction, climatology and impacts. Weather Clim. Dyn. 2022, 3, 173–208. [Google Scholar] [CrossRef] [Scilit]
- Trigo, I.F.; Bigg, G.R.; Davies, T.D. Climatology of cyclogenesis mechanisms in the Mediterranean. Mon. Weather Rev. 2002, 130, 549–569. [Google Scholar] [CrossRef] [Scilit]
- Samman, A.E. Synoptic and Dynamic Analyses of an Intense Mediterranean Cyclone: A Case Study. Climate 2025, 13, 126. [Google Scholar] [CrossRef] [Scilit]
- Fita, L.; Flaounas, E. Medicanes as subtropical cyclones: The December 2005 case from the perspective of surface pressure tendency diagnostics and atmospheric water budget. Q. J. R. Meteorol. Soc. 2018, 144, 1028–1044. [Google Scholar] [CrossRef] [Scilit]
- Emanuel, K. Genesis and maintenance of “Mediterranean hurricanes”. Adv. Geosci. 2005, 2, 217–220. [Google Scholar] [CrossRef] [Scilit]
- Argüeso, D.; Marcos, M.; Amores, A. Storm Daniel fueled by anomalously high sea surface temperatures in the Mediterranean. npj Clim. Atmos. Sci. 2024, 7, 307. [Google Scholar] [CrossRef] [Scilit]
- Cioni, G.; Cerrai, D.; Klocke, D. Investigating the predictability of a Mediterranean tropical-like cyclone using a storm-resolving model. Q. J. R. Meteorol. Soc. 2018, 144, 1598–1610. [Google Scholar] [CrossRef] [Scilit]
- Davolio, S.; Miglietta, M.; Moscatello, A.; Pacifico, F.; Buzzi, A.; Rotunno, R. Numerical forecast and analysis of a tropical-like cyclone in the Ionian Sea. Nat. Hazards Earth Syst. Sci. 2009, 9, 551–562. [Google Scholar] [CrossRef] [Scilit]
- Faranda, D.; Coppola, E. The “Medicanes” (Mediterranean Hurricanes) and Climate Change. 2023. Available online: https://xaida.eu/medicanes-and-climate-change/ (accessed on 15 April 2026).
- Reale, M.; Cabos Narvaez, W.D.; Cavicchia, L.; Conte, D.; Coppola, E.; Flaounas, E.; Giorgi, F.; Gualdi, S.; Hochman, A.; Li, L.; et al. Future projections of Mediterranean cyclone characteristics using the Med-CORDEX ensemble of coupled regional climate system models. Clim. Dyn. 2022, 58, 2501–2524. [Google Scholar] [CrossRef] [Scilit]
- Wernli, H.; Schwierz, C. Surface cyclones in the ERA-40 dataset (1958–2001). Part I: Novel identification method and global climatology. J. Atmos. Sci. 2006, 63, 2486–2507. [Google Scholar] [CrossRef] [Scilit]
- Neu, U.; Akperov, M.G.; Bellenbaum, N.; Benestad, R.; Blender, R.; Caballero, R.; Cocozza, A.; Dacre, H.F.; Feng, Y.; Fraedrich, K.; et al. IMILAST: A community effort to intercompare extratropical cyclone detection and tracking algorithms. Bull. Am. Meteorol. Soc. 2013, 94, 529–547. [Google Scholar] [CrossRef] [Scilit]
- Romero, R.; Emanuel, K. Climate change and hurricane-like extratropical cyclones: Projections for North Atlantic polar lows and medicanes based on CMIP5 models. J. Clim. 2017, 30, 279–299. [Google Scholar] [CrossRef] [Scilit]
- Racah, E.; Beckham, C.; Maharaj, T.; Ebrahimi Kahou, S.; Prabhat, M.; Pal, C. Extremeweather: A large-scale climate dataset for semi-supervised detection, localization, and understanding of extreme weather events. Adv. Neural Inf. Process. Syst. 2017, 30, 3405–3416. [Google Scholar]
- Zolina, O.; Gulev, S.K. Improving the accuracy of mapping cyclone numbers and frequencies. Mon. Weather Rev. 2002, 130, 748–759. [Google Scholar] [CrossRef] [Scilit]
- Alpert, P.; Neeman, B.; Shay-El, Y. Climatological analysis of Mediterranean cyclones using ECMWF data. Tellus A Dyn. Meteorol. Oceanogr. 1990, 42, 65–77. [Google Scholar] [CrossRef] [Scilit]
- Mann, H.B. Nonparametric tests against trend. Econom. J. Econom. Soc. 1945, 13, 245–259. [Google Scholar] [CrossRef] [Scilit]
- Sen, P.K. Estimates of the regression coefficient based on Kendall’s tau. J. Am. Stat. Assoc. 1968, 63, 1379–1389. [Google Scholar] [CrossRef]
- Mann, H.B.; Whitney, D.R. On a test of whether one of two random variables is stochastically larger than the other. Ann. Math. Stat. 1947, 18, 50–60. [Google Scholar] [CrossRef] [Scilit]
- Hersbach, H.; Bell, B.; Berrisford, P.; Biavati, G.; Horányi, A.; Muñoz Sabater, J.; Nicolas, J.; Peubey, C.; Radu, R.; Rozum, I.; et al. ERA5 hourly data on pressure levels from 1940 to present. Copernic. Clim. Chang. Serv. (C3S) Clim. Data Store (CDS) 2023, 10, 24381. [Google Scholar] [CrossRef]
- International Hydrographic Organization. Limits of Oceans and Seas, 3rd ed.; Number 23 in Special Publication; International Hydrographic Bureau: Monte Carlo, Monaco, 1953. [Google Scholar]
- Hofstätter, M.; Chimani, B.; Lexer, A.; Blöschl, G. A new classification scheme of European cyclone tracks with relevance to precipitation. Water Resour. Res. 2016, 52, 7086–7104. [Google Scholar] [CrossRef] [Scilit]
- Hofstätter, M.; Lexer, A.; Homann, M.; Blöschl, G. Large-scale heavy precipitation over central Europe and the role of atmospheric cyclone track types. Int. J. Climatol. 2018, 38, e497–e517. [Google Scholar] [CrossRef] [Scilit]
- Pinto, J.G.; Spangehl, T.; Ulbrich, U.; Speth, P. Sensitivities of a cyclone detection and tracking algorithm: Individual tracks and climatology. Meteorol. Z. 2005, 14, 823–838. [Google Scholar] [CrossRef] [Scilit] [PubMed]
- Trigo, I.F.; Davies, T.D.; Bigg, G.R. Objective climatology of cyclones in the Mediterranean region. J. Clim. 1999, 12, 1685–1696. [Google Scholar] [CrossRef] [Scilit]
- Ueno, K. Inter-annual variability of surface cyclone tracks, atmospheric circulation patterns, and precipitation patterns, in winter. J. Meteorol. Soc. Jpn. Ser. II 1993, 71, 655–671. [Google Scholar] [CrossRef] [Scilit]
- Lionello, P.; Trigo, I.F.; Gil, V.; Liberato, M.L.; Nissen, K.M.; Pinto, J.G.; Raible, C.C.; Reale, M.; Tanzarella, A.; Trigo, R.M.; et al. Objective climatology of cyclones in the Mediterranean region: A consensus view among methods with different system identification and tracking criteria. Tellus A Dyn. Meteorol. Oceanogr. 2016, 68, 29391. [Google Scholar] [CrossRef] [Scilit]
- Raible, C.; Della-Marta, P.; Schwierz, C.; Wernli, H.; Blender, R. Northern Hemisphere extratropical cyclones: A comparison of detection and tracking methods and different reanalyses. Mon. Weather Rev. 2008, 136, 880–897. [Google Scholar] [CrossRef] [Scilit]
- Padilha Reinke, C.K.; Machado, J.P.; Mata, M.M.; de Azevedo, J.L.L.; Saraiva, J.M.B.; Rodrigues, R. Objective Algorithm for Detection and Tracking of Extratropical Cyclones in the Southern Hemisphere. Atmosphere 2024, 15, 230. [Google Scholar] [CrossRef] [Scilit]
- Hofstätter, M.; Blöschl, G. Vb cyclones synchronized with the Arctic-/North Atlantic oscillation. J. Geophys. Res. Atmos. 2019, 124, 3259–3278. [Google Scholar] [CrossRef] [Scilit]
- Picornell, M.; Jansa, A.; Genovés, A.; Campins, J. Automated database of mesocyclones from the HIRLAM (INM)-0.5° analyses in the western Mediterranean. Int. J. Climatol. 2001, 21, 335–354. [Google Scholar] [CrossRef] [Scilit]
- Lim, E.P.; Simmonds, I. Southern Hemisphere winter extratropical cyclone characteristics and vertical organization observed with the ERA-40 data in 1979–2001. J. Clim. 2007, 20, 2675–2690. [Google Scholar] [CrossRef] [Scilit]

Disclaimer/Publisher’s Note: The statements, opinions and data contained in all publications are solely those of the individual author(s) and contributor(s) and not of MDPI and/or the editor(s). MDPI and/or the editor(s) disclaim responsibility for any injury to people or property resulting from any ideas, methods, instructions or products referred to in the content. |
© 2026 by the authors. Licensee MDPI, Basel, Switzerland. This article is an open access article distributed under the terms and conditions of the Creative Commons Attribution (CC BY) license.