


Abstract
Deforestation in unprotected areas (UPAs) within the Brazilian Amazon affects environmental sustainability and regional climate. This study quantifies shifts in near-surface air temperature, precipitation, and evapotranspiration (ET) during the dry season resulting from UPA loss. Utilizing a five-year ensemble (2015–2019) to isolate the climatic response from interannual variability, simulations indicate a warmer (+1.0 ± 0.4 °C) and drier climate, characterized by a basin-wide 12 ± 8% reduction in precipitation and a 12 ± 4% reduction in ET following UPA removal. This shifted climate state extends to Rondônia, a southwestern state where detailed risk mapping was developed by integrating changes in climate variables with socio-economic, agricultural, and demographic. UPA deforestation, largely external to Rondônia, is associated with a simulated decrease in precipitation by 20 ± 7% and ET by 11 ± 9% coupled with an increase in air temperature by 1.2 ± 0.4 °C. These shifts indicate increased vulnerability for municipalities, including the capital, potentially affecting agricultural productivity. Findings suggest that to protect remaining forests these biophysical risks must be mitigated. This study establishes a spatial framework for identifying municipalities most suceptible to the climatic shifts triggered by UPA loss.
1. Introduction
The Brazilian Amazon, a key global ecological asset, faces significant environmental challenges due to deforestation, particularly in UnProtected Areas (UPAs). Despite covering only 15% of the region, UPAs were responsible for a disproportionate 36% of the illegal deforestation in 2022 [1]. Forest loss in UPAs remains rampant, with primary forest loss in 2020 hitting the highest levels of the decade. Across the entire Brazilian Amazon, forest area decreased from 394 million hectares in 2000 to 366 million hectares in 2021, representing a loss of 28 million hectares. This decline was predominantly concentrated in UPAs, accounting for approximately 95% of the total forest area loss during this period [2]. Since 2019, environmental law enforcement has significantly weakened, exacerbating deforestation and environmental degradation [3,4,5,6]. This decline in governance effectiveness is evident from the substantial rise in illegal activities within Indigenous territories and other protected lands, underscoring a requirement for robust environmental policies and governance to safeguard these ecosystems [7,8].
Since 2000, Indigenous Territories and Protected Areas (PAs) in the Brazilian Amazon have expanded to encompass 43% of the region’s land and approximately half its forest area, significantly contributing to biodiversity conservation and climate change mitigation [9,10]. While these areas are globally recognized for preserving carbon stocks and enhancing legal compliance, they face challenges from developmental pressures and relaxed environmental regulations post-2012, with threats such as mining remaining substantial [11,12]. Despite political resistance leading to the frequent downgrading or degazetting of PAs, recent research indicates their effectiveness in limiting deforestation rates compared to unprotected areas [13,14,15]. Consequently, illegal activities in undesignated or private lands continue to drive environmental degradation, with Brazil noted as a significant contributor to carbon emissions in 2022 [16,17].
In the state of Rondônia, a region where PAs are increasingly threatened, political interests in conservation led to the revocation of 11 areas in 2018 without public consultation or technical studies, highlighting vulnerabilities within state governance [18]. This specific region has seen substantial forest cover loss within its PAs over the last two decades due to agricultural expansion and infrastructural developments, often facilitated by PA Downgrading, Downsizing, and Degazettement (PADDD) events [19]. Furthermore, enforcement of environmental protections is weakened by resource limitations, leaving these areas prone to exploitation by economic activities [20,21]. While legal battles continue, with companies facing lawsuits for environmental damages, the fluctuating effectiveness of PAs in Rondônia underscores a necessity for robust governance and enhanced resource allocation to protect these ecosystems [22,23,24].
These anthropogenic pressures contribute to a broader feedback loop, as continued deforestation in the Amazon is driven by the expansion of cattle ranching, agricultural activities, road networks, and the erosion of environmental regulations and enforcement, among other contributing factors. Despite a 22% reduction in deforestation rates between 2022 and 2023 [25], these activities have historically accelerated deforestation. This deforestation modifies precipitation patterns, prolonging dry seasons and delaying wet seasons, underscoring the role of forest moisture recycling and regional ET in maintaining climatic balance [26,27,28,29,30]. These disruptions degrade ecosystems and increase the likelihood of extreme rainfall and droughts while also altering local and regional climates by reducing ET and convective precipitation and intensifying downwind convection [31]. The resultant shifts in energy fluxes and diminished ET are pushing the Amazon towards a hotter, more variable climate, particularly in its deforested southern and eastern regions, indicating the Amazon may have already entered a new climate regime [32,33,34,35].
To address these multi-scalar challanges, regional climate-land surface modeling is integrated with Multi-Criteria Decision Analysis (MCDA) to evaluate the consequences of UPA loss across scales. The study utilizes modeling to simulate the impacts of deforestation in UPAs on air temperature, precipitation, and evapotranspiration (ET) during the dry season. Additionally, risk mapping is conducted at the municipal level, merging climatic, agricultural, demographic, and socioeconomic data to evaluate the impacts on Rondônia, a vulnerable state in the southwest region of the Amazon basin. This research aims to assess the basin-scale climatic changes driven by deforestation in UPAs and explore how these changes influence risk at the municipal level. The specific configurations of this integrated approach are detailed in the Materials and Methods section, while the resulting climatic signals are compared with recent literature in the Results and Discussion section.
2. Materials and Methods
2.1. Study Area
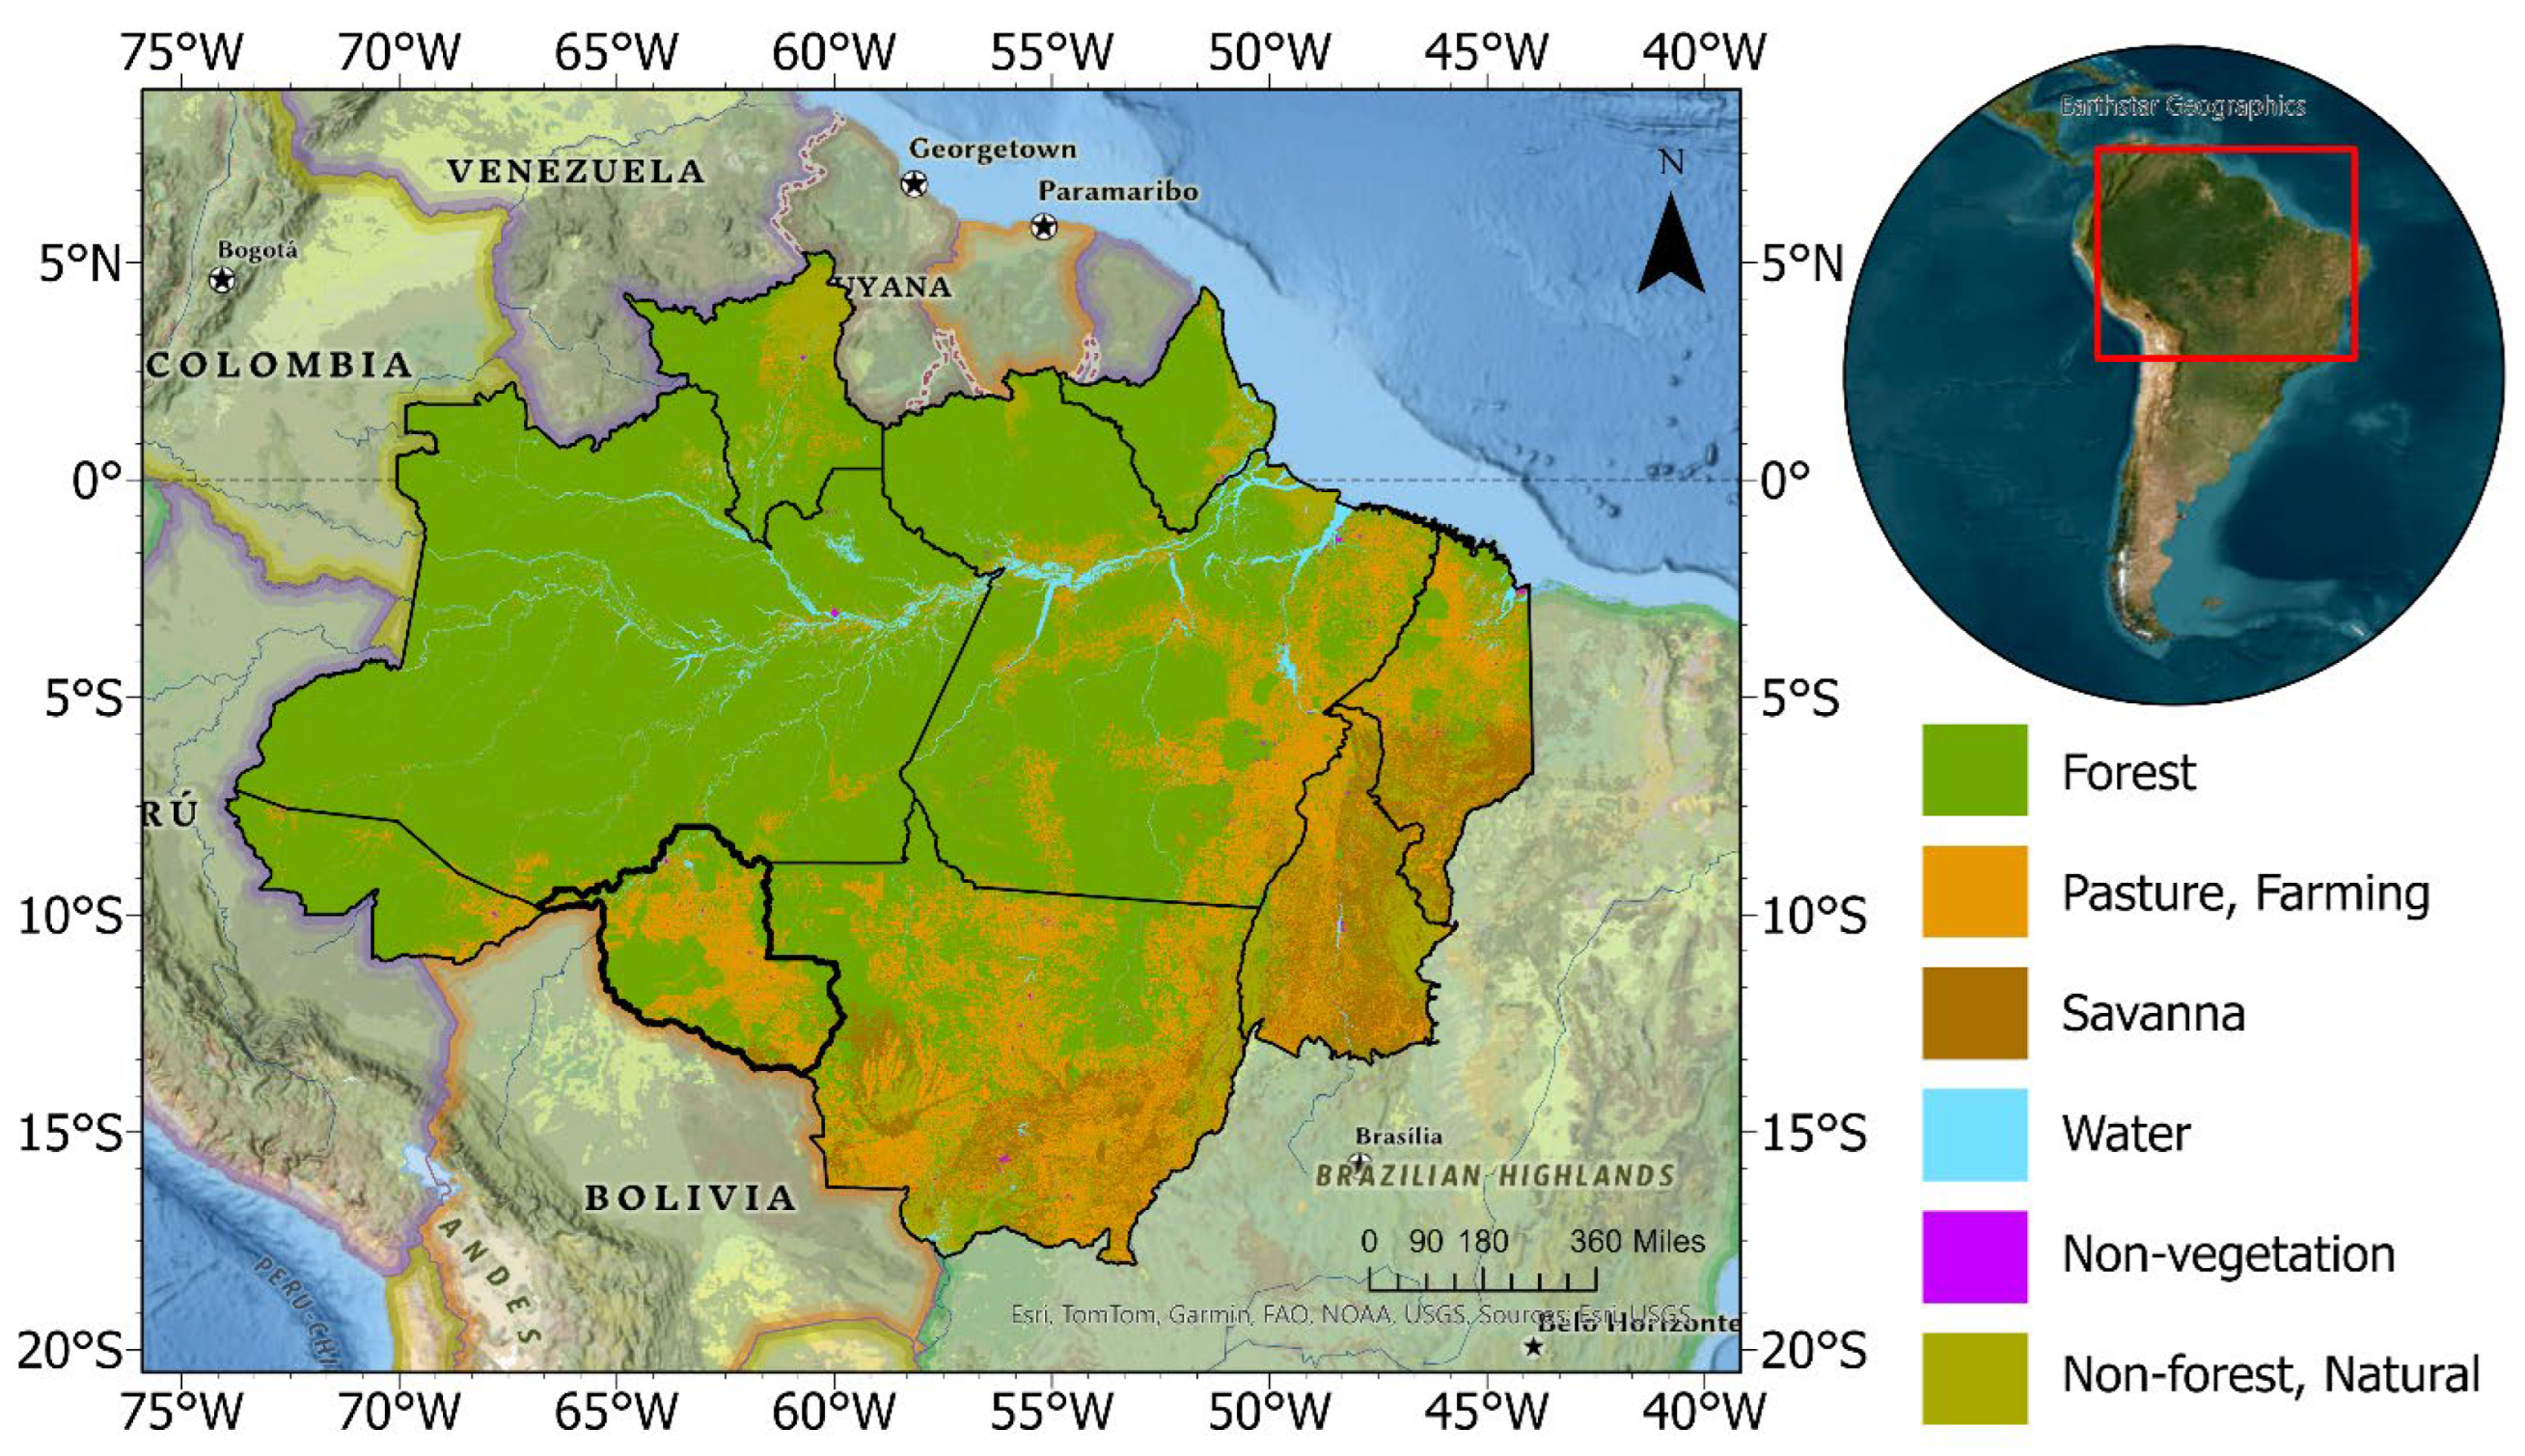
The study area encompasses the Brazilian Amazon and the state of Rondônia (Figure 1), regions selected to assess the impacts of deforestation across different spatial scales generated using ArcGIS Pro v3.2. The Amazon Basin and Rondônia feature a tropical humid climate with a dry season (June–September) typically characterized by daily highs of 31 °C to 35 °C and low monthly rainfall often falling below 30 mm in the most affected sectors [29,36]. The region has seen a basin-wide warming trend of 0.6 °C to 1.0 °C and a significantly lengthened dry season [32,37]. In Rondônia, specifically, forest loss has been linked to a delay in the onset of the rainy season by up to 18 days, as reduced ET weakens the regional moisture recycling needed to trigger convective rainfall [27].
Figure 1.
Location of the study area and land cover type. Rondônia is in the Southwest, as indicated by the thicker black outline. The land-use and land-cover data are derived from the 2017 TerraBrasilis/PRODES dataset provided by the Brazilian National Institute for Space Research (INPE).
Since the 1970s, significant population growth in Rondônia, spurred by highway construction, has improved accessibility throughout the state. This influx led to increased agricultural expansion, notably in beef and milk production, which serves as a major driver of deforestation. In response to both local and international demand for meat, increased livestock farming facilitated significant transformations from forest to pasture [38]. This trend has been supported by government agrarian reforms that incentivize settlers to clear tracts of land for agricultural use, establishing Rondônia as a focal point for studies on deforestation and its climatic impacts [39,40]. In Rondônia, the cattle production reached 17,688,225 heads in 2022 (https://sidra.ibge.gov.br/tabela/3939#resultado) (accessed on 15 June 2023), with 366,285 milk cows (https://sidra.ibge.gov.br/tabela/94#resultado) (accessed on 15 June 2023). The region also reported substantial milk production, with up to 8.8 million liters produced in a quarter (https://sidra.ibge.gov.br/tabela/1086#resultado) (accessed on 15 June 2023). This juxtaposition of spatial scales allows for a detailed examination of the broader climatic shifts within the Amazon and localized risks in Rondônia.
2.2. Modeling System
The Weather Research and Forecasting (WRF) regional climate model, coupled with the Simplified Simple Biosphere (SSiB) land surface model (LSM), was employed to analyze the climatic effects of deforestation in the Brazilian Amazon [41,42,43,44,45]. This land-climate model, WRF-SSiB, operates at 18 km resolution on a single unnested grid, covering the region from 25° S to 11° N and 85° W to 20° W. The domain encompasses the Atlantic Ocean to the east of South America with the WRF Single-moment 6-class scheme for microphysics [46], RRTMG radiation scheme [47], and the New Tiedtke cumulus scheme [48]. This model simulates changes in wind, moisture, and temperature regimes. Initial and lateral boundary conditions for the simulations were provided by the European Centre Medium-Range Weather Forecasts (ECMWF) ERA5 reanalysis, which offers a high-resolution reconstruction of the global atmosphere [49,50].
The model was run for the dry season (May–September) from 2015–2019 under two static scenarios: a control (CTL) and UPA deforestation scenario. While this 5-year period does not represent a 30-year climatological regime, it serves as a robust window to isolate the biophysical signal of land-cover change. Rather than a continuous simulation, an ensemble approach was employed to minimize uncertainties from initial boundary conditions and ensure a robust climate signal. For each scenario (CTL and UPA), the model was initiated on five sequential days (1 May–5 May) for each of the five years. This resulted in an ensemble of 25 simulations per scenario, providing a stable benchmark and a larger sample size for statistical analysis. May results were excluded from the analysis to account for model spin-up. The study window (2015–2019) was selected based on data available at the start of the research and the computational cost associated with high-resolution ensemble modeling.
2.3. Deforestation Representation
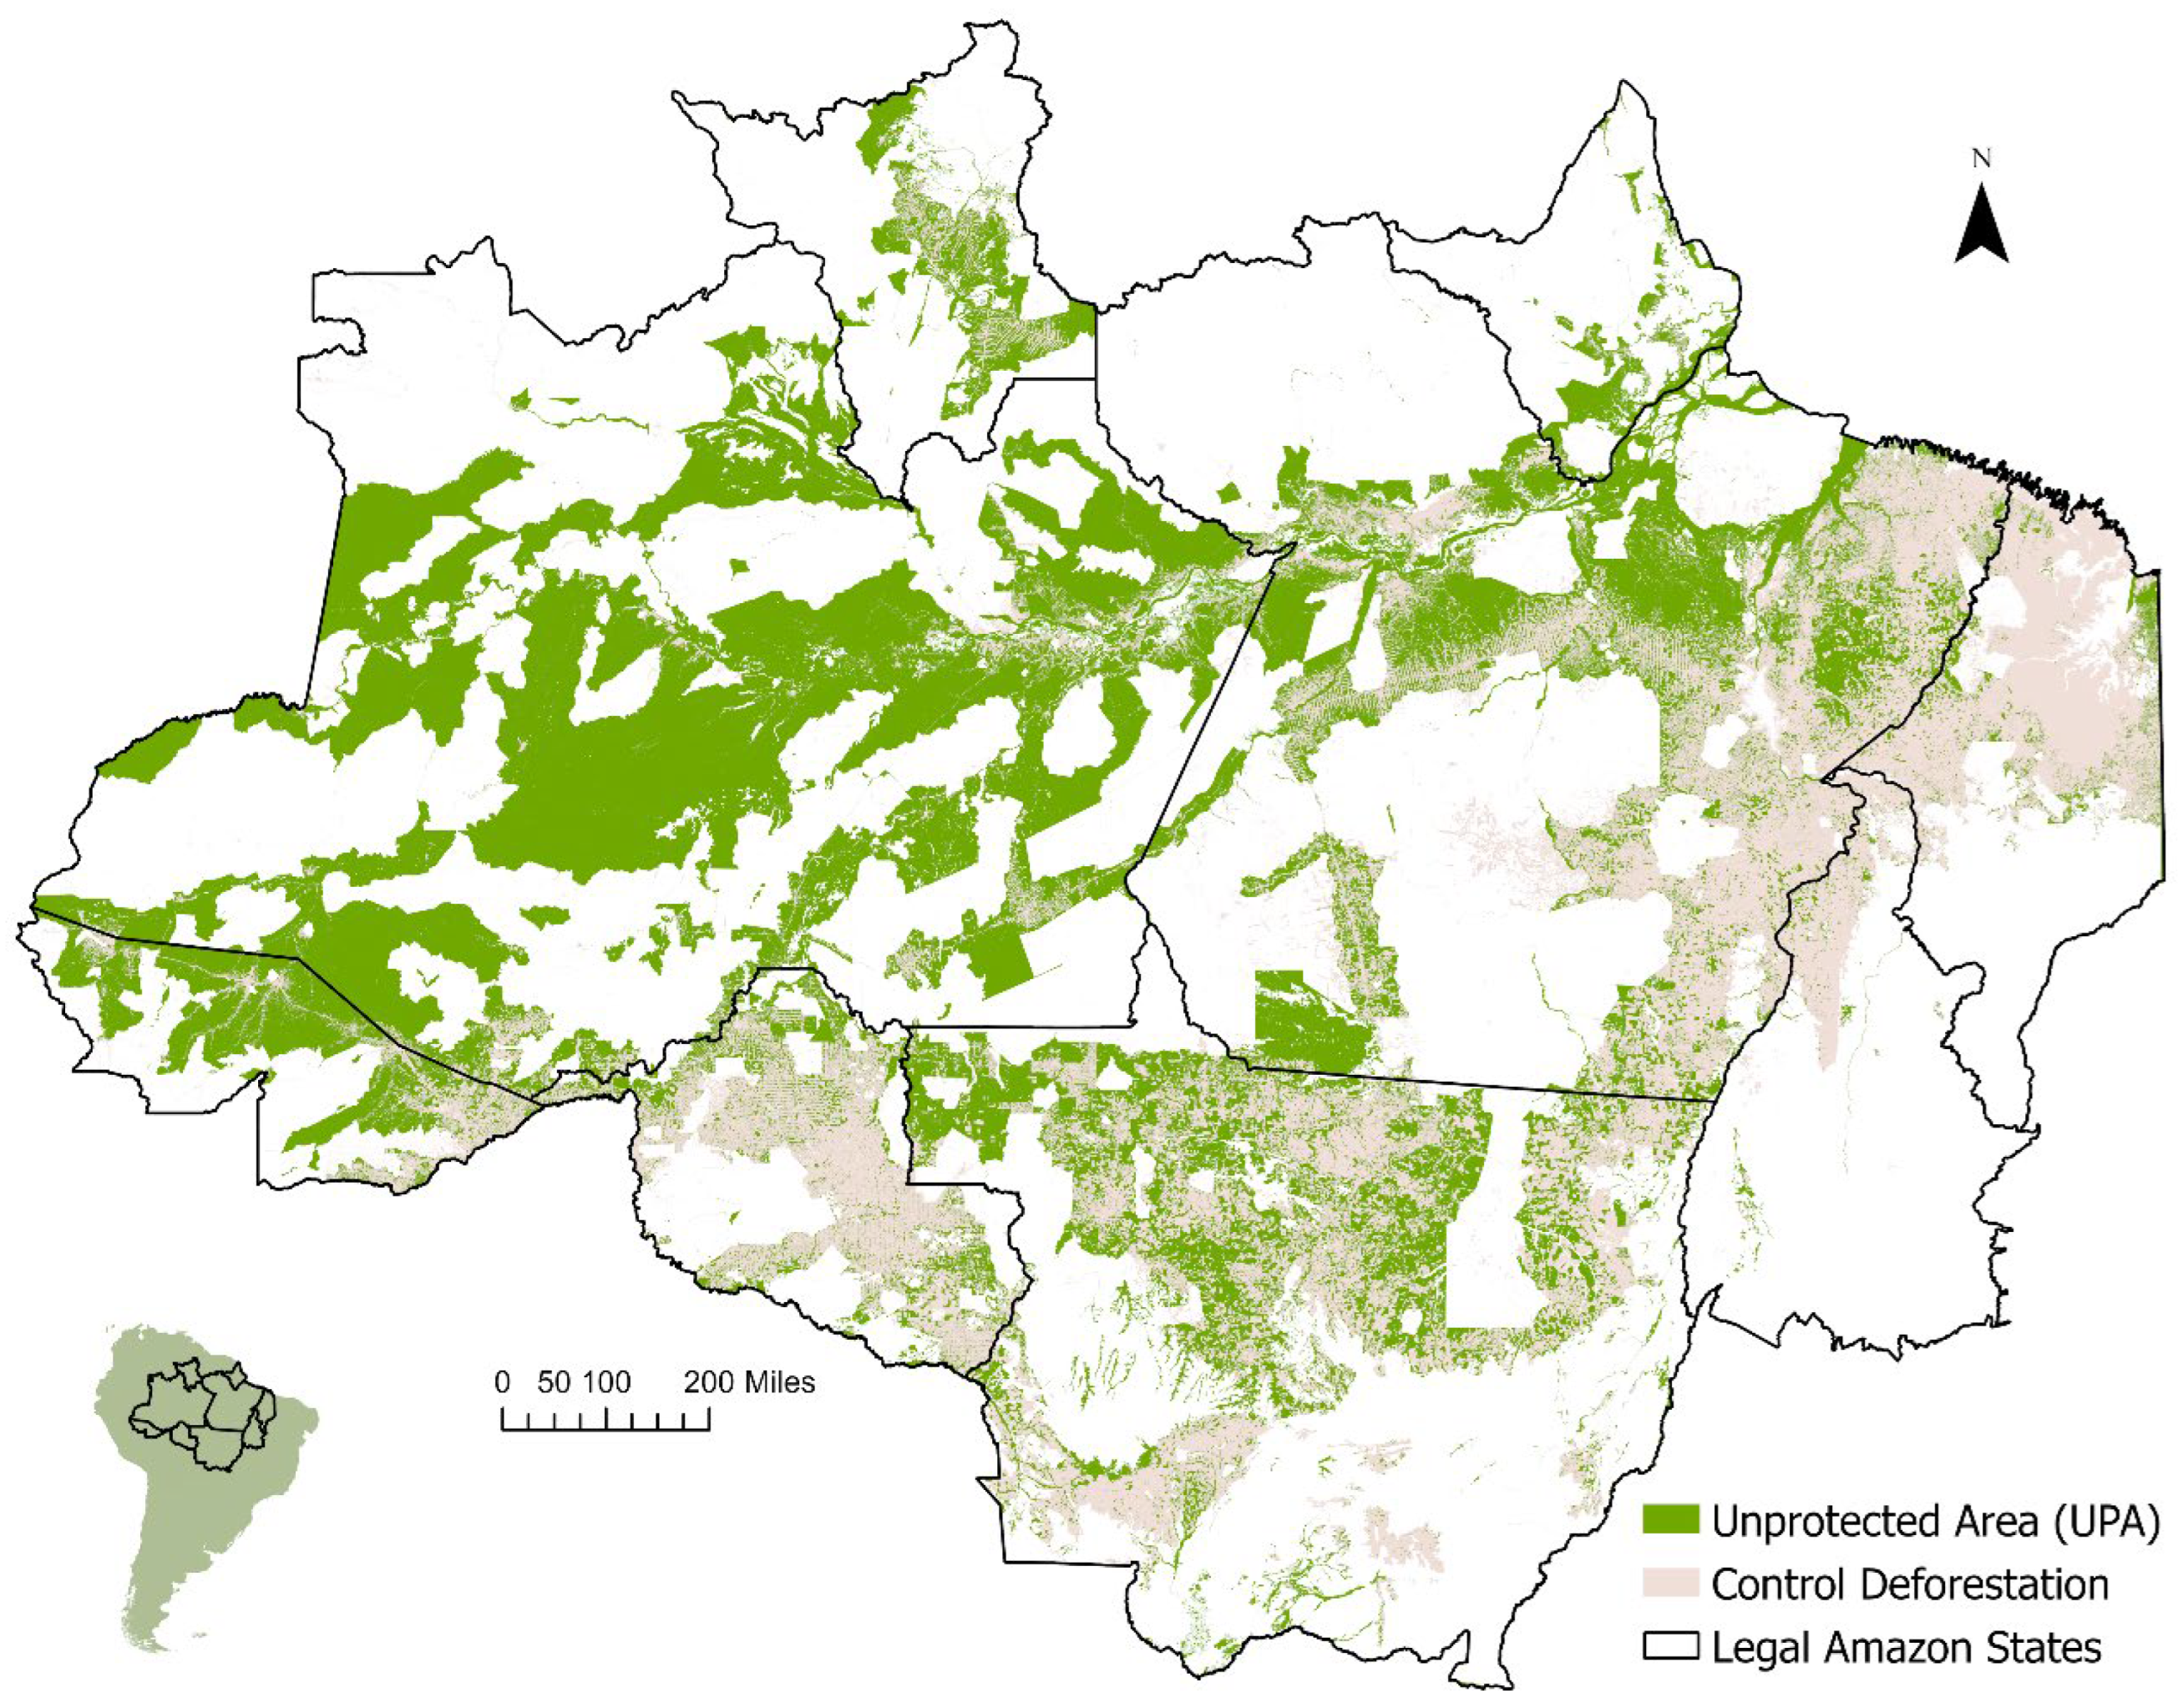
A map was developed a map to identify UPAs using data from the Brazilian National Institute for Space Research (INPE) Terrabrasilis 2017 dataset (https://terrabrasilis.dpi.inpe.br/en/home-page/) (accessed on 15 June 2023). Within ArcGIS Pro v3.2, shapefiles for layers, including conservation units, Indigenous areas in the Legal Amazon, and deforestation metrics, were integrated. The UPAs were delineated by identifying regions with existing forest cover that are neither within conservation units nor Indigenous areas and have not been deforested, marked as green in Figure 2.
Figure 2.
Map of unprotected areas and control deforestation in the Legal Amazon to be implemented in WRF-SSiB model.
To isolate the climatic impact of forest loss, two distinct modeling scenarios over the same geographic domain. The CTL scenario serves as the baseline, utilizing the observed 2017 land-cover map as a static benchmark for all simulation years (2015–2019), shown in pink in Figure 2. Given the scale of the Amazon basin, annual land-cover changes are relatively minor; utilizing 2017 as a mid-period baseline provides a representative and stable land-surface state while reducing computational load. In the UPA scenario, a sensitivity experiment was implemented where 100% of the forest areas within the identified UPAs were replaced with uniform grassland. This approach enables a direct comparison between the results of the UPA ensemble and the CTL ensemble to identify the climatic changes specifically triggered by the deforestation of UPAs. The focus on the dry season specifically isolates the land-atmosphere response during the period when regional climate is most sensitive to forest-mediated moisture recycling rather than large-scale ENSO-driven wet season variability.
SSiB contains 13 vegetation types derived from the International Satellite Land Surface Climatology Project (ISLSCP), the University of Maryland Global Land Cover Classifications (https://daac.ornl.gov/cgi-bin/dsviewer.pl?ds_id=969) (accessed on 15 June 2023). In the UPA scenario, 100% of the forest areas within the identified UPAs were replaced with a uniform grassland class. This experiment represents an absolute conversion rather than incremental loss, isolating the climatic signal from UPA deforestation without the interference of interannual variability. While post-deforestation landscapes are often a mosaic of uses, the study follows the established modeling strategy of [51]. In addition, the SSiB model architecture does not support a sub-grid mosaic option. Table 1 contains the parameter information for forest and deforested cover [44].
Table 1.
Vegetation Parameters.
2.4. Observational Data
The modeled air temperature was validated using the Climate Research Unit (CRU) dataset, which offers air temperature records at 0.5° spatial resolution from station data [52], and the Copernicus Atmosphere Monitoring Service (CAMS) datasets with approximately 0.7° spatial resolution that combine satellite observations, in situ measurements, and model data [53]. Precipitation validation employed three datasets: the Climate Hazards Group Infrared Precipitation with Stations (CHIRPS) providing quasi-global estimates at 0.05° spatial resolution [54], the CPC Merged Analysis of Precipitation (CMAP) that merges satellite and gauge data at 2.5° resolution [55], and the CRU dataset at 0.5° resolution. All datasets were evaluated at the monthly scale.
2.5. Analysis
2.5.1. Basin-Wide Analysis
Differences in key climatic variables for the dry season months (JJAS), including air temperature, wind, ET, and precipitation, were calculated by subtracting the five-year (2015–2019) ensemble mean of the CTL scenario from the five-year ensemble mean of the UPA scenario. To determine the statistical significance of these changes, a two-tailed Student’s t-test was performed comparing the CTL and UPA ensembles. With five years of data and five realizations per year, the total sample size for each scenario was n = 25. To evaluate the mechanisms behind precipitation changes, moisture flux and convergence at 900 mb were analyzed at 900 mb, providing a detailed examination of the response of the climate system to deforestation.
2.5.2. Risk Mapping
Risk maps for Rondônia were developed, integrating climatic changes with agricultural and socio-economic data at the municipal level. This involved integrating criteria, such as simulated precipitation, temperature, and ET changes. Agricultural criteria such as cattle and milked cow counts, and socioeconomic and demographic factors, including population density and Gross Domestic Product (GDP) per capita, were also included (Table 2; Supplementary Information (SI) Figure S1). The analysis utilized both bivariate maps and multi-criteria maps to assess vulnerability to climatic changes.
Table 2.
Risk analysis data sources.
Bivariate maps categorized each variable into three levels (low, medium, high) cross-tabulated into a 3 × 3 matrix to visually represent combinations like low-low or high-high using a color gradient, indicating varying risk levels across municipalities. Utilizing natural breaks for categorization provides a spatial depiction of risk. Such maps are useful in illustrating the compounding effects of interrelated variables such as near-surface air temperature change and population density on heat vulnerability. Although population density is a valuable indicator for depicting heat risk, it was not included in the multi-criteria maps. The focus of the multi-criteria analysis was primarily on agricultural and economic factors, specifically GDP and livestock numbers, which are more directly relevant to the objectives of assessing agricultural impacts and vulnerabilities in rural areas. The utility of bivariate mapping is well-documented and allows for an intuitive understanding of two variables [56,57,58].
MCDA was utilized to evaluate the potential impact of climatic change on agriculture and vulnerable populations at the municipal level in Rondônia. The analysis considered six criteria to define risk: changes in precipitation, air temperature, and ET due to UPA deforestation; cattle and milk cow counts; and GDP per capita. The weightings, calculated through the Analytic Hierarchy Process (AHP), prioritize climatic changes as the primary risk drivers (combined weight of 76.8%) to align with the objective of mapping risk triggered by UPA deforestation. Agricultural exposure factors, cattle and milk cow counts, were weighted equally (9.4% each) to reflect regional livelihood reliance on the beef and dairy sectors. The relatively low weight assigned to GDP per capita (4.4%) is a deliberate choice to focus the risk mapping on the biophysical vulnerability of the agricultural sector. Given that Rondônia’s economy relies on livestock and milk production, where cattle populations at times outnumber inhabitants in many municipalities, the direct exposure of these assets to rising temperatures and decreasing precipitation is a primary indicator of risk. AHP involved constructing and normalizing a pairwise comparison matrix (Table 3 and Table 4), calculating criteria weights, and assessing the consistency of judgments [59,60,61]. The pairwise comparison matrix yielded a Consistency Ratio (CR) of 0.02. Since this value is lower than the 0.10 threshold proposed by Saaty, the inconsistency in the pairwise judgments is considered acceptable and the resulting weights are statistically consistent [62]).
Table 3.
The Analytical Hierarchy Process (AHP) comparison matrix, criteria weights, and consistency ratio.
Table 4.
Scale for pairwise comparison (Saaty, 1987) [60].
Utilizing these weighted criteria, the ArcPro suitability tool mapped municipalities by risk (Supplementary Information Equations (S1) and (S2)) ensuring the final map shows areas where precipitation and ET change are negative, air temperature change is positive, cattle and milk cow counts are high, and GDP is low. Risk classification employed the Jenks natural breaks method to identify inherent data groupings, data clusters, and outliers, thus optimizing classification and highlighting regions from ‘most at risk’ to ‘least at risk’ for targeted planning [63]. The map developed in this research incorporates key components of risk [64]—hazard, exposure, and vulnerability, within the context of climatic changes. Hazard is represented by changes in climatic variables such as precipitation, temperature, and ET derived from climate simulations. Exposure is represented through cattle and milk cow counts. Vulnerability is represented through GDP, reflecting the economic capacity to respond to climatic changes. This map illustrates the potential impacts of climatic variability on agricultural systems, emphasizing areas where the confluence of high climatic hazard, high agricultural activity, and low GDP increases vulnerability.
3. Results and Discussion
3.1. Model Performance
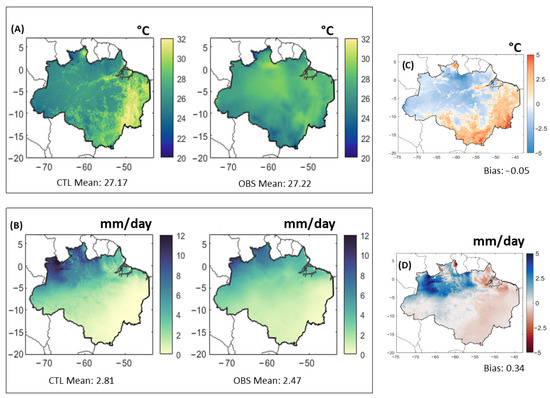
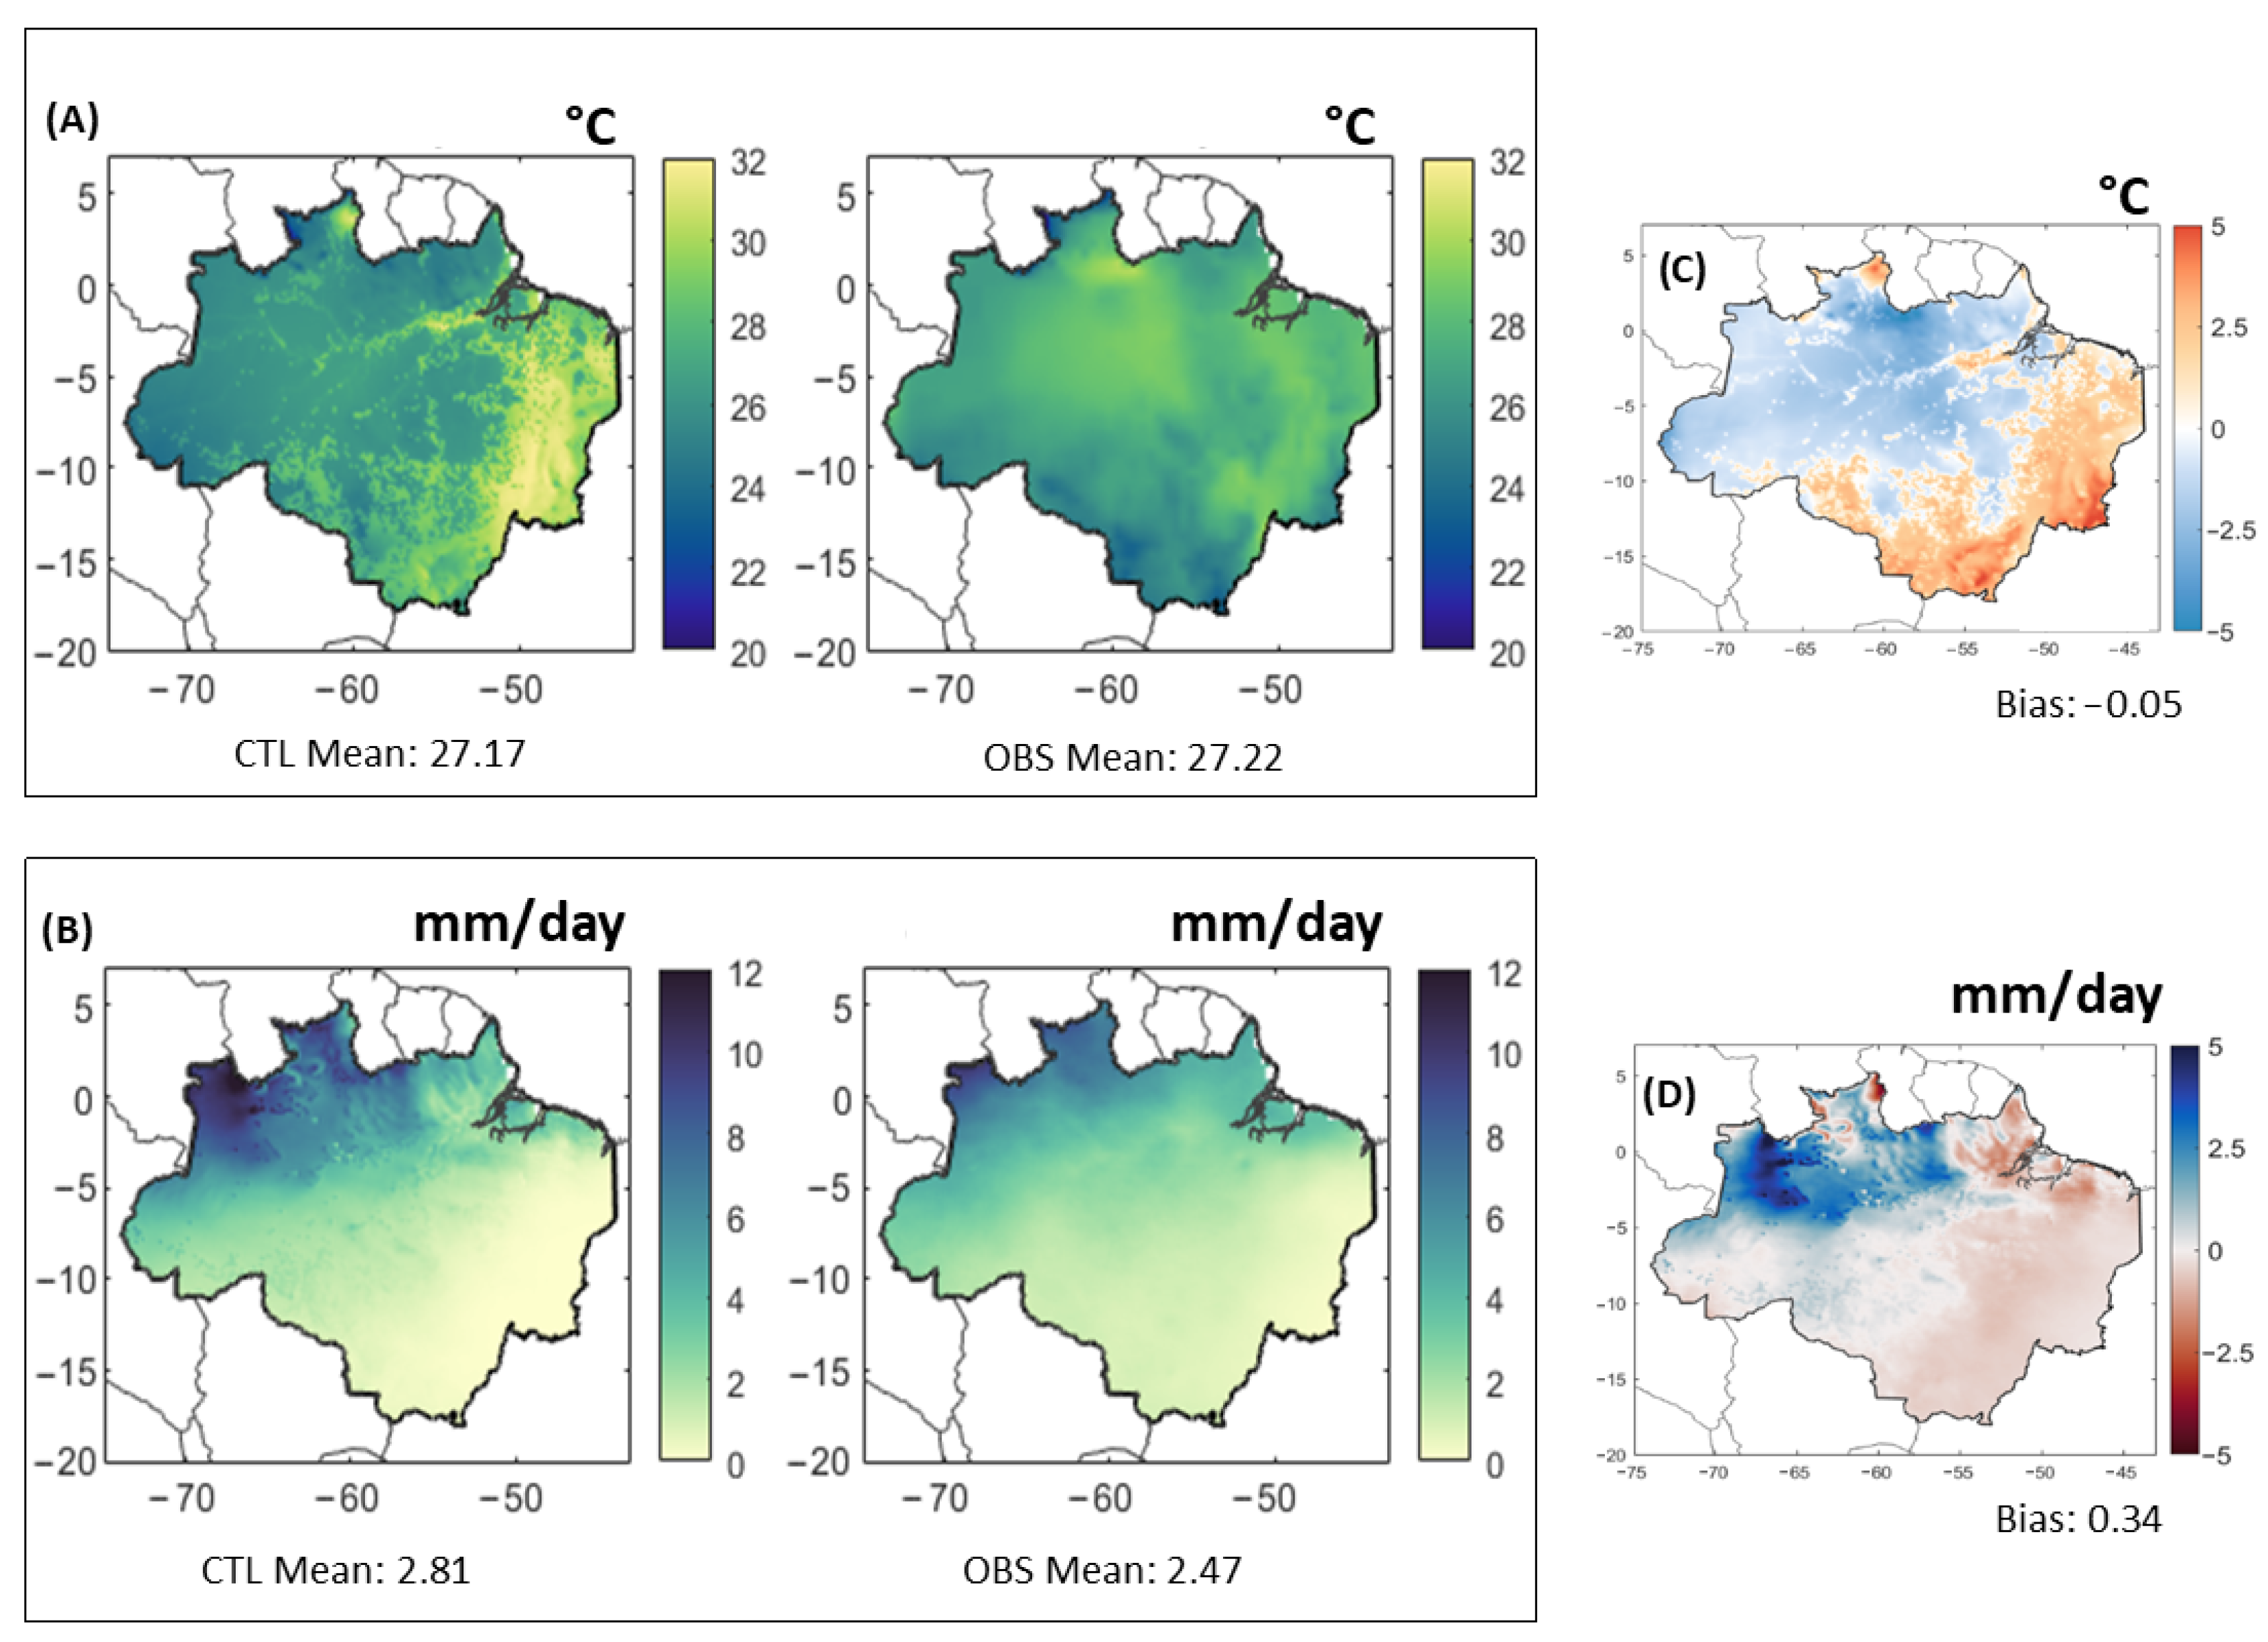
The WRF-SSiB model simulates regional 2 m air temperature and precipitation from 2015–2019 (Figure 3). Analysis reveals a minor cold bias (−0.05 °C, 0.2%) against the observed mean temperature of 27.2 °C, and a root-mean-square error (RMSE) of 1.7 °C (RMSE 6%). Temperature is overestimated by up to 5 °C in the deforested area on the southern boundary and underestimated in the forested north. The model exhibits a mean wet bias (0.34 mm/day, 12%) in precipitation against an observed average of 2.8 mm/day, with an RMSE of 0.83 mm/day (RMSE 30%). Precipitation is underestimated in the deforested south and overestimated in the forested north. These metrics demonstrate the model’s effectiveness in depicting Amazonian climatic conditions and its applicability for risk assessment. While these metrics characterize the performance of the model in depicting Amazonian climatic conditions, climate modeling is subject to uncertainties and biases, especially in regions with sparse observational data [65,66]. This scarcity indicates a requirement for additional observational sites to refine models and improve predictions [67].
Figure 3.
JJAS (2015–2019) average (A) 2 m air temperature for CTL and observed, (B) precipitation for CTL and observed (C) 2 m air temperature bias, (D) precipitation bias.
3.2. Basin-Wide Impacts of Deforestation
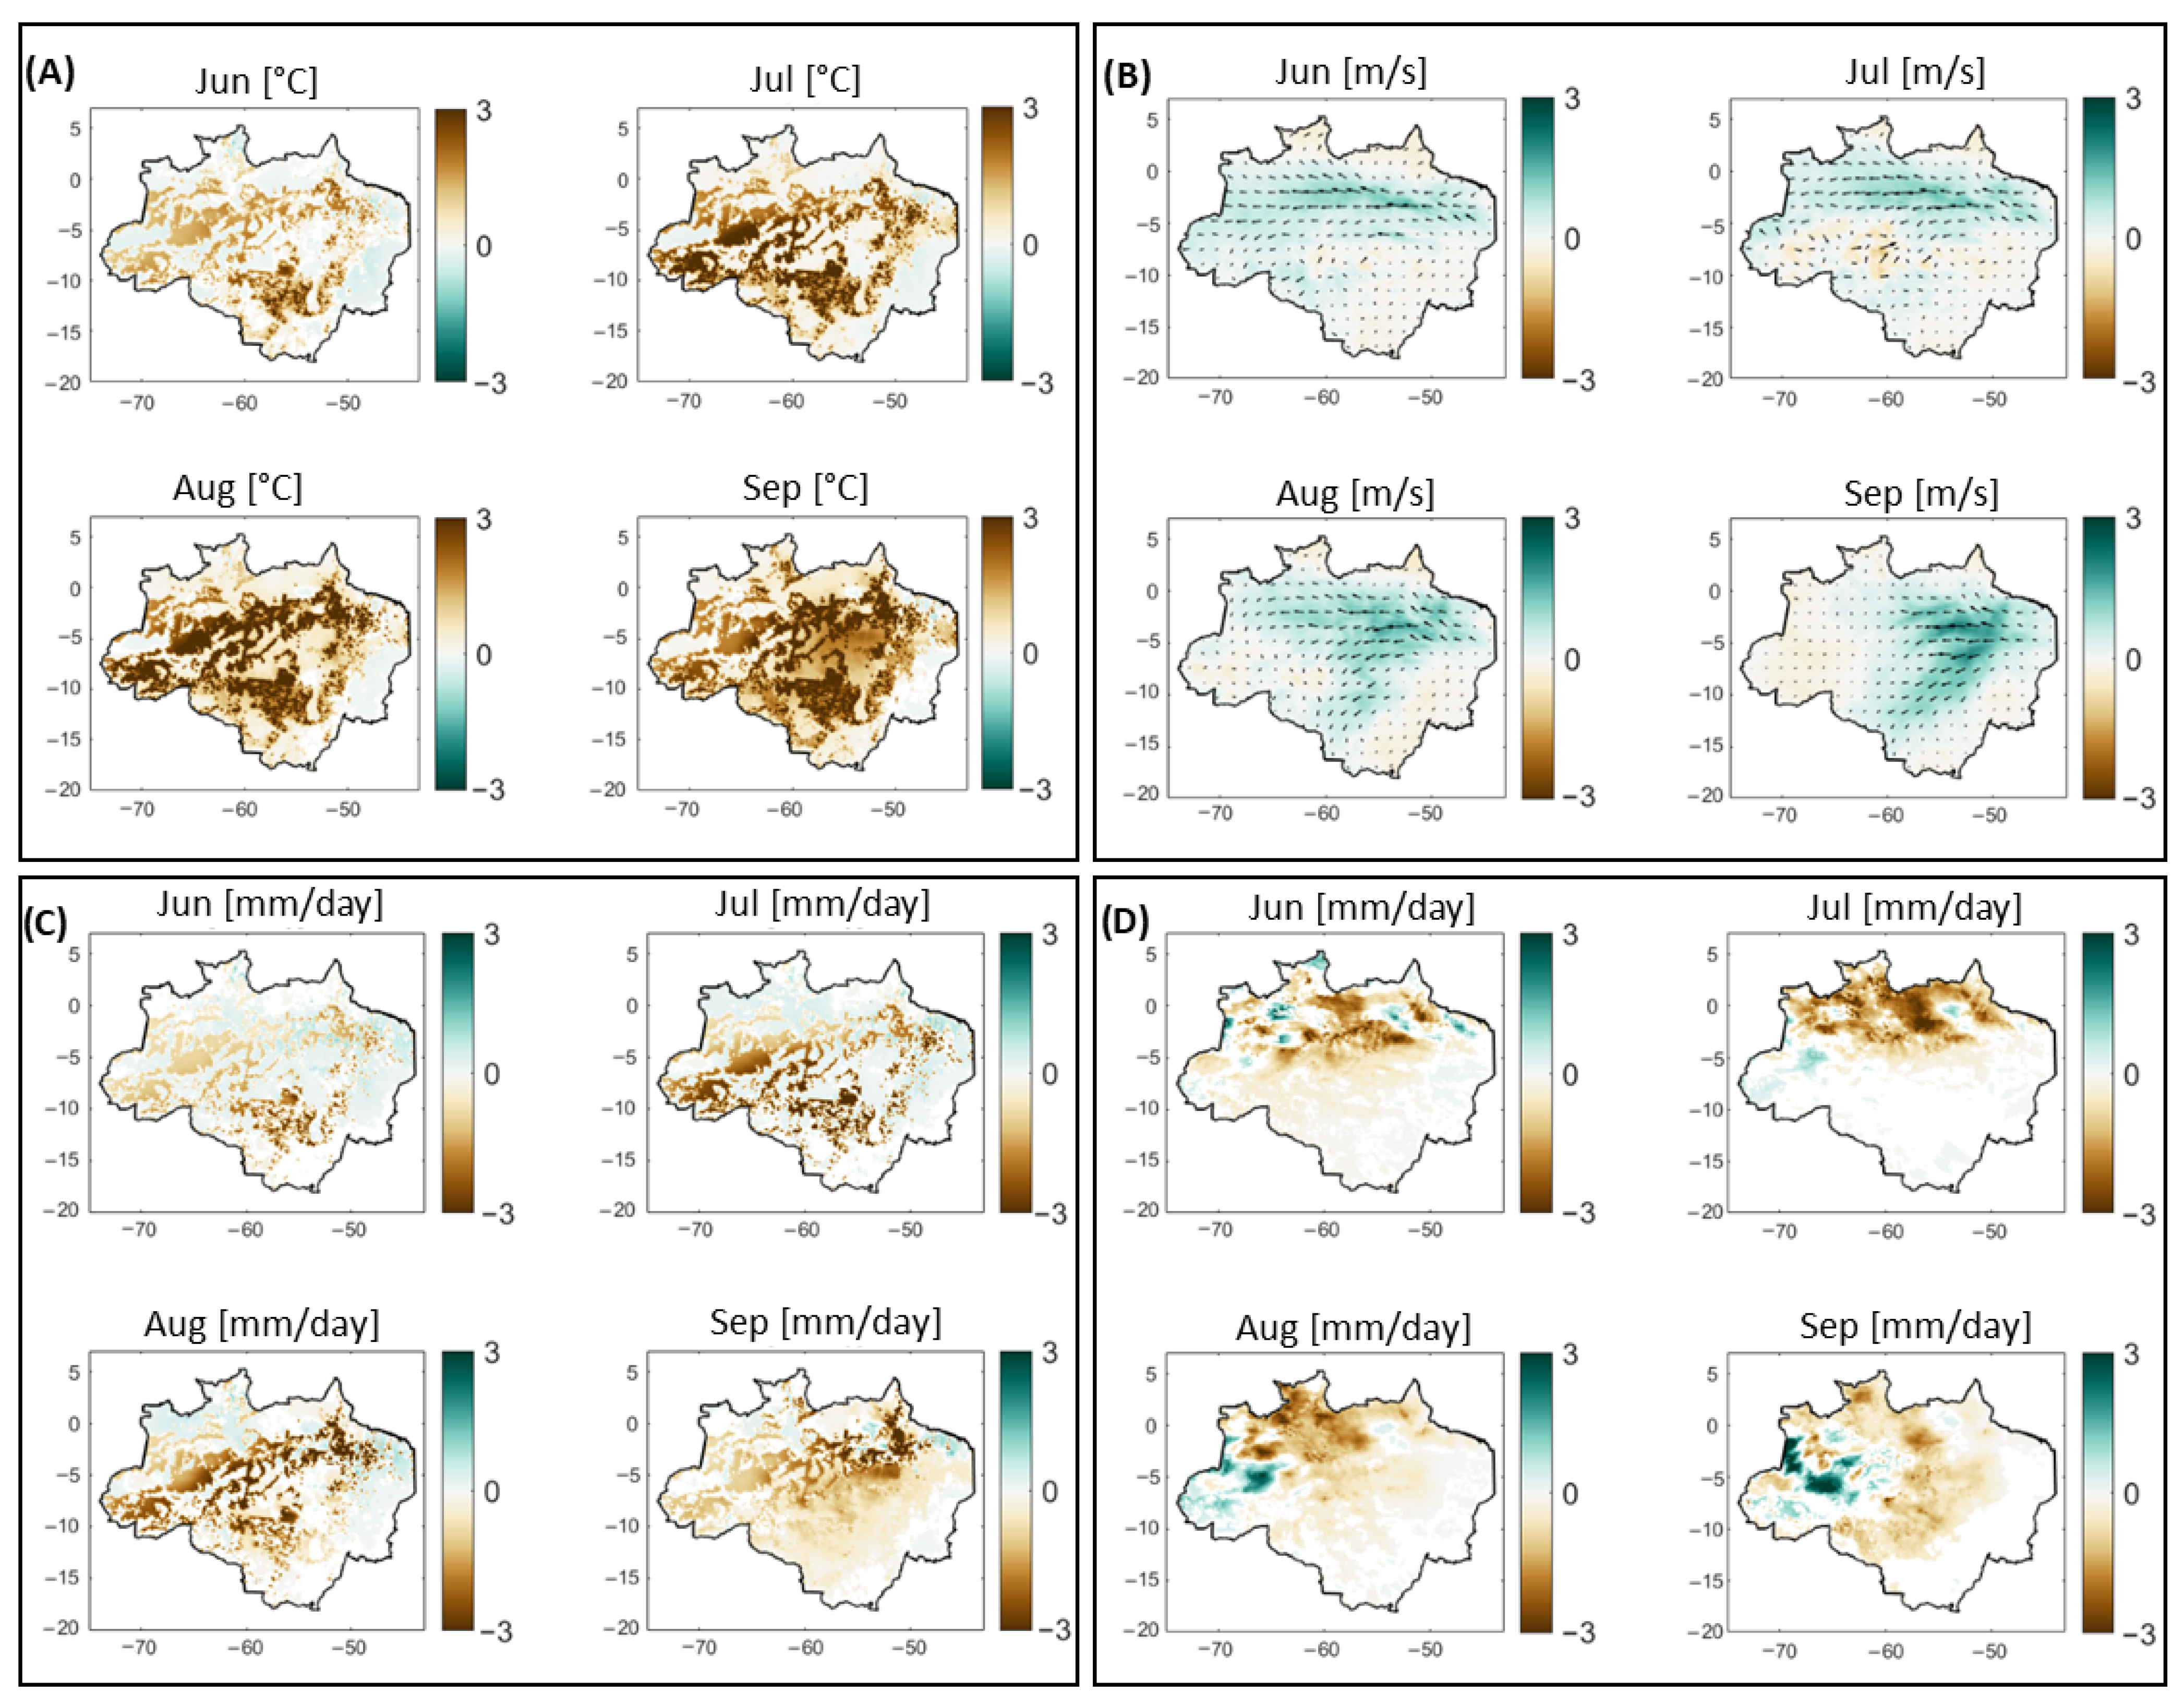
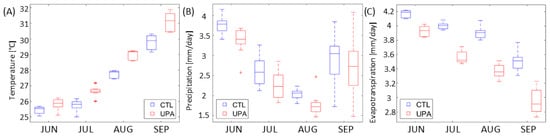
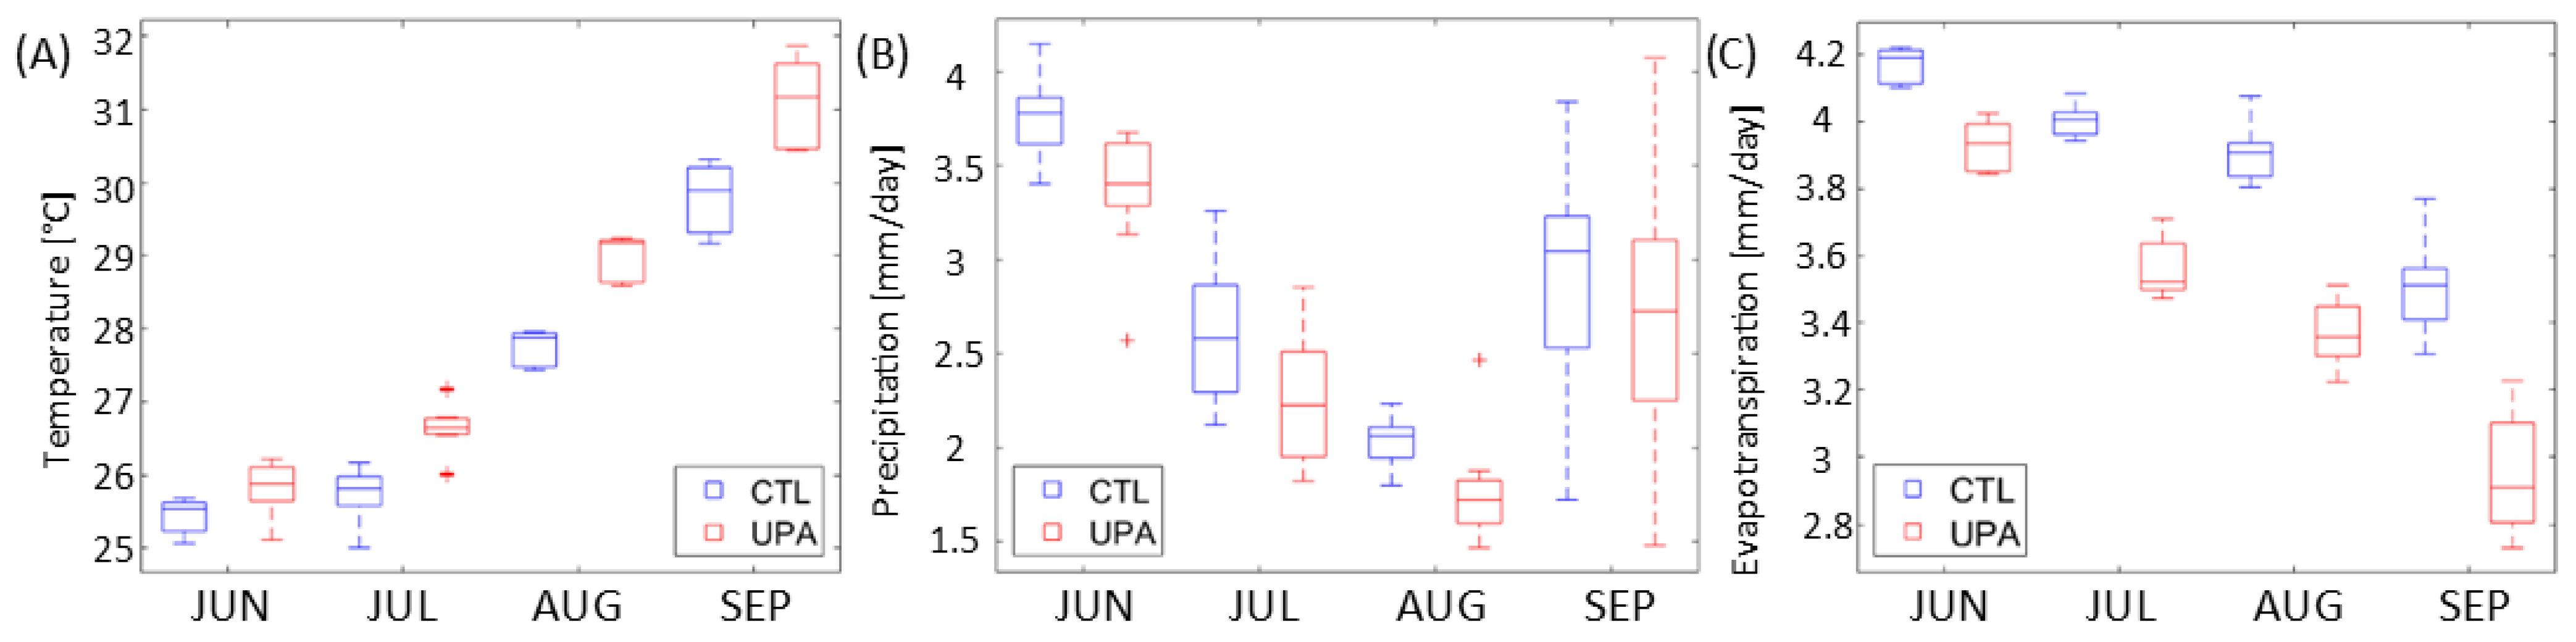
Air temperature change (Figure 4A) indicates significant warming in deforestation zones, intensifying during dry season months. This warming extends regionally beyond deforested areas by September [68,69]. Box plots (Figure 5A) show a rise in temperature medians and ranges in the UPA scenarios, with greater increases in UPAs (Supplementary Information Figure S2A). The Brazilian Amazon’s mean surface air temperature rose by 1.0 ± 0.4 °C following UPA deforestation. Following the deforestation of UPAs, wind speeds increase due to decreased surface roughness and a warmer interior, leading to intensified easterly winds across the basin (Figure 4B). As the dry season intensifies, extending into September, easterly winds strengthen and shift southwest, becoming more meridional. ET declines by an average of 12 ± 4% across the basin in the UPA deforestation scenario (Figure 4C), as forest conversion to grass diminishes transpiration [70]. ET is consistently lower for the UPA run, reaching the lowest values through the dry season into August (Figure 5C). Supplementary Information Figure S2C shows that the decrease in ET is greater over UPA but extends to areas outside these regions. This study shows that impacts on the edges of deforested patches should be investigated in greater detail.
Figure 4.
Difference in monthly air temperature [°C] (A), 850 hPa wind speed [m/s] (B), evapotranspiration [mm/day] (C), and precipitation [mm/day] (D) for the Brazilian Amazon due to unprotected area deforestation (2015–2019). Values were excluded from the above figures where the significance level did not reach 90% (p ≥ 0.1).
Figure 5.
Boxplots of the dry season (JJAS) monthly air temperature [°C] (A), precipitation [mm/day] (B), and evapotranspiration [mm/day] (C) for the control ‘CTL’ run (blue boxes) and deforestation scenario ‘UPA’ (red boxes) for the Brazilian Amazon (2015–2019).
Precipitation decreases are greatest in the central and northern basin (Figure 4D), with a simulated increase in the western region. The reduction in ET likely decreases local moisture availability, diminishing overall rainfall by 12 ± 8%. Figure 5B illustrates the reduction in rainfall, particularly evident from June to August. Changes in pressure gradients in the southeast corridor correspond with the northward movement of air from the south and east. Easterly winds accelerate along the deforested tract in the northern basin, coinciding with the transport of moisture and increased lower-level moisture flux convergence (MFC) and precipitation in the western regions (Supplementary Information Figure S3). The increased MFC in the western region of the Brazilian Amazon basin is likely compensating for the local decrease in ET due to deforestation. This is supported by studies such as those by [30,51,71,72], which link changes in wind patterns due to deforestation with alterations in regional moisture convergence and precipitation.
The simulated warming and reduction in ET indicate shifts consistent with established basin-wide trends in moisture recycling and energy flux. These findings suggest that UPA loss may move the regional system toward a hotter, more variable state, potentially aligning with the previously identified ‘new climate regime’.
3.3. Rondônia Risk Analysis
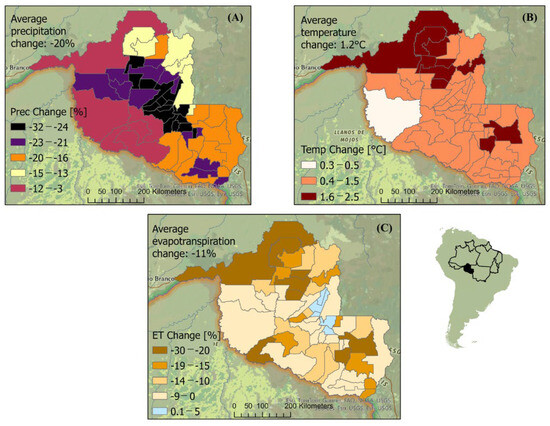
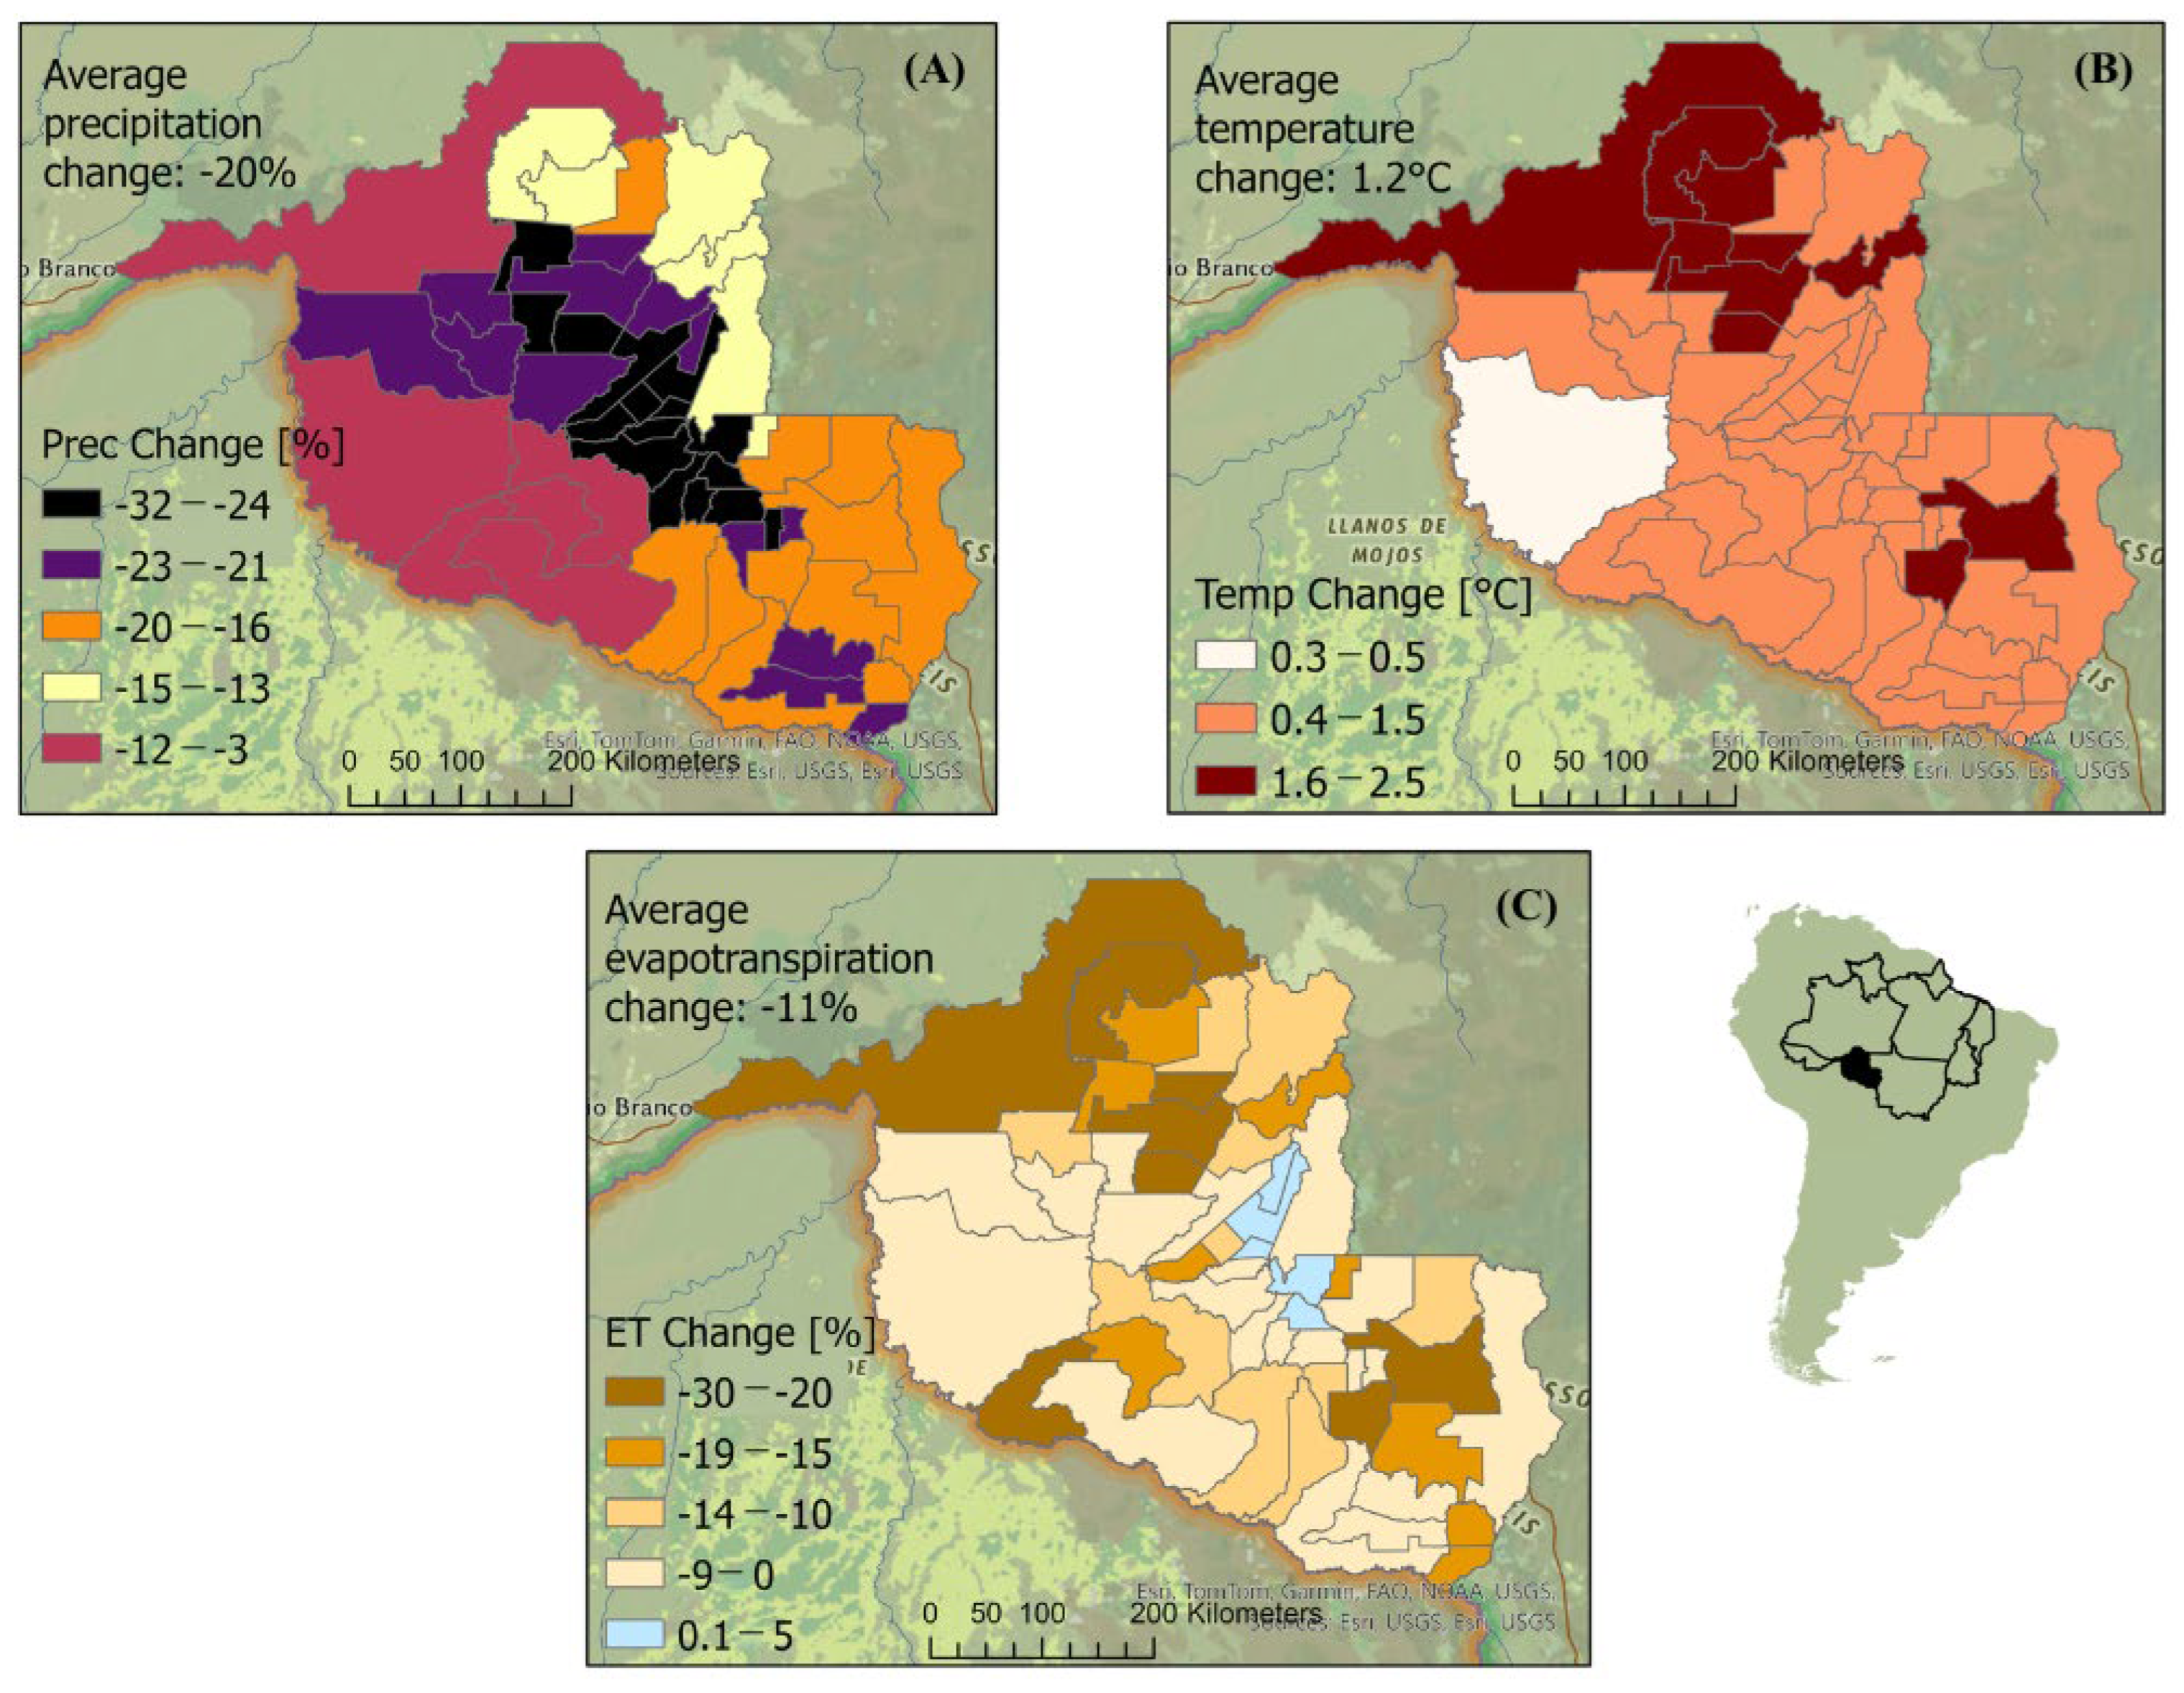
Past deforestation in Rondônia is associated with biodiversity loss through habitat destruction and altering rainfall patterns, and endangering its rich biodiversity [39]. Previous research indicates that these changes have affected agricultural productivity, a significant component to the state’s economy [73]. Figure 6 illustrates a simulated decrease in mean precipitation by municipality of 20 ± 7% (Figure 6A), a reduction in ET by 11 ± 9% (Figure 6C), and an air temperature increase of 1.2 ± 0.4 °C (Figure 6B) following UPA deforestation. These shifts correspond with climatic conditions previously linked to disruptions in agricultural activities, such as reduced crop yields and livestock productivity [74]. More in-depth risk analyses of these climatic changes associated with UPA removal are presented in the following sections.
Figure 6.
Difference in precipitation [%] (A), air temperature [°C] (B), and evapotranspiration [%] (C) at the municipality level for Rondônia due to unprotected area deforestation in the Brazilian Amazon.
3.3.1. Bivariate Risk Maps
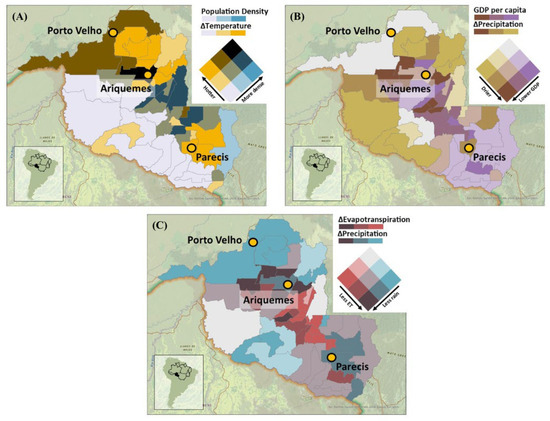
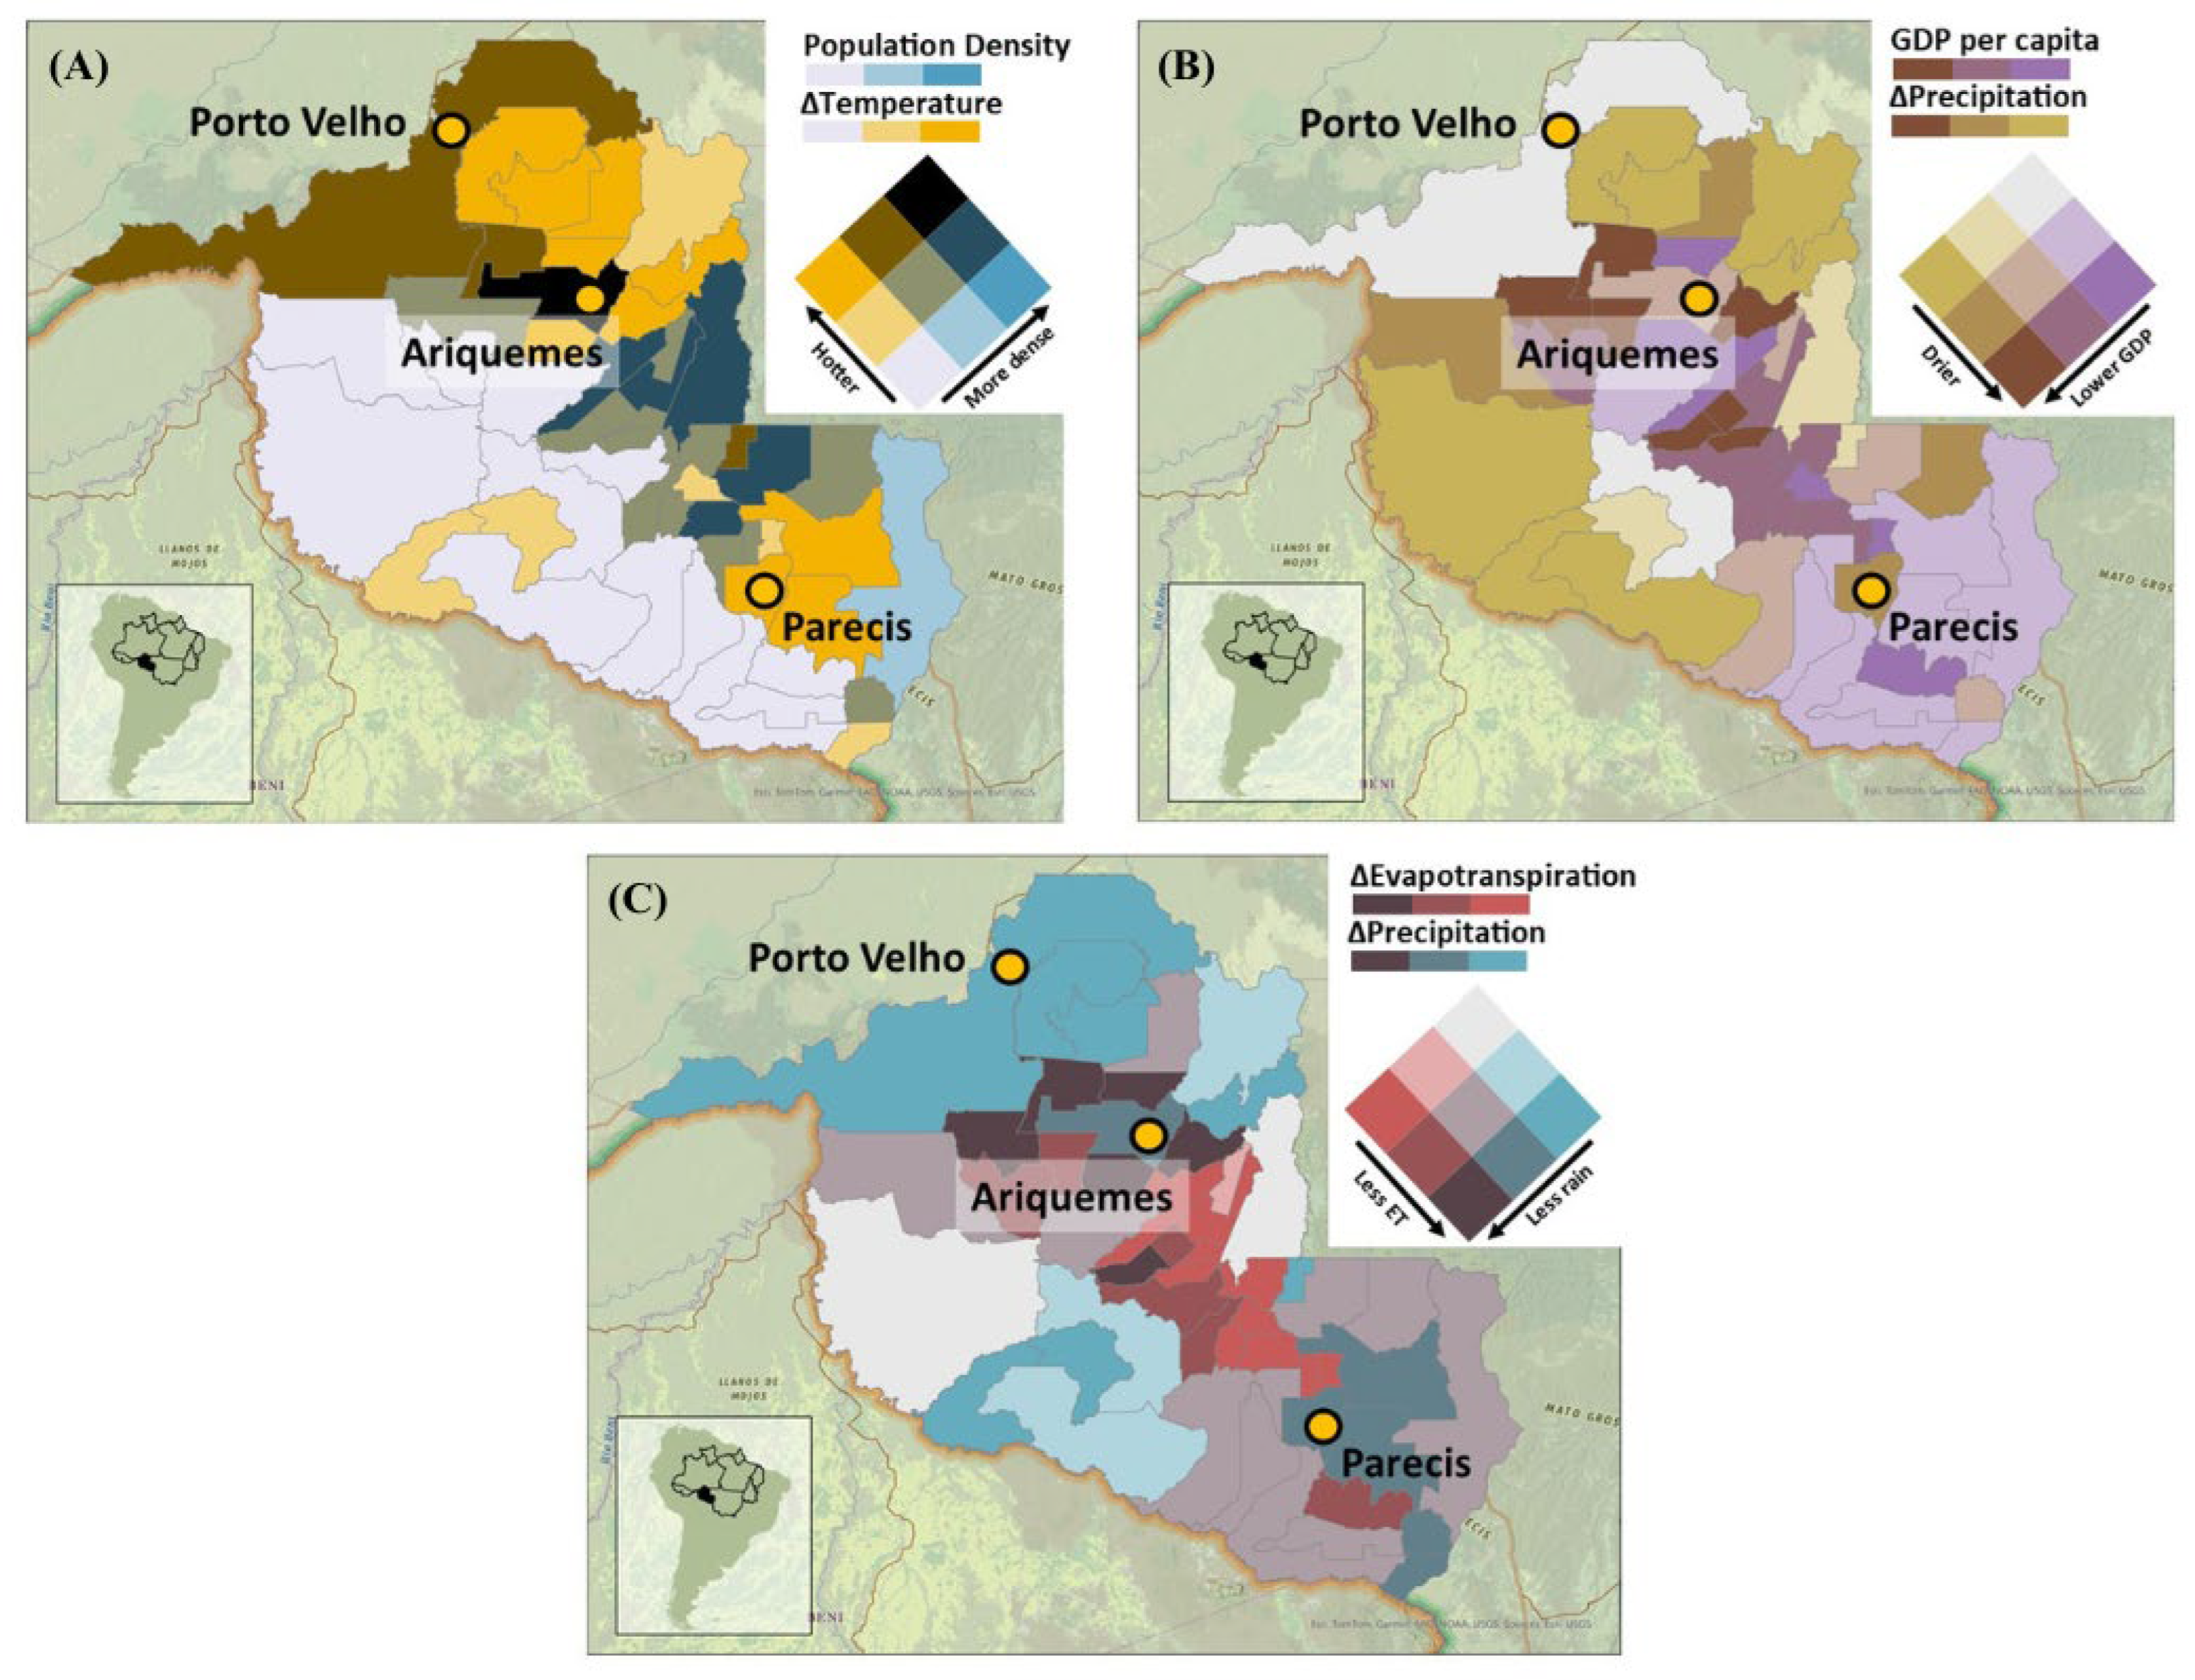
Urban areas are warmer than nearby rural areas due to altered land surfaces s [75,76]. A lack of cooling infrastructure, such as air conditioning is linked to higher risk for vulnerable populations, including the elderly, children, and those with health conditions, leading to increased heat-related illnesses [77,78,79]. In Rondônia, the heat vulnerability map (Figure 7A) identifies areas with high heat vulnerability, particularly along the stretch from Porto Velho to Parecis, including Ariquemes, which has a population density of 22 inhabitants per km2 and an simulated air temperature increase of 2 °C. The northern regions exhibit the highest temperature increases (1.6–2.5 °C), whereas the southeastern municipalities record smaller temperature increases (0.4–1.5 °C) and higher population densities (15–39 inhabitants per km2). While the combination of high population density and high temperatures is an indicator of heat vulnerability, other factors such as the availability and quality of housing, socioeconomic status, access to healthcare, and community preparedness were not included in the analysis [80,81,82,83].
Figure 7.
Bivariate maps due to deforestation in UPAs, including heat vulnerability (A), drought vulnerability (B), and agricultural stress (C).
Higher GDP per capita is linked to better infrastructure and greater resources for drought resilience [84]. In contrast, lower GDP per capita is associated with a reduced capacity to handle environmental challenges [85]. Low or decreasing precipitation characterizes drought-like conditions [86]. Bivariate mapping identifies areas where economic constraints and low precipitation overlap. The drought vulnerability map (Figure 7B) shows that the most vulnerable areas are around Ariquemes, with the lowest GDP per capita (21,000–29,000 BRL compared to the state average of 32,000) and simulated precipitation reductions (up to 32%) following UPA removal. In contrast, Porto Velho exhibits moderate precipitation reductions (12%) and higher GDP per capita (29,000–40,000 BRL). Other vulnerable regions are denoted in light tan and purple colors, including Parecis and areas to the northeast and southwest of Ariquemes, including Indigenous lands 160 km southwest of Ariquemes. Drought vulnerability is also influenced by factors such as soil type, water management policies, agricultural practices, and social factors [70]. GDP per capita does not reflect wealth distribution, which can impact community resilience to drought.
High ET corresponds to periods of active vegetation growth and water availability [87]. Conversely, low ET often results from deforestation and decreased transpiring vegetation cover. Low ET and precipitation are indicators of reduced water availability [88]. Rondônia’s agricultural water stress map (Figure 7C) identifies areas within a 145 km radius of Ariquemes as highly vulnerable precipitation and ET reductions up to 32% and 30%, respectively. Areas with lower risk include protected forests and Indigenous lands 160 km southwest of Ariquemes, which show moderate decreases in precipitation (12%) and ET (4%). Other vulnerable regions are marked in light red and blue around Parecis and municipalities 80 km to the east and 160 km south. The impact of ET and precipitation on agricultural stress varies with crop types, soil conditions, and farming practices.
3.3.2. Multicriteria Risk Map
Simulations indicate that the warming signal (1.2 ± 0.4 °C) resulting from UPA deforestation in Rondônia directly intersects with the state’s high-density livestock zones. While literature highlights that heat stress, driven by high temperatures and humidity, significantly impacts cattle performance, milk yield, and behavior [89,90,91,92], the results provide a spatial representation of this vulnerability. The risk map below highlights areas in Rondônia where these projected climate changes may exacerbate heat stress for livestock, thereby potentially affecting agricultural productivity and the economic stability of sectors heavily reliant on dairy and beef production.
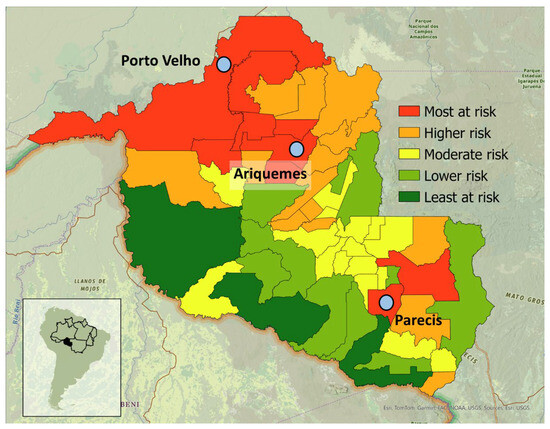
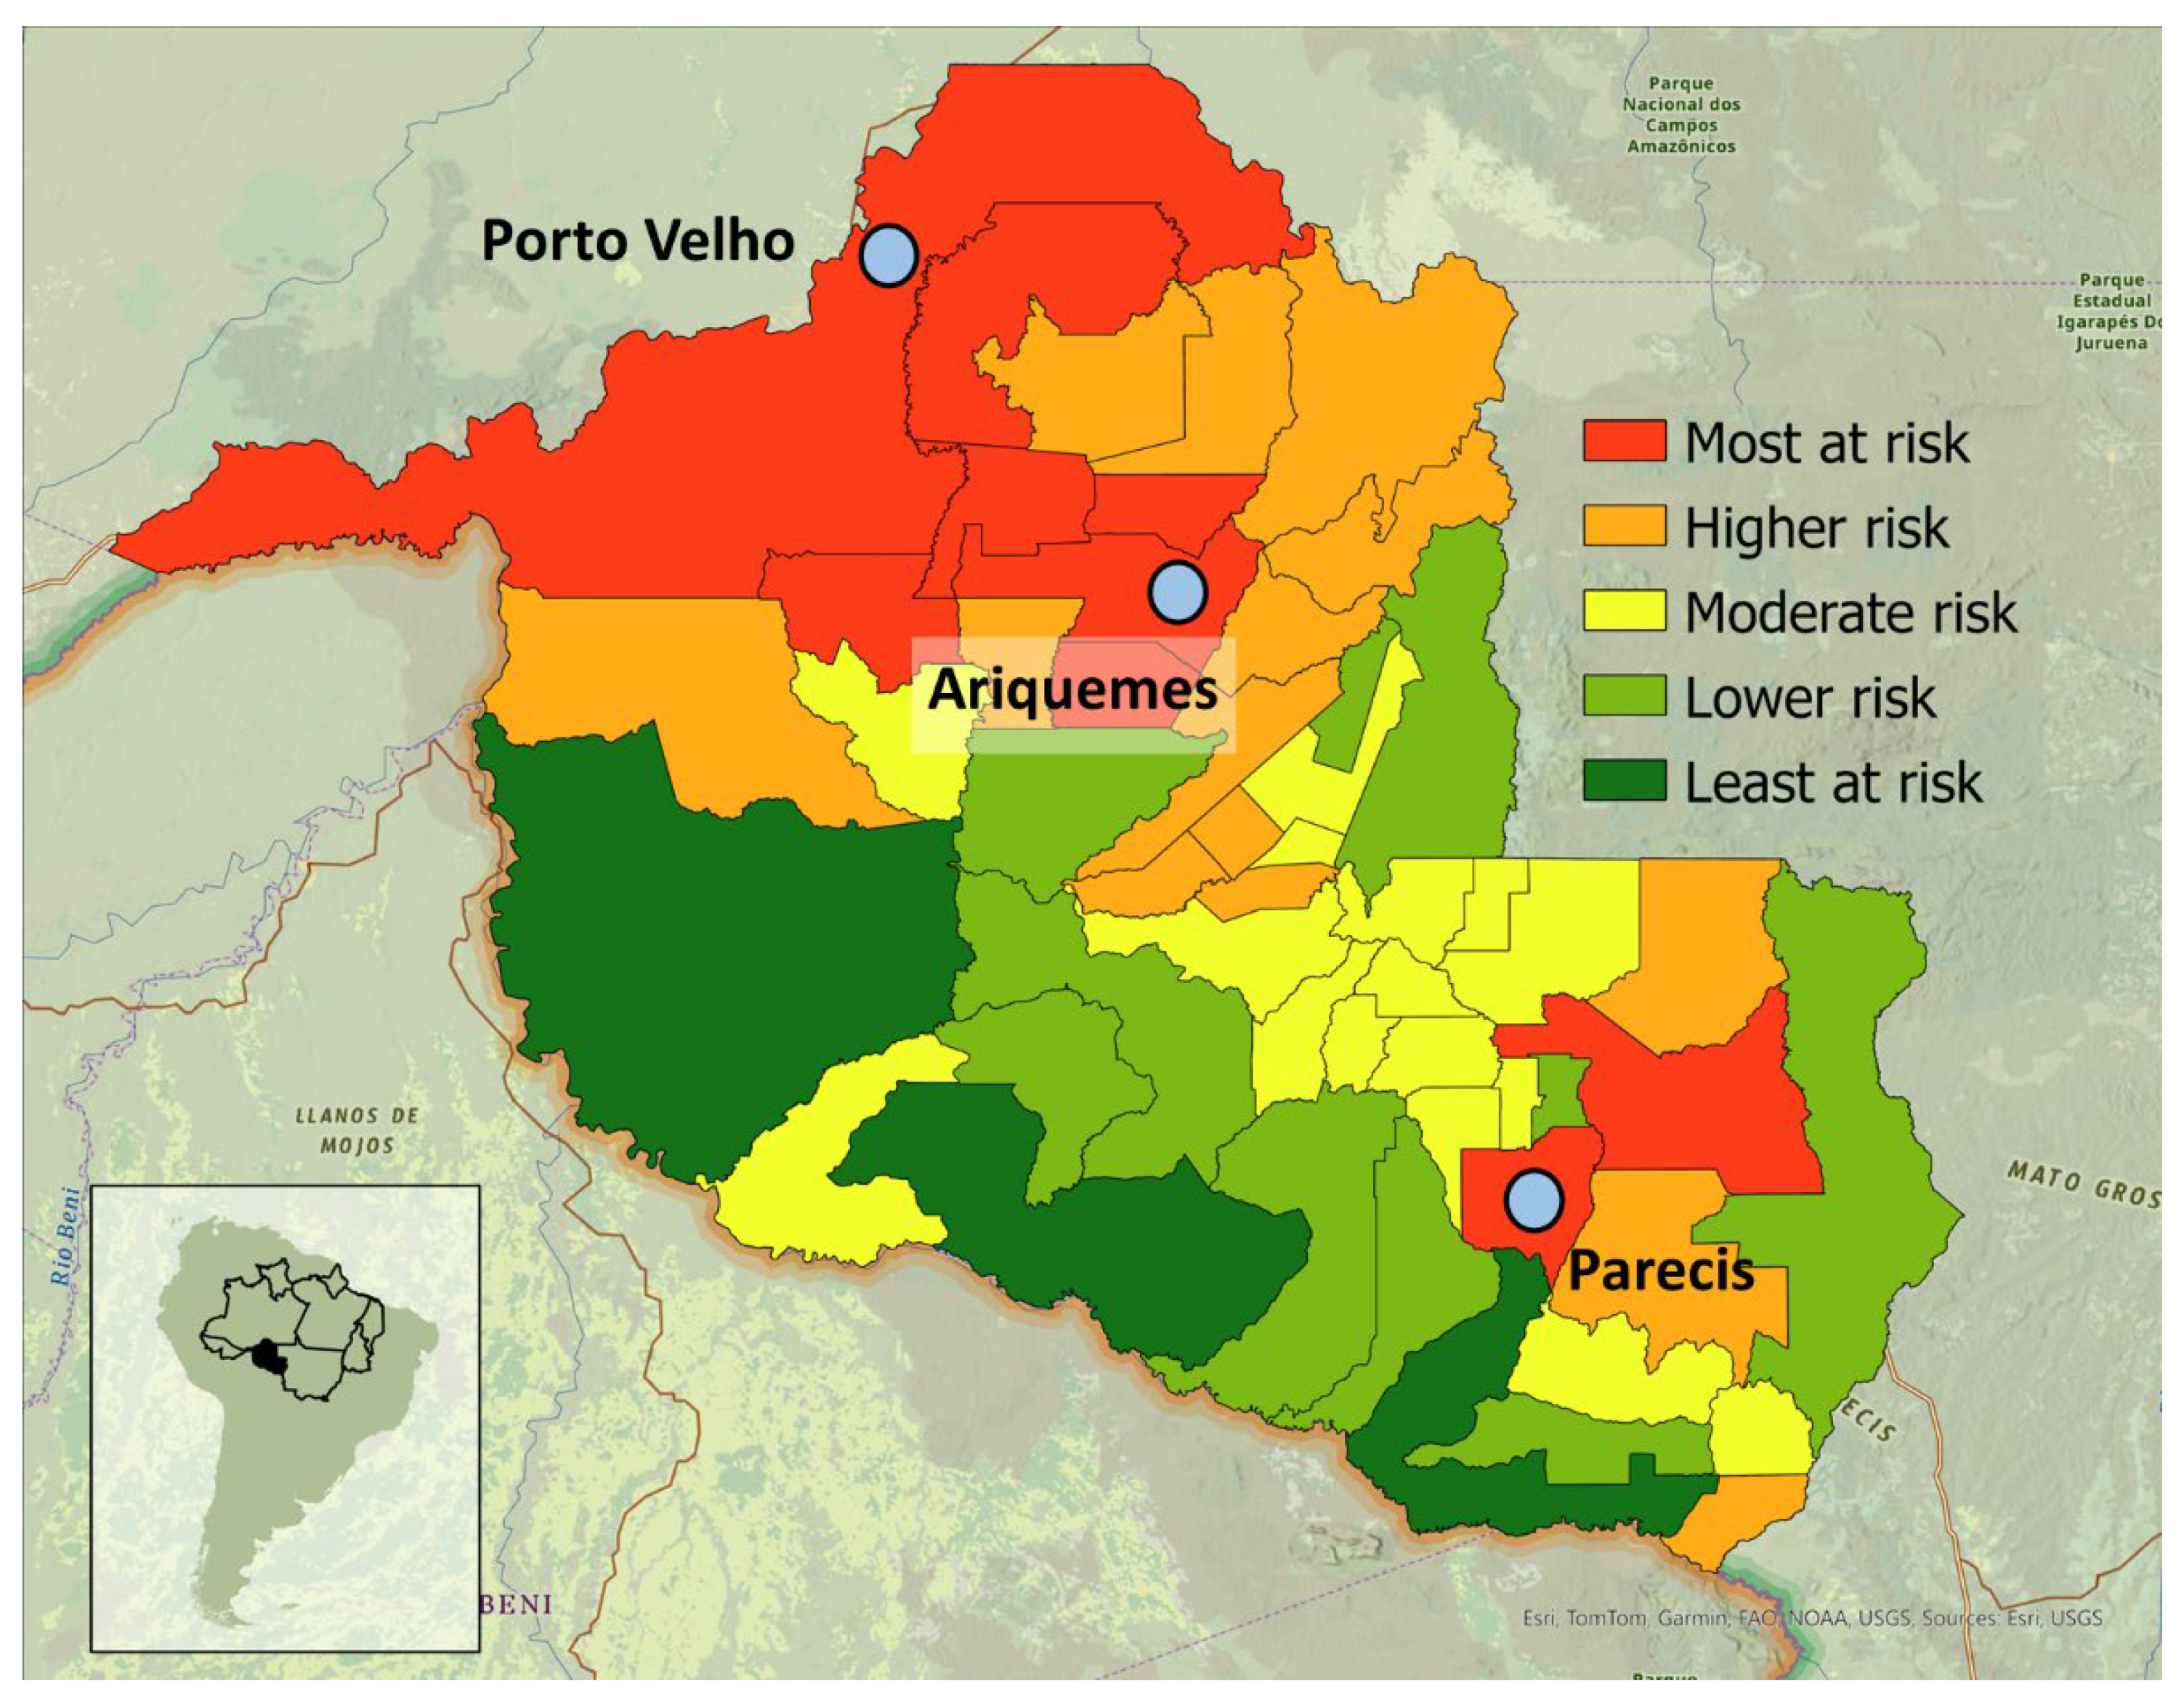
In Rondônia, the municipalities most at risk from climate change due to UPA deforestation include Porto Velho, Ariquemes, and surrounding regions (Figure 8, Table 5). Porto Velho, the capital of Rondônia is identified at the highest level of risk. Parecis and surrounding municipalities face the highest risks in the southern region. Regions at most risk comprise 27% of the entire State area and often correlate with higher agricultural productivity, suggesting deforestation could impact cow milk and cattle production. However, the study does not quantify the potential reduction in yield due to the projected temperature increases. The municipalities least at risk include a large region to the southwest of Ariquemes and Parecis, including Indigenous territories and conservation units, and comprise 18% of the State area (Supplementary Information Figure S4), which were not deforested in simulations.
Figure 8.
Municipality risk map for Rondônia due to unprotected area deforestation in the Brazilian Amazon.
Table 5.
Rondônia municipality risk ranking (from most at risk to least at risk).
The risk designation in these maps is influenced by the weights assigned to various factors in Table 3; altering these weights (or removing UPA climate change altogether) would shift the areas identified as high risk. Risk categories (Table 5) are also relative, indicating that the lowest risk category could still experience significant impacts. Other factors, especially access to government resources, proximity to infrastructure such as electricity or roads, and power relations, can significantly impact risk at various spatial scales. Household and individual characteristics can impact risk at the inter- and intra-household scale, including differences by gender, race, ethnicity, and class [93]. In Rondônia, these disparities are significant, as approximately 58% of the population identifies as Pardo (mixed-race) and 7% as Black (Preto) [94]. Adaptive capacity, which is critical to mitigating risk impacts, was not quantified [95]. Due to those complexities, the study does not advocate for the allocation or withdrawal of aid to any specific municipalities; rather, it serves as a visual tool highlighting the municipalities that may be most susceptible to the climatic shifts resulting from UPA deforestation, based on specific criteria of GDP and cattle and milk cow populations.
4. Implications for Policymakers
These findings highlight a critical feedback loop where the agricultural expansion driving UPA loss simultaneously destabilizes the regional climate, creating a trade-off where short-term land gains are associated with long-term productivity declines due to diminished rainfall and increased thermal stress. Targeted policy interventions may mitigate the risks identified in the bivariate and multi-criteria maps. Given the historical vulnerability of the region to PADD (PA Downgrading, Downsizing, and Degazetttement), effective strategies could involve strengthening the legal enforcement of the Forest Code and the National System of Protected Areas (SNUC) to prevent the conversion of current UPAs into permanent pasture.
This study serves as a spatial steppingstone, highlighting where resources for monitoring and infrastructure could be concentrated to buffer against the biophysical hazards quantified. To operationalize these findings, promoting regional development strategies, such as rotational grazing or production diversification, is recommended to improve climate resilience within these high-exposure agricultural zones [74]. While these recommendations are derived from specific UPA-deforestation simulations, they underscore the necessity for flexible policy implementation that integrates climate modeling with the socio-political needs of local farming communities to prevent the ‘new climate regime’ trends identified in the basin-wide analysis.
5. Conclusions
Widespread deforestation within UPAs of the Brazilian Amazon precipitates a fundamental shift in the regional dry-season climate state. Simulation results indicate that the loss of these forests destabilizes moisture recycling and thermal regulation, disproportionately affecting states such as Rondônia where biophysical hazards intersect with socio-economic and agricultural exposure. The analysis identifies a systemic risk: the agricultural expansion currently driving UPA loss threatens the climatic state required for long-term regional productivity.
Evidence suggests that mitigating identified risks involves targeted interventions including strengthened legal enforcement, improved monitoring infrastructure, and sustainable agricultural practices. Averting these shifts requires a shift toward integrated governance that transcends the designation of boundaries. While PAs and Indigenous territories are essential for conservation, their efficacy is often limited by resource constraints and the potential for “leakage”, where deforestation activities shift to less protected, undesignated lands [96]. Evidence suggests that isolated conservation efforts without robust enforcement and regional economic alternatives may fail to address the broader trajectory of forest loss.
The preservation of the Amazonian climate regime depends on a multi-scalar approach that integrates legal enforcement of the Forest Code with socio-political support for farming communities. This study provides a spatial framework for identifying high-risk municipalities where resources for monitoring and infrastructure could be prioritized. Future research should focus on quantifying the specific economic thresholds of agricultural yield loss under the projected temperature increases and investigating the role of sub-grid land-use mosaics in mitigating local heat stress in modeling designs. Such efforts are necessary to guide the international community toward sustainable actions that support the long-term resilience of the Amazon basin.
Supplementary Materials
The following supporting information can be downloaded at: https://www.mdpi.com/article/10.3390/cli14040085/s1, Figure S1: Cattle count, milked cows count, GDP per capita, and population density for Rondônia at the municipality level. Data representing municipal-level cattle herds and agricultural indicators are derived from the 2017 IBGE Municipal Livestock Production (PPM) surveys; Figure S2: Boxplots of dry season (JJAS) monthly surface air temperature [°C] (A), precipitation [mm/day] (B), and evapotranspira-tion [mm/day] (C) for the control ‘CTL’ run (blue boxes) and deforestation scenario ‘UPA’ (red boxes) for unprotected areas ‘UPA’ versus all remaining lands ‘nonUPA’ (2015–2019); Figure S3: Difference in 900 mb moisture flux convergence between the CTL and UPA deforestation scenarios for the dry season (JJAS 2015–2019); Figure S4: Risk map for Rondônia overlayed with Indigenous land (cross-hatched) and conservation unit (slashed) regions.
Author Contributions
C.M.: Conceptualization, data curation, formal analysis, investigation, methodology, project administration, validation, visualization, writing—original draft, writing—review and editing; F.D.S.: Conceptualization, formal analysis, funding acquisition, methodology, supervision, validation, writing—review and editing; T.W.B.: supervision, writing—review and editing; K.M.: funding acquisition, writing—review and editing; C.J.: writing—review and editing; M.V.: writing—review and editing. All authors have read and agreed to the published version of the manuscript.
Funding
This research was supported by Connections between Water and Rural Production: Sociohydrological Systems on a Tropical Forest Frontier Project funded by the National Science Foundation: CNH-L #1825046. The authors acknowledge the Behner Stiefel Center for Brazilian Studies at San Diego State University for its support of this research and its commitment to social and environmental justice in Brazil. We utilized the supercomputing systems at the National Center for Atmospheric Research (NCAR) to process ERA5 reanalysis data from the NCAR-hosted ERA5 dataset.
Data Availability Statement
If you would like access to any of the data, please email the corresponding author.
Acknowledgments
This work is based on the doctoral dissertation: Corrie Monteverde, “Climate Dynamics and Agricultural Adaptability in the Brazilian Amazon”, San Diego State University and University of California Santa Barbara (Joint Doctoral Program), San Diego, California and Santa Barbara, California, United States, June 2024. The dissertation is available at: https://escholarship.org/content/qt3t55m8mc/qt3t55m8mc.pdf (accessed on 3 February 2026).
Conflicts of Interest
The authors declare no conflicts of interest.
References
- Maisonnave, F. Report: Brazil Authorities Pay No Mind to Deforestation. Available online: https://apnews.com/article/travel-forests-brazil-parks-national-42d20c3115f28ff3feb75e540fb53633 (accessed on 3 February 2026).
- Qin, Y.; Xiao, X.; Liu, F.; De Sa E Silva, F.; Shimabukuro, Y.; Arai, E.; Fearnside, P.M. Forest Conservation in Indigenous Territories and Protected Areas in the Brazilian Amazon. Nat. Sustain. 2023, 6, 295–305. [Google Scholar] [CrossRef] [Scilit]
- Abessa, D.; Famá, A.; Buruaem, L. The Systematic Dismantling of Brazilian Environmental Laws Risks Losses on All Fronts. Nat. Ecol. Evol. 2019, 3, 510–511. [Google Scholar] [CrossRef] [Scilit] [PubMed]
- De Area Leão Pereira, E.J.; Silveira Ferreira, P.J.; De Santana Ribeiro, L.C.; Sabadini Carvalho, T.; De Barros Pereira, H.B. Policy in Brazil (2016–2019) Threaten Conservation of the Amazon Rainforest. Environ. Sci. Policy 2019, 100, 8–12. [Google Scholar] [CrossRef] [Scilit]
- Ferrante, L.; Fearnside, P.M. Brazil’s New President and ‘Ruralists’ Threaten Amazonia’s Environment, Traditional Peoples and the Global Climate. Environ. Conserv. 2019, 46, 261–263. [Google Scholar] [CrossRef] [Scilit]
- Gonzaga, D. Bolsonaro Is a Catastrophe for the Environment. Available online: https://www.greenpeace.org/international/story/52098/bolsonaro-president-brazil-amazon-environment/ (accessed on 3 February 2026).
- CIMI. Amidst the Pandemic, Invasions of Indigenous Lands and Killings of Indigenous Peoples Increased in 2020|Cimi. Available online: https://cimi.org.br/2021/10/amidst-pandemic-invasions-indigenous-lands-killings-indigenous-people-increased-2020/ (accessed on 3 February 2026).
- Spring, J. Insight: Brazil’s Bolsonaro Obstructs Environmental Fines Key to Protecting Amazon; Reuters: London, UK, 2021. [Google Scholar]
- Dudley, N.; Groves, C.; Redford, K.H.; Stolton, S. Where Now for Protected Areas? Setting the Stage for the 2014 World Parks Congress. Oryx 2014, 48, 496–503. [Google Scholar] [CrossRef] [Scilit]
- Qin, Y.; Xiao, X.; Dong, J.; Zhang, Y.; Wu, X.; Shimabukuro, Y.; Arai, E.; Biradar, C.; Wang, J.; Zou, Z.; et al. Improved Estimates of Forest Cover and Loss in the Brazilian Amazon in 2000–2017. Nat. Sustain. 2019, 2, 764–772. [Google Scholar] [CrossRef] [Scilit]
- Silveira, F.A.O.; Ferreira, M.C.; Perillo, L.N.; Carmo, F.F.; Neves, F.S. Brazil’s Protected Areas under Threat. Science 2018, 361, 459. [Google Scholar] [CrossRef] [Scilit]
- Begotti, R.A.; Peres, C.A. Brazil’s Indigenous Lands under Threat. Science 2019, 363, 592. [Google Scholar] [CrossRef] [Scilit]
- Nepstad, D.; Schwartzman, S.; Bamberger, B.; Santilli, M.; Ray, D.; Schlesinger, P.; Lefebvre, P.; Alencar, A.; Prinz, E.; Fiske, G.; et al. Inhibition of Amazon Deforestation and Fire by Parks and Indigenous Lands. Conserv. Biol. 2006, 20, 65–73. [Google Scholar] [CrossRef] [Scilit]
- Jenkins, C.N.; Joppa, L. Expansion of the Global Terrestrial Protected Area System. Biol. Conserv. 2009, 142, 2166–2174. [Google Scholar] [CrossRef] [Scilit]
- Cabral, A.I.R.; Saito, C.; Pereira, H.; Laques, A.E. Deforestation Pattern Dynamics in Protected Areas of the Brazilian Legal Amazon Using Remote Sensing Data. Appl. Geogr. 2018, 100, 101–115. [Google Scholar] [CrossRef] [Scilit]
- Coe, M.T.; Rattis, L.; Machado, M.; Macedo, M.N.; Fiske, G.J. Amazon Deforestation and Fire Outlook; Woodwell Climate Research Center: Falmouth, MA, USA, 2023. [Google Scholar]
- Global Forest Watch. Brazil Deforestation Rates & Statistics|GFW. Available online: https://www.globalforestwatch.org/dashboards/country/BRA/?category=forest-change (accessed on 3 February 2026).
- Fearnside, P.M.; Vilela Cruz, P. Chainsaw Massacre: Protected Areas in Danger in Brazil’s State of Rondônia (Commentary). Conservation News, 31 October 2018.
- Ribeiro, M.; Verissimo, A. Patterns and Causes of Deforestation in Protected Areas of Rondonia-Brazil. Nat. Conserv. 2007, 5, 103–113. [Google Scholar]
- WWF. Indigenous Lands and Other Protected Areas Under Threat in Brazil. Available online: https://wwf.panda.org/wwf_news/?99940/Indigenous-lands-and-other-protected-areas-under-threat-in-Brazil (accessed on 3 February 2026).
- Tesfaw, A.T.; Pfaff, A.; Golden Kroner, R.E.; Qin, S.; Medeiros, R.; Mascia, M.B. Land-Use and Land-Cover Change Shape the Sustainability and Impacts of Protected Areas. Proc. Natl. Acad. Sci. USA 2018, 115, 2084–2089. [Google Scholar] [CrossRef] [Scilit] [PubMed]
- Herrera, D.; Pfaff, A.; Robalino, J. Impacts of Protected Areas Vary with the Level of Government: Comparing Avoided Deforestation across Agencies in the Brazilian Amazon. Proc. Natl. Acad. Sci. USA 2019, 116, 14916–14925. [Google Scholar] [CrossRef] [Scilit] [PubMed]
- El Pais. Brazil Lawsuits Link JBS to Destruction of Amazon in Protected Area, Seek Millions in Damages. Available online: https://english.elpais.com/climate/2023-12-19/brazil-lawsuits-link-jbs-to-destruction-of-amazon-in-protected-area-seek-millions-in-damages.html (accessed on 3 February 2026).
- Maisonnave, F. Brazil Lawsuits Allege Direct Relationship Between Meatpackers, Deforesters on Protected Land. Available online: https://apnews.com/article/brazil-deforestation-jbs-meatpackers-cattle-d393d5915a46e75009e2433b3de3cd33 (accessed on 3 February 2026).
- Mataveli, G.; Jones, M.W.; Carmenta, R.; Sanchez, A.; Dutra, D.J.; Chaves, M.; de Oliveira, G.; Anderson, L.O.; Aragão, L.E.O.C. Deforestation Falls but Rise of Wildfires Continues Degrading Brazilian Amazon Forests. Glob. Change Biol. 2024, 30, e17202. [Google Scholar] [CrossRef] [Scilit]
- Costa, M.H.; Pires, G.F. Effects of Amazon and Central Brazil Deforestation Scenarios on the Duration of the Dry Season in the Arc of Deforestation. Int. J. Climatol. 2010, 30, 1970–1979. [Google Scholar] [CrossRef] [Scilit]
- Butt, N.; De Oliveira, P.A.; Costa, M.H. Evidence That Deforestation Affects the Onset of the Rainy Season in Rondonia, Brazil. J. Geophys. Res. Atmos. 2011, 116, D11120. [Google Scholar] [CrossRef] [Scilit]
- Bonini, I.; Rodrigues, C.; Dallacort, R.; Marimon Junior, B.H.; Carvalho, M.A.C. Rainfall and Deforestation in the Municipality of Colíder, Southern Amazon. Rev. Bras. Meteorol. 2014, 29, 483–493. [Google Scholar] [CrossRef] [Scilit]
- Marengo, J.A.; Souza, C.M.; Thonicke, K.; Burton, C.; Halladay, K.; Betts, R.A.; Alves, L.M.; Soares, W.R. Changes in Climate and Land Use Over the Amazon Region: Current and Future Variability and Trends. Front. Earth Sci. 2018, 6, 228. [Google Scholar] [CrossRef] [Scilit]
- Mu, Y.; Biggs, T.; De Sales, F. Forests Mitigate Drought in an Agricultural Region of the Brazilian Amazon: Atmospheric Moisture Tracking to Identify Critical Source Areas. Geophys. Res. Lett. 2021, 48, e2020GL091380. [Google Scholar] [CrossRef] [Scilit]
- Ruiz-Vásquez, M.; Arias, P.A.; Martínez, J.A.; Espinoza, J.C. Effects of Amazon Basin Deforestation on Regional Atmospheric Circulation and Water Vapor Transport towards Tropical South America. Clim. Dyn. 2020, 54, 4169–4189. [Google Scholar] [CrossRef] [Scilit]
- Barkhordarian, A.; Saatchi, S.S.; Behrangi, A.; Loikith, P.C.; Mechoso, C.R. A Recent Systematic Increase in Vapor Pressure Deficit over Tropical South America. Sci. Rep. 2019, 9, 15331. [Google Scholar] [CrossRef] [Scilit]
- Dubreuil, V.; Fante, K.P.; Planchon, O.; Sant’Anna Neto, J.L. Climate Change Evidence in Brazil from Köppen’s Climate Annual Types Frequency. Int. J. Climatol. 2019, 39, 1446–1456. [Google Scholar] [CrossRef] [Scilit]
- Esquivel-Muelbert, A.; Baker, T.R.; Dexter, K.G.; Lewis, S.L.; Brienen, R.J.W.; Feldpausch, T.R.; Lloyd, J.; Monteagudo-Mendoza, A.; Arroyo, L.; Álvarez-Dávila, E.; et al. Compositional Response of Amazon Forests to Climate Change. Glob. Change Biol. 2019, 25, 39–56. [Google Scholar] [CrossRef] [Scilit] [PubMed]
- Chen, C.-A.; Hsu, H.-H.; Liang, H.-C. Evaluation and Comparison of CMIP6 and CMIP5 Model Performance in Simulating the Seasonal Extreme Precipitation in the Western North Pacific and East Asia. Weather Clim. Extrem. 2021, 31, 100303. [Google Scholar] [CrossRef] [Scilit]
- Alvares, C.A.; Stape, J.L.; Sentelhas, P.C.; De Moraes Gonçalves, J.L.; Sparovek, G. Köppen’s Climate Classification Map for Brazil. Meteorol. Z. 2013, 22, 711–728. [Google Scholar] [CrossRef] [Scilit]
- SPA. Amazon Assessment Report 2021. Available online: https://www.sp-amazon.org/publications (accessed on 5 February 2026).
- Donoso, V.G.; Hirye, M.C.M.; Gerwenat, C.; Reicher, C. Amazon Deforestation and Global Meat Consumption Trends: An Assessment of Land Use Change and Market Data from Rondônia That Shows Why We Should Consider Changing Our Diets. Sustainability 2024, 16, 4526. [Google Scholar] [CrossRef] [Scilit]
- Pedlowski, M.A.; Dale, V.H.; Matricardi, E.A.T.; Pereira Da, E.; Filho, S. Patterns and Impacts of Deforestation in Rondhia, Brazil. Landsc. Urban Plan. 1997, 38, 149–157. [Google Scholar] [CrossRef] [Scilit]
- Almeida, C.; Mourão, M.; Dessay, N.; Lacques, A.E.; Monteiro, A.; Durieux, L.; Venturieri, A.; Seyler, F. Typologies and Spatialization of Agricultural Production Systems in Rondônia, Brazil: Linking Land Use, Socioeconomics and Territorial Configuration. Land 2016, 5, 18. [Google Scholar] [CrossRef] [Scilit]
- Powers, J.G.; Klemp, J.B.; Skamarock, W.C.; Davis, C.A.; Dudhia, J.; Gill, D.O.; Coen, J.L.; Gochis, D.J.; Ahmadov, R.; Peckham, S.E.; et al. The Weather Research and Forecasting Model: Overview, System Efforts, and Future Directions. Bull. Am. Meteorol. Soc. 2017, 98, 1717–1737. [Google Scholar] [CrossRef] [Scilit]
- De Sales, F.; Okin, G.S.; Xue, Y.; Dintwe, K. On the Effects of Wildfires on Precipitation in Southern Africa. Clim. Dyn. 2019, 52, 951–967. [Google Scholar] [CrossRef] [Scilit]
- Skamarock, W.C.; Klemp, J.B.; Dudhia, J.; Gill, D.O.; Liu, Z.; Berner, J.; Wang, W.; Powers, J.G.; Duda, M.G.; Barker, D.M.; et al. A Description of the Advanced Research WRF Model Version 4; NSF National Center for Atmospheric Research: Boulder, CO, USA, 2019. [Google Scholar]
- Xue, Y.; Sellers, P.J.; Kinter, J.L.; Shukla, J. A Simplified Biosphere Model for Global Climate Studies. J. Clim. 1991, 4, 345–364. [Google Scholar] [CrossRef] [Scilit]
- Zhang, Y.; Hemperly, J.; Meskhidze, N.; Skamarock, W.C. The Global Weather Research and Forecasting (GWRF) Model: Model Evaluation, Sensitivity Study, and Future Year Simulation. Atmos. Clim. Sci. 2012, 2, 231–253. [Google Scholar] [CrossRef]
- Hong, S.-Y. Hongandlim-JKMS-2006. J. Korean Meteorol. Soc. 2006, 42, 129–151. [Google Scholar]
- Iacono, M.J.; Delamere, J.S.; Mlawer, E.J.; Shephard, M.W.; Clough, S.A.; Collins, W.D. Radiative Forcing by Long-Lived Greenhouse Gases: Calculations with the AER Radiative Transfer Models. J. Geophys. Res. Atmos. 2008, 113, 1–8. [Google Scholar] [CrossRef] [Scilit]
- Zhang, C.; Wang, Y. Projected Future Changes of Tropical Cyclone Activity over the Western North and South Pacific in a 20-Km-Mesh Regional Climate Model. J. Clim. 2017, 30, 5923–5941. [Google Scholar] [CrossRef] [Scilit]
- Hersbach, H.; Bell, B.; Berrisford, P.; Hirahara, S.; Horányi, A.; Muñoz-Sabater, J.; Nicolas, J.; Peubey, C.; Radu, R.; Schepers, D.; et al. The ERA5 Global Reanalysis. Q. J. R. Meteorol. Soc. 2020, 146, 1999–2049. [Google Scholar] [CrossRef] [Scilit]
- Hersbach, H.; Bell, B.; Berrisford, P.; Biavati, G.; Horanyi, A.; Munoz Sabater, J.; Nicolas, J.; Peuby, C.; Radu, R.; Rozum, I.; et al. ERA5 Hourly Data on Single Levels from 1940 to Present. 2023. Available online: https://cds.climate.copernicus.eu/datasets/reanalysis-era5-single-levels (accessed on 17 August 2020).
- De Sales, F.; Santiago, T.; Biggs, T.W.; Mullan, K.; Sills, E.O.; Monteverde, C. Impacts of Protected Area Deforestation on Dry-Season Regional Climate in the Brazilian Amazon. J. Geophys. Res. Atmos. 2020, 125, e2020JD033048. [Google Scholar] [CrossRef] [Scilit]
- Harris, I.; Osborn, T.J.; Jones, P.; Lister, D. Version 4 of the CRU TS Monthly High-Resolution Gridded Multivariate Climate Dataset. Sci. Data 2020, 7, 109. [Google Scholar] [CrossRef] [Scilit] [PubMed]
- Inness, A.; Ades, M.; Agustí-Panareda, A.; Barré, J.; Benedictow, A.; Blechschmidt, A.M.; Dominguez, J.J.; Engelen, R.; Eskes, H.; Flemming, J.; et al. The CAMS Reanalysis of Atmospheric Composition. Atmos. Chem. Phys. 2019, 19, 3515–3556. [Google Scholar] [CrossRef] [Scilit]
- Funk, C.; Peterson, P.; Landsfeld, M.; Pedreros, D.; Verdin, J.; Shukla, S.; Husak, G.; Rowland, J.; Harrison, L.; Hoell, A.; et al. The Climate Hazards Infrared Precipitation with Stations—A New Environmental Record for Monitoring Extremes. Sci. Data 2015, 2, 150066. [Google Scholar] [CrossRef] [Scilit]
- Xie, P.; Arkin, P.A. Global Precipitation: A 17-Year Monthly Analysis Based on Gauge Observations, Satellite Estimates, and Numerical Model Outputs. Bull. Am. Meteorol. Soc. 1997, 78, 2539–2558. [Google Scholar] [CrossRef] [Scilit]
- Dunn, R. A Dynamic Approach to Two-Variable Color Mapping. Am. Stat. 1989, 43, 245–252. [Google Scholar] [CrossRef] [Scilit]
- Kebonye, N.M.; Agyeman, P.C.; Seletlo, Z.; Eze, P.N. On Exploring Bivariate and Trivariate Maps as Visualization Tools for Spatial Associations in Digital Soil Mapping: A Focus on Soil Properties. Precis. Agric. 2023, 24, 511–532. [Google Scholar] [CrossRef] [Scilit]
- Tripathy, S.S.; Jafarzadegan, K.; Moftakhari, H.; Moradkhani, H. Dynamic Bivariate Hazard Forecasting of Hurricanes for Improved Disaster Preparedness. Commun. Earth Environ. 2024, 5, 12. [Google Scholar] [CrossRef] [Scilit]
- Cutter, S.L.; Boruff, B.J.; Shirley, W.L. Social Vulnerability to Environmental Hazards. Soc. Sci. Q. 2003, 84, 242–261. [Google Scholar] [CrossRef] [Scilit]
- Saaty, R.W. The Analytic Hierarchy Process—What It Is and How It Is Used. Math. Model. 1987, 9, 161–176. [Google Scholar] [CrossRef] [Scilit]
- Pohekar, S.D.; Ramachandran, M. Application of Multi-Criteria Decision Making to Sustainable Energy Planning—A Review. Renew. Sustain. Energy Rev. 2004, 8, 365–381. [Google Scholar] [CrossRef] [Scilit]
- Saaty, T.L. The Analytic Hierarchy and Analytic Network Processes for the Measurement of Intangible Criteria and for Decision-Making. In Multiple Criteria Decision Analysis: State of the Art Surveys; Greco, S., Ehrgott, M., Figueira, J.R., Eds.; Springer: New York, NY, USA, 2016; pp. 363–419. [Google Scholar]
- Jenks, G.F. The Data Model Concept in Statistical Mapping. Int. Yearb. Cartogr. 1967, 7, 186–190. [Google Scholar]
- IPCC AR6 WGII. Climate Change 2022: Impacts, Adaptation and Vulnerability, Summary for Policymakers. 2022. Available online: https://www.ipcc.ch/report/ar6/wg2/chapter/summary-for-policymakers/ (accessed on 5 February 2023).
- Betts, R.A.; Malhi, Y.; Roberts, J.T. The Future of the Amazon: New Perspectives from Climate, Ecosystem and Social Sciences. Philos. Trans. R. Soc. B Biol. Sci. 2008, 363, 1729–1735. [Google Scholar]
- Marengo, J.A.; Chou, S.C.; Kay, G.; Alves, L.M.; Pesquero, J.F.; Soares, W.R.; Tavares, P. Development of Regional Future Climate Change Scenarios in South America Using the Eta CPTEC/HadCM3 Climate Change Projections: Climatology and Regional Analyses for the Amazon, São Francisco and the Paraná River Basins. Clim. Dyn. 2010, 38, 1829–1848. [Google Scholar] [CrossRef] [Scilit]
- Anderson, L.O.; Ribeiro Neto, G.; Cunha, A.P.; Fonseca, M.G.; Mendes de Moura, Y.; Dalagnol, R.; Wagner, F.H.; de Aragão, L.E.O.E.C. Vulnerability of Amazonian Forests to Repeated Droughts. Philos. Trans. R. Soc. B Biol. Sci. 2018, 373, 20170411. [Google Scholar] [CrossRef] [Scilit]
- Nobre, C.A.; Sellers, P.J.; Shukla, J. Amazonian Deforestation and Regional Climate Change. J. Clim. 1991, 4, 957–988. [Google Scholar] [CrossRef] [Scilit]
- Marengo, J.A.; Nobre, C.A.; Tomasella, J.; Oyama, M.D.; de Oliveira, G.S.; de Oliveira, R.; Sampaio, G. The Drought of Amazonia in 2005. J. Clim. 2010, 23, 495–516. [Google Scholar] [CrossRef] [Scilit]
- Davidson, E.A.; De Araüjo, A.C.; Artaxo, P.; Balch, J.K.; Brown, I.F.; Mercedes, M.M.; Coe, M.T.; Defries, R.S.; Keller, M.; Longo, M.; et al. The Amazon Basin in Transition. Nature 2012, 481, 321–328. [Google Scholar] [CrossRef] [Scilit] [PubMed]
- Coe, M.T.; Costa, M.H.; Botta, A. Long-Term Simulations of Discharge and Floods in the Amazon Basin. J. Geophys. Res. 2002, 107, D20. [Google Scholar] [CrossRef] [Scilit]
- Mu, Y.; Biggs, T.; Jones, C. Importance in Shifting Circulation Patterns for Dry Season Moisture Sources in the Brazilian Amazon. Geophys. Res. Lett. 2023, 50, e2023GL103167. [Google Scholar] [CrossRef] [Scilit]
- Lense, G.H.E.; Parreiras, T.C.; Spalevic, V.; Avanzi, J.C.; Mincato, R.L. Soil Losses in the State of Rondônia, Brazil. Ciênc. Rural 2021, 51, e20200460. [Google Scholar] [CrossRef] [Scilit]
- Monteverde, C.; De Sales, F.; Quandt, A.; Gilberto de Souza Ribeiro, J. Changing Climates, Changing Lives: Voices of Rondônia’s Farming Community in a Time of Climate Crisis. PLoS Clim. 2024, 3, e0000522. [Google Scholar] [CrossRef] [Scilit]
- Basu, R.; Samet, J.M. Relation between Elevated Ambient Temperature and Mortality: A Review of the Epidemiologic Evidence. Epidemiol. Rev. 2002, 24, 190–202. [Google Scholar] [CrossRef] [Scilit]
- Memon, R.A.; Leung, D.Y.C.; Chunho, L. A Review on the Generation, Determination and Mitigation of Urban Heat Island. J. Environ. Sci. 2008, 20, 120–128. [Google Scholar] [CrossRef] [Scilit]
- Harlan, S.L.; Brazel, A.J.; Prashad, L.; Stefanov, W.L.; Larsen, L. Neighborhood Microclimates and Vulnerability to Heat Stress. Soc. Sci. Med. 2006, 63, 2847–2863. [Google Scholar] [CrossRef] [Scilit]
- Kovats, R.S.; Hajat, S. Heat Stress and Public Health: A Critical Review. Annu. Rev. Public Health 2008, 29, 41–55. [Google Scholar] [CrossRef] [Scilit] [PubMed]
- Ebi, K.L.; Capon, A.; Berry, P.; Broderick, C.; Broderick, C.; de Dear, R.; Havenith, G.; Honda, Y.; Kovats, R.S.; Ma, W.; et al. Hot Weather and Heat Extremes: Health Risks. Lancet 2021, 398, 698–708. [Google Scholar] [CrossRef] [Scilit] [PubMed]
- Ebi, K.L.; Semenza, J.C. Community-Based Adaptation to the Health Impacts of Climate Change. Am. J. Prev. Med. 2008, 35, 501–507. [Google Scholar] [CrossRef] [Scilit]
- Harlan, S.L.; Declet-Barreto, J.H.; Stefanov, W.L.; Petitti, D.B. Neighborhood Effects on Heat Deaths: Social and Environmental Predictors of Vulnerability in Maricopa County, Arizona. Environ. Health Perspect. 2013, 121, 197–204. [Google Scholar] [CrossRef] [Scilit]
- Hondula, D.M.; Davis, R.E.; Leisten, M.J.; Saha, M.V.; Veazey, L.M.; Wegner, C.R. Fine-Scale Spatial Variability of Heat-Related Mortality in Philadelphia County, USA, from 1983–2008: A Case-Series Analysis. Environ. Health 2012, 11, 16. [Google Scholar] [CrossRef] [Scilit]
- Uejio, C.K.; Wilhelmi, O.V.; Golden, J.S.; Mills, D.M.; Gulino, S.P.; Samenow, J.P. Intra-Urban Societal Vulnerability to Extreme Heat: The Role of Heat Exposure and the Built Environment, Socioeconomics, and Neighborhood Stability. Health Place 2011, 17, 498–507. [Google Scholar] [CrossRef] [Scilit]
- Mendelsohn, R.; Dinar, A.; Williams, L. The Distributional Impact of Climate Change on Rich and Poor Countries. Environ. Dev. Econ. 2006, 11, 159–178. [Google Scholar] [CrossRef] [Scilit]
- Eakin, H.; Bojórquez-Tapia, L.A. Insights into the Composition of Household Vulnerability from Multicriteria Decision Analysis. Glob. Environ. Change 2008, 18, 112–127. [Google Scholar] [CrossRef] [Scilit]
- Cunha, A.P.M.A.; Zeri, M.; Leal, K.D.; Costa, L.; Cuartas, L.A.; Marengo, J.A.; Tomasella, J.; Vieira, R.M.; Barbosa, A.A.; Cunningham, C.; et al. Extreme Drought Events over Brazil from 2011 to 2019. Atmosphere 2019, 10, 642. [Google Scholar] [CrossRef] [Scilit]
- Rodriguez-Iturbe, I.; Porporato, A.; Ridolfi, L.; Isham, V.; Coxi, D.R. Probabilistic Modelling of Water Balance at a Point: The Role of Climate, Soil and Vegetation. Proc. R. Soc. A Math. Phys. Eng. Sci. 2001, 457, 2091–2120. [Google Scholar]
- Basso, B.; Ritchie, J.T. Simulating Crop Growth and Biogeochemical Fluxes in Response to Land Management Using the SALUS Model. J. Environ. Qual. 2015, 44, 576–588. [Google Scholar]
- Garcia, A.B.; Angeli, N.; Machado, L.; De Cardoso, F.C.; Gonzalez, F. Relationships between Heat Stress and Metabolic and Milk Parameters in Dairy Cows in Southern Brazil. Trop. Anim. Health Prod. 2015, 47, 889–894. [Google Scholar] [CrossRef] [Scilit] [PubMed]
- Karvatte, N.; Klosowski, E.S.; De Almeida, R.G.; Mesquita, E.E.; De Oliveira, C.C.; Alves, F.V. Shading Effect on Microclimate and Thermal Comfort Indexes in Integrated Crop-Livestock-Forest Systems in the Brazilian Midwest. Int. J. Biometeorol. 2016, 60, 1933–1941. [Google Scholar] [CrossRef] [Scilit]
- De Sousa, K.T.; Deniz, M.; Vale, M.M.D.; Dittrich, J.R.; Hötzel, M.J. Influence of Microclimate on Dairy Cows’ Behavior in Three Pasture Systems during the Winter in South Brazil. J. Therm. Biol. 2021, 97, 102873. [Google Scholar] [CrossRef] [Scilit]
- Deniz, M.; Schmitt Filho, A.L.; Hötzel, M.J.; De Sousa, K.T.; Pinheiro Machado Filho, L.C.; Sinisgalli, P.A. Microclimate and Pasture Area Preferences by Dairy Cows under High Biodiversity Silvopastoral System in Southern Brazil. Int. J. Biometeorol. 2020, 64, 1877–1887. [Google Scholar] [CrossRef] [Scilit]
- Kaijser, A.; Kronsell, A. Climate Change through the Lens of Intersectionality. Environ. Politics 2014, 23, 417–433. [Google Scholar] [CrossRef] [Scilit]
- IBGE. Panorama Do Censo. 2022. Available online: https://censo2022.ibge.gov.br/panorama/ (accessed on 5 February 2026).
- Kelly, P.M.; Adger, W.N. Theory and Practice in Assessing Vulnerability to Climate Change andFacilitating Adaptation. Clim. Change 2000, 47, 325–352. [Google Scholar] [CrossRef] [Scilit]
- Assunção, J.; Gandour, C. The Deforestation Menace: Do Protected Territories Actually Shield Forests? Climate Policy Initiative: Rio de Janeiro, Brazil, 2018. [Google Scholar]

Disclaimer/Publisher’s Note: The statements, opinions and data contained in all publications are solely those of the individual author(s) and contributor(s) and not of MDPI and/or the editor(s). MDPI and/or the editor(s) disclaim responsibility for any injury to people or property resulting from any ideas, methods, instructions or products referred to in the content. |
© 2026 by the authors. Licensee MDPI, Basel, Switzerland. This article is an open access article distributed under the terms and conditions of the Creative Commons Attribution (CC BY) license.