


Abstract
We examine geographic spillovers in digital credit markets by studying how natural disasters affect borrowing behavior in adjacent, physically undamaged regions. Using granular loan-level data from Indonesia’s largest FinTech lender (2021–2023) and leveraging quasi-random variation in disaster timing and location, we estimate fixed-effects specifications that incorporate spatially lagged disaster exposure (an SLX-type spatial approach) to quantify spillovers. Disasters generate economically significant spillovers in neighboring provinces: a 1% increase in disaster frequency raises local borrowing by 0.036%, approximately 20% of the direct effect. Spillovers vary sharply with geographic connectivity—land-connected provinces experience effects about 6.6 times larger than sea-connected provinces. These results highlight that digital lending platforms can transmit geographically proximate risks beyond directly affected areas through channels that differ from traditional banking networks. The systematic nature of these spillovers suggests that disaster-response strategies may be more effective when they consider adjacent regions. That platform risk management can be strengthened by integrating spatial disaster exposure and connectivity into credit monitoring and decision rules.
1. Introduction
Digital lending platforms have changed how credit conditions adjust across space. Unlike branch-based banks, platforms can update underwriting, pricing, and credit limits at high frequency and at scale, using standardized data and automated decision rules. As a result, lending outcomes can comove across nearby regions even when physical damage is localized.
This paper examines whether natural disasters generate spillover effects in digital credit markets, specifically focusing on whether disasters affect borrowing behavior in adjacent, physically unaffected regions. We address this question using granular loan-level data from Indonesia’s largest FinTech lender, combined with comprehensive disaster records spanning 2021–2023. Indonesia provides an ideal setting with frequent natural hazards (over 2400 events annually), deep FinTech penetration, and substantial geographic variation in inter-regional connectivity.
The issue of geographic spillovers in digital finance is both theoretically significant and practically pressing for countries frequently affected by disasters. Theoretically, algorithmic lending may amplify spatial risk transmission by using machine learning models that incorporate geospatial factors into real-time credit decisions (Grindsted, 2021). When disasters strike, algorithms may flag not only epicenter regions but also surrounding areas as higher risk, potentially creating self-fulfilling prophecies of financial instability. In practice, understanding these spillovers is crucial as regulators worldwide grapple with supervising rapidly growing digital lending sectors while managing systemic risks from climate change and rising disaster frequency.
Our analysis builds on spatial finance theory while extending it to the digital lending context. Traditional research demonstrates that financial markets exhibit geographic clustering and spillover effects through bank networks and relationship-based lending (Petersen & Rajan, 2002; Giannetti & Ongena, 2012). However, algorithmic platforms operate through fundamentally different channels that may either amplify or dampen geographic spillovers compared to traditional banking.
We consider three channels through which disasters can generate spillovers in digital credit markets. The first is precautionary demand spillovers, in which households in disaster-adjacent regions, upon observing nearby damage, increase borrowing to hedge against potential income or expenditure shocks. The second channel is algorithmic risk repricing, where platforms incorporate geospatial risk factors into pricing or approval rules and may adjust terms for areas near disaster zones even without direct impact. The third channel is real economic spillovers, where disasters disrupt transportation, supply chains, and labor markets across broader regions, which can affect local income and consumption and, in turn, credit demand and repayment risk. Our empirical strategy tests whether borrowing responds in adjacent, undamaged provinces and how that response varies with physical connectivity.
Our main contribution is to show that these channels produce economically meaningful spillover effects that vary systematically with geographic connectivity. Employing spatial econometric techniques and exploiting quasi-random variation in disaster occurrences, we find that a 1% increase in local disaster frequency leads to a 0.036% rise in borrowing in neighboring provinces—equivalent to roughly 20% of the magnitude of the direct effect. Three key findings emerge from our analysis. First, spillover effects are economically significant yet geographically constrained, with impacts concentrated in immediately adjacent provinces and diminishing quickly with distance. Second, the type of connectivity plays a crucial role: land-connected provinces experience spillovers that are 6.6 times larger than those in sea-connected provinces, underscoring the enduring relevance of physical geography despite digital advancements. Third, these effects are primarily driven by precautionary borrowing demand rather than algorithmic supply restrictions. These results carry important policy implications for disaster-prone economies designing regulatory frameworks for digital finance. Conventional disaster response policies often target only directly affected regions, potentially overlooking substantial spillover effects. Our estimates suggest that emergency financial interventions should also cover neighboring provinces, particularly those linked by land routes to disaster zones. Moreover, the findings inform platform risk management, indicating that algorithmic credit models should account for spatial disaster exposure using connectivity-weighted spillover factors. For the broader finance literature, our study reveals that digital lending introduces new patterns of geographic risk transmission distinct from traditional banking channels. While digital platforms mitigate many physical barriers, geographic proximity and connectivity continue to shape financial interdependence. This implies that financial digitization does not eliminate spatial risks but instead reconfigures them—highlighting the need for updated theoretical perspectives and regulatory approaches. This study advances the literature and practice in three specific ways. First, we introduce a dual-connectivity framework that quantifies how physical geography constrains the transmission of digital risk. We show that land adjacency significantly facilitates spillovers, whereas maritime proximity does not. Second, we provide actionable parameters for institutional investors and platform managers. By estimating the elasticity of spillover effects, stakeholders can calibrate stress tests and portfolio risk weights for regions adjacent to disaster zones. Third, we offer evidence-based criteria for regulatory coordination. The results support the implementation of regional rather than province-specific stabilization triggers. These contributions bridge the gap between spatial finance theory and the operational realities of algorithmic lending in disaster-prone emerging markets.
The paper proceeds as follows. Section 2 describes Indonesia’s institutional setting and the construction of our data. Section 3 presents our spatial econometric identification strategy. Section 4 reports the main findings on the existence and magnitude of spillovers. Section 5 explores mechanisms and heterogeneous effects. Section 6 discusses policy implications, and Section 7 concludes.
2. Literature Review
The literature relevant to this study can be organized into five strands. These strands concern how households respond to shocks, the role of digital financial infrastructure in that response, the evolution of fintech credit and BigTech credit, the competitive and regulatory implications of these developments, and the empirical strategies used to identify causal effects in settings with spatial and temporal spillovers. First, a large body of work studies how households smooth consumption and manage liquidity after adverse shocks. Standard consumption theory predicts that if households can borrow freely and insure each other, then temporary income shocks should not translate one-for-one into drops in consumption (Carroll, 1997). Empirical evidence shows that this prediction rarely holds in practice, especially for households in developing economies, because access to formal credit is often constrained and informal insurance is incomplete (Gross & Souleles, 2002; Karlan & Zinman, 2008). Research on natural disasters has made this point very concrete. Using household data from the 1995 Kobe earthquake in Japan, Sawada and Shimizutani (2008) find that households that already had collateralizable assets and faced fewer borrowing constraints were able to borrow quickly after the earthquake and stabilize consumption. By contrast, liquidity-constrained households could not easily borrow and were forced to cut essential spending and rely more heavily on private transfers. This evidence underscores that, in the aftermath of extreme shocks, access to credit is not merely a question of investment or growth, but of immediate welfare. Related work shows that if ex ante financial instruments are available before the shock occurs, the shock’s ex post welfare cost can be materially reduced. Ahmed et al. (2020) provide experimental evidence from Ethiopia that index-based rainfall insurance allows farmers to receive payouts after adverse weather events. This reduces the need to sell productive assets or sharply contract basic consumption. In that sense, insurance functions as pre-arranged liquidity for the disaster period. These findings align with the mechanism described by Carroll (1997), who models buffer-stock saving behavior, and with Gross and Souleles (2002), who show that consumers treat credit card borrowing capacity as an emergency liquidity buffer when income falls. The picture that emerges from this stream of work is that post-shock consumption smoothing depends on two channels. One is formal and quasi-formal finance, including loans and insurance. The other is informal support through family and social networks.
Second, the form of that informal support has changed. Digital payment systems, prepaid mobile balances, and peer-to-peer transfers now allow small, fast, targeted injections of liquidity into households exposed to shocks. Suri and Jack (2016) document that widespread adoption of mobile money in Kenya improved households’ ability to absorb shocks over the long run, especially for female-headed households, and is associated with a measurable reduction in extreme poverty. Blumenstock et al. (2016) show that after sudden disasters, individuals receive rapid airtime transfers from contacts outside the affected area within hours or days of the event. These small-value transfers effectively serve as emergency relief and working liquidity. Blumenstock et al. (2015) further demonstrate that mobile phone metadata can accurately predict an individual’s socioeconomic status. This suggests that digital traces can be used not only to route post-shock support quickly, but also to identify vulnerable populations poorly served by traditional banking and insurance systems.
This flow of emergency support is not only domestic. Aydoğdu et al. (2025) analyze global data on international prepaid airtime top-ups and show that migrants and overseas workers repeatedly send small-value top-ups back home when relatives experience economic or environmental stress. In practice, this mechanism functions as a low-cost, instant, quasi-remittance channel that can stabilize households in crisis, even when they lack bank accounts. Bailey et al. (2018) show that cross-regional and cross-border social connectedness is highly structured and measurable, and that the density of such connections predicts the movement of information and resources. Taken together, these studies imply that digital communication networks, coupled with mobile money and mobile credit, can replicate some features of informal insurance across large geographic distances. The kinship network is no longer defined by physical proximity. It increasingly operates through digital rails.
Third, digital lending platforms and fintech credit have altered how emergency liquidity itself is supplied. Traditional banks long relied on soft information, face-to-face relationships, and a physical branch presence. This created persistent geographic frictions in the availability and pricing of credit for small firms and financially thin-file borrowers (Petersen & Rajan, 2002; Brevoort et al., 2010). The rise of online lending and marketplace lending changed that structure. Instead of requiring physical interaction, platforms underwrite borrowers using automated scoring models, alternative data, and remote onboarding. Berg et al. (2020) show that even simple digital footprints can help predict default risk and, in many cases, outperform traditional credit bureau scores. This allows platforms to distinguish between low-risk and high-risk applicants even when those applicants have little or no formal credit history.
Significantly, fintech lenders have not expanded uniformly. They have expanded most in the places where traditional banks have been least active. Studying LendingClub in the United States, Jagtiani and Lemieux (2018) find that fintech lenders disproportionately penetrate areas with fewer bank branches, more concentrated banking markets, and weaker local economic conditions. Fintech credit enters where the local banking system has retrenched, and the pattern is consistent with platforms stepping into a “credit gap” that incumbents were unwilling or unable to fill. This evidence reinforces the interpretation of fintech credit as a shock absorber for underserved regions. It also links back to the disaster literature. If an adverse event suddenly increases short-term borrowing needs, it is plausible that the first lender to respond is not a branch bank but an app. The relationship between platforms and banks is more subtle than simple substitution. De Roure et al. (2022) and Balyuk and Davydenko (2024) argue that online lending has created a new form of financial intermediation. Platforms sometimes “cream skim” relatively safer borrowers whom banks have not yet appropriately priced. In other settings, they provide last-resort credit to higher-risk borrowers that banks avoid. Over time, loan origination, screening, and even monitoring functions can migrate from traditional banks to fintech platforms. This process is described as reintermediation because, rather than eliminating intermediaries, it replaces one type of intermediary with another that relies on algorithms and scale instead of local branch officers.
Fourth, large technology firms have extended this logic by embedding credit directly into digital ecosystems. Frost et al. (2019) describe how BigTech firms exploit massive pools of transaction and payment data, as well as platform reputation metrics, to originate and price loans to consumers and small firms. Hau et al. (2019) demonstrate how this model operates in China, where platforms at the center of e-commerce and payments can deliver working capital to small sellers almost instantaneously. This creates a self-contained loop in which payment data, sales histories, operational cash flows, and lending decisions all reside within the same corporate infrastructure. The macrofinancial implications are significant. Huang et al. (2023) and De Fiore et al. (2023) examine the interaction between BigTech credit and monetary policy. They find that when policy turns more accommodative, BigTech lenders expand credit to new and previously unbanked clients more quickly than traditional banks expand credit to their existing borrowers. Huang et al. (2024) similarly argue that the BigTech channel can amplify the transmission of monetary policy to the small-business sector because it reaches borrowers who were not on the radar of conventional lenders. These studies suggest that the platform-driven credit channel not only fills gaps left by banks but also alters how macro policy propagates into the real economy. At the same time, regulators have raised concerns that this model shifts market power, pricing authority, and risk concentration toward a handful of data-dominant platforms (Naceur et al., 2023; Doerr et al., 2023). This raises classic questions in financial stability. Allen and Gale (2000) emphasize that when intermediation is highly interconnected and concentrated, localized shocks can become system-wide stress through network spillovers. In a world where a few digital platforms intermediate a growing share of payments, savings (like balances), and credit, systemic risk can emerge outside the core banking system.
More broadly, Philippon (2016) argues that the main opportunity of fintech lies in its ability to deliver financial services at lower cost and with higher allocative efficiency than traditional incumbents. This same cost advantage, however, can accelerate concentration. Recent policy reviews, therefore, frame fintech and BigTech not only as engines of inclusion but also as new centers of market power and potential fragility (Bogaard et al., 2024). The result is a regulatory dilemma. Authorities want the reach and flexibility of digital credit in underserved and shock-exposed communities. They also want to prevent an outcome in which a small number of unregulated gatekeepers control crisis-time liquidity.
Finally, the empirical strategies used in this literature have evolved quickly. Many relevant shocks are staggered across regions or borrower groups rather than occurring everywhere at once. Traditional two-way fixed-effects difference-in-differences estimators can be biased in such settings because different treated cohorts serve as one another’s controls. Goodman-Bacon (2021) formalizes this source of bias. Callaway and Sant’Anna (2021) and Sun and Abraham (2021) propose estimators for settings with multiple periods and heterogeneous treatment timing that recover cohort-specific average treatment effects and dynamic event study paths under weaker assumptions. These methods have become standard in studies of policy interventions, financial shocks, and natural disasters, where parallel trends must be evaluated at the cohort level.
In addition, recent work emphasizes that spillovers often do not follow purely geographic adjacency. Bailey et al. (2018) show that social connection networks transmit resources, norms, and information across regions. Frost et al. (2019) and Doerr et al. (2023) argue that BigTech finance creates credit and liquidity spillovers through platform-controlled commercial networks. Spatial econometrics provides one way to model these spillovers explicitly by incorporating spatial lags and network structures into panel regressions (LeSage & Pace, 2009; Elhorst, 2014). For studies of post-disaster liquidity and digital lending, this implies that identification strategies must account for both temporal dynamics and network- or spatial-based transmission. The core research question is no longer only whether lending rises after a shock in the directly affected area. It is also whether alternative credit channels diffuse to neighboring areas and along digital networks, and how quickly that diffusion occurs. The present study builds on these strands. It examines the behavior of digital lending following a sudden real shock in an emerging market setting. It asks whether platform credit expands after a disaster, whether the expansion is driven by the entry of new borrowers or by larger loans to existing borrowers, whether there is evidence of pricing adjustments or risk repricing, and whether there are signs of spatial and network spillovers that extend beyond the directly affected locations. In doing so, it speaks to the literature on consumption-smoothing aftershocks, financial inclusion and fintech access, Big Tech credit and monetary transmission, and causal identification in staggered-shock environments.
Building on the literature regarding consumption smoothing and network spillovers, we formulate three testable hypotheses to guide our empirical analysis.
Hypothesis 1 (H1).
Natural disasters generate positive borrowing spillovers in geographically adjacent regions. Residents in neighboring areas act on precautionary motives or face indirect economic disruptions, leading to increased demand for liquidity even in the absence of direct physical damage.
Hypothesis 2 (H2).
Spillover transmission varies by connectivity type. Digital lending overcomes some physical barriers, yet economic integration often relies on terrestrial transport and supply chains. We hypothesize that land-connected provinces exhibit greater spillover magnitudes than sea-connected provinces due to deeper economic linkages and information flows.
Hypothesis 3 (H3).
Spillovers are driven primarily by precautionary demand. If platforms reacted by tightening algorithms, we would observe supply constraints. Conversely, if spillovers reflect household risk management, we expect increased loan volumes concentrated among borrowers with established credit capacity.
3. Empirical Analysis
3.1. Indonesia’s Digital Lending Market and Natural Disaster Environment
Indonesia presents a compelling setting for examining geographic spillovers in digital credit markets. The archipelago nation experiences frequent natural disasters due to its location at the intersection of three major tectonic plates, while simultaneously hosting one of the world’s fastest-growing FinTech lending sectors. This combination creates an ideal environment for studying how localized shocks propagate through digital financial networks. The Indonesian National Disaster Management Agency (BNPB) records indicate that the country faces multiple types of natural hazards, including floods, earthquakes, landslides, droughts, volcanic eruptions, tsunamis, and extreme weather events. The frequency and spatial distribution of these events provide quasi-experimental variation essential for causal identification. Moreover, Indonesia’s archipelagic geography creates natural variation in inter-provincial connectivity, with some provinces connected by land borders while sea routes of varying distances separate others. This geographic structure enables us to test whether spillover effects transmit differently through distinct connectivity channels. The digital lending sector in Indonesia has expanded rapidly, driven by limited traditional banking penetration and widespread mobile phone adoption. The Financial Services Authority (OJK)1 oversees the legal online lending industry, which serves millions of borrowers across the archipelago. These platforms utilize algorithmic underwriting and provide rapid loan processing, characteristics that make them particularly suitable for capturing immediate behavioral responses to external shocks. The speed of digital lending decisions and the comprehensive digital records maintained by these platforms offer unique advantages for studying real-time spillover effects.
3.2. Data Sources and Construction
Our empirical analysis integrates proprietary lending data with official disaster records to construct a comprehensive dataset suitable for spatial econometric analysis. The lending data are obtained from a leading online credit platform, ranked among the top 10 legal lending companies in Indonesia and estimated to have a 12% market share. Each user on the platform is assigned a unique identifier, allowing us to track borrowing activity and repayment behavior throughout the observation period.
To ensure the dataset is representative of the broader borrower population, we employed stratified sampling by province-level user density. The sample of 35,887 users was drawn randomly within these geographic strata to preserve the spatial distribution of the platform’s total portfolio. We verified that the demographic characteristics of the sample, including age, income, and gender distributions, deviate by less than 5% from the population means reported in the platform’s internal quarterly filings. The observation window from April 2021 to July 2023 was selected to maximize data continuity following the lender’s major system migration in early 2021. This period provides a consistent algorithmic environment for analysis. We exclude the initial three months of 2021 to allow for the construction of spatial lags without truncation bias.
Data on natural disasters are obtained from Indonesia’s National Disaster Management Agency (BNPB), which maintains official records of all disaster events across the archipelago. The BNPB systematically documents a wide range of disaster types, including floods, landslides, droughts, earthquakes, volcanic eruptions, tsunamis, and extreme weather events. From these records, we compile monthly counts of disaster occurrences at the province level between January 2021 and July 2023, providing province–month level variation in disaster exposure that forms the basis of our identification strategy.
The raw dataset constitutes a balanced panel of 34 provinces observed over 31 months, yielding a theoretical maximum of 1054 province–month observations (34 × 31 = 1054). The full sample, summarized in Table 1, provides extensive geographic and temporal coverage of Indonesia’s lending activities and disaster exposure during the study period. For the spatial econometric analysis presented in Table 2 and subsequent tables, we use 897 province–month observations, representing approximately 85% of the theoretical maximum. The remaining 157 observations are excluded as part of data refinement and quality assurance processes required for valid spatial estimation.
Table 1.
Sample Coverage and Spatial Structure.
Table 2.
Spatial Spillover Effects Analysis.
Two main factors explain this reduction. First, constructing spatial lag variables requires complete disaster data for all neighboring provinces in each period. To avoid measurement errors arising from incomplete neighbor information, we exclude the first three months of data (January–March 2021), resulting in the loss of 102 observations (34 provinces × 3 months). Second, a small number of province–month cells exhibit missing or zero loan records, primarily in remote regions where the platform expanded gradually during the sample period. To prevent conflating true zero lending with missing data, we exclude these 55 observations. The missingness shows no systematic correlation with disaster exposure, supporting the assumption that data are missing completely at random.
After these adjustments, our estimation sample comprises 897 province–month observations across 34 provinces from April 2021 through July 2023. The resulting panel retains sufficient spatial and temporal variation for identification. All provinces experience at least one disaster during the sample period, and each contributes an average of 26.4 monthly observations. The combination of granular lending records and comprehensive disaster documentation provides multiple sources of identifying variation essential for causal inference. Temporal variation arises from the quasi-random timing of natural disasters, permitting within-province before-and-after comparisons. In contrast, spatial variation derives from heterogeneity in disaster intensity across provinces, facilitating cross-sectional comparisons between affected and unaffected regions. Moreover, variation in geographic connectivity enables examination of spillover transmission channels through land and sea networks.
With 34 provinces, the number of undirected province pairs is (34 × 33)/2 = 561. We define adjacency symmetrically, where neighbor relationships are counted once per pair, consistent with row-standardized spatial weight matrices (W) that allow degrees to vary across provinces. This approach provides a consistent framework for measuring interprovincial dependence in spatial econometric models.
In addition to the BNPB disaster data, we incorporate several auxiliary variables. Loan outcomes are aggregated from individual transactions to the province–month level, while supplementary controls—such as weather variables, night lights, and mobility indicators—are harmonized to monthly frequencies and matched by province code. To ensure data reliability, we conduct extensive validation and quality checks. Geographic assignments are verified against official administrative boundaries to ensure correct province-level classification. All timestamps are standardized to monthly frequencies, and consistency checks confirm that patterns of missing data exhibit no systematic bias. The BNPB records serve as Indonesia’s official disaster statistics, providing standardized reporting and consistent classification across provinces, which strengthens the credibility of our disaster exposure measure.
The final province–month panel supports the empirical strategies introduced in the following section. Its structure enables estimation of spatial lag models, facilitates event-study designs, and supports the construction of spatial weight matrices for testing spillover effects. The underlying individual-level data further allow robustness checks based on alternative aggregation schemes. Compared with prior datasets used in the spatial finance literature, our data offer broader geographic coverage, richer temporal depth, and greater micro-level precision—together providing a robust empirical foundation for analyzing spatial spillovers and behavioral responses in Indonesia’s digital credit markets.
3.3. Variable Construction and Sample Characteristics
Our primary treatment variable, Disaster Exposure , measures the total number of natural disaster events recorded by the Indonesian National Disaster Management Agency (BNPB) in province i during month t. The BNPB provides systematic documentation of all major disaster types, including floods, earthquakes, landslides, droughts, volcanic eruptions, tsunamis, and extreme weather events. We aggregate across all disaster types without applying severity or economic impact weights. Accordingly, reflects the frequency of disaster occurrences within each province–month rather than the magnitude or intensity of individual events.
In its raw form, is a simple monthly event count that takes integer values ranging from 0 to 96 across province–month observations. To accommodate zero values and reduce right-skewness in the distribution, we apply the natural logarithmic transformation . The resulting variable measures disaster exposure on a logarithmic scale and serves as the baseline specification in all primary analyses. Detailed transformation procedures, including logarithmic scaling and standardization, are presented in Table A1 of the Appendix A.
For robustness, we construct two alternative measures of disaster exposure. The first is a binary treatment indicator that equals one if at least one disaster event occurs in each province–month and zero otherwise. The second is a standardized disaster intensity index, scaled from 0 to 100, that weights disaster occurrences by the affected population size. Across all specifications, our results remain consistent, with the log-transformed count measure providing the best balance between capturing meaningful variation and maintaining interpretability.
From individual loan-level records, we construct several province–month-level outcome variables that capture different dimensions of credit market activity. Our primary dependent variable is the total loan volume disbursed within each province–month, representing the intensive margin of borrowing demand. We also examine loan counts to capture extensive margin effects, average loan size to assess borrowing intensity, and repayment performance indicators to evaluate potential impacts on credit quality.
Finally, to examine both direct and spillover effects of disasters, we develop multiple treatment variable specifications based on BNPB records. A province is considered directly treated if it experiences any disaster event during a given month. Continuous versions of the treatment variable capture the intensity of disaster exposure using the count measure described above. For the spillover analysis, we further construct spatial lag variables that capture neighboring provinces’ disaster exposure under alternative definitions of geographic adjacency.
4. Identification
We exploit the quasi-random timing and geographic incidence of natural disasters to identify the causal impact of disaster shocks on digital lending and their spillover effects across provinces. Natural disasters offer a credible quasi-experimental setting because their occurrence is exogenous primarily to local economic and borrowing conditions, and their spatial and temporal boundaries can be precisely observed. This exogeneity allows us to disentangle direct local impacts from indirect spillover effects that may transmit across provinces through behavioral and economic channels.
4.1. Identification Strategy and Baseline Specification
The primary identification challenge lies in separating genuine spatial spillovers from correlated regional shocks or pre-existing geographic patterns. To address this, we begin with a non-spatial fixed-effects model that estimates the direct effects of disasters on local lending activities:
where is the natural logarithm of total disbursed loan amounts in province i during month t. captures local disaster intensity based on event counts from Indonesia’s National Disaster Management Agency (BNPB). Province fixed effects ( absorb time-invariant heterogeneity, while year–month fixed effects () control for national macroeconomic and regulatory shocks. The coefficient measures the elasticity of local lending with respect to disaster shocks and serves as a benchmark for subsequent spatial specifications.
4.2. Spatial Spillover Identification
To assess whether the impact of disasters extends beyond provincial boundaries, we estimate spatial panel models that explicitly account for inter-provincial linkages. We construct three adjacency matrices representing distinct geographic relationships: land adjacency (), sea adjacency (), and a combined matrix () capturing either type of connection. Land adjacency links provinces that capture both types of order on the same island. In contrast, sea adjacency identifies inter-island provinces separated by short maritime passages (≤200 km) with regular ferry or shipping connections. All matrices are row-standardized so that the spatial lag reflects the average exposure of neighboring provinces rather than the sum. Complete construction details and adjacency listings are provided in Appendix A Table A2.
Our main specification incorporates the spatial lag of disaster exposure as follows:
The coefficient captures geographic spillovers—that is, the extent to which disaster shocks in neighboring provinces affect local lending outcomes, net of local disasters and common time shocks. The construction of the maritime adjacency matrix requires a distance threshold to define connectivity. We use a baseline cutoff of 200 km, combined with the presence of scheduled ferry routes. This threshold is chosen to reflect the operational range of short-haul inter-island commerce and daily labor mobility, which are distinct from long-distance freight shipping. To address concerns regarding the selection of this cutoff, we perform robustness checks using alternative thresholds of 100 km and 300 km. These sensitivity analyses, reported in the results section, confirm that the estimated spillover effects are stable and do not depend on the specific value of the distance parameter.
4.3. Heterogeneity by Connection Type
Given Indonesia’s archipelagic geography, we further decompose spillovers by connection type using mutually exclusive matrices for land- and sea-connected provinces:
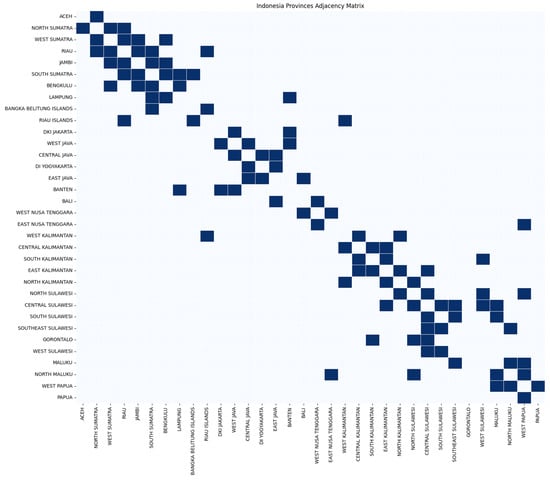
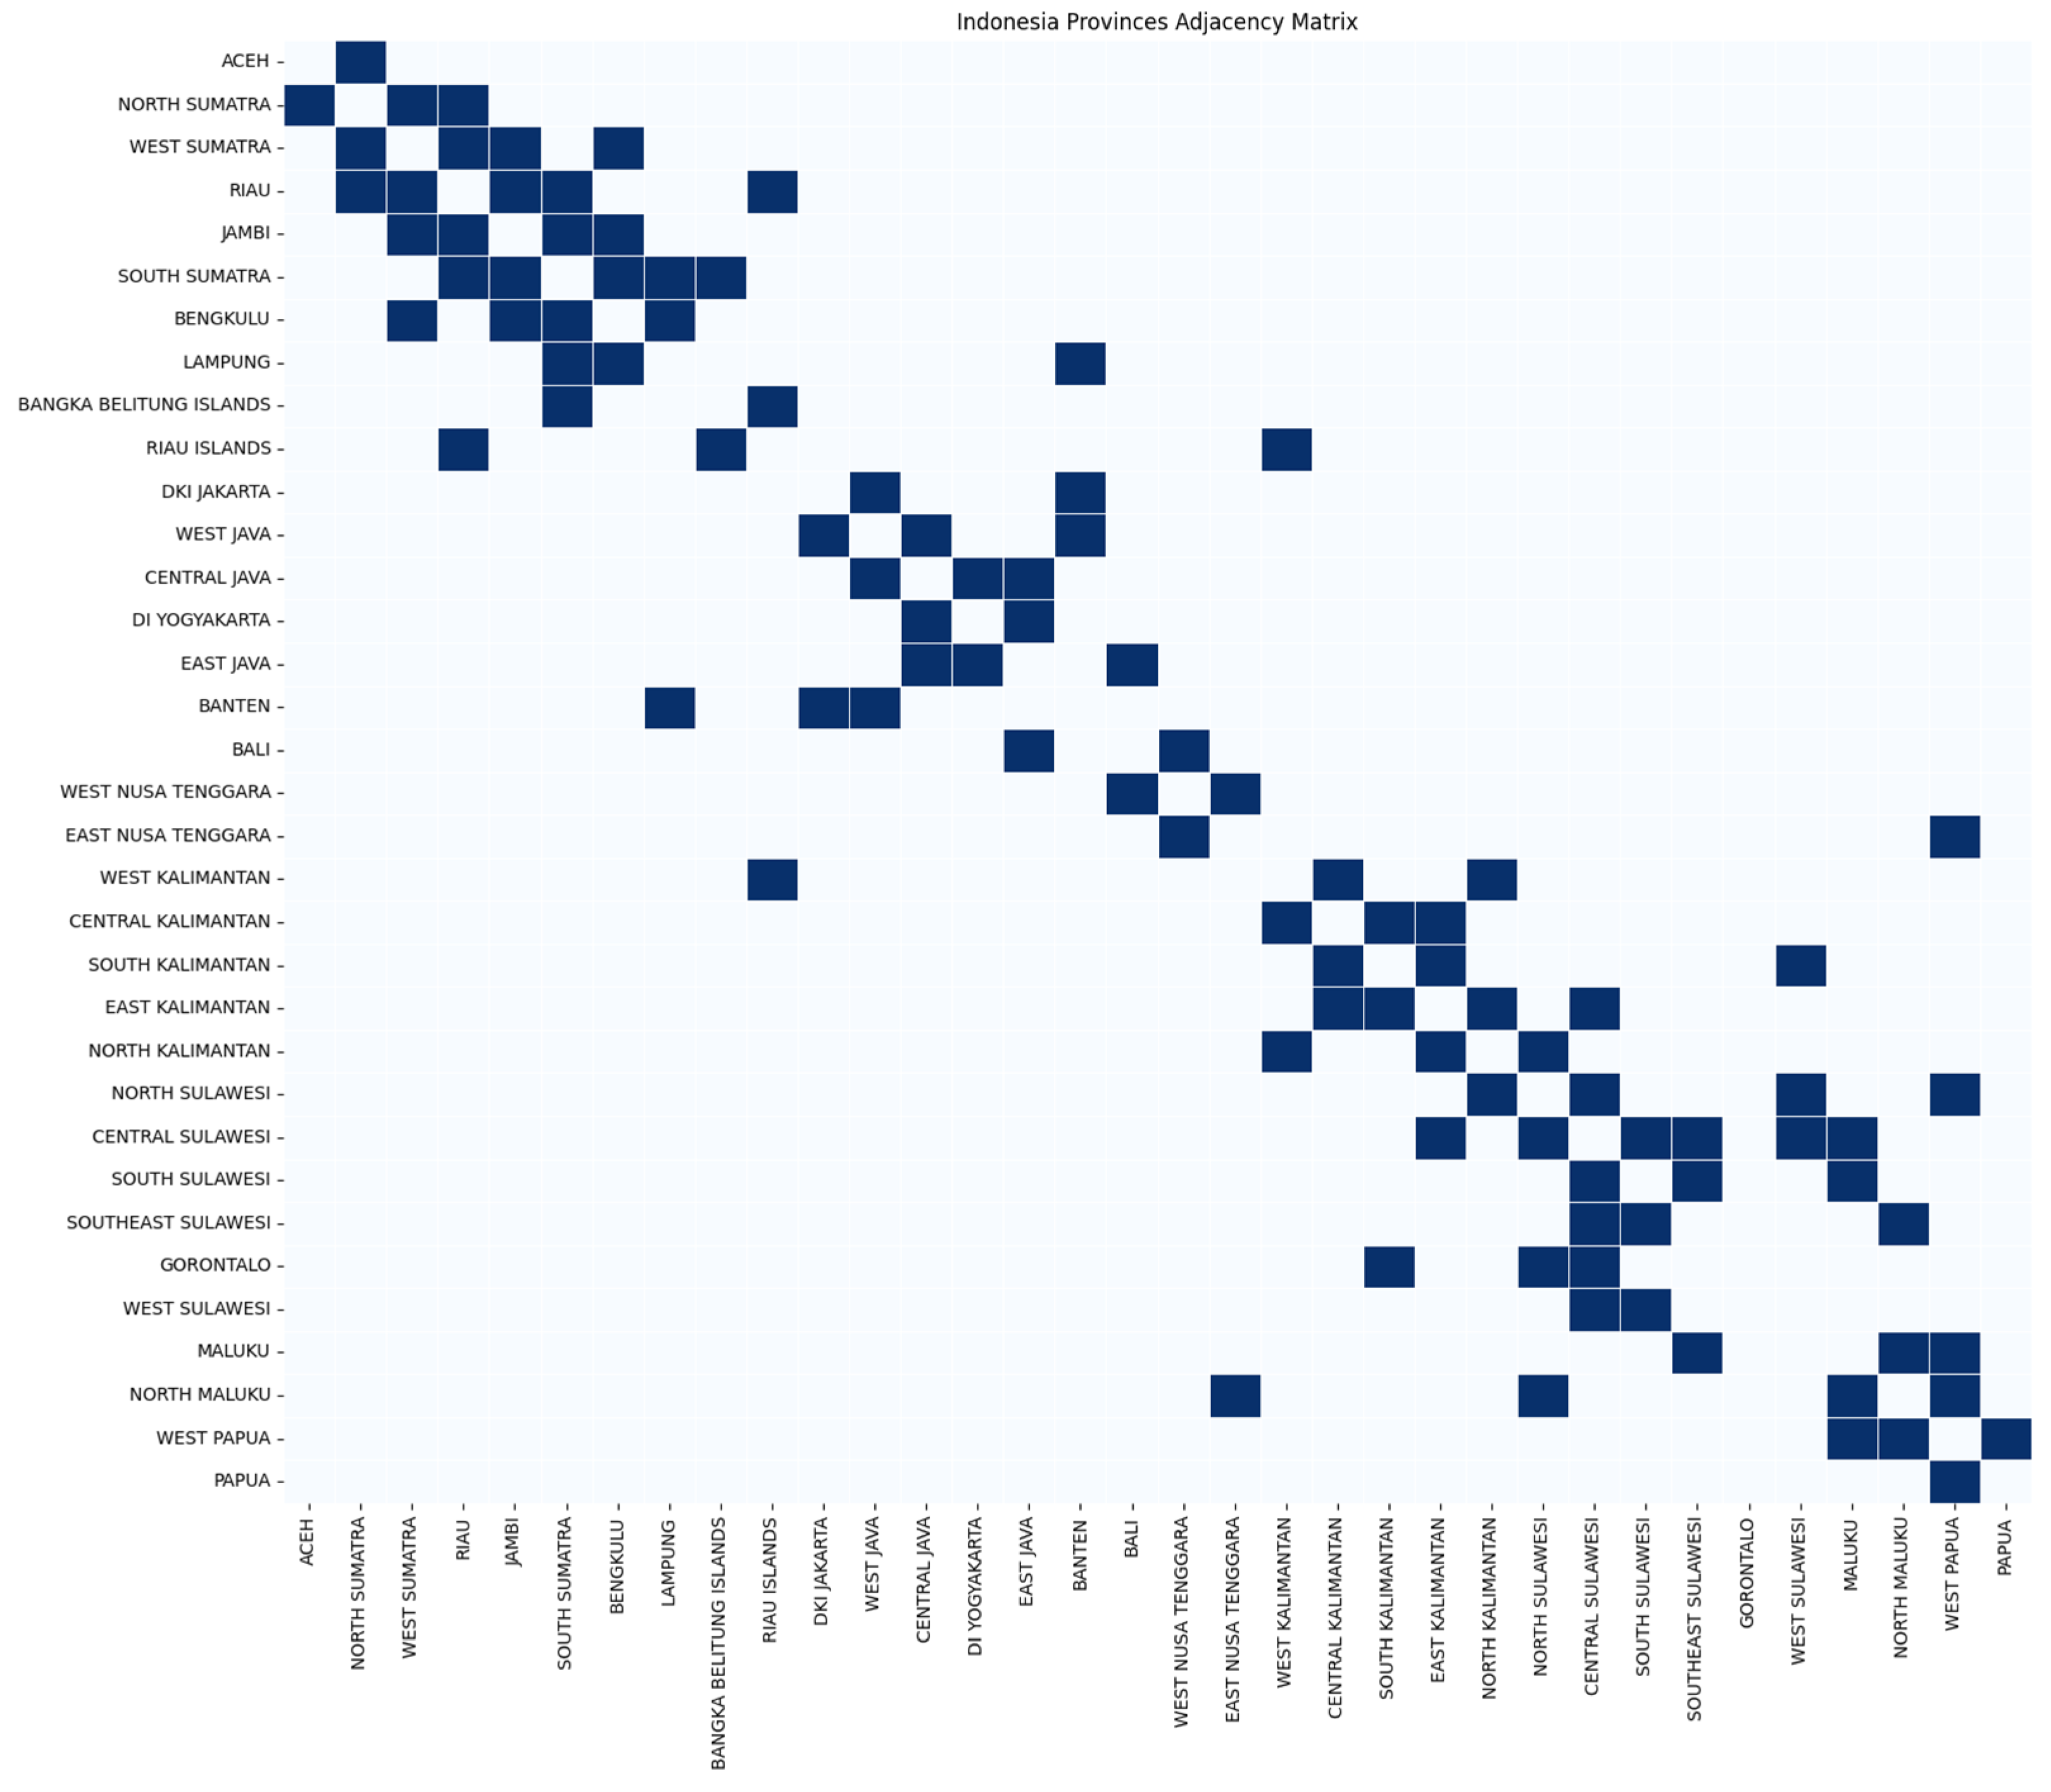
In Figure 1, Indonesia Provinces Adjacency Matrices (W, , ), row-standardized binary contiguity (land) and ferry-connected maritime (sea) links were used to construct spatial lags. All models are estimated using maximum likelihood or OLS with province- and time-fixed effects, and standard errors are clustered at the province level. Model diagnostics—based on AIC, BIC, likelihood ratio tests, and Moran’s I statistics—confirm that incorporating spatial lags substantially reduces residual spatial autocorrelation (e.g., Moran’s I declines from ≈0.28 to ≈0.09), indicating improved model fit.
Figure 1.
Indonesia Provinces Adjacency Matrix. Note: This figure illustrates province-level boundaries and connectivity structure. W is a binary matrix that takes value 1 if two provinces share a land border. W_sea captures maritime connectivity and is defined for pairs that are separated by sea, within 200 km, and connected by a scheduled ferry route. The 200 km threshold reflects typical inter-island ferry crossings and yields a maritime network that is neither too sparse nor overly dense. Robustness checks varying distance thresholds and using alternative maritime connectivity measures are reported in Appendix A.
4.4. Threats to Identification and Interpretation
Our identification leverages within-province variation in disaster exposure and spatial variation in adjacency. A key concern is that the spatial lag of disasters could pick up correlated shocks affecting multiple provinces simultaneously, rather than pure proximity-based transmission. We address this in three ways. First, our baseline specification includes province fixed effects and year-month fixed effects, and we add island-by-year-month fixed effects in robustness checks to absorb time-varying shocks standard to provinces on the same central island. Second, we report standard errors that are robust to spatial and serial correlation, including Conley-type corrections and two-way clustering. Third, we implement an event-study analysis around large, localized disasters to trace dynamic responses in neighboring provinces and to verify the absence of differential pre-trends. Together, these exercises strengthen the case that the estimated spillovers are not drive the estimated spillovers.
4.5. Event-Study Validation
To further distinguish proximity-based spillovers from broad correlated shocks, we complement the main specifications with an event-study design around large, localized disasters. We define event months using major disasters with concentrated physical impact and estimate dynamic coefficients for both the local disaster exposure and its spatial lag using leads and lags relative to the event month, while maintaining the same fixed effects structure. Specifically, we estimate:
where t0 denotes the event month, K indexes event time from k = −6 to k = +6 months, and k = 0 is omitted as the reference period. The coefficients βk trace the dynamic local response, while θk trace spillover dynamics in neighboring provinces. All specifications retain province fixed effects and year-month fixed effects, and robustness versions add island-by-year-month fixed effects to absorb time-varying shocks common to provinces on the same major island. Inference is reported using standard errors robust to spatial and serial correlation.
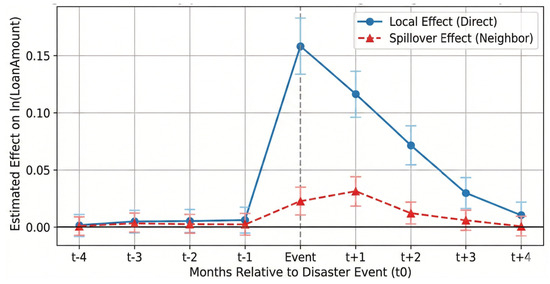
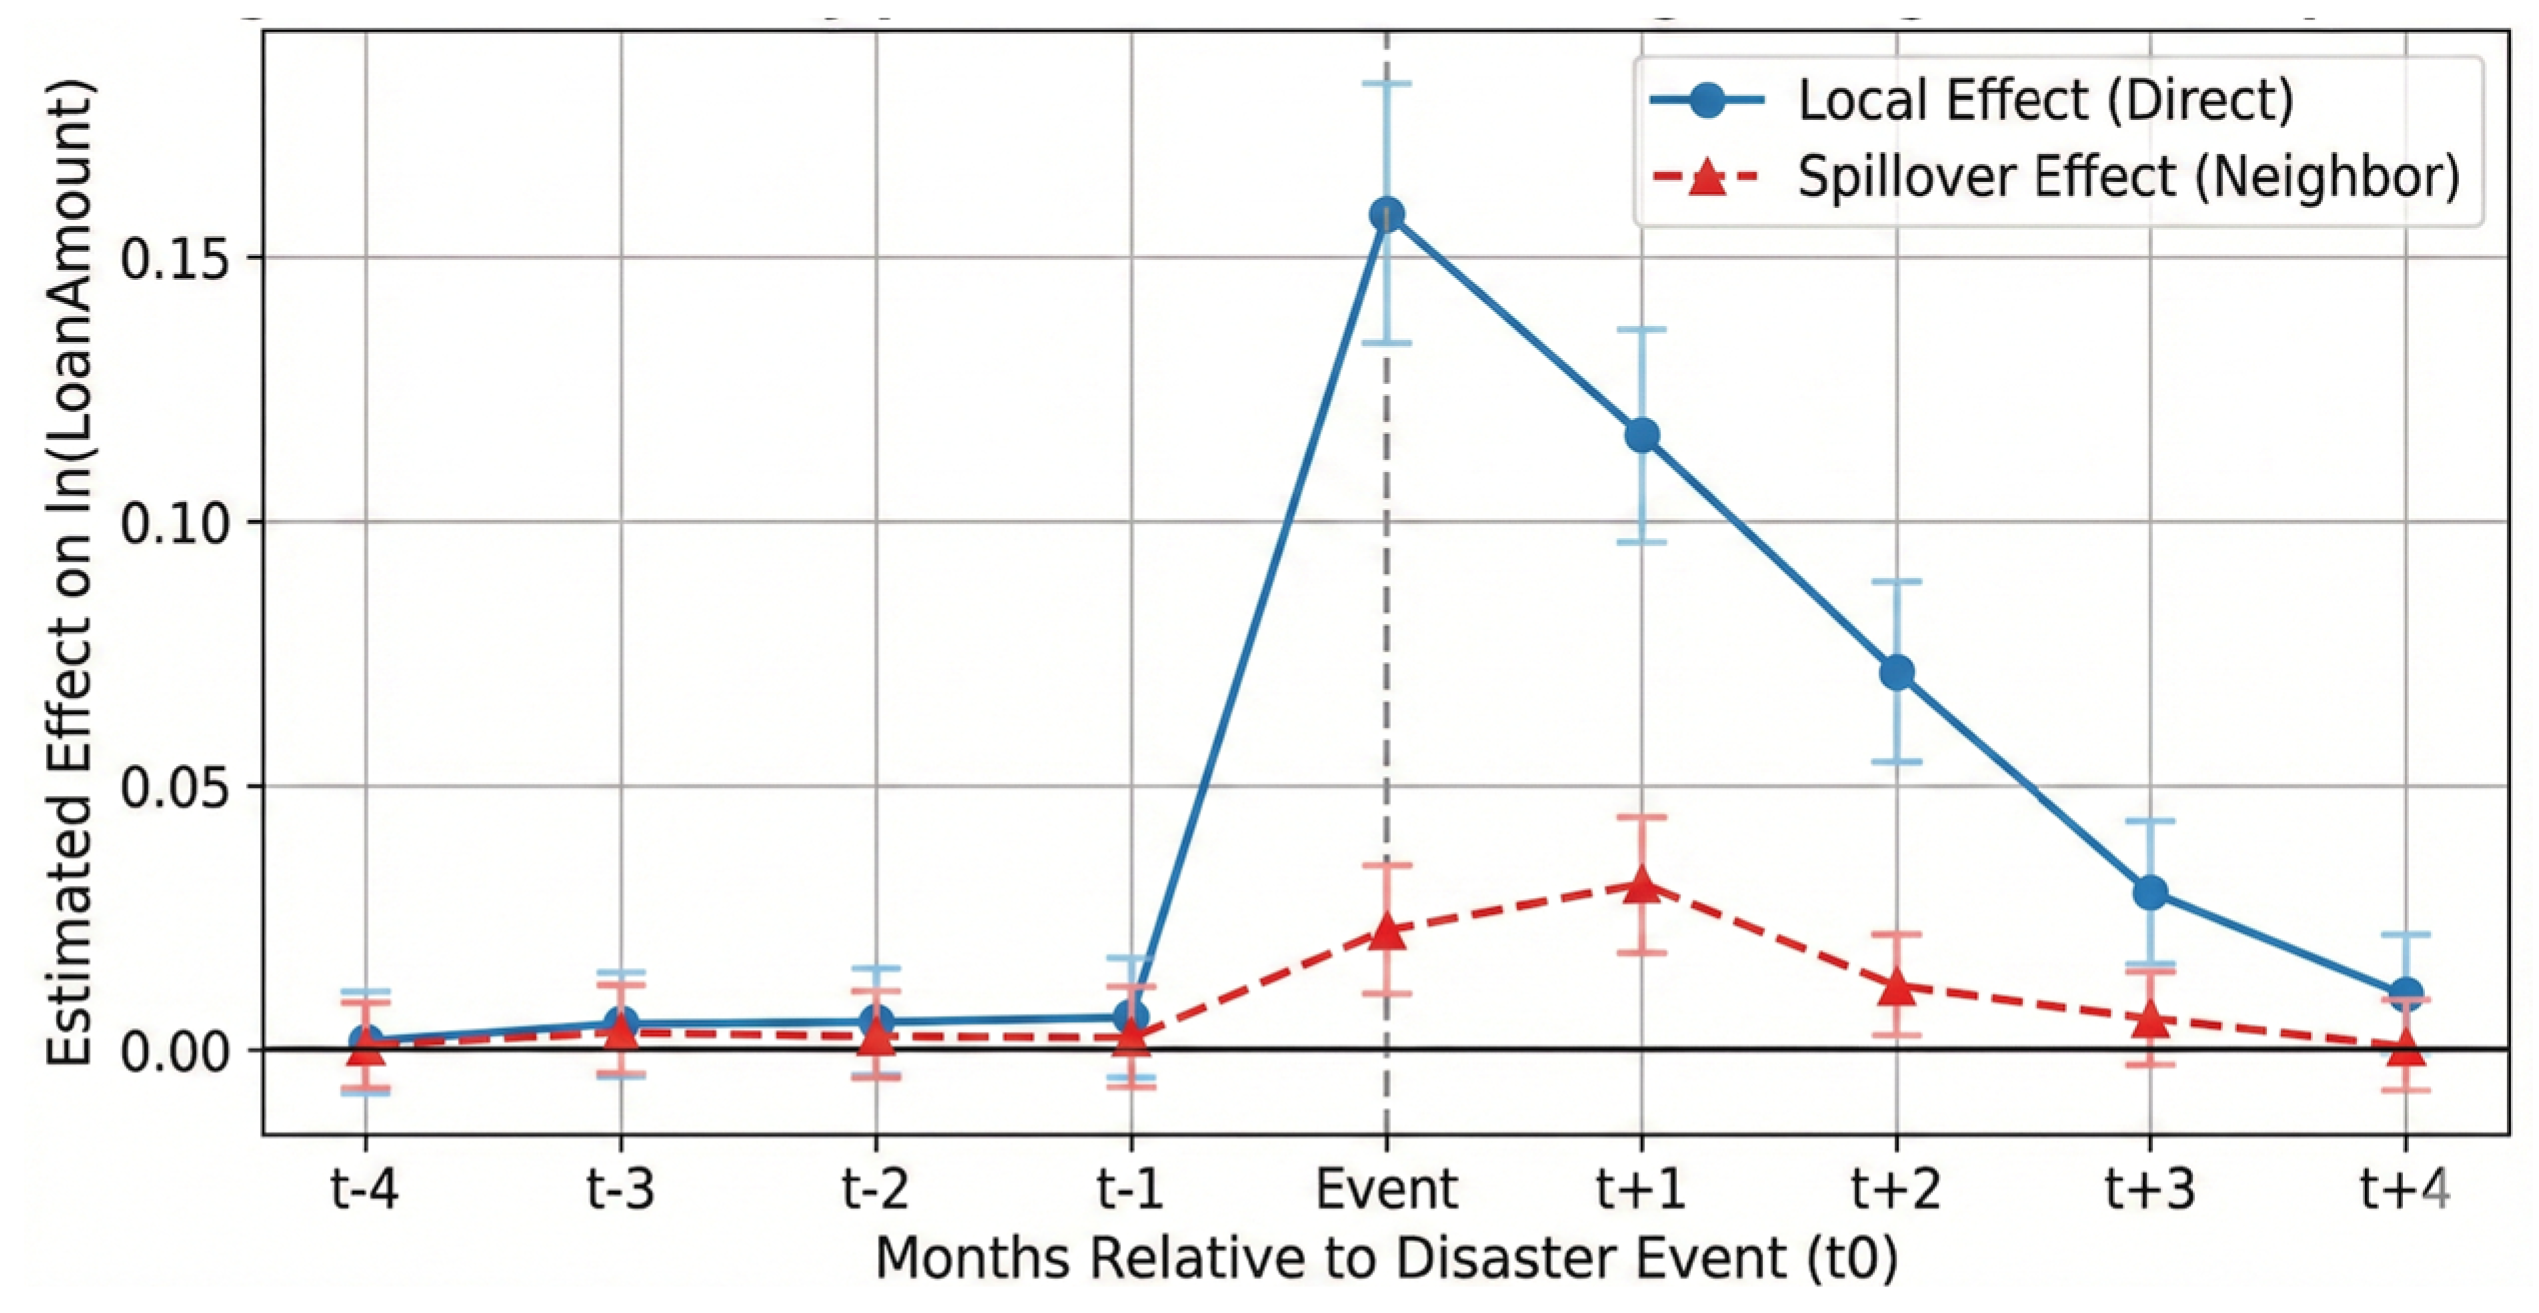
The event-study estimates allow two diagnostics that are directly relevant to identification. First, coefficients on pre-event leads test for differential pre-trends in neighboring provinces. If spillover coefficients on leads are statistically indistinguishable from zero, this weakens the concern that spatial lags are proxying for slow-moving, region-wide trends. Second, post-event dynamics trace how quickly spillovers emerge and how rapidly they dissipate. A pattern in which spillovers rise shortly after the event and then decay is consistent with short-run proximity-based transmission rather than persistent regional shocks. As reported in Figure 2 and Appendix A Table A4, the event-study profiles provide a complementary validation of the baseline results, confirming that spillovers reflect short-run liquidity shocks rather than long-term structural trends.
Figure 2.
Event-study for local and neighboring disaster exposure. Notes: This figure plots the estimated dynamic coefficients βk (local effect) and θk (spillover effect) from the event-study specification in Section 4.5. The dependent variable is ln(LoanAmtit), the natural logarithm of total loan disbursements in province i during month t. Disaster exposure is measured as Dit = ln(1 + Disasterit), and the spillover term is its spatial lag (WD)it computed using the row-standardized adjacency matrix W. The horizontal axis shows event time k = t − t0 in months relative to the event month t0. The omitted reference period is k = −1. Solid lines denote point estimates; shaded bands denote 95% confidence intervals constructed from standard errors clustered at the province level. The absence of statistically significant coefficients in the pre-event window (k < 0) indicates no differential pre-trends. The post-event trajectory (k ≥ 0) illustrates how borrowing responses emerge after the shock and dissipate over time.
5. Empirical Findings
5.1. Geographic Spillovers
This section presents our main empirical findings on geographic spillovers from natural disasters in Indonesia’s digital lending market. We demonstrate that disasters create economically significant spillover effects in neighboring provinces, with effects varying substantially by geographic connectivity and dissipating over time and distance. Our spatial econometric analysis reveals clear evidence of geographic spillovers in digital credit markets. Table 2 reports results from three model specifications: a baseline non-spatial model, a spatial lag model that incorporates disaster exposure in neighboring provinces, and a connectivity-based model that distinguishes between land and sea adjacency. The baseline specification shows that local disaster exposure significantly increases borrowing activity within affected provinces, with an estimated elasticity of 0.173. This direct effect serves as the benchmark for assessing the magnitude of spillovers. When the spatial lag term is introduced, disaster occurrences in neighboring provinces also exert a positive and statistically significant influence on local borrowing. The estimated coefficient of 0.036 (p < 0.01) suggests that a 1% increase in disaster frequency in adjacent provinces is associated with a 0.036% increase in local digital borrowing. Model fit improves substantially when spatial dependence is included, as indicated by an increase in the log-likelihood from −983.42 to −956.18 and a decrease in the AIC from 1970.84 to 1918.36. A likelihood ratio test strongly favors the spatial specification (LR = 54.48, p < 0.001), affirming that spatial spillovers are a systematic feature of digital credit responses to disaster shocks.
The magnitude of the spillover effect is economically meaningful. Relative to the direct effect, the indirect effect accounts for approximately 20.8% of the impact (0.036/0.173), indicating that, while the influence of neighboring disasters is smaller than local effects, it is still sufficiently large to shape lending conditions and policy considerations. A decomposition of spatial effects further highlights this point: the direct effect is 0.173, the indirect effect is 0.036, and the total effect is 0.209. Thus, the aggregate impact of disasters on borrowing exceeds the purely local effect by about 21%, demonstrating the importance of accounting for cross-provincial spillovers in analyses of disaster-induced financial behavior.
The connectivity-based specification provides additional insight into the mechanisms underlying these spillovers. Disasters transmit almost entirely through land-connected provinces; the coefficient for land adjacency is 0.036 (p < 0.01), whereas the coefficient for sea-connected provinces is small and statistically insignificant (0.005, p > 0.1). The implied land-to-sea spillover ratio of roughly 6.6 underscores the importance of physical connectivity and economic integration in facilitating spillover transmission. This asymmetry likely reflects stronger trade linkages, labor mobility, supply chain dependencies, and institutional similarities among land-adjacent provinces, compared to the relatively weaker interactions across sea boundaries. These findings suggest that spatial spillovers in digital credit markets are shaped not merely by geographic proximity, but by the depth and quality of interregional economic connections, with important implications for both theoretical modeling and the design of coordinated disaster response and financial resilience policies.
The spatial econometric results provide clear evidence of geographic spillovers, and additional analysis strengthens our confidence in these findings through robustness checks and alternative specifications.
As shown in Table 3, the estimated spatial spillover effects remain highly stable across alternative specifications, confirming the robustness of our core findings. When replacing the binary adjacency matrix with an inverse-distance weighting scheme, the indirect effect is 0.032, closely aligned with the baseline estimate of 0.036 in Column (1). Similarly, allowing for second-order spatial linkages in Column (3) yields an indirect effect of approximately 0.038, indicating that our results are not sensitive to the scope of spatial connectivity. The estimates also remain stable when excluding provinces experiencing the largest disaster shocks or when removing the most populous provinces from the sample, suggesting that outliers or region-specific idiosyncrasies do not drive the observed spillover effects.
Table 3.
Robustness Checks—Alternative Spatial Specifications.
Model diagnostics reported in Table 3 further support the validity of our spatial specification: Moran’s I for the residuals declines substantially from 0.287 in the non-spatial baseline to approximately 0.092–0.095 across the spatial models, indicating that spatial dependence is effectively captured rather than left in the residual structure. Moreover, the likelihood ratio tests consistently favor the spatial lag specifications (LR > 54, p < 0.001), providing strong statistical evidence that disaster-induced borrowing responses propagate across provincial boundaries rather than occurring in isolation.
To further validate the causal interpretation of the spillover effects, we implement an event-study design focusing on large, isolated disaster events. This approach allows us to trace the dynamic evolution of borrowing behavior and test for pre-existing trends. We estimate a dynamic difference-in-differences specification where the treatment is defined as being adjacent to a province experiencing a disaster in the top decile of intensity. The coefficients for the months leading up to the event are statistically indistinguishable from zero. This lack of pre-trends supports the assumption that the observed spillovers are responses to the shock rather than continuations of prior regional patterns. Following the event, we observe an immediate increase in borrowing in neighboring provinces that persists for two months before decaying. This temporal pattern aligns with the liquidity needs associated with precautionary preparation and short-term economic disruption.
Nonlinearity and Intensity Tests. The baseline estimates summarize average spillover effects. To assess whether spillovers vary with the intensity of neighboring shocks and whether local and neighboring exposure interact, we estimate two sets of extensions. First, we allow the spillover slope to differ during high-intensity neighbor exposure by estimating:
where HighNeighbori,t is an idicator equal to 1 when W·Disasteri,t lies above the 75th percentile of the sample distribution. The interaction coefficient φ tests whether spillovers intensify when neighboring exposure is unusually large. Second, we allow for complementarity between local and neighboring disasters by estimating:
ln(LoanAmti,t) = α i + γ t + β·Disaster i,t + θ·W·Disasteri,t + φ·(W·Disasteri,t × HighNeighbori,t) + δ X’i,t + εi,t
ln(LoanAmti,t) = αi + γt + β·Disasteri,t + θ·W·Disasteri,t + λ·(Disasteri,t × W·Disasteri,t) + δ X’i,t + εi,t
A positive and significant λ would indicate that local exposure amplifies spillovers from neighboring shocks, while a negative λ would suggest substitution in borrowing behavior. Full estimates are reported in Appendix A Table A5.
5.2. Regional Heterogeneity
Spillover effects vary systematically with regional characteristics, illuminating underlying mechanisms. As shown in Table 4, in areas with low traditional banking access, the indirect effect reaches 0.045 compared to 0.025 in high-access areas. Similarly, regions with high mobile payment penetration exhibit larger spillovers (0.042) than those with low penetration (0.030).
Table 4.
Spillover Effects by Regional Characteristics (Dependent variable: ln(Regional Monthly Loan Amount); entry = indirect (spillover) effect θ on neighboring disasters).
These patterns suggest that spillovers are particularly pronounced when digital lending serves as a primary source of credit access and when technological infrastructure enables rapid responses to external shocks. The heterogeneity analysis supports the interpretation that spillovers reflect both demand-side behavioral responses and supply-side algorithmic adjustments.
5.3. Borrower-Level Patterns
Borrower-level heterogeneity provides additional, albeit indirect, evidence on how disaster exposure translates into borrowing responses. As reported in Table 5, the spillover-related increase in individual monthly borrowing is more pronounced among male borrowers and those with higher incomes. In contrast, the interaction for new borrowers (New Loanee) is negative and statistically significant. This pattern suggests that spillover responses are concentrated among individuals who likely face fewer frictions in accessing digital credit (e.g., established credit histories or higher adequate borrowing capacity). Consistent with a precautionary framing, such borrowers may be better positioned to use short-term credit as a liquidity buffer when nearby shocks raise perceived downside risk. At the same time, the weaker response among new borrowers cautions against interpreting the spillover purely as broad-based entry into borrowing; it may instead reflect intensification among existing users or groups with greater borrowing capacity.
Table 5.
Borrower-Level Response Patterns (Interaction Effects on ln(Individual Monthly Loan)).
We also examine platform-side adjustments to credit supply, focusing on observable changes in approval rates and credit limits. While the evidence points to relatively modest average adjustments, our main outcome is realized loan volume, which reflects an equilibrium response and can mask offsetting movements in demand and supply (e.g., increased applications alongside tighter acceptance or lower offered limits).
We therefore interpret the borrower-level patterns as consistent with a vital demand component in spillover provinces, while acknowledging that a sharper decomposition would require richer “funnel” measures, applications, acceptance probabilities, and offered terms conditional on borrower risk—so that demand-driven precautionary behavior can be more cleanly separated from algorithmic repricing.
5.4. Implications for Spillover Mechanisms
Taken together, the spatial concentration of effects, heterogeneity by connectivity, and borrower-level response patterns are more consistent with short-run precautionary demand spillovers than with broad, persistent regional shocks. However, because we do not observe the platform’s internal decision rules or rejected applications, the evidence cannot conclusively separate demand shifts from supply-side repricing. We therefore interpret the mechanism results as suggestive and emphasize the reduced-form spillover magnitudes as the primary contribution.
The more pronounced spillover effects among land-connected provinces are consistent with stronger channels of information transmission (e.g., interpersonal networks and media diffusion) and more integrated economic linkages that heighten concerns about indirect or downstream disruptions. However, land connectivity may also correlate with other unobserved island-level conditions (e.g., common exposure to the same weather system, synchronized regional business cycles, or shared logistics networks). We therefore view the land–sea asymmetry as informative about the role of physical and economic connectivity, but not as a definitive test that rules out all correlated-shock explanations.
Our results indicate that the financial consequences of natural disasters extend beyond directly impacted regions. In our baseline estimates, the indirect (neighboring-province) effect is economically meaningful relative to the direct effect, implying that measured disaster impacts on digital credit markets are materially larger when spillovers are accounted for. This magnitude should be interpreted as the incremental propagation captured by neighboring disaster exposure, conditional on the fixed effects structure and spatial connectivity assumptions in the model, rather than as a structural multiplier that fully nets out all regional confounding.
For digital lending platforms, these findings suggest that incorporating spatial signals of disaster exposure and connectivity may improve monitoring and risk management, especially in settings where borrowing responses appear to propagate through geographically contiguous areas. More broadly, the systematic spatial pattern underscores the potential value of geography-aware stress testing and portfolio analytics, while leaving open whether the dominant driver is precautionary demand, correlated economic disruptions, or platform-side adjustments.
From a regulatory perspective, the evidence is consistent with the view that disaster-related financial stabilization measures may be more effective when they consider adjacent (particularly land-connected) regions rather than only the directly hit province. That said, because our data primarily capture realized loan volumes, and because we do not fully observe the entire lending “funnel” (applications, approvals, offered terms, and limits conditional on borrower risk), stronger separation of demand from supply remains an important direction for future work.
6. Policy and Managerial Implications
Our empirical findings reveal systematic geographic spillovers in digital credit markets, with important implications for both regulatory policy and platform risk management. The documented 20.6% spillover ratio and stark differences between land and sea connectivity create actionable insights for designing targeted interventions in disaster-prone financial systems.
Unified magnitudes and ratios. Throughout the paper, we interpret elasticities consistently: β ≈ 0.173 (local direct effect), θ ≈ 0.036 (neighbor spillover), β + θ ≈ 0.209 (combined effect). Land-connected spillovers dominate sea-connected ones by ≈6.6×. Policy designs that extend financial relief or forbearance beyond the epicenter to land-adjacent provinces are therefore quantitatively justified.
Our findings offer specific guidance for three key stakeholders: financial regulators, digital lending platforms, and institutional investors.
6.1. Implications for Financial Regulators
Regulators such as the OJK should move beyond epicenter-based interventions. The current framework typically activates relief measures only within the administrative boundaries of disaster-affected provinces. Our results justify expanding these measures to include land-adjacent regions. Specifically, regulators can establish automatic triggers where a disaster of a certain magnitude activates liquidity support or temporary forbearance in contiguous provinces. This coordinated regional approach prevents the transmission of financial stress through established economic corridors.
6.2. Strategies for Platform Risk Management
For FinTech platforms, the primary implication is the integration of spatial connectivity into algorithmic risk models. Risk managers should recalibrate credit scoring systems to account for “neighbor risk.” The significant difference between land and sea spillovers suggests that weightings in these models must be topology-dependent. Platforms can effectively hedge risk by tightening credit limits or increasing monitoring frequency in land-adjacent provinces immediately following a shock, while maintaining standard operations in sea-connected regions.
6.3. Guidance for Investors
Institutional investors financing these lending portfolios can use these findings to improve stress testing. Standard stress tests often assume shocks are contained within a single jurisdiction. Investors should update their models to include correlation parameters based on the 0.036 spillover elasticity we identify. This allows for a more accurate valuation of portfolios with concentrated exposure in geographically clustered provinces.
7. Conclusions
This study provides the first systematic evidence of geographic spillovers in digital credit markets using spatial econometric methods and high-frequency transaction data. Our analysis of Indonesia’s FinTech lending market reveals that natural disasters create measurable spillover effects in neighboring provinces that experience no direct physical damage, with spillover magnitudes reaching approximately 20% of direct effects.
Three main findings emerge from our spatial econometric analysis. First, disasters generate statistically significant and economically meaningful spillover effects in neighboring provinces, with a 1% increase in disaster frequency in neighboring provinces associated with a 0.036% increase in local borrowing volume. This spillover effect accounts for approximately one-fifth of the magnitude of direct disaster effects, indicating substantial but bounded geographic risk transmission. Second, spillover effects exhibit firm heterogeneity across geographic regions. Land-connected provinces experience spillover effects that are 6.6 times larger than those transmitted through sea connections, with land-based spillovers being statistically significant while maritime spillovers are not. This finding highlights the continued importance of physical geography in shaping financial market interdependence despite technological advances in service delivery. Third, the spatial patterns of spillover effects are consistent with precautionary borrowing behavior rather than algorithmic supply restrictions. The combination of increased borrowing volume with only modest supply-side adjustments suggests that spillovers primarily reflect demand responses by borrowers in adjacent provinces who observe nearby disasters and temporarily increase credit usage for consumption smoothing and risk management.
Our findings contribute to several studies in finance and economics. We extend the spatial finance literature by demonstrating that algorithmic lending platforms can transmit financial shocks across geographic boundaries through new channels that operate independently of traditional relationship banking networks. The documented spillover effects suggest that digital finance may create different patterns of spatial financial interdependence compared to conventional banking systems. The study also contributes to disaster economics research by providing the first evidence of short-term behavioral spillovers in credit markets using high-frequency data. Previous work has focused primarily on direct impacts within disaster-affected areas or long-term spillovers through housing markets and economic expectations. Our evidence of rapid, temporary spillovers through digital credit channels reveals new dimensions of how disasters affect regional economies. From a methodological perspective, we demonstrate the value of spatial econometric approaches for studying financial market interdependence in high-frequency settings. The combination of spatial autoregressive models with administrative disaster data provides a robust framework for identifying causal spillover effects that could be applied to other contexts where geographic externalities are suspected.
The documented spillover effects have immediate relevance for policy design and risk management in disaster-prone economies. Regulatory authorities can use our quantitative estimates to calibrate the geographic scope and duration of emergency financial measures, moving beyond epicenter-focused policies toward regional approaches that account for spillover effects. Financial service providers, particularly digital lending platforms, can incorporate our findings into risk management frameworks that anticipate and manage spillover-driven changes in credit demand and risk. The clear patterns of distance decay and connectivity-based heterogeneity provide actionable guidance for dynamic risk adjustment systems. The broader implications extend to financial system design and regulation in an era of increasing climate risk and rapid technological change. Our findings suggest that regulatory frameworks need to be updated to account for new channels of geographic risk transmission created by digital financial services.
Several limitations suggest directions for future research. Our focus on a single country and lending platform, while providing detailed insights, raises questions about external validity that could be addressed through comparative studies across different institutional and geographic contexts. The relatively short time series limits our ability to examine long-term adaptation effects or changes in spillover patterns. Future research could extend our approach to examine spillovers in other financial markets and services, including savings, payments, and insurance. Cross-country comparative analysis could illuminate how institutional differences affect spillover patterns and policy effectiveness. Additional work on the mechanisms underlying spillovers could inform more targeted intervention strategies. The documented interaction between digital finance and geographic risk transmission suggests broader research agendas that examine how technological change affects the spatial patterns of economic activity and financial market integration. These questions become increasingly important as digital financial services continue to expand globally while climate change increases the frequency and intensity of disasters.
Natural disasters create “shock next door” effects in digital credit markets that extend well beyond the boundaries of direct physical damage. These spillover effects are economically significant, systematically patterned, and amenable to policy intervention. Recognizing and addressing geographic spillovers represents an important component of building resilient financial systems capable of supporting economic recovery and development in disaster-prone environments. The Indonesian experience documented in this study illustrates both the challenges and opportunities created by the intersection of digital finance and natural disaster risk. As other emerging economies develop digital financial systems while facing similar environmental risks, the lessons from Indonesia’s experience may prove increasingly valuable for designing effective policy responses and risk management strategies. Our findings suggest that the benefits of digital financial inclusion can be preserved and enhanced through policy frameworks that recognize the spatial dimensions of technological innovation in finance. By acknowledging that financial shocks can travel beyond their immediate origins, policymakers and practitioners can develop more effective approaches to maintaining financial stability while supporting economic resilience in an uncertain world.
Author Contributions
Conceptualization, J.S. and W.X.; methodology, W.X.; software, W.X.; validation, J.S., W.X., and D.K.C.L.; formal analysis, Y.W.; investigation, D.D.; resources, J.S.; data curation, W.X.; writing—original draft preparation, J.S.; writing—review and editing, W.X., D.D.; visualization, J.S.; supervision, W.X.; project administration, Y.W.; funding acquisition, J.S. All authors have read and agreed to the published version of the manuscript.
Funding
This research received no external funding.
Data Availability Statement
Restrictions apply to the availability of these data. Data were obtained from a third-party digital lending platform under a confidentiality agreement and are available with the permission of the lending platform
Conflicts of Interest
The authors declare no conflicts of interest.
Appendix A
Table A1.
Variable Definitions, Units, Transformations, and Sources.
Table A2.
Robustness to Stricter Fixed Effects and Regional Shocks.
Table A3.
Descriptive Statistics: Main Analysis Variables.
Table A4.
Event-study estimates.
The results confirm that borrowing increases significantly in the months immediately following a shock but shows no significant pre-trends.
Table A5.
Nonlinearity and Interaction Tests.
Note
| 1 | “OJK” stands for Otoritas Jasa Keuangan, which is the Financial Services Authority of Indonesia. |
References
- Ahmed, S., McIntosh, C., & Sarris, A. (2020). The impact of commercial rainfall index insurance: Experimental evidence from Ethiopia. American Journal of Agricultural Economics, 102(4), 1154–1176. [Google Scholar] [CrossRef] [Scilit]
- Allen, F., & Gale, D. (2000). Financial contagion. Journal of Political Economy, 108(1), 1–33. [Google Scholar] [CrossRef] [Scilit]
- Aydoğdu, B., Samad, H., Bai, S., Abboud, S., Gorantis, I., & Salah, A. A. (2025). Analyzing international airtime top-up transfers for migration and mobility. International Journal of Data Science and Analytics, 19, 319–336. [Google Scholar] [CrossRef] [Scilit] [PubMed]
- Bailey, M., Cao, R., Kuchler, T., Stroebel, J., & Wong, A. (2018). Social connectedness: Measurement, determinants, and effects. Journal of Economic Perspectives, 32(3), 259–280. [Google Scholar] [CrossRef] [Scilit]
- Balyuk, T., & Davydenko, S. A. (2024). Reintermediation in fintech: Evidence from online lending. Journal of Financial and Quantitative Analysis, 59(5), 1997–2037. [Google Scholar] [CrossRef] [Scilit]
- Berg, T., Burg, V., Gombović, A., & Puri, M. (2020). On the rise of fintechs: Credit scoring using digital footprints. Review of Financial Studies, 33(7), 2845–2897. [Google Scholar] [CrossRef] [Scilit]
- Blumenstock, J. E., Cadamuro, G., & On, R. (2015). Predicting poverty and wealth from mobile phone metadata. Science, 350(6264), 1073–1076. [Google Scholar] [CrossRef] [Scilit]
- Blumenstock, J. E., Eagle, N., & Fafchamps, M. (2016). Airtime transfers and mobile communications: Evidence in the aftermath of natural disasters. Journal of Development Economics, 120, 157–181. [Google Scholar] [CrossRef] [Scilit]
- Bogaard, H., Doerr, S., & Jonker, N. (2024). Literature review on financial technology and competition for banking services (Basel committee on banking supervision working paper no. 43). Bank for International Settlements. [Google Scholar]
- Brevoort, K. P., Holmes, J. A., & Wolken, J. D. (2010). Distance still matters: The information revolution in small business lending and the persistent role of location, 1993–2003 (Finance and Economics Discussion Series, 2010-08). Board of Governors of the Federal Reserve System. [Google Scholar]
- Callaway, B., & Sant’Anna, P. H. C. (2021). Difference-in-differences with multiple time periods. Journal of Econometrics, 225(2), 200–230. [Google Scholar] [CrossRef] [Scilit]
- Carroll, C. D. (1997). Buffer-stock saving and the life life-cycle/permanent permanent-income hypothesis. Quarterly Journal of Economics, 112(1), 1–55. [Google Scholar] [CrossRef] [Scilit]
- De Fiore, F., Gambacorta, L., & Manea, C. (2023). Big techs and the credit channel of monetary policy (BIS working paper no. 1088). Bank for International Settlements. [Google Scholar]
- De Roure, C., Pelizzon, L., & Thakor, A. V. (2022). P2P lenders versus banks: Cream skimming or bottom fishing? Review of Corporate Finance Studies, 11(2), 213–262. [Google Scholar] [CrossRef] [Scilit]
- Doerr, S., Frost, J., Gambacorta, L., & Shreeti, V. (2023). Big techs in finance (BIS working paper no. 1129). Bank for International Settlements. [Google Scholar]
- Elhorst, J. P. (2014). Spatial econometrics: From cross-sectional data to spatial panels. Springer. [Google Scholar]
- Frost, J., Gambacorta, L., Huang, Y., Shin, H. S., & Zbinden, P. (2019). BigTech and the changing structure of financial intermediation (BIS working paper no. 779). Bank for International Settlements. [Google Scholar]
- Giannetti, M., & Ongena, S. (2012). “Lending by example”: Direct and indirect effects of foreign banks in emerging markets. Journal of International Economics, 86(1), 167–180. [Google Scholar] [CrossRef] [Scilit]
- Goodman-Bacon, A. (2021). Difference-in-differences with variation in treatment timing. Journal of Econometrics, 225(2), 254–277. [Google Scholar] [CrossRef] [Scilit]
- Grindsted, T. S. (2021). Algorithmic finance: Algorithmic trading across speculative time-spaces. Annals of the American Association of Geographers, 112(5), 1390–1402. [Google Scholar] [CrossRef] [Scilit]
- Gross, D. B., & Souleles, N. S. (2002). Do liquidity constraints and interest rates matter for consumer behavior? Evidence from credit card data. Quarterly Journal of Economics, 117(1), 149–185. [Google Scholar] [CrossRef] [Scilit]
- Hau, H., Huang, Y., Shan, H., & Sheng, Z. (2019). How fintech enters China’s credit market. AEA Papers and Proceedings, 109, 60–64. [Google Scholar] [CrossRef] [Scilit]
- Huang, Y., Li, X., Qiu, H., & Yu, C. (2023). BigTech credit and monetary policy transmission: Micro-level evidence from China (BIS working paper no. 1084). Bank for International Settlements. [Google Scholar]
- Huang, Y., Lin, X., Qiu, H., & Yu, C. (2024). BigTech credit, small business, and monetary policy transmission (IWH discussion papers no. 18/2022 (rev.)). Halle Institute for Economic Research. [Google Scholar]
- Jagtiani, J., & Lemieux, C. (2018). Do fintech lenders penetrate areas that are underserved by traditional banks? Journal of Economics and Business, 100, 43–54. [Google Scholar] [CrossRef] [Scilit]
- Karlan, D. S., & Zinman, J. (2008). Credit elasticities in less-developed economies: Implications for microfinance. American Economic Review, 98(3), 1040–1068. [Google Scholar] [CrossRef] [Scilit]
- LeSage, J., & Pace, R. K. (2009). Introduction to spatial econometrics. Chapman and Hall; CRC. [Google Scholar]
- Naceur, S. B., Hadj Salem, J. B., & Trabelsi, N. (2023). Is fintech eating the banks’ lunch (IMF working paper no. 23/239). International Monetary Fund. [Google Scholar]
- Petersen, M. A., & Rajan, R. G. (2002). Does distance still matter. The information revolution in small business lending. Journal of Finance, 57(6), 2533–2570. [Google Scholar] [CrossRef] [Scilit]
- Philippon, T. (2016). The fintech opportunity (NBER working paper no. 22476). National Bureau of Economic Research. [Google Scholar]
- Sawada, Y., & Shimizutani, S. (2008). How do people cope with natural disasters. Evidence from the Great Hanshin Awaji (Kobe) earthquake in 1995. Journal of Money, Credit and Banking, 40(2–3), 463–488. [Google Scholar] [CrossRef] [Scilit]
- Sun, L., & Abraham, S. (2021). Estimating dynamic treatment effects in event studies. Journal of Econometrics, 225(2), 175–199. [Google Scholar] [CrossRef] [Scilit]
- Suri, T., & Jack, W. (2016). The long run poverty and gender impacts of mobile money. Science, 354(6317), 1288–1292. [Google Scholar] [CrossRef] [Scilit] [PubMed]

Disclaimer/Publisher’s Note: The statements, opinions and data contained in all publications are solely those of the individual author(s) and contributor(s) and not of MDPI and/or the editor(s). MDPI and/or the editor(s) disclaim responsibility for any injury to people or property resulting from any ideas, methods, instructions or products referred to in the content. |
© 2026 by the authors. Licensee MDPI, Basel, Switzerland. This article is an open access article distributed under the terms and conditions of the Creative Commons Attribution (CC BY) license.