


Abstract
Previous studies on healthy controls suggest the added value of thigh-based Electrocardiography (ECG), which collects data using sensors embedded in a toilet seat for unobtrusive signal acquisition. However, further evidence regarding its clinical feasibility is needed; with this work, we investigated three complementary aspects: signal quality, morphological correlation with standard ECG leads, and the system’s potential for heart rate variability (HRV) analysis in patients undergoing aortic valve replacement. This work was divided into two main phases. In the first, 32 healthy volunteers underwent simultaneous ECG recordings using both a standard 12-lead ECG system and the thigh-based system. Signal Quality Index (SQI) analysis revealed that 56.25% of the experimental signals were classified as excellent, and over 62.5% of recordings showed a strong correlation with Lead I of the clinical ECG. These findings extend the state of the art by further characterising the quality and relevance of the captured signals. In the second phase, two patients with severe aortic stenosis were monitored before and after surgical valve replacement. HRV metrics derived from the thigh-based ECG captured distinct autonomic responses: one patient showed significant postoperative improvement in global and parasympathetic modulation (increased SDNN, RMSSD, and Sample Entropy), while the other exhibited reduced variability and complexity, potentially indicating impaired autonomic recovery. These results highlight the feasibility of thigh-based ECG data acquisition for passive, longitudinal cardiac health monitoring in everyday environments and its applicability for pre- and postoperative autonomic assessment.
1. Introduction
Remote monitoring has become essential for reducing healthcare costs, improving patient care, and enabling continuous tracking of chronic diseases. Cardiovascular diseases (CVDs) remain the leading global cause of death, accounting for 17.9 million fatalities annually [1], with 3.9 million deaths in Europe alone [2]. Many CVDs—including coronary artery disease, heart failure, arrhythmias, and stroke—could benefit from early detection through continuous monitoring and ECG signal analysis [3].
Recent research explores novel ECG acquisition methods at the thighs, aiming to promote regular monitoring with minimal user intervention [4,5]. However, signals from this unconventional anatomical location require careful evaluation for clinical interpretability and diagnostic potential. Since specific cardiac pathologies manifest more clearly in particular leads, it is crucial to identify which standard ECG leads correlate most closely with thigh-based signals. Additionally, signal reliability must be quantified using established Signal Quality Index (SQI) metrics to ensure consistency across users and environments, and to detect noise, motion artefacts, or other distortions.
Finally, the system’s clinical utility can be assessed by monitoring autonomic nervous system function via heart rate variability (HRV) analysis in patients undergoing aortic valve replacement for severe aortic stenosis. HRV is a non-invasive marker of autonomic regulation and cardiovascular health, widely applied in cardiac rehabilitation to assess recovery, guide exercise intensity, and detect autonomic dysfunction during follow-up. Evaluating HRV before and after surgery with a toilet-seat ECG system provides insight into its ability to track physiological improvements, detect signs of delayed recovery, and support structured rehabilitation programs. By enabling passive, high-frequency measurements, this approach has the potential to reduce patient burden and enhance adherence—two major challenges in post-surgical and long-term rehabilitation.
Based on these considerations, this work addresses the following research questions: (1) Which standard ECG leads correlate most closely with thigh-based ECG signals, and how does this vary across cardiac pathologies? (2) How reliable are thigh-based ECG signals when evaluated using SQI metrics, particularly under conditions prone to noise and motion artefacts? (3) Can a toilet-seat ECG system effectively monitor HRV in aortic stenosis patients, and how do pre- and postoperative HRV patterns compare with standard clinical measurements?
This study contributes to the state of the art by (1) quantifying the correlation between thigh-based and standard ECG leads, (2) evaluating signal quality with established SQI metrics, and (3) exploring the clinical viability of this system for HRV analysis before and after valve replacement, with particular emphasis on its value for remote cardiac rehabilitation and postoperative recovery monitoring. The remainder of this paper is organised as follows. Section 2 reviews relevant background on wearable ECG systems and HRV. Section 3 describes the experimental setup for thigh-based ECG acquisition. Section 4 details the methods used to assess signal correlation and quality and presents the HRV analysis conducted on aortic stenosis patients before and after surgery. Finally, Section 5 summarises the main findings and outlines directions for future research.
2. Background
Our study stems from the convergence of two growing trends in biomedical engineering and digital health. First, this expansion reflects the broader movement toward unobtrusive and ubiquitous physiological monitoring. Second, sanitary facility environments have emerged as highly promising platforms for continuous health monitoring given their essential presence in daily routines and inherent potential for passive user engagement. In fact, Fadhil [6] reported that up to 11% of cardiac arrest episodes occur in bathrooms, reinforcing the importance of cardiovascular monitoring in these settings.
Toilet-integrated systems for ECG monitoring have gained increasing attention. Kim et al. [7] conducted a foundational study using capacitively coupled insulated copper and PTFE electrodes embedded in a toilet seat. Their results showed that R-peaks could be reliably detected, and they also examined how body grounding influenced HRV measurements. Despite this, capacitance-based acquisition remains limited in diagnostic reliability, particularly for comprehensive CVD evaluation.
Further developments came from Huang et al. [8], who designed a toilet-based system capable of acquiring multiple physiological parameters, including ECG, body weight, and bioimpedance. While their method enabled advanced health tracking, it still required external wearable electrodes for complete body impedance analysis, thus limiting its unobtrusiveness.
More recently, Conn et al. [5] introduced a multimodal cardiovascular monitoring system integrated into a toilet seat, incorporating ECG, Ballistocardiography (BCG), and Photoplethysmography (PPG) sensors. Their system successfully measured blood pressure, stroke volume, and oxygen saturation with clinical-grade accuracy. They relied on contact-based ECG acquisition using stainless steel electrodes placed on a flat surface, demonstrating that properly designed toilet-based sensing platforms can yield clinically actionable data.
Despite these promising advancements, signal quality remains a persistent challenge in non-conventional ECG systems. Most current toilet-integrated solutions lack real-time feedback mechanisms for assessing ECG integrity. Variability in skin contact, user posture, motion artefacts, and environmental noise can all compromise data reliability. Clifford et al. [9] and Tobón et al. [10] highlighted how such degradation impedes clinical interpretation and accurate feature extraction.
Recent studies have proposed algorithms for automated signal quality assessment to address these issues. Notably, Zhao et al. [11] introduced an autonomous SQI algorithm to identify usable ECG segments for diagnostic purposes. This approach enables the filtering of low-quality signals, facilitating real-time decision-making in wearable and passive monitoring systems. Compared with previous toilet-integrated ECG systems, the present approach offers the advantage of fully passive acquisition using dry electrodes positioned at the thighs, which reduces user burden and may facilitate repeated long-term monitoring in home environments. In contrast to capacitively coupled systems, contact-based acquisition may provide improved waveform fidelity, particularly for R-peak detection and HRV extraction. However, the method remains sensitive to posture, contact pressure, motion artefacts, and inter-subject variability, and it does not currently replace diagnostic multi-lead ECG for comprehensive clinical interpretation. Therefore, its strength lies primarily in unobtrusive longitudinal monitoring rather than full diagnostic substitution.
Thigh-based ECG acquisition offers a key advantage over conventional electrode-based systems by enabling fully unobtrusive and passive monitoring. Unlike standard ECG setups, which require skin preparation, gelled electrodes, and active user participation, the proposed approach allows signal acquisition during natural daily activities, such as toilet use, thereby reducing user burden and potentially improving long-term adherence. However, ECG signals acquired in such non-conventional environments are inherently more susceptible to motion artefacts, variable electrode contact, and environmental noise. For this reason, objective signal quality assessment becomes essential. Signal Quality Indices (SQIs) provide a quantitative framework to identify reliable segments and exclude corrupted data prior to clinical interpretation or feature extraction, and they have been widely adopted in ECG processing pipelines [11,12,13]. Table 1 summarises representative related work and highlights the main limitations of existing approaches with respect to the proposed system, emphasising the novelty and integrated nature of this study.
Table 1.
Comparison with representative related work, emphasising the novelty and scientific contribution of the proposed approach.
3. Experimental Procedures
A long-standing issue regarding thigh-based ECG has been the characterisation of signals obtained with this type of sensor compared to those obtained with clinical-grade stationary devices placed on the person, which are the gold standard. Importantly, the placement of the sensor on the thighs and the use of non-gelled electrodes alleviate significant pre-established constraints in gold standard methodologies [4,17]. Therefore, this comparison aims not to prove or demonstrate any physiological principles but to empirically analyse whether our signals correlate with one (or more) derivations of what is known as the gold standard, thus informing the potential use in real-world applications.
3.1. Data Acquisition
We carried out an experimental study involving two different groups. The first consisted of 32 volunteers (12 females) with an average age of years (ranging from 30 to 64 years), an average body weight of kg and an average height of cm with no diagnosed cardiac pathologies. In this group, simultaneous ECG recordings were obtained using a clinical-grade reference device—the GE HealthCare MAC 800 (hereafter ECG_REF)—and the thigh-based ECG acquisition system previously described in [4,17] (hereafter ECG_EXP). The ECG_REF device was configured for standard 12-lead acquisition (leads I, II, III, aVR, aVL, aVF, and V1–V6) using pre-gelled Ag/AgCl electrodes placed according to clinical guidelines. In parallel, participants were instructed to sit normally on a toilet seat instrumented with customised electrodes, ensuring consistent contact.
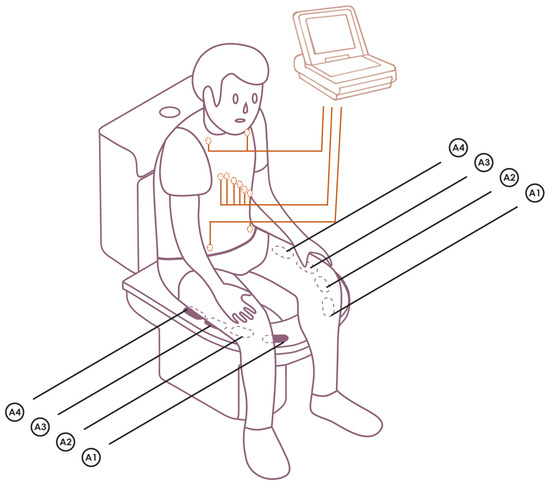
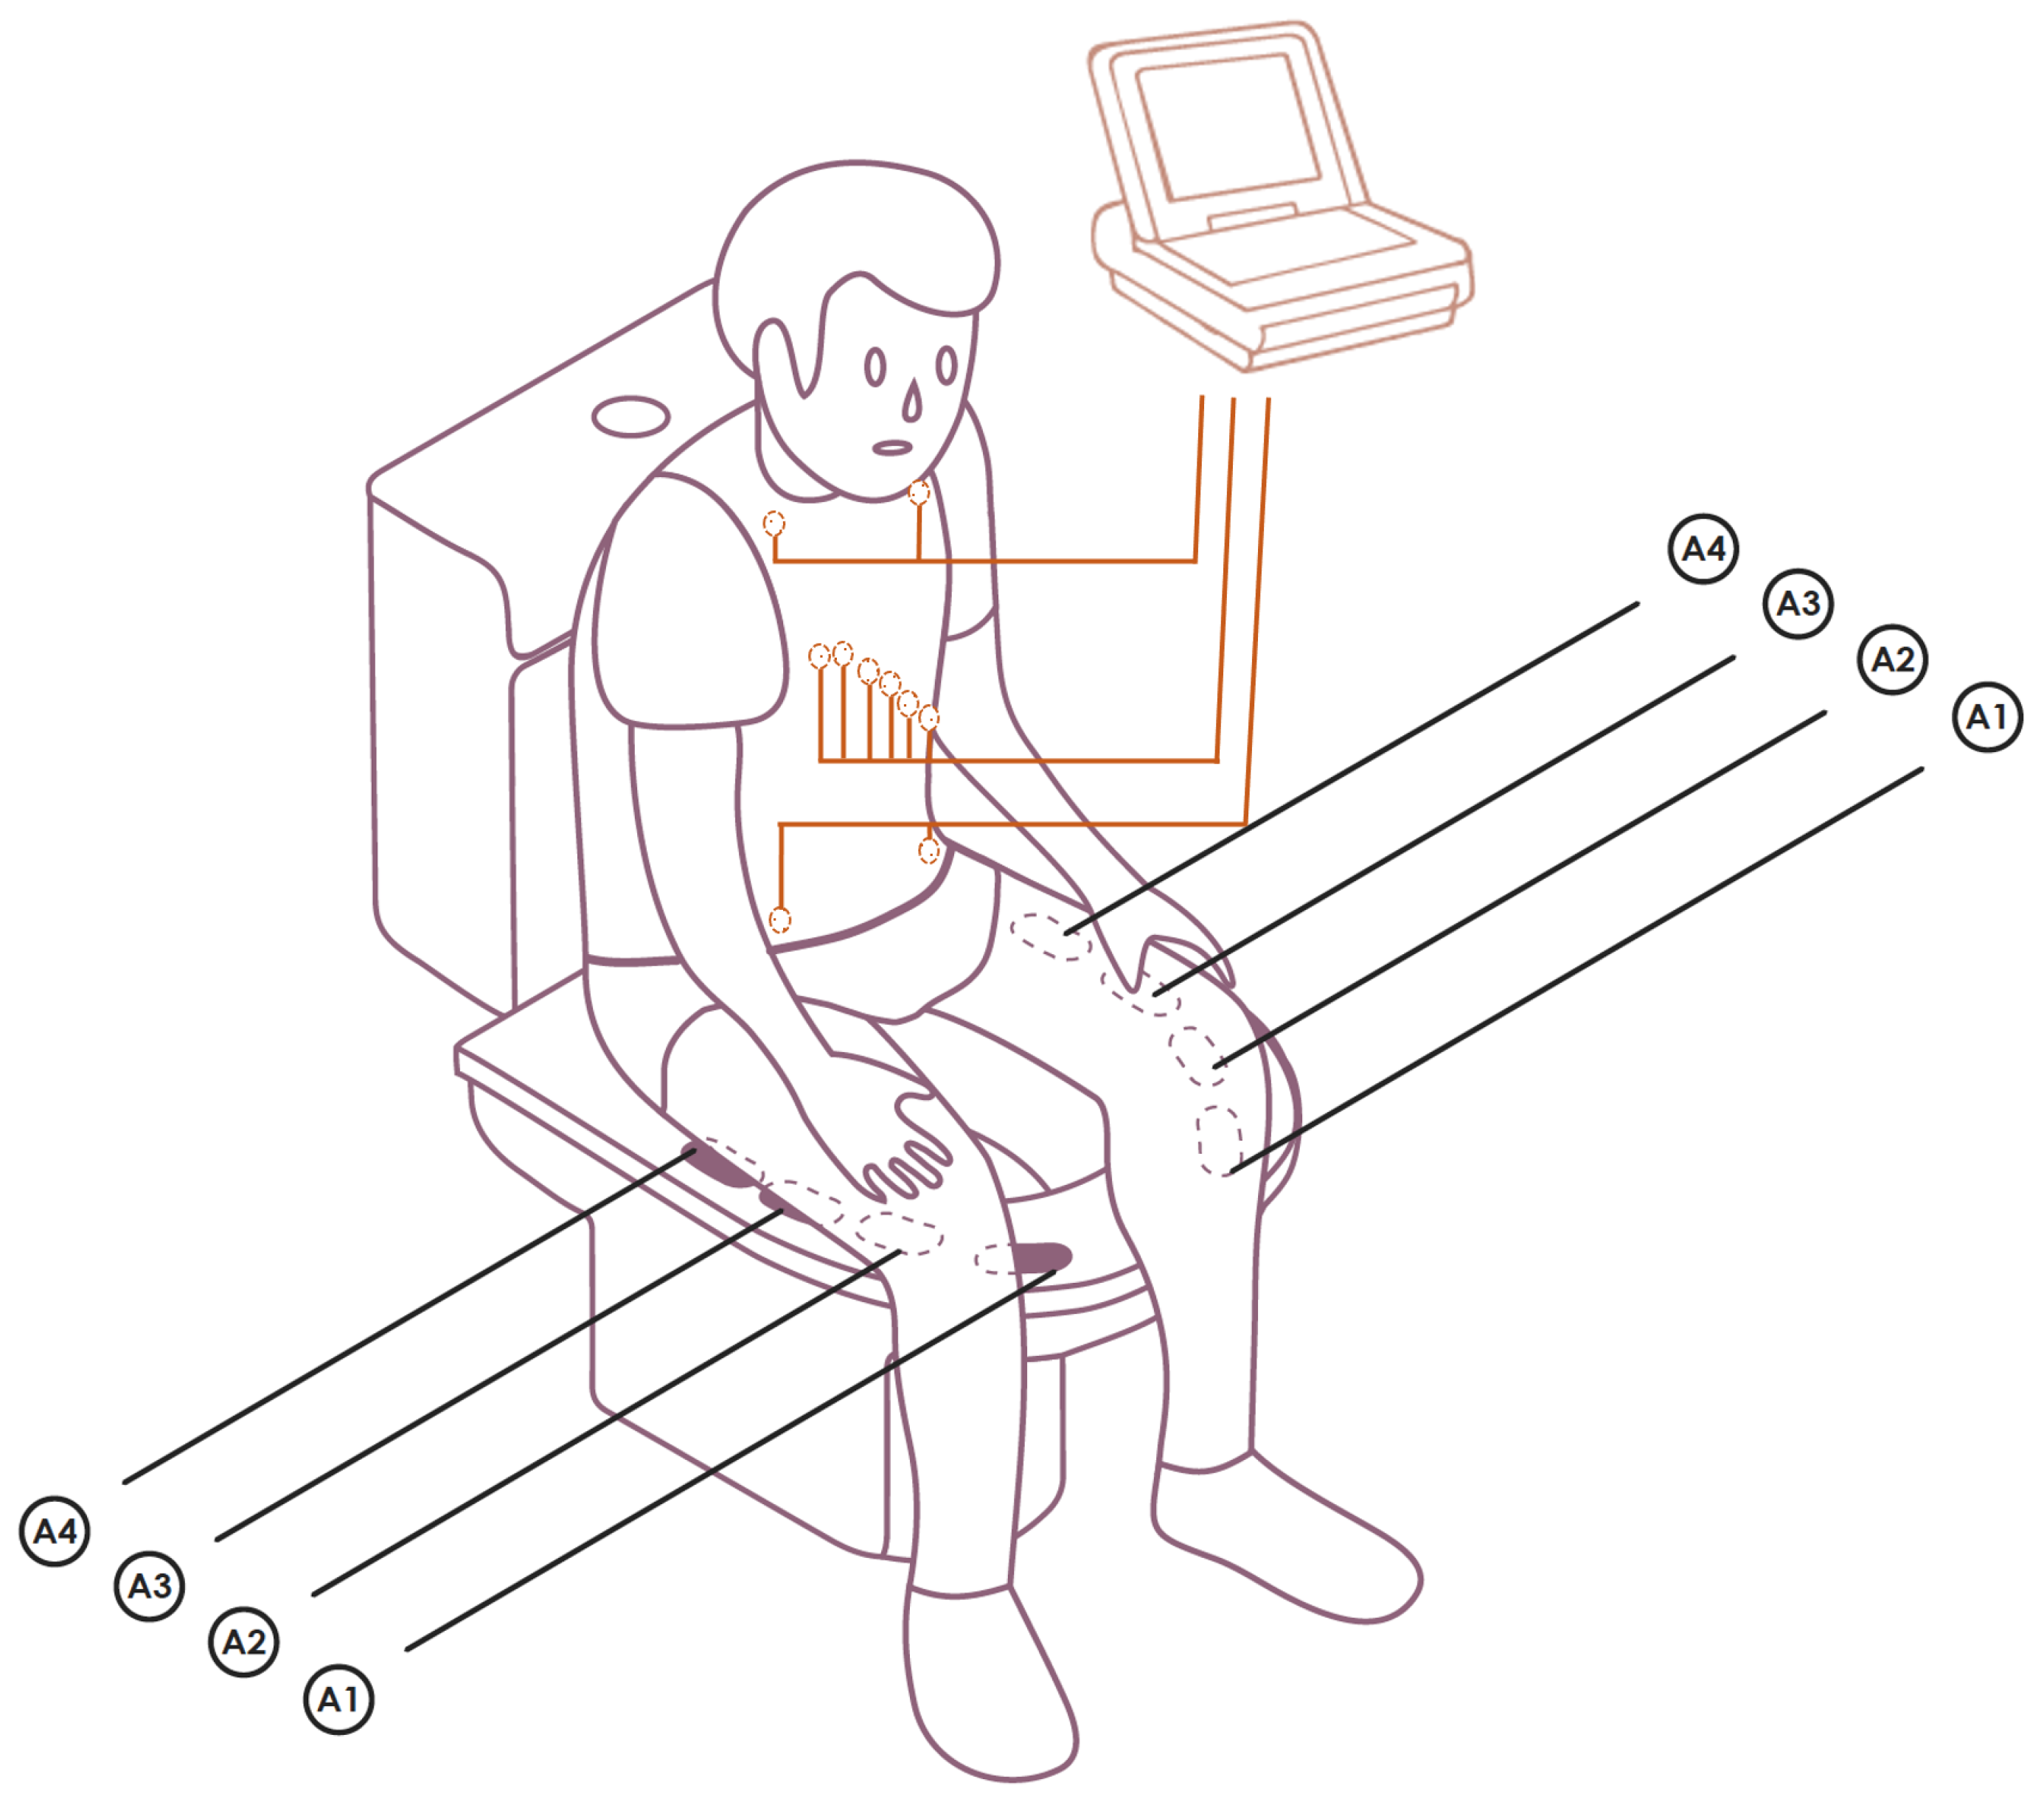
The second group consisted of two male patients diagnosed with severe aortic valve stenosis who underwent brief recordings (approximately 2 min) before and after surgical valve replacement. Each recording session lasted up to approximately 2 min, corresponding to the expected natural duration of toilet-seat use. Since the acquisition followed an opportunistic paradigm designed to emulate real-world use, the effective duration varied across participants. Recordings were retained for analysis, provided that they met the predefined quality criteria. In the final dataset, the mean recording duration was 70.35 ± 49.65 s. The system depicted in Figure 1 was therefore evaluated under realistic short-duration recording conditions.
Figure 1.
Experimental setup used in this work. A GE HealthCare MAC 800 12-lead ECG system (ECG_REF) is used alongside our thigh-based system with dry electrodes (ECG_EXP). Drawings are not to scale. Electrodes corresponding to the MAC 800 system are shown in orange, while the thigh-based dry electrodes are shown in black. A pair of ECG electrodes is positioned to contact the user’s thighs. Adapted from [4].
To ensure the reliability of ECG signals acquired from a non-conventional and noise-prone location, such as the thighs, an automated signal quality assessment procedure was applied before analysis. This procedure was adapted from our previously published processing pipeline [4] and from established methodologies for ECG signal quality evaluation [12,13]. Given that motion artefacts, poor electrode contact, and analogue-to-digital converter (ADC) clipping primarily affect high-amplitude ECG components, signal quality was assessed at the beat level, with particular emphasis on the QRS complex.
An overview of the experimental setup is provided in Figure 1. All procedures were carried out in accordance with the ethical principles described in the Declaration of Helsinki. The study protocol was reviewed and approved by the Ethics Committee of the Telecommunications Institute (IT) and the Ethics Committee of the Cardiorespiratory Ward of Hospital São João, Porto, Portugal, under approval number 315/23. The thigh-based ECG system operates as a single-lead acquisition system in the context of this study. Although the prototype includes four electrode pairs (A1–A4), these were originally implemented to evaluate different electrode materials and surface textures in a proof-of-concept study [4]. For each recording, the ECG signal selected for analysis corresponds to the electrode pair that exhibits the lowest level of saturation and best overall signal quality. This selection ensures that the most reliable signal is used while maintaining the unobtrusive nature of the system.
To reduce subject-specific bias, all participants were evaluated using the same hardware, identical electrode positioning on the toilet seat, and the same acquisition and preprocessing pipeline. No participant-specific tuning or manual adjustment of the sensing configuration was performed. Volunteers were simply instructed to sit in a natural and comfortable position, thus preserving the intended unobtrusive and real-world nature of the system. Furthermore, the cohort included both female and male participants with a broad age range and heterogeneous anthropometric characteristics, allowing assessment under diverse user conditions. This design aimed to evaluate the robustness of the method across users rather than optimise performance for any specific individual.
3.2. Data Processing for Non-Pathological Subjects
Preprocessing was performed to ensure fair comparison between ECG_EXP and ECG_REF and to reduce the influence of acquisition-related artefacts. First, ECG_EXP signals were downsampled from 1000 Hz to 500 Hz to match the sampling frequency of ECG_REF. Next, a third-order Butterworth band-pass filter (0.5–40 Hz) was applied using a zero-phase forward–backward filtering approach (filtfilt) to attenuate baseline wander, motion-related low-frequency components, and high-frequency noise while preserving the temporal characteristics of the signal. Because the two systems were acquired independently and no hardware synchronisation was available, temporal alignment was performed by maximising the cross-correlation between ECG_EXP and Lead I from ECG_REF after amplitude normalisation.
For beat-by-beat morphological analysis, segmented heartbeats were further screened for outliers. This step was necessary because occasional beats may be severely distorted by motion artefacts, transient loss of contact, or segmentation errors, leading to non-representative waveform templates and biased similarity estimates. Outlier rejection was performed using a QRS-based segmentation approach derived from the method of Engelse & Zeelenberg [18], which is widely used for robust heartbeat detection and has been shown to be effective in noisy ECG conditions. This allowed the morphological metrics to reflect the dominant and physiologically meaningful waveform patterns rather than isolated corrupted beats. This preprocessing pipeline was not intended to artificially improve the experimental signal but rather to ensure that comparisons between systems were performed on temporally aligned, bandwidth-consistent, and morphologically representative cardiac cycles.
Another central aspect we consider in our analysis is that two independent systems are acquiring data. The ECG_REF does not offer a direct synchronisation approach at the hardware level; to overcome this issue, in the postprocessing, we also performed the correlation of the RR interval sequence of both signals, first normalising the DC offset and the amplitude of the signals, according to Equation (1).
where represents the ECG signal sample at time index k, is the mean value of the signal, and the denominator corresponds to the dynamic range of the signal, defined by its maximum and minimum values.
We then align the signals between the corresponding time series of the ECG_EXP and the ECG_REF by calculating the time delay for which the cross-correlation between them is maximum (Equation (2)). Note that we use Lead I of the ECG_REF to determine the delay since, as we will demonstrate in the following sections, this lead best correlates with the data for this invisible device system.
where d represents the time delay between the two signals, and corresponds to the optimal delay that maximises the cross-correlation between and , thus providing temporal alignment between ECG_EXP and ECG_REF signals.
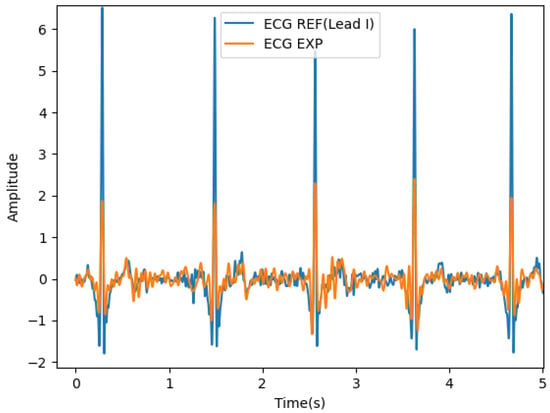
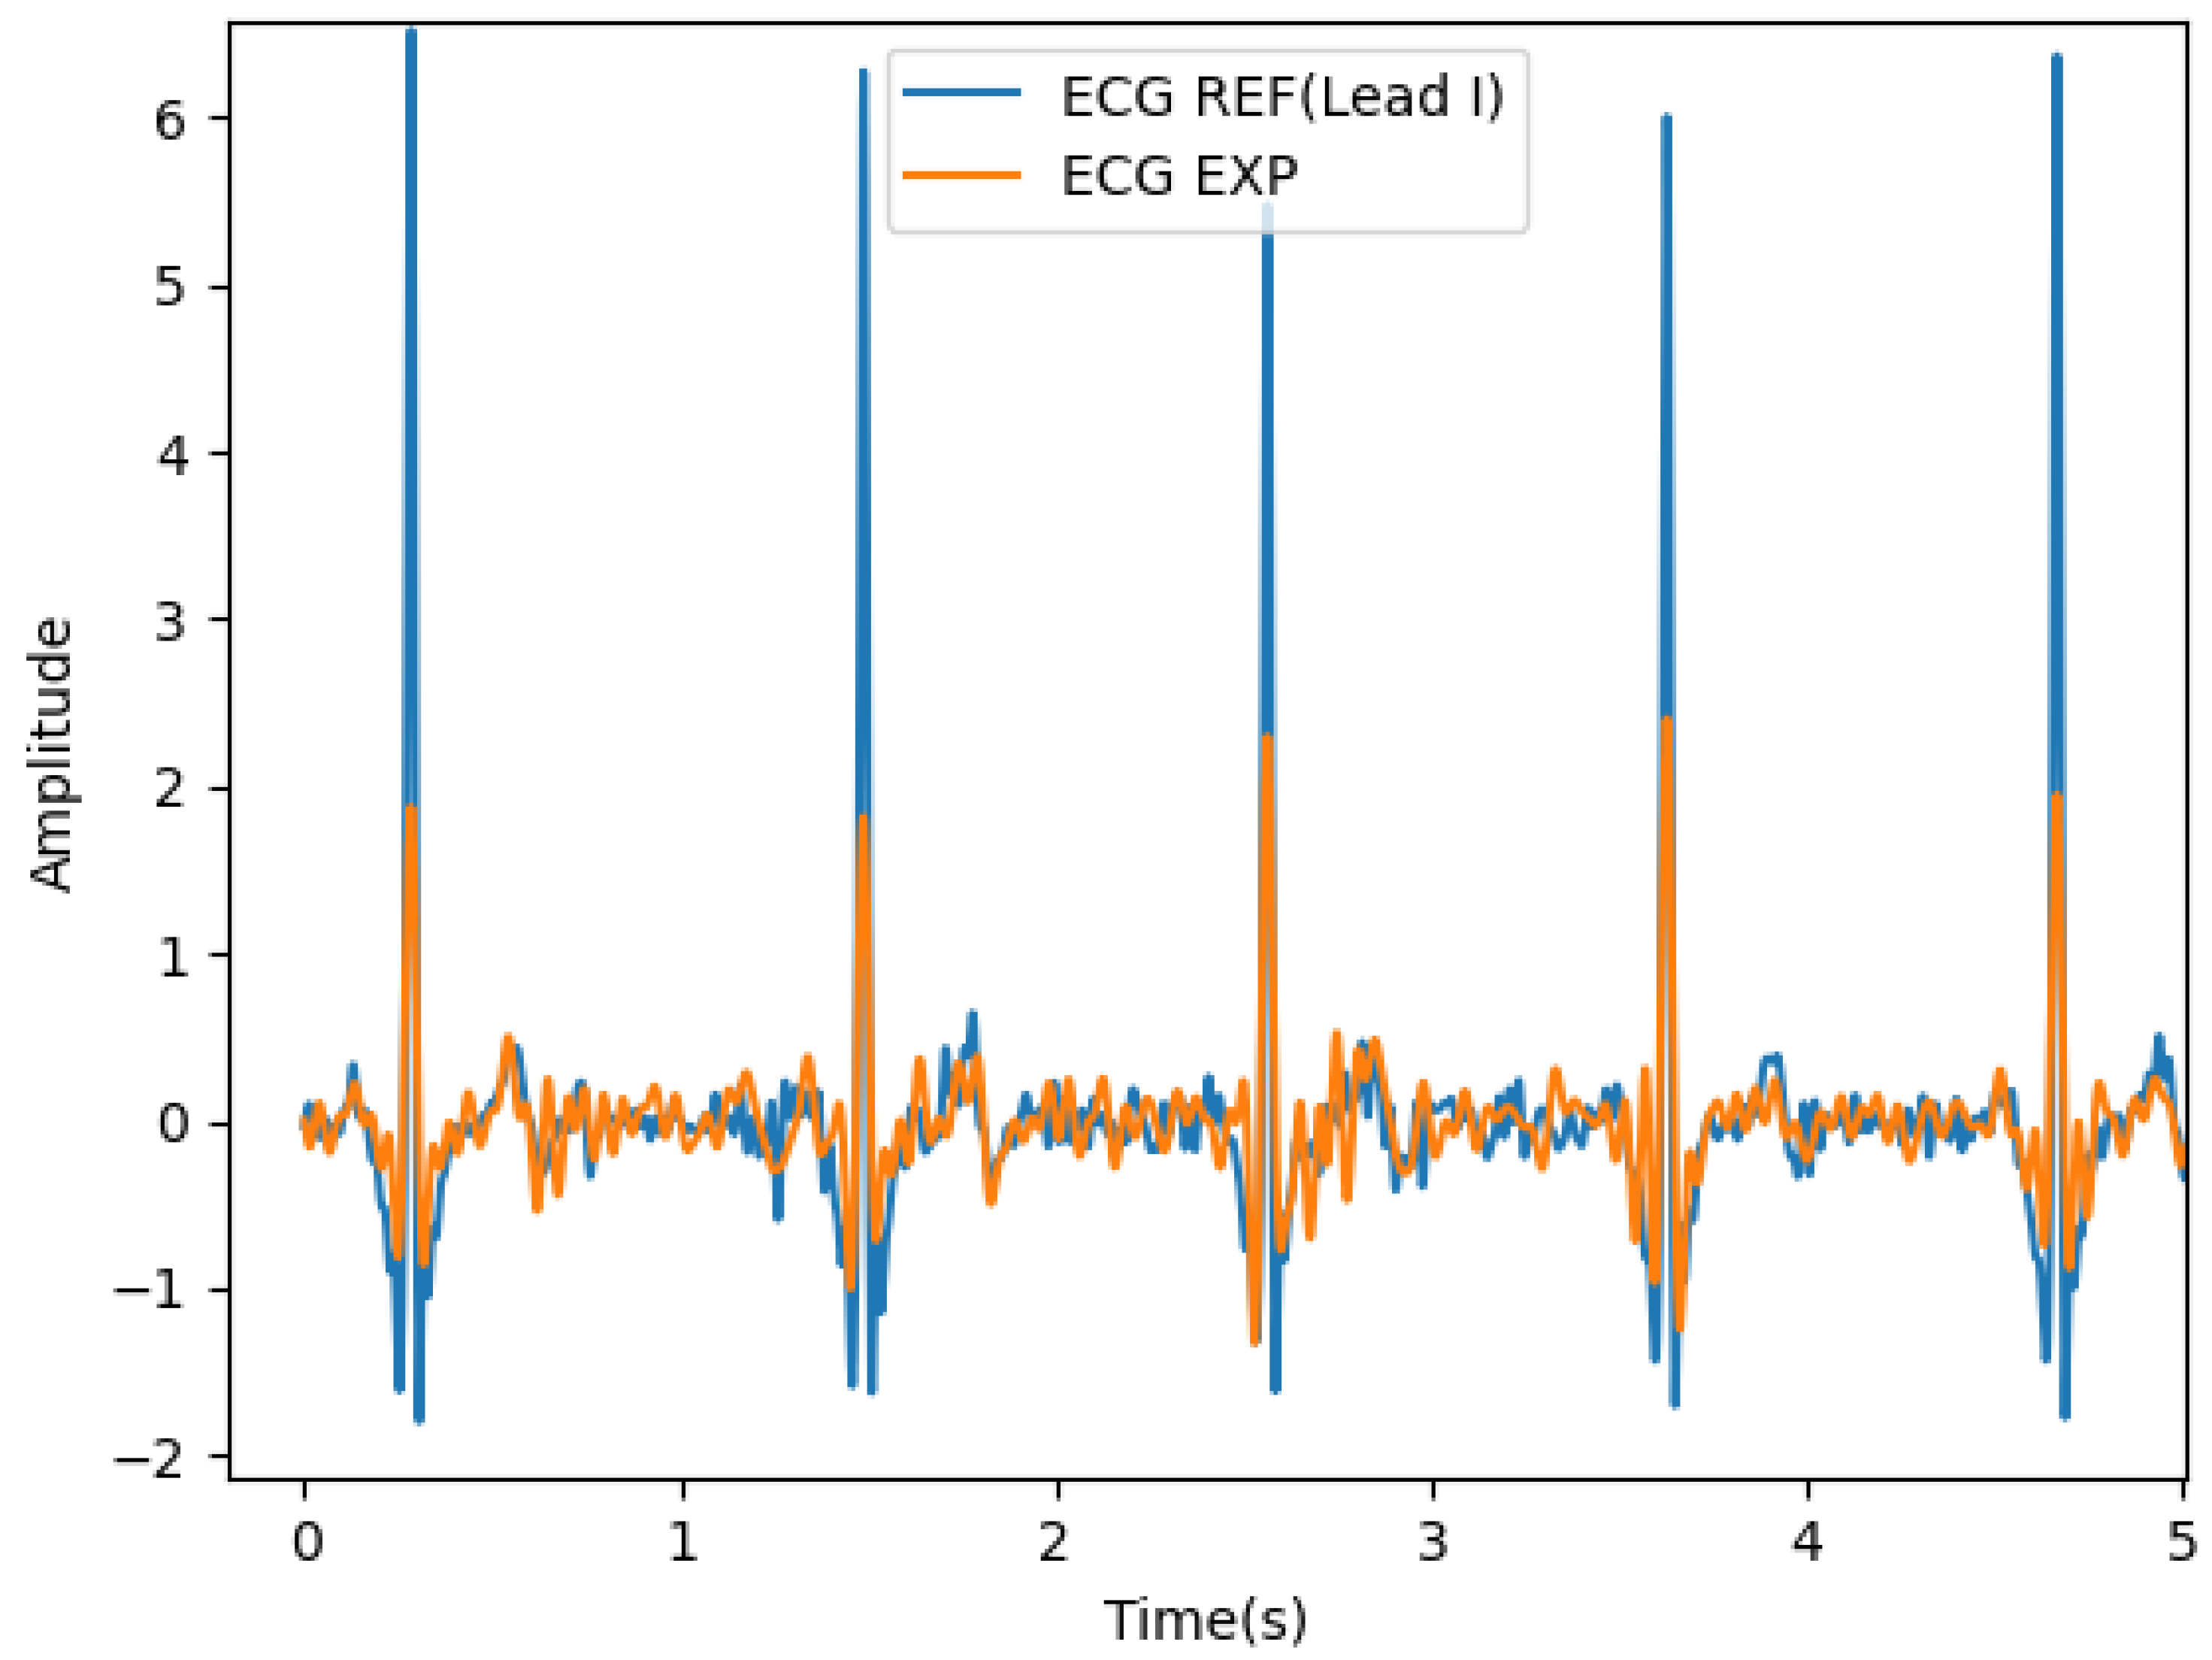
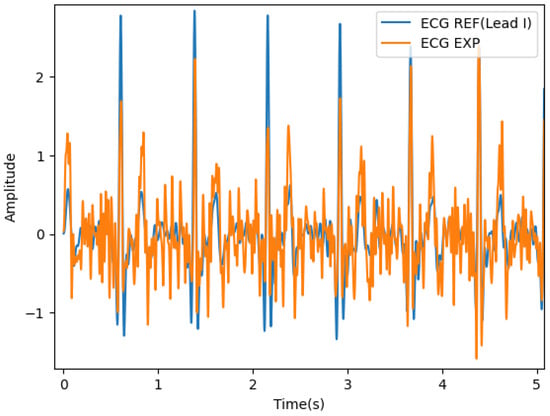
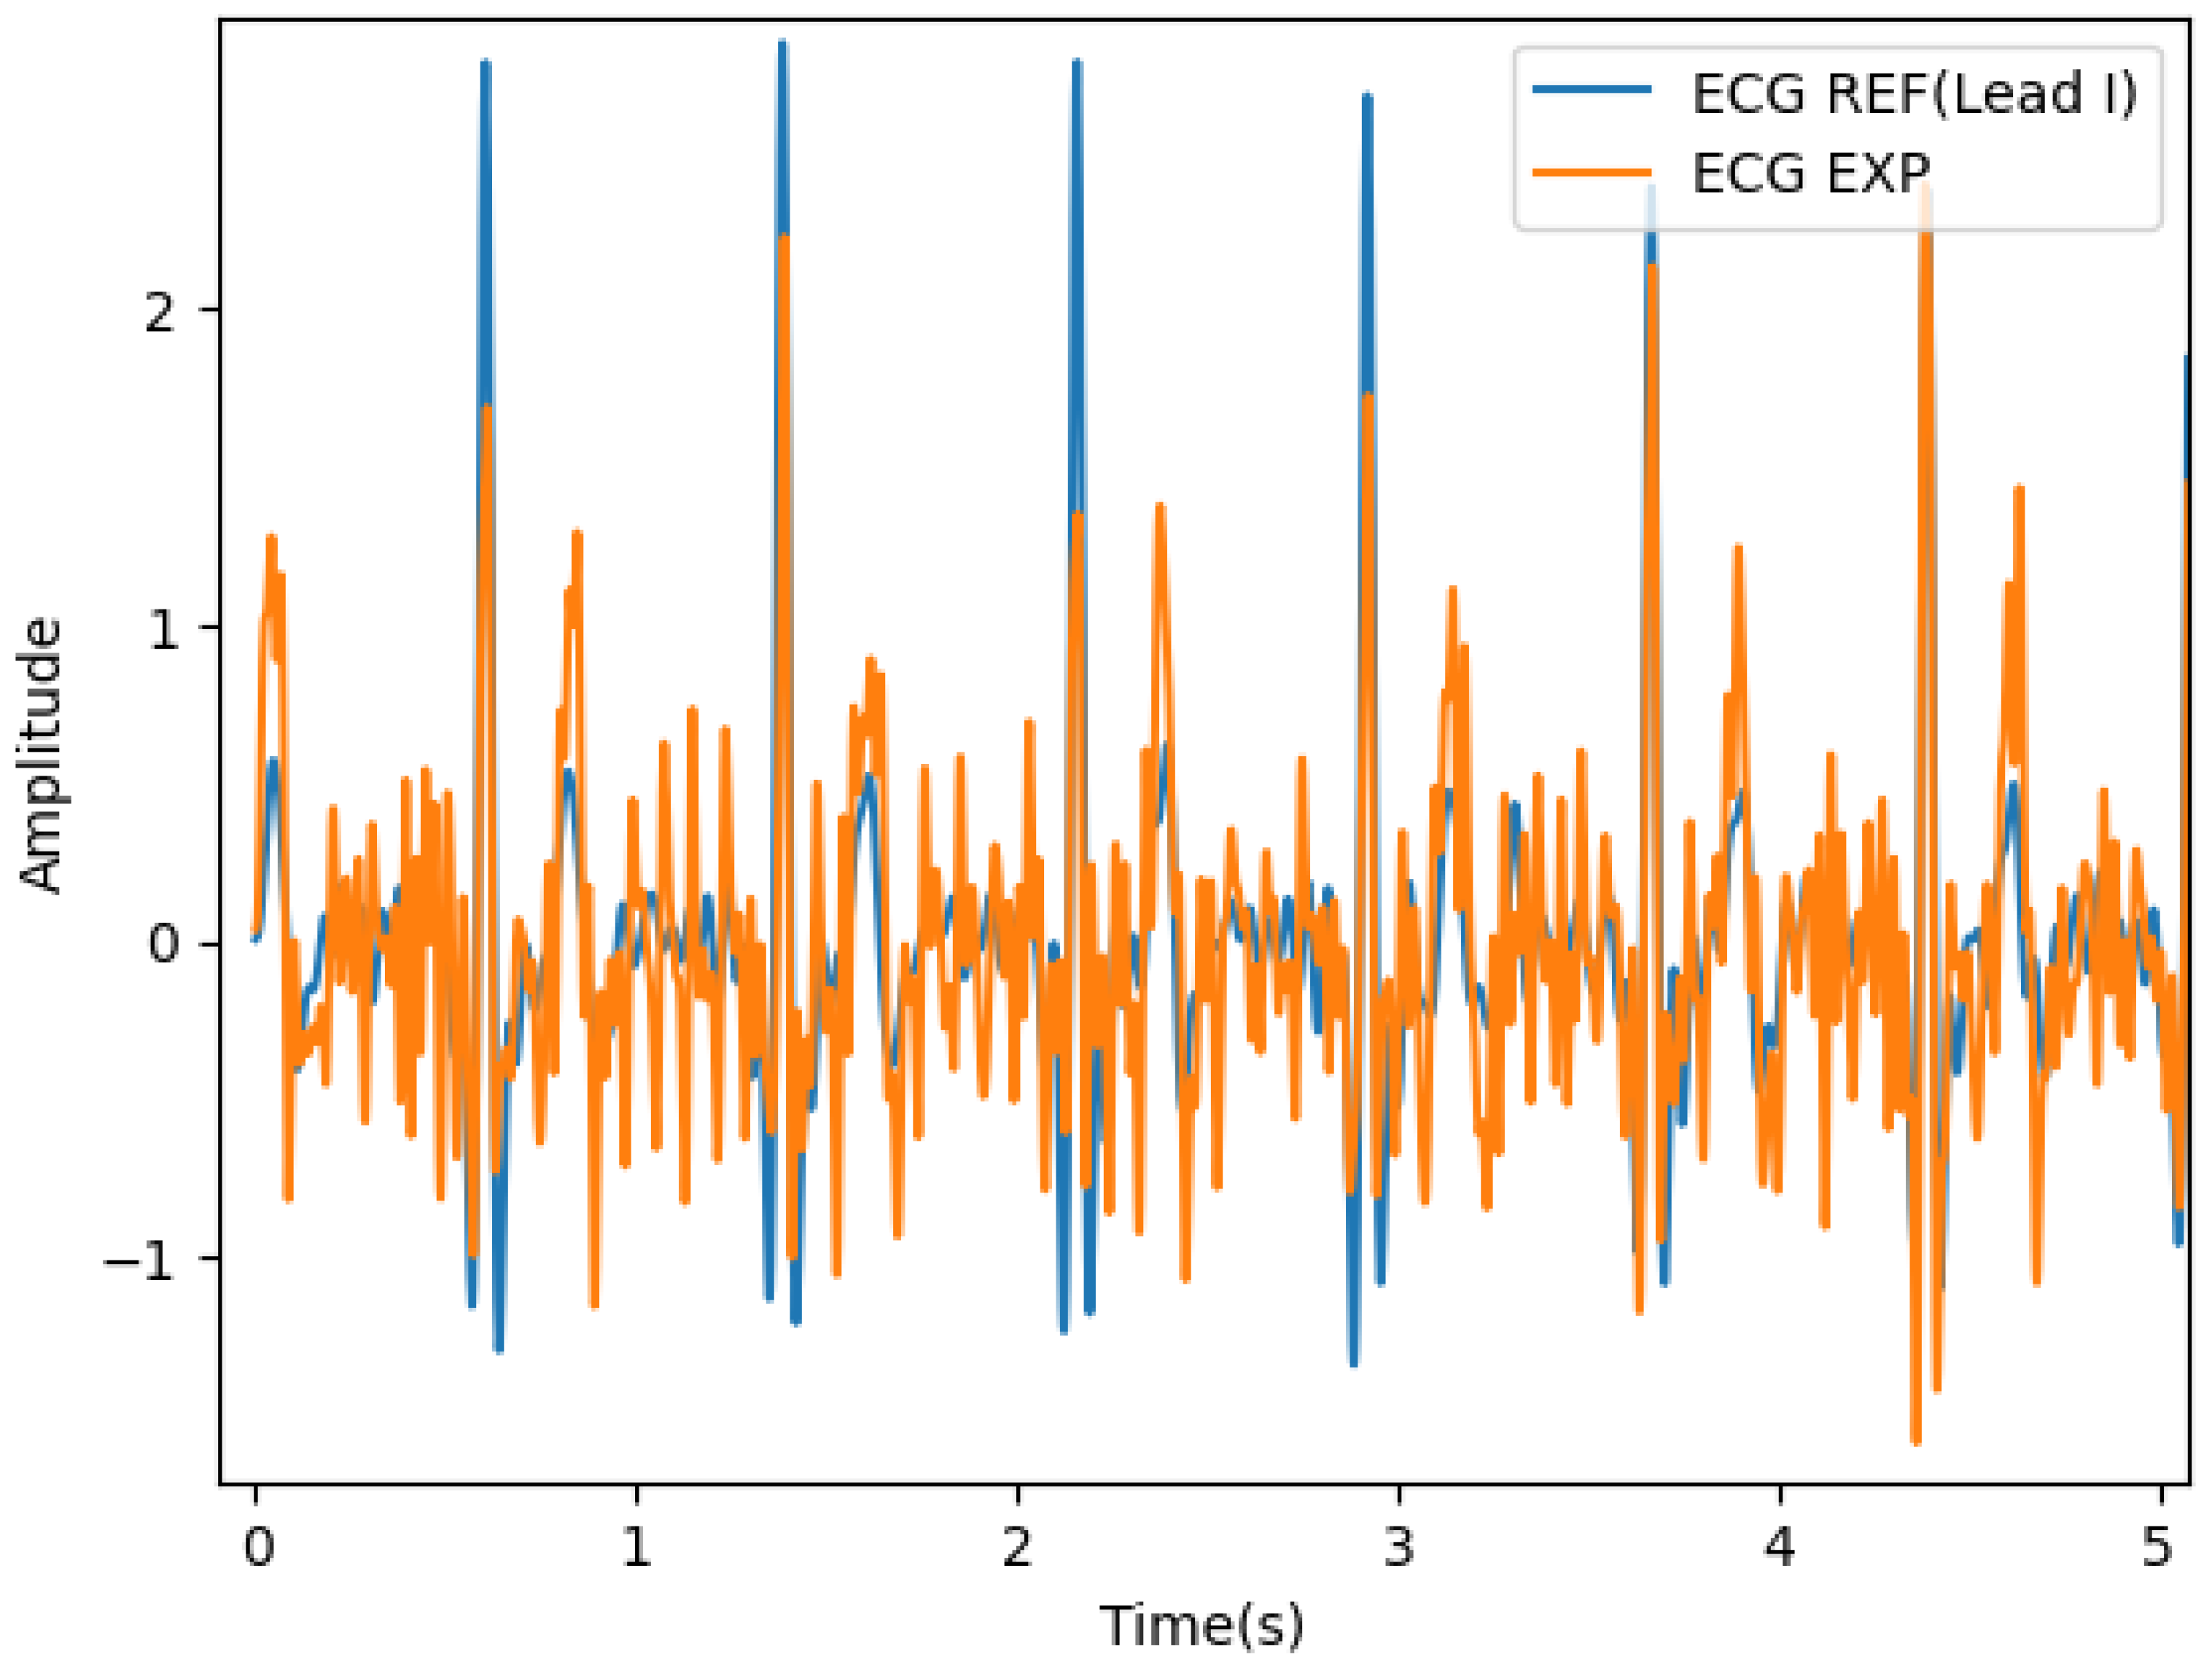
Figure 2 shows an example of the synchronised signals for one of the acquisition runs, where we can observe an almost exact temporal match between the two signals. Figure 3 shows an example of signals that manage to synchronise even with the presence of significant noise that prevails after signal processing.
Figure 2.
Synchronised ECG_EXP and ECG_REF for subject S2.
Figure 3.
ECG_EXP and ECG_REF synchronised for subject S11, with noise that prevails even after signal processing.
3.3. Data Processing for Pathological Subjects
The following time-domain HRV metrics were extracted: the MeanNN, which corresponds to the mean RR interval; SDNN, the standard deviation of RR intervals; RMSSD, the root mean square of successive differences between adjacent RR intervals; pNN50, representing the percentage of successive RR intervals differing by more than 50 ms; and the Stress Index (SI), estimated from the histogram of RR intervals.
R-peaks were detected using a Pan–Tompkins-based implementation adapted from the open-source framework. This procedure included signal differentiation, squaring, and moving-window averaging, with an integration window of (120 ms at 1000 Hz). To avoid initialisation artefacts, the first samples (200 ms) were excluded from peak detection. RR intervals were then obtained as the temporal difference between consecutive R-peaks, followed by removal of artefacts and physiologically implausible outliers (values below 300 ms or above 2000 ms).
In addition, nonlinear HRV metrics were considered, including Sample Entropy (SampEn) and Approximate Entropy (ApEn), which are indicators of signal irregularity and complexity [19,20], as well as Detrended Fluctuation Analysis (DFA-) [21].
SampEn and ApEn were computed to quantify signal complexity. Both metrics were calculated using an embedding dimension , delay , and tolerance of the RR interval series, following standard practices in HRV analysis.
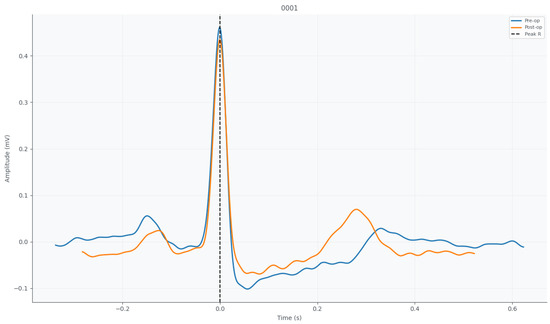
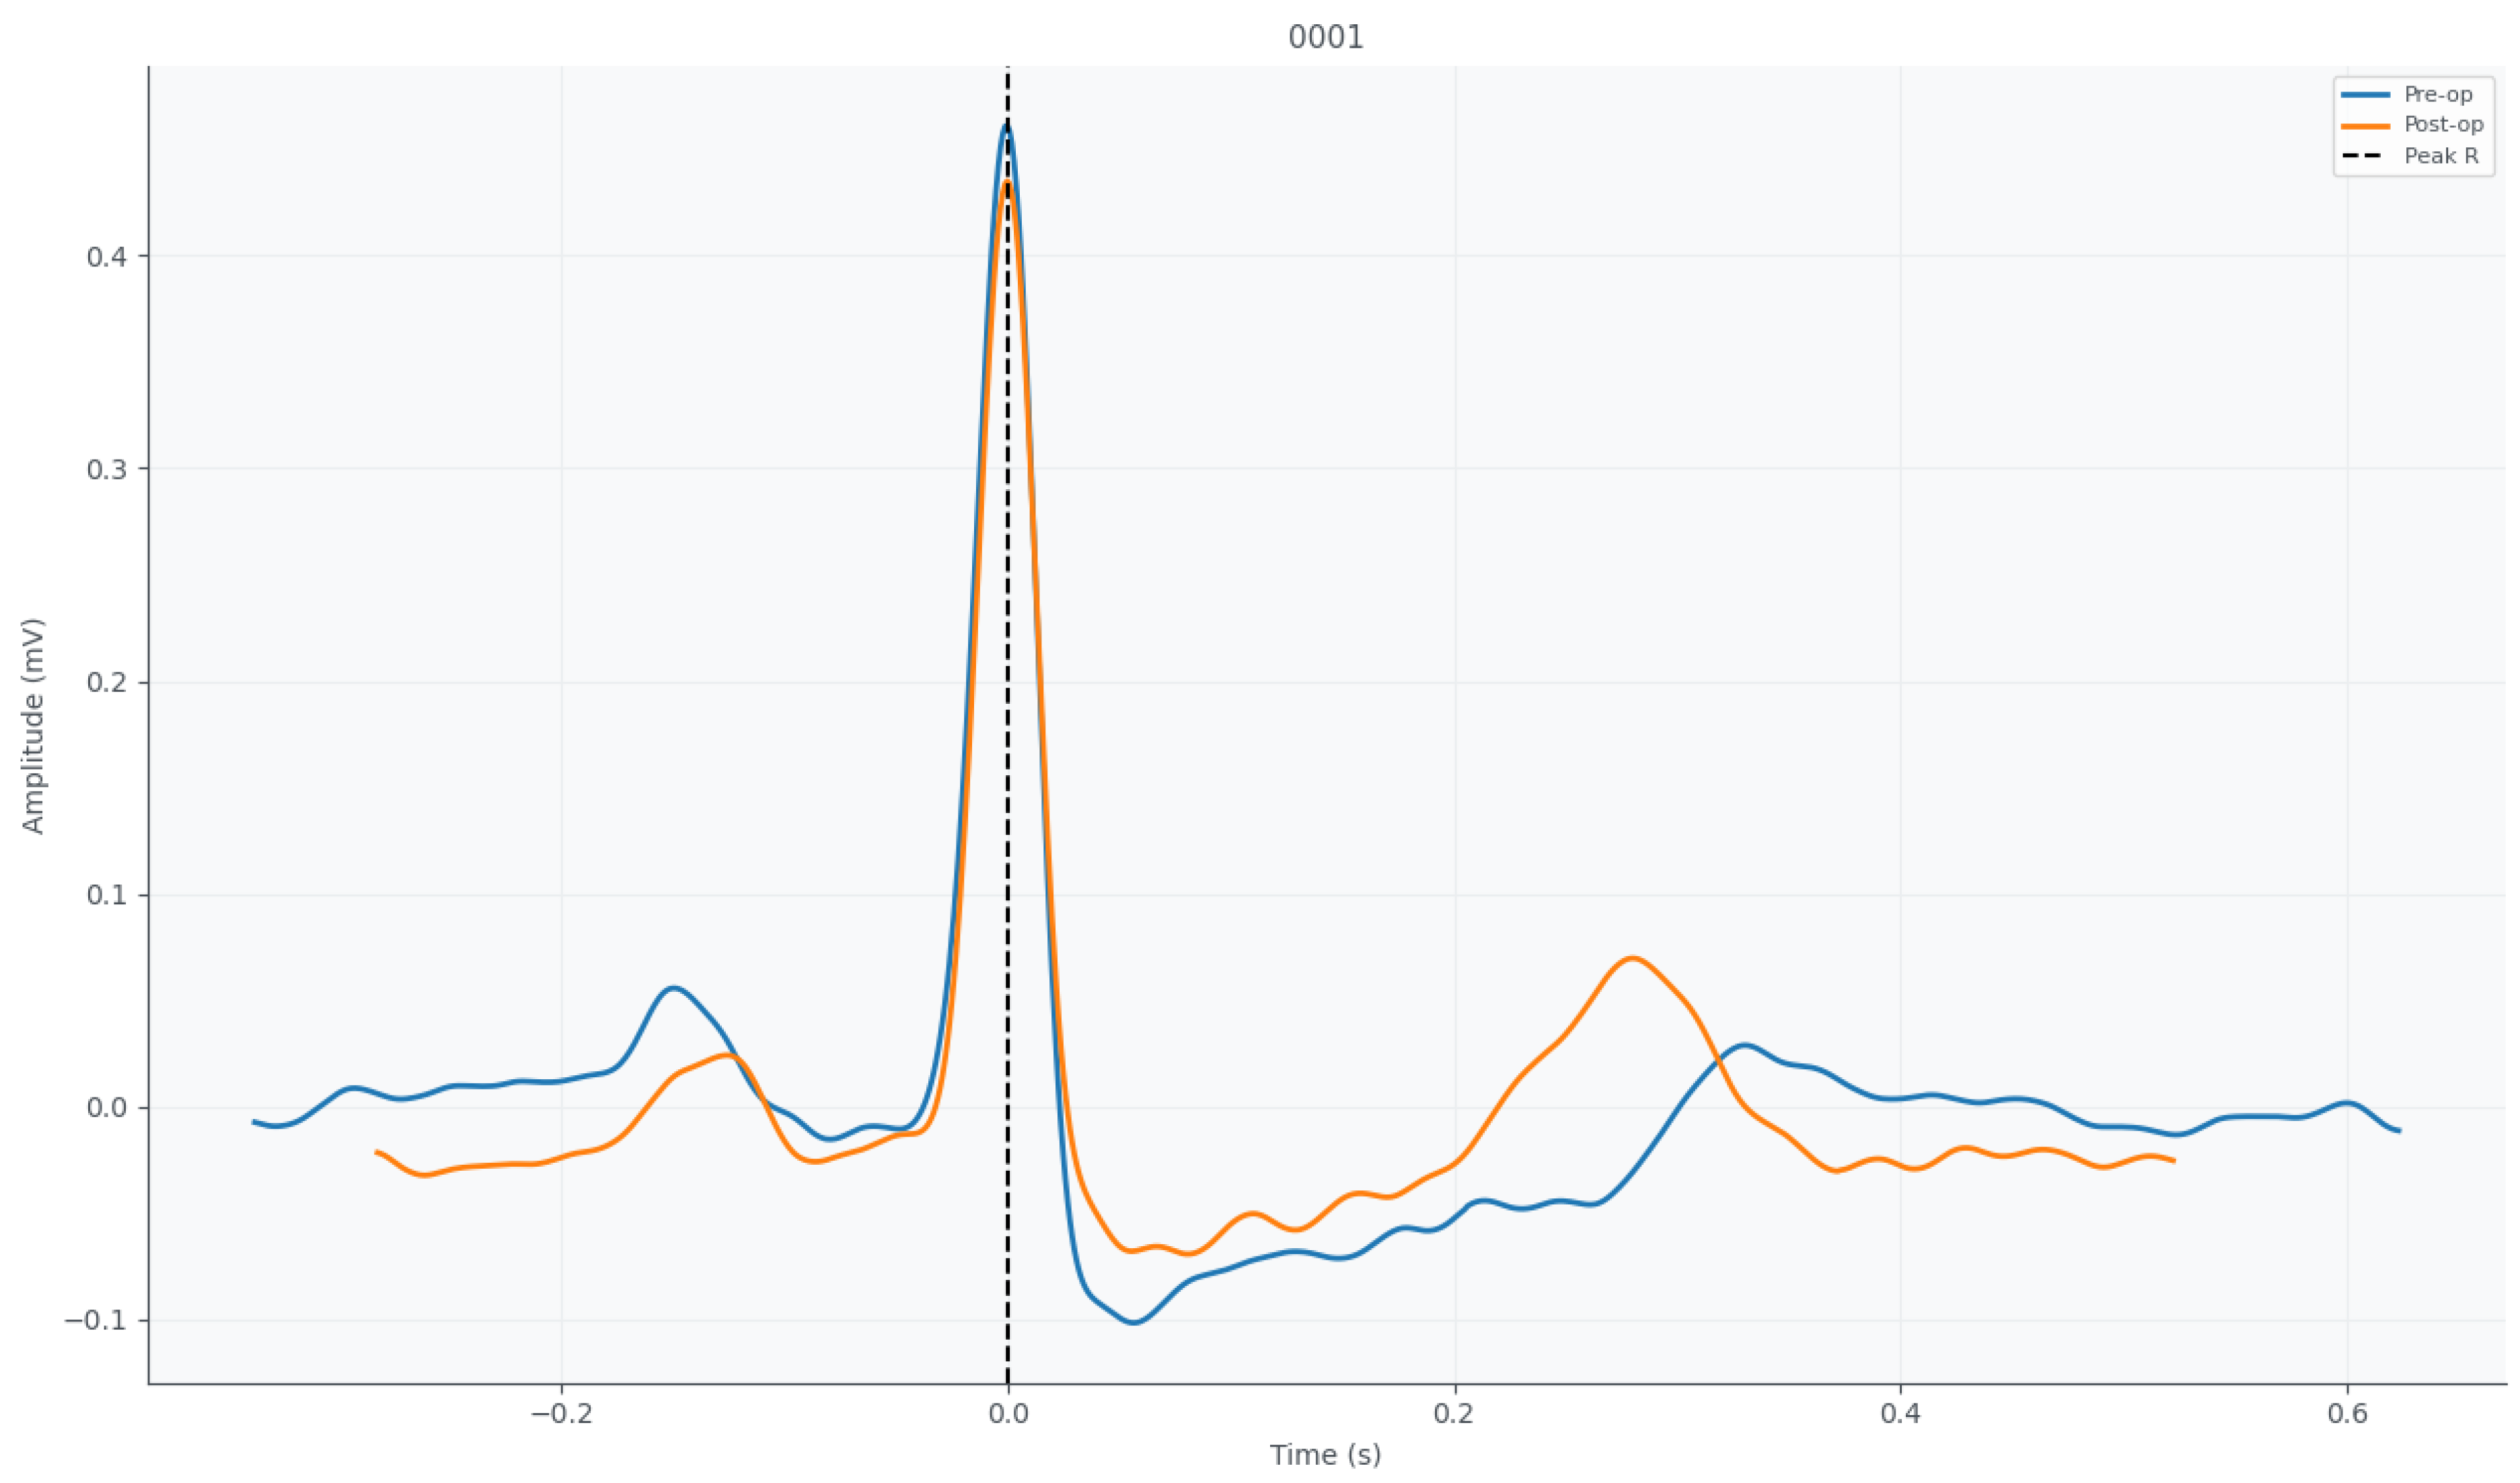
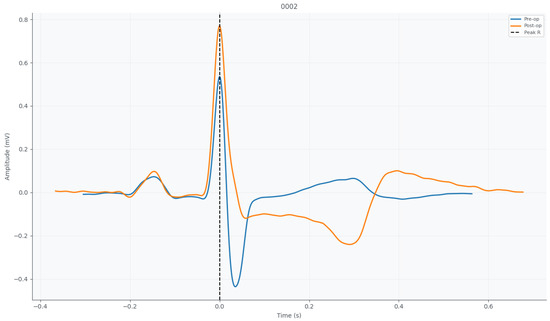
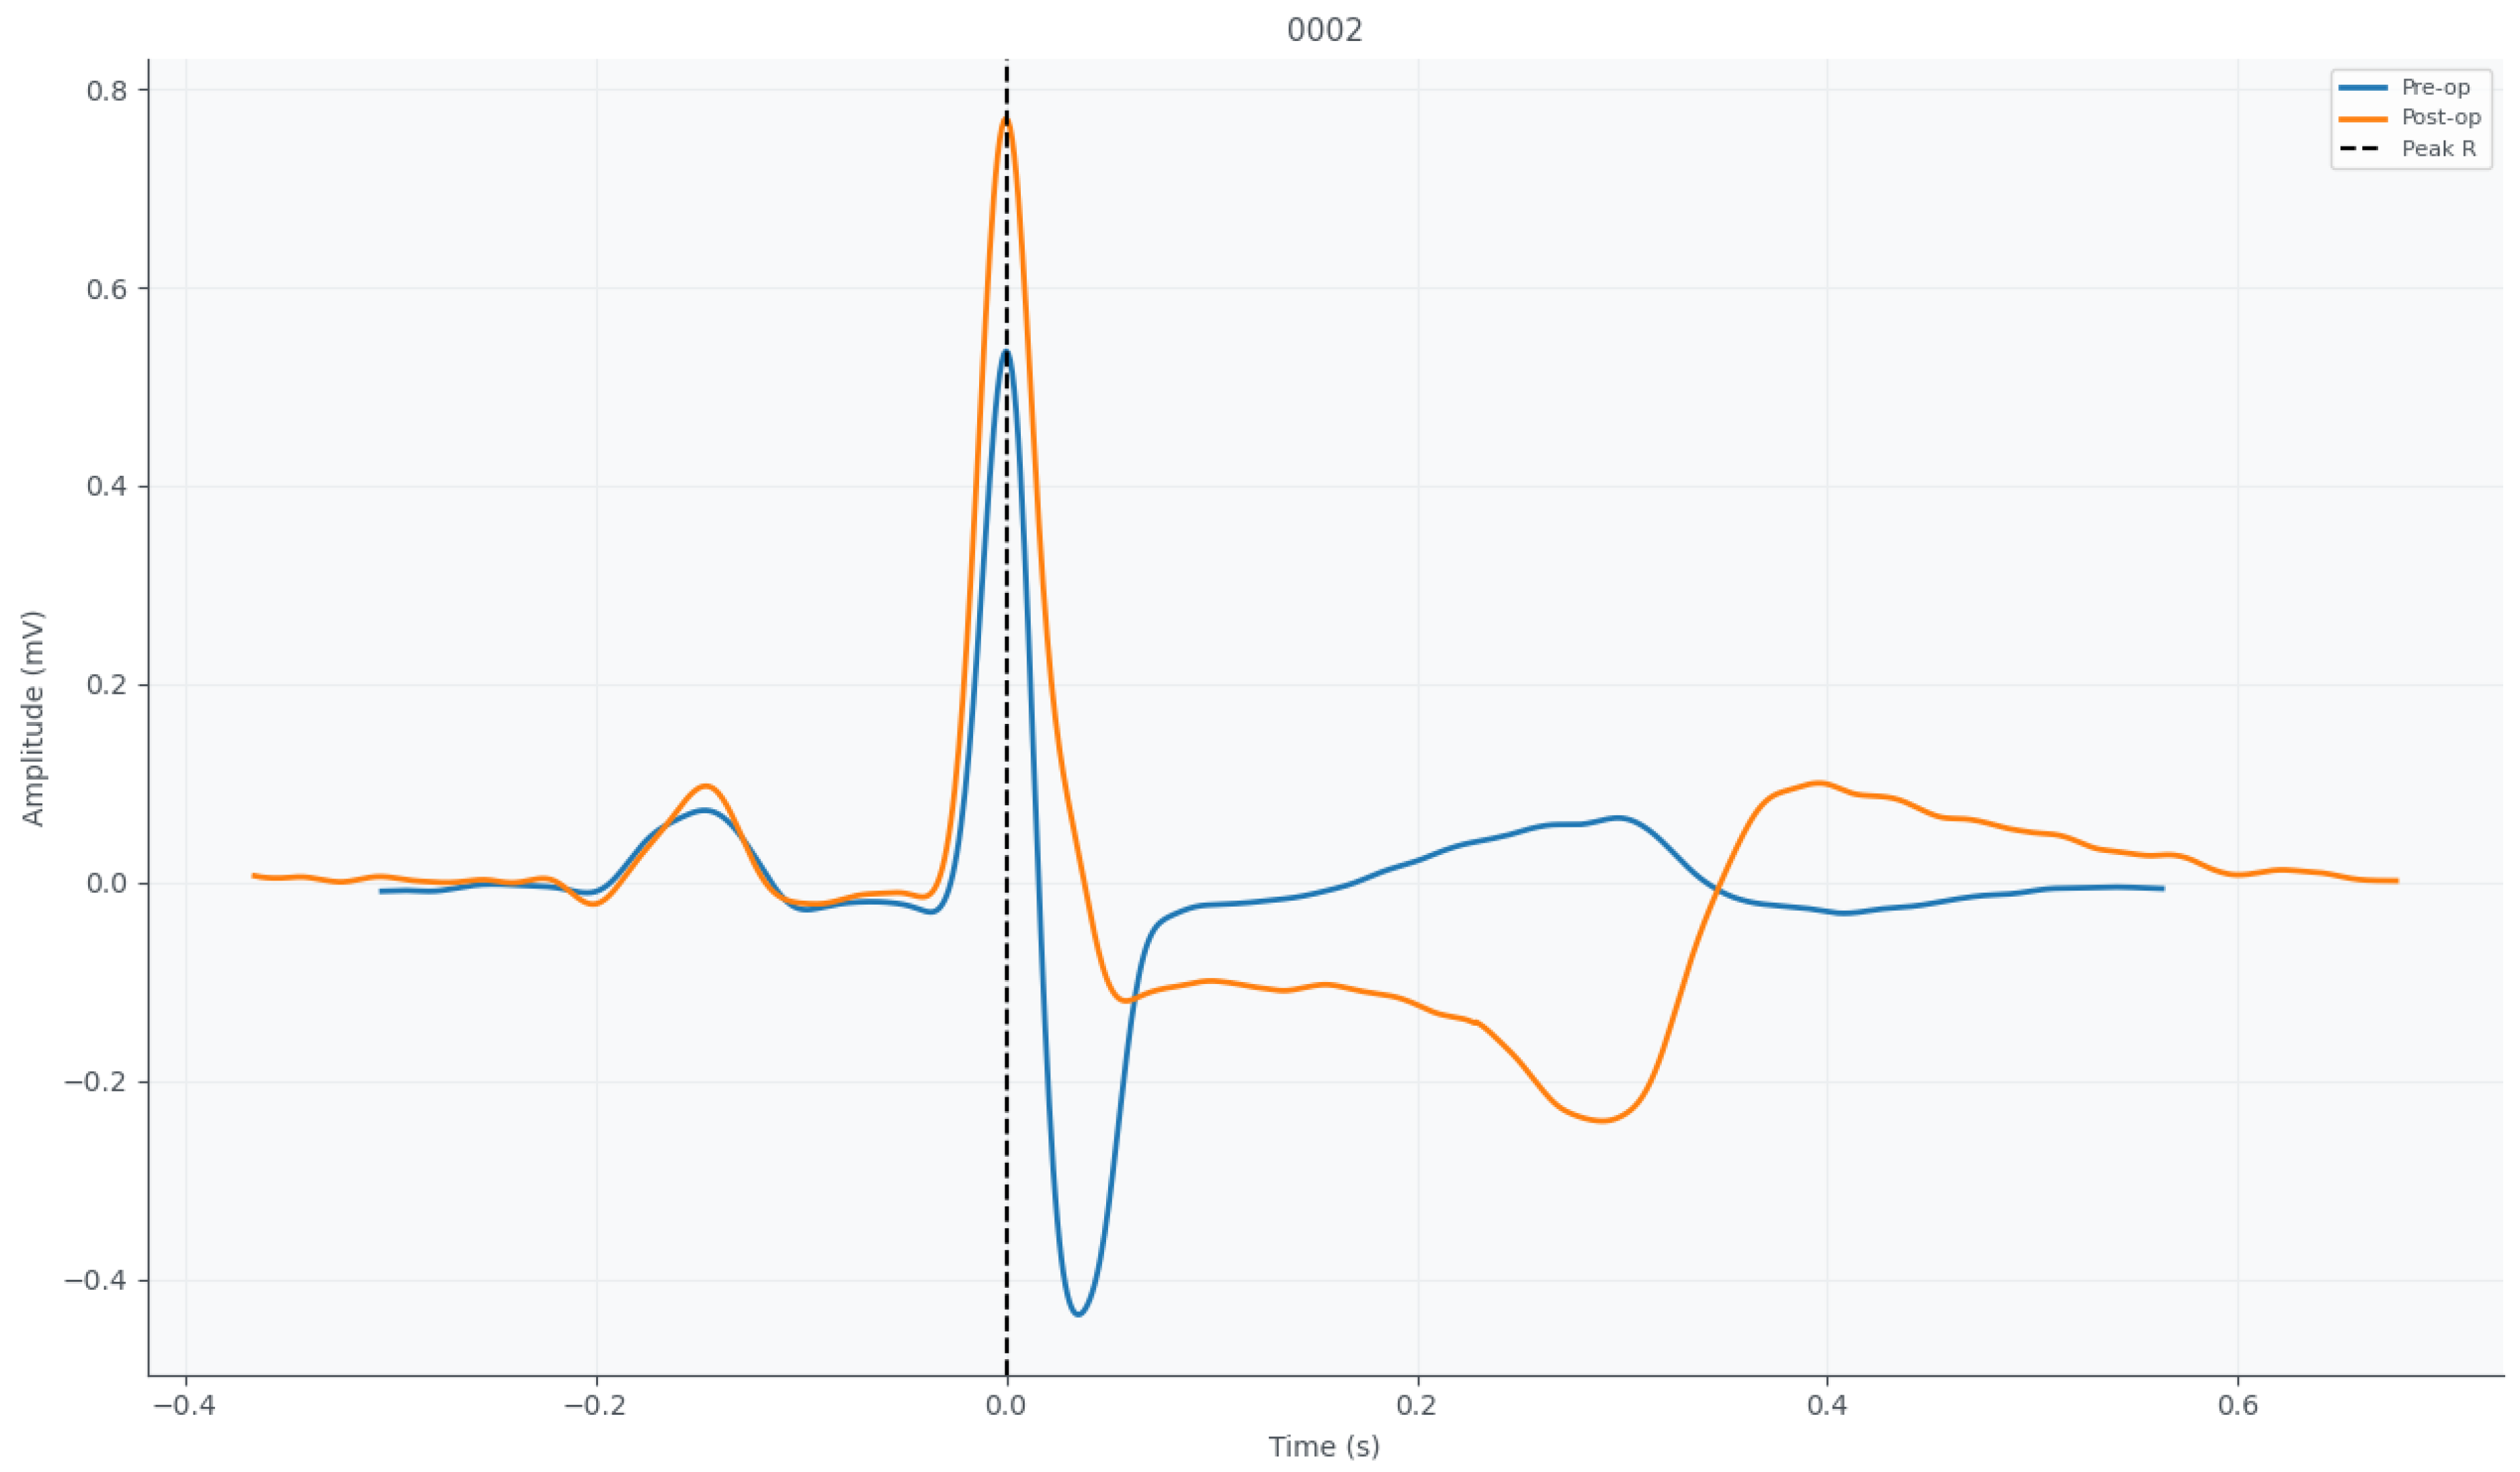
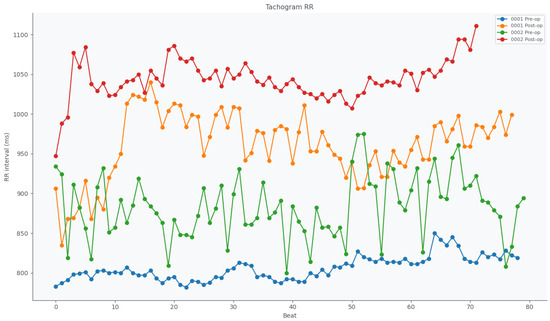
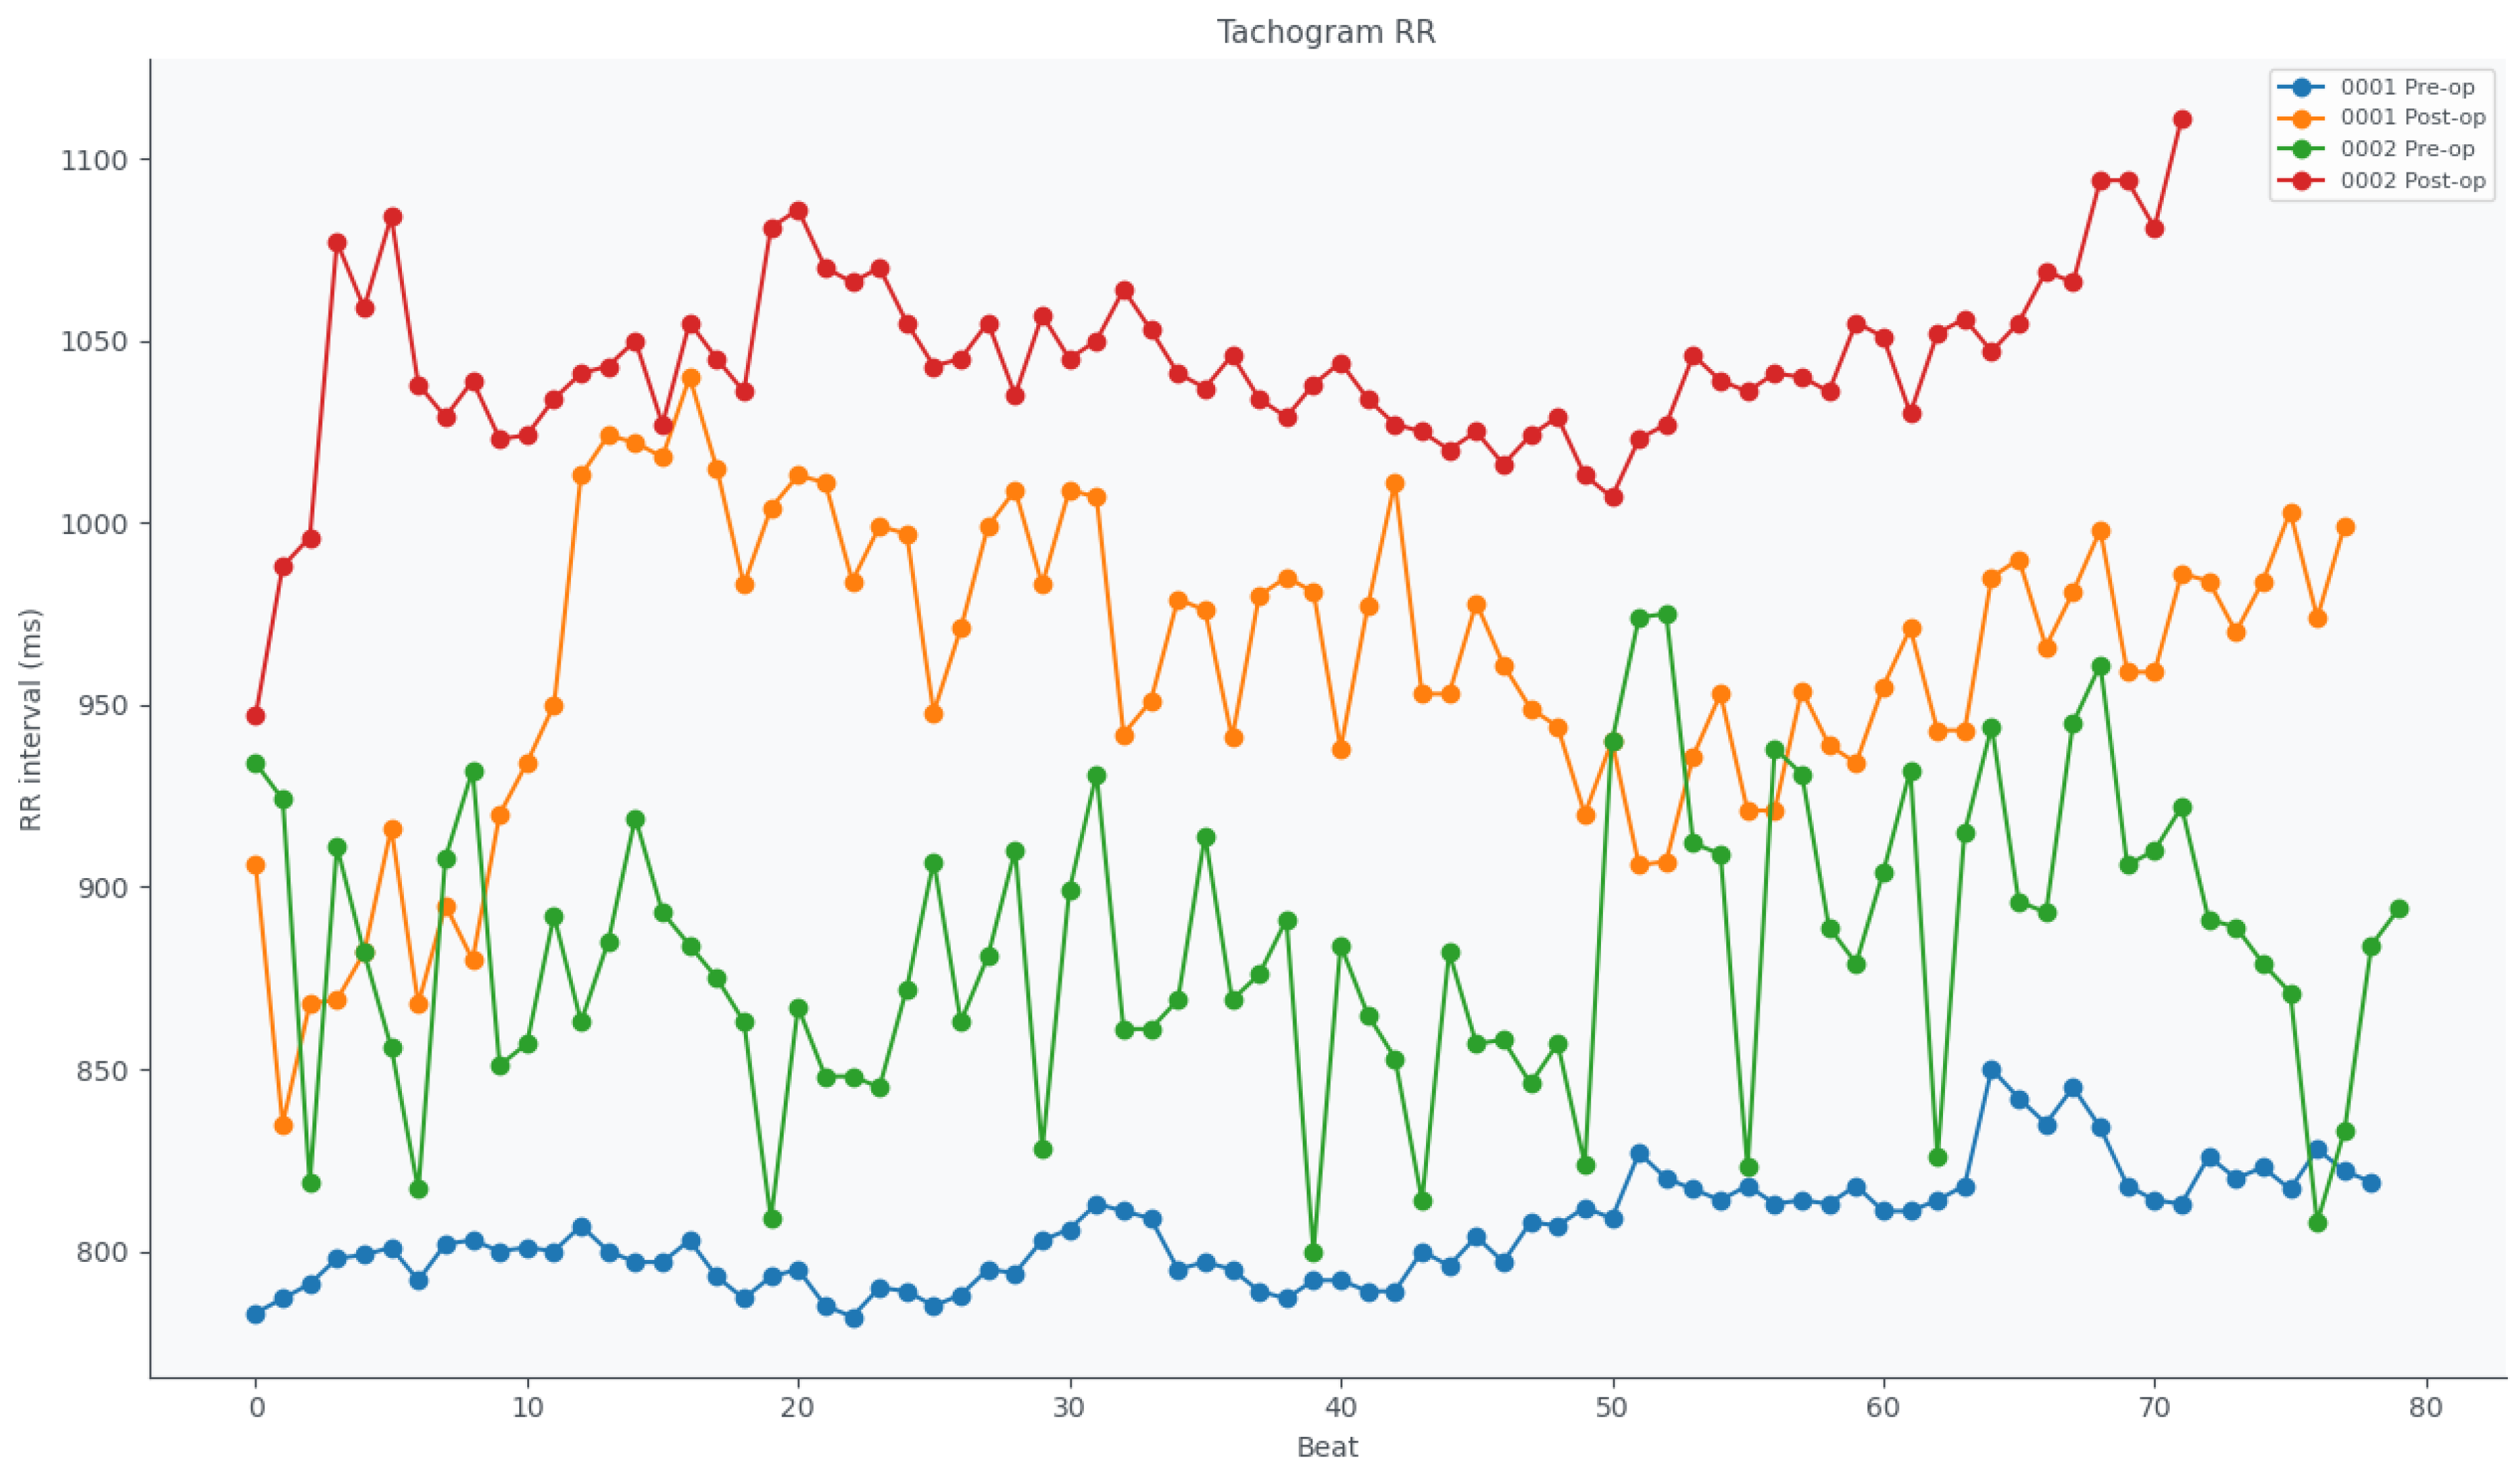
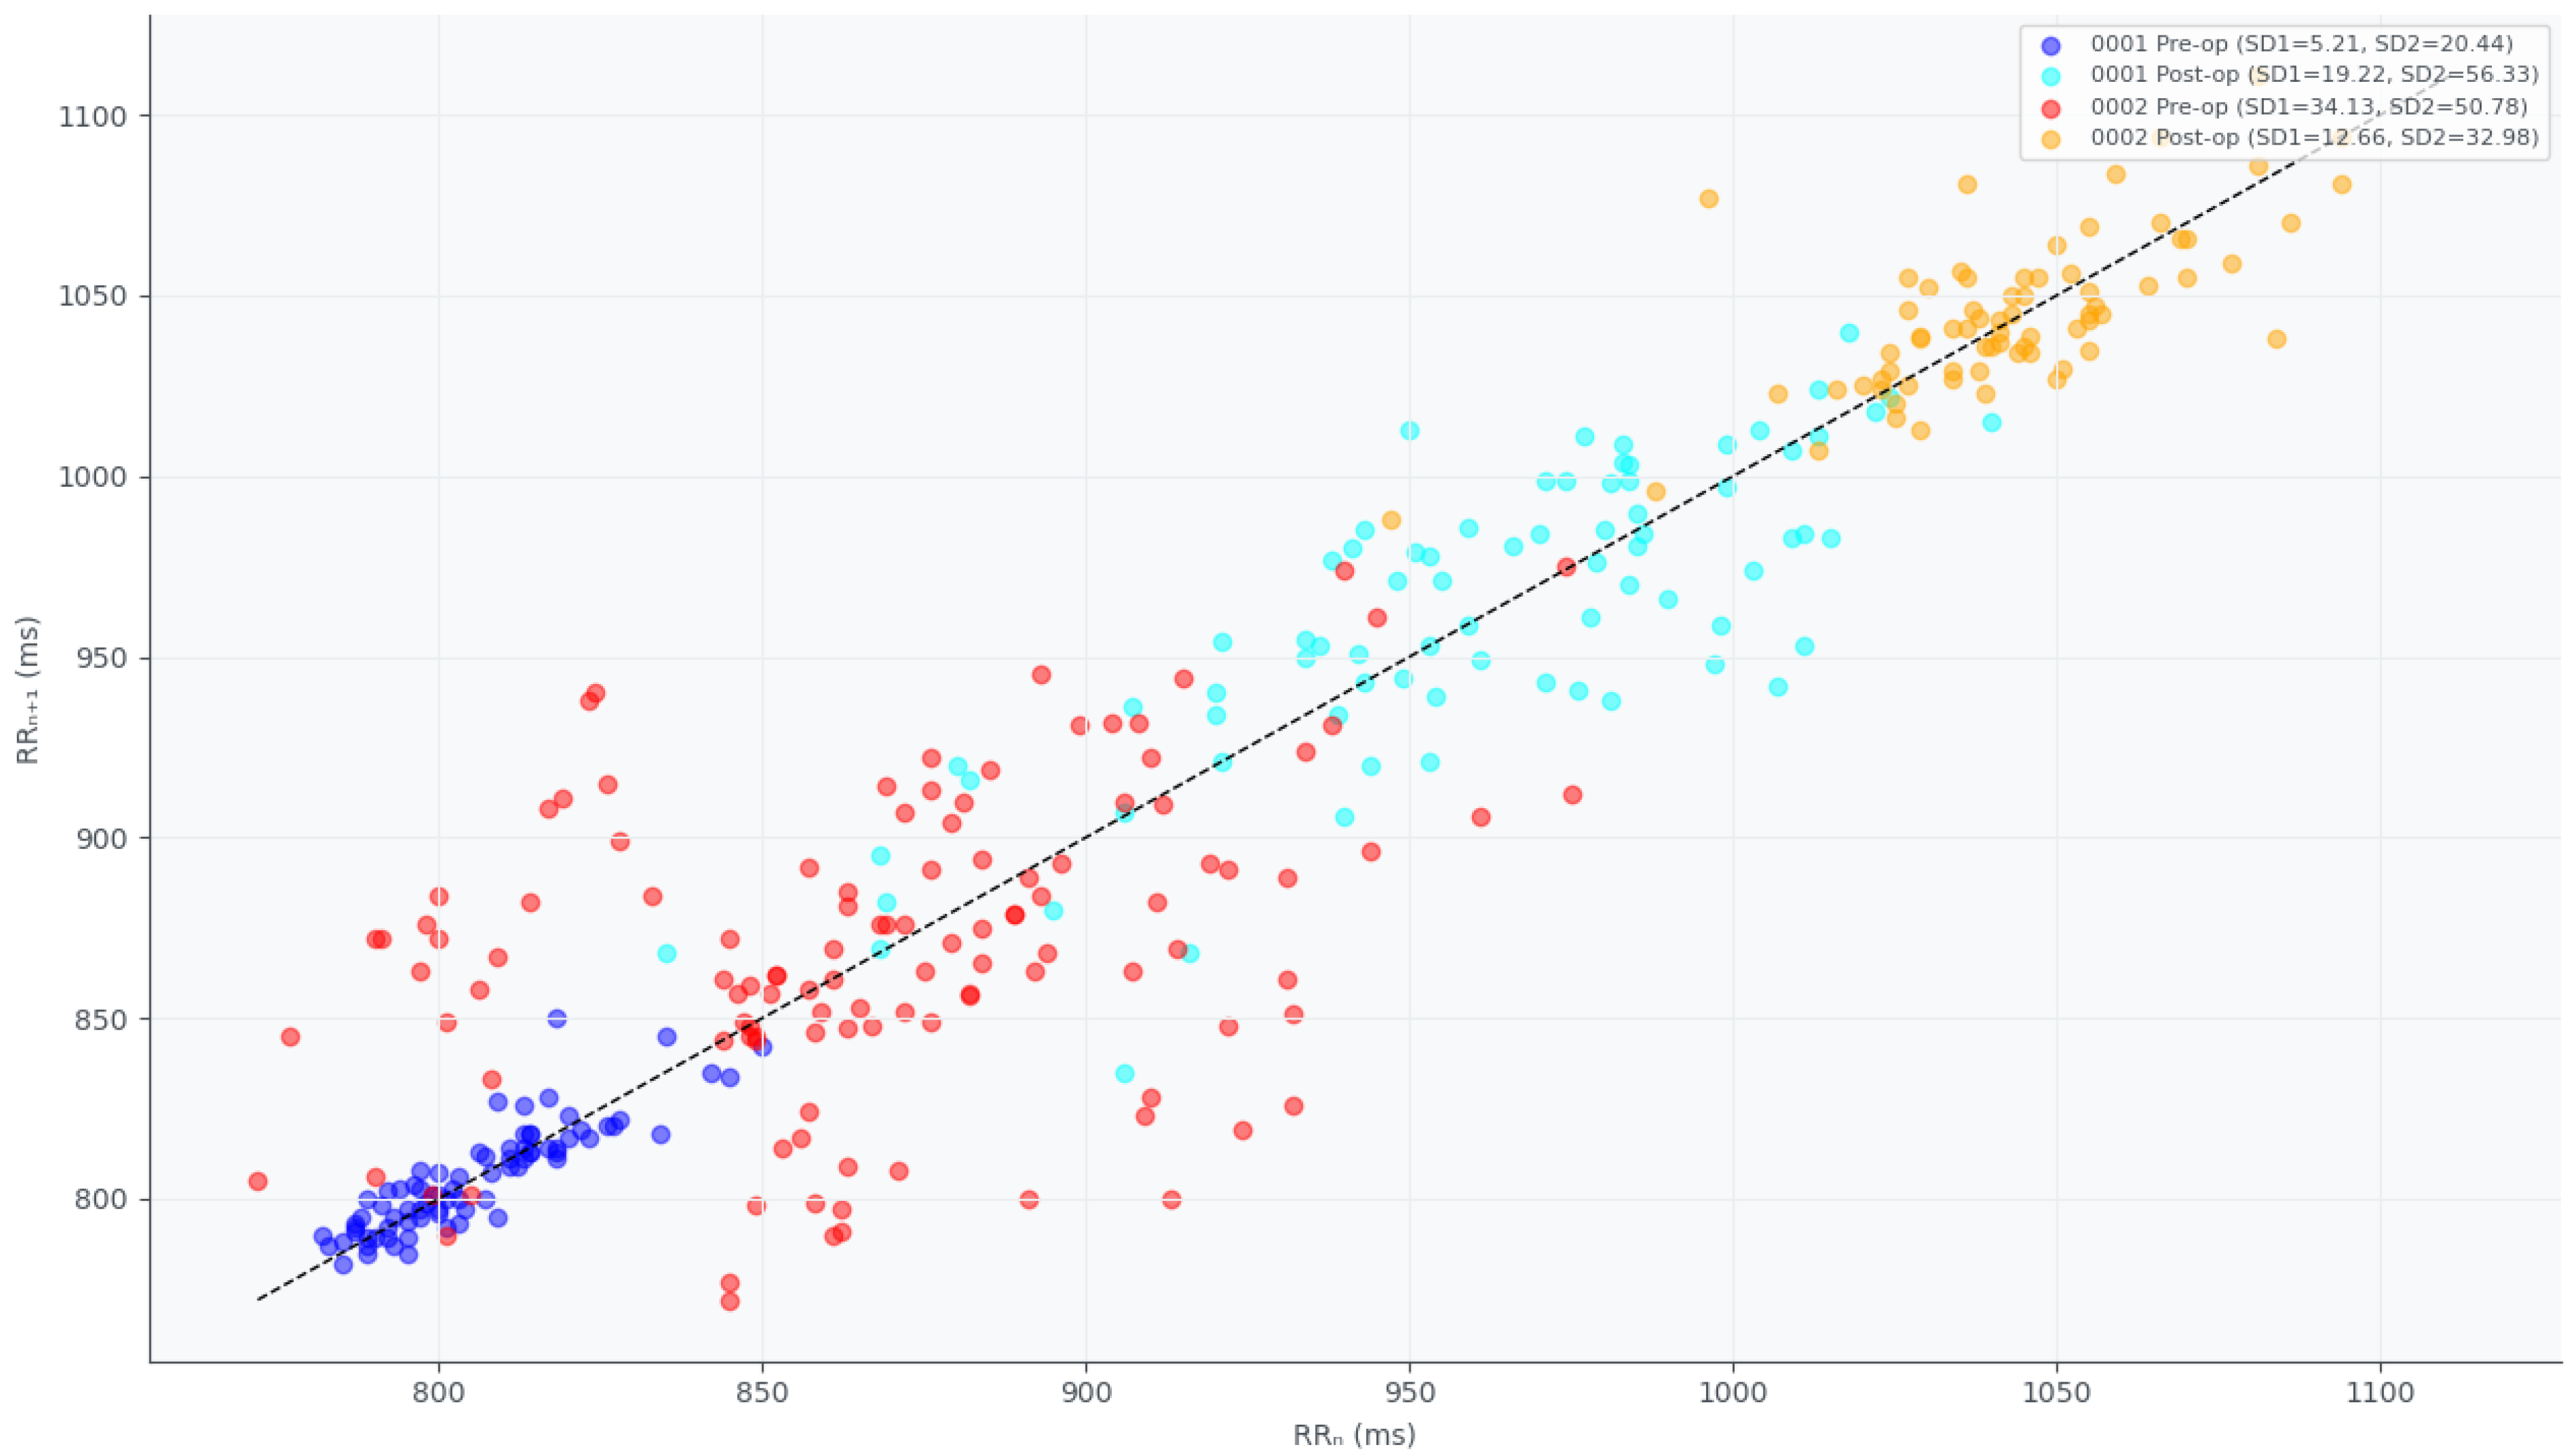
Heartbeat waveform templates were generated by aligning and averaging windows centred on the R-wave, enabling visual comparison between pre- and postoperative periods (Figure 4 and Figure 5). Additionally, tachograms (Figure 6) and extended Poincaré plots (Figure 7) were constructed, and SD1 and SD2 parameters were calculated [22].
Figure 4.
Comparison between the mean heartbeat templates of subject 0001, recorded in the pre- and postoperative periods. The signals were aligned to the R peak (t = 0 s) to facilitate morphological analysis. The preoperative template is represented by the blue curve and the postoperative template by the orange curve. Differences in the shape of the QRS complex and/or the T wave may indicate ECG changes resulting from the surgical intervention.
Figure 5.
Comparison between the mean heartbeat templates of subject 0002, recorded in the pre- and postoperative periods. The signals were aligned to the R peak (t = 0 s) to facilitate morphological analysis. The preoperative template is represented by the blue curve and the postoperative template by the orange curve. Differences in the shape of the QRS complex and/or the T wave may indicate ECG changes resulting from the surgical intervention.
Figure 6.
Tachogram showing the RR intervals before (Pre-op) and after (Post-op) the surgical procedure. A noticeable increase in RR variability is observed postoperatively, indicating enhanced vagal modulation.
Figure 7.
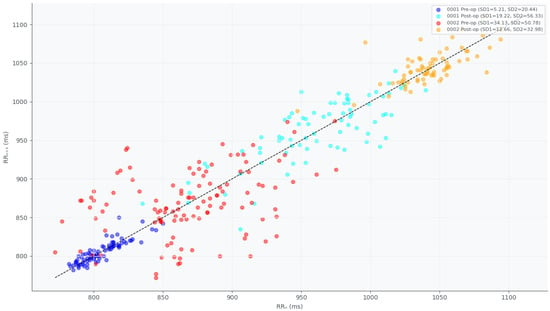
Extended Poincaré plot (RRn+2 vs. RRn) for subjects 0001 and 0002, showing preoperative and postoperative RR intervals.
4. Results
4.1. Segmentation Performance
With this analysis, we seek to characterise potential differences in the heart rate as computed from the signals collected with ECG_REF and with ECG_EXP. Distortions in the R peak may introduce a latency that affects the heart rate calculation, and artefacts in the signal may lead to undetected or wrongly detected peaks.
Table 2 summarises the comparative analysis for the heart rate calculation. Each line corresponds to the difference in heart rate between the ECG_EXP channel and the ECG_REF channel collected with each ECG acquisition system and shows the mean difference () and standard deviation (). This difference in heart rate is shown based on the correspondence of the R peaks between both time series. Finally, the percentage of noisy segments is presented, i.e., segments corresponding to periods when the signal is saturated (at maximum or minimum value) or highly corrupted by noise. The signal detection error (SDE in %) is given by Equation (3), where S represents the total signal and N represents the signal outside the measurement range (both in seconds). In Table 2, results are summarised for two algorithms used to detect R-peaks, which are later employed in Section 4.2. The first algorithm, implemented from the BioSPPy library [23] (Algorithm 1), relies on band-pass filtering (typically 0.5–45 Hz) to remove baseline wander and high-frequency noise, followed by signal differentiation, squaring, and moving-window integration to enhance the QRS complex, with peak detection based on amplitude and refractory period constraints. The second algorithm (Algorithm 2), based on the adaptive thresholding method proposed by Gutiérrez-Rivas et al. [24], applies initial signal pre-processing and dynamically updates detection thresholds according to local signal amplitude and noise levels, enabling robust identification of R-peaks under varying signal conditions.
Table 2.
Summary of heart rate differences and signal quality indices for ECG measurements.
4.2. Signal Quality Index
As stated earlier, the method proposed by Zhao et al. [11] is separated into two steps: The first is based on a simple heuristic fusion. By means of the ECG waveform characteristics and time–frequency characteristics of the noise source, they proposed quality evaluation parameters to adjust the reasonable range of the SQI.
Following Zhao and Zhang [11], signal quality was assessed using a fusion of morphological and noise-sensitive indicators derived from the ECG waveform. In the present implementation, four SQIs were computed: qSQI, pSQI, kSQI, and basSQI. The qSQI was obtained from the agreement between two independent R-peak detectors, thus reflecting the consistency of heartbeat detection. The pSQI was computed from the relative spectral power in the QRS-related band, representing the extent to which the signal energy was concentrated in physiologically relevant frequency components. The kSQI corresponded to the kurtosis of the ECG signal and was used as a waveform-shape descriptor. Finally, the basSQI quantified the relative contribution of low-frequency baseline components. For qSQI, values were considered optimal and values unqualified. For kSQI, values were considered optimal. For basSQI, values were considered optimal and values unqualified. The pSQI thresholds followed the heart-rate-dependent rules defined in the BioSPPy implementation of Zhao and Zhang’s method. In accordance with the simple heuristic fusion approach of Zhao and Zhang [11], each SQI was mapped to a local quality class: 0 (unqualified), 1 (suspicious), or 2 (optimal). The final signal quality class was then obtained by heuristic fusion of the four local SQI classes, resulting in one of three categories: “Excellent”, “Barely acceptable”, or “Unacceptable”.
The implementation used in this work follows the open-source version available in the BioSPPy library [25], ensuring the transparency and reproducibility of the signal quality assessment procedure.
The full ECG signal from the EXP_ECG was analysed with this method, and two different types of algorithms for detecting R-peaks were used. In a complete ECG signal, the R-wave has the maximum amplitude and is the most obvious characteristic, so the presence of an ECG signal is often confirmed by detecting the R-wave. Therefore, by comparing the heart rates calculated through the R-peaks between ECG_REF and ECG_EXP, we can estimate the quality of the signal.
With these results, it is possible to observe a correlation between the signals that had an SQI of “Barely acceptable” and those that presented an SDE above 7%, which can be justified by the fact that in signals with a low SDE percentage, there is greater stability of the signal. In addition, 56.25% of the collected signals had “Excellent” signal quality based on the criteria established by Zhao et al. [11] (Table 2).
The characteristics of the complexes extracted from the ECG play a fundamental role in detecting cardiac pathologies. Parameters such as the duration of the PR, QRS, and QT intervals, as well as the morphology of the P wave and the ST segment, are essential for identifying abnormalities in the heart’s electrical conduction.
For example, a prolonged PR interval may indicate an atrioventricular block, while a widened QRS complex may suggest intraventricular conduction disturbances, such as bundle branch block. Alterations in the ST segment and T wave are often associated with myocardial ischaemia or myocardial infarction. In addition, the variability of these parameters can help diagnose arrhythmias such as atrial fibrillation and ventricular tachycardia. Conditions such as aortic valve stenosis may also lead to electrical and haemodynamic changes that are reflected in ECG patterns.
Extracting and analysing these characteristics enables a more accurate diagnosis and continuous patient monitoring, facilitating the early detection of heart disease and the implementation of appropriate medical interventions.
4.3. Clinical Correlation
We performed a more detailed evaluation, where segmentation results indicated comparable performance between the systems. Subsequently, we analysed the morphology of ECG_EXP signals and compared them with those collected using the clinical-grade ECG_REF system.
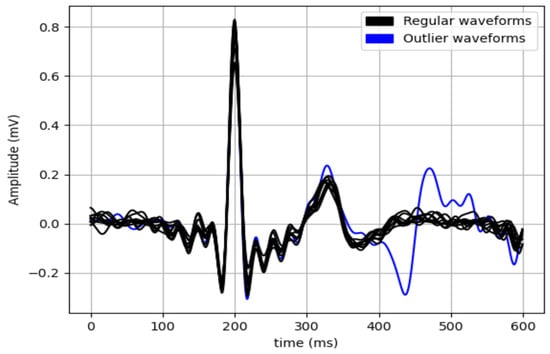
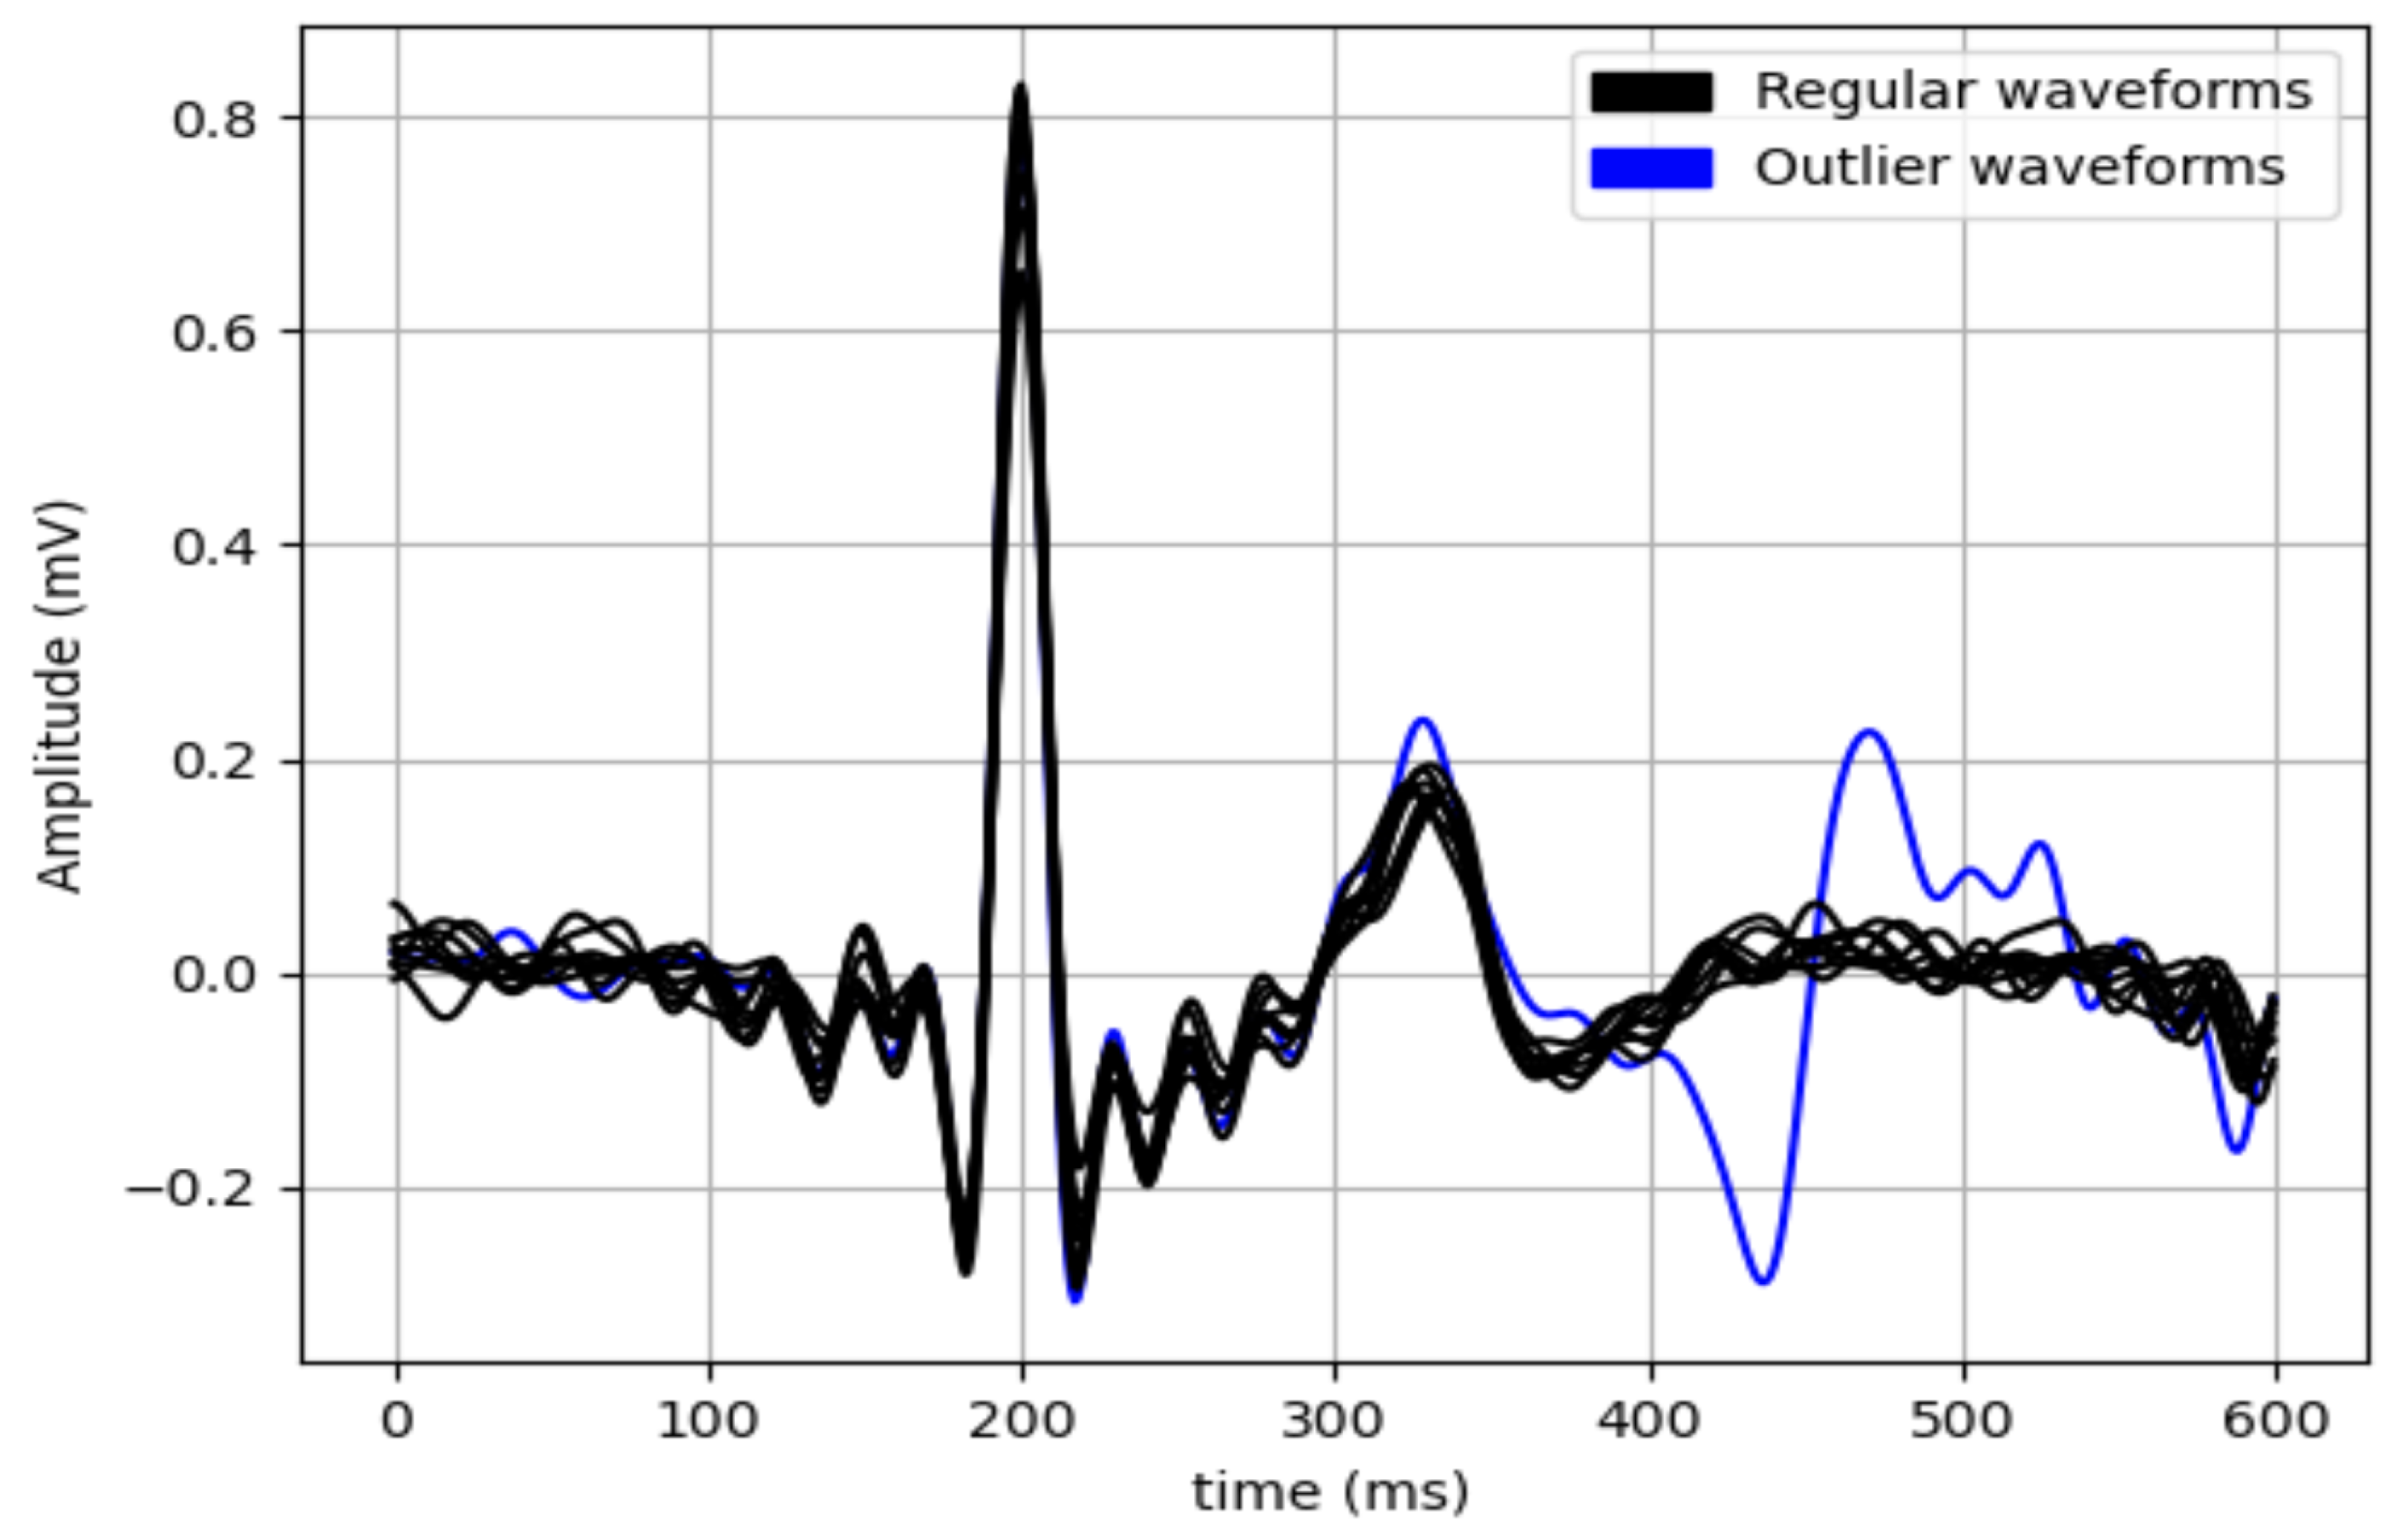
To do so, we segmented the individual heartbeat waveforms and removed the outliers using the Engelse & Zeelenberg [18] algorithm approach, as shown in Figure 8.
Figure 8.
Example of the result of the outlier removal algorithm for a test subject.
After removing the outliers, we then calculated several metrics, such as cosine distance methods, Dynamic Time Warping (DTW), Normalised Root Mean Square Error (NRMSE), and Pearson Correlation Coefficient (PCC), to assess the morphological similarity of the two signal sources. The distribution of these values was used to compare the different leads.
The results show that, in general, data collected at the thighs using our approach correlates better with the clinical Lead I derivation (Figure A1).
However, in order to deepen the analysis and compare the signal morphology in more detail, we performed the statistical analysis of each beat obtained from the EXP_ECG with the corresponding beat obtained from the ECG_REF, as seen in Figure A2.
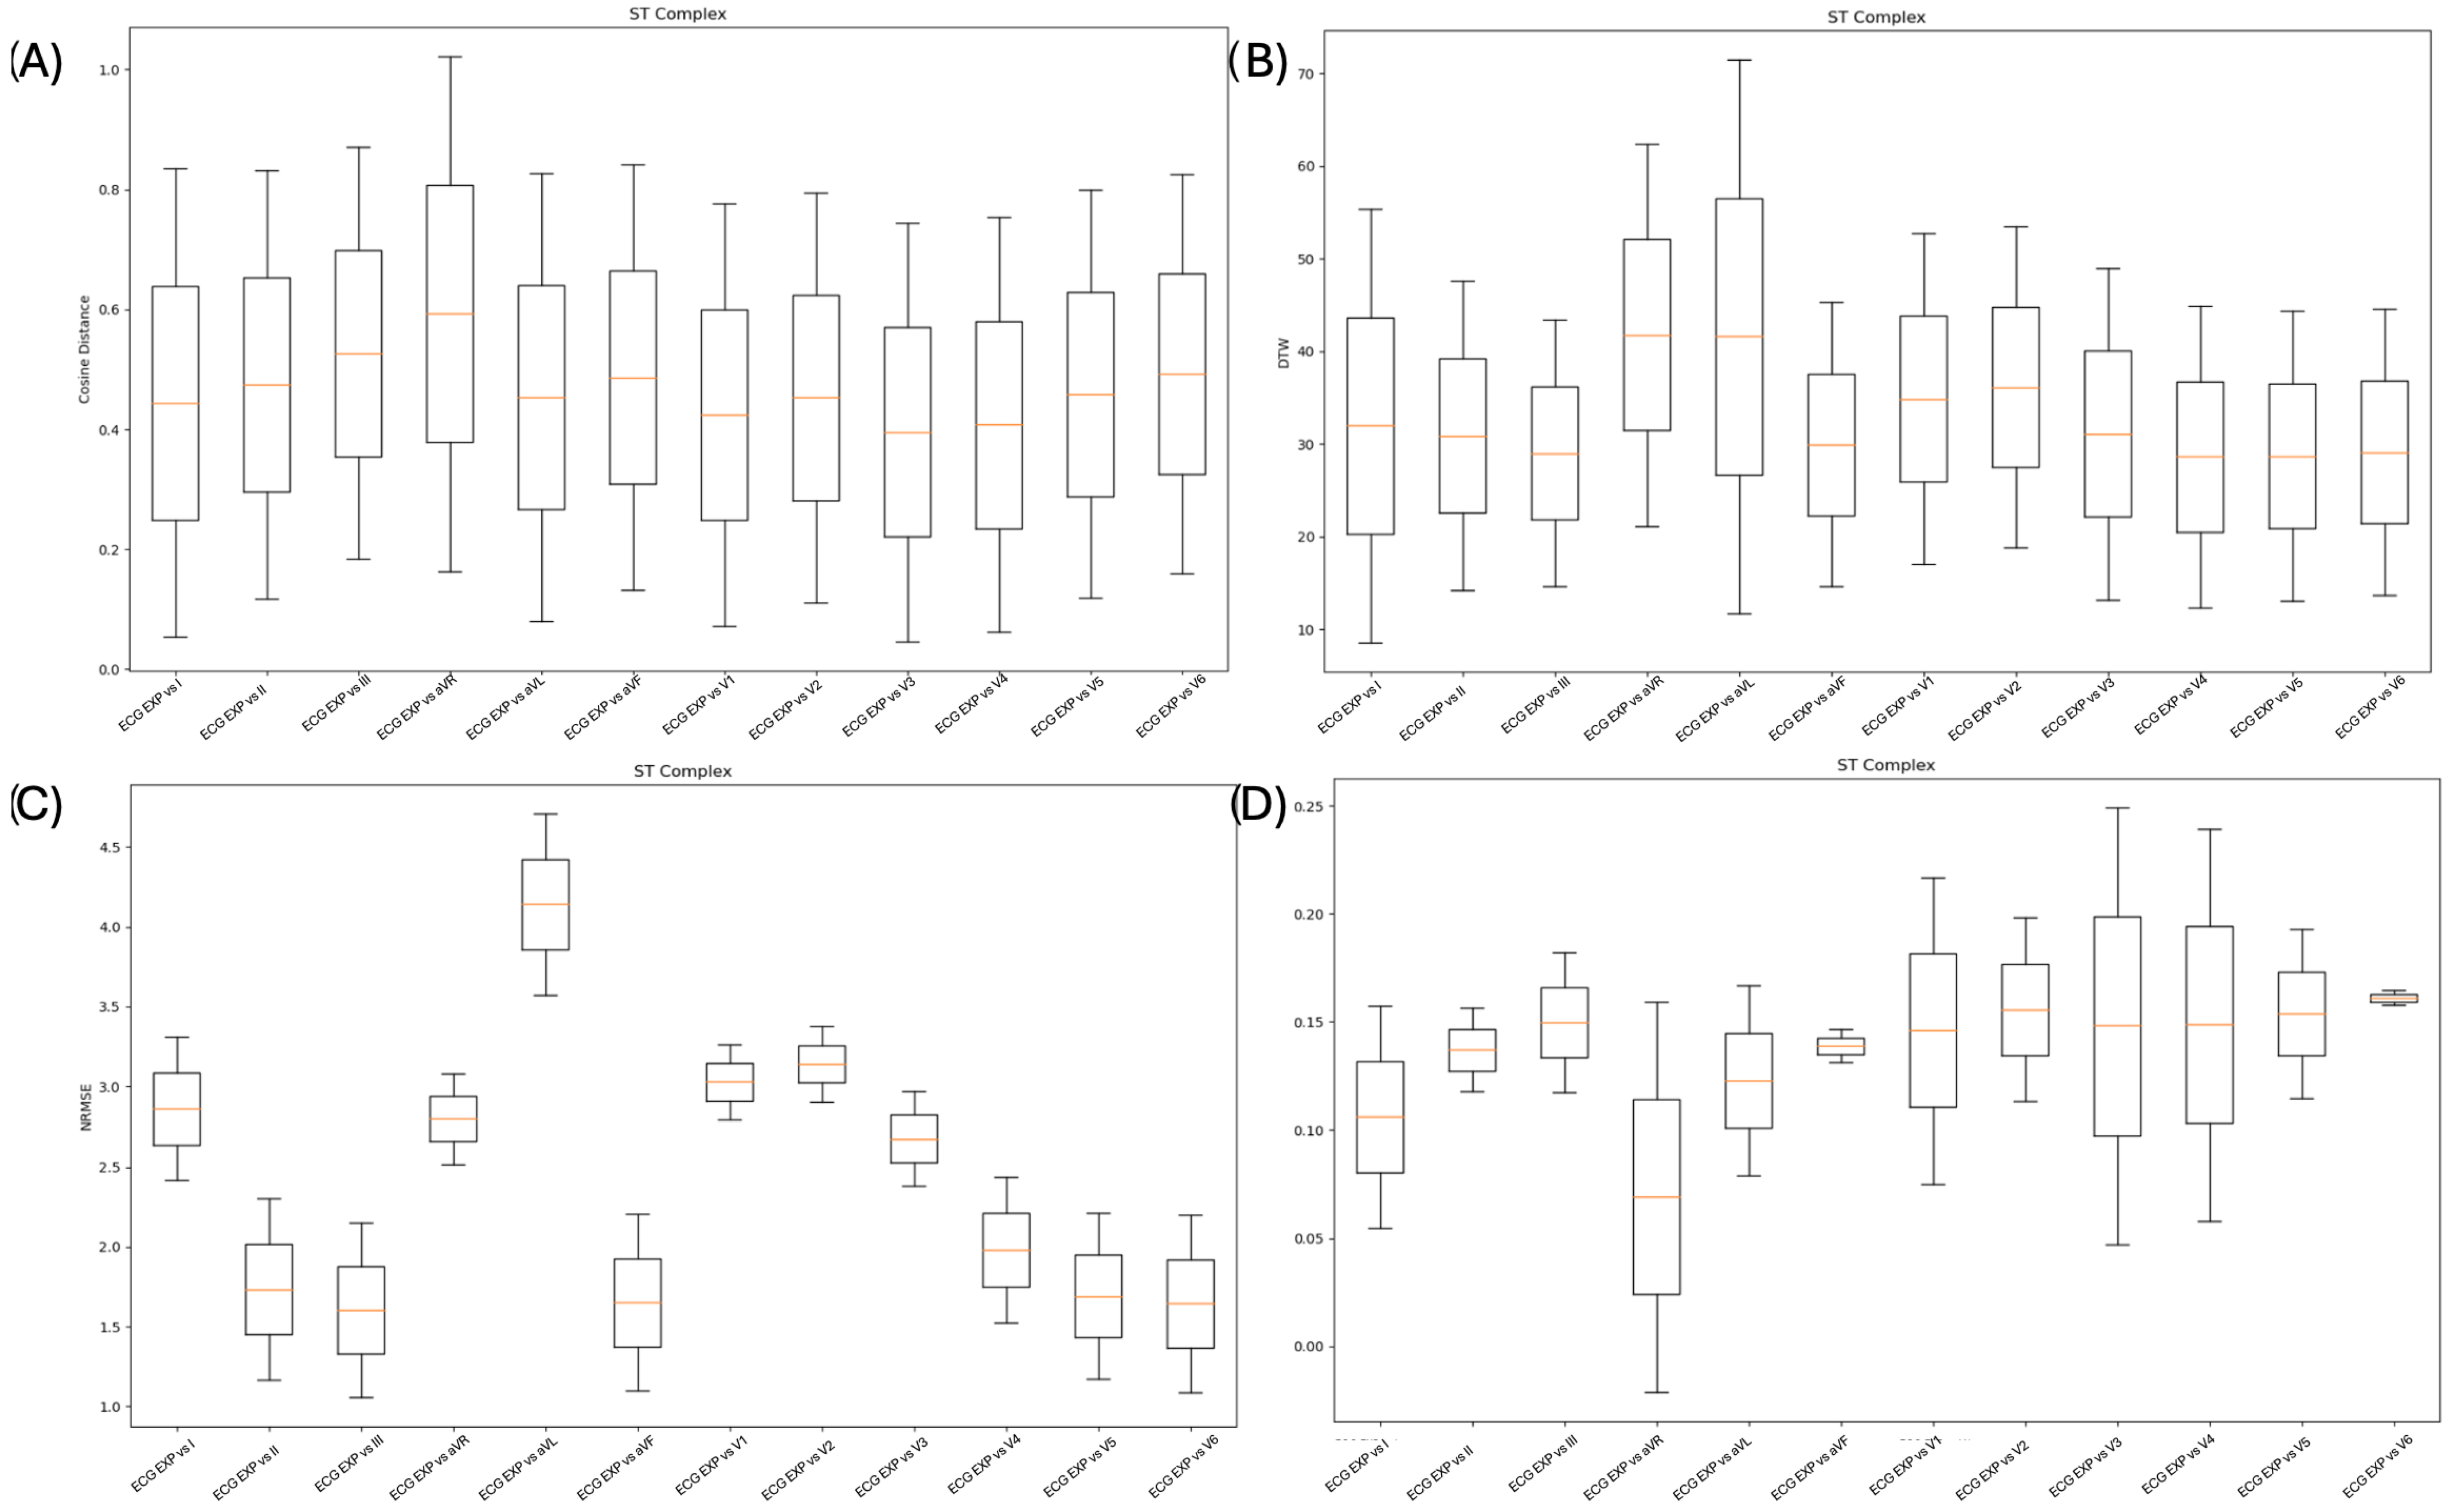
Our focus in this part of the study is to determine the morphological similarity between individual heartbeat waveforms collected using ECG_EXP. As explained previously, some aspects of the ECG waveform obtained by ECG_EXP are less evident than in ECG_REF. In addition to analysing the complete PQRST complex, we separately analysed the PQ and ST complexes as shown in Figure A3 and Figure A4.
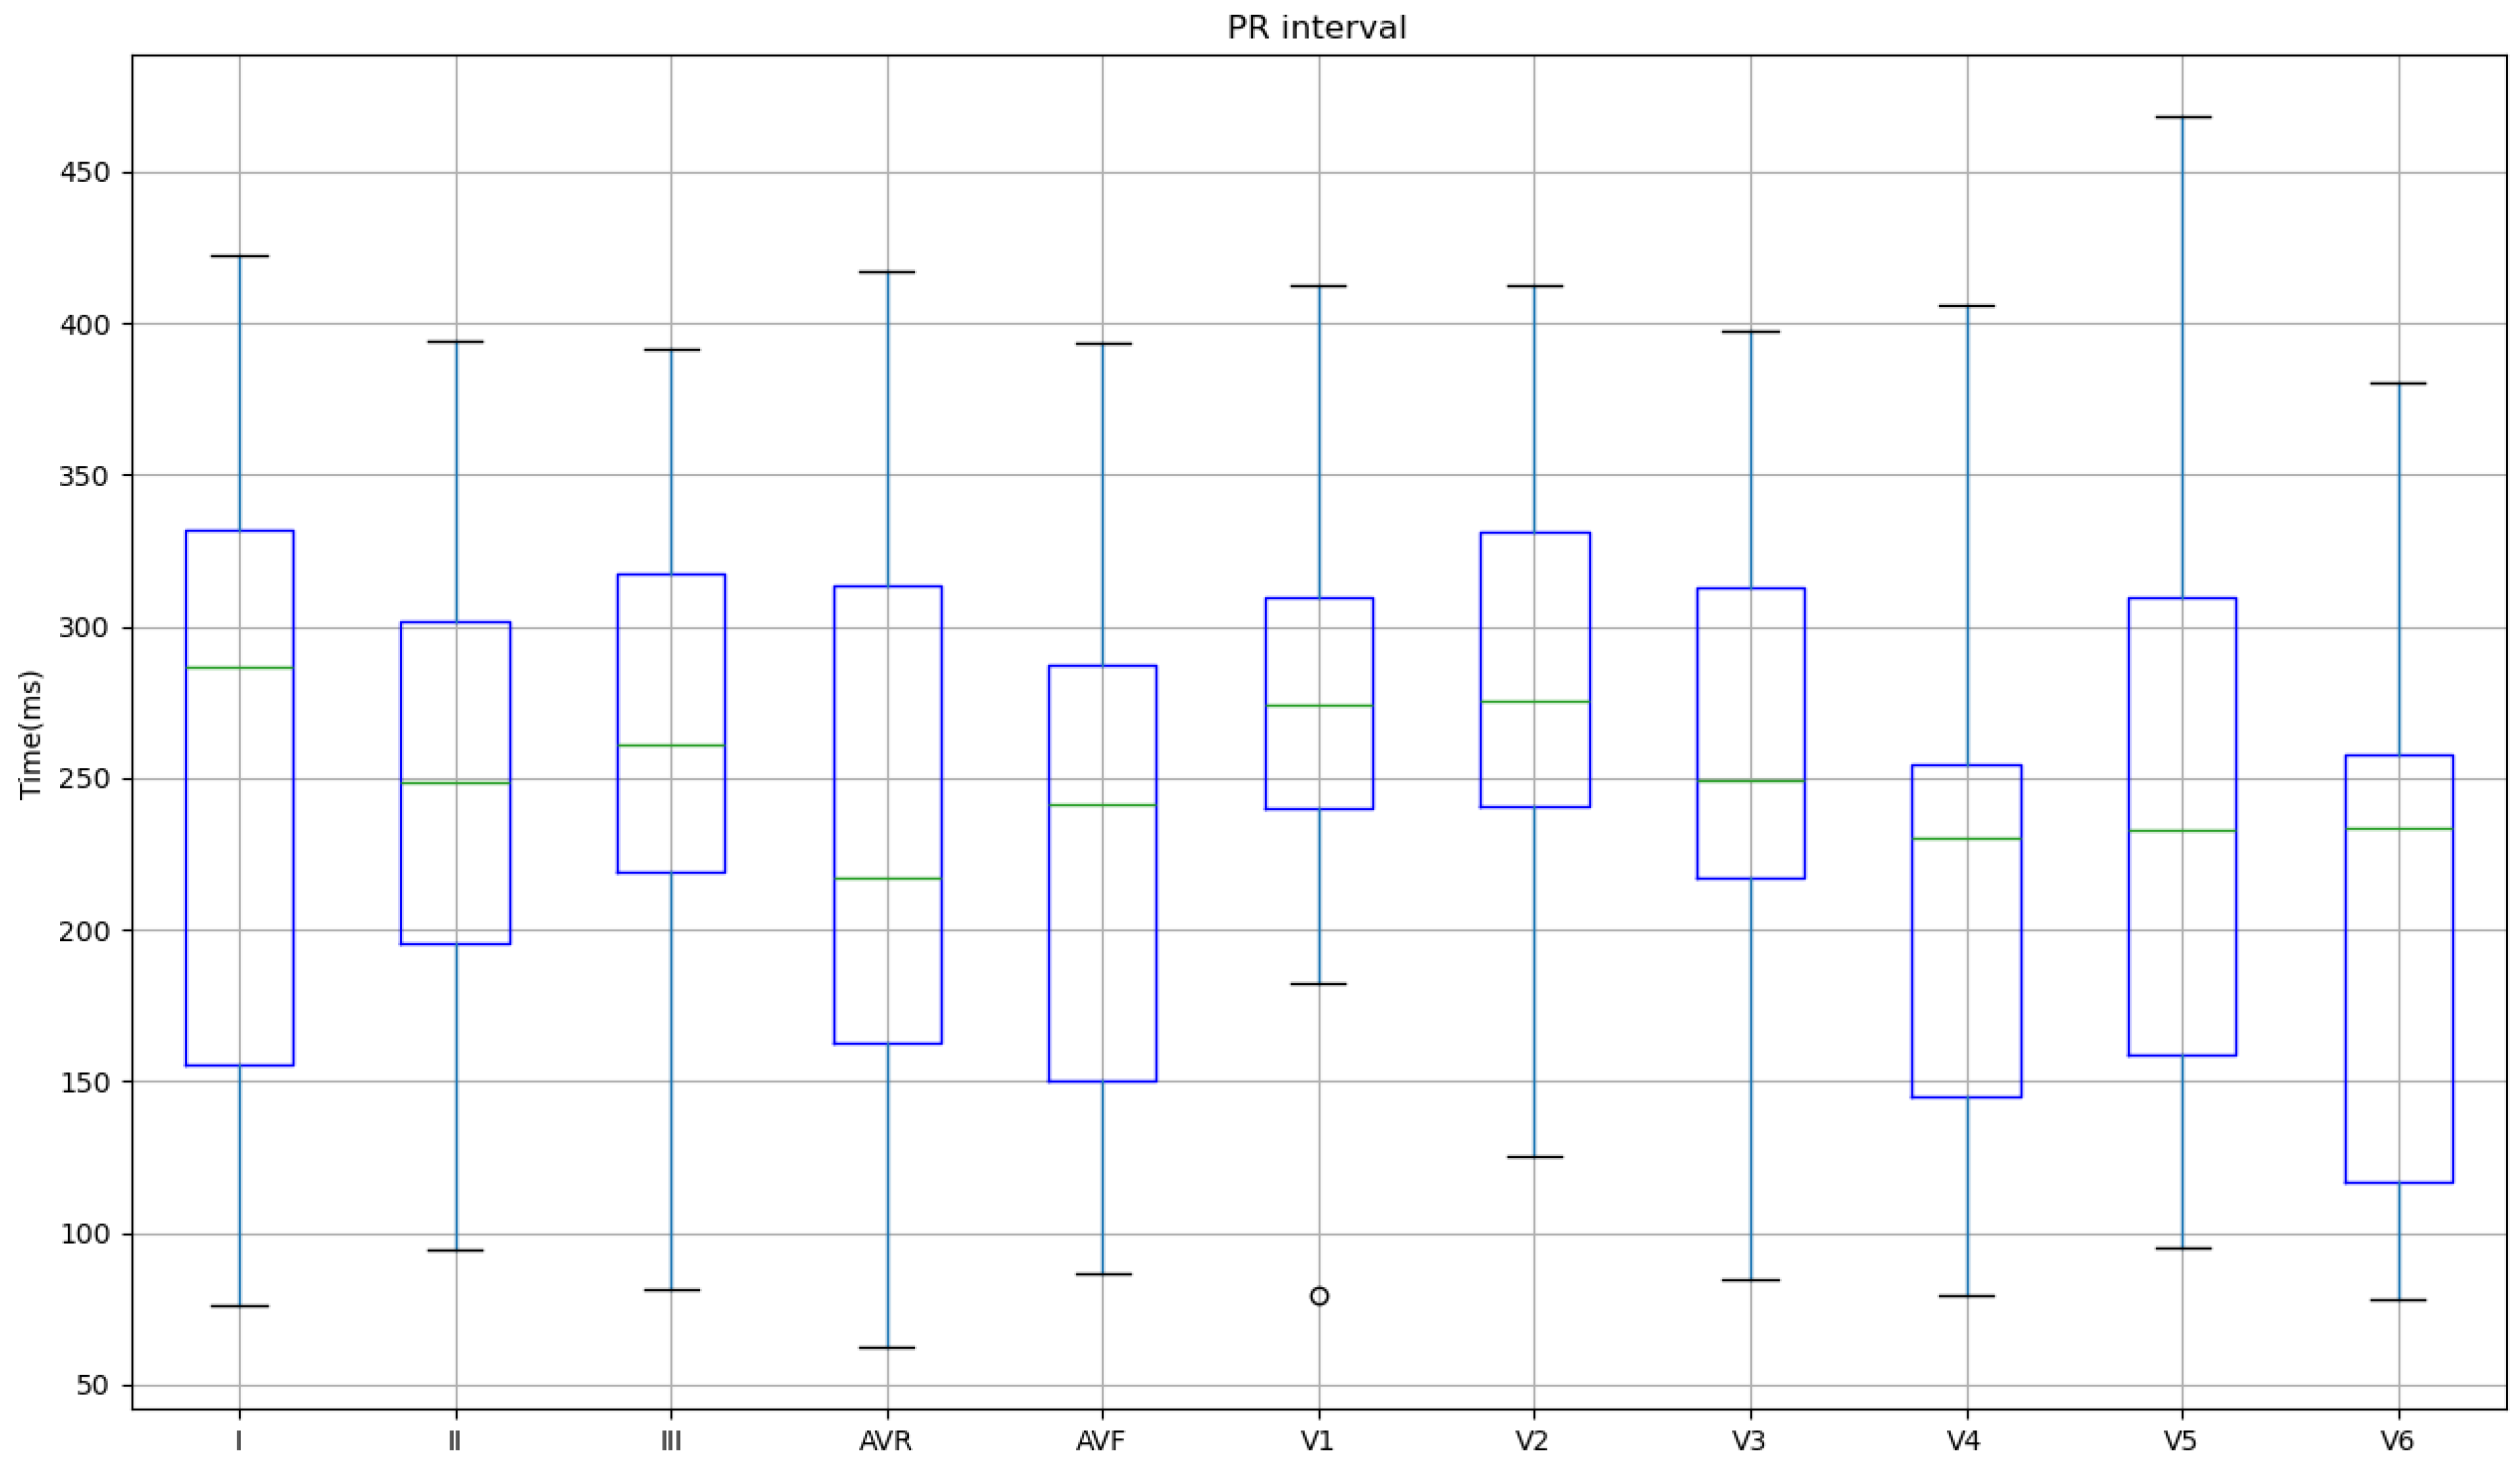
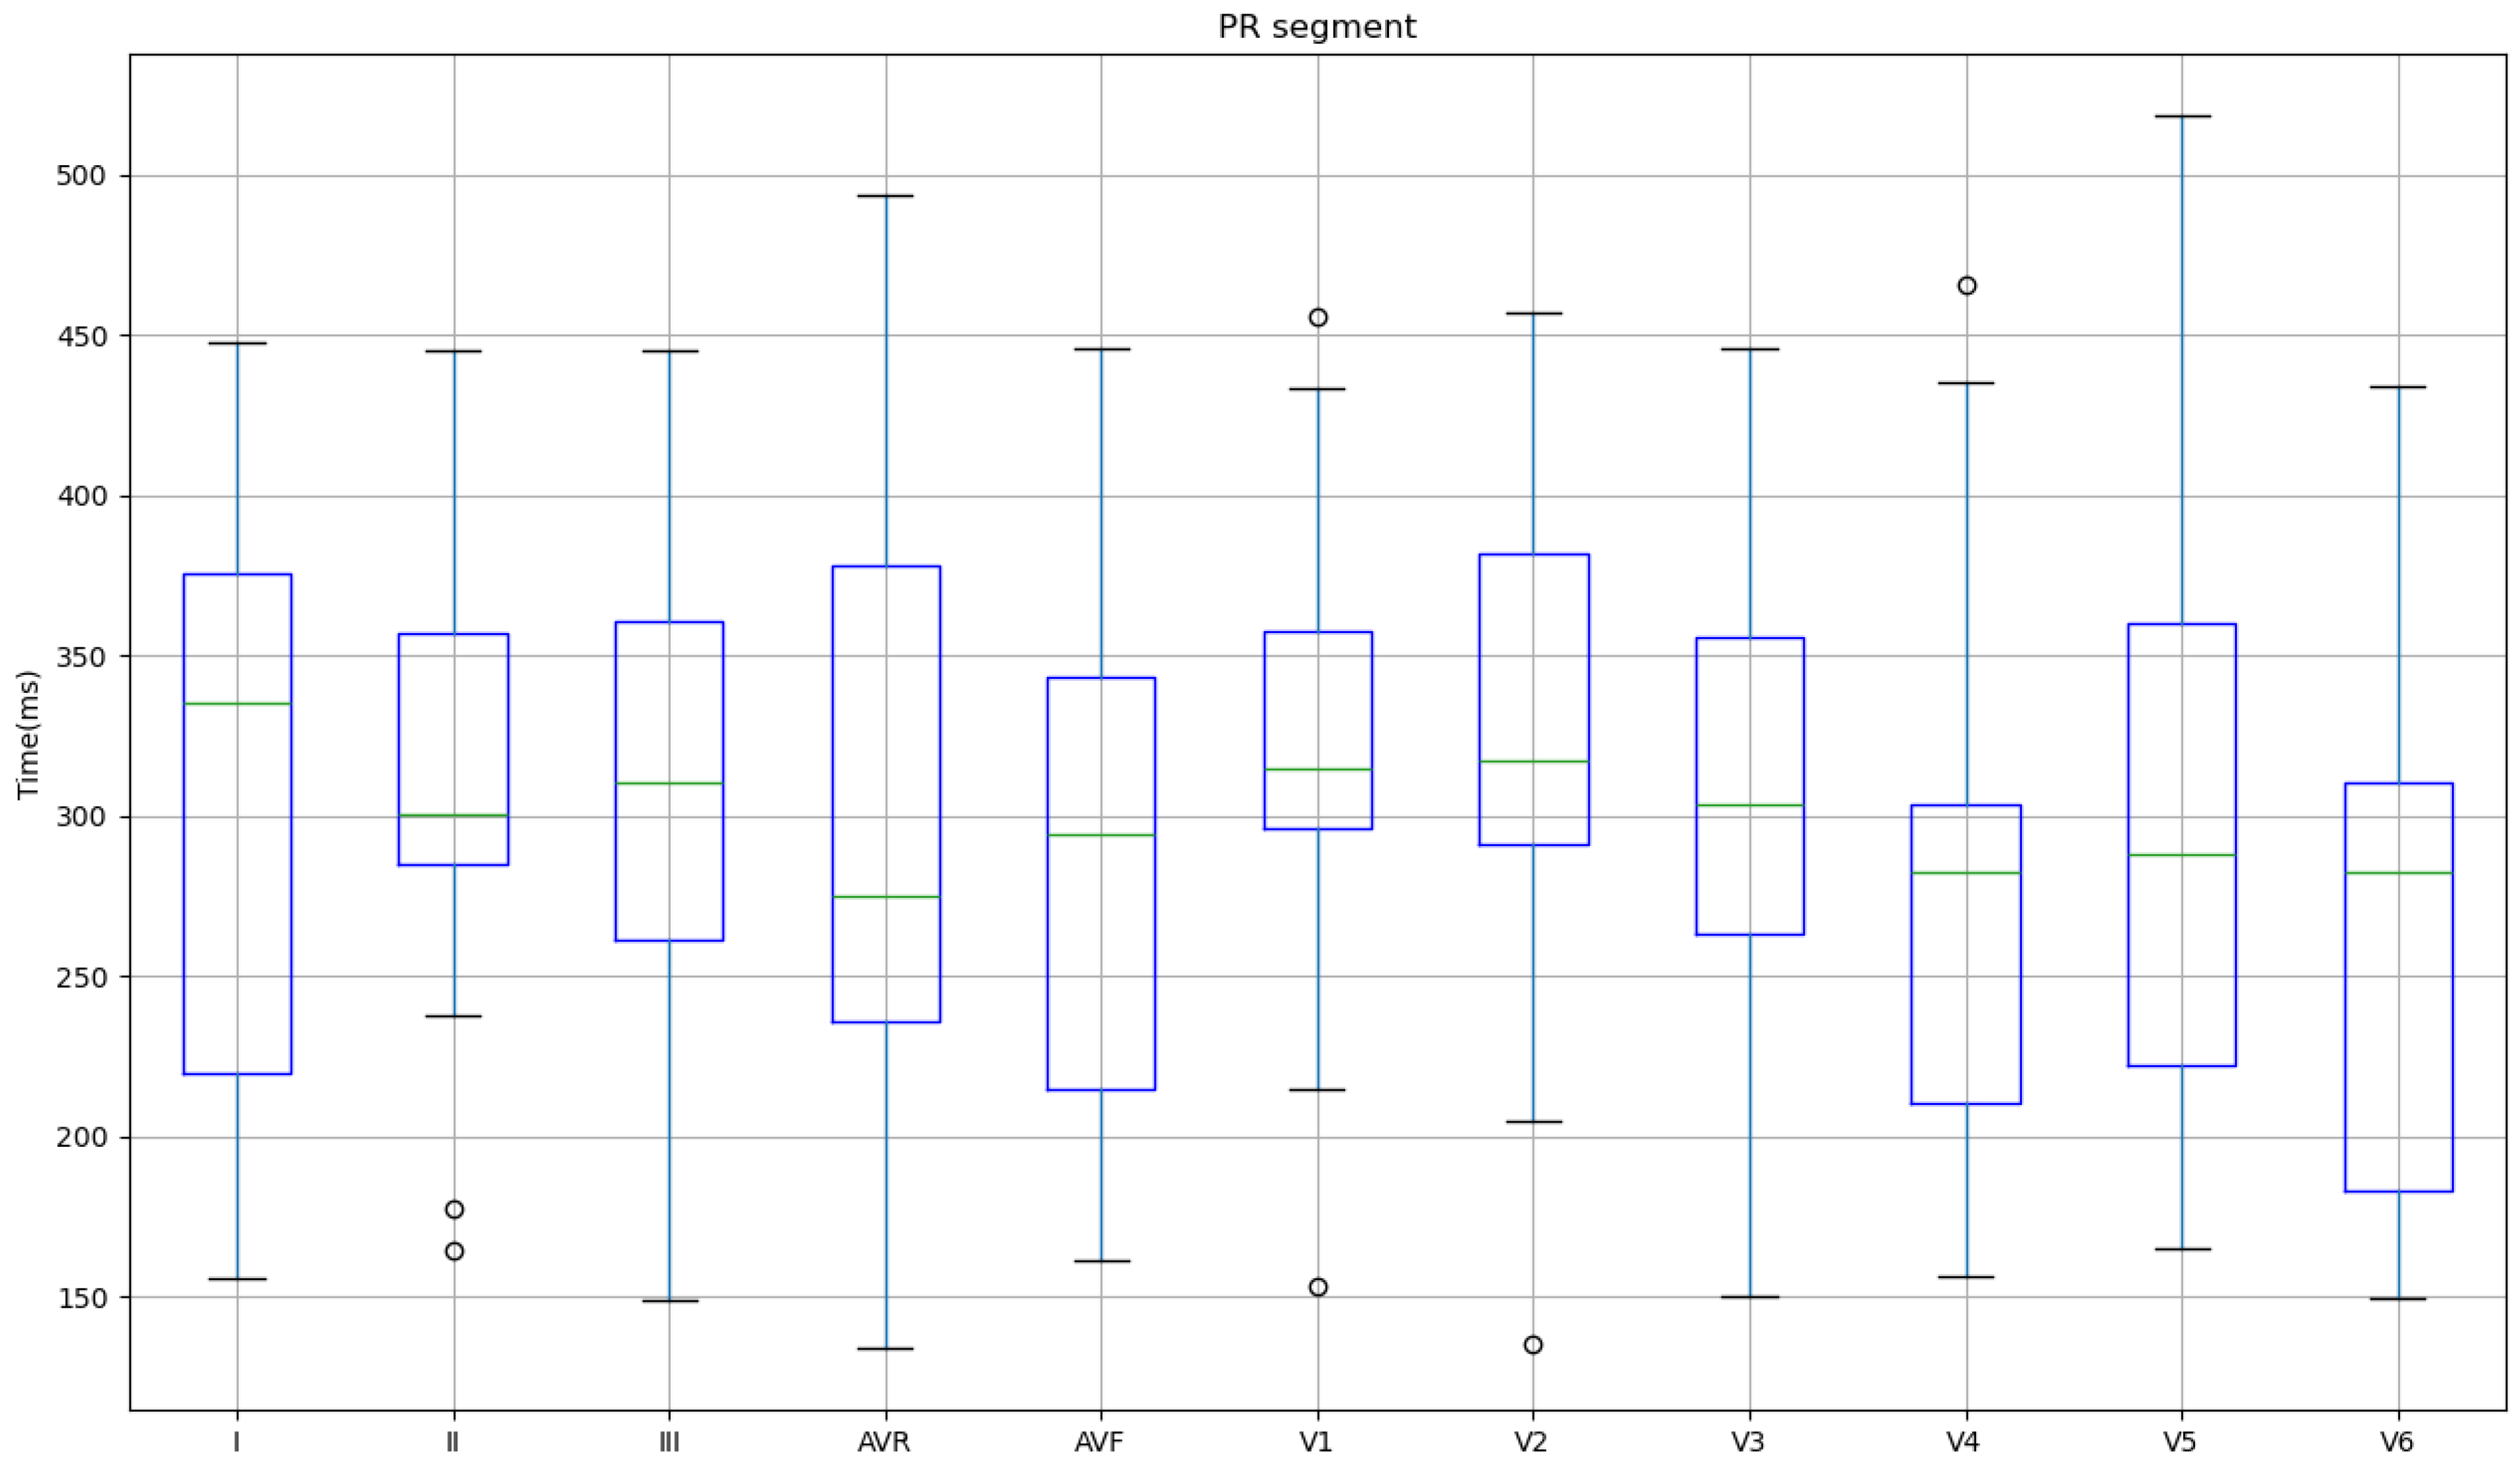
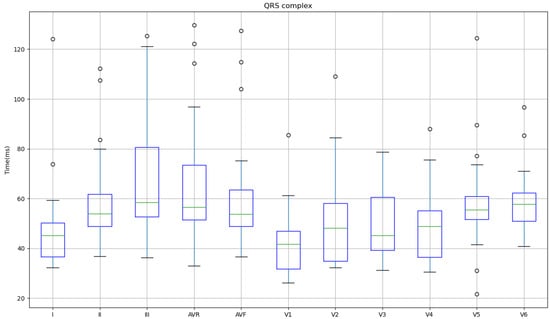
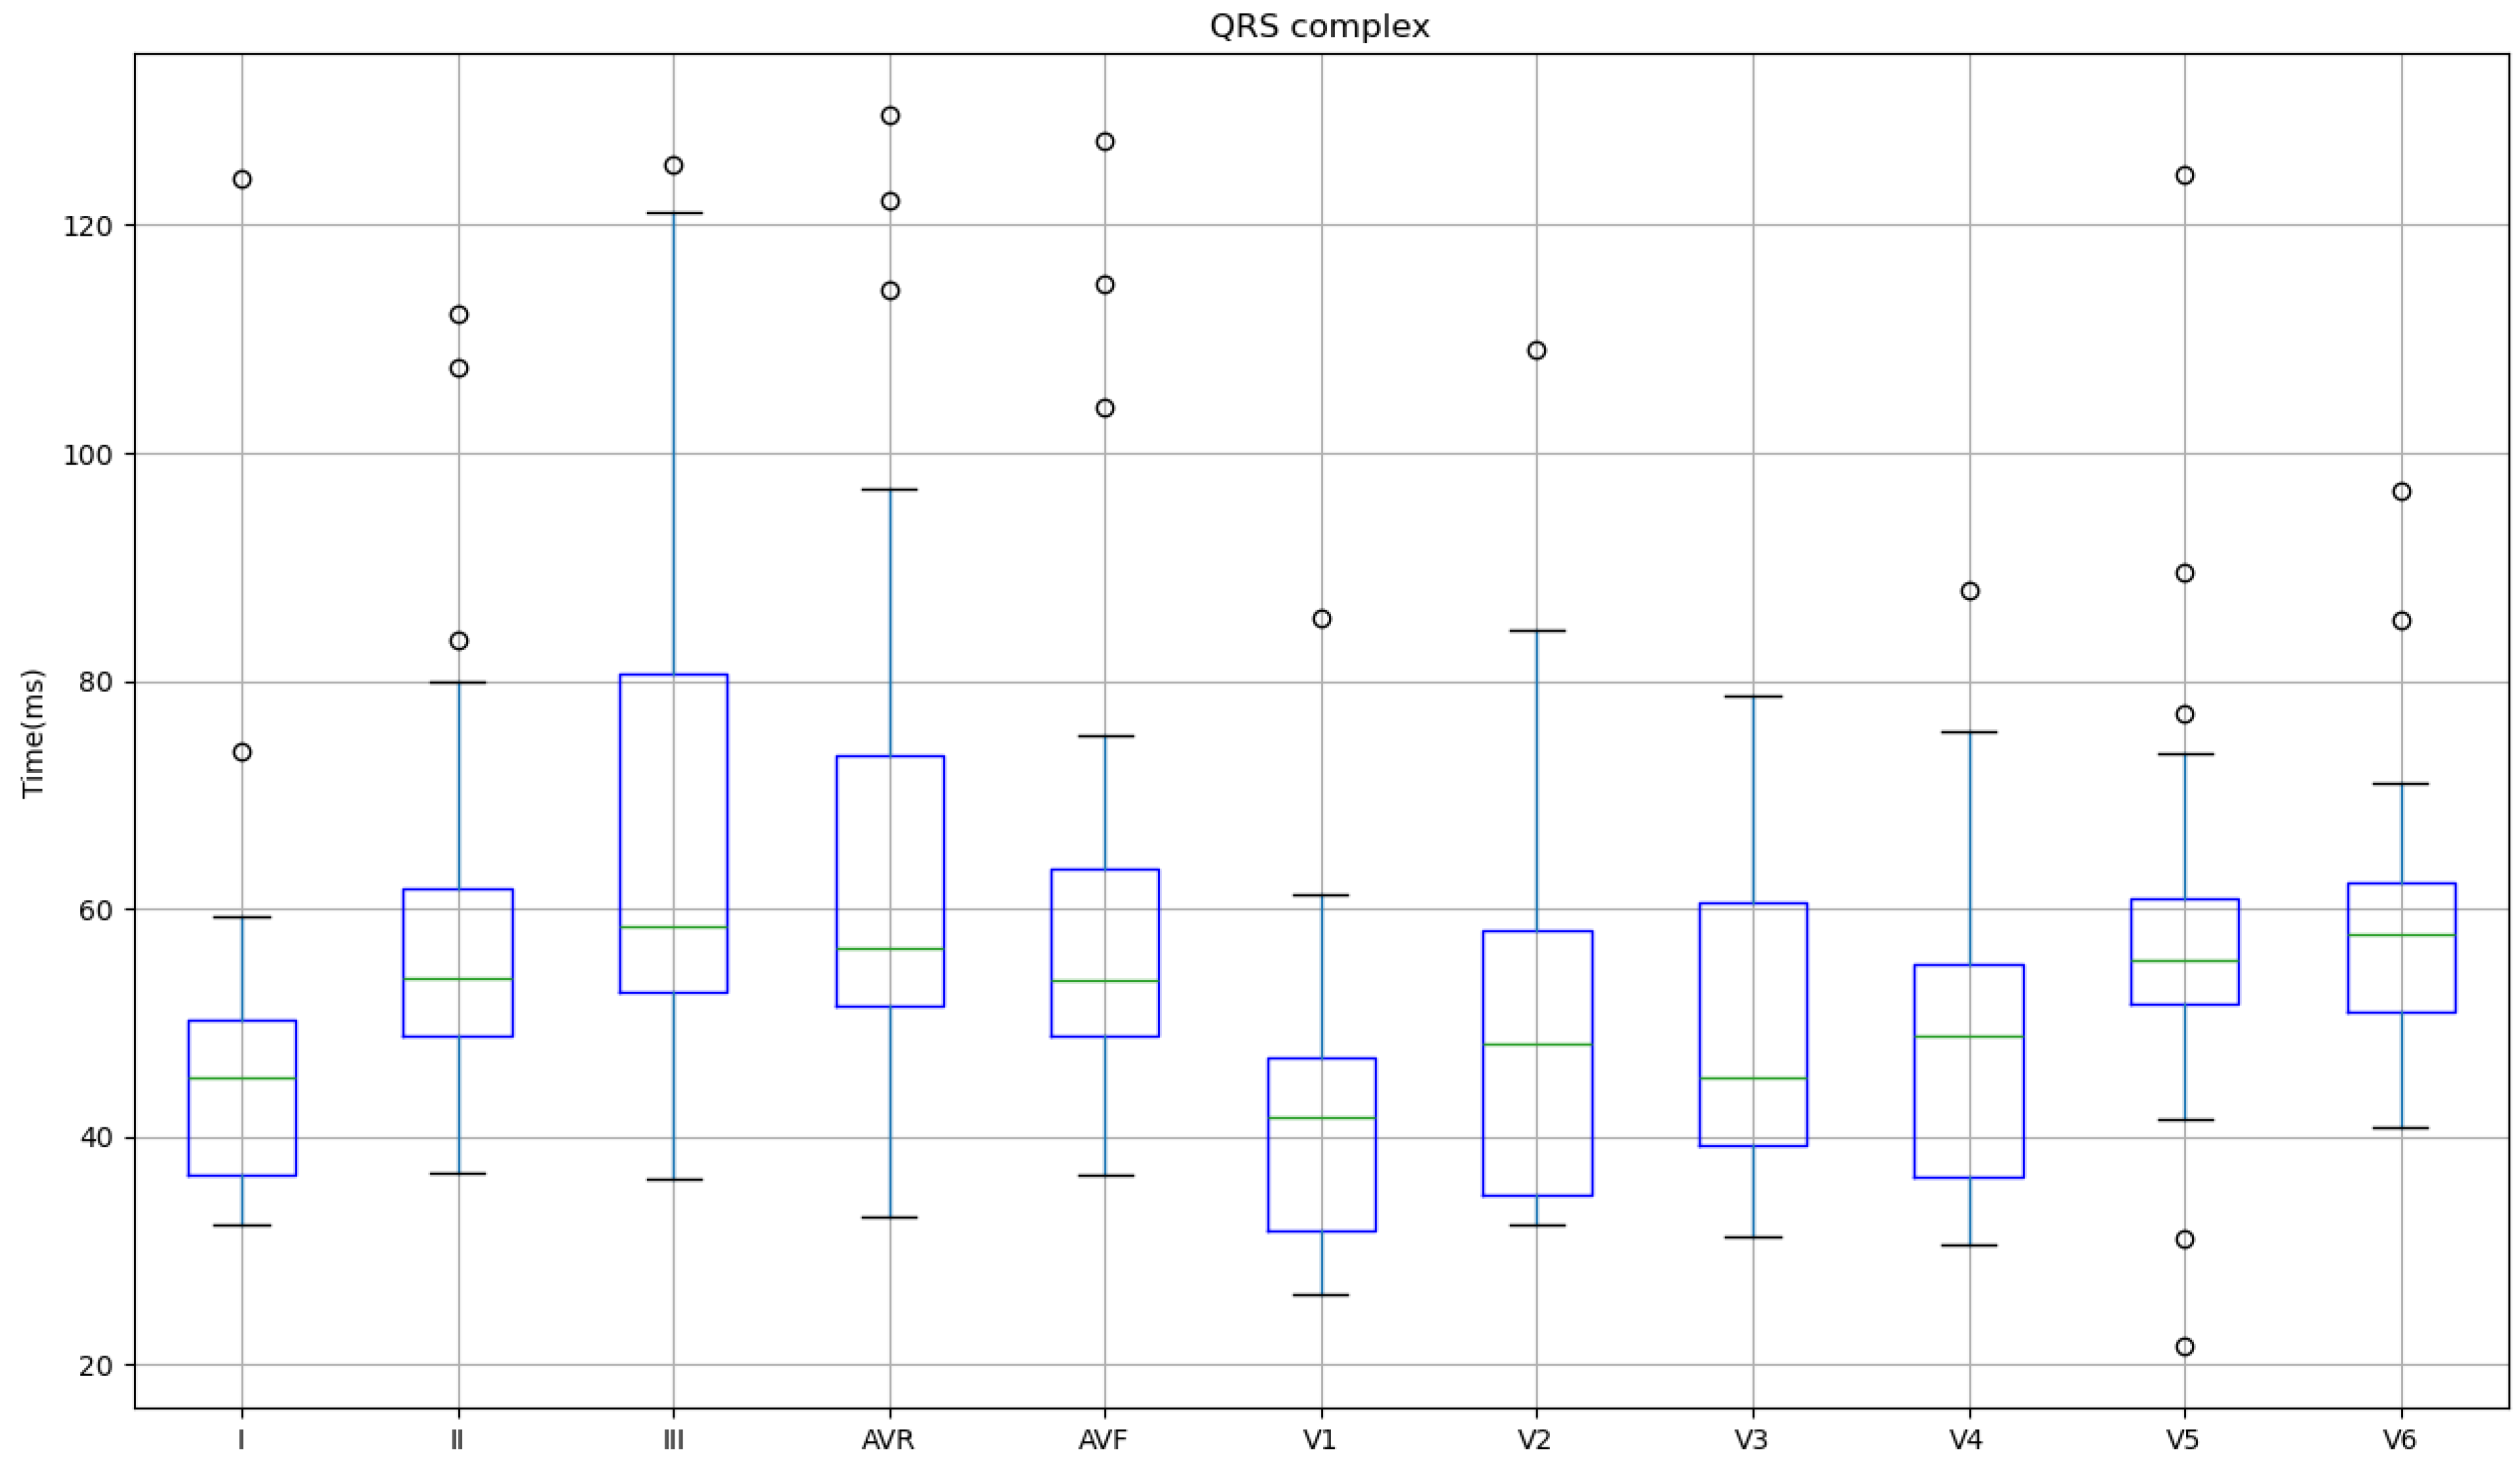
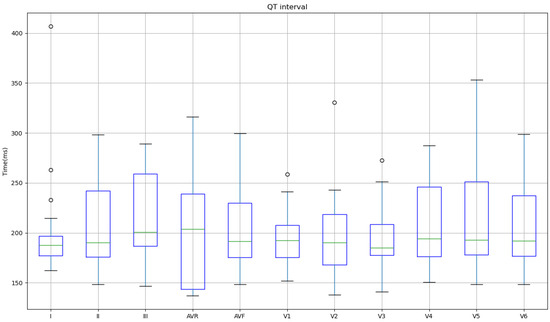
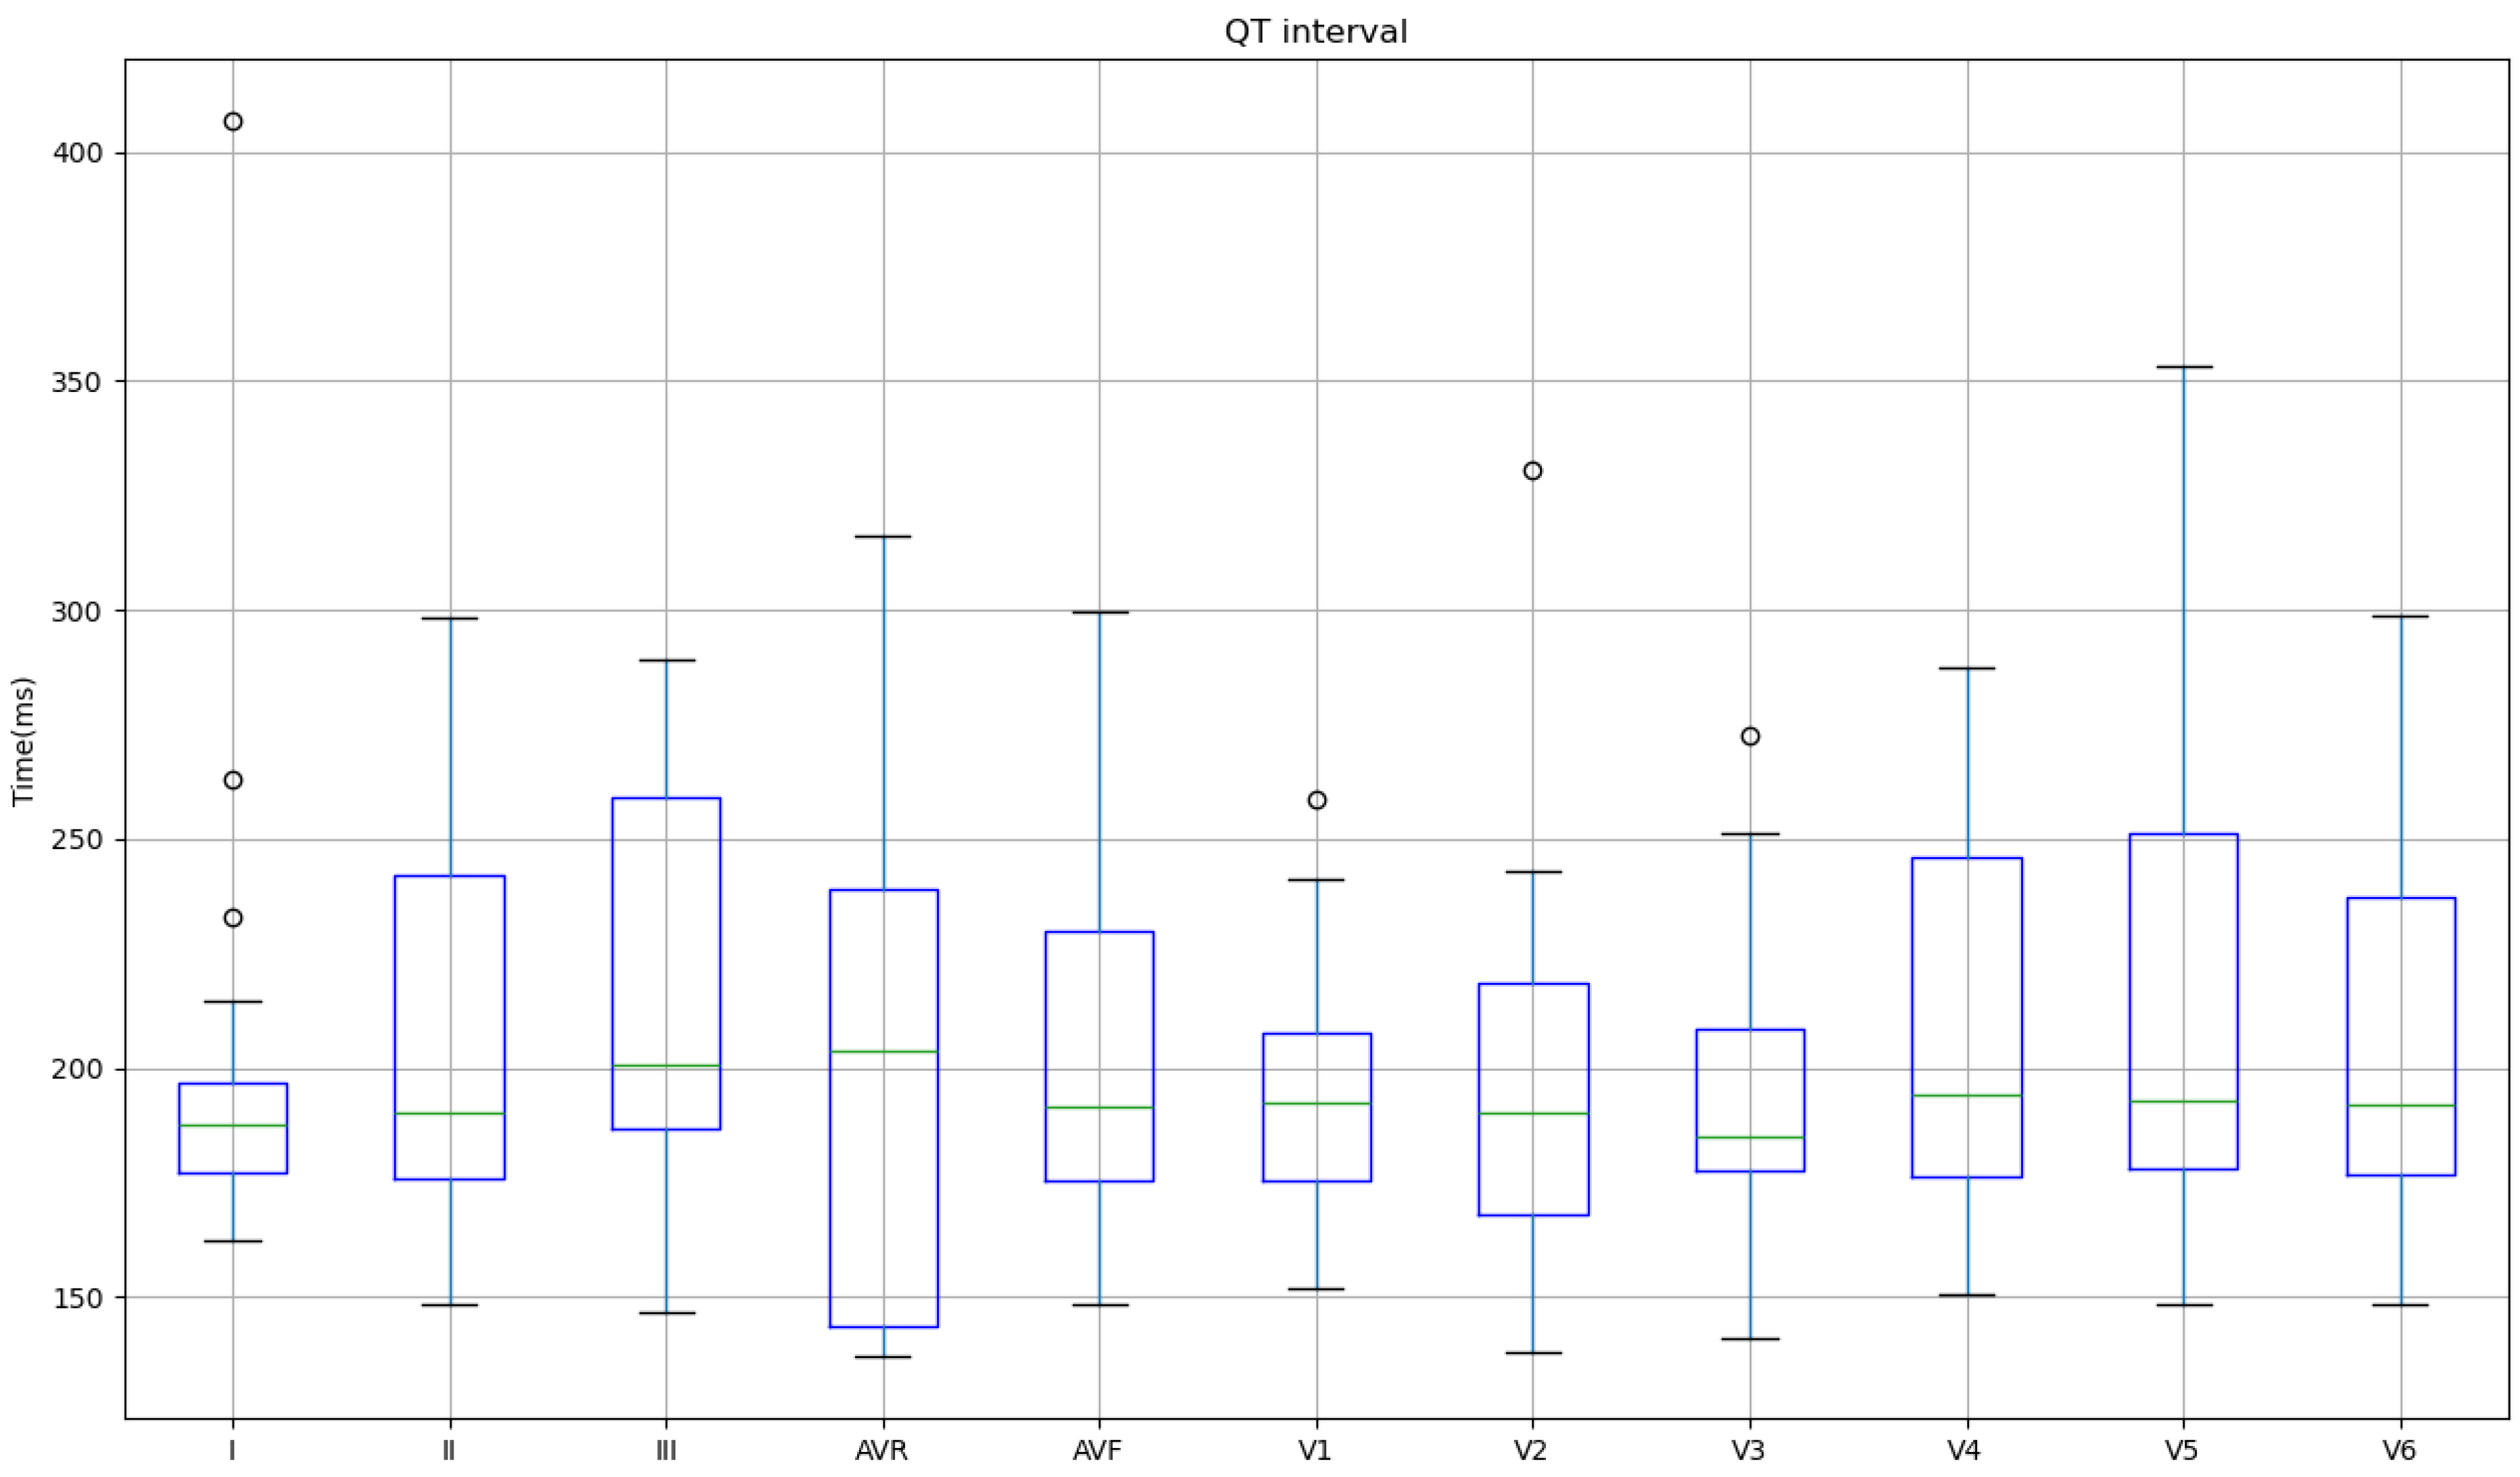
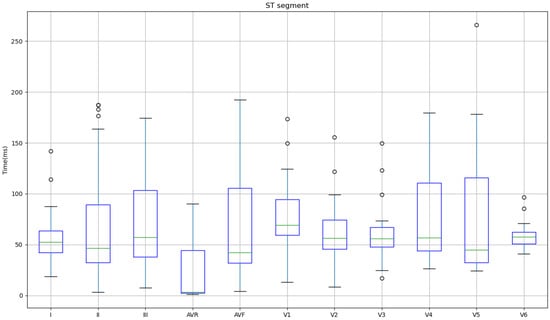
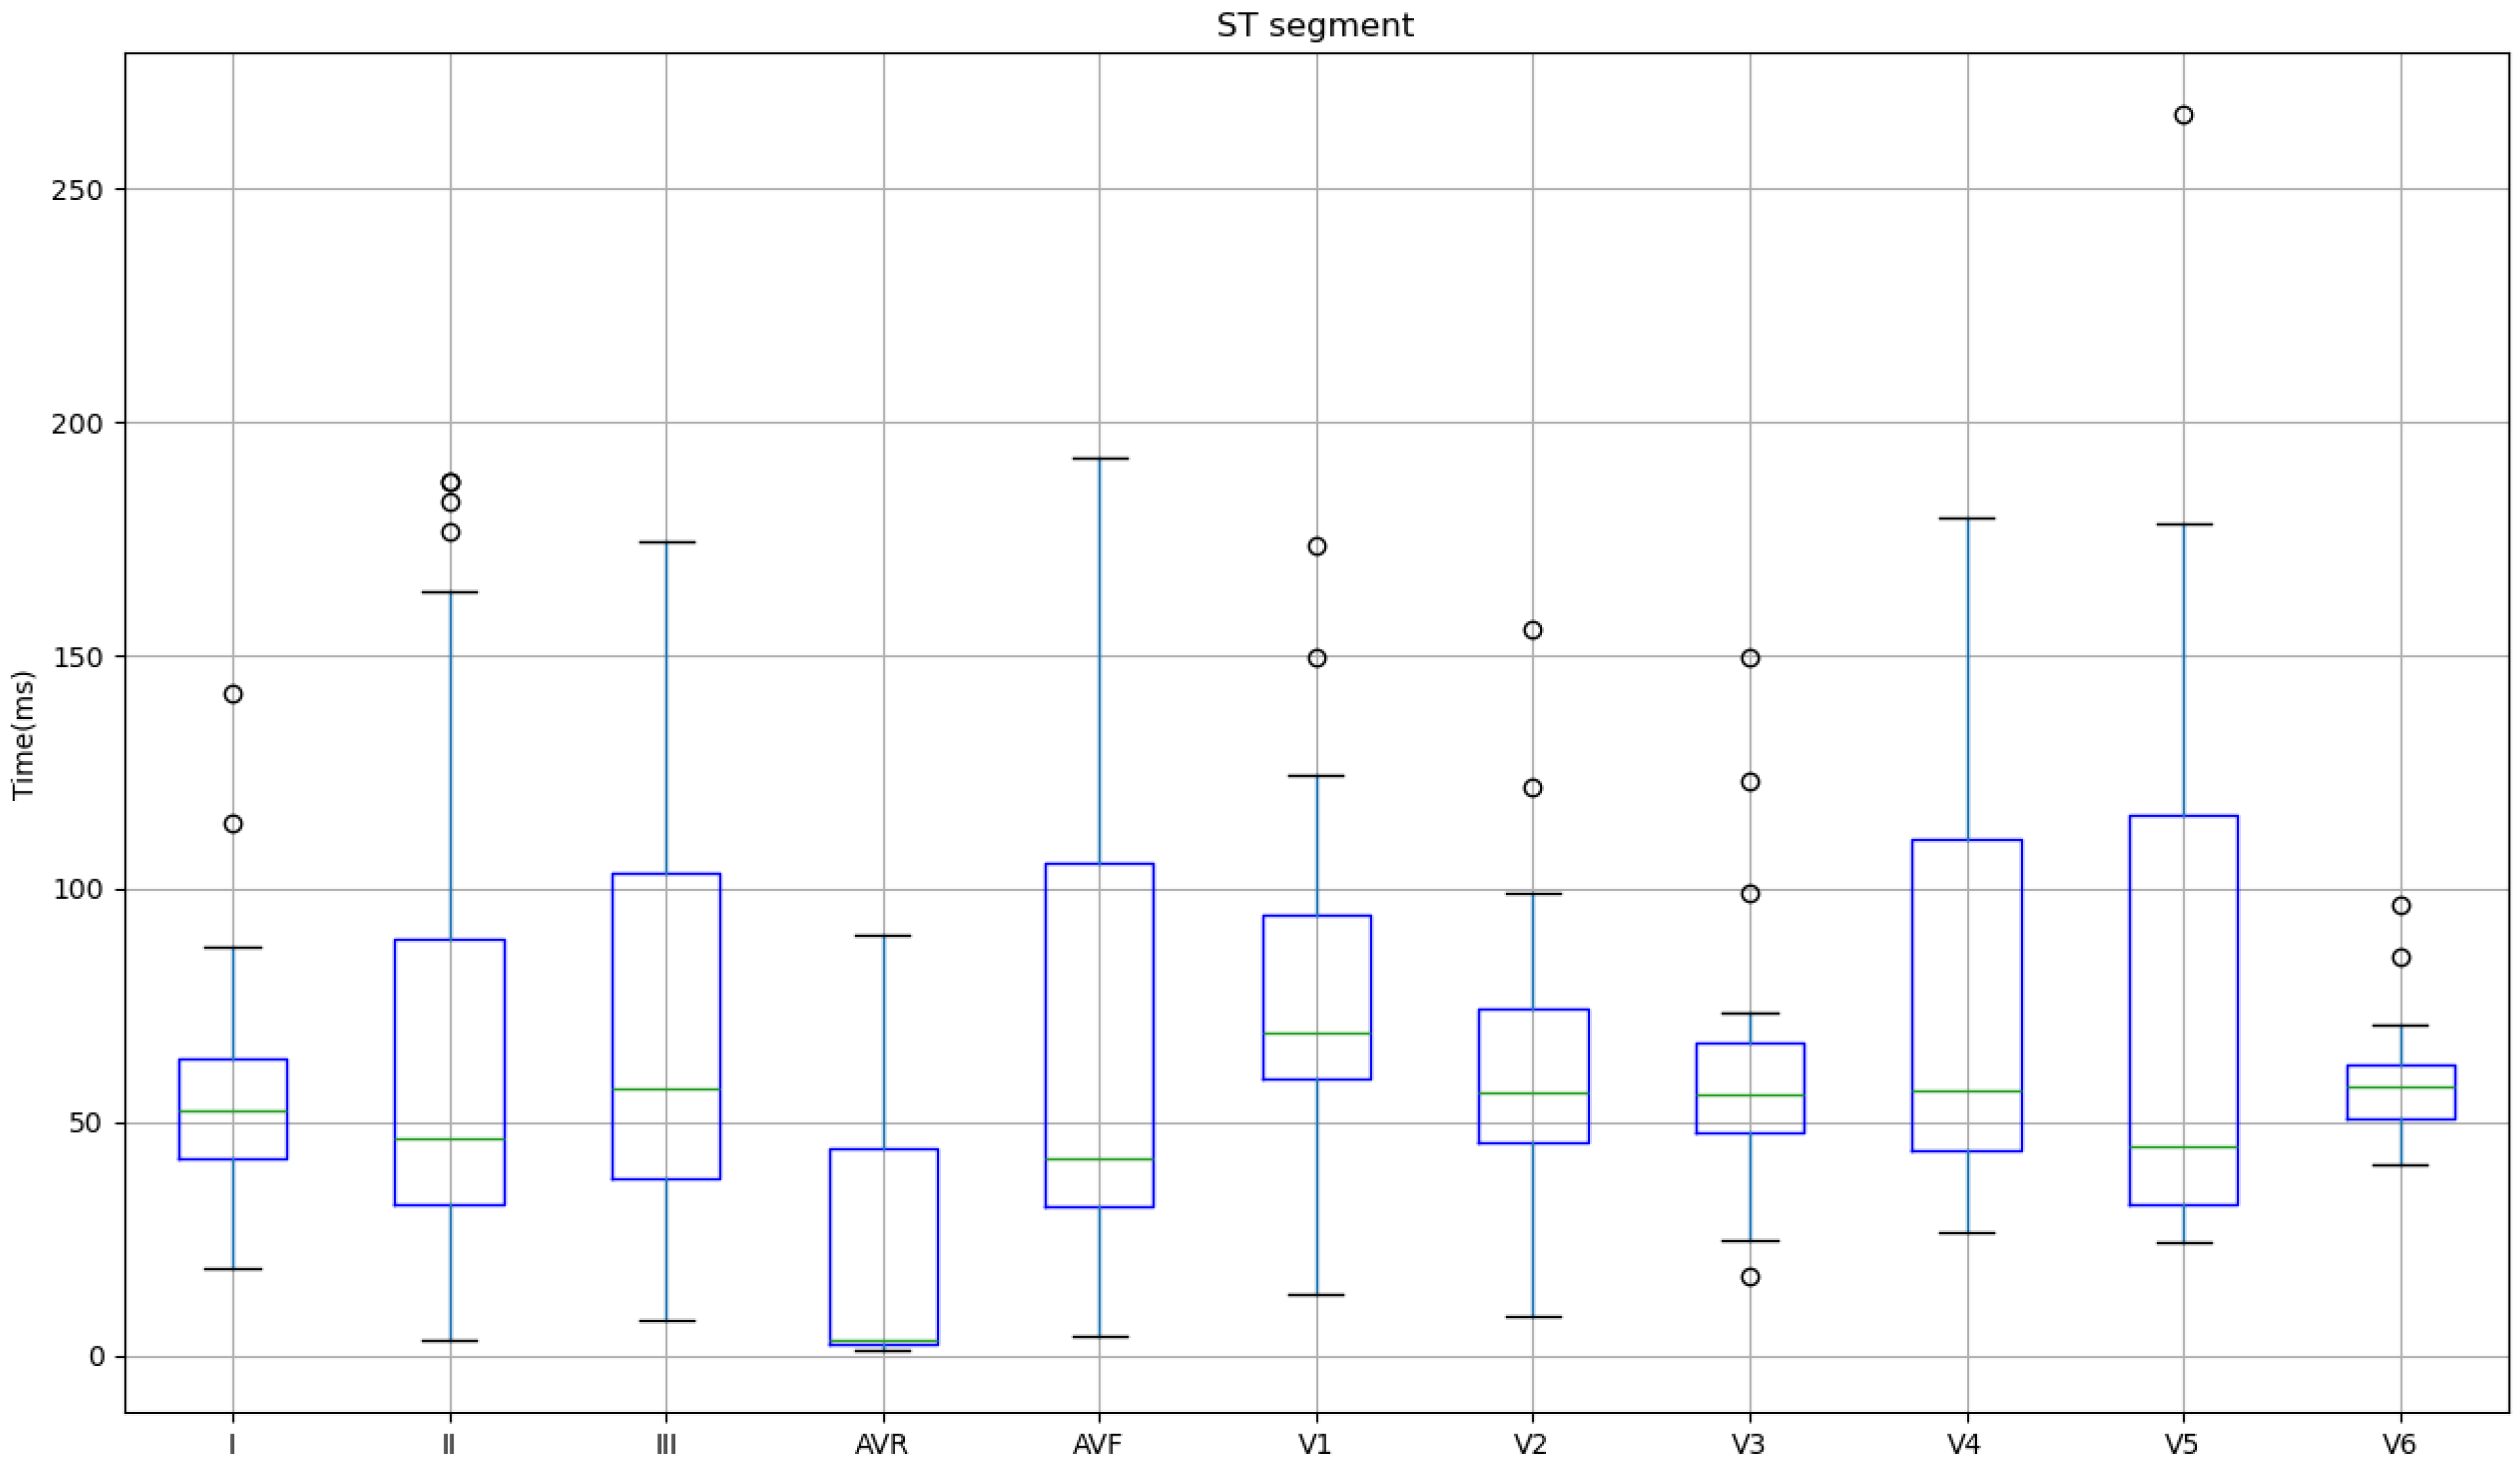
Figure 9, Figure 10, Figure 11, Figure 12 and Figure 13 present the mean and standard deviation of the PR interval (Figure 9), PR segment (Figure 10), QRS complex (Figure 11), QT segment (Figure 12), and ST segment (Figure 13) for each lead, in comparison with the signals obtained from the reference ECG (ECG_REF).
Figure 9.
Mean and standard deviation of the PR interval for each lead in relation to the signals obtained on the ECG_REF.
Figure 10.
Mean and standard deviation of the PR segment for each lead in relation to the signals obtained on the ECG_REF.
Figure 11.
Mean and standard deviation of the QRS complex for each lead in relation to the signals obtained on the ECG_REF.
Figure 12.
Mean and standard deviation of the QT segment for each lead in relation to the signals obtained on the ECG_REF.
Figure 13.
Mean and standard deviation of the ST segment for each lead in relation to the signals obtained on the ECG_REF.
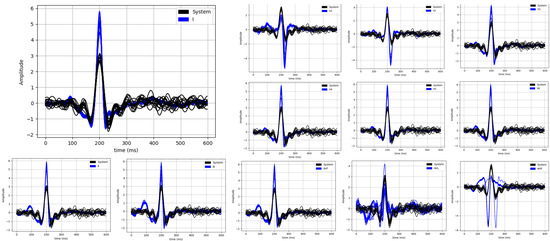
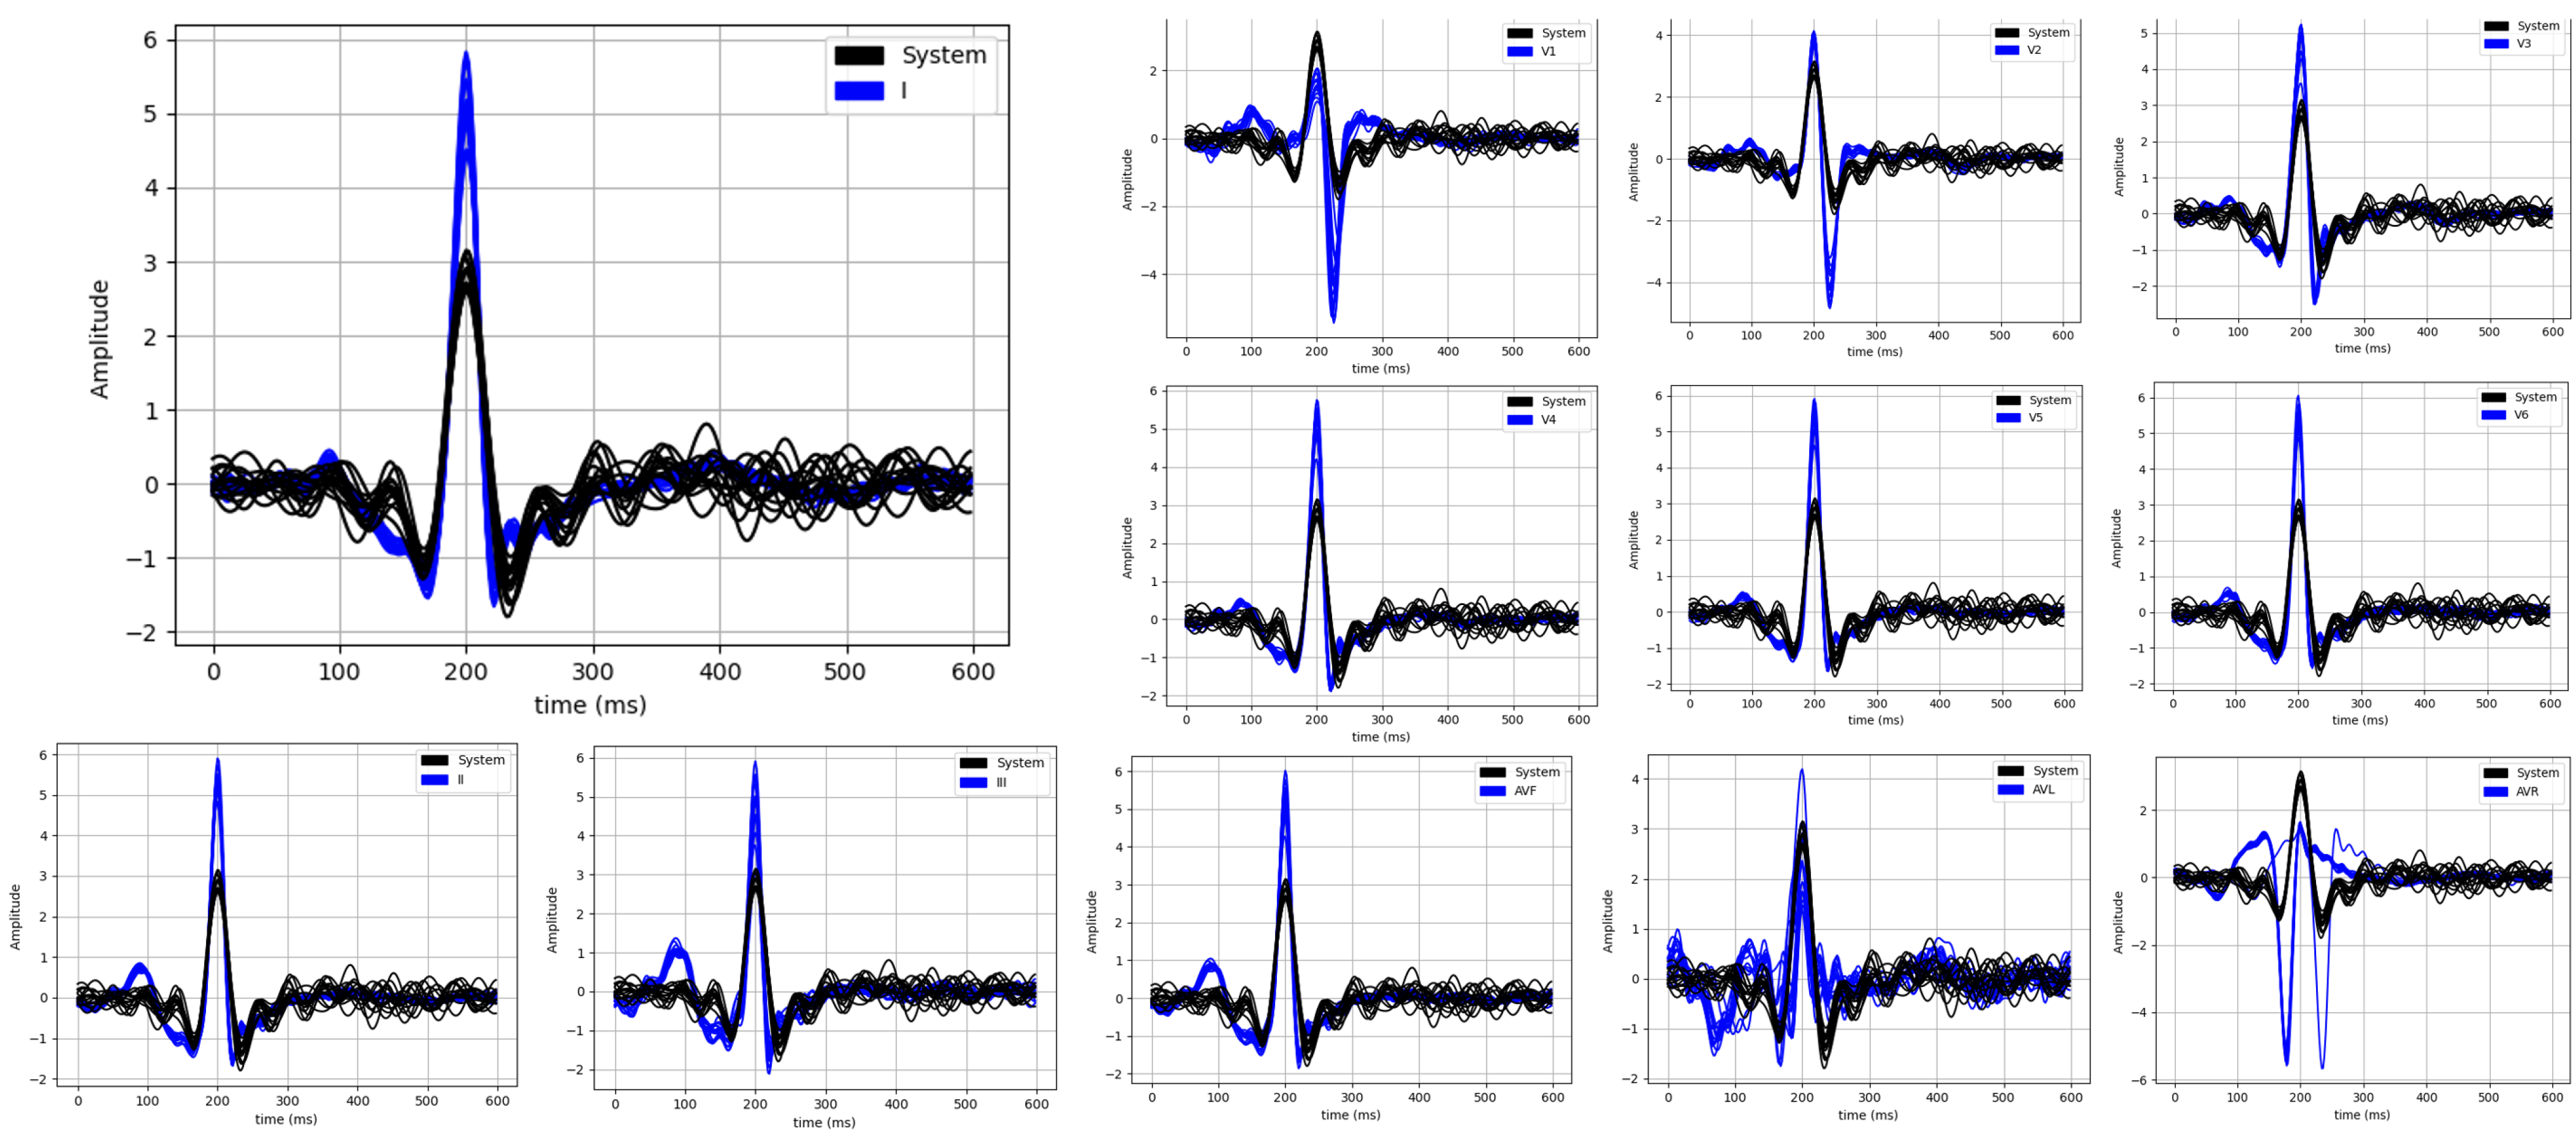
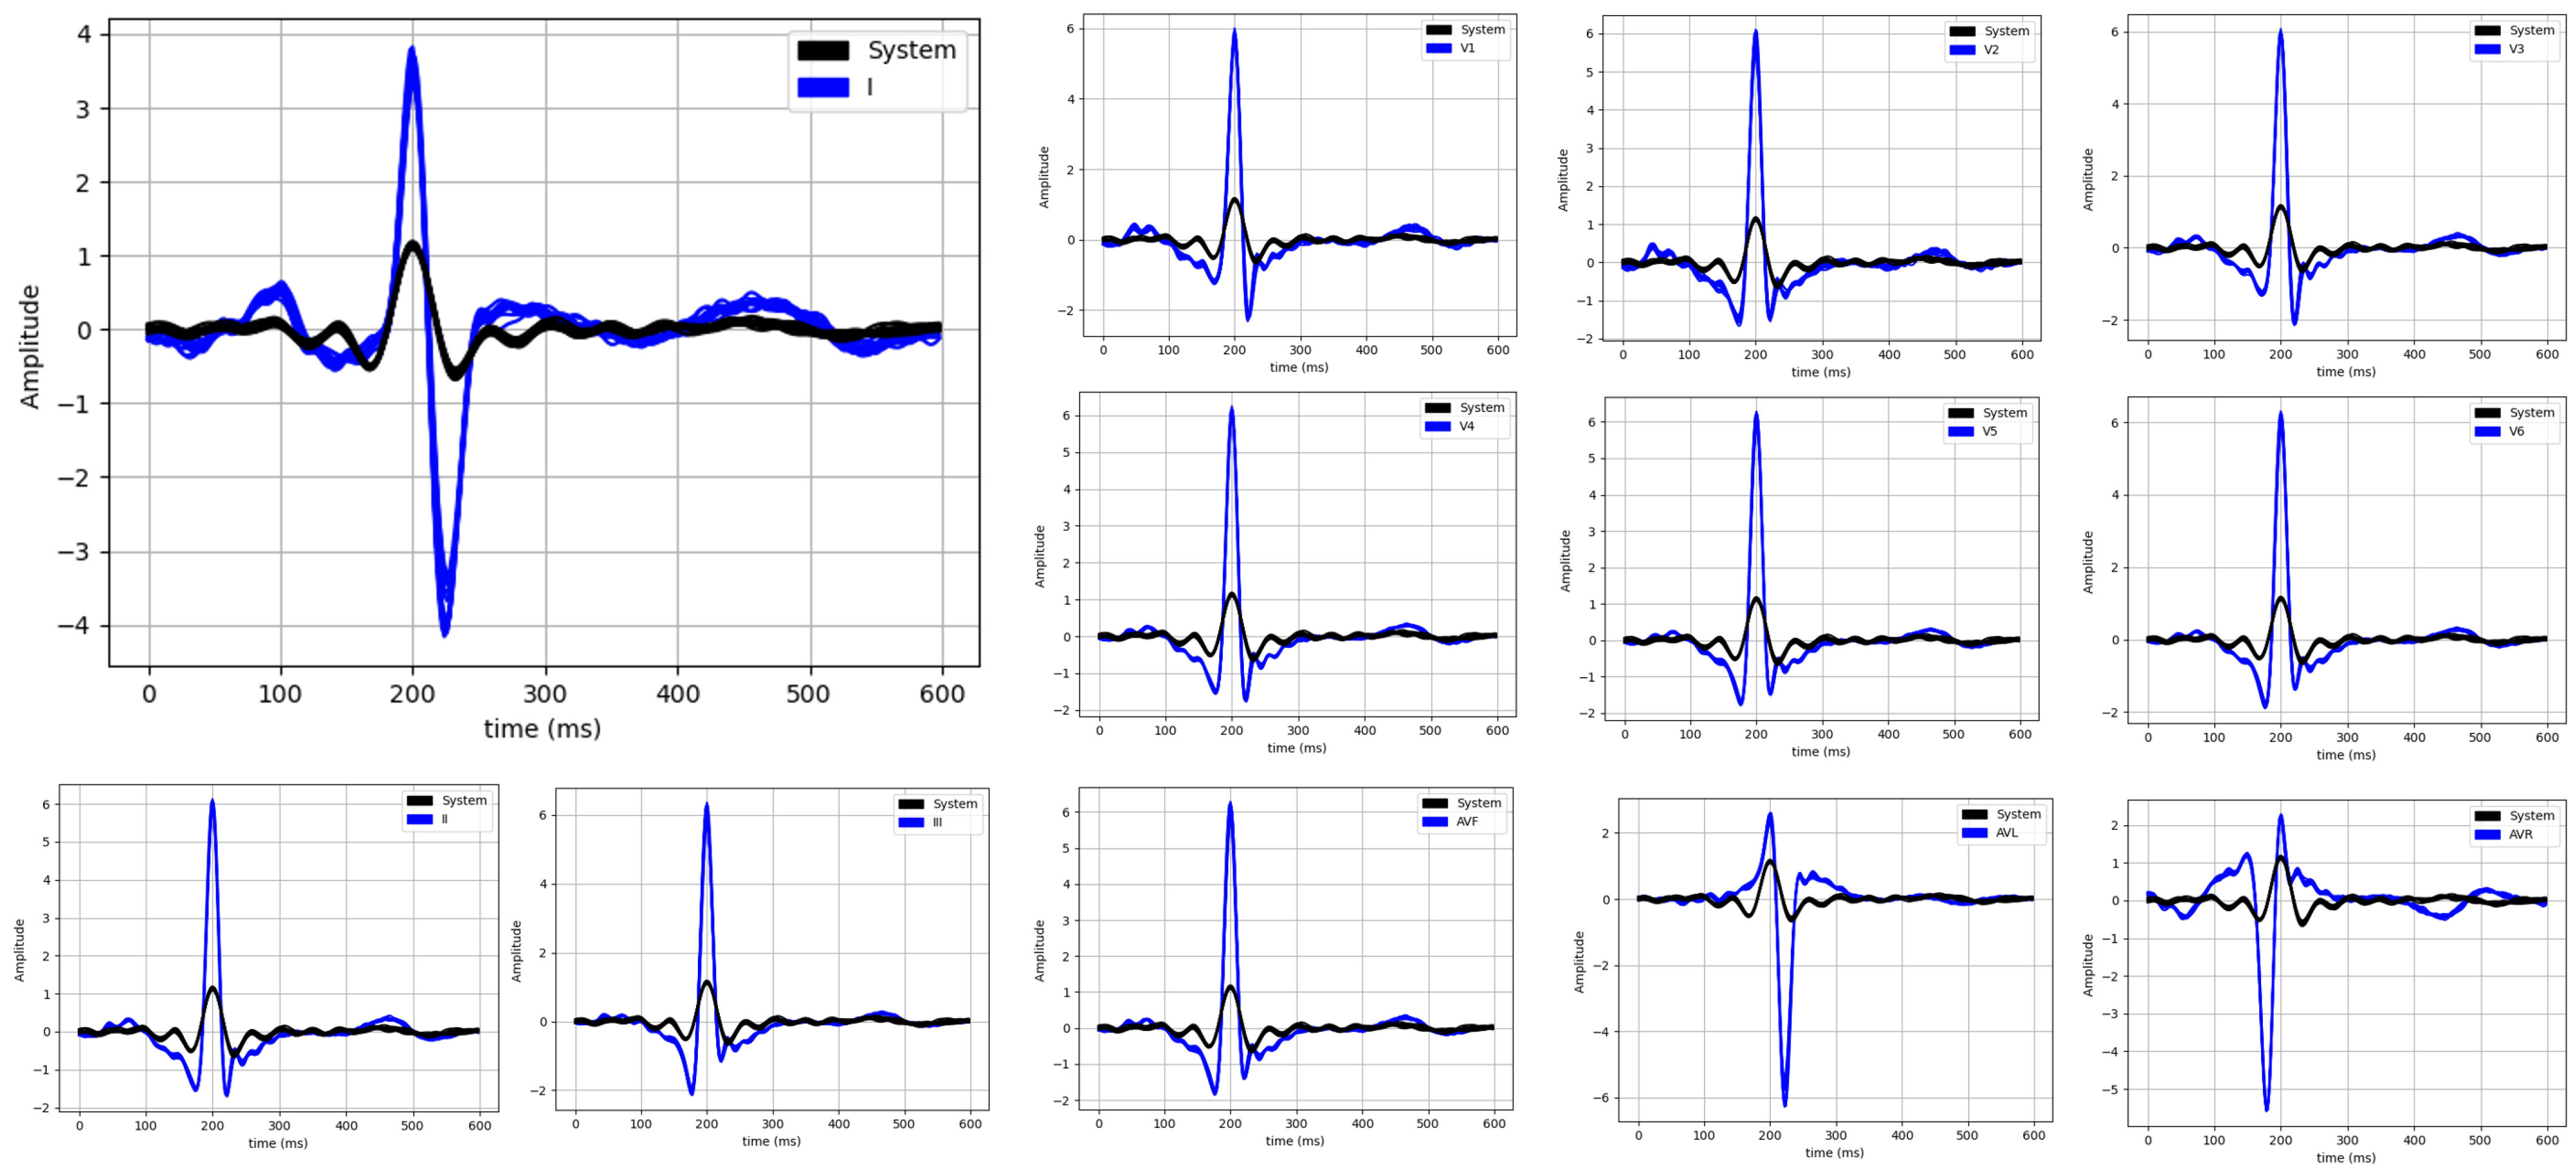
In Figure 14 and Figure 15, we show examples of the waveforms of individuals with the highest and lowest similarity values with Lead I. For the entire signal (Figure A1), all the statistical methods pointed to the Lead I derivation as having the highest correlation. Both DTW and PCC showed greater similarity for the V4 derivation when analysing the correlation of the PQRST complexes (Figure A2), with Lead I as the second most similar, and for the cosine distance and NRMSE methods, Lead I prevails as the most correlated. Because Lead I and the V4 derivation are more morphologically similar, Lead I still prevails as the most correlated. The analysis for the study with the PQ complexes (Figure A3) also favours Lead I, except in the PCC method, which points to the V6 derivation as having the highest correlation. However, when the ST complex (Figure A4) is analysed, none of the methods point to Lead I, and this may be because most of the ECG_EXP recordings do not show ST peaks, which hinders their identification and correlation with Lead I.
Figure 14.
Comparison of the signals obtained in each derivation of the ECG_REF signal with the ECG_EXP signal, using the subject that obtained the greatest similarity with Lead I by the cosine distance method.
Figure 15.
Comparison of the signals obtained in each derivation of the ECG_REF signal with the ECG_EXP signal, using the subject that obtained the least similarity with Lead I by the cosine distance method.
4.4. HRV Analysis in Aortic Stenosis Valve Replacement
Aortic valve stenosis is one of the most prevalent structural heart diseases in the elderly and often requires surgical intervention. In addition to the haemodynamic changes caused by the obstruction of ventricular ejection, aortic stenosis is associated with alterations in cardiac autonomic modulation, which may persist or change after valve replacement [26]. HRV analysis has proven to be a sensitive tool for assessing autonomic modulation in both physiological and pathological contexts.
In this case study, we analysed the autonomic responses of two patients undergoing aortic valve replacement surgery. Through the extraction of linear, nonlinear, and morphological features from the ECG signal, we aimed to characterise and compare pre- and postoperative states, focusing on indicators of risk, recovery, and physiological complexity.
Table 3 presents the extracted HRV metrics for both patients. A comparison of these values reveals physiologically relevant changes following surgery [21,27].
Table 3.
HRV linear and nonlinear metrics for patients 0001 and 0002 before and after surgery.
In this context, a favourable response to surgery is characterised by increased global and short-term HRV indices (e.g., SDNN, RMSSD, pNN50), reduction in stress index, and higher nonlinear complexity (SampEn, ApEn, balanced DFA-). These changes suggest improved vagal modulation, autonomic balance, and enhanced physiological adaptability. Conversely, a decrease in variability metrics, an increase in sympathetic dominance (e.g., higher SI), and reduced entropy may indicate an unfavourable response. Patient 0001 showed a significant postoperative increase in the mean RR interval (from 805.7 ms to 960.9 ms), indicating a decrease in heart rate. There was a marked increase in both global HRV (SDNN: 15.0 to 42.4 ms) and short-term parasympathetic modulation (RMSSD: 7.4 to 27.2 ms; pNN50: 0% to 5.1%). The stress index decreased slightly, reflecting a potential rebalancing of autonomic tone. Nonlinear near metrics showed a favourable trend, increased SampEn (from 1.31 to 1.44) and reduced DFA- (from 1.34 to 1.26), suggesting greater physiological complexity and adaptability.
In contrast, patient 0002 exhibited an unfavourable response. Although MeanNN increased (from 868.8 ms to 1043.7 ms), variability indicators decreased significantly: SDNN from 43.4 to 25.2 ms, RMSSD from 48.3 to 18.0 ms, and pNN50 from 31.9% to 1.4%. The SI increased (from 49.3 to 59.1), indicating sympathetic dominance. Nonlinear near metrics also declined (SampEn from 1.85 to 1.39), pointing to reduced complexity and possible autonomic dysfunction or acute inflammatory response to surgery.
Morphological analysis (Figure 4 and Figure 5) revealed differences in the QRS complex and T-wave between time points, suggesting electrophysiological alterations induced by the procedure.
Tachograms (Figure 6) reinforce these findings with increased variability in patient 0001 postoperatively and reduced dispersion in patient 0002.
Poincaré plots (Figure 7) further confirm these trends. Patient 0001 exhibited increased SD1 (5.2 to 19.2 ms) and SD2 (20.4 to 56.3 ms), indicating autonomic recovery. Patient 0002, however, showed a sharp reduction in both parameters (SD1 from 34.1 to 12.7 ms; SD2 from 50.8 to 33.0 ms), suggesting decreased complexity and impaired autonomic control.
These findings demonstrate the utility of HRV as a tool for monitoring autonomic status in the postoperative context, with the potential to identify patients at risk of complications or with incomplete recovery. Individualised analysis, as illustrated in these cases, reveals patterns that may not be evident in population-based analyses, reinforcing the value of personalised assessment [28,29,30].
It is important to note that due to the sensitive nature of clinical data and patient privacy constraints, detailed clinical information (such as comorbidities, medication, or perioperative complications) was not fully available for analysis. However, according to the clinical staff, both patients corresponded to comparable and representative surgical scenarios. The surgical procedures were performed on the same day, with preoperative recordings acquired one day prior to surgery and postoperative recordings collected five days after the intervention.
The clinical team confirmed that physiological changes between pre- and postoperative states were expected and that the trends observed in the HRV metrics are consistent with clinical observations. Therefore, the differences identified in this study should be interpreted as exploratory indicators of individualised autonomic responses rather than definitive clinical conclusions.
5. Conclusions
This work advances the development of unobtrusive ECG monitoring by validating a toilet-seat-integrated system that captures cardiac signals from the thighs. Building on prior demonstrations of feasibility [4,31], we explored three critical aspects: signal quality, morphological correlation with clinical ECGs, and applicability to autonomic assessment via HRV analysis.
First, signal quality was quantitatively evaluated using established Signal Quality Index (SQI) metrics. From the 32 healthy volunteers, 56.25% of the recordings obtained from the experimental system were classified as excellent. Although motion artefacts contributed to an average signal distortion event (SDE) rate of 7.06 ± 6.64%, the majority of signals were deemed clinically usable. This confirms the robustness of the system in realistic usage conditions.
Second, we assessed the morphological fidelity of the thigh-acquired signals by comparing them to standard 12-lead ECGs. Correlation analysis revealed that Lead I exhibited the strongest similarity, with over 62.5% of tests confirming significant agreement. This finding supports the targeted use of this system for clinical features that manifest in the Lead I vector, such as atrial fibrillation or ST-segment abnormalities.
Third, we demonstrated the system’s utility in clinical follow-up by performing HRV analysis in two patients undergoing surgical correction of aortic stenosis. Patient 0001 showed improved postoperative autonomic function, with increased RR intervals, elevated SDNN and RMSSD, and higher entropy, indicating healthier variability and adaptability. In contrast, patient 0002 exhibited postoperative autonomic suppression, with reduced variability and complexity—potentially flagging complications or inflammatory stress. Morphological analysis (QRS and T-wave changes), as well as nonlinear measures (Poincaré plots, DFA, and SampEn), provided further insights into the divergent recovery patterns.
Importantly, these findings highlight the potential of passive toilet-based ECG monitoring as a powerful tool in cardiac rehabilitation. Continuous or high-frequency HRV and ECG assessments can support individualised rehabilitation plans, early detection of autonomic imbalance, monitoring of exercise tolerance, and rapid identification of postoperative deterioration. By reducing the need for wearable sensors and improving adherence through fully unobtrusive acquisition, this system aligns with modern paradigms of home-based, patient-centred rehabilitation and long-term management of chronic cardiovascular conditions. This clinical analysis should be interpreted as a preliminary feasibility case study, since only two hospitalised patients with severe aortic stenosis were included. Recruitment and data acquisition in this context are particularly challenging due to the perioperative condition of the patients and the associated clinical and logistical constraints. Therefore, the observed postoperative HRV differences cannot be generalised to the broader population and may reflect individual clinical, surgical, or recovery-related factors. Nevertheless, these findings provide an initial indication that thigh-based ECG may capture meaningful autonomic changes in the perioperative setting. A broader characterisation of thigh-based ECG signals across a larger cohort of cardiac patients was presented in our recent work [32], while the present study specifically explores perioperative HRV behaviour and postoperative signal changes.
Future work will address signal denoising, adaptive electrode positioning, and integration with machine learning algorithms for early detection of arrhythmias or decompensation in chronic heart disease. Ultimately, this system could support a wide range of applications, from digital therapeutics to autonomous triage, remote post-surgical care, and structured cardiac rehabilitation programs.
Author Contributions
Conceptualization, A.d.S.S., M.V.C., A.G.d.C. and H.P.d.S.; methodology, software, formal analysis, investigation, resources, writing—original draft preparation, A.d.S.S.; writing—review and editing, A.d.S.S., M.V.C. and H.P.d.S.; supervision, R.J.C., M.V.C. and H.P.d.S. All authors have read and agreed to the published version of the manuscript.
Funding
This work is financed by National Funds through the Portuguese funding agency Fundação para a Ciência e a Tecnologia, I.P. (FCT, https://ror.org/00snfqn58) within projects UID/50014/2025—INESCTEC (https://doi.org/10.54499/UID/50014/2025), UID/50008/2025—Instituto de Telecomunicações (https://doi.org/10.54499/UID/50008/2025) and LA/P/0063/2020, and grant 2022.10245.BDANA (https://doi.org/10.54499/2022.10245.BDANA).
Data Availability Statement
The raw data supporting the conclusions of this article will be made available by the authors on request.
Acknowledgments
The authors would also like to thank OLI—Sistemas Sanitarios S.A. and the team at the Cardiorespiratory Ward of Hospital São João for providing all the resources and support that made this work possible.
Conflicts of Interest
A.G.C. is an employee of OLI—Sistemas Sanitários. OLI Sistemas Sanitários is a commercial company. Its contribution to this study was limited to the initial project concept. The device used in the study, as well as all signal processing and data analyses, were conducted independently by the research team. The company had no involvement in experimental procedures, data collection, or analysis. All other authors declare no competing interests.
Appendix A
Figure A1.
Statistical analysis between the ECG_EXP and ECG_REF with the whole signal: (A) cosine distance; (B) DTW; (C) NRMSE; (D) PCC.
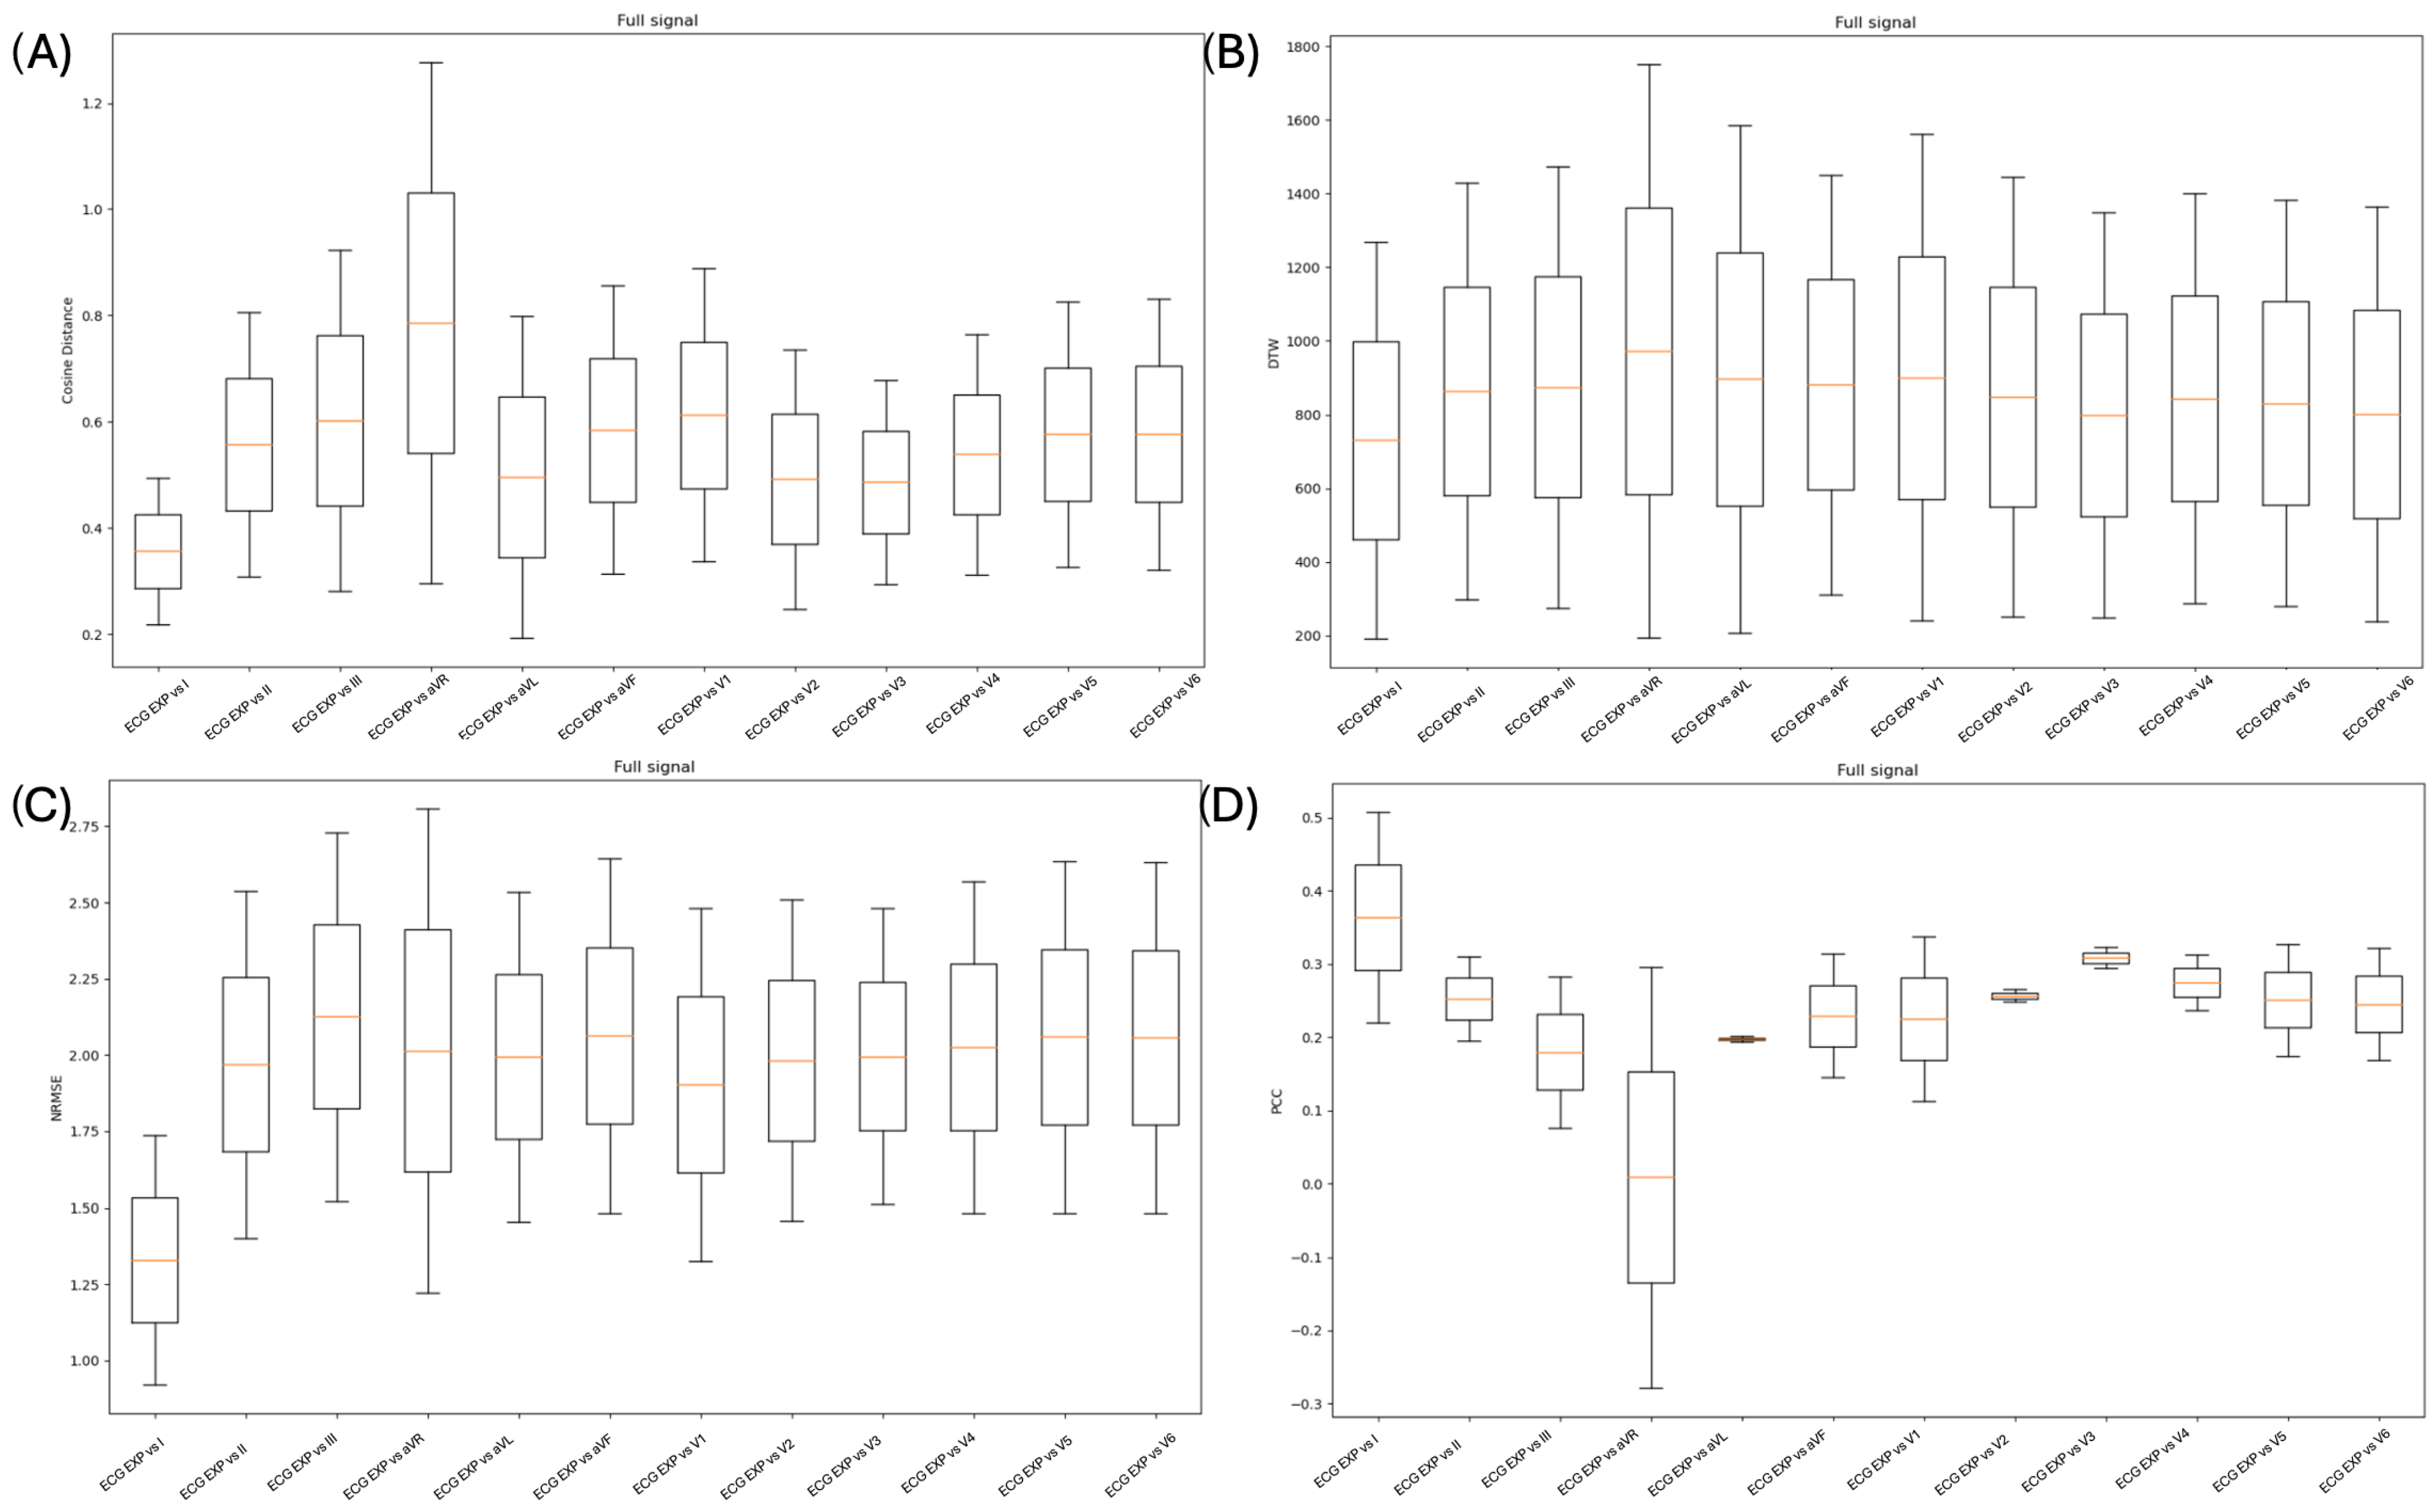
Figure A2.
Statistical analysis between the ECG_EXP and ECG_REF with the PQRST complex: (A) cosine distance; (B) DTW; (C) NRMSE; (D) PCC.
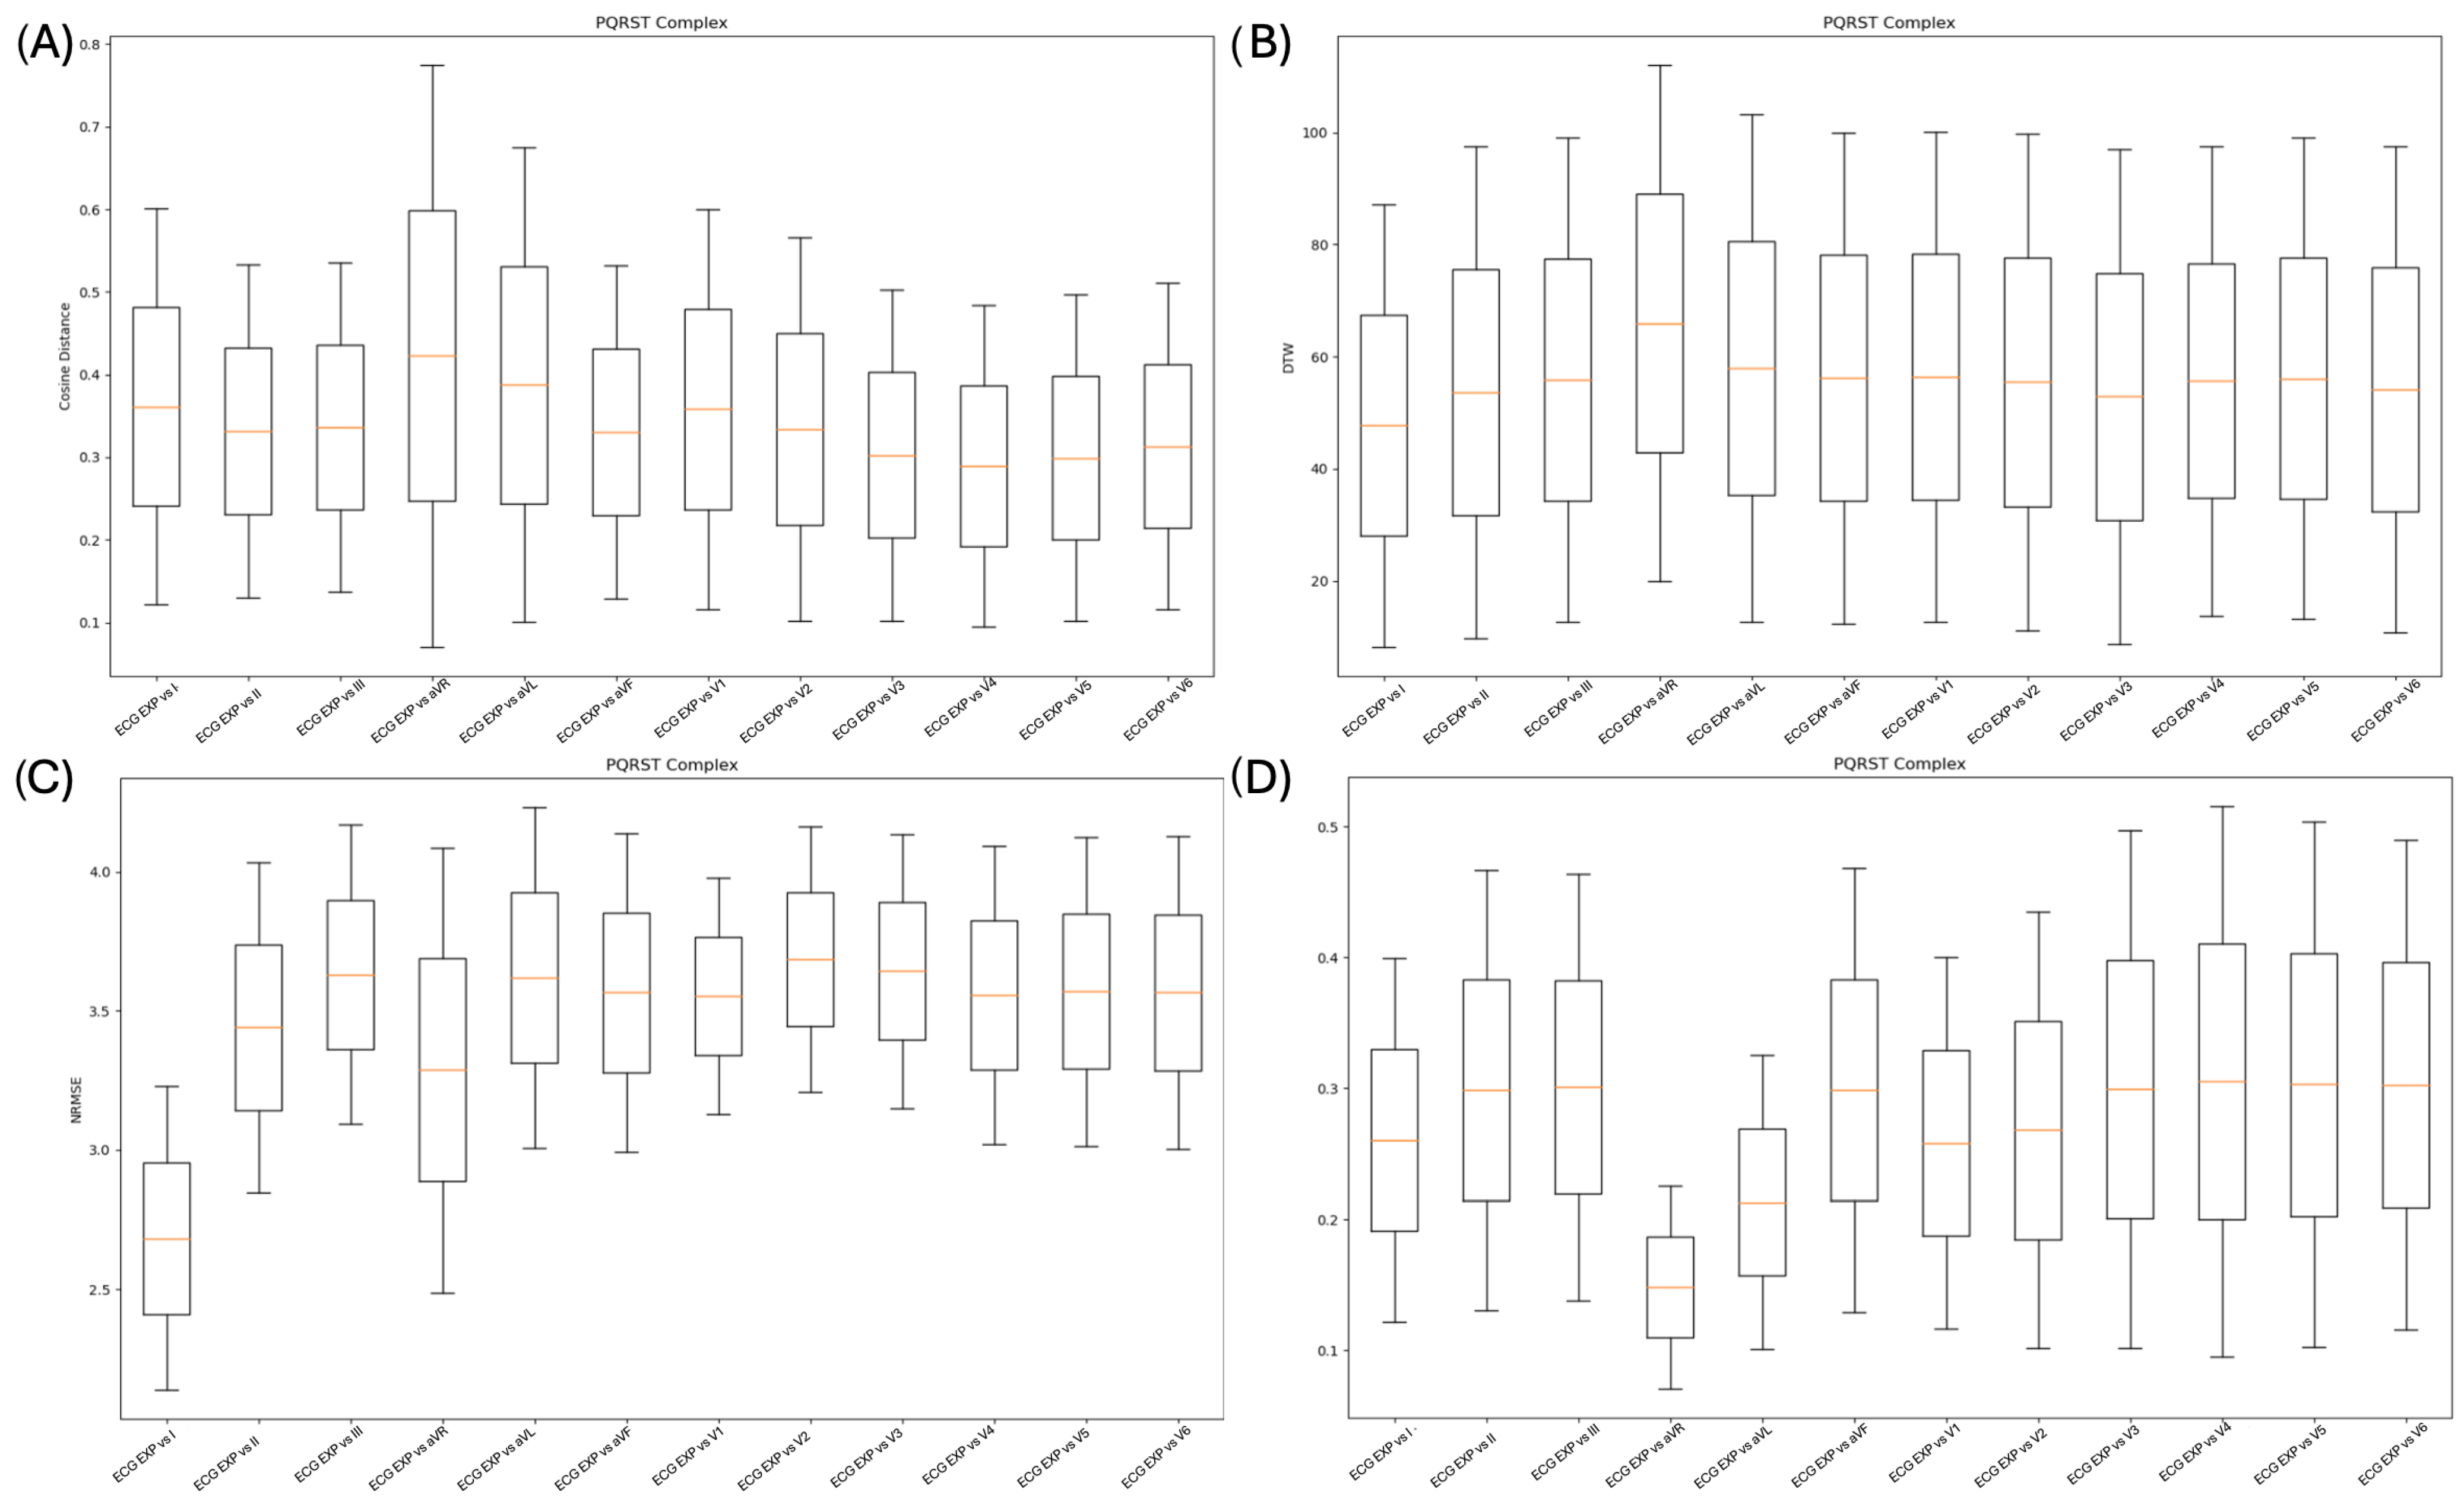
Figure A3.
Statistical analysis between the ECG_EXP and ECG_REF with the PQ complex: (A) cosine distance; (B) DTW; (C) NRMSE; (D) PCC.
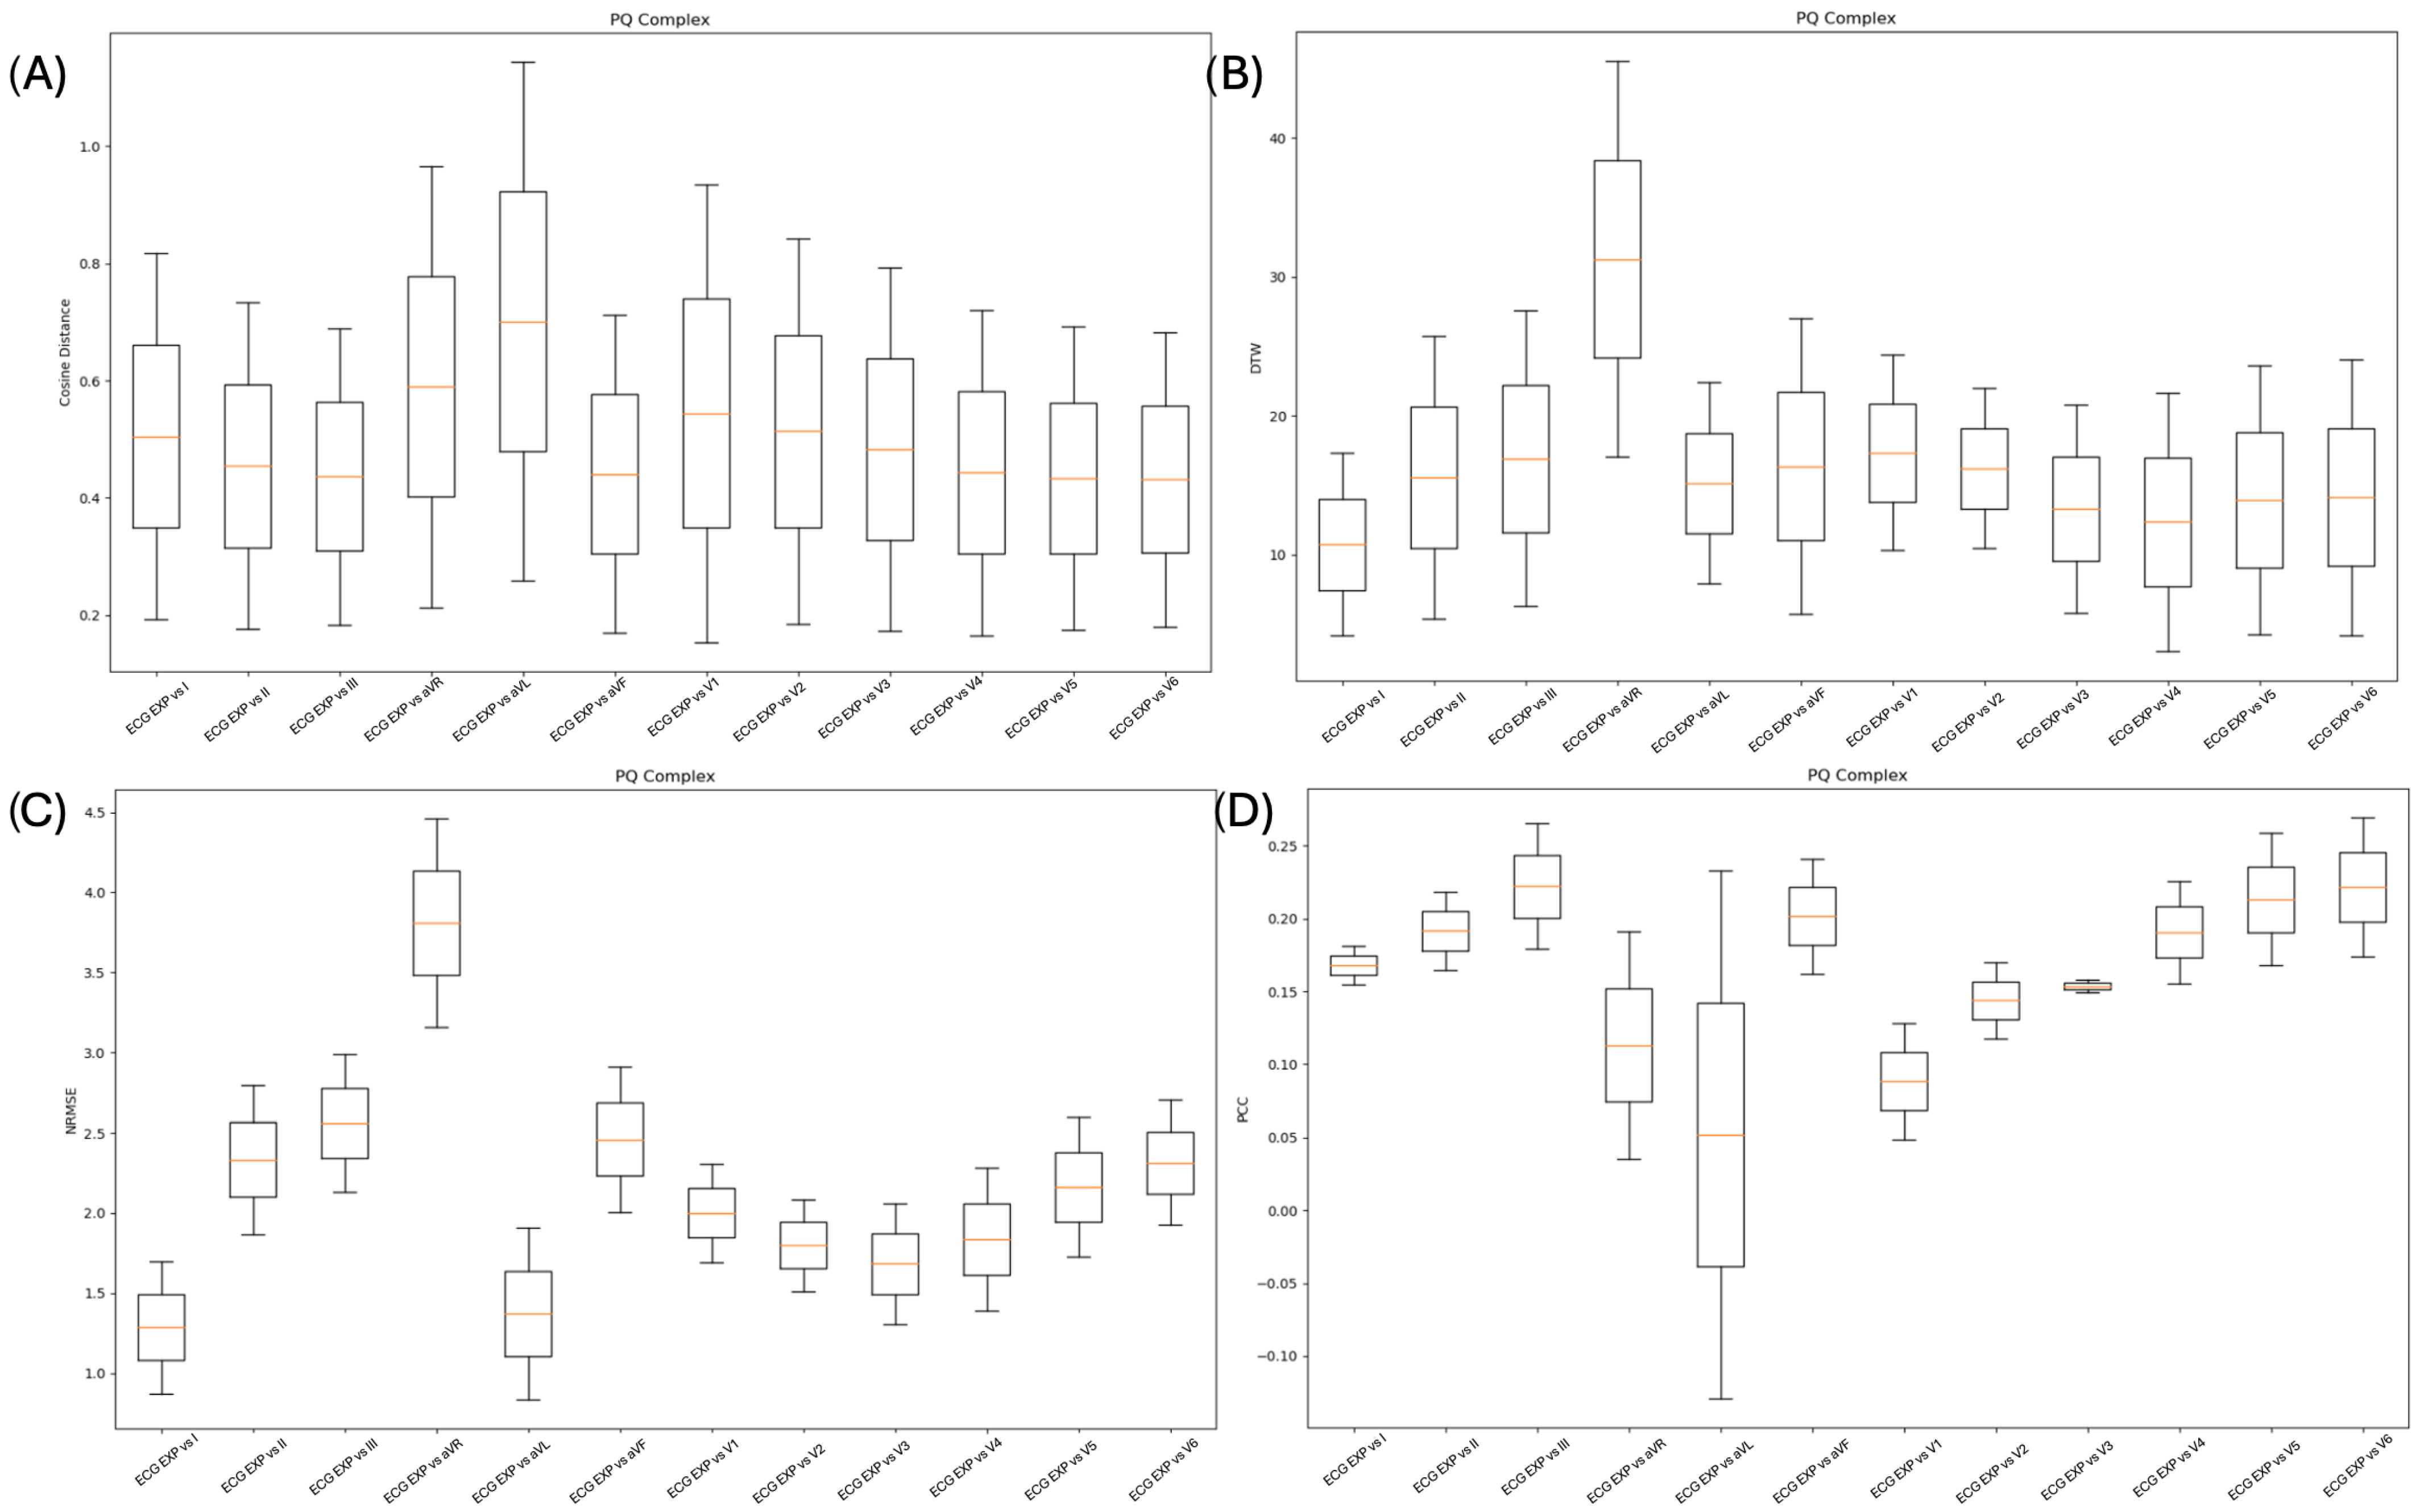
Figure A4.
Statistical analysis between the ECG_EXP and ECG_REF with the ST complex: (A) cosine distance; (B) DTW; (C) NRMSE; (D) PCC.
References
- World Health Organization. Prevention of Cardiovascular Disease: Guidelines for Assessment and Management of Total Cardiovascular Risk; World Health Organization: Geneva, Switzerland, 2007. [Google Scholar]
- Wilkins, E.; Wilson, L.; Wickramasinghe, K.; Bhatnagar, P.; Leal, J.; Luengo-Fernandez, R.; Burns, R.; Rayner, M.; Townsend, N. European Cardiovascular Disease Statistics 2017; European Heart Network: Brussels, Belgium, 2017. [Google Scholar]
- Hassan, M.F.u.; Lai, D.; Bu, Y. Characterization of single lead continuous ecg recording with various dry electrodes. In Proceedings of the 2019 3rd International Conference on Computational Biology and Bioinformatics; Association for Computing Machinery: New York, NY, USA, 2019; pp. 76–79. [Google Scholar]
- Silva, A.d.S.; Almeida, H.; da Silva, H.; Oliveira, A. Design and evaluation of a novel approach to invisible electrocardiography (ecg) in sanitary facilities using polymeric electrodes. Sci. Rep. 2021, 11, 6222. [Google Scholar] [CrossRef] [Scilit]
- Conn, N.; Schwar, K.Q.; Borkholder, D.A. In-home cardiovascular monitoring system for heart failure: Comparative study. JMIR mHealth uHealth 2019, 7, e12419. [Google Scholar] [CrossRef] [Scilit]
- Fadhil, A. Beyond Technical Motives: Perceived User Behavior in Abandoning Wearable Health & Wellness Trackers. arXiv 2019, arXiv:1904.07986. [Google Scholar] [CrossRef] [Scilit]
- Kim, K.; Lim, Y.; Park, K.S. The electrically noncontacting ecg measurement on the toilet seat using the capacitively-coupled insulated electrodes. In Proceedings of the Annual International Conference of the IEEE Engineering in Medicine and Biology Society; IEEE: Piscataway, NJ, USA, 2004; pp. 2375–2378. [Google Scholar] [CrossRef] [Scilit]
- Huang, J.; Yu, S.; Syu, H. Development of the smart toilet equipment with measurements of physiological parameters. In Proceedings of the International Conference on Ubiquitous Intelligence and Computing and International Conference on Autonomic and Trusted Computing; IEEE: Piscataway, NJ, USA, 2012; pp. 9–16. [Google Scholar] [CrossRef] [Scilit]
- Clifford, G.D.; Azuaje, F.; Mcsharry, P. Ecg statistics, noise, artifacts, and missing data. Adv. Methods Tools Ecg Data Anal. 2006, 6, 18. [Google Scholar]
- Tobon, D.P.; Falk, T.H. Online ecg quality assessment for context-aware wireless body area networks. In 2015 IEEE 28th Canadian Conference on Electrical and Computer Engineering (CCECE); IEEE: Piscataway, NJ, USA, 2015; pp. 587–592. [Google Scholar]
- Zhao, Z.; Zhang, Y. Sqi quality evaluation mechanism of single-lead ecg signal based on simple heuristic fusion and fuzzy comprehensive evaluation. Front. Physiol. 2018, 9, 727. [Google Scholar] [CrossRef] [Scilit]
- Clifford, G.D.; Behar, J.; Li, Q.; Rezek, I. Signal quality indices and data fusion for determining clinical acceptability of electrocardiograms. Physiol. Meas. 2012, 33, 1419–1433. [Google Scholar] [CrossRef] [Scilit] [PubMed]
- Behar, J.; Oster, J.; Li, Q.; Clifford, G.D. ECG signal quality during arrhythmia and its application to false alarm reduction. IEEE Trans. Biomed. Eng. 2013, 60, 1660–1666. [Google Scholar] [CrossRef] [Scilit] [PubMed]
- Lessard-Tremblay, M.; Weeks, J.; Morelli, L.; Cowan, G.; Gagnon, G.; Zednik, R.J. Contactless Capacitive Electrocardiography Using Hybrid Flexible Printed Electrodes. Sensors 2020, 20, 5156. [Google Scholar] [CrossRef] [Scilit]
- Boiko, A.; Martínez Madrid, N.; Seepold, R. Contactless Technologies, Sensors, and Systems for Cardiac and Respiratory Measurement during Sleep: A Systematic Review. Sensors 2023, 23, 5038. [Google Scholar] [CrossRef] [Scilit] [PubMed] [PubMed Central]
- Cheung, C.C.; Krahn, A.D.; Andrade, J.G. The Emerging Role of Wearable Technologies in Detection of Arrhythmia. Can. J. Cardiol. 2018, 34, 1083–1087. [Google Scholar] [CrossRef] [Scilit] [PubMed]
- Silva, H.P.D.; Guerreiro, J.; Lourenço, A.; Fred, A.; Martins, R. Bitalino: A novel hardware framework for physiological computing. In International Conference on Physiological Computing Systems; SciTePress: Setúbal, Portugal, 2014; Volume 2, pp. 246–253. [Google Scholar]
- Engelse, W.A.H.; Zeelenberg, C. A single scan algorithm for QRS detection and feature extraction. In IEEE Computers in Cardiology; IEEE: Piscataway, NJ, USA, 1979; pp. 37–42. [Google Scholar]
- Richman, J.S.; Moorman, J.R. Physiological time-series analysis using approximate entropy and sample entropy. Am. J. Physiol.-Heart Circ. Physiol. 2000, 278, H2039–H2049. [Google Scholar] [PubMed]
- Delgado-Bonal, A.; Marshak, A. Approximate entropy and sample entropy: A comprehensive tutorial. Entropy 2019, 21, 541. [Google Scholar] [CrossRef] [Scilit]
- Peng, C.; Havlin, S.; Stanley, H.E.; Goldberger, A.L. Quantification of scaling exponents and crossover phenomena in nonstationary heartbeat time series. Chaos Interdiscip. J. Nonlinear Sci. 1995, 5, 82–87. [Google Scholar] [CrossRef] [Scilit]
- Brennan, M.; Palaniswami, M.; Kamen, P. Do existing measures of poincare plot geometry reflect nonlinear features of heart rate variability? IEEE Trans. Biomed. Eng. 2001, 48, 1342–1347. [Google Scholar] [CrossRef] [Scilit] [PubMed]
- Lourenço, A.; Silva, H.; Leite, P.; Lourenxcxo, R.; Fred, A.L. Real time electrocardiogram segmentation for finger based ecg biometrics. In Proceedings of the International Conference on Bio-Inspired Systems and Signal Processing (BIOSIGNALS-2012); SciTePress: Setúbal, Portugal, 2012; pp. 49–54. [Google Scholar]
- Gutiérrez-Rivas, R.; Garcia, J.J.; Marnane, W.P.; Hernández, A. Novel real-time low-complexity qrs complex detector based on adaptive thresholding. IEEE Sens. J. 2015, 15, 6036–6043. [Google Scholar] [CrossRef] [Scilit]
- Bota, P.; Silva, R.; Carreiras, C.; Fred, A.; da Silva, H.P. BioSPPy: A Python toolbox for physiological signal processing. SoftwareX 2024, 26, 101712. [Google Scholar] [CrossRef] [Scilit]
- Vranic, I.I. Electrocardiographic appearance of aortic stenosis before and after aortic valve replacement. Ann. Noninvasive Electrocardiol. 2017, 22, e12457. [Google Scholar] [CrossRef] [Scilit] [PubMed]
- Goldberger, A.L.; Peng, C.-K.; Lipsitz, L.A. What is physiologic complexity and how does it change with aging and disease? Neurobiol. Aging 2002, 23, 23–26. [Google Scholar] [CrossRef] [Scilit]
- Thayer, J.F.; Hansen, A.L.; Saus-Rose, E.; Johnsen, B.H. Heart rate variability, prefrontal neural function, and cognitive performance: The neurovisceral integration perspective on self-regulation, adaptation, and health. Ann. Behav. Med. 2009, 37, 141–153. [Google Scholar] [CrossRef] [Scilit]
- Kleiger, R.E.; Miller, J.; Bigger, J.; Moss, A.J. Decreased heart rate variability and its association with increased mortality after acute myocardial infarction. Am. J. Cardiol. 1987, 59, 256–262. [Google Scholar] [CrossRef] [Scilit]
- Rovere, M.T.L.; Bigger, J.T.; Marcus, F.I.; Mortara, A.; Schwartz, P.J. Baroreflex sensitivity and heart-rate variability in prediction of total cardiac mortality after myocardial infarction. Lancet 1998, 351, 478–484. [Google Scholar] [CrossRef] [Scilit]
- Silva, A.S.; Correia, M.V.; de Melo, F.; da Silva, H.P. Identity recognition in sanitary facilities using invisible electrocardiography. Sensors 2022, 22, 4201. [Google Scholar] [CrossRef] [Scilit]
- dos Santos Silva, A.; Correia, M.V.; da Costa, A.G.; Cerqueira, R.J.; da Silva, H.P. Characterisation of thigh-based electrocardiography (ECG) across different pathologies. Sci. Rep. 2026, 16, 10766. [Google Scholar] [CrossRef] [Scilit]

Disclaimer/Publisher’s Note: The statements, opinions and data contained in all publications are solely those of the individual author(s) and contributor(s) and not of MDPI and/or the editor(s). MDPI and/or the editor(s) disclaim responsibility for any injury to people or property resulting from any ideas, methods, instructions or products referred to in the content. |
© 2026 by the authors. Licensee MDPI, Basel, Switzerland. This article is an open access article distributed under the terms and conditions of the Creative Commons Attribution (CC BY) license.