


Abstract
In arid oases of Northwest China, canal water is delivered on a rotation calendar that does not follow crop demand. On-farm ponds can store canal water, but their benefits are usually measured against canal-timed border irrigation, which confounds application method, timing and amount. A two-season field experiment (2023–2024) on a calcareous silt loam in Qitai, Xinjiang, compared canal-timed border irrigation (CB), canal-timed drip irrigation (CD), pond-supplied drip irrigation on demand (PD) and PD with 70% of the depth applied outside the jointing–milk window (PDR). The canal deliveries were 14–17 d apart, whereas readily available soil water was depleted in 8.5–9.2 d (9.8–11.1 d even if all rainfall had been effective). The canal-timed regimes accumulated 12–16 stress days (root-zone depletion above readily available water) between jointing and the milk stage, against less than 2 d under pond supply. Relative to CD, PD increased kernels per spike by 9–15%, grain yield by 12–14% (0.15–0.19 g more grain per spike) and evapotranspiration (ET) by 28 mm, without changing spike number or kernel weight. Drip irrigation on canal dates did not affect yield and reduced irrigation by 106 mm, mainly through less estimated drainage. PDR diverted 79 mm (19%) less water than CB, but its ET was not lower (+9 mm; 95% CI: −3 to 20 mm). Pond storage increased yield by improving irrigation timing, but consumptive water use did not decline, and pond evaporation added 5.0–5.4 mm (1.4% of PD irrigation). In similar conditions, ponds should be sized to bridge the delivery interval between jointing and the milk stage, and reduced diversion should not be reported as water saving unless ET falls.
1. Introduction
Irrigated agriculture accounts for most human freshwater withdrawals, and agricultural water scarcity is projected to intensify as the climate warms [1,2]. In the arid oases of Northwest China, crops depend on rivers fed by snow and glacier melt; their flow is stored in reservoirs and distributed through canal networks [2], and spring wheat is a staple crop in many of these oases. In Xinjiang, wheat is grown on about 1.14 × 10⁶ ha, and roughly two-thirds of this area has been reported as drip-irrigated [3]. Drip irrigation has been promoted widely to reduce irrigation withdrawals. A recent meta-analysis found that optimized systems, mostly drip and micro-sprinkler irrigation, reduced irrigation inputs to wheat in China by about one-third, and that drip irrigation had no significant effect on yield [4]; in Xinjiang, moderate reductions in drip irrigation also maintained spring wheat yield [5]. Water saved in the field, however, is not necessarily available for other uses. Lower soil evaporation is a real saving, but much of the reduction usually comes from less deep percolation, which, in many basins, returns to aquifers or rivers and is used again downstream. In such basins, higher on-farm efficiency can leave basin-scale consumption unchanged or even increase it [6,7,8]. A claim of water saving, therefore, has to distinguish a reduction in consumption from a reduction in diversion (the volume withdrawn from the canal or reservoir).
The productivity of irrigation water depends on when water is available as well as on how much is applied. The yield response factor of wheat is highest around flowering and lowest during early vegetative growth [9]. Kernel number, the yield component most sensitive to the environment [10], is determined from about three weeks before anthesis until shortly after it, when floret survival depends on the supply of assimilates to the growing spike [11]. Water deficit in this period reduces floret fertility, partly because low plant water potential induces pollen sterility [12,13]; the young microspore stage of pollen development, around booting, is particularly vulnerable [14]. Deficit after anthesis mainly shortens grain filling, although mild soil drying can accelerate the remobilization of stem reserves [15]. At the leaf level, stomatal closure is the first response to declining soil water and limits carbon gain before metabolic damage occurs [16,17]. Regulated deficit irrigation uses this stage dependence: water is withheld when the crop is least sensitive and supplied fully during critical stages [18,19,20]. Supplemental irrigation in dry areas rests on the same principle: limited water applied at critical stages gives large gains in yield and water productivity [21]. Both approaches require that water can be delivered at the right time.
In canal-irrigated districts, delivery timing follows a rotation calendar that allocates flow among users rather than the soil water status of individual fields. In the irrigation districts of Northwest China, the mismatch between delivery and crop demand is a major cause of lost production and low irrigation water productivity [22]. Small on-farm ponds can reduce this mismatch: they store canal water when it arrives and release it when the crop needs it [23]. In the Zhanghe Irrigation System of central China, farm ponds gave rice farmers enough flexibility to adopt water-saving irrigation and raised water productivity, but net depletion did not decrease because local storage replaced water from the main reservoir [24]. Ponds also allow sediment to settle before water enters the drip laterals, which reduces emitter clogging [25]. In a dry climate, however, an open water surface loses water by evaporation, a term that is often missing from water accounts [26]. Many small ponds have been built in the oases of northern Xinjiang, and local reports attribute large yield increases and water savings to them. These reports compare pond-supplied drip irrigation with canal-timed border irrigation, so the effects of application method, irrigation timing and irrigation amount are confounded. A field study of table grape in a canal command in India, which found 37% higher water productivity when canal water was stored in a farm pond and applied by drip than when it was applied directly by flooding, had the same limitation [27]. The same problem is common in field comparisons of drip and surface irrigation, in which the drip treatment usually differs from the control in scheduling and amount as well as in method [4,28,29,30].
This study asked how much of the yield and water productivity gain associated with pond-supplied drip irrigation comes from matching water supply to the critical period for kernel number, and how much from the irrigation method and the irrigation amount. The working hypothesis was that, under canal rotation, the interval between deliveries during the period of high demand is longer than the time the crop needs to deplete readily available soil water. If so, drip irrigation tied to the rotation calendar cannot prevent stress, however efficiently it applies water. A two-season field experiment compared four regimes that form a stepwise sequence from farmer practice to pond-supplied regulated deficit irrigation: canal-timed border irrigation (CB), canal-timed drip irrigation (CD), pond-supplied drip irrigation on demand (PD), and PD with irrigation reduced to 70% outside the period from jointing to the milk stage (PDR). Differences between adjacent regimes were isolated by method (CD − CB), timing (PD − CD) and amount (PDR − PD). Three outcomes were expected. First, pond supply would remove most of the days on which root-zone depletion exceeded readily available water during the critical window, whereas drip irrigation alone would not. Second, the smaller deficit would maintain stomatal conductance and photosynthesis around anthesis and increase kernels per spike and grain yield, with little effect on kernel weight. Third, most of the reduction in irrigation relative to border irrigation would come from the change in method, and reduced irrigation outside the window would reduce diversion further at little cost to yield. For the third expectation, the analysis tested whether these reductions lowered evapotranspiration (ET) or only the volume of water diverted.
This study adds to earlier work in two ways. First, meta-analyses such as that of Ma et al. [4] pooled trials in which method, schedule and amount usually changed together, so they reported the effect of an irrigation package and could not assign it to its components; here, a stepwise design isolates method, timing and amount. Second, the irrigation efficiency literature [6,7,8] shows that savings at field scale need not reduce consumption, but it has seldom been combined with a field water balance in which drainage, storage and evapotranspiration are separated, and evaporation from storage is counted; here, the water balance of each step is partitioned into ET, soil water storage and drainage, with evaporation from the pond added. The results are of practical significance in two ways. They show whether the yield benefit attributed to ponds in northern Xinjiang can be reproduced by changing only the timing of application, and they give irrigation districts a basis for deciding how much storage is needed and for reporting reductions in diversion separately from reductions in consumption.
2. Results
2.1. Canal Delivery Intervals and Root-Zone Water Supply
Growing-season precipitation was 112.4 mm in 2023 and 141.6 mm in 2024, compared with a 1991–2020 mean of 124 mm for the same period, so the two seasons fell on either side of the long-term mean, and reference evapotranspiration (ET0) was 552 and 508 mm (Figure 1a,b). Between jointing (Zadoks stage 31) and the milk stage (Z75), the daily ET0 averaged 5.87 mm in 2023 and 5.30 mm in 2024, and rainfall totaled 38.7 and 47.9 mm. Canal water reached the village on five dates in each season, 14–17 d apart (Figure S1a). The three intervals that began with a delivery inside the critical window averaged 16.3 d in 2023 and 16.0 d in 2024. At the crop evapotranspiration (ETc) of the unstressed PD plots during the window (6.7 and 6.2 mm d−1), readily available water (RAW; 57.5 mm in the 0–60 cm layer) was depleted 8.5 and 9.2 d after a refill. Even if all rainfall during the window had been effective, the net rate of depletion (5.9 and 5.2 mm d−1) would have exhausted RAW in 9.8 and 11.1 d, still well short of the delivery interval. During the window, the pond-supplied plots were irrigated every 6–12 d (means of 9.1 d in 2023 and 8.8 d in 2024); over the season, they received 7–8 irrigation events, one before jointing, four to six within the window, and one or two after the milk stage, compared with five in CB and CD (one before jointing, three within the window and one after the milk stage; Table S1).
Figure 1.
Weather, irrigation timing and root-zone water depletion in (a) 2023 and (b) 2024, and (c) stress days during the critical window. In (a,b), the upper panels show daily reference evapotranspiration (ET0) and precipitation; the middle panels mark canal delivery dates (triangles; shared by CB and CD) and irrigation events in each PD and PDR plot (ticks; one row per block); and the lower panels show daily root-zone depletion (Dr, 0–60 cm; treatment means, n = 3). The dashed line is readily available water (RAW), the shaded band is the critical window (Zadoks stages 31–75), and the dotted line marks anthesis (Z65). In (c), stacked bars show stress days before anthesis (Z31–Z65; solid) and after anthesis (Z65–Z75; light); error bars are the SE of the total (n = 3), and within a year, different letters indicate differences in the total at p < 0.05 (Tukey). CB, canal-timed border irrigation; CD, canal-timed drip irrigation; PD, pond-supplied drip irrigation on demand; PDR, PD with 70% of the PD depth applied outside the critical window. Mean interval between irrigations during the critical window (range): canal-timed plots, 16.3 d (16–17 d) in 2023 and 16.0 d (15–17 d) in 2024; pond-supplied plots (PD and PDR together), 9.1 d in 2023 and 8.8 d in 2024 (6–12 d in both years).
Seasonal irrigation was highest in CB in both years (Table 1). Pond supply increased irrigation relative to CD by 49 mm in 2023 and 66 mm in 2024, because water was applied whenever the root zone reached the trigger rather than only on delivery dates. Averaged over the two years, PDR received 40 mm (31%) less than PD before jointing and after the milk stage, but 10 mm more within the window, because its first irrigations after jointing had to replace the deficit carried over from the pre-jointing period. Pond storage did not fall below 41% of design capacity in 2023 or below 49% in 2024; Section 3.4 considers what this means for the whole command area.
Table 1.
Irrigation, soil water storage change, drainage, evapotranspiration and water productivity of spring wheat under four irrigation regimes.
2.2. Root-Zone Depletion and Stress Days During the Critical Window
In CB and CD, depletion in the 0–60 cm layer rose above RAW before each delivery within the window and peaked at 75–86 mm (72–82% of TAW, equivalent to a mean volumetric water content of 0.15–0.17 m3 m−3 against 0.12 at the wilting point). In PD and PDR, it remained below RAW on nearly all days of the window (Figure 1a,b). A stress day was a day on which the daily mean Dr exceeded RAW (Section 4.4). CB and CD accumulated 16.0 and 14.7 stress days in 2023 and 12.7 and 11.7 in 2024, whereas PD and PDR accumulated no more than 1.7 d (Figure 1c). The timing contrast (PD − CD) reduced stress days by 14.3 d (95% CI: 12.5–16.2 d) in 2023 and by 11.7 d (8.4–15.0 d) in 2024. The method contrast (CD − CB) changed them by −1.3 d (−3.2 to 0.6 d) and −1.0 d (−4.3 to 2.3 d). Stress days were more numerous in 2023 (p = 0.016), when evaporative demand was higher and rainfall lower; the treatment × year interaction was not significant (p = 0.085).
The timing of stress differed between the seasons. Before anthesis (Z65), the canal-timed plots exceeded RAW for 5.3 d in 2023 (27–31 May) and for 6.0–6.7 d in 2024 (29 May–4 June), and depletion was greater in 2024 (82–84 mm compared with 75–78 mm). After anthesis, they exceeded RAW for 5.7–6.0 d in 2024 (15–20 June) but for 9.3–10.7 d in 2023. In that year, rain between 3 and 11 June delayed the first episode until anthesis, and a second episode followed from 26 June to 1 July (Figure 1).
The treatment differences were not sensitive to the choice of depletion fraction. When RAW was recalculated with the fraction adjusted for the observed ETc (0.48 instead of 0.55; RAW = 50.2 mm), stress days increased to 14–20 d in the canal-timed treatments and to 2–6 d in the pond-supplied treatments, and the timing contrast remained about 13 d in both years. Outside the window, mean depletion in PDR exceeded that in PD by 15.6 mm in 2023 and 13.3 mm in 2024 and was above RAW on 8.3 and 2.7 d, mostly after the milk stage; depletion in PD did not exceed RAW outside the window.
2.3. Leaf Gas Exchange, Water Status and Nitrogen
Treatment effects on leaf gas exchange depended on growth stage (stage × treatment interaction for Pn and gs (p < 0.001); Figure 2). At jointing, the canal-timed plots had been irrigated 1–2 d earlier, and gs and Pn were lowest in PDR, which had received 70% of the PD depth before jointing; relative to the mean of CB and CD, gs was 14% lower and Pn 7% lower. At anthesis, the canal-timed plots had gone 10–11 d without irrigation, and the pond-supplied plots a median of 4 d (range of 1–12 d). Treatments were measured on the same day, so the time since the last irrigation differed among them by design, and the differences below describe the state of each regime at that point of its irrigation cycle, not an effect of treatment independent of irrigation timing. Pn in PD and PDR was 9% higher than in CD, although by Tukey’s test, only CB differed from the pond-supplied treatments. Stomatal conductance in PD was 23% higher than in CD, and CB had the lowest values of both variables. At 25 d after anthesis (DAA), 4 d after the last canal delivery, neither Pn (p = 0.075) nor gs (p = 0.11) differed among treatments; both were lowest in PDR, in line with its reduced irrigation after the milk stage. Leaf relative water content (RWC) did not differ among treatments at any stage (93.2–93.9% at jointing, 91.3–91.9% at anthesis and 87.6–88.1% at 25 DAA; p ≥ 0.085), and the treatment effect on RWC did not depend on stage (p = 0.31). Flag-leaf N concentration at anthesis was 3.79–3.84% in the three drip treatments, with no difference among them, and lower in CB (3.63%; treatment p = 0.010).
Figure 2.
(a) Net photosynthetic rate (Pn) and (b) stomatal conductance (gs) at jointing, anthesis and 25 days after anthesis (DAA). The uppermost fully expanded leaf was measured at jointing and the flag leaf thereafter. Points are means of both years ± SE (n = 6 plot-seasons); within a stage, different letters indicate differences at p < 0.05 (Tukey). Treatment abbreviations are the same as in Figure 1. Treatments were measured on the same day, so the time since the last irrigation differed by design: at jointing, 1–2 d for the canal-timed plots; at anthesis, 10–11 d for the canal-timed plots and a median of 4 d (range of 1–12 d) for the pond-supplied plots; and at 25 DAA, 4 d after the last delivery for the canal-timed plots. The differences, therefore, describe each regime at that point of its irrigation cycle and are not treatment effects independent of irrigation timing.
2.4. Yield and Yield Components
Grain yield ranged from 7.04 t ha−1 in CD in 2023 to 8.27 t ha−1 in PDR in 2024 and was affected by treatment (p = 0.001) and year (p = 0.045), with no treatment × year interaction (p = 0.72) (Table 2). Relative to CD, PD increased grain yield by 0.86 t ha−1 (12%; 95% CI: 0.13–1.58) in 2023 and by 1.02 t ha−1 (14%; 0.66–1.38) in 2024. In 2023, this difference was supported by the planned contrast but not by Tukey’s test, which adjusts for all six pairwise comparisons (Section 4.8); the 2023 estimate agrees in direction and is similar in size to the 2024 estimate but does not confirm it independently. The increase came from kernels per spike, which PD raised by 2.9 (9%) in 2023 and 4.4 (15%) in 2024 (treatment × year; p = 0.015). Because the effect on kernels per spike differed between years, year-specific differences are given for this variable, and the two-year mean is not used. Neither spikes per square meter (p = 0.71) nor thousand-kernel weight (TKW; p = 0.58) responded to treatment; TKW was higher in 2024 (44.9–45.5 g compared with 42.4–43.3 g). Pond supply increased above-ground biomass by 0.94 t ha−1 (6.5%; 0.49–1.38) and harvest index by 0.027 (0.009–0.045). Canal-timed drip irrigation did not change yield (two-year CD − CB: 0.00 t ha−1; −0.38 to 0.39), and reduced irrigation outside the window did not lower it (PDR − PD: −0.05 t ha−1; −0.44 to 0.34). These intervals exclude differences larger than about 0.4 t ha−1 (roughly 5%) but not smaller ones; with three plots per treatment and two seasons, the power to detect small differences is limited, so non-significant contrasts are interpreted from their confidence intervals and not as proof of no effect. The product of the three yield components exceeded measured grain yield by 1.6–3.2%. The excess was similar in all treatments (1.9–3.0% when calculated from treatment means) and so does not bias the comparisons between them; it probably reflects small kernels that were counted on the spikes but lost during threshing and cleaning, together with other handling losses.
Table 2.
Yield components, grain yield, above-ground biomass and harvest index of spring wheat under four irrigation regimes.
Expressed per spike, the smallest unit counted at harvest (Section 4.6), the yield response took the same form (Table S2). Grain mass per spike, calculated from kernels per spike and TKW, was 1.29–1.33 g in the canal-timed treatments and 1.44–1.52 g in the pond-supplied treatments. Pond supply raised it by 0.15 g (12%) in 2023 and by 0.19 g (14%) in 2024, the same relative increase as grain yield, because spike number did not change. Above-ground biomass per spike rose less, by 4% in 2023 (from 2.52 to 2.63 g) and by 8% in 2024 (from 2.59 to 2.81 g), in line with the higher harvest index. Neither drip irrigation on canal dates (CD − CB) nor reduced irrigation outside the window (PDR − PD) changed grain mass per spike by more than 0.04 g in either year.
Across the 24 plot-seasons, kernels per spike declined by 0.67 per stress day before anthesis (95% CI: 0.55–0.79; R2 = 0.87), and grain yield declined by 157 kg ha−1 per stress day (117–197 kg ha−1; R2 = 0.78) (Figure 3). The slopes did not differ between years (p = 0.073 and 0.57). At a given number of pre-anthesis stress days, the yield was 0.41 t ha−1 higher in 2024, consistent with the heavier kernels of that season. The 24 plot-seasons come from 12 plots measured in two seasons and were treated as independent observations in these regressions, so the confidence intervals are probably too narrow, and the regressions are descriptive (Section 4.8).
Figure 3.
Relationships between stress days before anthesis (Z31–Z65) and (a) kernels per spike and (b) grain yield across 24 plot-seasons. Filled symbols, 2023; open symbols, 2024; points are offset slightly along the x-axis to reduce overlap. Lines are fitted by linear regression with a common slope and year-specific intercepts. Treatment abbreviations are the same as in Figure 1. The 24 plot-seasons (12 plots in two seasons) were treated as independent observations, so the fits are descriptive.
2.5. Water Balance, Water Productivity and Pond Evaporation
Seasonal ET varied much less among treatments than irrigation did (Table 1). Averaged over both years, ET ranged from 474 mm in CD to 502 mm in PD, whereas irrigation ranged from 307 to 414 mm. Treatment affected ET across years (p = 0.005), although no pair of treatments differed within a year. Drainage below 100 cm under CB was estimated at 56 mm in 2023 and 98 mm in 2024 (Section 4.7) and was not detected in any drip plot. Water productivity based on ET (WPET) was 11% higher in PDR than in CB (two-year difference of 0.16 kg m−3; 0.05–0.27), and irrigation water productivity (IWP) was lowest in CB in both years.
Figure 4a partitions each change in irrigation among the terms of the water balance. The switch from border to drip irrigation reduced irrigation by 106 mm (95% CI: 95–117 mm): 77 mm was estimated drainage that no longer occurred, 18 mm came from greater depletion of soil water over the season, and 12 mm (0.4–23 mm) was a reduction in ET. Pond supply added 57 mm (46–68 mm), of which 28 mm (17–40 mm) was used as additional ET, and 29 mm remained in the profile at harvest. Reducing the depth of irrigation outside the window lowered irrigation by 30 mm (19–41 mm); 22 mm of this was drawn from soil water storage, and 8 mm (−4 to 19 mm) came from lower ET, so most of the reduction was a deferral of demand to the following season and not a sustained saving. Overall, PDR diverted 79 mm (19%) less water than CB, but its ET was 9 mm higher (−3 to 20 mm). The yield gain of PDR over CB, 0.89 t ha−1 (12%; 0.50–1.28), was accounted for almost entirely by the timing contrast (Figure 4b).
Figure 4.
(a) Differences in seasonal irrigation between adjacent regimes and between PDR and CB, partitioned into differences in evapotranspiration (ET), soil water storage change (ΔS) and drainage, which together equal the difference in irrigation (Equation (3)). Bars are two-year means; the point shows the irrigation difference with its 95% confidence interval. (b) Corresponding differences in grain yield within each year and for the two-year mean, with 95% confidence intervals. Treatment means are given in Table 1 and Table 2; treatment abbreviations are the same as in Figure 1. The drainage component applies to CB only and was estimated, not measured, so it is the least certain part of panel (a); the confidence intervals shown for irrigation do not include the uncertainty of this estimate.
The irrigation differences and the storage terms were measured, whereas drainage under CB was estimated, and the ET of CB was calculated as the residual of Equation (3), so an error in the drainage estimate passes into the ET of CB with the opposite sign. The sum of avoided drainage and reduced ET in the method contrast (about 89 mm) is, therefore, independent of the drainage estimate, but its division between the two terms is not. An error of 20 mm (26%) in the two-year mean drainage of CB (77 mm) would change the ET reduction in the method contrast from 12 mm to between −8 and 32 mm, and the ET difference between PDR and CB from +9 mm to between −11 and +29 mm. The confidence intervals above do not include this error. The conclusion that pond supply increased ET, therefore, rests on the PD − CD contrast, in which neither treatment drained, and the PDR − CB result is best read as showing that no reduction in ET was detected.
Pond evaporation was 8300 m3 in 2023 and 7680 m3 in 2024, equivalent to 5.4 and 5.0 mm over the 153 ha command area and to 1.4% of seasonal irrigation in PD in both years. It was estimated from Class A pan evaporation, a pan coefficient of 0.7 and the mean water surface area of the pond, with seepage assumed to be negligible in the lined pond (Section 4.7). A pan coefficient of 0.6 or 0.8 instead of 0.7 would give 4.3–6.2 mm over the command area, or 1.2–1.6% of PD irrigation, so the conclusion that this term is minor does not depend on the exact coefficient. Including this loss lowered the IWP of PD from 2.07 to 2.04 kg m−3 in 2023 and from 2.37 to 2.34 kg m−3 in 2024.
3. Discussion
3.1. Why Canal-Timed Drip Irrigation Did Not Prevent Stress
Drip irrigation tied to the canal calendar left the crop with as many stress days as border irrigation, whereas pond supply removed almost all of them (Figure 1). The explanation lies in the water balance of the root zone rather than in the drip system itself. With an ETc of 6–7 mm d−1 during stem elongation and heading and an RAW of 57.5 mm, a refilled root zone reaches the stress threshold in 8–9 d, about half the 14–17 d between deliveries. A drip system changes how water is distributed and how much of it drains below the root zone, but it cannot shorten the interval between deliveries; only storage can. Model studies that aligned canal deliveries with the field water balance in Northwest China predicted about 20% greater total production [22]. The present experiment tested the same mechanism in the field, with the canal calendar held constant and only the timing of on-farm application varied. Lowering the depletion fraction to the value recommended for the observed evaporative demand [31] added stress days to all treatments but left the timing contrast at about 13 d. The same balance shows how far the result depends on the two seasons observed. For canal-timed drip irrigation to avoid stress at the shortest delivery interval recorded (14 d), the net rate of depletion would have had to stay below 4.1 mm d−1 (57.5 mm/14 d) throughout the window. With the observed ETc, this would have required at least 96 mm (2024) to 119 mm (2023) of effective rain between jointing and the milk stage, two to three times the 39–48 mm received and 77–96% of the long-term mean rainfall for the whole growing season (124 mm), or a shorter delivery interval. The direction of the timing effect, therefore, follows from the rotation calendar and the readily available water of the root zone rather than from the weather of these two seasons, although its size will vary from year to year.
Border and drip irrigation applied on the same dates produced similar numbers of stress days. The slightly higher number under CB in 2023 has two plausible causes. Water from a border spreads unevenly, so the downstream part of a plot infiltrates less than the average depth and dries sooner, and a fully wetted surface loses more water to soil evaporation in the days after irrigation than the partly wetted surface of a drip plot [31]. Both effects were small compared with the effect of timing. They also help to explain why yield gains are often credited to drip irrigation itself. In many field comparisons, the drip treatment is irrigated more often and closer to crop demand than the surface-irrigated control [28,29,30], and irrigation frequency alone can raise the yield and water productivity of drip-irrigated wheat [3,28,32]. Across Chinese wheat studies, drip irrigation reduced irrigation inputs substantially without a significant change in yield [4], which agrees with the absence of a method effect on yield in this study once timing was held constant.
3.2. Water Deficit and Kernel Set
The yield response to pond supply came through kernels per spike, and kernel number declined with the number of pre-anthesis stress days along a common slope in both years (Table 2; Figure 3). This is consistent with the physiology of kernel set in wheat. Kernel number is determined from about three weeks before anthesis until shortly after it, when floret survival depends on the assimilate supply to the growing spike [11], and pollen development is sensitive to low plant water potential [12,13,14]. The leaf measurements are consistent with a smaller assimilate supply in the canal-timed plots at this time, with the caveat that the plots were measured at different times since irrigation (by design), so the readings describe each regime on the day of measurement and not a steady treatment effect. At anthesis, gs was 23% and Pn 9% higher in PD than in CD (Figure 2), whereas leaf RWC differed by less than one percentage point. Stomatal closure before any marked loss of leaf water is the usual first response of wheat to drying soil, and it limits carbon gain before metabolic damage occurs [16,17]. Measurements on single leaves on three dates cannot be scaled directly to the canopy [33]. Nevertheless, the 6.5% increase in biomass and the 0.027 increase in the harvest index under pond supply are consistent with greater assimilate production around anthesis and a larger share of it allocated to grain. The response was also evident on individual spikes: a spike of PD carried 0.15–0.19 g more grain than a spike of CD, whereas spike number did not change (Section 2.4; Table S2). The yield gain was, therefore, expressed through the number of grains set on each spike rather than through spike number or grain size, consistent with the general finding that grain number per spike responds more strongly to water supply than grain size does [10,34].
The comparison between seasons supports this interpretation. Stress days were more numerous in 2023, yet the loss of kernels was larger in 2024 (Table 2). Before anthesis, when kernel number was being set, the canal-timed plots were stressed for longer and more severely in 2024, whereas the additional stress days of 2023 fell late in the window, during early grain filling (Figure 1). Kernel weight did not respond to treatment in either year, and two processes may have contributed. Fewer kernels per spike leave more assimilate per kernel during grain filling, and a moderate deficit during grain filling accelerates the remobilization of stem reserves, which buffers kernel weight against reduced current photosynthesis [15,35]. The same buffering may explain why PDR did not produce lighter kernels than PD despite lower gs and Pn values at 25 DAA and more stress days after the milk stage. Reduced irrigation after the milk stage, therefore, cost little yield, which is the trade-off on which regulated deficit irrigation relies [18,19,20]. The lower stomatal conductance of PDR at jointing did not affect spike number, which is largely fixed by that stage.
The relationships in Figure 3 are consistent with, but do not prove, a causal chain from root-zone deficit to kernel number. Because the stress gradient was created by the treatments, stress before and after anthesis was correlated across plots, and other differences between treatments could produce the same pattern. Nitrogen is the most likely alternative. Drip fertigation places N where roots are most active [36], and water and N supply interact strongly in determining wheat yield [37,38,39]. In this experiment, the same N rate was applied on the same dates in all treatments, and flag-leaf N concentration at anthesis did not differ among the three drip treatments, so CD is unlikely to have been more N-limited than PD when kernel number was set. Flag-leaf N at anthesis is, however, a single-time indicator; N dynamics earlier in the season, when florets were forming, were not measured, so a difference in N supply before anthesis cannot be excluded. The lower flag-leaf N of CB, where urea was broadcast before irrigation, did not lead to lower yield than in CD. Canopy temperature is a second candidate. Water-limited canopies are generally warmer, and heat around anthesis also reduces floret fertility [13], but canopy temperature was not measured, so this pathway remains a hypothesis. Both pathways would themselves result from the water deficit, so neither contradicts the main conclusion; the leaf and kernel responses are best interpreted as the combined effect of water status and its consequences.
3.3. Diversion, Consumption and Pond Evaporation
The water balance separates two effects that are usually reported together (Figure 4a). The change from border to drip irrigation reduced applied water by more than the total reduction from CB to PDR, but according to the drainage estimates, most of the water that was no longer applied had previously drained below the root zone (Table 1). Drainage of this kind is expected under border irrigation because a fixed depth is applied to a root zone whose deficit varies and water infiltrates unevenly along the border [40,41]. In three of the four border irrigations outside the critical window (29 April 2023, 5 May 2024 and 6 July 2024), the 78–88 mm applied was much larger than the depletion of the 0–60 cm layer before irrigation (about 25 to 55 mm; Figure 1), so a substantial part of the water had to pass below that layer; the exception was 4 July 2023, when depletion before irrigation (about 86 mm) was close to the depth applied. Drainage was not measured with lysimeters or tracers, however, and its size depended on the estimation procedure in Section 4.7. The remainder came from lower soil evaporation, which drip irrigation achieves by wetting only part of the surface [31], and from drawing down soil water that border irrigation had replenished. Only lower soil evaporation is a reduction in consumption. Drainage is a loss to the field but not necessarily to the basin. In an oasis where percolating water recharges groundwater that is pumped elsewhere or returns to the river, reducing drainage lowers diversion without lowering consumption, which is the central point of the irrigation efficiency paradox [6,7]. Studies in other arid irrigation districts reached the same conclusion: field-scale water savings depend on what happens to return flows and groundwater [8,42]. Because drainage under CB was estimated rather than measured, the ET term of the method contrast is the least certain. Estimates of this kind should be reported with their uncertainty [43], and Section 2.5 shows how an error in drainage propagates to ET. The finding that pond supply increased consumption rests mainly on the PD−CD contrast, in which neither treatment drained. The comparison between PDR and CB, which involves the estimated drainage, supports only the statement that no reduction in ET was detected.
Pond supply changed consumption in the opposite direction. By keeping the root zone above the stress threshold, it raised ET by 28 mm. Because PD and CD were both drip-irrigated on the same soil, the additional water use was probably mostly transpiration, which is consistent with the larger biomass and kernel number, but transpiration and soil evaporation were not measured separately, so this is an inference. More frequent wetting of the soil surface under PD (7–8 events against five in CD) would also have raised soil evaporation, so part of the 28 mm may have been evaporation. Water was used more productively, but more of it was consumed. Biomass increased by 6.5% and ET by 6.0%, as expected from the close coupling between biomass production and transpiration [9], and grain yield increased more than both because the harvest index also rose. Reduced irrigation outside the window recovered only a small part of the additional ET; most of its 30 mm reduction in irrigation came from soil water storage rather than from a lower ET. Water taken from storage by the end of one season has to be replaced by winter precipitation or pre-sowing irrigation before the next, so this reduction is a transfer between seasons and should not be read as a sustained saving; the experiment did not follow soil water storage into the following season. This agrees with the principle that deficit irrigation improves water productivity only when consumption falls during stages of low yield sensitivity [18,44], and with field results showing that well-timed reductions in irrigation can maintain wheat yield [45]. In this environment, the period before jointing offered little scope for reducing irrigation, because spring rain and stored soil water met most of the low early demand.
The pond adds a non-crop evaporation term of about 5 mm per season over the command area, equivalent to 1.4% of irrigation in PD (1.2–1.6% for pan coefficients of 0.6–0.8). This share is small compared with the losses reported for small agricultural reservoirs in warm, dry regions, where evaporation can remove a large fraction of the stored water [26]. The seasonal loss here equaled 11–12% of the design storage, but because the pond was refilled at each delivery, it was small relative to the volume that passed through it. Overall, the pond-supplied system with reduced irrigation outside the window diverted about 74 mm less water than farmer practice, including pond evaporation, but consumed about 14 mm more when ET and pond evaporation are both counted (the ET part of this difference carries the uncertainty of the CB drainage estimate; Section 2.5). Farm ponds in central China showed a similar pattern: the flexibility they gave raised water productivity, but net depletion did not fall [24]. Whether this exchange is desirable depends on the fate of drainage from border irrigation within the basin. Pond evaporation can be reduced by increasing depth relative to surface area or by covering the water surface, and pond size involves a trade-off between storage and yield stability [23]. The settling function of the pond, which protects drip emitters from sediment [25], is an engineering benefit that this experiment did not quantify.
The results also help to interpret the larger yield increases reported for the village. Yield gains on farms usually reflect several simultaneous changes in cultivar, fertilization, land leveling and irrigation [46]. The timing contrast of 0.86–1.02 t ha−1 measured here is the part attributable to pond supply under otherwise identical management, and it is a better basis than whole-farm comparisons for judging the benefit of ponds.
3.4. Implications for Pond Sizing and Limitations of This Study
The results suggest a simple criterion for when on-farm storage is worthwhile under rotational delivery. A refilled root zone supplies the crop for RAW/ETc days, where ETc is the crop evapotranspiration of the unstressed crop during the period of highest demand (here, the mean of the PD plots over the critical window). If the interval between deliveries during the critical window is shorter than this, drip irrigation on delivery dates is sufficient, and a pond adds little beyond sediment control. If the interval is longer, the storage needed per unit of command area is the interval multiplied by ETc, minus RAW. Supplementary Note S1 gives a worked example and lists the assumptions. At this site, the requirement was 52 mm in 2023 and 42 mm in 2024, close to the 46 mm that the pond holds over its command area (7 × 10⁴ m3 over 153 ha). These values use the mean of the three intervals that began inside the window (16.3 and 16.0 d), the ETc of the PD plots (6.7 and 6.2 mm d−1), the RAW of the 0–60 cm layer (57.5 mm) and no extraction below 60 cm; rainfall during the interval was ignored, which overstates the requirement, and evaporation from the pond was ignored, which understates it slightly. The same expression shows which conditions raise the requirement: coarser soils with less RAW, higher peak ET in hot seasons, and rotation calendars that lengthen the interval in dry years all widen the gap that storage must cover, whereas roots that extract water below the monitored layer narrow it. Two pond quantities need to be distinguished. Pond storage never fell below 41% of capacity in 2023 or 49% in 2024, so the largest draw-downs that actually occurred were 59% and 51% of capacity (if the pond was full at the start of each draw-down). These draw-downs were about half of the requirement calculated above, because not all fields in the command area were irrigated on demand. Had all 153 ha drawn water at the rate of the PD plots, the 2023 requirement (52 mm, about 79,600 m3) would have exceeded the pond capacity (46 mm, 70,000 m3), and the 2024 requirement (42 mm, about 64,300 m3) would have used 92% of it. The benefit measured in the plots, therefore, did not depend on pond capacity, but supplying every field in the command area on demand would need more storage than the pond holds in a season like 2023, and the margin would be narrow in a hotter season; this needs to be tested at the system scale [23].
The conclusions rest on two seasons at one site, with one cultivar and one soil, and describe short-term responses under the conditions observed. Two seasons, three plots per treatment and one site limit both the generality of the conclusions and the power to detect small effects. The direction of the timing effect was the same in two seasons that differed in rainfall, evaporative demand and the timing of stress relative to anthesis (Section 2.1 and Section 2.2), and the water balance in Section 3.1 indicates that it would persist unless rainfall during the window were two to three times higher than observed or the delivery interval shorter. This is encouraging but does not replace a longer series. A third season, preferably a hot and dry one, would test the size of the effect and the storage criterion under greater demand than was observed here. The conclusions are also specific to the calcareous silt loam, climate and canal water of this site. Pond operation was idealized because each pond-supplied plot could be irrigated whenever its trigger was reached. Soil water below 60 cm was not included in RAW, although roots may extract it, so stress days describe the monitored layer and may overstate stress in the canal-timed treatments. Drainage below the border-irrigated plots was estimated rather than measured, so the ET of CB, and every contrast that involves it, is less certain than the PD−CD contrast. Leaf gas exchange was measured on three dates, and the time since the last irrigation differed among treatments by design. Plants were not counted at harvest, so yield and biomass are expressed per unit area and per spike, not per plant (Table S2). Grain quality was assessed only through thousand-kernel weight, and the influences of air temperature and humidity on the treatment responses were not analyzed separately; ET0, which integrates them, was the same for all treatments within a year. The experiment did not address salt accumulation under drip irrigation without leaching or the multi-year effects of drawing down soil water storage; multi-year studies of water- and fertilizer-saving regimes [47] and joint optimization of water and N inputs [48] are needed to resolve these questions.
Soil salinity and alkalinity are further conditions on these results. The soil was calcareous, with pH 8.07–8.31 and an EC1:5 of 0.18–0.23 dS m−1 in the 0–100 cm profile before sowing (Table 3). Multiplying the EC1:5 by 10, a conversion factor commonly used for loam-textured soils [49], gave a saturated-paste conductivity (ECe) of about 2 dS m−1, and even a factor of 12, slightly above the highest published values compiled in [50], gave less than 3 dS m−1, well below the threshold of 6.0 dS m−1, above which wheat yield declines [51,52]. The pH was below 8.5, the value used to separate non-saline sodic soils [53], but pH alone does not show that the soil was non-sodic because that criterion refers to a saturated paste, and exchangeable sodium was not measured. At the start of the experiment, the soil was, therefore, alkaline and non-saline; a yield effect of salinity would not be expected, and sodicity could not be assessed. The plots were arranged in randomized blocks on one soil and received the same fertilizer, so any pre-existing heterogeneity was spread across treatments. Soil pH, EC and the quality of the irrigation water were, however, determined only once, before sowing in 2023, and not before and after irrigation or throughout the season, so the experiment cannot show whether the regimes differed in salt accumulation or leaching, or whether such differences affected photosynthesis, biomass or yield, as salt stress can through osmotic and ionic effects [54]. The regimes differ in a way that matters here. Border irrigation was estimated to drain 56 and 98 mm below 100 cm, which would leach salts, whereas no drainage was detected in the drip plots, so salts supplied with the water stay in the profile and can raise root-zone salinity during the season when the water is more saline, or rainfall is low, as reported for mulched drip irrigation in arid southern Xinjiang [55]. In more saline or sodic soils, the yield response and the water balance reported here could, therefore, differ, and soil pH, EC and water quality should be measured before and after irrigation in any test on such soils.
Table 3.
Properties of the 0–100 cm soil profile at the experimental site (sampled before sowing in 2023).
4. Materials and Methods
4.1. Study Site and Water Supply
The experiment was conducted in the 2023 and 2024 growing seasons in Yaozhanzi Village, Banjiegou Town, Qitai County, Changji Hui Autonomous Prefecture, Xinjiang, China (43°48′ N, 89°43′ E; 1086 m above sea level), on the northern piedmont of the eastern Tianshan Mountains. The climate is temperate continental and arid. At the Qitai meteorological station (1991–2020), the mean annual temperature is 5.8 °C, the mean annual precipitation is 276 mm, Class A pan evaporation is 1865 mm, and the frost-free period is 156 d. The groundwater table is deeper than 25 m. The soil is a calcareous silt loam (Table 3). Daily weather and Class A pan evaporation were recorded at an automatic weather station 1.2 km from the field, and ET0 was calculated with the FAO-56 Penman–Monteith equation [31].
Irrigation water comes from the Zhonggegen Reservoir and reaches the village through a regulating gate and a lateral canal, where flow is measured with a Parshall flume. Canal water is delivered according to a rotation calendar set by the irrigation district. A geomembrane-lined on-farm pond (design storage of 7 × 10⁴ m3; water-surface area of 17,800 m2 at full supply) stores canal water and supplies about 153 ha of farmland through a pumping station with sand-media and disc filters that feeds the drip network (Figure S1). The pond water level was read daily with a staff gauge and converted to storage using the stage–storage curve of the pond. The canal-timed plots were supplied directly from the lateral canal on delivery dates. The same canal water supplied all treatments, directly or through the pond; its salinity and chemical composition were not measured in this experiment.
4.2. Experimental Design and Treatments
Four irrigation regimes were arranged in a randomized complete block design with three replicates (Table 4). Treatments were assigned at random within each block, giving 12 plots per season and 24 plot-seasons in total. Each plot measured 8 m × 15 m and was separated from neighboring plots by a 2 m buffer. Border-irrigated plots were enclosed by earthen bunds, and a plastic sheet was inserted vertically to a 60 cm depth around them to prevent lateral seepage. The plot layout and the arrangement of bunds, drip laterals and soil water probes are shown in Figure S1. Each plot received the same treatment in both seasons.
Table 4.
Irrigation regimes and the factor isolated by each comparison.
Adjacent regimes differed in one management factor. CB and CD differed in application method under the same canal-imposed timing. CD and PD differed in timing under the same method and refill rule. In PD and PDR, irrigation was triggered when root-zone depletion reached 40% of TAW (41.8 mm), and each event refilled the 0–60 cm root zone to field capacity; in CD, the root zone was refilled to field capacity on each canal delivery date (Table 4). Because the pond is what makes on-demand supply possible, timing and water source cannot be separated in this design, and the total amount applied differed between CD and PD because the crop used more water when it was not stressed; this difference is treated as part of the timing effect. PD and PDR differed in the amount applied outside the critical window. The critical window was defined as jointing (Z31) to the milk stage (Z75) [56], the period in which kernel number is set and early grain filling occurs [9,11]. Outside this window, PDR was irrigated on the same days as PD, with 70% of the depth applied to PD. Reducing the depth of each event was preferred to lowering the refill target under an unchanged trigger, because the latter returns the root zone to the trigger sooner and, over successive events, applies almost the same total amount.
4.3. Crop Management
Spring wheat (Triticum aestivum L. cv. Xinchun 6) was sown on 6 April 2023 and 9 April 2024 at 390 kg ha−1 in rows 15 cm apart and harvested on 22 July 2023 and 25 July 2024. Jointing (Z31), anthesis (Z65) and the milk stage (Z75) were reached on 16 May, 13 June and 1 July in 2023, and on 18 May, 15 June and 3 July in 2024. In the drip treatments, one lateral served four rows (lateral spacing of 60 cm; emitter spacing of 30 cm; and emitter discharge of 2.6 L h−1). All plots received 240 kg N, 150 kg P2O5 and 75 kg K2O ha−1; 30% of the N and all the P and K were applied before sowing. The remaining N was top-dressed as urea in three equal splits on the canal delivery dates closest to jointing, booting and the end of anthesis because CB could receive water only on those dates. In CB, urea was broadcast immediately before irrigation; in CD, it was injected on the delivery date; and in PD and PDR, it was injected with the irrigation event nearest to each date (within 2 d). Weeds, pests and diseases were controlled uniformly according to local practice.
4.4. Irrigation, Root-Zone Depletion and Stress Days
Canal water was delivered on 29 April, 16 May, 1 June, 18 June and 4 July 2023 and on 5 May, 19 May, 5 June, 21 June and 6 July 2024, according to the dispatch records of the irrigation district, which were checked against the Parshall flume record. Applied water in each drip plot was recorded with a volumetric meter (accuracy of ±2%) at the plot inlet, and the inflow to each border plot was measured with a portable ultrasonic flow meter and multiplied by the inflow duration. Applied depth (mm) was calculated as the metered volume divided by the plot area (120 m2), so that all irrigation amounts are expressed per unit area; irrigation per plant was not measured separately because the plot was the experimental unit. Irrigation ended 10 d before harvest in all treatments.
Volumetric soil water content was logged hourly with EC-5 probes (METER Group, Pullman, WA, USA) installed at 10, 30 and 50 cm depths in the center of each plot, representing the 0–20, 20–40 and 40–60 cm layers. In the drip plots, the probes were placed midway between the lateral and adjacent wheat rows. The probes were calibrated against gravimetric samples. Soil was also sampled gravimetrically in 20 cm increments to 100 cm at sowing, jointing, anthesis and harvest at two positions per plot (beneath and midway between laterals), and bulk density (Table 3) was used to convert gravimetric to volumetric contents. Total available water (TAW, mm) and daily root-zone depletion (Dr, mm) in the 0–60 cm layer were calculated as
where θFC,j, θWP,j and θj are the volumetric water contents (m3 m−3) at field capacity, at the permanent wilting point and on the given day in layer j, and Δzj is the layer thickness (m). Depletion was calculated for the 0–60 cm layer, which the hourly probes covered; deeper layers were sampled only four times per season. Readily available water (RAW) was taken as 0.55 TAW (57.5 mm), the depletion fraction tabulated for spring wheat [31]. With the values in Table 3, RAW corresponds to a mean volumetric water content of the 0–60 cm layer of 0.20 m3 m−3 and the PD trigger (40% of TAW, 41.8 mm) to 0.23 m3 m−3, compared with 0.30 at field capacity and 0.12 at the wilting point. Stress days were the days between Z31 and Z75 on which the daily mean Dr exceeded the RAW; they were also counted separately before anthesis (Z31–Z65) and after it (Z65–Z75). Because the tabulated fraction applies to an ETc of about 5 mm d−1, stress days were recalculated with the fraction adjusted for the observed ETc (0.55 + 0.04 × (5 − 6.7) ≈ 0.48; RAW = 50.2 mm) [31] to test the sensitivity of the treatment differences. In PD and PDR, the daily mean Dr served as the irrigation trigger, and irrigation was normally applied within 2 d of the trigger being reached.
TAW = 1000 Σj=1…3 (θFC,j − θWP,j) Δzj,
Dr = 1000 Σj=1…3 (θFC,j − θj) Δzj,
4.5. Leaf Gas Exchange, Water Status and Nitrogen
Net photosynthetic rate (Pn) and stomatal conductance (gs) were measured with a portable photosynthesis system (LI-6800, LI-COR, Lincoln, NE, USA) at jointing (uppermost fully expanded leaf; 18 May 2023 and 20 May 2024), anthesis (flag leaf; 12 and 15 June) and 25 DAA (flag leaf; 8 and 10 July). The third date was set after Z75, when PDR had returned to reduced irrigation. Five leaves per plot were measured between 10:00 and 12:00 local solar time on clear days at a photosynthetic photon flux density of 1500 µmol m−2 s−1, a reference CO2 concentration of 400 µmol mol−1 and ambient temperature. All treatments were measured on the same day, and the number of days since the last irrigation was recorded for each plot. Leaf RWC was determined on five further leaves per plot as RWC = (FW − DW)/(TW − DW) × 100, where FW, TW and DW are fresh, turgid and oven-dry mass [57]. At anthesis, the oven-dried flag leaves from the RWC samples were ground, and their N concentration was determined by the Kjeldahl method.
4.6. Grain Yield and Yield Components
At maturity (Z92), plants were harvested from three 1 m2 quadrats per plot, avoiding edge rows. Sampling was, therefore, restricted to the interior of each plot, so that edge effects were excluded. Spikes were counted, kernels per spike were determined on 20 randomly selected spikes, and TKW was measured on three samples of 1000 kernels. Grain yield and TKW are reported at 12.5% moisture. Above-ground biomass was determined after oven-drying at 70 °C to constant mass, and the harvest index was calculated from oven-dry grain and biomass. Plants were not counted in the quadrats, so the yield response was also expressed per spike: grain mass per spike was calculated as kernels per spike × TKW/1000 (g spike−1), above-ground biomass per spike as biomass divided by spike number, and kernels per square meter as spikes per square meter × kernels per spike (Table S2). At the seeding rate of 390 kg ha−1, about 850–930 seeds were sown per square meter (for a seed mass of 42–46 g per 1000 seeds, the range of TKW at harvest), compared with 551–572 spikes m−2 at harvest, so the crop bore fewer spikes than seeds sown. All plots were sown on the same day at the same rate, and the regimes diverged only from the first irrigation after sowing, so plant number is not expected to have differed among treatments; because spike number did not differ either, relative treatment differences per plant would be the same as those per spike. Quadrat values were averaged to give one value per plot, so the plot was the experimental unit.
4.7. Water Balance, Water Productivity and Pond Evaporation
Seasonal evapotranspiration (ET, mm) for the 0–100 cm profile from sowing to harvest was calculated as
where P is precipitation, I is irrigation, ΔS is the change in soil water storage (harvest minus sowing), D is drainage below 100 cm, and R is surface runoff. Runoff was zero because the plots were level and bunded, and no ponding occurred in the drip plots; capillary rise was neglected because the groundwater table was deeper than 25 m. Drainage was estimated from the logged and gravimetric profiles as the water stored above field capacity in the 80–100 cm layer after each irrigation or rainfall event larger than 10 mm. Drainage was not measured directly (no lysimeters or drainage collectors were installed), and ET was obtained as the residual of Equation (3), so an error in D passes into ET with the opposite sign. Drainage was set to zero where no water above field capacity was found in the 80–100 cm layer; this is the “not detected” category in Table 1, with a resolution of about 0.01–0.02 m3 m−3 (2–4 mm of water in a 20 cm layer). Because this estimate is the most uncertain for border irrigation, the ET of CB is the least certain term of the water balance. Section 2.5 shows how an error in drainage would propagate to ET. Water productivity based on ET (WPET, kg m−3) and irrigation water productivity (IWP, kg m−3) were calculated as [58]
where Y is grain yield (kg ha−1), and ET and I are in mm.
ET = P + I − ΔS − D − R,
WPET = Y/(10 ET), IWP = Y/(10 I),
Evaporation from the pond during each season (Epond, m3) was estimated as Epond = Kp × Epan × A, where Epan is the Class A pan evaporation recorded at the site, A is the mean water-surface area of the pond (14,600 m2 in 2023 and 14,900 m2 in 2024), and Kp is the pan-to-lake coefficient for a Class A pan (0.7) [59]. The coefficient was held constant over the season; a change of ±0.1 changes Epond by ±14%. Seepage was assumed to be negligible because the pond is lined. Epond was divided by the command area and expressed as an equivalent depth (mm) and as a percentage of seasonal irrigation in PD, and a system-level IWP was obtained by adding this depth to I in Equation (4).
4.8. Statistical Analysis
Analyses were performed in R 4.3.2 with the packages lme4 [60], lmerTest [61] and emmeans. Season-level variables were analyzed with linear mixed models in which treatment, year and their interaction were fixed effects, and block and plot were random intercepts. The plot term accounts for the repeated use of the same plots in both seasons, so that in this balanced design, treatment is tested against the plot error. Denominator degrees of freedom were obtained by the Kenward–Roger method, and residuals were checked graphically and with the Shapiro–Wilk test. Treatment means were compared within each year by Tukey’s test. Tukey letters, therefore, group the four treatments within a year and can differ from a planned contrast because Tukey’s test adjusts for all six pairwise comparisons, whereas a planned contrast tests one. The three planned contrasts in Table 4 were estimated within each year and for the two-year mean with 95% confidence intervals (CIs), without further adjustment because they were specified before the experiment. Each claim in the text rests on one of these inferences: treatment effects on a variable are judged from the treatment term of the mixed model, the effects of method, timing and amount are judged from the planned contrasts and their confidence intervals, and Tukey letters are used only to group treatments within a year. Where the treatment × year interaction was significant, year-specific contrasts are reported, and the two-year mean is not used. With three plots per treatment and two seasons, the power to detect small differences is limited, so non-significant results are interpreted from their confidence intervals, and no post hoc power analysis was made. Because the three planned contrasts were not adjusted for multiplicity, a contrast whose confidence interval comes close to zero, such as the 2023 PD−CD yield difference, is treated as suggestive and not as confirmed. Because the three contrasts sum to the difference between PDR and CB, and Equation (3) links irrigation to ET, ΔS and D, the difference in irrigation for each contrast was partitioned into differences in these three terms. Leaf variables were analyzed with the same model plus growth stage and its interactions as fixed effects, and means across years (n = 6 plot-seasons) were compared within each stage. The dependence of kernels per spike and grain yield on stress days before anthesis was tested across the 24 plot-seasons by linear regression, with year as a categorical covariate, and a year × stress-day term tested whether the slopes differed between years. Because stress days were set by the treatments, and the same plots were used in both seasons, these regressions are descriptive. The 24 plot-seasons were treated as independent observations, which ignores the repeated use of the same plots and probably makes the confidence intervals too narrow. The SE was calculated from the three plot means per treatment and year (six plot-seasons for the leaf variables), not from quadrats, leaves or individual plants. The per-spike variables in Table S2 were calculated from the treatment means in Table 2 and were not analyzed separately; because spike number did not respond to treatment, their treatment differences follow those of grain yield and biomass. Values are means ± standard error (SE; n = 3 unless stated), and differences were considered significant at p < 0.05.
5. Conclusions
In a two-season experiment on a calcareous silt loam under canal rotation in an arid oasis, the yield benefit of on-farm pond storage for drip-irrigated spring wheat came from matching water supply to the critical period for kernel number; drip irrigation alone did not change yield. When drip irrigation was limited to canal delivery dates, the 14–17 d interval between deliveries exceeded the 8.5–9.2 d needed to deplete readily available water, and the crop accumulated 12–16 stress days between jointing and the milk stage. Pond supply reduced this to less than 2 d, was associated with higher stomatal conductance and photosynthesis at anthesis, and increased kernels per spike by 9–15% and grain yield by 12–14% (0.15–0.19 g more grain per spike), with no change in spike number or kernel weight. Drip irrigation on canal dates reduced irrigation by 106 mm, mostly estimated drainage that border irrigation had sent below the root zone. Pond supply, and the larger crop it supported, increased ET by 28 mm, and the lower irrigation depth outside the critical window cut irrigation by a further 30 mm, of which 22 mm came from soil water storage and is a deferral of demand to the next season, not a sustained saving. The pond-supplied system diverted about 74 mm less water than farmer practice, including pond evaporation (5.0–5.4 mm), but did not consume less.
For irrigation management, ponds should be sized and operated to cover the mean delivery interval between jointing and the milk stage, which, at this site, required 42–52 mm of storage over the command area in the two seasons observed, and any reduction in irrigation should be confined to periods outside this window. Claims of water saving for pond-supplied drip irrigation should be based on changes in ET and pond evaporation rather than on changes in diversion. Reductions in diversion should be reported as reduced diversion, and any part of them that comes from soil water storage only defers demand to the following season. These conclusions apply to short-term responses under similar soils (calcareous, non-saline at the start, and pH 8.1–8.3), climate, irrigation-water quality and rotation schedules. Soil salinity during the season, water quality and grain quality were not assessed, and observations over more seasons, together with system-scale tests in which many farmers share one pond, are needed before the conclusions can be generalized.
Supplementary Materials
The following supporting information can be downloaded at https://www.mdpi.com/article/10.3390/plants15223547/s1. Figure S1, Schematic of the experimental set-up at Yaozhanzi Village, Qitai County, Xinjiang; Table S1, Number of irrigation events and depth of irrigation applied by growth stage to spring wheat under four irrigation regimes in 2023 and 2024; Table S2, Grain mass and above-ground biomass per spike and kernels per square metre of spring wheat under four irrigation regimes in 2023 and 2024; Note S1, Worked example of the pond-storage criterion.
Funding
This research was funded by the Third Xinjiang Scientific Expedition of the Ministry of Science and Technology of the People’s Republic of China (grant number: 2022xjkk0902).
Institutional Review Board Statement
Not applicable.
Informed Consent Statement
Not applicable.
Data Availability Statement
The plot-level data for irrigation, soil water, drainage estimates, evapotranspiration, leaf gas exchange, yield components and yield in both seasons are available from the corresponding author on request.
Conflicts of Interest
The author declares no conflicts of interest.
Abbreviations
The following abbreviations are used in this manuscript:
| CB | Canal-timed border irrigation |
| CD | Canal-timed drip irrigation |
| PD | Pond-supplied drip irrigation on demand |
| PDR | PD with 70% of the PD depth applied outside the critical window |
| DAA | Days after anthesis |
| ET | Evapotranspiration |
| ET0 | Reference evapotranspiration |
| ETc | Crop evapotranspiration of the unstressed crop during the critical window (mean of the PD plots) |
| Dr | Root-zone depletion |
| HI | Harvest index |
| IWP | Irrigation water productivity |
| gs | Stomatal conductance |
| Pn | Net photosynthetic rate |
| RAW | Readily available water |
| RWC | Relative water content |
| TAW | Total available water |
| TKW | Thousand-kernel weight |
| WPET | Water productivity based on evapotranspiration |
| Z | Zadoks growth stage |
References
- Liu, X.; Liu, W.; Tang, Q.; Liu, B.; Wada, Y.; Yang, H. Global agricultural water scarcity assessment incorporating blue and green water availability under future climate change. Earth’s Future 2022, 10, e2021EF002567. [Google Scholar] [CrossRef] [Scilit]
- Kang, S.; Hao, X.; Du, T.; Tong, L.; Su, X.; Lu, H.; Li, X.; Huo, Z.; Li, S.; Ding, R. Improving agricultural water productivity to ensure food security in China under changing environment: From research to practice. Agric. Water Manag. 2017, 179, 5–17. [Google Scholar] [CrossRef] [Scilit]
- Chen, R.; Xiong, X.-P.; Cheng, W.-H. Root characteristics of spring wheat under drip irrigation and their relationship with aboveground biomass and yield. Sci. Rep. 2021, 11, 4913. [Google Scholar] [CrossRef] [Scilit]
- Ma, J.; Yin, B.; Jing, C.; Li, W.; Qiao, Y.; Zhang, L.; Fan, H.; Gu, L.; Zhen, W. Evaluating the effectiveness of water-saving irrigation on wheat (Triticum aestivum L.) production in China: A meta-analytical approach. Plants 2025, 14, 2837. [Google Scholar] [CrossRef] [Scilit]
- Wan, W.; Zhao, Y.; Li, X.; Xu, J.; Liu, K.; Guan, S.; Chai, Y.; Xu, H.; Cui, H.; Chen, X.; et al. A moderate reduction in irrigation and nitrogen improves water-nitrogen use efficiency, productivity, and profit under new type of drip irrigated spring wheat system. Front. Plant Sci. 2022, 13, 1005945. [Google Scholar] [CrossRef] [Scilit]
- Grafton, R.Q.; Williams, J.; Perry, C.J.; Molle, F.; Ringler, C.; Steduto, P.; Udall, B.; Wheeler, S.A.; Wang, Y.; Garrick, D.; et al. The paradox of irrigation efficiency. Science 2018, 361, 748–750. [Google Scholar] [CrossRef] [Scilit]
- Yue, Z.; Zhuo, L.; Ji, X.; Tian, P.; Gao, J.; Wang, W.; Sun, F.; Duan, Y.; Wu, P. Water-saving irrigated area expansion hardly enhances crop yield while saving water under climate scenarios in China. Commun. Earth Environ. 2025, 6, 295. [Google Scholar] [CrossRef] [Scilit]
- Wu, Z.; Li, Y.; Wang, R.; Xu, X.; Ren, D.; Huang, Q.; Xiong, Y.; Huang, G. Evaluation of irrigation water saving and salinity control practices of maize and sunflower in the upper Yellow River basin with an agro-hydrological model based method. Agric. Water Manag. 2023, 278, 108157. [Google Scholar] [CrossRef] [Scilit]
- Steduto, P.; Hsiao, T.C.; Fereres, E.; Raes, D. Crop Yield Response to Water; FAO Irrigation and Drainage Paper 66; FAO: Rome, Italy, 2012. [Google Scholar]
- Sadras, V.O.; Slafer, G.A. Environmental modulation of yield components in cereals: Heritabilities reveal a hierarchy of phenotypic plasticities. Field Crops Res. 2012, 127, 215–224. [Google Scholar] [CrossRef] [Scilit]
- Fischer, R.A. Number of kernels in wheat crops and the influence of solar radiation and temperature. J. Agric. Sci. 1985, 105, 447–461. [Google Scholar] [CrossRef] [Scilit]
- Saini, H.S.; Aspinall, D. Effect of water deficit on sporogenesis in wheat (Triticum aestivum L.). Ann. Bot. 1981, 48, 623–633. [Google Scholar] [CrossRef] [Scilit]
- Barnabás, B.; Jäger, K.; Fehér, A. The effect of drought and heat stress on reproductive processes in cereals. Plant Cell Environ. 2008, 31, 11–38. [Google Scholar] [CrossRef] [Scilit]
- Dolferus, R.; Ji, X.; Richards, R.A. Abiotic stress and control of grain number in cereals. Plant Sci. 2011, 181, 331–341. [Google Scholar] [CrossRef] [Scilit]
- Yang, J.; Zhang, J. Grain filling of cereals under soil drying. New Phytol. 2006, 169, 223–236. [Google Scholar] [CrossRef] [Scilit]
- Chaves, M.M.; Flexas, J.; Pinheiro, C. Photosynthesis under drought and salt stress: Regulation mechanisms from whole plant to cell. Ann. Bot. 2009, 103, 551–560. [Google Scholar] [CrossRef] [Scilit]
- Sommer, S.G.; Han, E.; Li, X.; Rosenqvist, E.; Liu, F. The chlorophyll fluorescence parameter Fv/Fm correlates with loss of grain yield after severe drought in three wheat genotypes grown at two CO2 concentrations. Plants 2023, 12, 436. [Google Scholar] [CrossRef] [Scilit]
- Fereres, E.; Soriano, M.A. Deficit irrigation for reducing agricultural water use. J. Exp. Bot. 2007, 58, 147–159. [Google Scholar] [CrossRef] [Scilit]
- Chai, Q.; Gan, Y.; Zhao, C.; Xu, H.-L.; Waskom, R.M.; Niu, Y.; Siddique, K.H.M. Regulated deficit irrigation for crop production under drought stress. A review. Agron. Sustain. Dev. 2016, 36, 3. [Google Scholar] [CrossRef] [Scilit]
- Yu, L.; Zhao, X.; Gao, X.; Siddique, K.H.M. Improving/maintaining water-use efficiency and yield of wheat by deficit irrigation: A global meta-analysis. Agric. Water Manag. 2020, 228, 105906. [Google Scholar] [CrossRef] [Scilit]
- Oweis, T.; Hachum, A. Water harvesting and supplemental irrigation for improved water productivity of dry farming systems in West Asia and North Africa. Agric. Water Manag. 2006, 80, 57–73. [Google Scholar] [CrossRef] [Scilit]
- Zhang, F.; He, C.; Fan, Y.; Hao, X.; Kang, S. Canal delivery and irrigation scheduling optimization based on crop water demand. Agric. Water Manag. 2022, 260, 107245. [Google Scholar] [CrossRef] [Scilit]
- Vico, G.; Tamburino, L.; Rigby, J.R. Designing on-farm irrigation ponds for high and stable yield for different climates and risk-coping attitudes. J. Hydrol. 2020, 584, 124634. [Google Scholar] [CrossRef] [Scilit]
- Roost, N.; Cai, X.L.; Turral, H.; Molden, D.; Cui, Y.L. Adapting to intersectoral transfers in the Zhanghe Irrigation System, China: Part II. Impacts of in-system storage on water balance and productivity. Agric. Water Manag. 2008, 95, 685–697. [Google Scholar] [CrossRef] [Scilit]
- Lv, C.; Niu, W.; Du, Y.; Sun, J.; Dong, A.; Wu, M.; Mu, F.; Zhu, J.; Siddique, K.H.M. A meta-analysis of labyrinth channel emitter clogging characteristics under Yellow River water drip tape irrigation. Agric. Water Manag. 2024, 291, 108634. [Google Scholar] [CrossRef] [Scilit]
- Aminzadeh, M.; Friedrich, N.; Narayanaswamy, S.G.; Madani, K.; Shokri, N. Evaporation loss from small agricultural reservoirs in a warming climate: An overlooked component of water accounting. Earth’s Future 2024, 12, e2023EF004050. [Google Scholar] [CrossRef] [Scilit]
- Kadbhane, S.J.; Manekar, V.L. An experimental study on the grape orchard: Effects comparison of two irrigation systems. J. Water Land Dev. 2017, 32, 41–51. [Google Scholar] [CrossRef] [Scilit]
- Fang, Q.; Zhang, X.; Shao, L.; Chen, S.; Sun, H. Assessing the performance of different irrigation systems on winter wheat under limited water supply. Agric. Water Manag. 2018, 196, 133–143. [Google Scholar] [CrossRef] [Scilit]
- Zhao, J.; Xu, X.; Liu, S.; Jia, J.; Li, M.; Huang, H.; Zhang, G.; Zhao, C. Optimizing wheat prosperity: Innovative drip irrigation and nitrogen management strategies for enhanced yield and quality of winter wheat in the Huang-Huai-Hai region. Front. Plant Sci. 2024, 15, 1454205. [Google Scholar] [CrossRef] [Scilit]
- Wu, P.; Wang, Y.; Li, Y.; Yu, H.; Shao, J.; Zhao, Z.; Qiao, Y.; Liu, C.; Liu, S.; Gao, C.; et al. Evaluating optimized irrigation strategies on crop productivity and field water utilization under micro sprinkling irrigation in typical cropping systems of the Huang-Huai-Hai Plain. Eur. J. Agron. 2024, 154, 127093. [Google Scholar] [CrossRef] [Scilit]
- Allen, R.G.; Pereira, L.S.; Raes, D.; Smith, M. Crop Evapotranspiration: Guidelines for Computing Crop Water Requirements; FAO Irrigation and Drainage Paper 56; FAO: Rome, Italy, 1998. [Google Scholar]
- Hao, T.; Zhu, Z.; Zhang, Y.; Liu, S.; Xu, Y.; Xu, X.; Zhao, C. Effects of drip irrigation and fertilization frequency on yield, water and nitrogen use efficiency of medium and strong gluten wheat in the Huang-Huai-Hai Plain of China. Agronomy 2023, 13, 1564. [Google Scholar] [CrossRef] [Scilit]
- Nguyen, T.H.; Langensiepen, M.; Gaiser, T.; Webber, H.; Ahrends, H.; Hüging, H.; Ewert, F. Responses of winter wheat and maize to varying soil moisture: From leaf to canopy. Agric. For. Meteorol. 2022, 314, 108803. [Google Scholar] [CrossRef] [Scilit]
- Slafer, G.A.; Savin, R.; Sadras, V.O. Coarse and fine regulation of wheat yield components in response to genotype and environment. Field Crops Res. 2014, 157, 71–83. [Google Scholar] [CrossRef] [Scilit]
- Xue, Q.; Zhu, Z.; Musick, J.T.; Stewart, B.A.; Dusek, D.A. Physiological mechanisms contributing to the increased water-use efficiency in winter wheat under deficit irrigation. J. Plant Physiol. 2006, 163, 154–164. [Google Scholar] [CrossRef] [Scilit]
- Li, J.; Xu, X.; Lin, G.; Wang, Y.; Liu, Y.; Zhang, M.; Zhou, J.; Wang, Z.; Zhang, Y. Micro-irrigation improves grain yield and resource use efficiency by co-locating the roots and N-fertilizer distribution of winter wheat in the North China Plain. Sci. Total Environ. 2018, 643, 367–377. [Google Scholar] [CrossRef] [Scilit]
- Yuan, Y.; Lin, F.; Maucieri, C.; Zhang, Y. Efficient irrigation methods and optimal nitrogen dose to enhance wheat yield, inputs efficiency and economic benefits in the North China Plain. Agronomy 2022, 12, 273. [Google Scholar] [CrossRef] [Scilit]
- Li, J.; Wang, Z.; Song, Y.; Li, J.; Zhang, Y. Effects of reducing nitrogen application rate under different irrigation methods on grain yield, water and nitrogen utilization in winter wheat. Agronomy 2022, 12, 1835. [Google Scholar] [CrossRef] [Scilit]
- Wang, D.; Liu, S.; Guo, M.; Cheng, Y.; Shi, L.; Li, J.; Yu, Y.; Wu, S.; Dong, Q.; Ge, J.; et al. Optimizing nitrogen fertilization and irrigation practices for enhanced winter wheat productivity in the North China Plain: A meta-analysis. Plants 2025, 14, 1686. [Google Scholar] [CrossRef] [Scilit]
- Pereira, L.S.; Oweis, T.; Zairi, A. Irrigation management under water scarcity. Agric. Water Manag. 2002, 57, 175–206. [Google Scholar] [CrossRef] [Scilit]
- Burt, C.M.; Clemmens, A.J.; Strelkoff, T.S.; Solomon, K.H.; Bliesner, R.D.; Hardy, L.A.; Howell, T.A.; Eisenhauer, D.E. Irrigation performance measures: Efficiency and uniformity. J. Irrig. Drain. Eng. 1997, 123, 423–442. [Google Scholar] [CrossRef] [Scilit]
- Yan, W.; Li, F.; Zhao, Y. Determination of irrigation water quantity and its impact on crop yield and groundwater. Agric. Water Manag. 2022, 273, 107900. [Google Scholar] [CrossRef] [Scilit]
- Clemmens, A.J.; Burt, C.M. Accuracy of irrigation efficiency estimates. J. Irrig. Drain. Eng. 1997, 123, 443–453. [Google Scholar] [CrossRef] [Scilit]
- Geerts, S.; Raes, D. Deficit irrigation as an on-farm strategy to maximize crop water productivity in dry areas. Agric. Water Manag. 2009, 96, 1275–1284. [Google Scholar] [CrossRef] [Scilit]
- Mehmood, F.; Wang, G.; Abubakar, S.A.; Zain, M.; Rahman, S.U.; Gao, Y.; Duan, A. Optimizing irrigation management sustained grain yield, crop water productivity, and mitigated greenhouse gas emissions from the winter wheat field in North China Plain. Agric. Water Manag. 2023, 290, 108599. [Google Scholar] [CrossRef] [Scilit]
- Lobell, D.B.; Cassman, K.G.; Field, C.B. Crop yield gaps: Their importance, magnitudes, and causes. Annu. Rev. Environ. Resour. 2009, 34, 179–204. [Google Scholar] [CrossRef] [Scilit]
- Li, H.; Li, X.; Mei, X.; Nangia, V.; Guo, R.; Hao, W.; Wang, J. An alternative water-fertilizer-saving management practice for wheat-maize cropping system in the North China Plain: Based on a 4-year field study. Agric. Water Manag. 2023, 276, 108053. [Google Scholar] [CrossRef] [Scilit]
- Huang, X.; Xu, X.; Zhu, Q.; Zhang, Y. Optimizing water and nitrogen inputs for sustainable wheat yields and minimal environmental impacts. Agric. Syst. 2024, 220, 104061. [Google Scholar] [CrossRef] [Scilit]
- Slavich, P.G.; Petterson, G.H. Estimating the electrical conductivity of saturated paste extracts from 1:5 soil, water suspensions and texture. Aust. J. Soil Res. 1993, 31, 73–81. [Google Scholar] [CrossRef] [Scilit]
- Kargas, G.; Londra, P.; Sotirakoglou, K. The effect of soil texture on the conversion factor of 1:5 soil/water extract electrical conductivity (EC1:5) to soil saturated paste extract electrical conductivity (ECe). Water 2022, 14, 642. [Google Scholar] [CrossRef] [Scilit]
- Maas, E.V.; Hoffman, G.J. Crop salt tolerance—Current assessment. J. Irrig. Drain. Div. ASCE 1977, 103, 115–134. [Google Scholar] [CrossRef] [Scilit]
- Ayers, R.S.; Westcot, D.W. Water Quality for Agriculture; FAO Irrigation and Drainage Paper 29 Rev. 1; FAO: Rome, Italy, 1985. [Google Scholar]
- Richards, L.A. (Ed.) Diagnosis and Improvement of Saline and Alkali Soils; USDA Agriculture Handbook No. 60; U.S. Government Printing Office: Washington, DC, USA, 1954. [Google Scholar]
- Munns, R.; Tester, M. Mechanisms of salinity tolerance. Annu. Rev. Plant Biol. 2008, 59, 651–681. [Google Scholar] [CrossRef] [Scilit]
- Wang, Z.; Jin, M.; Šimůnek, J.; van Genuchten, M.T. Evaluation of mulched drip irrigation for cotton in arid Northwest China. Irrig. Sci. 2014, 32, 15–27. [Google Scholar] [CrossRef] [Scilit]
- Zadoks, J.C.; Chang, T.T.; Konzak, C.F. A decimal code for the growth stages of cereals. Weed Res. 1974, 14, 415–421. [Google Scholar] [CrossRef] [Scilit]
- Barrs, H.D.; Weatherley, P.E. A re-examination of the relative turgidity technique for estimating water deficits in leaves. Aust. J. Biol. Sci. 1962, 15, 413–428. [Google Scholar] [CrossRef] [Scilit]
- Molden, D.; Oweis, T.; Steduto, P.; Bindraban, P.; Hanjra, M.A.; Kijne, J. Improving agricultural water productivity: Between optimism and caution. Agric. Water Manag. 2010, 97, 528–535. [Google Scholar] [CrossRef] [Scilit]
- Kohler, M.A.; Nordenson, T.J.; Fox, W.E. Evaporation from Pans and Lakes; Research Paper No. 38; U.S. Department of Commerce, Weather Bureau: Washington, DC, USA, 1955. [Google Scholar]
- Bates, D.; Mächler, M.; Bolker, B.; Walker, S. Fitting linear mixed-effects models using lme4. J. Stat. Softw. 2015, 67, 1–48. [Google Scholar]
- Kuznetsova, A.; Brockhoff, P.B.; Christensen, R.H.B. lmerTest package: Tests in linear mixed effects models. J. Stat. Softw. 2017, 82, 1–26. [Google Scholar] [CrossRef] [Scilit]
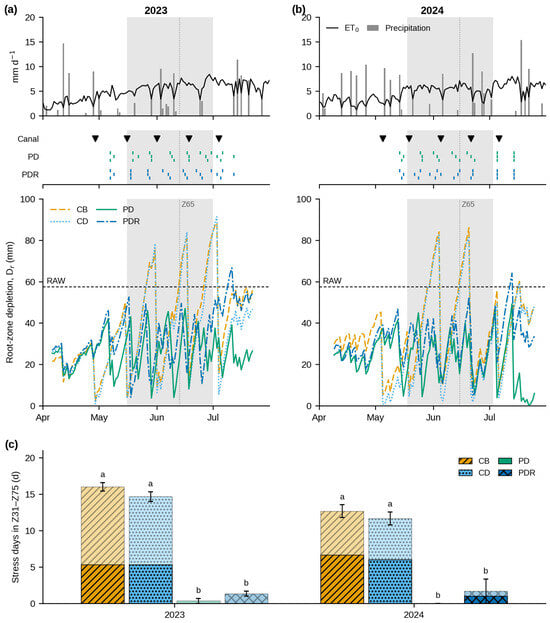
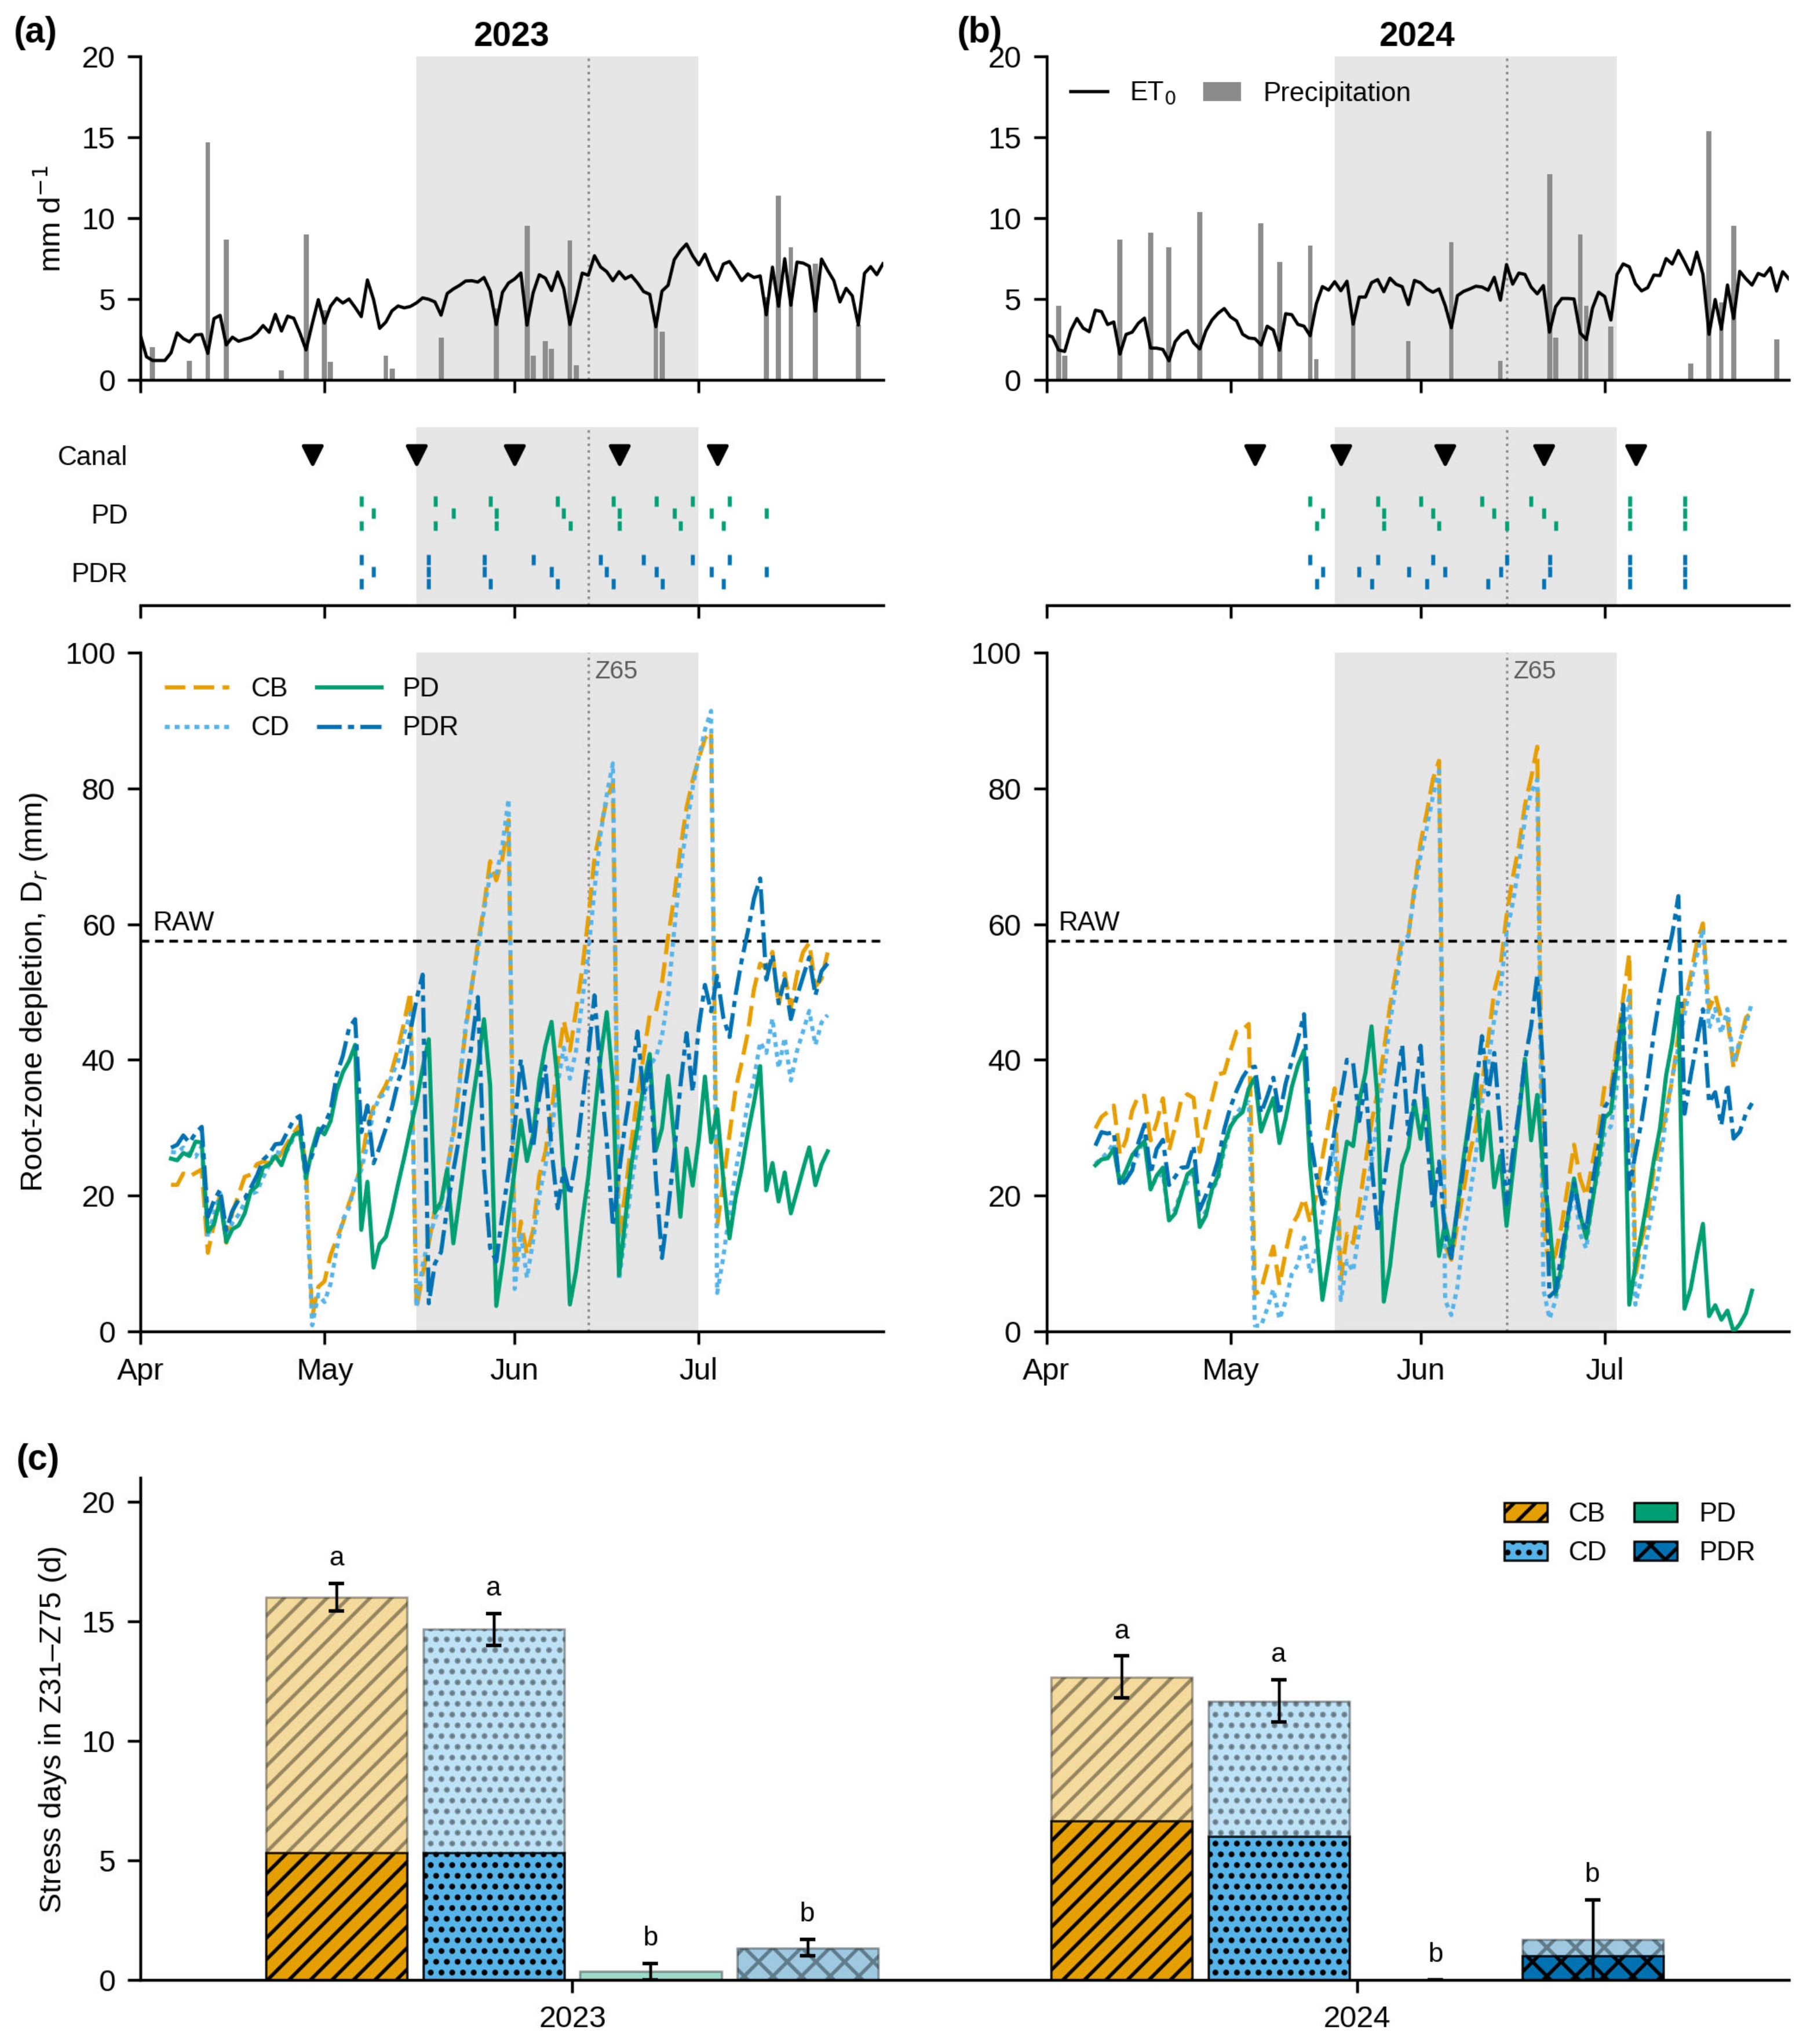
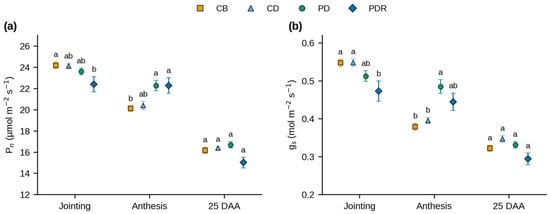
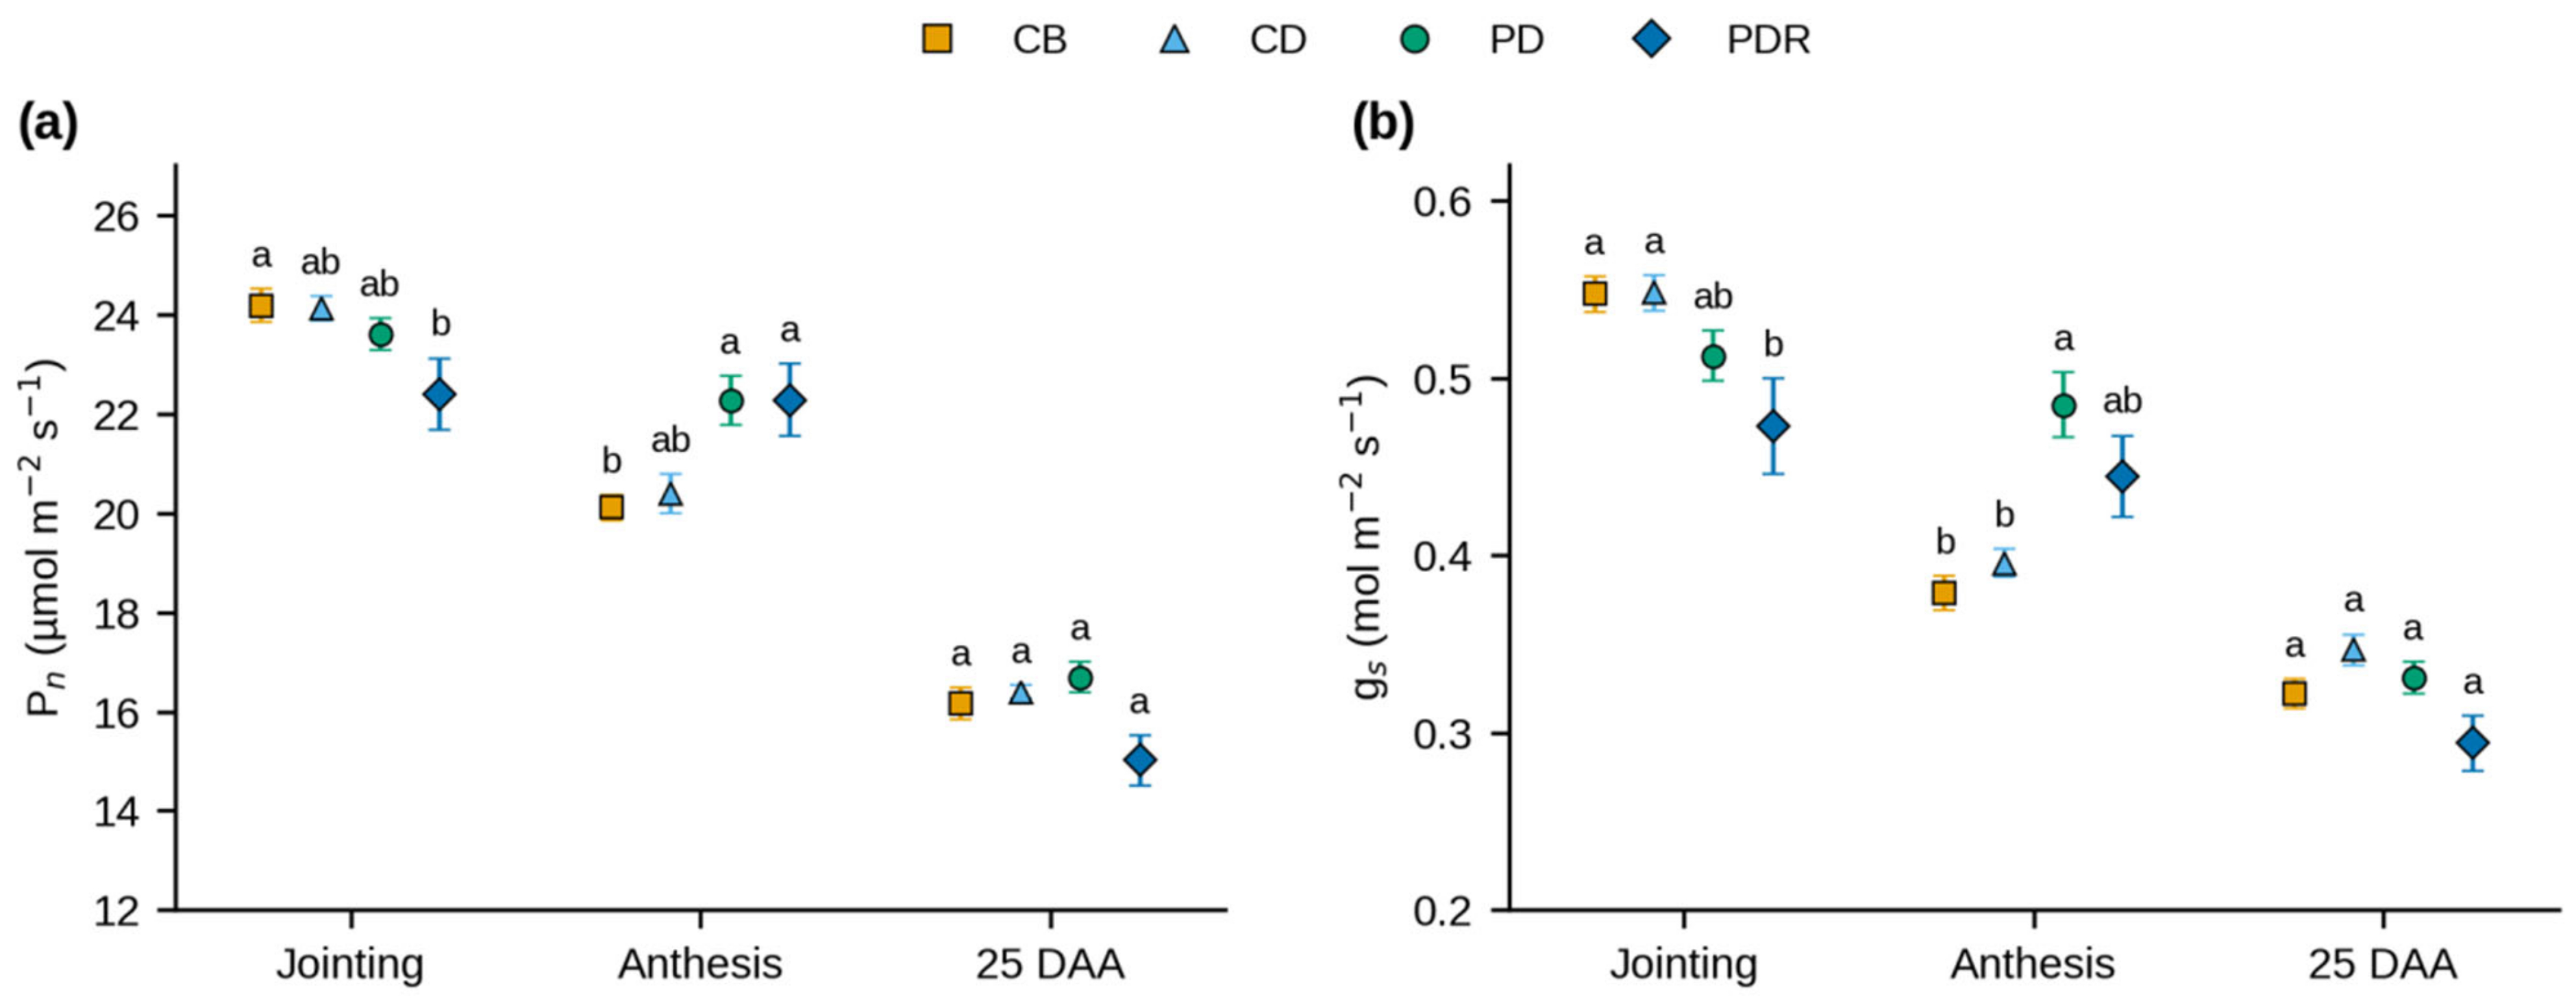
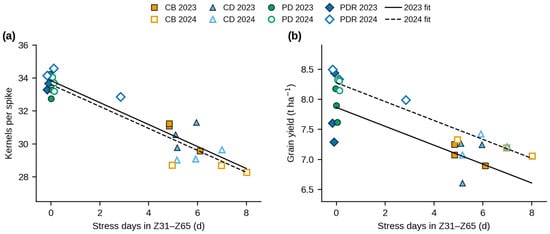
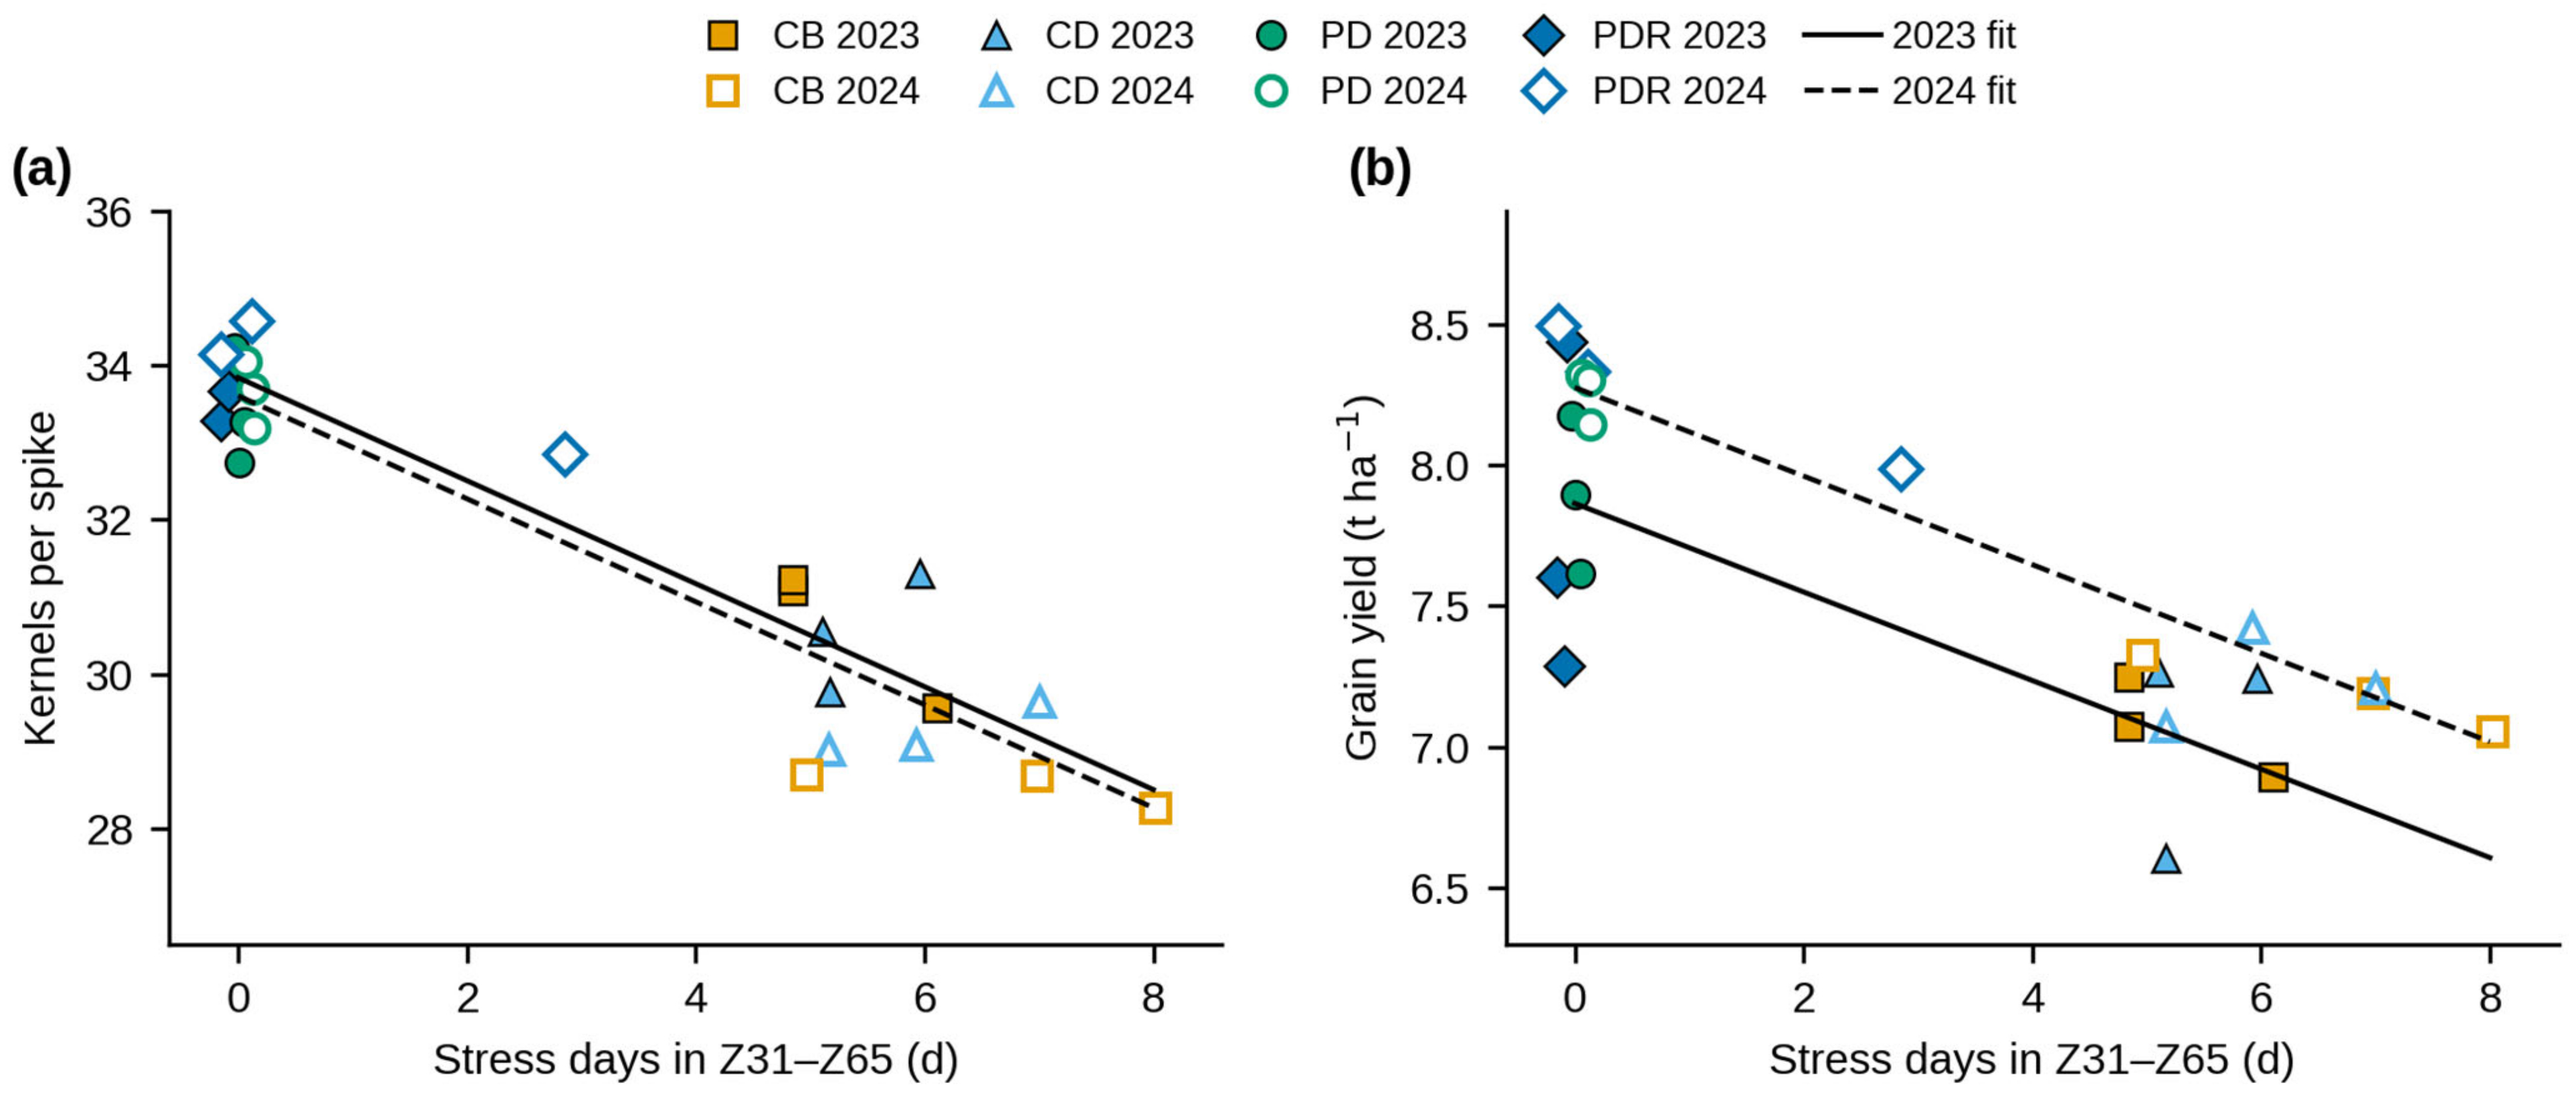
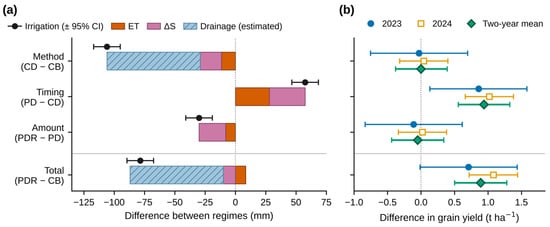
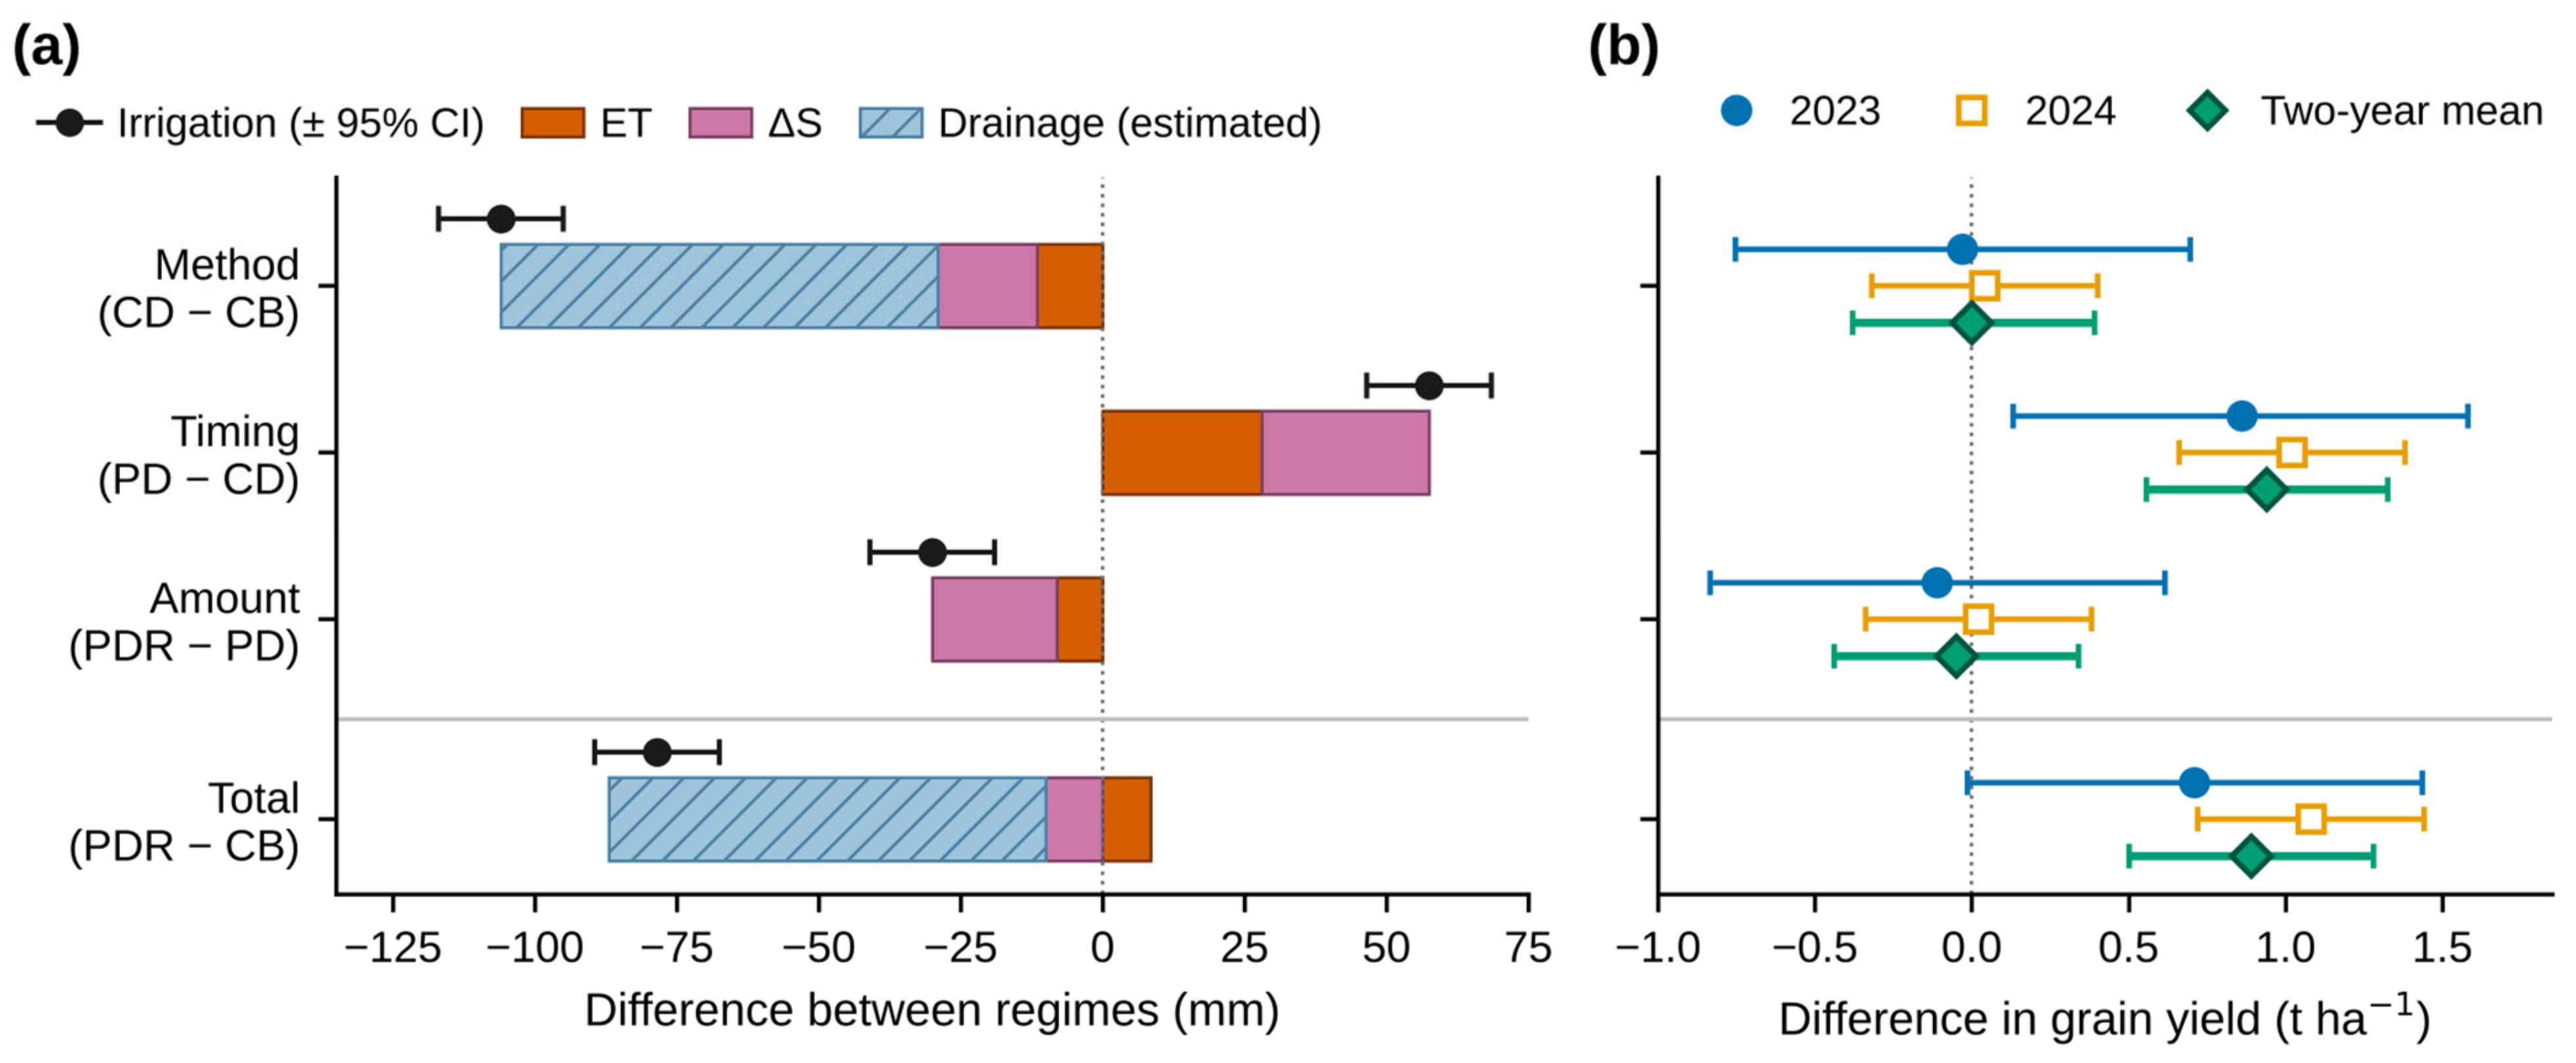

Disclaimer/Publisher’s Note: The statements, opinions and data contained in all publications are solely those of the individual author(s) and contributor(s) and not of MDPI and/or the editor(s). MDPI and/or the editor(s) disclaim responsibility for any injury to people or property resulting from any ideas, methods, instructions or products referred to in the content. |
© 2026 by the author. Licensee MDPI, Basel, Switzerland. This article is an open access article distributed under the terms and conditions of the Creative Commons Attribution (CC BY) license.