


Abstract
Soil nitrogen (N) availability modulates the relative magnitudes and dominant roles of stomatal, mesophyll, and biochemical limitations to photosynthesis (denoted as lsc, lm, and lb, respectively); however, the dynamic changes in these factors and their relative contributions under varying N application levels remain controversial. In this study, we quantified the responses of photosynthetic limitations in soybeans subjected to four N application levels (0, 7.5, 15.0, and 22.5 g urea m−2). Moderate N addition (≤15.0 g urea m−2) increased lsc and lb but decreased lm, whereas excessive N addition (22.5 g urea m−2) caused a rapid increase in lm, exceeding both lsc and lb. lm was negatively correlated with mesophyll conductance (gm) and net photosynthetic rate (An), whereas lb was positively correlated with An. Changes in photosynthetic limitation were accompanied by increased chlorophyll and leaf N contents and increased activities of aquaporins (AQPs), carbonic anhydrase (CA), and Rubisco under moderate N addition. These results indicated that the relative contribution of lm to the total limitation (denoted as MCL) decreased under moderate N addition but increased sharply under high N addition, exceeding the contributions of lsc and lb (denoted as SCL and BL, respectively). Under an excessive N supply of 22.5 g urea m−2, MCL was the highest among the three components, although this ranking should be interpreted considering the reference-state dependence of the limitation framework. This study provides a basis for rational N fertilization in soybean production.
1. Introduction
Photosynthesis is the core physiological process of plant carbon assimilation and directly affects the growth, development, and yield of plants [1,2]. The efficiency of photosynthesis is regulated by multiple internal and external factors, among which the availability of nutrients, especially nitrogen (N), is among the most critical [3]. N is a key nutrient element for soybean growth, development, and photosynthetic processes; it directly affects Rubisco activity, stomatal development, mesophyll cell structure, and other traits, thereby regulating the partitioning of photosynthetic limitation components [4,5,6]. As a typical legume crop, soybean can establish symbioses with rhizobia to acquire atmospheric N via biological N fixation, whereas high mineral-N input typically represses nodule initiation and reduces symbiotic N-fixation capacity [7,8]. Nevertheless, the present study focuses mainly on the physiological responses of leaf photosynthetic limitations to externally supplied mineral N.
The limitations to photosynthesis in plants can be divided into three main categories: stomatal limitation (lsc), mesophyll limitation (lm), and biochemical limitation (lb) [9]. lsc results from reduced stomatal conductance (gsc), which restricts CO2 entry into leaves. Subsequently, lm is governed by mesophyll conductance (gm), which controls CO2 diffusion from intercellular airspaces to chloroplast carboxylation sites. Ultimately, lb results from decreased activity of photosynthesis-related enzymes (e.g., Rubisco) and impaired product synthesis, thereby constraining CO2 fixation efficiency [10,11]. Photosynthetic limitation analysis serves as a central tool for determining the mechanism by which N regulates photosynthesis. Identifying the dominant limiting factor in the presence of different amounts of N is highly important for precise N management in soybean production. Previous studies have shown that N application can increase plant photosynthetic capacity by increasing chlorophyll content and photosynthesis-related enzyme activity [12,13,14], but the dynamic changes in the three types of photosynthetic limitations upon the application of different amounts of N and their relative contributions to photosynthesis are still controversial.
Both N deficiency and abundance can reduce the photosynthetic rate [12]. Most previous studies on N application and photosynthesis have focused on changes in the photosynthetic rate and related parameters [6,13,15], whereas quantitative analyses of photosynthetic limitations and of the mechanisms regulating these limitations remain scarce. Consequently, the reported dominant limitation under N deficiency is still debated: some studies identified lsc as the main constraint [15], whereas others emphasized lm or lb [16,17]. In our latest study, Zuo et al. (2026) showed that enhanced biochemical metabolism under N addition was the dominant factor improving intraleaf CO2 diffusion in soybean leaves [18]; however, it remains unclear whether this enhancement mainly reflects increased photosynthetic carbon assimilation after soil N addition. In addition, excessive N application can lead to nutrient imbalance [19,20], which may cause a decrease in photosynthetic efficiency, but the specific type and degree of photosynthetic limitation under excessive N still need clarification.
Accordingly, the aim of this study was to quantify the dynamic changes in the photosynthetic limitation components (lsc, lm, and lb) of soybean when different amounts of N are added and identify the dominant limiting factor responsible for reduced photosynthesis under varied N conditions. We hypothesized that lsc and lb are the dominant constraints that lead to the increase in photosynthesis under low N conditions, that no obvious dominant limitation occurs under only moderate N conditions, and that lm prevails only under high N conditions. The findings of this study will fill the research gap concerning the relationship between N application and photosynthetic limitations in soybean, elucidate the intrinsic mechanism through which N regulates soybean photosynthesis, and provide a theoretical basis and technical reference for the precise application of N fertilizer and for improving photosynthetic efficiency and grain yield in soybean.
2. Materials and Methods
2.1. Plant Material
Seedlings of the disease- and drought-resistant soybean (Glycine max L.) cultivar ‘Jindou 23’ (state-certified No. 2001011) were planted in individual pots at the Experimental Station of the College of Resources and Environment, Shanxi Agricultural University, Taigu, Shanxi, China (37°43′ N, 112°56′ E; 791 m a.s.l.) in late March 2021, with three replicate pots per treatment and two seedlings per pot. The pots were 12.2 L in volume, with a height of 24.0 cm and a diameter of 31.0 cm, and were filled with 7.4 L of soil. The initial soil total N content was 0.58 g kg−1, and the phosphorus content was 0.88 g kg−1. The baseline soil N content was determined using the Kjeldahl digestion method on air-dried soil samples passed through a 2 mm sieve prior to the addition of N and is expressed as total soil N content rather than being estimated from soil organic matter. The plant roots were blocked from the outside soil by pedestals placed under the pots. The relevant morphological parameters of the soybean seedlings when gas exchange was measured are shown in Table 1.
Table 1.
Height (H) and base diameter (D) of the soybean seedlings.
2.2. Experimental Design
Four N application levels, 0 (no N addition, CK), 7.5 (low N addition, LN), 15.0 (medium N addition, MN) and 22.5 g urea m−2 (high N addition, HN), were used to simulate the ecological effects under varying intensities of atmospheric N deposition. Urea solutions with different concentrations of N were sprayed evenly onto the surface of the rhizosphere soil in the different treatment groups. The plants in the CK group were sprayed with the same volume of water. Three replicates (i.e., three potted plants) were included in each treatment group, with two seedlings retained per pot. Six fully expanded mature leaves (three leaves from each individual plant) were selected per pot for measurements of photosynthetic and physiological parameters, and the mean values were taken as the replicate values for that potted plant. All the potted slings were thoroughly watered daily to avoid water deficit.
2.3. Analysis of Photosynthesis Limitations
Gas exchange and chlorophyll fluorescence on newly and fully expanded, sun-exposed leaves were simultaneously measured using an open-flow gas exchange system (Li-6400XT; LI-COR Inc., Lincoln, NE, USA) equipped with an integrated fluorescence leaf chamber (Li-6400-40; LI-COR) from 12 to 20 July 2022. During this period, the leaves were fully light-adapted under a saturated photosynthetically active photon flux density (PPFD) of 1200 µmol m−2 s−1 provided by Li-6400 with 10:90 blue:red light for 30 min; this saturating PPFD was selected on the basis of light response curves for soybean and is consistent with that used in previous studies [5,21]. The leaf temperature, relative humidity and CO2 concentration in the leaf chamber were maintained at 25 °C, 60 ± 5% and 400 μmol CO2 mol−1, respectively, with a CO2 mixture. These environmental settings follow the standard configuration for photosynthetic limitation analysis [22,23]. In addition, the gas flow rate was controlled at 300 μmol s−1 to ensure adequate gas exchange. After stabilization to a steady state, gas exchange parameters (i.e., net photosynthetic rate (An, µmol CO2 m−2 s−1), intercellular CO2 concentration (Ci, µmol mol−1)), steady-state fluorescence (Fs) and maximum fluorescence (Fm′) were recorded.
In accordance with Grassi and Magnani (2005) and Wang et al. (2018) [22,23], the relative changes in light-saturated assimilation are sequentially expressed in terms of parallel relative changes in gsc and gm and in biochemical capacity (e.g., in maximum carboxylation rate, Vcmax) as follows:
where lsc, lm and lb are the limitations imposed by gsc, gm and biochemical capacity, respectively (0 < li < 1, i = sc, m, b); SCL, MCL and BL are the relative contributions of gsc and gm and biochemical capacity to dAn/An, respectively; and the sum of contributions due to gsc and gm is defined as the diffusional limitation (DL = SCL + MCL), whereas the sum of gm and biochemical capacity is defined as the nonstomatal limitation (NSL = MCL + BL) [22]. Within the Grassi–Magnani framework, limitation coefficients (SCL, MCL and BL) represent the relative contribution of each component (gsc and gm and Vcmax) to the relative change in An with respect to a defined reference state and are not absolute measures of constraint intensity. In the current study, Vcmax was replaced with Jf, which is coupled with Vcmax [23,24,25,26], and the fitted photosynthesis parameters at Ψpd = −0.25 MPa (CK) were used as reference values [23]. Thus,
where x represents the fitted gsc, gm or Jf and x0.25 (e.g., xref) represents the x value at Ψpd = −0.25 MPa (CK).
Because An-Ci curves were not measured, Vcmax and Jmax were derived from light-response gas-exchange-fluorescence data, and triose phosphate utilization (TPU) could not be estimated. Importantly, biochemical limitation (lb) is also modulated by TPU in addition to Vcmax and Jmax, which represents a methodological limitation of the current analysis.
gsc was determined by the following Formula (4):
where gsw is the stomatal conductance to water vapour (mol (H2O) m−2 s−1), which was directly obtained from gas exchange measurements, and 1.6 is the ratio of the diffusivities of CO2 and water in air.
gm was calculated using the ‘variable J method’ described by Harley et al. (1992) [27]:
where Jf is the photosynthetic electron transport rate, Γ* represents the CO2 compensation point in the absence of respiration (µmol mol−1), and Rd represents the mitochondrial respiration in the light (µmol m−2 s−1).
In this study, Jf was calculated as follows:
where ΦPSII is the actual photochemical efficiency of photosystem II, which is calculated according to Genty et al. (1989) [28] using Formula (7). α is the total leaf absorptance, and β is the partitioning of absorbed quantum between PS II and PS I. In this study, αβ was corrected as described by Valentini et al. (1995) [29], and its values for different N treatments are shown in Table 2.
Table 2.
Values of αβ for different N treatments.
Γ* and Rd were measured using the Laisk method [30]. In theory, they intersect with each other at a point, and the intersection points at the x- and y-axes are considered to indicate the intercellular CO2 partial pressure (Ci*) and Rd, respectively. In practice, three CO2 response curves under low light and low CO2 concentrations obtained by varying CO2 concentrations from 150 to 40 µmol CO2 mol−1 under three PPFDs (150, 100 and 50 µmol m−2 s−1) formed a triangular range rather than a single point [31], and Ci* and Rd were calculated as the barycentre of the triangle formed by the intersection of the three lines on the x- and y-axes, respectively, in this study. The value of Γ* was calculated using the following Formula (8) [32]:
gtot was the total conductance to CO2 and was calculated using Formula (9):
Notably, the values for biochemical and anatomical traits, including aquaporin (AQP) activity, carbonic anhydrase (CA) activity, Rubisco activity, cell wall thickness (Tcw), surface area of mesophyll cells exposed to intercellular space per unit of leaf area (Sm), chloroplast surface area facing the intercellular space per unit of leaf area (Sc), liquid-phase conductance to CO2 (gliq), and Jf, used in this study were obtained from our companion study in Zuo et al. (2026) [18], which was conducted using the same experimental system and plant material. The present study focused on the quantitative analysis of photosynthetic limitations, whereas the study by Zuo et al. (2026) [18] focused on internal leaf CO2 diffusion and biochemical metabolism. Together, these two studies provide a complementary understanding of how soil N supply regulates soybean photosynthesis.
Notably, the limitation coefficients SCL, MCL and BL in the Grassi–Magnani framework are defined relative to a chosen reference state. In this study, the CK treatment (0 g urea m−2, Ψpd = −0.25 MPa) was used as the reference. Consequently, all the limitation values are relative to this reference and should not be interpreted as absolute constraint intensities. A reference-dependence sensitivity analysis was performed to assess the robustness of the inferred limitation rankings (see Section 3.4).
2.4. Determination of Chlorophyll Content
The chlorophyll content was determined using the Arnon method [33]. Fresh leaf fragments (0.1 g) with the veins removed were weighed and placed in a mortar. A small amount of quartz sand and calcium carbonate, along with 2 mL of 80% acetone, was added, and the sample was ground thoroughly into a homogenate, which was then transferred to a 25 mL brown volumetric flask. The mortar, pestle, and residue were rinsed 2–3 times with a small volume of 80% acetone, the rinses were combined, and the volume was made up to 25 mL with 80% acetone and mixed well. The samples were extracted in the dark for 12 h, followed by centrifugation at 4 °C and 8000 r min−1 for 10 min, after which the supernatant was collected. Using 80% acetone as the blank, the absorbance was measured at 663 nm and 645 nm using UV-Vis/Vis Spectrophotometers (Ther-moFisher Scientific, Waltham, MA, USA). The chlorophyll content was calculated using the following formulas and is expressed as mg g−1 FW: Chl a = 12.7A663 − 2.69A645; Chl b = 22.9A645 − 4.68A663; and Chl total = 8.02A663 + 20.21A645.
2.5. Measurement of Leaf N Content
Fully expanded and healthy functional leaves were randomly selected during the gas exchange measurement period and immediately cleaned with deionized water to remove surface dust and soil residues. The samples were subsequently oven-dried at 75 °C for 24 h until a constant weight was achieved to eliminate residual moisture and then thoroughly ground into a fine and homogeneous powder using an oscillating mixer mill (MM400; Retsch, Düsseldorf, Germany). Approximately 5.0 mg of each leaf sample was accurately weighed and loaded into a C–N elemental analyser (Elementar Vario MACRO, Element, Langenselbold, Germany) to determine the leaf N content (LNC). The obtained N content was calculated and is expressed on a dry weight basis, and replicate measurements (n = 3) were performed to guarantee the accuracy and reproducibility of the experimental data.
2.6. Statistical Analysis
Normality and homogeneity of variance were confirmed prior to parametric analysis. One-way ANOVA was performed using IBM SPSS Statistics 29.0 (SPSS, Inc., Chicago, IL, USA) to determine differences in lsc, lm and lb among the different N treatment groups, and means were compared using the least significant difference (LSD) multiple comparison test. In addition, regression analysis was used to describe the response of each limitation component to the gradient of added N, with the N dose treated as a continuous variable; both linear and quadratic models were fitted, and the best-fitting model was selected on the basis of R2 and the significance level. Pearson correlation analysis and linear regression analysis were subsequently performed to examine the relationships between photosynthetic limitation components (lsc, lm and lb) and physiological traits (gm and An), as well as between An and the limitation components. Correlation coefficients (r), regression parameters and their significance levels were calculated. A sensitivity analysis was subsequently conducted to evaluate the effects of the limitation components on the photosynthetic carbon assimilation capacity, which was assessed as An and Vcmax. Differences were considered statistically significant at p < 0.05. All figures were generated using OriginPro 2021 (OriginLab Corporation, Northampton, MA, USA).
3. Results
3.1. Quantitative Changes in Photosynthetic Limitation Components
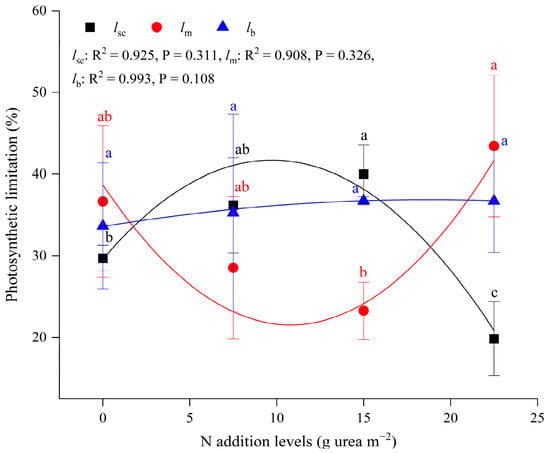
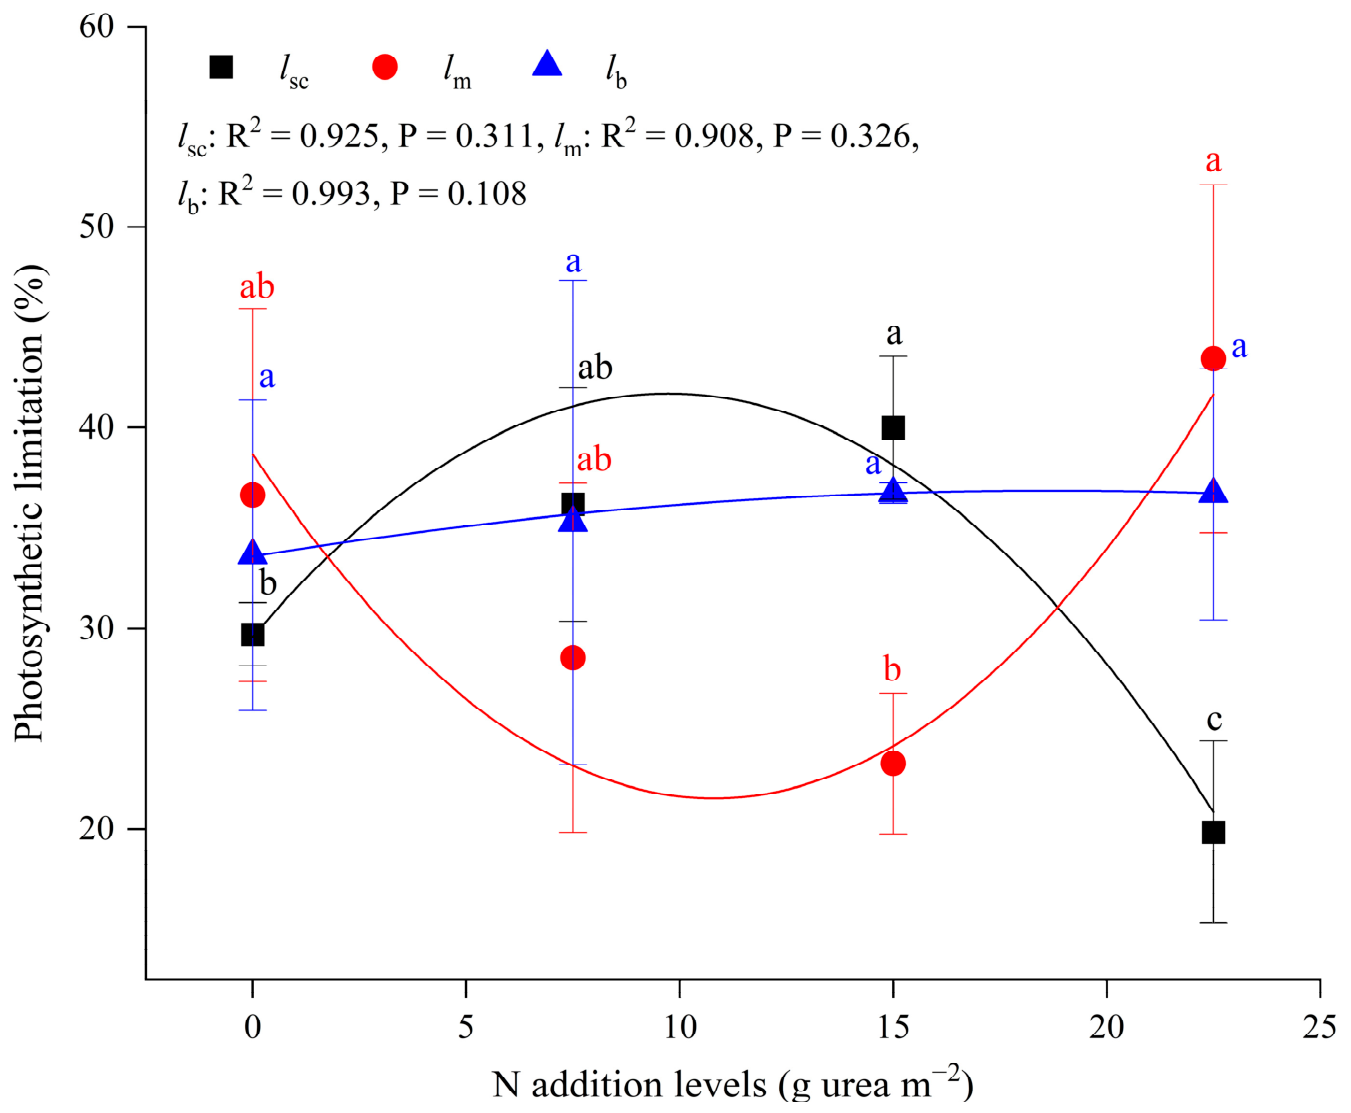
The responses of the three photosynthetic limitation indices (lsc, lm, and lb) to the gradient of added N are shown in Figure 1. One-way ANOVA revealed significant differences among the N treatment groups in terms of lsc (F = 11.261; p = 0.003), lm (F = 3.652; p = 0.063), and lb (F = 0.104; p = 0.955). When the N dose was treated as a continuous variable, quadratic models provided the best fit for all three components, although none reached statistical significance (lsc: R2 = 0.925, p = 0.311; lm: R2 = 0.908, p = 0.326; lb: R2 = 0.993, p = 0.108; Figure 1), likely owing to the limited number of N levels (n = 4) and the resulting low statistical power. Despite the nonsignificant regressions, lsc increased from the CK group to the MN group and then decreased in the HN group; lm exhibited a U-shaped trend, reaching a minimum at 10.9 g urea m−2 and showing a sharp increase at 22.5 g urea m−2; and lb gradually increased. At the highest N dose, lm exceeded both lsc and lb, although this difference was not statistically significant for all pairwise comparisons, indicating a shift in the dominant limitation from mesophyll to stomatal and biochemical constraints as the N supply increased.
Figure 1.
Response of photosynthetic limitation components to soil N application levels. lsc, stomatal limitation; lm, mesophyll limitation; lb, biochemical limitation. The values are the means ± SDs (n = 3). Different lowercase letters (a, b, and c) denote significant differences among the N addition treatment groups at p < 0.05. Regression curves were fitted against the N application level as a continuous variable: lsc, quadratic model, R2 = 0.925, p = 0.311; lm, quadratic model, R2 = 0.908, p = 0.326; lb, quadratic model, R2 = 0.993, p = 0.108. CK, control; LN, low N addition; MN, medium N addition; HN, high N addition.
3.2. Quantitative Changes in the Relative Contribution of Photosynthetic Limitation Components to Photosynthetic Carbon Assimilation
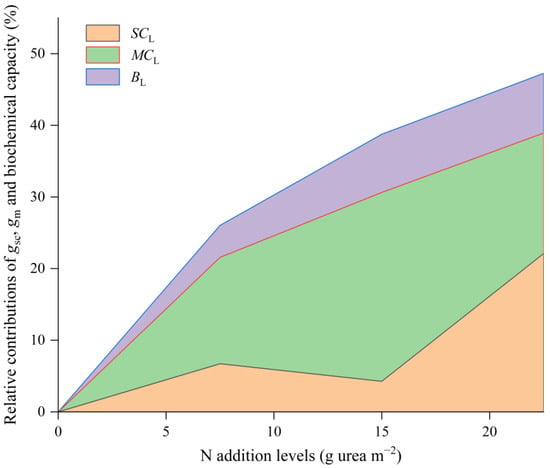
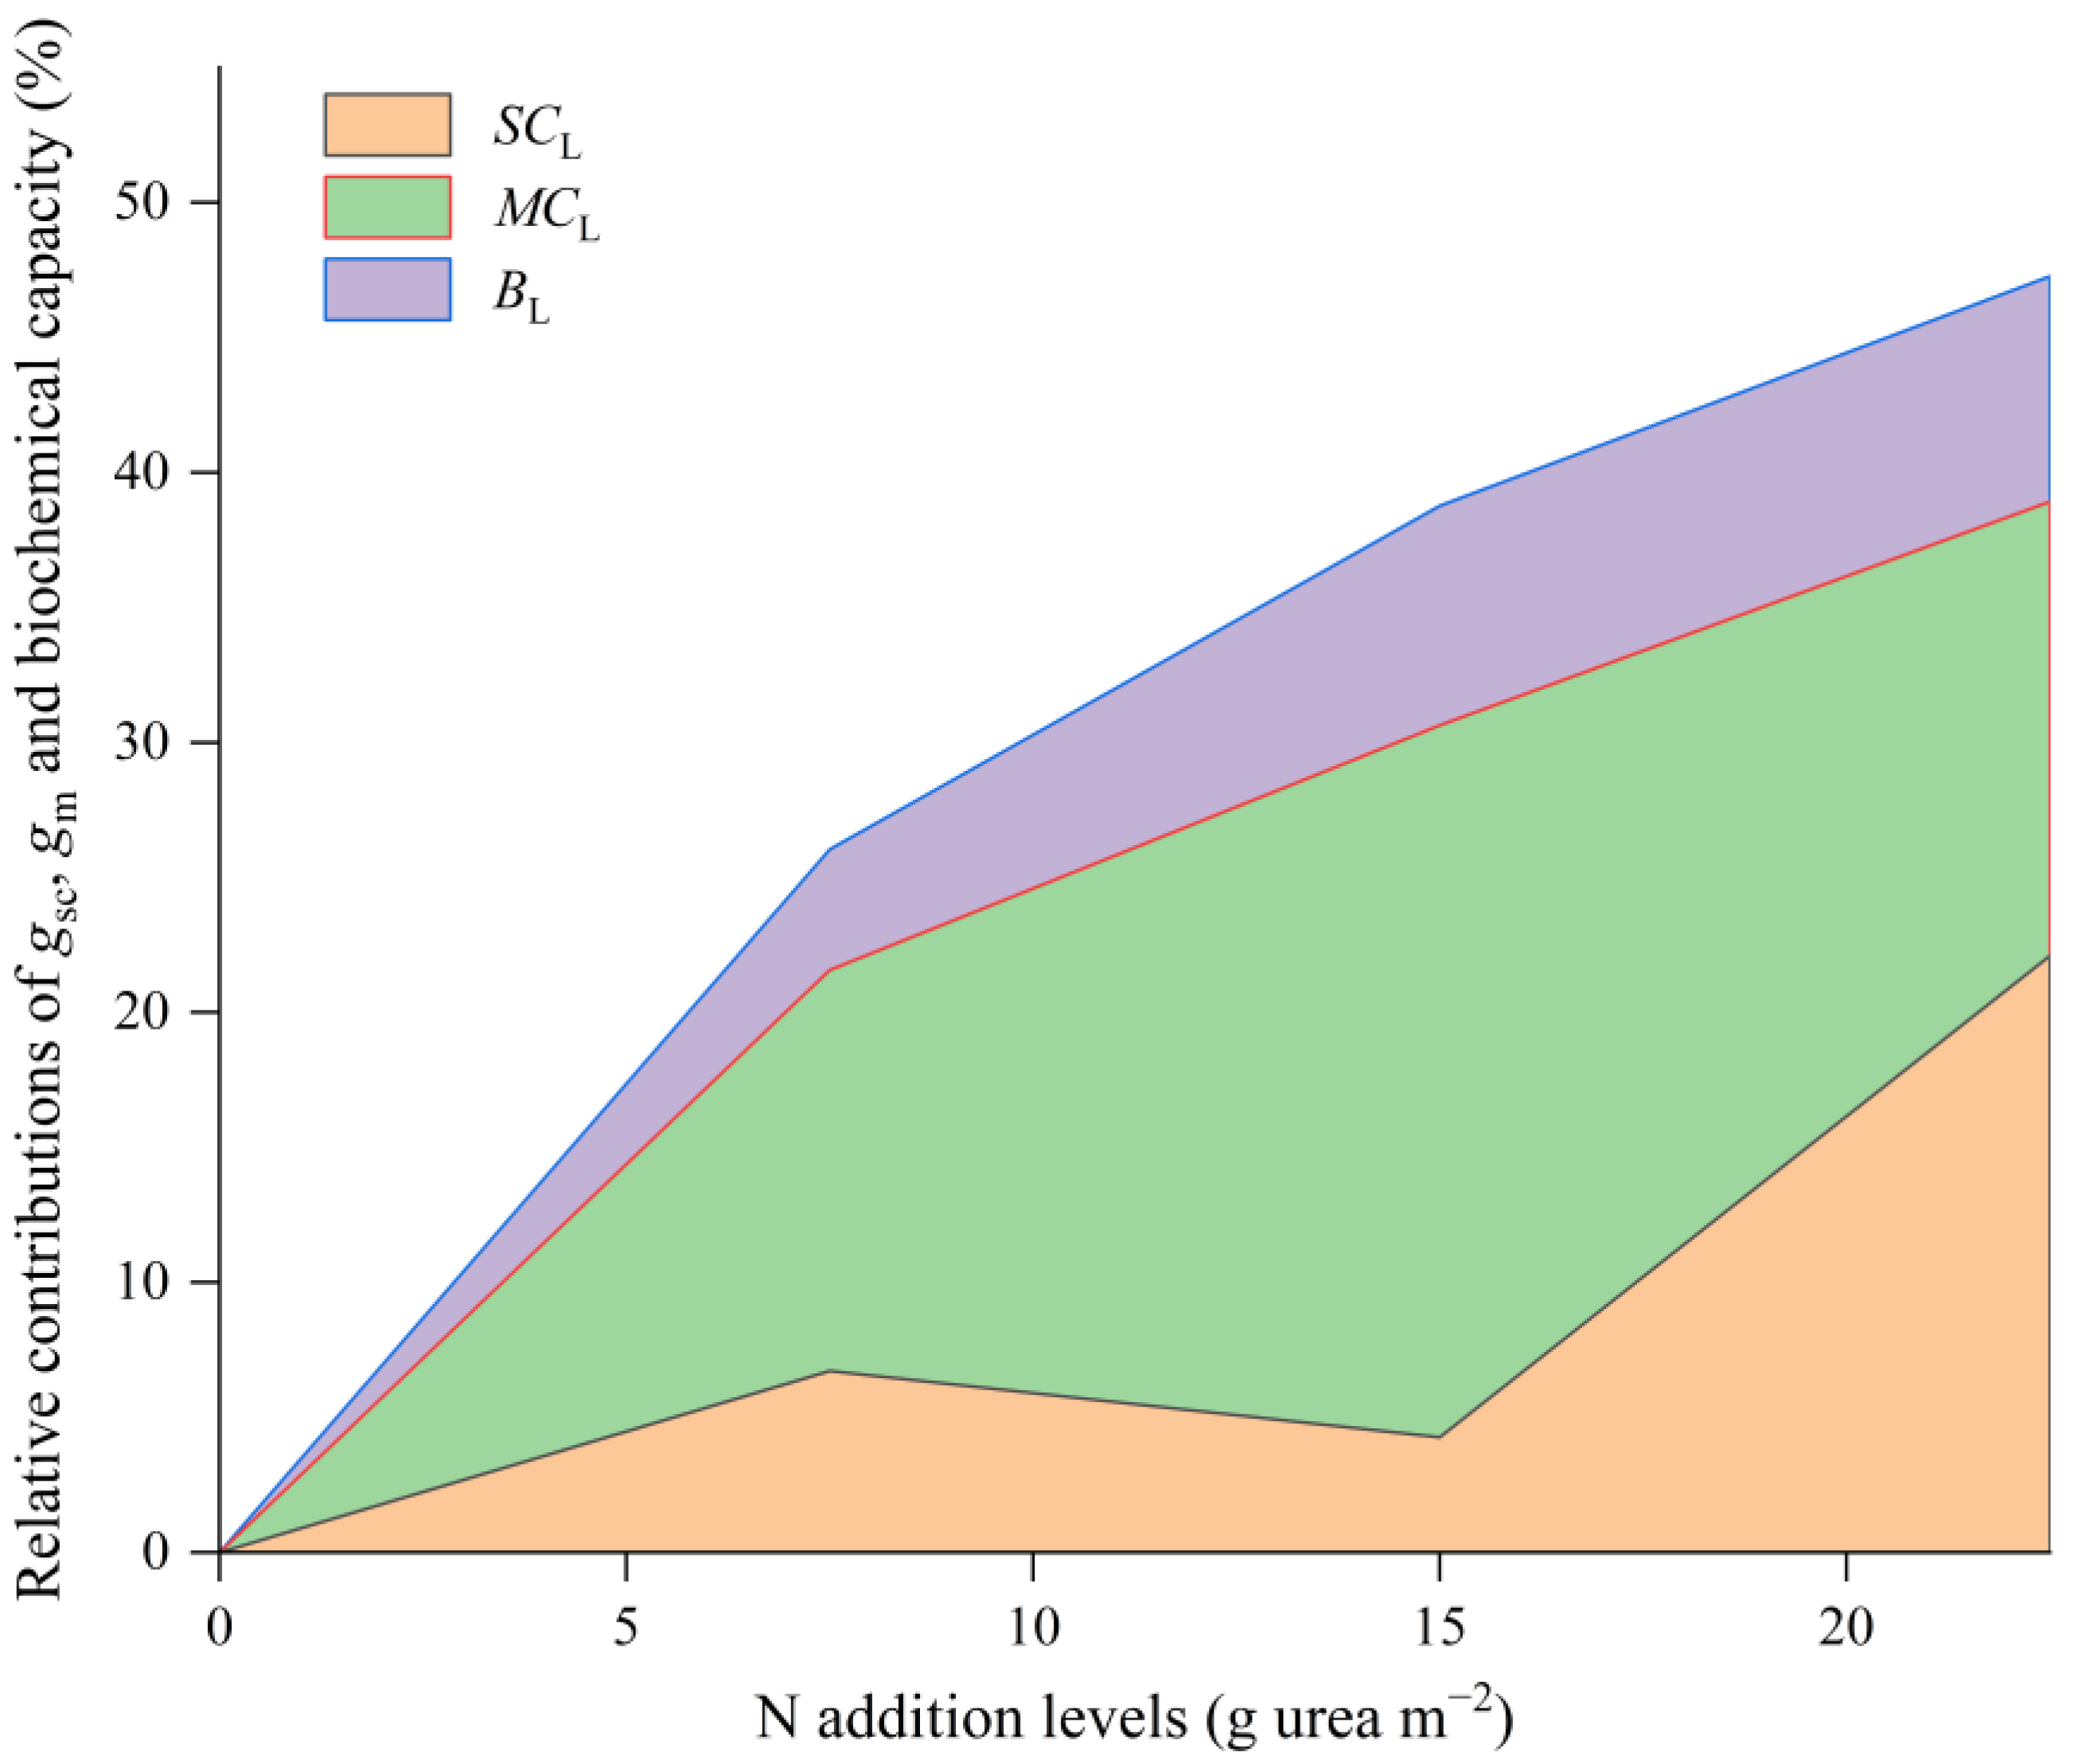
We quantified the relative contributions of photosynthetic limitation components (SCL, MCL and BL) to photosynthetic carbon assimilation with increasing N application levels (Figure 2). Overall, the three indices responded differently to increasing N supply: SCL exhibited a biphasic response, MCL remained the largest single component across most of the gradient, and BL increased gradually but stayed comparatively small. Specifically, SCL was negligible at low N levels (0%) and peaked at approximately 22% under excess N. MCL ranged from 34% to 39% relative to the CK treatment across the N gradient, with gm accounting for 60–70% of the total limitation. BL increased gradually from 1% to 9% with increasing N availability. Consequently, the total photosynthetic limitation nearly doubled from 35% (control) to 70% at the highest N level. Our findings indicate that gm was the core bottleneck of photosynthesis under N addition, whereas excess N simultaneously strengthened stomatal and biochemical constraints, providing a mechanistic basis for optimizing N management to improve plant photosynthetic efficiency.
Figure 2.
Relative contribution of photosynthetic limitation components to photosynthetic carbon assimilation.
3.3. Correlations Between Limitation Components and Physiological Traits
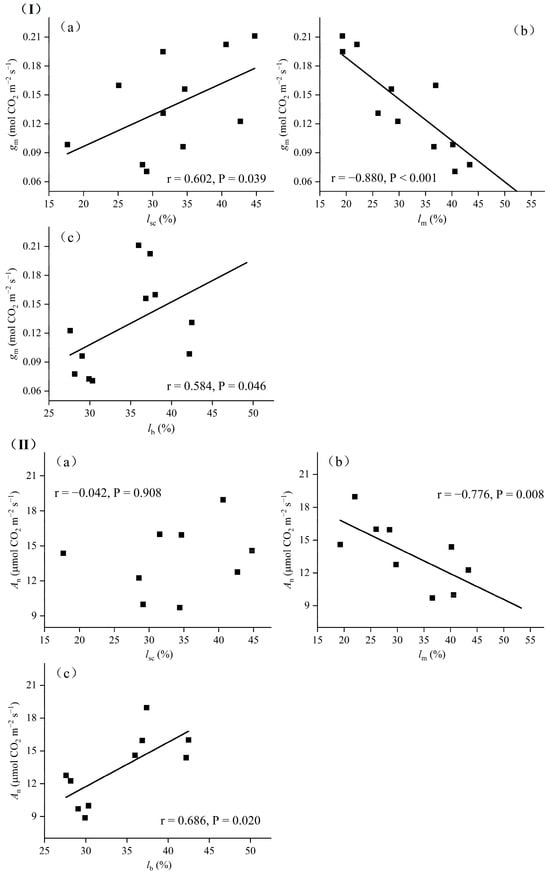
We first examined the relationships between gm and the three limitation components, and then assessed how each component was related to An (Figure 3). As shown in Figure 3I, gm was significantly positively correlated with lsc (r = 0.602, p = 0.039) and lb (r = 0.584, p = 0.046) but extremely significantly negatively correlated with lm (r = −0.880, p < 0.001). lm acted as the dominant negative regulator that directly constrained gm, whereas lsc and lb exerted positive effects on gm, probably via a compensatory mechanism in which gm was increased to alleviate stomatal/cuticular and biochemical constraints on photosynthesis. Thus, gm appeared to be co-regulated by these three limitation components, with lm as the decisive factor and lsc and lb as compensatory positive drivers.
Figure 3.
Correlations between gm (I) and An (II) and limitation components (lsc, lm and lb). lsc, stomatal limitation, lm, mesophyll limitation, lb, biochemical limitation. The fitting lines are shown at the level of p < 0.05. I-a, b, c are correlations between gm and lsc, lm and lb, respectively; II-a, b, c are correlations between An and lsc, lm and lb, respectively.
As illustrated in Figure 3II, linear regression analyses revealed divergent associations between An and the three photosynthetic limitation components. No statistically significant linear correlation was observed between An and lsc (p > 0.05), indicating that gsc did not have a meaningful linear effect on An across the soil N supply range of 0–22.5 g urea m−2. Conversely, a strong and statistically significant negative linear correlation was observed between An and lm (r = −0.776, p = 0.008), demonstrating that elevated mesophyll limitation was associated with a pronounced reduction in photosynthetic CO2 assimilation, with lm explaining a large proportion of the variance in An. Furthermore, a moderate and statistically significant positive linear correlation was identified between An and lb (r = 0.686, p = 0.020), indicating that a higher biochemical limitation was linked to increased An, likely reflecting compensatory physiological adjustment. Collectively, these findings indicated that lm acted as the primary negative linear predictor of An, lb functioned as a significant positive linear predictor, and lsc had no significant linear predictive power for the net photosynthetic rate, a pattern consistent with the regulatory dynamics of gm described above.
3.4. Reference-Dependent Sensitivity Analysis of the Relative Contribution of Photosynthetic Limitation Components to Photosynthetic Carbon Assimilation
The Grassi–Magnani limitation framework is reference-state dependent. To test the robustness of the limitation-component rankings, the LN and MN treatments were separately adopted as alternative reference states to recalculate SCL, MCL and BL (Table 3).
Table 3.
Relative contributions of photosynthetic limitation components to photosynthetic carbon assimilation calculated using the LN and MN treatments as alternative reference states.
When the LN treatment was used as the reference, MCL (12.01 ± 2.43%) > SCL (5.92 ± 1.15%) > BL (4.61 ± 1.30%) for the CK treatment, whereas SCL (25.58 ± 2.90%) > MCL (21.90 ± 2.95%) > BL (11.55 ± 1.47%) for the HN treatment. When the MN treatment was used as the reference, MCL was still the largest component in the CK group (19.29 ± 2.09%), and SCL (22.52 ± 2.27%) and MCL (19.18 ± 2.13%) were comparable in the HN group, with BL remaining the minor contributor (5.73 ± 0.87%). The HN treatment consistently produced the highest values for all three contribution indices across reference states.
Comparison with the original results in which the CK treatment was used as the reference (Section 3.2, where MCL dominated the total limitation) showed that switching reference states altered the numerical order of SCL and MCL, especially for the HN treatment. Nevertheless, the sum of the diffusional limitations (SCL + MCL) always constituted the major fraction of the total photosynthetic limitation, whereas BL remained the smallest component regardless of reference selection. These results confirm that individual limitation rankings are reference-dependent rather than absolute; however, the qualitative conclusion that diffusional limitations dominate photosynthetic constraints under varying soil N levels remains robust.
3.5. Sensitivity Analysis of the Limiting Components of Photosynthetic Carbon Assimilation
On the basis of the linear regression analysis between the photosynthetic limitation components (lsc, lm and lb) and photosynthetic carbon assimilation (An and Vcmax) presented in Table 4, the VIF for all the photosynthetic limitation factors was greater than 1.000, indicating the absence of multicollinearity among the independent variables. For An (left panel), lb had the largest standardized coefficient (beta = 0.568), followed by lsc, with a moderate positive effect (beta = 0.261, p = 0.357), whereas lm exhibited a negative standardized coefficient (beta = −0.515) that was not statistically significant (p = 0.087). The overall model F-statistics for lsc and lb (F = 2.519, df = 11) and for lm (F = 3.603, df = 11) further suggested limited explanatory power. For Vcmax (right panel), all three factors showed weak and nonsignificant effects, with lb having a weak negative influence (beta = −0.279, p = 0.406), whereas lsc (beta = 0.075, p = 0.820) and lm (beta = 0.097, p = 0.765) had negligible positive effects. Similarly, the model F-values were also low (F = 0.435 for lsc and lb; F = 0.095 for lm), confirming that the relationships were not significant. These results suggested that all three limitation components might contribute to variation in An, with lb and lm showing marginal trends (p ≈ 0.06 and 0.09, respectively) and lm exerting the strongest negative effect, whereas the effect of lsc was relatively weak. In other words, compared with lsc, lb (biochemical capacity) and lm (gm) had relatively stronger influences on An. Nevertheless, none of the coefficients reached the conventional significance threshold (p < 0.05), and the limited sample size (n = 3) meant that these results should be regarded as suggestive rather than conclusive. To further evaluate the combined effects of the three limitation components on An, a multiple regression analysis was performed; its results were consistent with the simple regression and sensitivity analyses, again indicating that lm had the strongest negative association with An (marginally significant), whereas lb and lsc had weaker positive effects, although none of the coefficients reached statistical significance at p < 0.05, probably owing to the limited sample size.
Table 4.
Linear regression analysis of the effects of photosynthetic limiting factors on photosynthetic carbon assimilation capacity.
3.6. Effects of Soil N Application on Chlorophyll Content
N application significantly altered the leaf chlorophyll content, which followed a parabolic trend—initially increasing but then decreasing—with increasing N levels (Table 5). Compared with the CK treatment, all the N treatments significantly increased the chlorophyll a (Chl a), chlorophyll b (Chl b), and total chlorophyll (total Chl) contents (p < 0.05). Compared with the CK treatment, the MN treatment resulted in the highest chlorophyll contents, with the contents of Chl a, Chl b, and total chlorophyll increasing by 59.4%, 90.0%, and 66.7%, respectively. The chlorophyll levels in the LN group were intermediate, whereas those in the HN group slightly decreased, indicating that an excessive N supply does not further promote chlorophyll accumulation.
Table 5.
Effects of different N treatments on the chlorophyll and leaf N contents of soybean plants.
3.7. Effects of Soil N Application on Leaf N Content
The LNC was significantly affected by soil N application (Table 5). Compared with the control, the LNC increased by 36.3% in the low N application group (7.5 g urea m−2) and by 71.4% in the medium N application group (15.0 g urea m−2), reaching a maximum value of 44.9 ± 3.2 g kg−1 in the MN group. However, in the high N application group (22.5 g urea m−2), the LNC decreased to 37.1 ± 2.3 g kg−1, representing a 17.4% reduction relative to that in the MN group, but remained 41.6% higher than that in the CK group. Multiple comparisons revealed that the LNC in all N-treated groups was significantly greater than that in the CK group (p < 0.05). Notably, no significant difference was detected between the LN and HN groups (p > 0.05), whereas the LNC was greatest in the MN group, significantly differing from that in all the other treatment groups (p < 0.05).
3.8. Biochemical and Anatomical Traits Underlying Photosynthetic Limitations
To provide mechanistic insight into the shifts in photosynthetic limitation components, key biochemical and anatomical traits, including AQP activity; CA activity; Rubisco activity; and Tcw, Sm, Sc, gliq, and Jf, obtained from our companion study (Zuo et al., 2026) [18] were summarized in Table 6. Compared with the CK treatment, moderate N addition (≤15.0 g urea m−2) increased CA activity and Rubisco activity, with the highest values observed in the MN group (CA: 223.8 U L−1; Rubisco: 836.8 U L−1). However, in the HN group, Rubisco activity decreased to 807.4 U L−1, which was significantly lower than that in the MN group (), whereas CA activity continued to increase to 238.3 U L−1. AQP activity differed among groups, being lowest in the LN group (604.0 U L−1) and highest in the HN group (678.3 U L−1). With respect to leaf anatomical traits, Tcw decreased from the CK group (0.36 μm) to the LN group (0.25 μm) but then increased in the HN group (0.35 μm), whereas Sm increased from the CK group (6.52 μm2) to the MN group (16.87 μm2) but decreased in the HN group (13.66 μm2). Sc did not significantly differ among the treatment groups. gliq was highest in the MN group (4.27 × 10⁻³ mol CO2 m−2 s−1), which is consistent with the lowest lm observed in the MN group.
Table 6.
Values of key biochemical and anatomical traits in the different soil N addition treatment groups. All the data are presented as the mean ± SDs (n = 3). Different lowercase letters (a, b, c and d) indicate significant differences at p < 0.05. AQPs, aquaporins; CA, carbonic anhydrase; Rubisco, ribulose-1,5-bishosphate carboxylase; Tcw, cell wall thickness; Sm, surface area of mesophyll cells exposed to intercellular space per unit leaf area; Sc, chloroplast surface area facing the intercellular space per unit leaf area; Jf, photosynthetic electron transport rate; gliq, liquid-phase conductance to CO2. All the data presented in the table were obtained from our previous study (Zuo et al. (2026)) [18].
These patterns were consistent with the changes in lm: the lowest lm in the MN group coincided with the highest CA activity, Rubisco activity, Sm, and gliq, whereas the sharp increase in lm in the HN group coincided with decreased Rubisco activity and Sm and increased Tcw. These results suggest that N-induced changes in biochemical capacity and leaf anatomy underlie the observed shifts in mesophyll limitation.
4. Discussion
Photosynthetic limitations are key determinants of plant photosynthetic efficiency, and their nature and magnitude are modulated by N supply levels [21,34]. Upon entering a plant, N is preferentially allocated to photosynthesis-related enzymes and electron transport components, thereby increasing the capacity for photosynthetic carbon assimilation [35,36]. The results of the present study revealed a nonlinear response of photosynthesis to N addition. Quantitative limitation analysis revealed that moderate N application (≤15.0 g urea m−2) progressively increased lsc and lb but significantly decreased lm (see Figure 1). Consequently, gsc and biochemical metabolic capacity (Vcmax, which increased with increasing N supply, as shown in our previous study by Zuo et al. (2026) [18]), emerged as the dominant drivers of photosynthetic changes. These improvements were primarily attributed to increased activities of CA and Rubisco, as well as to favourable modifications in leaf anatomical traits—including reduced Tcw, increased surface areas of mesophyll cells and chloroplasts exposed to intercellular airspaces per unit of leaf area (Sm and Sc), and elevated liquid-phase diffusional conductance (gliq)—as detailed in our earlier study by Zuo et al. (2026) [18] (see Table 6). In contrast, a high N supply redirected leaf N partitioning from the photosynthetic apparatus towards storage and structural pools, thereby increasing lm and suppressing photosynthesis [37]. Additionally, high N application reduced photosynthetic capacity by decreasing Rubisco activity and diverting leaf N into nonphotosynthetic storage pools [38]. Consistent with these reports, our study revealed that at 22.5 g urea m−2 (high N, HN), lm increased rapidly and significantly surpassed both lsc and lb (see Figure 1), a pattern differing from those reported by some previous studies suggesting that excessive N primarily increases lsc [15,39]. Instead, our results indicated that excessive N increased both lm and lb. The concurrent decline in the LNC in the HN group (see Table 5) likely reduced substrate availability for CA and Rubisco synthesis, directly reducing gm and carboxylation efficiency. Several factors likely contributed to this outcome: (i) nitrate accumulation in leaves damaged chloroplast structure, reducing gm; (ii) the synthesis and activity of photosynthesis-related enzymes (CA and Rubisco) were inhibited (see Table 6), lowering CO2 fixation efficiency; and (iii) an imbalanced leaf C/N ratio might have disrupted the transport and accumulation of photosynthetic products, further intensifying lb. In the HN group in the present study, gm gradually surpassed gsc and biochemical metabolic capacity as the dominant factors limiting photosynthesis (see Figure 2). This shift was attributed mainly to high-N-induced alterations in mesophyll cell structure and Rubisco activity. The increased Tcw and decreased Sm under high N application (see Table 6) not only lengthened the CO2 diffusion pathway [40] but also reduced the contact area between CO2 and chloroplastic carboxylation sites [23], directly decreasing the amount of CO2 available for carbon assimilation. Concurrently, the marked decline in Rubisco activity under high N application (see Table 6) substantially decreased carboxylation efficiency.
Appropriate N application (≤15.0 g urea m−2) increased the chlorophyll and leaf N contents (see Table 4 and Table 5) and subsequently increased Rubisco activity, decreased lm, and consequently improved photosynthetic efficiency. A clear parabolic response of the LNC to increasing N supply was observed; the maximum LNC was observed in the MN group (44.9 g kg−1), followed by a subsequent decline in the HN group (37.1 g kg−1) (see Table 5). This LNC trajectory closely mirrored the opposite trend in lm, which decreased progressively from the CK group to the MN group but then increased sharply in the HN group (see Figure 1), suggesting a mechanistic linkage between leaf N status and the efficiency of CO2 diffusion from the substomatal cavity to chloroplast carboxylation sites.
The LNC-dependent regulation of lm can be attributed to at least three non-mutually exclusive mechanisms. First, increased LNC under moderate N supply promoted the synthesis of CA and AQPs (see Table 6), both of which are N-rich proteins that facilitate CO2 hydration and membrane transport, thereby increasing gm (data available in our previous study by Zuo et al. (2026) [18]). Second, adequate leaf N availability supported the development of mesophyll anatomical traits—including by increasing Sm and reducing Tcw—which collectively lowered the physical resistance to CO2 diffusion (see Table 6). Third, the decline in the LNC under excessive N application (HN) likely reflected a shift in N partitioning from the photosynthetic apparatus to nonphotosynthetic storage pools, leading to reduced gm and consequently elevated lm (see Figure 1). This interpretation is consistent with the strong negative correlation observed between gm and lm (r = −0.880, p < 0.001; Figure 3I) and the significant negative linear relationship between An and lm (r = −0.776, p = 0.008; Figure 3II), reinforcing the view that lm serves as the primary negative predictor of photosynthetic carbon assimilation under varying N supply. In contrast to its dominant effect on lm, the LNC showed a weaker direct relationship with lsc. Although moderate N addition increased both the LNC and lsc (Figure 1), the contribution of gsc to overall photosynthetic restriction remained relatively modest (SCL ≤ 22%; Figure 2). These observations align with the finding that lsc did not significantly linearly correlate with An (p > 0.05; Figure 3II), implying that gsc was not a major limiting factor within the N gradient examined. Rather, the N-induced increase in lsc might represent an incidental consequence of improved leaf structure and increased guard cell turgor [41,42] rather than a direct cause of photosynthetic enhancement. This interpretation is supported by the relatively low standardized coefficient of lsc on An (beta = 0.261, p = 0.357; Table 4), indicating that stomatal factors played a subordinate role relative to mesophyll and biochemical constraints. Unlike lm and lsc, lb increased with N addition across the entire gradient (see Figure 1), although the magnitude of this increase was relatively small (BL from 1% to 9%; Figure 2), and lb exhibited a significant positive correlation with An (r = 0.686, p = 0.020; Figure 3II), suggesting that greater biochemical limitation was paradoxically associated with increased net photosynthesis—a counterintuitive finding that likely reflects a compensatory mechanism. The positive correlation between An and lb should be interpreted with caution because lb is a relative limitation index that is mathematically coupled with lsc and lm. Under moderate N supply, the absolute biochemical capacity (Rubisco activity and electron transport rate) and gm both increased, whereas the relative contribution of lb to total limitation increased. This pattern reflects a coordinated adjustment among limitation components rather than evidence that An is unlimited by biochemical capacity. Under sufficient N conditions (≤15.0 g urea m−2), the increase in Rubisco activity and Jf (see Table 6) outweighs the concurrent increase in lb, resulting in a net increase in photosynthetic carbon assimilation [43,44]. This interpretation is consistent with the sensitivity analysis showing that lb had the highest positive standardized coefficient for An (beta = 0.568, p = 0.063; Table 4), although this effect was only marginally significant. However, the marginal significance (p ≈ 0.06) suggested that the positive effect of lb might be context dependent, varying with N availability and the prevailing physiological status of the leaf. Importantly, the decrease in the LNC in the HN group did not translate to a reduction in lb; instead, lb continued to increase (see Figure 1). These results suggest that in the presence of excessive N, the biochemical machinery might be subjected to feedback inhibition or downregulation at the posttranslational level, even when the leaf N content remains relatively high (37.1 g kg−1). Such a decoupling between the LNC and lb in the presence of high amounts of N highlights the limitation of using total LNC as a sole proxy for photosynthetic capacity and the importance of considering N allocation among photosynthetic components.
Specifically, correlation analyses between the limitation components and physiological traits (see Figure 3), together with sensitivity analysis of photosynthetic carbon assimilation (Table 1), revealed that lsc and lb exerted positive regulatory effects on net photosynthetic capacity, with lb having the strongest positive effect and lm having the most pronounced negative effect. Hence, the influence of photosynthetic limitation components on carbon assimilation capacity is environment dependent [45,46], with lb (i.e., biochemical metabolic capacity) being the most sensitive variable, whose effect direction varies under different model conditions.
Nevertheless, despite the clear mechanistic insights obtained in this study, several caveats should also be noted. This study was conducted under greenhouse conditions with relatively stable temperature, light, and humidity, which may differ from field environments. In addition, we did not quantify nodule-related traits in the current experiment. Since mineral nitrogen fertilization may alter nodule formation and symbiotic nitrogen-fixation activity, future investigations should include quantitative measurements of nodule development to disentangle the interactive effects between exogenous mineral N supply and biological N-fixation in soybean. Moreover, the experiments were performed solely on soybean plants, and the regulatory effects of N application on photosynthetic limitations may vary across plant species. Third, the limitation analysis was inherently reference-dependent. The choice of CK as the reference state influenced the absolute values and potentially the ranking of limitation components. Although we conducted a reference-dependence sensitivity analysis (Section 3.4), the limited number of N levels (n = 4) and replicates (n = 3) constrained the statistical power of our conclusions. Future studies should include more N levels and larger sample sizes to validate the robustness of the inferred limitation rankings. Therefore, future studies should be carried out in the field using a broader range of species to validate the present findings and to provide a more comprehensive theoretical basis for optimizing soil N management strategies.
5. Conclusions
In this study, moderate soil N addition (≤15.0 g urea m−2) increased lsc and lb but markedly decreased lm, whereas excessive N addition (22.5 g urea m−2) led to a rapid increase in lm, which exceeded both lsc and lb. The LNC showed a parabolic response to N supply, with a maximum at 15.0 g urea m−2 and a decline at 22.5 g urea m−2, and this pattern was associated with the observed shifts in the photosynthetic limitation components. The changes in net photosynthetic capacity were accompanied by altered activities of CA and Rubisco and by changes in leaf structure. These findings indicate that optimizing soil N addition could reduce lm and that excessive N supply is associated with the greatest relative contribution of lm, but this conclusion requires validation by studies with larger sample sizes and alternative reference states. Further field studies involving multiple species are needed to validate these conclusions and to support rational N fertilization for sustainable agriculture.
Author Contributions
Conceptualization, L.G. and K.Z.; methodology, L.G. and K.Z.; software, L.G. and Q.Z.; validation, Q.Z., H.X. and S.T.; formal analysis, L.G. and Q.Z.; investigation, L.G. and Q.Z.; data curation, L.G. and Q.Z.; writing—original draft preparation, L.G.; writing—review and editing, K.Z.; funding acquisition, K.Z. All authors have read and agreed to the published version of the manuscript.
Funding
This work was supported by the Scientific and Technological Innovation Programs of Higher Education Institutions in Shanxi, grant number 2021L156, and the Fundamental Research Program of Shanxi Province, grant number 20210302124229.
Data Availability Statement
The datasets used and/or analyzed during the current study are available from the corresponding author upon reasonable request.
Conflicts of Interest
The authors declare no conflicts of interest.
References
- Liang, X.G.; Gao, Z.; Fu, X.X.; Chen, X.M.; Shen, S.; Zhou, S.L. Coordination of carbon assimilation, allocation, and utilization for systemic improvement of cereal yield. Front. Plant Sci. 2023, 14, 1206829. [Google Scholar] [CrossRef] [Scilit] [PubMed]
- Smith, E.N.; van Aalst, M.; Tosens, T.; Niinemets, U.; Stich, B.; Morosinotto, T.; Alboresi, A.; Erb, T.J.; Gomez-Coronado, P.A.; Tolleter, D.; et al. Improving photosynthetic efficiency toward food security: Strategies, advances, and perspectives. Mol. Plant 2023, 16, 1547–1563. [Google Scholar] [CrossRef] [Scilit] [PubMed]
- Liu, H.; Gao, X.H.; Fan, W.S.; Fu, X.D. Optimizing carbon and nitrogen metabolism in plants: From fundamental principles to practical applications. J. Integr. Plant Biol. 2025, 67, 1447–1466. [Google Scholar] [CrossRef] [Scilit] [PubMed]
- Kubar, M.S.; Shar, A.H.; Kubar, K.A.; Rind, N.A.; Ullah, H.; Kalhoro, S.A.; Wang, C.; Feng, M.C.; Gujar, A.; Sun, H. Optimizing nitrogen supply promotes biomass, physiological characteristics and yield components of soybean (Glycine max L. Merr.). Saudi J. Biol. Sci. 2021, 28, 6209–6217. [Google Scholar] [CrossRef] [Scilit] [PubMed]
- Zhu, K.; Zuo, Q.; Liu, F.; Qin, J.M.; Wang, A.Z.; Zhang, J.; Flexas, J. Divergences in leaf CO2 diffusion conductance and water use efficiency of soybean coping with water stress and its interaction with N addition. Environ. Exp. Bot. 2024, 217, 105572. [Google Scholar] [CrossRef] [Scilit]
- Lu, Z.F.; Ren, T.; Li, Y.; Cakmak, I.; Lu, J.W. Nutrient limitations on photosynthesis: From individual to combinational stresses. Trends Plant Sci. 2025, 30, 872–885. [Google Scholar] [CrossRef] [Scilit] [PubMed]
- Saturno, D.F.; Cerezini, P.; Moreira da Silva, P.; Oliveira, A.B.; Oliveira, M.C.N.; Hungria, M.; Nogueira, M.A. Mineral nitrogen impairs the biological nitrogen fixation in soybean of determinate and indeterminate growth types. J. Plant Nutr. 2017, 40, 1690–1701. [Google Scholar] [CrossRef] [Scilit]
- Gan, Y.; Stulen, I.; van Keulen, H.; Kuiper, P.J.C. Low concentrations of nitrate and ammonium stimulate nodulation and N2 fixation while inhibiting specific nodulation (nodule DW g−1 root dry weight) and specific N2 fixation (N2 fixed g−1 root dry weight) in soybean. Plant Soil 2004, 258, 281–292. [Google Scholar] [CrossRef] [Scilit]
- Guo, J.M.; Beverly, D.P.; Ewers, B.E.; Williams, D.G. Stomatal, mesophyll and biochemical limitations to photosynthesis and their relationship with leaf structure over an elevation gradient in two conifers. Photosynth. Res. 2023, 157, 85–101. [Google Scholar] [CrossRef] [Scilit] [PubMed]
- Li, S.L.; Tan, T.T.; Fan, Y.F.; Raza, M.A.; Wang, Z.L.; Wang, B.B.; Zhang, J.W.; Tan, X.M.; Chen, P.; Shafiq, I.; et al. Responses of leaf stomatal and mesophyll conductance to abiotic stress factors. J. Integr. Agric. 2022, 21, 2787–2804. [Google Scholar] [CrossRef] [Scilit]
- Kubota, S.; Yokoyama, G.; Shibata, T.; Yasutake, D.; Hirota, T. Stomatal, mesophyll, and biochemical limitation to photosynthesis of soybeans under waterlogging and reoxygenation. Environ. Exp. Bot. 2026, 243, 106325. [Google Scholar] [CrossRef] [Scilit]
- Cisse, A.; Zhao, X.; Fu, W.M.; Kim, R.E.R.; Chen, T.T.; Tao, L.X.; Feng, B.H. Non-photochemical quenching involved in the regulation of photosynthesis of rice leaves under high nitrogen conditions. Int. J. Mol. Sci. 2020, 21, 2115. [Google Scholar] [CrossRef] [Scilit] [PubMed]
- Mu, X.H.; Chen, Y.L. The physiological response of photosynthesis to nitrogen deficiency. Plant Physiol. Biochem. 2021, 158, 76–82. [Google Scholar] [CrossRef] [Scilit] [PubMed]
- Salesse-Smith, C.E.; Wang, Y.; Long, S.P. Increasing Rubisco as a simple means to enhance photosynthesis and productivity now without lowering nitrogen use efficiency. New Phytol. 2025, 245, 951–965. [Google Scholar] [CrossRef] [Scilit] [PubMed]
- Yang, J.; Shuang, S.P.; Cun, Z.; Zhang, J.Y.; Chen, J.W. High nitrogen-driven photosynthesis limitation in shade-demanding species mediated by stomatal conductance through plasma membrane intrinsic proteins. Environ. Exp. Bot. 2024, 226, 105909. [Google Scholar] [CrossRef] [Scilit]
- Li, H.X.; Li, J.; Zhang, X.H.; Shi, T.R.; Chai, X.Y.; Hou, P.J.; Wang, Y. Mesophyll conductance, photoprotective process and optimal N partitioning are essential to the maintenance of photosynthesis at N deficient condition in a wheat yellow-green mutant (Triticum aestivum L.). J. Plant Physiol. 2021, 263, 153469. [Google Scholar] [CrossRef] [Scilit] [PubMed]
- Parkash, V.; Snider, J.L.; Sintim, H.Y.; Hang, L.C.; Virk, G.; Pokhrel, A. Differential sensitivities of photosynthetic processes and carbon loss mechanisms govern N-induced variation in net carbon assimilation rate for field-grown cotton. J. Exp. Bot. 2023, 74, 2638–2652. [Google Scholar] [CrossRef] [Scilit] [PubMed]
- Zuo, Q.H.; Tan, S.Y.; Gao, L.N.; Wang, X.E.; Zhang, J.; Liu, F.W.; Zhu, K. Biochemical metabolic enhancement acting as a dominant driver in intra-leaf CO2 diffusional response to soil nitrogen supplying in Soybean. PLoS ONE 2026, 21, e0340250. [Google Scholar] [CrossRef] [Scilit] [PubMed]
- Saiz-Fernández, I.; De Diego, N.; Brzobohatý, B.; Munoz-Rueda, A.; Lacuesta, M. The imbalance between C and N metabolism during high nitrate supply inhibits photosynthesis and overall growth in maize (Zea mays L.). Plant Physiol. Biochem. 2017, 120, 213–222. [Google Scholar] [CrossRef] [Scilit] [PubMed]
- Sperling, O.; Karunakaran, R.; Erel, R.; Yasuor, H.; Klipcan, L.; Yermiyahu, U. Excessive nitrogen impairs hydraulics, limits photosynthesis, and alters the metabolic composition of almond trees. Plant Physiol. Biochem. 2019, 143, 265–274. [Google Scholar] [CrossRef] [Scilit] [PubMed]
- Zhu, K.; Wang, A.Z.; Wu, J.B.; Yuan, F.H.; Guan, D.X.; Jin, C.J.; Zhang, Y.S.; Gong, C.J. Effects of nitrogen additions on mesophyll and stomatal conductance in Manchurian ash and Mongolian oak. Sci. Rep. 2020, 10, 10038. [Google Scholar] [CrossRef] [Scilit] [PubMed]
- Grassi, G.; Magnani, F. Stomatal, mesophyll conductance and biochemical limitations to photosynthesis as affected by drought and leaf ontogeny in ash and oak trees. Plant Cell Environ. 2005, 28, 834–849. [Google Scholar] [CrossRef] [Scilit]
- Wang, X.X.; Du, T.T.; Huang, J.L.; Peng, S.B.; Xiong, D.L. Leaf hydraulic vulnerability triggers the decline in stomatal and mesophyll conductance during drought in rice. J. Exp. Bot. 2018, 69, 4033–4045. [Google Scholar] [CrossRef] [Scilit] [PubMed]
- Galmés, J.; Medrano, H.; Flexas, J. Photosynthesis limitations in response to water stress and rewatering in Mediterranean plants with different growth forms. New Phytol. 2007, 175, 81–93. [Google Scholar] [CrossRef] [Scilit] [PubMed]
- Galle, A.; Florez-Sarasa, I.; Tomas, M.; Pou, A.; Medrano, H.; Ribas-Carbo, M.; Flexas, J. The role of mesophyll conductance during water stress and rewatering in tobacco (Nicotiana sylvestris): Acclimation or limitation? J. Exp. Bot. 2009, 60, 2379–2390. [Google Scholar] [CrossRef] [Scilit] [PubMed]
- Han, J.M.; Lei, Z.Y.; Zhang, Y.J.; Yi, X.P.; Zhang, W.F.; Zhang, Y.L. Drought-introduced variability of mesophyll conductance in Gossypium and its relationship with leaf anatomy. Physiol. Plant. 2019, 166, 873–887. [Google Scholar] [CrossRef] [Scilit] [PubMed]
- Harley, P.C.; Loreto, F.; Marco, G.D.; Sharkey, T.D. Theoretical considerations when estimating the mesophyll conductance to CO2 flux by analysis of the response of photosynthesis to CO2. Plant Physiol. 1992, 98, 1429–1436. [Google Scholar] [CrossRef] [Scilit] [PubMed]
- Genty, B.; Briantais, J.M.; Baker, N.R. The relationship between the quantum yield of photosynthetic electron-transport and quenching of chlorophyll fluorescence. Biochim. Biophys. Acta 1989, 990, 87–92. [Google Scholar] [CrossRef] [Scilit]
- Valentini, R.; Epron, D.; Angelis, P.D.E.; Matteucc, G.; Dreyer, E. In situ estimation of net CO2 assimilation, photosynthetic electron flow and photorespiration in Turkey oak (Q. cerris L.) leaves: Diurnal cycles under different levels of water supply. Plant Cell Environ. 1995, 18, 631–640. [Google Scholar] [CrossRef] [Scilit]
- Laisk, A. Kinetics of Photosynthesis and Photorespiration of C3 Plants; Nauka: Moscow, Russia, 1977. [Google Scholar]
- Sun, J.W.; Guan, D.X.; Wu, J.B.; Jing, Y.L.; Yuan, F.H.; Wnag, A.Z.; Jin, C.J. Day and night respiration of three tree species in a temperate forest of northeastern China. iForest-Biogeosci. For. 2015, 8, 25–32. [Google Scholar] [CrossRef] [Scilit]
- Xiong, D.L.; Xi, L.; Liu, L.M.; Douthe, C.; Li, Y.; Peng, S.B.; Huang, J.L. Rapid responses of mesophyll conductance to changes of CO2 concentration, temperature and irradiance are affected by N supplements in rice. Plant Cell Environ. 2015, 38, 2541–2550. [Google Scholar] [CrossRef] [Scilit] [PubMed]
- Arnon, D.I. Localization of polyphenoloxidase in the chloroplasts of beta-vulgaris. Nature 1948, 162, 341. [Google Scholar] [CrossRef] [Scilit] [PubMed]
- Hu, W.S.; Zhang, S.S.; Huang, W.; Chang, H.B.; Li, Y.S.; Gu, C.M.; Dai, J.; Yang, L.; Liao, X.; Qin, L. Nitrogen-driven changes in leaf anatomy affect the coupling between leaf mass per area and photosynthesis. J. Exp. Bot. 2025, 76, 3444–3456. [Google Scholar] [CrossRef] [Scilit] [PubMed]
- Zhou, Z.X.; Struik, P.C.; Gu, J.F.; van der Putten, P.E.L.; Wang, Z.Q.; Yin, X.Y.; Yang, J.C. Enhancing leaf photosynthesis from altered chlorophyll content requires optimal partitioning of nitrogen. Crop Environ. 2023, 2, 24–36. [Google Scholar] [CrossRef] [Scilit]
- Zhuo, H.; Liu, X.Y.; Luo, S.; Ou, X.X.; Rong, X.M.; Yang, L.; Li, Q.; Han, Y.L. Physiological changes underlying increased photosynthetic-nitrogen use efficiency in response to low-nitrogen conditions in Brassica napus L. Ind. Crops Prod. 2024, 211, 118240. [Google Scholar] [CrossRef] [Scilit]
- Li, K.; Liu, D.N.; Li, L.Y.; Gao, Y.; Gao, W.J.; Chen, B.W.; Luo, F.; Yao, Y. Effects of nitrogen application amount on nitrogen distribution and photosynthesis in tea leaves. Front. Plant Sci. 2022, 16, 1575317. [Google Scholar]
- Cun, Z.; Zhang, J.Y.; Wu, H.M.; Zhang, L.; Chen, J.W. High nitrogen inhibits photosynthetic performance in a shade-tolerant and N-sensitive species Panax notoginseng. Photosynth. Res. 2021, 147, 283–300. [Google Scholar] [CrossRef] [Scilit] [PubMed]
- Albornoz, F.; Lieth, J.H. Over fertilization limits lettuce productivity because of osmotic stress. Chil. J. Agric. Res. 2015, 75, 284–290. [Google Scholar] [CrossRef] [Scilit]
- Xiong, D.L.; Yu, T.T.; Zhang, T.; Li, Y.; Peng, S.B.; Huang, J.L. Leaf hydraulic conductance is coordinated with leaf morpho-anatomical traits and nitrogen status in the genus Oryza. J. Exp. Bot. 2015, 66, 741–748. [Google Scholar] [CrossRef] [Scilit] [PubMed]
- Tomás, M.; Flexas, J.; Copolovici, L.; Galmés, J.; Hallik, L.; Medrano, H.; Ribas-Carbó, M.; Tosens, T.; Vislap, V.; Niinemets, Ü. Importance of leaf anatomy in determining mesophyll diffusion conductance to CO2 across species: Quantitative limitations and scaling up by models. J. Exp. Bot. 2013, 64, 2269–2281. [Google Scholar] [CrossRef] [Scilit] [PubMed]
- Guo, F.Q.; Young, J.; Crawford, N.M. The nitrate transporter AtNRT1.1 (CHL1) functions in stomatal opening and contributes to drought susceptibility in Arabidopsis. Plant Cell 2003, 15, 107–117. [Google Scholar] [CrossRef] [Scilit] [PubMed]
- Yamori, W.; Nagai, T.; Makino, A. The rate-limiting step for CO2 assimilation at different temperatures is influenced by the leaf nitrogen content in several C3 crop species. Plant Cell Environ. 2011, 34, 764–776. [Google Scholar] [CrossRef] [Scilit] [PubMed]
- Makino, A.; Nakano, H.; Mae, T. Responses of ribulose-1,5-bisphosphate carboxylase, cytochrome f, and sucrose synthesis enzymes in rice leaves to leaf nitrogen and their relationships to photosynthesis. Plant Physiol. 1994, 105, 173–179. [Google Scholar] [CrossRef] [Scilit] [PubMed]
- Yin, X.Y. A method to quantify relative stomatal, mesophyll, and biochemical limitations to C3 leaf photosynthesis in a specific growth environment. Physiol. Plant. 2025, 177, e70552. [Google Scholar] [CrossRef] [Scilit] [PubMed]
- Zhu, R.; Hu, T.S.; Vico, G.; Zhang, L.; Qiu, R.J.; Wang, Y.P.; Li, Y.; Liu, Y. How stomatal, mesophyll, and biochemical limitations co-limit photosynthesis: A bilevel optimization model. Agric. For. Meteorol. 2025, 375, 110829. [Google Scholar] [CrossRef] [Scilit]

Disclaimer/Publisher’s Note: The statements, opinions and data contained in all publications are solely those of the individual author(s) and contributor(s) and not of MDPI and/or the editor(s). MDPI and/or the editor(s) disclaim responsibility for any injury to people or property resulting from any ideas, methods, instructions or products referred to in the content. |
© 2026 by the authors. Licensee MDPI, Basel, Switzerland. This article is an open access article distributed under the terms and conditions of the Creative Commons Attribution (CC BY) license.