


Abstract
The formation of a species’ range generally involves dispersal and selection processes where dispersal enhancing species expansion is counterbalanced by selection that reduces mean population fitness at the edge of a species’ range. The application of high-throughput sequencing has made it possible to identify the genetic basis for plant adaptation, which allows for assessing molecular mechanisms of genetic regulation at the edge. Here, we first review the theoretical advances in studying a species’ range based on a unified eco-evolutionary model. Genetic loads generated by different evolutionary processes can be uniformly expressed in a general genetic component of regulation (). We then discuss the molecular basis of adaptation from recent empirical studies, including SNP-based detection of adaptation signatures, the regulation of gene expression, genomic structural variation, transposable elements, gene family expansion/contraction, and genome size. We also discuss the potential of applying estimates of molecular evolutionary rates (Ka/Ks) to infer plant adaptation in the edge populations by comparing the differences between the central and edge populations or between the central and edge communities. Finally, we discuss how plant mating systems regulate genetic loads in edge populations and alter the relative genetic loads at the gametophyte versus sporophyte phase. By linking the eco-evolutionary model with genomic evidence, this review explores several issues to incorporate genetic and ecological regulations and genomic variation into studies on a species’ range. Addressing these issues can extend our understanding of the limits to a plant species’ range.
1. Introduction
Understanding why and how a plant species occupies one region but not others has long been a fundamental goal in plant ecology, evolutionary biology, and conservation sciences [1,2,3]. Plant species vary markedly in the size, continuity, and boundary sharpness of their geographic ranges [4]. Almost all species on Earth have limited geographic distributions. This raises two basic questions: How is a species’ range limited under global climate and environmental changes? What mechanisms maintain them? Answers to these questions may help us to understand the pattern of biodiversity and to develop an effective conservation strategy for a particular species. So far, many theories and empirical studies have tackled this theme, and several specific issues have been recorded [5,6,7]. Although the evolutionary forces driving a species’ range have been studied and discussed in the literature, a general framework, especially covering different genetic loads regulating a species’ range, has not been synthesized in detail. Here we bring together different models of evolutionary processes shaping the mean fitness of a population and synthesize them in a general eco-evolutionary model to describe a species’ range.
The eco-evolutionary explanation of a species’ range goes back to Darwin’s pioneering work [8], who emphasized the roles of climate, other physical conditions, and interspecific interactions in determining a species’ range. This was followed by Haldane [9], who emphasized the joint effects of natural selection and gene flow in determining a species’ range. Gene flow from the central populations constrains adaptation in the edge populations, thereby limiting species expansion, which has been explored in detail [10,11,12]. These two viewpoints provide a basis to examine eco-evolutionary processes underlying a species’ range. Subsequent models have been developed to explore diverse models of selection (ecological niche models) and neutral processes [13]. These models explicitly or implicitly involve the adaptation of edge populations to local environments despite different model assumptions. The eco-evolutionary model is extended from the previously single population-based to the metapopulation-based models and is used to interpret and predict species’ geographic ranges [6,7,14]. The limit of the species distribution marks the transition from species presence to absence and reflects constraints on population adaptation [15,16].
The application of high-throughput sequencing has transformed previous studies on population adaptation, mainly based on phenotypic variation, into the integration of both phenotypic and genome-wide sequence variations. This transition provides new opportunities to examine molecular mechanisms underlying a species’ range [17]. A growing body of work has integrated genome-wide SNP variation, transcriptome-based RNA-seq data, structural variants (SVs), transposable elements (TEs), and molecular evolution analyses to identify adaptation signatures and to clarify the molecular basis of population adaptation. However, the linkage between molecular mechanisms and the eco-evolutionary model has not been explored, which hinders our insights into a general picture of a plant species’ range at a more fundamental level. Here we begin by synthesizing the eco-evolutionary model, which is predominantly applied to interpret animal species’ ranges, and unify the mean Malthusian fitness of the population for interpreting plant species’ ranges. We then review recent advances in molecular mechanisms related to a species’ range and connect the empirical findings to population fitness in the eco-evolutionary model, including adaptation signature detection in terms of various genomic markers, molecular evolution and the regulation of plant mating systems on a species’ range. Finally, we discuss a few important issues, and their exploration can expand our understanding of the molecular mechanisms underlying the formation of a plant species’ range.
2. A Unified Eco-Evolutionary Model
Without loss of generality, consider a population size N as a continuous variable. In one-dimensional and homogeneous space, the general framework for an eco-evolutionary model for population dynamics at the edge of a plant species’ range can be synthesized in the diffusion–reaction process (Fisher-KPP equation):
where (the reaction term) is the mean Malthusian fitness of the population, σ2 (the diffusion term) is the variance of distance between parent and offspring, t is the time, and x is the position in space. Notice that is the potential function of biotic, genetic and abiotic factors [18]. Equation (1) can be derived by combining the changes due to population fitness (selection) and due to dispersal from foreign populations. The first part is a general expression for a population growth change where can be expressed in different forms under various scenarios. The second part is approximated by a diffusion process. These two parts are separately modeled and then combined to yield Equation (1). Although this framework is predominantly applied to animal species’ ranges, the two essential components ( and σ2) have not been understood in a general way, particularly for plant species.
Fisher [19] first proposed this model where was expressed in the logistic growth rate to describe the spread of advantageous genes in a two-dimensional space. The diffusion term in (1) refers to short-distance movement per unit time. Up to now, many variant models have been developed to describe population spatial spread [20,21,22] but have not been synthesized in a general way for a species’ range. A species’ range is limited in theory when the mean Malthusian fitness is not greater than zero. For instance, if is expressed as , where A, K, and r0 are the Allee-effect threshold [23], the carrying capacity, and the intrinsic growth rate, respectively; a species’ range may be formed when is negative and the diffusion process is weaker. If is the per capita growth rate (without Allee effects), the edge population grows, and the species expands across space as a traveling wave under the conditions of , , and . At a low density where approaches r0, the front wave moves at an approximate speed of [19,24].
In the following discussions of theoretical models, we assume that Allee effects on are negligible except for the discussions on potential Allee effects on genetic drift. Next, we synthesize the function under different eco-evolutionary processes, with an emphasis on different genetic loads (Figure 1). These processes can generate a mean Malthusian fitness deviating from the uniform per capita logarithmic growth rate under Malthusian law [18]. The mean Malthusian fitness () can be decomposed into the genetic () and ecological (re) components and their potential genotype-by-environment interactions (). They may unequally limit species’ ranges, although their relative effects could vary with species.
Figure 1.
The potential eco-evolutionary processes affecting the mean Malthusian fitness of a population (). The is decomposed into the components of re, , and the genotype-by-environment . Here re is considered to be mainly related to soft selection, where the number of survivors depends on individual competition ability (among intra- or interspecific individuals) and the genotypes with relatively higher advantages have larger survival probabilities. The is considered to be mainly related to hard selection, where the number of survivors depends on their adaptation to the environment rather than the density of competitors. The genetic component () may come from genetic loads from gene flow, mutation, drift and selection. The mating system affects the mean Malthusian fitness via interactions with basic evolutionary forces. The unidirectional arrows in the figure indicate causal relationships, while the two-way arrows indicate mutual interaction relationships.
Equation (1) indicates that a species’ range is shaped by the change in the mean Malthusian fitness of the edge population (). Selection interacts with other eco-evolutionary processes within species (e.g., among genotypes or genes) or between species to alter at the edge. With Haldane’s viewpoint, migration load weakens local adaptation [25,26] and facilitates species limitation by reducing at the edge. Suppose that the Malthusian population fitness is regulated by the logistic growth model (intraspecific competition) and is associated with an adaptive quantitative trait. The mean Malthusian fitness is expressed in terms of an adaptive phenotypic trait z that changes along an environmental gradient, the components of the ecological term re(N) (soft selection) and the genetic term (hard selection) in are written as
where VP is the phenotypic variance of the trait, is the population mean of the trait, zopt is the trait optimum, and Vs is the inverse of selection strength [27]. This decomposition does not include a potential regulation from eco-genetic interaction, denoted by (phenotypic plasticity). This interaction likely contributes to regulating a species’ range. Also, the relative contributions of ecological vs. genetic regulations (rₑ(N) vs. ) to limit a species’ range remain to be clarified. At equilibrium, the ecological and genetic regulation counterbalances each other, yielding , and the range boundary is restricted along the gradient of the trait. When the environmental gradient is steep relative to dispersal distance, the equilibrium range boundary is distributed closer to central populations, resulting in a narrower spatial distribution [10,27,28]. Several theories address how the joint effects of natural selection and gene flow affect the stability of species ranges [10,29,30].
Suppose that the mean Malthusian population fitness is controlled by the ecological regulation re(N) and genetic drift effects (Ne). Genetic drift shapes a species’ range via interaction with selection to regulate . Theoretical studies show that range expansion depends on whether genetic drift erodes genetic variation below the level needed for adaptation to new environmental conditions [31,32]. Genetic drift at the edge generates drift load by shifting population fitness away from its optimum. This process reduces [31,33], which is represented by independent white noise dw:
where N−1/2 is the strength of the drift effect. Notice that the white noise dw is not correlated in time and space, with a mean of zero and an expectation of autocorrelation being the Dirac delta function. A range size can be estimated from population density distribution. Genetic drift constrains range expansion indirectly by reducing the efficacy of selection against deleterious mutations, thereby increasing mutation load at the edge and limiting a species’ range [34,35]. Empirical evidence supports this expectation in Arabidopsis lyrata subsp. lyrata [36]. The re(N) reinforces impacts on small edge populations if Allee effects are present. If ecological regulation weakens Allee-effect constraints, it can alleviate the processes that limit range expansion. Du et al. [37] showed that individuals at the edge could maintain certain population density via shifting the boundary forward or backward, thereby avoiding Allee-effect limitation and promoting expansion. By contrast, when genetic drift overwhelms natural selection, species ranges may contract from the edge or undergo abrupt fragmentation, even when environmental change is relatively gradual [38].
Suppose that the mean Malthusian population fitness is regulated by ecological regulation re(N) and deleterious mutant genes. Mutation can interact with selection to regulate via mutation load. According to Haldane [39] and Kimura [40], the mutation load at a single locus with mutation rate μ is equal to μ. When there are n loci with deleterious mutants across whole genomes, the overall mutation load is equal to L = nμ. The genetic component of regulation in the Malthusian fitness is expressed by . Thus, is given by
Once the mutation load exceeds the ecological regulation at the edge, is negative and population expansion at the edge is blocked. In addition, when genetic drift interacts with mutation, the selection efficacy decreases and mutation load increases in edge populations, as reported in birds [41]. Simulations also show that mutation load can change dynamically when environmental change shifts species ranges [42]. Empirical studies support this prediction, such as in Arabidopsis lyrata [36,43] and Vitis arizonica [44].
Suppose that the mean Malthusian population fitness is only regulated by the ecological regulation arising from temporal fluctuation. Here, is the time-continuous Malthusian rate. Then, is expressed as . In homogeneous space, the edge populations with tend to spread in space in a traveling wave [20]. However, temporal variation in habitat reduces genetic diversity and weakens the maintenance of evolutionary potential due to competition among individuals, thereby limiting population adaptation to diverse habitats. Habitats in the edge populations often tend to fluctuate more temporally than the habitats in the central populations [45,46,47], and such temporal dynamics affect both ecological and evolutionary processes, ultimately restricting spatial distributions. Holt et al. [48] showed that temporal variation in habitats can shift the long-term growth rate in a directional way. If r(t, x) denotes the Malthusian population growth rate in environment x at time t, then the mean Malthusian growth rate under environmental variation over a time period T is calculated as:
Temporal dynamics can drive either range contraction or range expansion. Benning et al. [49] examined population spread along spatial environmental gradients and found that temporal environmental variation has a critical threshold, above which range expansion is prevented and a stable range forms.
The mating system as a life-history trait interacts with basic evolutionary forces to shape population dynamics and hence affect a species’ range. The mating system directly alters the diffusion coefficient σ2 for diploid dispersal via seeds only () and gene flow via both seed and pollen flow () [50], which differs from most animal species. Selfing discounts foreign pollen and thereby alters the spatial spread of both adaptive and neutral genes [51]. If the mating system has only weak effects on intra-competition, re(N) can be approximated by the case under outcrossing, but remains to be explored. Suppose that the mean Malthusian population fitness is regulated by both the ecological regulation and genetic loads in a mixed mating system. When the population growth is affected by an adaptive phenotypic trait (z), selfing directly interacts with gametic selection but indirectly with zygotic selection, thereby changing mean population fitness. Hu et al. [52] derived as follows:
where β is the ratio of selection coefficients between gametic and zygotic stages, S is the selection coefficient at the zygotic stage, VA is the additive genetic variance, and Vmax is the maximum additive variance. Selfing restricts a species’ range under gametic selection only but promotes range expansion under zygotic selection only. This theory implies a condition for the common view that species with self-fertilization often have wider ranges than outcrossing species [52].
Note that some species possess a partial selfing system in the edge populations that differ from the predominantly outcrossing system in the central populations [13]. Selfing interacts with genetic drift and mutation to reduce the effective population size (Ne) and weaken the efficacy of gametic selection, thereby favoring the retention of deleterious alleles and increasing genetic load [53]. This process can further amplify , and impede population expansion, particularly when the edge populations are small.
Darwin [8] argued that a species’ geographic distribution is shaped by climate and environmental conditions as well as by interspecific competition. Suppose that the mean Malthusian population fitness is only regulated by the ecological regulation arising from interspecific competition. When interspecific competition is incorporated, re is constructed by following the classical Lotka [54]–Volterra [55] model:
Here, re(N1, N2) is the ecological component of the mean Malthusian growth rate of species 1 under the influence of species 2; N1 and N2 are the population sizes of species 1 and species 2, respectively; a is the competitive effect of species 2 on species 1; and K1 is the carrying capacity of species 1. When is affected by an adaptive trait z, the competition coefficient a can be expressed as a function of interspecific differences in z, whereas follows the genetic term in (2). Equation (7) can be extended to the case of multispecies competition. Case & Taper [56] developed a theory of species distribution under two-species interactions, showing that biotic interactions can shape species’ ranges. Empirical evidence is recorded on the impacts of interspecific competition on species’ ranges [57,58,59,60]. Some theoretical models further include biotic gradients and environmental factors in the ecological regulation term, such as re(N1, N2, f), where f denotes an environmental factor. Alexander et al. [60] assumed an environment that was composed of one biotic and one abiotic variable, with the species’ fitness determined by a trade-off between responses to biotic and abiotic stresses. Their model showed that the genotypes favored at the edge may depend on the biotic environmental context and the form of the fitness trade-off.
Note that the general framework (1) needs revisions when plant populations spread along heterogeneous environments. The diffusion coefficient σ2 could be adjusted to σ2(x), allowing dispersal to vary across environmental locations. The ecological and genetic regulatory components are written as re(N, x) and , respectively, since both change with population position (x). Similarly, the long-distance dispersal moves the model beyond the diffusion approximation but still can be treated as an extension of the diffusion–reaction framework [20].
When the metapopulation dynamics are considered in the diffusion–reaction framework, the local population sizes are no longer fixed but fluctuate. Szep et al. [61] used Wright’s island model and assumed multilocus linkage equilibrium to derive the joint density ψ[N, p] of population size (N) and multilocus allele frequency (p), under the joint effects of ecological regulation r(N) and genetic regulation rg(p). Barton [14] subsequently expressed the genetic component as a function of the mean adaptive phenotypic trait rg() and obtained the joint density ψ[N, ] for evaluating species ranges.
Although the preceding framework is well established and can be unified in a general diffusion–reaction form, its connection to empirical molecular studies is scarce. The next section reviews the advances in empirical studies in this area and discusses how these studies connect to the unified eco-evolutionary model.
3. Molecular Bases for Adaptation in Plant Spatial Distribution
3.1. SNP-Based Detection of Adaptation Signatures
A species’ range could be maintained jointly by selection and other neutral processes (gene flow, genetic drift, and mutation). When re is low, determined by selective loci is then dominant. Identification of selective loci provides the genetic basis for insights into genetic regulation. Based on the diffusion–reaction framework, gene flow may swamp locally adaptive alleles when populations are investigated across a spatial scale smaller than the characteristic cline length, , where s is the selection coefficient of adaptive alleles [62], unless selection strength is very strong at some loci (s≫σ2/2) or the cline is only recently formed. Across spatial scales larger than l, local populations are more likely to possess alleles adapted to different habitats. Neutral processes facilitate the generation of linkage disequilibrium (LD) among loci, which reduces the power of detecting selective loci. Genome-wide scans for adaptive signatures can be performed with population genomic analysis, such as Fst outliers where local adaptation potentially occurs [63]. However, this approach often generates false-positive loci associated with neutral processes [64]. Furthermore, the environmental variables driving the observed patterns cannot be accurately identified [65]. Therefore, a landscape genomic analysis that combines population genomic analysis with environmental associations is now preferred to identify selective loci [66].
Table 1 summarizes recent studies with multiple approaches to identify adaptive loci and their correlated environmental gradients in different tree and crop species. The genomic datasets involved were SNPs derived from restriction site-associated DNA sequencing (RAD), genotyping-by-sequencing (GBS), whole-genome sequencing (WGS), transcriptome sequencing (RNA-seq), and single enrichment primer technology (SPET). When the SNPs associated with geographic or environmental factors are identified, the adaptation signatures could occur at corresponding loci. The basic procedure for such analyses follows detection of SNPs, annotation of candidate genes linked with the SNP variants and identification of functional pathways involving local adaptation. For example, there were 136 SNPs identified in Tibetan Plateau populations of Hordeum vulgare and 447 annotated candidate genes, including HvSs1 and HvVrn-H1, which were associated with cold-stress responses and flowering-time regulation [67]. Several candidate genes related to climate adaptation were identified in Picea rubens. Functional annotation and GO enrichment analyses indicated that these genes were mainly involved in drought stress, heat stress, cold stress, phenology regulation, and DNA/RNA repair pathways, including NBR1, HSFB-2B, and FPA [68].
Correlations between gene frequency and environmental gradients strongly imply local adaptation [69,70]. Ample evidence supports this implication, such as a latitudinal shift in PtFT2 allele frequency in Populus tremula [71], or associations of allele frequencies with temperature and precipitation in Fagus sylvatica [72]. However, when phenotypic traits change continuously along environmental gradients, the relationship between the environmental factors and the associated allele frequencies may not always show a simple monotonic cline, partly because of phenotypic plasticity (rge). Lotterhos [73] showed that different mutations reached similar multivariate phenotypic optima in different regions of a landscape. This could imply that similar adaptive outcomes could be achieved through different genetic pathways across geographic regions. Similar evidence to this was also reported in Pinus contorta [74].
Because gene flow blurs local genetic differences, the range covered by the investigated populations may affect the power of detecting adaptive loci [75]. In Quercus lobata, Gugger et al. [76] observed that adaptive loci were detected at multiple spatial scales, implying that independent selective processes could potentially act on these loci under different genetic or environmental backgrounds. In contrast, there were large differences in detecting selective loci between spatial scales in Eucalyptus regnans [75]. This was likely related to microgeographic habitat heterogeneity where local selection strength exceeded the homogenizing effect of gene flow [69,77,78]. Nevertheless, the strength of microenvironmental adaptation could depend on ecological and genetic contexts and may vary among species and landscape types [79].
Reports in the literature indicate that species with different degrees of genetic relatedness had common genes or nearby genomic regions displaying local adaptation across their natural distribution ranges. Such a phenomenon may reflect convergent adaptive responses to similar environmental pressures. More broadly, the same genetic loci are repeatedly involved in local adaptation across populations or species [80,81,82], such as in Quercus lobata and its close relative Q. rugosa [76] and in Eucalyptus species [83]. These adaptive loci did not correlate with species range sizes and essentially did not support the hypothesis that geographic range size is associated with the species’ responses to climate change [84]. Whiting et al. [82] also observed common patterns of adaptation among twenty-five distantly related plant species. Further work is needed to clarify whether locally adaptive loci and related genomic regions generally occur in local adaptation across multiple plant species.
Landscape genomic analysis is applied to separate adaptive loci from the neutral genomic background and to reveal local adaptation signatures at the molecular level. However, it should be noted that high correlations among environmental factors potentially exist, which makes it difficult to disentangle individual effects and limits direct identification of specific selective agents that drive adaptive differentiation among populations [85]. In addition, some studies only considered climatic variables due to limited data availability, and other environmental factors affecting local adaptation were overlooked. Most current studies employ RDA, where parts of the variation remain unexplained [86,87,88]. Under the conditions of strong population structure, conditional neutrality, genetic redundancy, and other complex mechanisms, landscape genomic analysis could fail to detect candidate loci for climate adaptation [81,89].
Table 1.
Landscape genomic analyses and major drivers of genomic variation in plants.
3.2. Regulation by Gene Expression
The gene expression level is a quantitative trait linking phenotype with genotype and is associated with specific genes and genotypes. Variation in gene expression level reflects the effects of the regulatory factors controlling that gene expression. When GWAS is performed with expression data, cis- and trans-regulatory mechanisms can be identified. This analysis provides information alternative to that derived from SNP-based scans of adaptive signatures. Wang et al. [106] provided a comprehensive review on plant gene expression regulation and evolution. The spatiotemporal regulation of gene expression results from long-term evolution and has robust genetic features and regulatory mechanisms (an Evo-Devo feature). However, the gene expression level is also affected by environmental factors and their potential interactions with genotypes (expression plasticity). These features make gene expression analysis at the population level broadly useful in ecology and evolutionary biology. Many studies have employed transcriptome data to examine the effects of environmental changes on gene expression, such as responses to precipitation differences in Brassica rapa [107], to seasonal flooding changes in Ischnosiphon colombianus [108] and to strong seasonal fluctuations [109].
Suppose that the expression level of a single gene is affected by environmental factors. Consider a common-garden experiment, with m sites, b genotypes and multiple individual measures for each genotype. Let zijk be the expression level of a gene in the k-th (k = 1, …, nij) individual (clone) of the j-th (j = 1, …, b) genotype at the i-th (i = 1, …, m) site or environment. All samples are assumed to be taken from the same tissue at the same developmental stage so that the expression level is comparable across samples biologically. The zijk can be partitioned into the mean value (u), the site or environment effect (si), the genetic effect (gj), the genotype-by-site effect (sgij), and the error term (eijk):
For a gene with b genotypes, (8) is analogous to a multiple-site unbalanced trial where the numbers of observations among sites for each genotype may be unequal. If all factor effects are fixed (fixed model), these effects can be statistically estimated and tested using ANOVA. If partial effects are fixed (e.g., site effects) and other effects are random, these effects can still be estimated and tested using the mixed linear model. In this situation, the genotype-by-site effects are random. Analysis of this model is not further presented here.
Consider a reciprocal-transplant experiment. Suppose that plants with b1 genotypes at site 1 are reciprocally transplanted with plants with b2 genotypes. The design is equivalent to a two-site experiment, with b (=b1 + b2) genotypes at each site. Equation (8) can still be applied to analyze this case. More complicated models can be found in [110,111,112].
Similarly, consider a natural field-sample experiment, with m sites, b genotypes and unequal numbers of individuals for each genotype. Equation (8) can be treated as either the fixed or the random model to estimate and test different effects, depending on the objectives. The major concern is comparable transcriptome sampling, such as the rigorous control of sampling time (e.g., the same developmental phase) and space (the same position) in field sampling.
Note that most transcriptomic studies measure gene expression from a specific tissue or organ of diploid organisms; therefore, unless single-cell RNA-seq is specified, the gene expression level (e.g., FPKM) represents the average level across cells within the tissue or organ. These datasets rarely separate genotype-specific expression. Therefore, if all samples at a site have the same genotype (b = 1), the mean population expression level is a mixture of the habitat or environmental effect, the genetic effect, and the genotype-by-environment effect. Differences in mean population expression level between sites reflect joint variation in these effects [86]. Such mixed-effect differences could approximately represent population-level differences in gene responses to heterogeneous sites. When samples contain different genotypes, the mean population gene expression level is calculated by , where Pij is the frequency of the j-th genotype in the i-th population, and = is the mean expression level. This value deviates from the case described above (b = 1). However, this calculation requires separation of b genotypes or associated SNPs screened from VCF analysis. A statistical issue for this analysis awaits further completion.
Gene expression is sensitive to environmental changes but genetically controlled and often exhibits expression plasticity (s × g). Many empirical studies have shown this feature [113,114], such as gene expression plasticity in Populus lasiocarpa [115]. An emerging question is to what extent gene expression plasticity arises from adaptive or non-adaptive processes [116,117]. Some experiments indicated that gene expression plasticity was associated with adaptive selection, such as in Tribolium castaneum [118]. Gene expression plasticity in rice exhibited different degrees of adaptation under wetland and dryland conditions [119,120].
Table 2 lists a few recent studies where population gene expression varied along environmental gradients, indicating that local adaptation was associated with species’ spatial distribution. The gene expression level was associated with environmental gradients, such as the elevational gradient in Rhododendron sanguineum var. haemaleum [121], Boechera stricta [122] and Quercus robur [123].
In theory, the central and edge populations are expected to differ in genetic composition. The frequencies of adaptive alleles vary in space or in different environments [51]. Accordingly, the expression levels of these genes vary and affect population adaptation. If the gene frequencies follow a clinal pattern, the optimum value of population gene expression level (zopt) is also expected to vary along a gradient under additive inheritance. The plastic component of gene expression could modify the clinal pattern. Suppose that the expression level (z) of an individual at a specific gene in the i-th site is decomposed in the linear form as Equation (8). These components at a given site can be estimated, and each component follows a normal distribution:), ), ), and ) where the symbols with bar hats are the means and is the variance. Suppose that the optimum expression level (zopt) in the population can be decomposed in the same way as Equation (8). Let be the vector and Zopt be the vector with corresponding optimum components. The fitness of an individual with the gene expression level z is expressed as
where Vs indicates the selection strength. This is the stabilizing selection towards an optimum expression level at the i-th site or environment for a single gene. Assume that an individual with Z follows a normal distribution, with density function ϕ(Z). Thus, the of the population is generally expressed as
where the genotype-by-site effects are included. Here, Equation (10) is not further explored but will be given elsewhere. A few studies have shown the presence of correlations between gene expression diversity and genetic diversity. In Pseudotaxus chienii, the gene expression diversity within and among populations was inversely related to nucleotide diversity [87]. Liu et al. [86] observed that the gene expression diversity was negatively correlated with population genetic distance or nucleotide diversity in Cephalotaxus oliveri, implying that the plastic responses were not significant.
Table 2.
Associations between gene expression and environmental gradients in plants.
3.3. Regulation by Genomic Structural Variants
3.3.1. Structural Variants and Transposable Elements
Genomic structural variants (SVs) are prevalent and play important roles in speciation and environmental adaptation [132,133]. SVs are usually defined as genomic segments larger than 50 bp in length, including duplications, inversions, translocations, and complex SVs [134]. Compared with SNPs, SVs could have larger effects on plant adaptation [135]. Their formation mechanisms include non-allelic homologous recombination (NAHR), non-homologous end joining (NHEJ), replication-based mechanisms, and the activity of transposable elements (TEs). SV types and sizes are often associated with diverse selective and evolutionary processes, including positive, negative, balancing selection, and neutral or nearly neutral processes [136]. A pangenome analysis of Quercus variabilis indicated that SV- and SNP-based scans revealed distinct selection signals, with only a few overlaps between the candidate regions [137]. Hämälä et al. [138] found that many SVs in Theobroma cacao were under selective constraints, which limits adaptation, whereas a small number of SVs affected adaptation to heterogeneous environments by altering gene expression. Regulatory effects of SVs were also reported in Brassica napus [139]. A pangenome analysis of Arabidopsis thaliana showed that more than 50% of large SVs (>500 bp) originated from TE insertions, and these TE-derived variants contributed to habitat adaptation [140]. Although few studies directly connected SVs to plant species’ range, the above cases imply that SVs can participate in regulating in the edge populations.
TEs are involved in regulating plant gene expression and adaptation but also exhibit distinct regions covered by SNPs-associated adaptation. Wang et al. [141] showed that SINE transposons promoted the accumulation of beneficial metabolites in Himalayan Prunus species and enhanced adaptation to harsh habitats. Zhao et al. [142] identified a Helitron transposon in Populus tomentosa populations. This transposon reduced WRKY expression and contributed to adaptation. In addition, TEs and SNPs provide complementary sources of genetic variation underlying plant adaptation to environmental heterogeneity. Rogivue et al. [143] showed little overlap between SNP- and TE-associated markers of local adaptation in Arabis alpina, suggesting that these variants could reflect distinct candidate genes and biological functions in adaptive responses. Castanera et al. [144] showed that transposon insertion polymorphisms (TIPs) captured more expression-associated genomic signals than SNPs alone in Oryza sativa ssp. indica and O. sativa ssp. japonica. When both were associated with the same expression trait, TIPs typically accounted for a greater fraction of expression variation.
In addition, TEs may be involved in plant spatial distribution. For instance, TE insertions contributed to adaptation to environmental changes in Phaseolus vulgaris and P. lunatus with wider-range expansions [145,146]. In Capsella rubella, the frequent insertions of TEs into the FLC region affected FLC gene expression and explained approximately 12.5% of natural variation in flowering time [147]. During the expansion of Zea mays into high-latitude regions, two independent TEs upstream of ZmCCT9 and ZmCCT10 reduced flowering repression, increased photoperiod insensitivity, and facilitated adaptation to high-latitude environments [148]. Hämälä et al. [149] observed that more abundant TEs in populations of Arabidopsis lyrata at higher altitude increased their adaptation. These examples imply that TEs participate in shaping a species’ range.
3.3.2. Gene Family and Genome Size
Most plants and animals have experienced partial- or whole-genome duplications in their long-term evolutionary history. Subsequent species divergences between close relatives often come from gene family expansion and contraction as well as genome size changes. The changes in gene family size could affect plant adaptation to different environments [150]. For instance, Yu et al. [151] identified 179 significantly expanded gene families in Acer catalpifolium, including stress-related families such as the FRS–FRF gene family, which enhanced adaptation to environmental stress. The rapid expansion of the WRKY gene family in Primulina huaijiensis was associated with adaptation to limestone karst environments [152]. Comparison of nine Rhododendron genomes showed that disease-resistance-related families were expanded in R. neriiflorum, a species from warm and humid subalpine forests, but contracted in R. nivale and R. redowskianum, which occur in cold alpine meadow and tundra environments with lower microbial diversity [153]. These examples imply that the changes in gene families potentially influence and hence a species’ range.
Differences in genome size and geographic range size between close relatives could likely imply the role of genome size variation. Compared with the wider-range relatives, the narrower-range species usually have smaller Ne, and lower genetic diversity due to genetic drift and inbreeding depression [154,155,156]. Further potential functional gene loss or gene family contraction weakens their ability to respond to environmental fluctuations (Table 3). The large genome constraint hypothesis predicts that angiosperms with larger genomes have lower dispersal abilities and hence narrower ecological niches and smaller geographic ranges [17]. Yet this prediction is not universal. Some narrow-range species have smaller genomes than their widespread relatives (Table 3), which may reflect genomic streamlining and functional specialization under specific selective pressures. The widespread Acer davidii has more expanded gene families and fewer contracted gene families than A. tsinglingense, suggesting that genomic redundancy may facilitate adaptation to diverse habitats. In contrast, the endangered and narrowly distributed A. tsinglingense may be adapted to small habitats [100].
Table 3.
Comparison between narrow- and wide-range relative species in genome and gene family size.
Although whole-genome duplication (WGD) occurs less frequently than tandem duplication [165], WGD or polyploidization represents an important evolutionary process that can promote plant diversification, speciation, and adaptation to new environments [166,167]. For example, the tetraploid Allium przewalskianum extends farther west and south than the diploid populations in the Qinghai–Tibet Plateau, suggesting broader ecological adaptability in tetraploids [168]. A similar relationship between polyploidy and range expansion was recorded in Solidago canadensis [169]. Similarly, the polyploid plants show higher environmental tolerance than their diploid relatives, especially under drought and salt stress [170,171], as reported in Pugionium and Brachypodium hybridum [172,173]. However, polyploidy plants do not always confer an advantage in extreme environments, such as in Chamaenerion angustifolium [174]. Taken together, these cases update reports showing that changes in genome size influenced plant species ranges.
Notice that the preceding discussions provide preliminary conclusions regarding the roles of SVs, TEs, gene families and genome sizes in shaping a species’ range. Several other factors, such as assembly methods and annotation pipelines, could affect these comparisons. Thus, more rigorous comparisons and meta-analyses are needed before a general conclusion is drawn across many plant species.
4. Detecting Adaptive Signatures by Ka/Ks
A species’ range may be governed by joint effects of selection, gene flow, mutation, and genetic drift. The edge populations often maintain smaller Ne where genetic drift is intensified, and selection efficacy is reduced. As a result, deleterious mutations accumulate more readily, which slows or constrains range expansion [42]. For instance, the European subspecies Arabidopsis lyrata ssp. petraea expanded northward after the Last Glacial Maximum, yet its edge populations experienced a sharp reduction [111]. The adaptive differences between the edge and central populations could be inferred from comparing their differences in molecular evolutionary rates (Figure 2). Strong purifying selection in the edge population indicates a reduced potential for further range expansion.
Figure 2.
Detecting adaptive signatures at the species’ edge from the comparison of Ka/Ks between the central and edge populations (upper panel for intraspecific competition) or between the central and edge communities (lower panel for interspecific competition). Note that the interacting species in a community are previously identified before analysis of adaptation detection.
Kryazhimskiy et al. [175] derived the ratio between the nonsynonymous substitution rate (Ka) and the synonymous substitution rate (Ks) for an adaptive gene in a single population:
The function D(2Ns, 4Neμ), D(0,4Neμ) and their calculations were described in Kryazhimskiy et al. [175]. Notice that D(2Ns, 4Neμ) and D(0,4Neμ) measure the polymorphisms due to the non-silent mutations per non-silent site and the silent mutations per silent site, respectively. The ratio within populations refers to the polymorphic sites where mutant alleles are not fixed in the short term. Kryazhimskiy et al. [175] showed that, in a single population, purifying selection is indicated with Ka/Ks < 1, whereas positive selection is indicated with Ka/Ks > 1. The ratio Ka/Ks increases as positive selection becomes stronger, but the increase becomes progressively smaller under strong positive selection, which differs from the pattern of Ka/Ks under interspecific competition. Stronger purifying selection implies the presence of highly deleterious alleles, which impedes adaptation of the edge populations. Gene flow from the central populations reinforces restriction of a species’ range [9,50].
Empirical studies were recorded for the intraspecific Ka/Ks analysis. Wang & Heckel [176] showed that Microtus arvalis subsp. orcadensis had a higher Ka/Ks than its close continental relative Microtus arvalis. The elevated Ka/Ks was mainly attributed to the smaller Ne maintained in the edge populations. However, higher molecular evolutionary rates were also reported for the continental populations than for the island populations [177], which arose from more efficient positive selection in the large populations [178]. In addition, molecular evolutionary rates were also correlated with the environmental gradients, such as a positive correlation with temperature or a negative correlation with latitude in ectotherms [179], a negative correlation with altitude in Sus scrofa [180], but a positive correlation with altitude in Rhododendron [181].
Adaptive signatures at the edge of a species could potentially be detected at the community level where interspecific interactions (competition and coexistence) differ between the edge and central communities. This is essentially consistent with Darwin’s viewpoint where a species’ range is determined by both abiotic and interspecific competition [8]. Suppose that species associations have been previously identified using community ecological methods. There are several methods that can be used to detect species associations in a community [182,183]. A phylogenetic tree can be constructed in the central community. Similarly, a phylogenetic tree in the edge community in which the edge population of a focal species is embedded can be constructed as well (Figure 2). The Ka/Ks ratio can be estimated from orthologous genes shared by interacting species [106]. Assume that the A allele has a constant selective advantage s over the a allele at a biallelic locus in a randomly mating population of effective size Ne. According to Kimura [184], Ka/Ks is given by
where s is the selection coefficient of mutant alleles. The Ka/Ks ratio refers to different alleles that are fixed in alternative lineages after a long-term history.
It is hypothesized that the species interaction in the edge community could cause the Ka/Ks ratio to be biased from its value in the central community. When the associated species imposes constraints on the focal species, this probably reduces its re(N1, N2) and its effective population size (Ne), which could increase the Ka/Ks ratio of deleterious genes. Similarly, positive interspecific interactions could increase re(N1, N2) and the effective population size of the focal species, which could enhance the Ka/Ks ratio. Thus, a comparison of Ka/Ks between the central and edge communities could likely reflect adaptation signatures in the edge populations. This hypothesis needs to be verified with data collection.
Kapralov [185] estimated the Ka/Ks ratio of 27 species of the genus Schiedea (Caryophyllaceae) sampled from the Hawaiian Islands and the mainland. The higher ratio in the island group than in the mainland group could reflect relaxed purifying selection in the smaller island community. More positive selection in the mainland group reflects interspecific competition in the mainland community. Community size influences species interactions re(N1, N2, …), which could in turn influence the effective population size of a focal species and then genetic drift effects and the Ka/Ks ratio [186].
Other empirical studies have compared interspecific Ka/Ks across their spatial distributions. For example, in four high-elevation frog species from the Qinghai–Tibet Plateau, genes with high Ka/Ks were annotated to participate in key pathways related to energy metabolism, mitochondrial function, and DNA repair [187]. In two alpine Lobelia species, Zhao et al. [188] detected that genes associated with cold response, DNA repair, and gene expression regulation were under positive selection. Liu et al. [181] detected genes under positive selection in Rhododendron distributed in elevation regions. Whether the pattern of Ka/Ks ratio is associated with interspecific interaction remains to be determined.
5. Regulation by Mating Systems
Alternation of generations and sexual reproduction are important innovations in eukaryote evolution. Selfing and outcrossing represent two different strategies of gene transmission across generations. Selfing can provide reproductive assurance and partly retains the functions that are equivalent to those of clonal or asexual reproduction. Outcrossing, by contrast, promotes genetic mixing among individuals. The mixed mating system combines both strategies and allows populations to balance the reproductive assurance and the maintenance of genetic variation. The life-cycle pattern differs widely among plant lineages, with the relative lengths of the gametophyte vs. sporophyte phases generally decreasing in the order of algae, bryophytes, ferns, gymnosperms, and angiosperms. Accordingly, the genetic loads could come from each phase and are unequal between the two phases, which shapes plant adaptation and species’ ranges. Previous studies have addressed how mating systems affect genetic diversity and a species’ range, as well as theoretical relationships between mating systems and molecular evolution [51,189]. In Section 2, we discussed how mixed mating systems regulate . Here, we expand discussions on the role of selfing in regulating molecular evolution and adaptation in the edge populations.
Selfing facilitates the maintenance of deleterious mutant alleles and reduces population fitness. However, this conclusion depends on certain conditions. Xiao et al. [53] proposed the concept of a critical selfing rate α* for large populations. A fraction of deleterious alleles can be fixed and generate genetic load when the selfing rate exceeds α* under mutation-selection processes. Assume that the fitness in the gametophyte phase is 1 − sh for the ancestral allele (A) and 1 for the mutant allele (a) in both pollen and ovules. The fitness in the sporophyte phase is 1 for the AA genotype, 1 − hsd for Aa, and 1 − sd for aa. In small populations with genetic drift effects, Ka/Ks is shaped by the selfing rate α. According to Equation (14) of Li et al. [189], when only gametic selection occurs, Ka/Ks is given by
When sh > 0, the mutant allele is beneficial. When sh < 0, the mutant allele is deleterious. When only zygotic selection occurs under a linear additive selection model (h = 1/2), according to Equation (17) of Li et al. [189], Ka/Ks is expressed as
The mutant allele is beneficial when sd < 0, but deleterious when sd > 0.
When the mutant allele is deleterious (Figure 3A), selfing reduces the efficiency of gametic selection. Genes expressed only at the gametic stage are therefore subjected to relaxed selection, and Ka/Ks tends to unity. By contrast, genes expressed only at the zygotic stage are subjected to stronger purifying selection, leading to a lower Ka/Ks. A contrast pattern is predicted for beneficial mutant alleles (Figure 3B). Selfing weakens gametic selection, so genes expressed in the gametophyte phase only have Ka/Ks closer to one. However, genes expressed in the sporophyte phase are subject to stronger positive selection, leading to a higher Ka/Ks. Selfing regulates molecular evolution rates in opposite directions depending on whether genes are expressed in the gametic or zygotic phase. This phase-specific effect provides a theoretical explanation for how mating systems shape species adaptation to environments and hence the species’ ranges.
Figure 3.
Examples of selfing regulating the molecular evolutionary rates (Ka/Ks). (A) Deleterious mutant genes expressed in the gametophyte phase only (blue line) and in the sporophyte phase only (green line), parameterized with sh = −0.015, sd = −0.03, and Ne = 30; and (B) Beneficial mutant genes expressed in the gametophyte phase only (blue line) and in the sporophyte phase only (green line), parameterized with sh = 0.015, sd = 0.03, and Ne = 30. The results are derived from Equations (14) and (15).
Species of self-fertilization often have smaller genomes but larger geographic ranges [17]. The edge populations may receive genetic inputs from the central or other populations. Deleterious mutations therefore accumulate during spatial expansion. Some species exhibit a partial selfing system in the edge populations, such as Arabidopsis lyrata ssp. lyrata at the edge [43]. This transition facilitates the generation of unequal genetic loads between the gametic and zygotic phases.
Assume that the fitness in the gametophyte phase is 1 for the ancestral allele (A) and 1 − sp for the mutant allele (a) in pollen and 1 − so in ovules. The fitness in the sporophyte phase is 1 for the AA genotype, 1 + shet for Aa, and 1 + shom for aa. Xiao et al. [53] provided the density function of mutant-allele frequency (Equation (10)) and the mean fitness at both phases under a mixed mating system. Based on these results, and assuming a linear additive selection model (shet = shom/2), the frequency density of the deleterious mutant gene expressed in the gametophyte phase only is given by
where μ is the mutation rate from the ancestral allele to the deleterious allele and shap is equal to sp + so. The frequency density of the deleterious mutant gene expressed in the sporophyte phase only is given by
The ratio of genetic load in the gametic phase () to that in the zygotic phase () is derived below:
where and . Notice that the mean Malthusian population fitness is equivalent to where is the mean population fitness in Wright’s definition. Consider genes expressed in a single phase only (gametophyte or sporophyte phase). The genetic component in the Malthusian fitness is .
Assume that the mutant alleles are deleterious in the gametophyte phase (shap > 0) or in the sporophyte phase (shom < 0) according to the fitness settings. Under the same selection strength, the mean genetic load in the gametic phase (Lhap) gradually exceeds that generated in the zygotic stage (Ldip) as the selfing rate increases (Figure 4). The genetic drift effects do not alter the general pattern since a positive partial differential of Lhap/Ldip with respect to the selfing rate holds, i.e., . It is hypothesized that the edge populations could possess different mating systems to regulate the total genetic load (Lhap + Ldip) so as to adapt to habitats. This hypothesis remains to be tested by empirical studies.
Figure 4.
Examples of the relative genetic loads between the gametic and zygotic phases (Lhap/Ldip) regulated by the mating system, commonly parameterized with shap = 0.03 and shom = −0.03. The genetic drift effects were compared under three effective population sizes: Ne = 15 (black lines), 30 (green line) and 50 (blue line). The results were derived from Equation (18), where the integral calculation was obtained using the NIntegrate function of Mathematica v 9.0 [190], with the frequency (q) in the range [10−6, 1].
Ample evidence addresses the relationships between the mating system and population adaptation at the edge. The type of mating system can alter species’ ranges [33,191]. A transition from outcrossing to selfing reduces the efficiency of natural selection and allows mildly deleterious mutations to accumulate, which limits population adaptation to new environments. This could increase Ka/Ks and the genetic load at the gametic phase, which is rarely emphasized in the literature. Such patterns also likely occur in organelle genomes [192]. Both theoretical and empirical studies indicate that self-fertilization can mitigate genetic load at the edge through range expansion [193,194]. However, selfing does not fully prevent the accumulation of expansion load [195]. It should be noted that mating systems do not necessarily change during range expansion. Many species retain their ancestral mating systems despite the presence of the expansion load [111,112,196].
6. Conclusions and Perspectives
Selection and dispersal are two dominant processes affecting a plant species’ range, although other evolutionary processes cannot be excluded. Current availability of population genome data provides new sources to explore evolutionary mechanisms underlying a species’ range at a more fundamental level. Here, we explored the eco-evolutionary model to interpret species’ range based on the general diffusion–reaction framework and reviewed recent advances in molecular studies from the perspectives of population genomics, transcriptomics, and genomic structural variation. Specific conclusions are summarized below:
- (1)
- The mean Malthusian fitness in the edge populations can be uniformly decomposed into the genetic component (hard selection), ecological component re (soft selection) and their potential genetic-by-environment interactions (). The may come from different genetic loads generated by four basic evolutionary forces, while the re may come from temporal environmental variation, density dependence, and interspecific interactions. The relative strengths of these two types of regulation remain to be quantified across plant species.
- (2)
- Landscape genomic analysis is currently applied to identify genome-wide SNPs associated with adaptation. This method combines multiple levels of data (population genomic, environmental and geographical data) and identifies adaptation signatures at the genome-scale. It may help to reveal possible genetic processes regulating population growth () but has not been well linked to the formation of a species’ range.
- (3)
- RNA-seq data and expression plasticity are rarely applied to interpret a species’ range. The nature of this type of data is its sensitivity to changes in abiotic and biotic environmental factors and promises the hope of predicting species adaptation. Gene expression data helps to reveal the genetic component of population growth rate .
- (4)
- Although some genomic structural variants (SVs) and transposable elements (TEs) are associated with population adaptation, their connections to a species’ range are rarely studied. Genome size and gene family expansion/contraction also affect species ranges, although most support comes from comparisons of species with different range sizes. Whether these impacts are present across multiple plant species awaits more data collection.
- (5)
- The idea of using estimates of Ka/Ks to detect adaptive signatures in the edge populations needs data support. Divergent selection could be inferred through comparisons between the central and edge populations or between the central and edge communities in terms of the Ka/Ks ratio. This line of study remains to be explored.
- (6)
- The mating systems provide a way to regulate genetic loads in the edge populations. Selfing reduces the efficiency of gametic selection, promotes the accumulation of deleterious mutations, and increases the proportion of the total genetic load from the gametic stage. Selfing also strengthens selection at the zygotic stage and reduces the genetic load from this stage. Small edge populations could weaken this regulatory effect. Plants with different lengths of gametophyte phase in a life cycle could evolve different ways to regulate a species’ range. This awaits empirical evidence.
Apart from the preceding conclusions, the following questions deserve emphasis in future studies.
- (1)
- The eco-evolutionary model could be extended by including gene expression traits as quantitative traits in modeling selection and adaptation. This provides a basis for directly incorporating molecular traits into theoretical models of species distribution. Such work may provide insights into the molecular mechanisms that regulate adaptation in the edge populations.
- (2)
- Population genomic analysis can detect diverse forms of genetic variation across the genome. A major concern lies in the methods that limit the accurate identification of all classes of structural variation. This methodological gap has constrained the application of SVs and TEs to ecological and evolutionary studies [133,197]. Although genome scans and environmental association analyses have identified candidate genes and genomic regions, most findings are confined to statistical associations. Direct evidence for the functional roles of candidate genes in adaptation is still scarce [198,199]. Further work is needed to clarify how genomic variation can be applied to explain species distribution patterns.
- (3)
- A key challenge is to evaluate the relative strengths of ecological regulation or soft selection versus genetic regulation or hard selection. Molecular explanations of a species’ range mainly involve hard selection and emphasize genetic load and evolutionary processes. Ecological regulation operates over shorter timescales. The extent to which the two regulatory mechanisms shape a species’ range varies among species. Different modes of selection could generate contrasting outcomes, and range changes under hard selection may even lead to extinction [42]. More accurate predictions of a species’ range may depend on models that account for both hard and soft selection.
In general, future studies need to integrate multiple layers of data with complementary research methods. Multi-omics studies that combine population genomics with transcriptomics, epigenomics, metabolomics, and related data can reveal how genetic variation influences adaptation to environments. Experimental studies, including common-garden experiments, gene editing, and functional validation, would be effective in testing the adaptive roles of candidate genes and genomic structural variants. Linking molecular data with theoretical models would provide a deeper understanding of the molecular mechanisms underlying a plant species’ range.
Author Contributions
Conceptualization, X.-S.H.; investigation, Y.-W.L., X.-H.L., H.X., Y.-L.B. and Z.-Y.G.; resources, Y.-W.L., X.-H.L., H.X., Y.-L.B. and Z.-Y.G.; writing—original draft preparation, Y.-W.L.; writing—review and editing, Y.-W.L. and X.-S.H.; visualization, Y.-W.L.; supervision, X.-S.H. All authors have read and agreed to the published version of the manuscript.
Funding
This research was funded by the National Natural Science Foundation of China, grant number 32171819, and South China Agricultural University, grant number 4400-K16013.
Data Availability Statement
No new data were created or analyzed in this study. Data sharing is not applicable to this article.
Acknowledgments
We sincerely appreciate three anonymous reviewers for helpful and constructive comments on this article.
Conflicts of Interest
The authors declare no conflicts of interest. The funders had no role in the design of the study; in the collection, analysis, or interpretation of data; in the writing of the manuscript; or in the decision to publish the results.
References
- Briscoe, N.J.; Elith, J.; Salguero-Gómez, R.; Lahoz-Monfort, J.J.; Camac, J.S.; Giljohann, K.M.; Holden, M.H.; Hradsky, B.A.; Kearney, M.R.; McMahon, S.M.; et al. Forecasting species range dynamics with process-explicit models: Matching methods to applications. Ecol. Lett. 2019, 22, 1940–1956. [Google Scholar] [CrossRef] [Scilit]
- Sheth, S.N.; Morueta-Holme, N.; Angert, A.L. Determinants of geographic range size in plants. New Phytol. 2020, 226, 650–665. [Google Scholar] [CrossRef] [Scilit]
- Sutherland, W.J.; Freckleton, R.P.; Godfray, H.C.J.; Beissinger, S.R.; Benton, T.; Cameron, D.D.; Carmel, Y.; Coomes, D.A.; Coulson, T.; Emmerson, M.C.; et al. Identification of 100 fundamental ecological questions. J. Ecol. 2013, 101, 58–67. [Google Scholar] [CrossRef] [Scilit]
- Connallon, T.; Sgrò, C.M. In search of a general theory of species’ range evolution. PLoS Biol. 2018, 16, e2006735. [Google Scholar] [CrossRef] [Scilit]
- Gaston, K.J. The Structure and Dynamics of Geographic Ranges; Oxford University Press: Oxford, UK, 2003. [Google Scholar] [CrossRef] [Scilit]
- Holt, R.D.; Keitt, T.H. Species’ borders: A unifying theme in ecology. Oikos 2005, 108, 3–6. [Google Scholar] [CrossRef] [Scilit]
- Rafajlović, M.; Alexander, J.M.; Butlin, R.K.; Johannesson, K. Introduction to the theme issue ‘species’ ranges in the face of changing environments. Philos. Trans. R. Soc. B Biol. Sci. 2022, 377, 20210002. [Google Scholar] [CrossRef] [Scilit]
- Darwin, C.R. On the Origin of Species by Means of Natural Selection, or, the Preservation of Favoured Races in the Struggle for Life; J. Murray: London, UK, 1859. [Google Scholar]
- Haldane, J.B.S. The relation between density regulation and natural selection. Proc. R. Soc. Lond. B Biol. Sci. 1956, 145, 306–308. [Google Scholar] [CrossRef] [Scilit]
- Barton, N.H. Adaptation at the edge of a species’ range. In Integrating Ecology and Evolution in a Spatial Context; Cambridge University Press: Cambridge, UK, 2001. [Google Scholar]
- Garant, D.; Forde, S.E.; Hendry, A.P. The multifarious effects of dispersal and gene flow on contemporary adaptation. Funct. Ecol. 2007, 21, 434–443. [Google Scholar] [CrossRef] [Scilit]
- Sexton, J.P.; McIntyre, P.J.; Angert, A.L.; Rice, K.J. Evolution and ecology of species range limits. Annu. Rev. Ecol. Evol. Syst. 2009, 40, 415–436. [Google Scholar] [CrossRef] [Scilit]
- Zhang, X.X.; Wang, X.; Hu, Y.; Zhou, W.; Chen, X.Y.; Hu, X.S. Advances in the study of population genetic diversity at plant species’ margins. Chin. J. Plant Ecol. 2019, 43, 383−395. [Google Scholar] [CrossRef] [Scilit]
- Barton, N. Limits to species’ range: The tension between local and global adaptation. J. Evol. Biol. 2024, 37, 605–615. [Google Scholar] [CrossRef] [Scilit]
- Hoffmann, A.A.; Blows, M.W. Species borders: Ecological and evolutionary perspectives. Trends Ecol. Evol. 1994, 9, 223–227. [Google Scholar] [CrossRef] [Scilit]
- Lee-Yaw, J.A.; Kharouba, H.M.; Bontrager, M.; Mahony, C.; Csergő, A.M.; Noreen, A.M.E.; Li, Q.; Schuster, R.; Angert, A.L. A synthesis of transplant experiments and ecological niche models suggests that range limits are often niche limits. Ecol. Lett. 2016, 19, 710–722. [Google Scholar] [CrossRef] [Scilit]
- Bureš, P.; Elliott, T.L.; Veselý, P.; Šmarda, P.; Forest, F.; Leitch, I.J.; Nic Lughadha, E.; Soto Gomez, M.; Pironon, S.; Brown, M.J.M.; et al. The global distribution of angiosperm genome size is shaped by climate. New Phytol. 2024, 242, 744–759. [Google Scholar] [CrossRef] [Scilit]
- Berryman, A.A. On principles, laws and theory in population ecology. Oikos 2003, 103, 695–701. [Google Scholar] [CrossRef] [Scilit]
- Fisher, R.A. The wave of advance of advantageous genes. Ann. Eugen. 1937, 7, 355–369. [Google Scholar] [CrossRef] [Scilit]
- Shigesada, N.; Kawasaki, K. Biological Invasions: Theory and Practice; Oxford University Press: Oxford, UK, 1997. [Google Scholar] [CrossRef] [Scilit]
- Ruan, S. Delay differential equations in single species dynamics. In Delay Differential Equations and Applications; Arino, O., Hbid, M.L., Ait Dads, E., Eds.; Springer: Dordrecht, The Netherlands, 2006; Volume 205, pp. 477–517. [Google Scholar] [CrossRef] [Scilit]
- Sawada, Y.; Takeuchi, Y.; Dong, Y. Stability analysis of a single-species logistic model with time delay and constant inflow. Appl. Math. Lett. 2023, 138, 108514. [Google Scholar] [CrossRef] [Scilit]
- Allee, W.C. Animal Aggregations: A Study in General Sociology; The University of Chicago Press: Chicago, IL, USA, 1931. [Google Scholar]
- Kolmogorov, A.; Petrovsky, N.; Picoounov, N.S. A study of the equation of diffusion with increase in the quantity of matter, and its application to a biological problem. Mosc. Univ. Bull. Math. 1937, 1, 1–25. [Google Scholar]
- Wright, S. Evolution and the Genetics of Populations, Volume 3: Experimental Results and Evolutionary Deductions; University of Chicago Press: Chicago, IL, USA, 1977. [Google Scholar]
- Hu, X.S.; Li, B. On migration load of seeds and pollen grains in a local population. Heredity 2003, 90, 162–168. [Google Scholar] [CrossRef] [Scilit]
- Kirkpatrick, M.; Barton, N.H. Evolution of a species’ range. Am. Nat. 1997, 150, 1–23. [Google Scholar] [CrossRef] [Scilit]
- García-Ramos, G.; Huang, Y. Competition and evolution along environmental gradients: Patterns, boundaries and sympatric divergence. Evol. Ecol. 2013, 27, 489–504. [Google Scholar] [CrossRef] [Scilit]
- Bridle, J.R.; Polechová, J.; Kawata, M.; Butlin, R.K. Why is adaptation prevented at ecological margins? New insights from individual–based simulations. Ecol. Lett. 2010, 13, 485–494. [Google Scholar] [CrossRef] [Scilit]
- Bridle, J.R.; Kawata, M.; Butlin, R.K. Local adaptation stops where ecological gradients steepen or are interrupted. Evol. Appl. 2019, 12, 1449–1462. [Google Scholar] [CrossRef] [Scilit]
- Polechová, J.; Barton, N.H. Limits to adaptation along environmental gradients. Proc. Natl. Acad. Sci. USA 2015, 112, 6401–6406. [Google Scholar] [CrossRef] [Scilit]
- Polechová, J. Is the sky the limit? On the expansion threshold of a species’ range. PLoS Biol. 2018, 16, e2005372. [Google Scholar] [CrossRef] [Scilit]
- Koski, M.H.; Layman, N.C.; Prior, C.J.; Busch, J.W.; Galloway, L.F. Selfing ability and drift load evolve with range expansion. Evol. Lett. 2019, 3, 500–512. [Google Scholar] [CrossRef] [Scilit]
- Henry, R.C.; Bartoń, K.A.; Travis, J.M.J. Mutation accumulation and the formation of range limits. Biol. Lett. 2015, 11, 20140871. [Google Scholar] [CrossRef] [Scilit]
- Willi, Y.; Van Buskirk, J. A practical guide to the study of distribution limits. Am. Nat. 2019, 193, 773–785. [Google Scholar] [CrossRef] [Scilit]
- Perrier, A.; Sánchez-Castro, D.; Willi, Y. Environment dependence of the expression of mutational load and species’ range limits. J. Evol. Biol. 2022, 35, 731–741. [Google Scholar] [CrossRef] [Scilit]
- Du, Y.; Li, L.; Ni, W.; Shabgard, N. Invasion dynamics of super invaders: Elimination of Allee effects by a strategy at the range boundary. J. Math. Biol. 2025, 91, 69. [Google Scholar] [CrossRef] [Scilit]
- Polechová, J. Evolution of species’ range and niche in changing environments. Proc. Natl. Acad. Sci. USA 2026, 123, e2604510123. [Google Scholar] [CrossRef] [Scilit]
- Haldane, J.B.S. The effect of variation on fitness. Am. Nat. 1937, 71, 337–349. [Google Scholar] [CrossRef] [Scilit]
- Kimura, M. Optimum mutation rate and degree of dominance as determined by the principle of minimum genetic load. J. Genet. 1960, 57, 21–34. [Google Scholar] [CrossRef] [Scilit]
- Botero-Castro, F.; Wolf, J.B.W. Determinants of mutation load in birds. Genetics 2026, 232, iyag033. [Google Scholar] [CrossRef] [Scilit]
- Gilbert, K.J.; Peischl, S.; Excoffier, L. Mutation load dynamics during environmentally-driven range shifts. PLoS Genet. 2018, 14, e1007450. [Google Scholar] [CrossRef] [Scilit]
- Willi, Y.; Fracassetti, M.; Zoller, S.; Van Buskirk, J. Accumulation of mutational load at the edges of a species range. Mol. Biol. Evol. 2018, 35, 781–791. [Google Scholar] [CrossRef] [Scilit]
- Fiscus, C.J.; Aguirre-Liguori, J.A.; Gaut, G.R.J.; Gaut, B.S. Mutational load and adaptive variation are shaped by climate and species range dynamics in Vitis arizonica. New Phytol. 2025, 247, 998–1014. [Google Scholar] [CrossRef] [Scilit]
- Angert, A.L. The niche, limits to species’ distributions, and spatiotemporal variation in demography across the elevation ranges of two monkeyflowers. Proc. Natl. Acad. Sci. USA 2009, 106, 19693–19698. [Google Scholar] [CrossRef] [Scilit]
- Gerst, K.L.; Angert, A.L.; Venable, D.L. The effect of geographic range position on demographic variability in annual plants. J. Ecol. 2011, 99, 591–599. [Google Scholar] [CrossRef] [Scilit]
- Villellas, J.; Morris, W.F.; García, M.B. Variation in stochastic demography between and within central and peripheral regions in a widespread short-lived herb. Ecology 2013, 94, 1378–1388. [Google Scholar] [CrossRef] [Scilit]
- Holt, R.D.; Barfield, M.; Peniston, J.H. Temporal variation may have diverse impacts on range limits. Philos. Trans. R. Soc. B Biol. Sci. 2022, 377, 20210016. [Google Scholar] [CrossRef] [Scilit]
- Benning, J.W.; Hufbauer, R.A.; Weiss-Lehman, C. Increasing temporal variance leads to stable species range limits. Proc. R. Soc. B Biol. Sci. 2022, 289, 20220202. [Google Scholar] [CrossRef] [Scilit]
- Hu, X.S.; He, F.L. Seed and pollen flow in expanding a species’ range. J. Theor. Biol. 2006, 240, 662–672. [Google Scholar] [CrossRef] [Scilit]
- Zhang, X.X.; Cheng, X.; Li, L.L.; Wang, X.; Zhou, W.; Chen, X.Y.; Hu, X.S. The wave of gene advance under diverse systems of mating. Heredity 2020, 125, 253–268. [Google Scholar] [CrossRef] [Scilit]
- Hu, X.S.; Zhang, X.X.; Zhou, W.; Hu, Y.; Wang, X.; Chen, X.Y. Mating system shifts a species’ range. Evolution 2019, 73, 158–174. [Google Scholar] [CrossRef] [Scilit]
- Xiao, Y.; Lv, Y.W.; Wang, Z.Y.; Wu, C.; He, Z.H.; Hu, X.S. Selfing shapes fixation of a mutant allele under flux equilibrium. Genome Biol. Evol. 2024, 16, evae261. [Google Scholar] [CrossRef] [Scilit]
- Lotka, A.J. Elements of Physical Biology; Williams & Wilkins: Baltimore, MD, USA, 1924. [Google Scholar]
- Volterra, V. Leçons sur la Théorie Mathématique de la Lutte Pour la Vie; Gauthier-Villars: Paris, France, 1931. [Google Scholar]
- Case, T.J.; Taper, M.L. Interspecific competition, environmental gradients, gene flow, and the coevolution of species’ borders. Am. Nat. 2000, 155, 583–605. [Google Scholar] [CrossRef]
- Case, T.J.; Holt, R.D.; McPeek, M.A.; Keitt, T.H. The community context of species’ borders: Ecological and evolutionary perspectives. Oikos 2005, 108, 28–46. [Google Scholar] [CrossRef] [Scilit]
- Baer, K.C.; Maron, J.L. Pre-dispersal seed predation and pollen limitation constrain population growth across the geographic distribution of Astragalus utahensis. J. Ecol. 2018, 106, 1646–1659. [Google Scholar] [CrossRef] [Scilit]
- Benning, J.W.; Eckhart, V.M.; Geber, M.A.; Moeller, D.A. Biotic interactions contribute to the geographic range limit of an annual plant: Herbivory and phenology mediate fitness beyond a range margin. Am. Nat. 2019, 193, 786–797. [Google Scholar] [CrossRef] [Scilit]
- Alexander, J.M.; Atwater, D.Z.; Colautti, R.I.; Hargreaves, A.L. Effects of species interactions on the potential for evolution at species’ range limits. Philos. Trans. R. Soc. B Biol. Sci. 2022, 377, 20210020. [Google Scholar] [CrossRef] [Scilit]
- Szep, E.; Sachdeva, S.; Barton, N.H. Polygenic local adaptation in metapopulations: A stochastic eco-evolutionary model. Evolution 2021, 75, 1030–1045. [Google Scholar] [CrossRef] [Scilit]
- Slatkin, M. Gene flow and selection in a cline. Genetics 1973, 75, 733–756. [Google Scholar] [CrossRef] [Scilit]
- Brennan, R.S.; Healy, T.M.; Bryant, H.J.; La, V.; Schulte, P.M.; Whitehead, A. Integrative population and physiological genomics reveals mechanisms of adaptation in killifish. Mol. Biol. Evol. 2018, 35, 2639–2653. [Google Scholar] [CrossRef] [Scilit]
- Aguirre-Liguori, J.A.; Ramírez-Barahona, S.; Gaut, B.S. The evolutionary genomics of species’ responses to climate change. Nat. Ecol. Evol. 2021, 5, 1350–1360. [Google Scholar] [CrossRef] [Scilit]
- Cushman, S.A.; Shirk, A.J.; Howe, G.T.; Murphy, M.A.; Dyer, R.J.; Joost, S. Editorial: The least cost path from landscape genetics to landscape genomics: Challenges and opportunities to explore NGS data in a spatially explicit context. Front. Genet. 2018, 9, 215. [Google Scholar] [CrossRef] [Scilit]
- Ahrens, C.W.; Rymer, P.D.; Stow, A.; Bragg, J.; Dillon, S.; Umbers, K.D.L.; Dudaniec, R.Y. The search for loci under selection: Trends, biases and progress. Mol. Ecol. 2018, 27, 1342–1356. [Google Scholar] [CrossRef] [Scilit]
- Chen, T.; Xu, J.; Wang, L.; Wang, H.D.; You, E.; Deng, C.; Bian, H.Y.; Shen, Y.H. Landscape genomics reveals adaptive genetic differentiation driven by multiple environmental variables in naked barley on the Qinghai-Tibetan Plateau. Heredity 2023, 131, 316–326. [Google Scholar] [CrossRef] [Scilit]
- Capblancq, T.; Lachmuth, S.; Fitzpatrick, M.C.; Keller, S.R. From common gardens to candidate genes: Exploring local adaptation to climate in red spruce. New Phytol. 2023, 237, 1590–1605. [Google Scholar] [CrossRef] [Scilit]
- Hancock, A.M.; Brachi, B.; Faure, N.; Horton, M.W.; Jarymowycz, L.B.; Sperone, F.G.; Toomajian, C.; Roux, F.; Bergelson, J. Adaptation to climate across the Arabidopsis thaliana genome. Science 2011, 334, 83–86. [Google Scholar] [CrossRef] [Scilit]
- Savolainen, O.; Lascoux, M.; Merilä, J. Ecological genomics of local adaptation. Nat. Rev. Genet. 2013, 14, 807–820. [Google Scholar] [CrossRef] [Scilit]
- Wang, J.; Ding, J.; Tan, B.; Robinson, K.M.; Michelson, I.H.; Johansson, A.; Nystedt, B.; Scofield, D.G.; Nilsson, O.; Jansson, S.; et al. A major locus controls local adaptation and adaptive life history variation in a perennial plant. Genome Biol. 2018, 19, 72. [Google Scholar] [CrossRef] [Scilit]
- Postolache, D.; Oddou-Muratorio, S.; Vajana, E.; Bagnoli, F.; Guichoux, E.; Hampe, A.; Le Provost, G.; Lesur, I.; Popescu, F.; Scotti, I.; et al. Genetic signatures of divergent selection in European beech (Fagus sylvatica L.) are associated with the variation in temperature and precipitation across its distribution range. Mol. Ecol. 2021, 30, 5029–5047. [Google Scholar] [CrossRef] [Scilit]
- Lotterhos, K.E. The paradox of adaptive trait clines with nonclinal patterns in the underlying genes. Proc. Natl. Acad. Sci. USA 2023, 120, e2220313120. [Google Scholar] [CrossRef] [Scilit]
- Mahony, C.R.; MacLachlan, I.R.; Lind, B.M.; Yoder, J.B.; Wang, T.; Aitken, S.N. Evaluating genomic data for management of local adaptation in a changing climate: A lodgepole pine case study. Evol. Appl. 2020, 13, 116–131. [Google Scholar] [CrossRef] [Scilit]
- Von-Takach, B.; Ahrens, C.W.; Lindenmayer, D.B.; Banks, S.C. Scale-dependent signatures of local adaptation in a foundation tree species. Mol. Ecol. 2021, 30, 2248–2261. [Google Scholar] [CrossRef] [Scilit]
- Gugger, P.F.; Fitz-Gibbon, S.T.; Albarrán-Lara, A.; Wright, J.W.; Sork, V.L. Landscape genomics of Quercus lobata reveals genes involved in local climate adaptation at multiple spatial scales. Mol. Ecol. 2021, 30, 406–423. [Google Scholar] [CrossRef] [Scilit]
- Banks, S.C.; Davies, I.D.; Cary, G.J. When can refuges mediate the genetic effects of fire regimes? A simulation study of the effects of topography and weather on neutral and adaptive genetic diversity in fire-prone landscapes. Mol. Ecol. 2017, 26, 4935–4954. [Google Scholar] [CrossRef] [Scilit]
- Richardson, J.L.; Urban, M.C.; Bolnick, D.I.; Skelly, D.K. Microgeographic adaptation and the spatial scale of evolution. Trends Ecol. Evol. 2014, 29, 165–176. [Google Scholar] [CrossRef] [Scilit]
- Busoms, S.; da Silva, A.C.; Escolà, G.; Abdilzadeh, R.; Curran, E.; Bollmann-Giolai, A.; Bray, S.; Wilson, M.; Poschenrieder, C.; Yant, L. Local cryptic diversity in salinity adaptation mechanisms in the wild outcrossing Brassica fruticulosa. Proc. Natl. Acad. Sci. USA 2024, 121, e2407821121. [Google Scholar] [CrossRef] [Scilit]
- Bohutínská, M.; Vlček, J.; Yair, S.; Laenen, B.; Konečná, V.; Fracassetti, M.; Slotte, T.; Kolář, F. Genomic basis of parallel adaptation varies with divergence in Arabidopsis and its relatives. Proc. Natl. Acad. Sci. USA 2021, 118, e2022713118. [Google Scholar] [CrossRef] [Scilit]
- Rennison, D.J.; Peichel, C.L. Pleiotropy facilitates parallel adaptation in sticklebacks. Mol. Ecol. 2022, 31, 1476–1486. [Google Scholar] [CrossRef] [Scilit]
- Whiting, J.R.; Booker, T.R.; Rougeux, C.; Lind, B.M.; Singh, P.; Lu, M.; Huang, K.; Whitlock, M.C.; Aitken, S.N.; Andrew, R.L.; et al. The genetic architecture of repeated local adaptation to climate in distantly related plants. Nat. Ecol. Evol. 2024, 8, 1933–1947. [Google Scholar] [CrossRef] [Scilit]
- Ahrens, C.W.; Bragg, J.; Van-Der-Merwe, M.; Rossetto, M. Evidence of landscape-driven repeated adaptation among 13 Eucalyptus species. Evolution 2025, 79, 1020–1032. [Google Scholar] [CrossRef] [Scilit]
- Pacifici, M.; Foden, W.B.; Visconti, P.; Watson, J.E.M.; Butchart, S.H.M.; Kovacs, K.M.; Scheffers, B.R.; Hole, D.G.; Martin, T.G.; Akçakaya, H.R.; et al. Assessing species vulnerability to climate change. Nat. Clim. Change 2015, 5, 215–224. [Google Scholar] [CrossRef] [Scilit]
- Wadgymar, S.M.; Lowry, D.B.; Gould, B.A.; Byron, C.N.; Mactavish, R.M.; Anderson, J.T. Identifying targets and agents of selection: Innovative methods to evaluate the processes that contribute to local adaptation. Methods Ecol. Evol. 2017, 8, 738–749. [Google Scholar] [CrossRef] [Scilit]
- Liu, H.J.; Li, M.H.; Wang, Z.; Wang, T.; Su, Y.J. Local adaptation and demographic history of vulnerable conifer Cephalotaxus oliveri in southern China. J. Syst. Evol. 2024, 62, 457–474. [Google Scholar] [CrossRef] [Scilit]
- Liu, L.; Wang, Z.; Su, Y.J.; Wang, T. Population transcriptomic sequencing reveals allopatric divergence and local adaptation in Pseudotaxus chienii (Taxaceae). BMC Genom. 2021, 22, 388. [Google Scholar] [CrossRef] [Scilit]
- Feliciano, D.C.; De Godoy, S.M.; Marques Da Silva, J.F.; Góes, B.D.; Ferraz, J.R.; De Oliveira Santos, P.; Da Silva Ribeiro, J.E.L.; Ruas, P.M.; Ruas, C.D.F. Landscape genetics reveal low diversity and adaptive divergence in Portulaca hatschbachii (Portulacaceae): An endangered species endemic to rocky outcrops of the Atlantic Forest. Bot. J. Linn. Soc. 2022, 200, 116–141. [Google Scholar] [CrossRef] [Scilit]
- Lind, B.M.; Candido-Ribeiro, R.; Singh, P.; Lu, M.; Obreht Vidakovic, D.; Booker, T.R.; Whitlock, M.C.; Yeaman, S.; Isabel, N.; Aitken, S.N. How useful is genomic data for predicting maladaptation to future climate? Glob. Change Biol. 2024, 30, e17227. [Google Scholar] [CrossRef] [Scilit]
- Capblancq, T.; Morin, X.; Gueguen, M.; Renaud, J.; Lobreaux, S.; Bazin, E. Climate-associated genetic variation in Fagus sylvatica and potential responses to climate change in the French Alps. J. Evol. Biol. 2020, 33, 783–796. [Google Scholar] [CrossRef] [Scilit]
- Sun, P.W.; Chang, J.T.; Luo, M.X.; Liao, P.C. Genomic insights into local adaptation and vulnerability of Quercus longinux to climate change. BMC Plant Biol. 2024, 24, 279. [Google Scholar] [CrossRef] [Scilit]
- Macharia, M.W.; Caproni, L.; Solemanegy, M.; Takele, R.; Chiulele, R.M.; Munisse, P.; Amane, M.; Pè, M.E.; Buizza, R.; Dell’Acqua, M. Cowpea (Vigna unguiculata L. Walp.) landraces in Mozambique and neighbouring Southern African countries harbour genetic loci with potential for climate adaptation. Commun. Biol. 2025, 8, 834. [Google Scholar] [CrossRef] [Scilit]
- Yang, Y.Z.; Sun, P.W.; Ke, C.Y.; Luo, M.X.; Chang, J.T.; Chao, C.T.; Gao, R.H.; Liao, P.C. Towards climate-resilient conservation: Integrating genetics and environmental factors in determining adaptive units of a xeric shrub. Glob. Ecol. Conserv. 2025, 57, e03417. [Google Scholar] [CrossRef] [Scilit]
- Wang, T.R.; Meng, H.H.; Wang, N.; Zheng, S.S.; Jiang, Y.; Lin, D.Q.; Song, Y.G.; Kozlowski, G. Adaptive divergence and genetic vulnerability of relict species under climate change: A case study of Pterocarya macroptera. Ann. Bot. 2023, 132, 241–254. [Google Scholar] [CrossRef] [Scilit]
- Chang, C.W.; Fridman, E.; Mascher, M.; Himmelbach, A.; Schmid, K. Physical geography, isolation by distance and environmental variables shape genomic variation of wild barley (Hordeum vulgare L. ssp. spontaneum) in the Southern Levant. Heredity 2022, 128, 107–119. [Google Scholar] [CrossRef] [Scilit]
- Nyine, M.; Davidson, D.; Adhikari, E.; Clinesmith, M.; Wang, H.; Akhunova, A.; Fritz, A.; Akhunov, E. Genomic signals of ecogeographic adaptation in a wild relative are associated with improved wheat performance under drought stress. Genome Biol. 2025, 26, 35. [Google Scholar] [CrossRef] [Scilit]
- Hein, K.; Girma, D.; McKay, J. Genetic diversity and environmental adaptation in Ethiopian tef. G3 2025, 15, jkae303. [Google Scholar] [CrossRef] [Scilit]
- Sandercock, A.M.; Westbrook, J.W.; Zhang, Q.; Holliday, J.A. A genome-guided strategy for climate resilience in American chestnut restoration populations. Proc. Natl. Acad. Sci. USA 2024, 121, e2403505121. [Google Scholar] [CrossRef] [Scilit]
- Hu, Y.; Feng, C.; Yang, L.; Edger, P.P.; Kang, M. Genomic population structure and local adaptation of the wild strawberry Fragaria nilgerrensis. Hortic. Res. 2022, 9, uhab059. [Google Scholar] [CrossRef] [Scilit]
- Meng, X.; López-Pujol, J.; Zhang, Q.J.; Yue, M.; Li, Z.H. Comparative genomic analysis of Acer tsinglingense and A. davidii provides insights into nervonic acid biosynthesis, population evolution and genome vulnerability of endangered A. tsinglingense. Plant J. 2025, 124, e70625. [Google Scholar] [CrossRef] [Scilit]
- Jiang, Q.; Shen, Y.; Wu, L.; Jiang, Z.W.; Yao, X.H. Genomic signatures of local adaptation to precipitation and solar radiation in kiwifruit. Plant Divers. 2025, 47, 733–745. [Google Scholar] [CrossRef] [Scilit]
- Feng, S.; Xi, E.; Wan, W.; Ru, D. Genomic signals of local adaptation in Picea crassifolia. BMC Plant Biol. 2023, 23, 534. [Google Scholar] [CrossRef] [Scilit]
- Lu, S.; Liu, L.; Lei, W.; Wang, D.; Zhu, H.; Lai, Q.; Ma, L.; Ru, D. Cryptic divergence in and evolutionary dynamics of endangered hybrid Picea brachytyla sensu stricto in the Qinghai-Tibet Plateau. BMC Plant Biol. 2024, 24, 1202. [Google Scholar] [CrossRef] [Scilit]
- Francisco, T.; Mayol, M.; Vajana, E.; Riba, M.; Westergren, M.; Cavers, S.; Pinosio, S.; Bagnoli, F.; Marchi, M.; Aravanopoulos, F.A.; et al. Genomic signatures of climate-driven (Mal)adaptation in an iconic conifer, the English yew (Taxus baccata L.). Evol. Appl. 2025, 18, e70160. [Google Scholar] [CrossRef] [Scilit]
- Wang, Y.; Zhang, L.; Zhou, Y.; Ma, W.; Li, M.; Guo, P.; Feng, L.; Fu, C. Using landscape genomics to assess local adaptation and genomic vulnerability of a perennial herb Tetrastigma hemsleyanum (Vitaceae) in subtropical China. Front. Genet. 2023, 14, 1150704. [Google Scholar] [CrossRef] [Scilit]
- Wang, Z.Y.; Lv, Y.W.; Xiao, Y.; Wu, C.; Hu, X.S. Advances in the regulation and evolutionary mechanism of plant gene expression. Chin. Bull. Bot. 2025, 60, 621–639. [Google Scholar] [CrossRef]
- Hamann, E.; Pauli, C.S.; Joly-Lopez, Z.; Groen, S.C.; Rest, J.S.; Kane, N.C.; Purugganan, M.D.; Franks, S.J. Rapid evolutionary changes in gene expression in response to climate fluctuations. Mol. Ecol. 2021, 30, 193–206. [Google Scholar] [CrossRef] [Scilit]
- Palma-Silva, C.; Mortati, A.F.; Chaves, C.J.N.; Simões Santos Leal, B.; Ribeiro, R.V.; Pinheiro, F.; Ferro, M.; Riaño-Pachón, D.M.; de Mattos, J.S.; Tavares, M.M.; et al. Ecological transcriptomics reveals stress response pathways of a ground-herb species in a waterlogging gradient of Amazonian riparian forests. Mol. Ecol. 2025, 34, e17437. [Google Scholar] [CrossRef] [Scilit]
- Flanagan, S.P.; Chaturvedi, S.; Palma-Silva, C.; Rennison, D.J.; Rogers, S.M.; Singh, P. Ecology of gene expression. Mol. Ecol. 2025, 34, e70035. [Google Scholar] [CrossRef] [Scilit]
- Liu, M.; Liu, X.; Zhou, P.; Jiang, S.; Huang, J.G.; Dong, Z. Environmental factors have a major effect in shaping the gene expression of Siberian larch in the Altai mountains of China. Plant Genome 2022, 15, e20240. [Google Scholar] [CrossRef] [Scilit]
- Takou, M.; Hämälä, T.; Koch, E.M.; Steige, K.A.; Dittberner, H.; Yant, L.; Genete, M.; Sunyaev, S.; Castric, V.; Vekemans, X.; et al. Maintenance of adaptive dynamics and no detectable load in a range-edge outcrossing plant population. Mol. Biol. Evol. 2021, 38, 1820–1836. [Google Scholar] [CrossRef] [Scilit]
- Hämälä, T.; Mattila, T.M.; Savolainen, O. Local adaptation and ecological differentiation under selection, migration, and drift in Arabidopsis lyrata. Evolution 2018, 72, 1373–1386. [Google Scholar] [CrossRef] [Scilit]
- Wos, G.; Bohutínská, M.; Nosková, J.; Mandáková, T.; Kolář, F. Parallelism in gene expression between foothill and alpine ecotypes in Arabidopsis arenosa. Plant J. 2021, 105, 1211–1224. [Google Scholar] [CrossRef] [Scilit]
- Szukala, A.; Lovegrove-Walsh, J.; Luqman, H.; Fior, S.; Wolfe, T.M.; Frajman, B.; Schönswetter, P.; Paun, O. Polygenic routes lead to parallel altitudinal adaptation in Heliosperma pusillum (Caryophyllaceae). Mol. Ecol. 2023, 32, 1832–1847. [Google Scholar] [CrossRef] [Scilit]
- Long, Z.; Sang, Y.; Feng, J.; Zhang, X.; Shi, T.; Zhang, L.; Mao, K.; Rieseberg, L.H.; Liu, J.; Wang, J. Evolutionary genomics unravels the responses and adaptation to climate change in a key alpine forest tree species. Mol. Biol. Evol. 2025, 42, msaf116. [Google Scholar] [CrossRef] [Scilit]
- Bittner, N.K.J.; Mack, K.L.; Nachman, M.W. Gene expression plasticity and desert adaptation in house mice. Evolution 2021, 75, 1477–1491. [Google Scholar] [CrossRef] [Scilit]
- Ghalambor, C.K.; Hoke, K.L.; Ruell, E.W.; Fischer, E.K.; Reznick, D.N.; Hughes, K.A. Non-adaptive plasticity potentiates rapid adaptive evolution of gene expression in nature. Nature 2015, 525, 372–375. [Google Scholar] [CrossRef] [Scilit]
- Koch, E.L.; Guillaume, F. Additive and mostly adaptive plastic responses of gene expression to multiple stress in Tribolium castaneum. PLoS Genet. 2020, 16, e1008768. [Google Scholar] [CrossRef] [Scilit]
- Groen, S.C.; Ćalić, I.; Joly-Lopez, Z.; Platts, A.E.; Choi, J.Y.; Natividad, M.; Dorph, K.; Mauck, W.M., III; Bracken, B.; Cabral, C.L.U.; et al. The strength and pattern of natural selection on gene expression in rice. Nature 2020, 578, 572–576. [Google Scholar] [CrossRef] [Scilit]
- Hamann, E.; Groen, S.C.; Dunivant, T.S.; Ćalić, I.; Cochran, C.; Konshok, R.; Purugganan, M.D.; Franks, S.J. Selection on genome-wide gene expression plasticity of rice in wet and dry field environments. Mol. Ecol. 2025, 34, e17522. [Google Scholar] [CrossRef] [Scilit]
- Ye, L.J.; Möller, M.; Luo, Y.H.; Zou, J.Y.; Zheng, W.; Liu, J.; Li, D.Z.; Gao, L. Variation in gene expression along an elevation gradient of Rhododendron sanguineum var. haemaleum assessed in a comparative transcriptomic analysis. Front. Plant Sci. 2023, 14, 1133065. [Google Scholar] [CrossRef] [Scilit]
- Tisinai, S.L.; Anderson, J.T.; Denney, D.A.; Busch, J.W. Gene expression differentiation is consistent with local adaptation across an elevational gradient in Drummond’s rockcress (Boechera stricta). J. Hered. 2026, 117, 199–210. [Google Scholar] [CrossRef] [Scilit]
- Le Provost, G.; Lalanne, C.; Lesur, I.; Louvet, J.M.; Delzon, S.; Kremer, A.; Labadie, K.; Aury, J.M.; Da Silva, C.; Moritz, T.; et al. Oak stands along an elevation gradient have different molecular strategies for regulating bud phenology. BMC Plant Biol. 2023, 23, 108. [Google Scholar] [CrossRef] [Scilit]
- Gurung, P.D.; Upadhyay, A.K.; Bhardwaj, P.K.; Sowdhamini, R.; Ramakrishnan, U. Transcriptome analysis reveals plasticity in gene regulation due to environmental cues in Primula sikkimensis, a high altitude plant species. BMC Genom. 2019, 20, 989. [Google Scholar] [CrossRef] [Scilit]
- Atamian, H.S.; Funk, J.L. Physiological and transcriptomic responses of two Artemisia californica populations to drought: Implications for restoring drought-resilient native communities. Glob. Ecol. Conserv. 2023, 43, e02466. [Google Scholar] [CrossRef] [Scilit]
- Cui, B.; Liu, R.; Yu, Q.; Guo, J.; Du, X.; Chen, Z.; Li, C.; Wang, T.; Liu, R.; He, R.; et al. Combined genome and transcriptome provides insight into the genetic evolution of an edible halophyte Suaeda salsa adaptation to high salinity. Mol. Ecol. 2025, 34, e17457. [Google Scholar] [CrossRef] [Scilit]
- Barnhart, M.H.; McAssey, E.V.; Dittmar, E.L.; Burke, J.M. Transcriptomics of developing wild sunflower seeds from the extreme ends of a latitudinal gradient differing in seed oil composition. Plant Direct 2022, 6, e423. [Google Scholar] [CrossRef] [Scilit]
- Li, Y.; Shi, L.C.; Pei, N.C.; Cushman, S.A.; Si, Y.T. Transcriptomic responses to drought stress among natural populations provide insights into local adaptation of weeping forsythia. BMC Plant Biol. 2021, 21, 273. [Google Scholar] [CrossRef] [Scilit]
- Garot, E.; Dussert, S.; Domergue, F.; Joët, T.; Fock-Bastide, I.; Combes, M.C.; Lashermes, P. Multi-approach analysis reveals local adaptation in a widespread forest tree of reunion island. Plant Cell Physiol. 2021, 62, 280–292. [Google Scholar] [CrossRef] [Scilit]
- Ranade, S.S.; Garcia-Gil, M.R. Molecular signatures of local adaptation to light in Norway spruce. Planta 2021, 253, 53. [Google Scholar] [CrossRef] [Scilit]
- Mangral, Z.A.; Islam, S.U.; Majeed, A.; Tariq, L.; Goel, S.; Barik, S.K.; Dar, T.U.H. Transcriptomic insights into elevation-dependent gene expression in Rhododendron anthopogon D.Don: Implications for climate resilience. Physiol. Plant. 2025, 177, e70419. [Google Scholar] [CrossRef] [Scilit]
- Mérot, C.; Oomen, R.A.; Tigano, A.; Wellenreuther, M. A roadmap for understanding the evolutionary significance of structural genomic variation. Trends Ecol. Evol. 2020, 35, 561–572. [Google Scholar] [CrossRef] [Scilit]
- Stuart, K.C.; Oomen, R.A.; Tigano, A.; Wellenreuther, M.; Wold, J.; Field, D.L.; Mérot, C. A beginner’s guide to structural variants in eco-evolutionary population genomics. Mol. Ecol. 2026, 35, e70216. [Google Scholar] [CrossRef] [Scilit]
- Kosugi, S.; Momozawa, Y.; Liu, X.; Terao, C.; Kubo, M.; Kamatani, Y. Comprehensive evaluation of structural variation detection algorithms for whole genome sequencing. Genome Biol. 2019, 20, 117. [Google Scholar] [CrossRef] [Scilit]
- Collins, R.L.; Brand, H.; Karczewski, K.J.; Zhao, X.; Alföldi, J.; Francioli, L.C.; Khera, A.V.; Lowther, C.; Gauthier, L.D.; Wang, H.; et al. A structural variation reference for medical and population genetics. Nature 2020, 581, 444–451. [Google Scholar] [CrossRef] [Scilit]
- Karageorgiou, C.; Leffler, E.M.; Dennis, M.Y.; Gokcumen, O. Structural variation in context: Mechanisms, functions and selection regimes across the tree of life. Heredity 2026, 135, 121–125. [Google Scholar] [CrossRef] [Scilit]
- Liang, Y.Y.; Liu, H.; Lin, Q.Q.; Shi, Y.; Zhou, B.F.; Wang, J.S.; Chen, X.Y.; Shen, Z.; Qiao, L.J.; Niu, J.W.; et al. Pangenome analysis reveals local adaptation to climate driven by introgression in oak species. Mol. Biol. Evol. 2025, 42, msaf088. [Google Scholar] [CrossRef] [Scilit]
- Hämälä, T.; Wafula, E.K.; Guiltinan, M.J.; Ralph, P.E.; dePamphilis, C.W.; Tiffin, P. Genomic structural variants constrain and facilitate adaptation in natural populations of Theobroma cacao, the chocolate tree. Proc. Natl. Acad. Sci. USA 2021, 118, e2102914118. [Google Scholar] [CrossRef] [Scilit]
- Song, J.-M.; Guan, Z.; Hu, J.; Guo, C.; Yang, Z.; Wang, S.; Liu, D.; Wang, B.; Lu, S.; Zhou, R.; et al. Eight high-quality genomes reveal pan-genome architecture and ecotype differentiation of Brassica napus. Nat. Plants 2020, 6, 34–45. [Google Scholar] [CrossRef] [Scilit]
- Kang, M.; Wu, H.; Liu, H.; Liu, W.; Zhu, M.; Han, Y.; Liu, W.; Chen, C.; Song, Y.; Tan, L.; et al. The pan-genome and local adaptation of Arabidopsis thaliana. Nat. Commun. 2023, 14, 6259. [Google Scholar] [CrossRef] [Scilit]
- Wang, X.; Liu, S.; Zuo, H.; Zheng, W.; Zhang, S.; Huang, Y.; Pingcuo, G.; Ying, H.; Zhao, F.; Li, Y.; et al. Genomic basis of high-altitude adaptation in Tibetan Prunus fruit trees. Curr. Biol. 2021, 31, 3848–3860.e8. [Google Scholar] [CrossRef] [Scilit]
- Zhao, Y.; Li, X.; Xie, J.; Xu, W.; Chen, S.; Zhang, X.; Liu, S.; Wu, J.; El-Kassaby, Y.A.; Zhang, D. Transposable elements: Distribution, polymorphism, and climate adaptation in Populus. Front. Plant Sci. 2022, 13, 814718. [Google Scholar] [CrossRef] [Scilit]
- Rogivue, A.; Leempoel, K.; Guillaume, A.S.; Roy Choudhury, R.; Felber, F.; Kasser, M.; Joost, S.; Parisod, C.; Gugerli, F. Locally specific genome-wide signatures of adaptation to environmental variation at high resolution in an alpine plant. Mol. Ecol. 2025, 34, e17646. [Google Scholar] [CrossRef] [Scilit]
- Castanera, R.; Morales-Díaz, N.; Gupta, S.; Purugganan, M.; Casacuberta, J.M. Transposons are important contributors to gene expression variability under selection in rice populations. eLife 2023, 12, RP86324. [Google Scholar] [CrossRef]
- Baduel, P.; Quadrana, L. Jumpstarting evolution: How transposition can facilitate adaptation to rapid environmental changes. Curr. Opin. Plant Biol. 2021, 61, 102043. [Google Scholar] [CrossRef] [Scilit]
- Lozano-Arce, D.; García, T.; Gonzalez-Garcia, L.N.; Guyot, R.; Chacón-Sánchez, M.I.; Duitama, J. Selection signatures and population dynamics of transposable elements in lima bean. Commun. Biol. 2023, 6, 803. [Google Scholar] [CrossRef] [Scilit]
- Niu, X.M.; Xu, Y.C.; Li, Z.W.; Bian, Y.T.; Hou, X.H.; Chen, J.F.; Zou, Y.P.; Jiang, J.; Wu, Q.; Ge, S.; et al. Transposable elements drive rapid phenotypic variation in Capsella rubella. Proc. Natl. Acad. Sci. USA 2019, 116, 6908–6913. [Google Scholar] [CrossRef] [Scilit]
- Huang, C.; Sun, H.; Xu, D.; Chen, Q.; Liang, Y.; Wang, X.; Xu, G.; Tian, J.; Wang, C.; Li, D.; et al. ZmCCT9 enhances maize adaptation to higher latitudes. Proc. Natl. Acad. Sci. USA 2018, 115, E334–E341. [Google Scholar] [CrossRef] [Scilit]
- Hämälä, T.; Ning, W.; Kuittinen, H.; Aryamanesh, N.; Savolainen, O. Environmental response in gene expression and DNA methylation reveals factors influencing the adaptive potential of Arabidopsis lyrata. eLife 2022, 11, e83115. [Google Scholar] [CrossRef] [Scilit]
- Wang, N.; Yang, Y.; Moore, M.J.; Brockington, S.F.; Walker, J.F.; Brown, J.W.; Liang, B.; Feng, T.; Edwards, C.; Mikenas, J.; et al. Evolution of Portulacineae marked by gene tree conflict and gene family expansion associated with adaptation to harsh envi-ronments. Mol. Biol. Evol. 2019, 36, 112–126. [Google Scholar] [CrossRef] [Scilit]
- Yu, T.; Hu, Y.; Zhang, Y.; Zhao, R.; Yan, X.; Dayananda, B.; Wang, J.; Jiao, Y.; Li, J.; Yi, X. Whole-genome sequencing of Acer catalpifolium reveals evolutionary history of endangered species. Genome Biol. Evol. 2021, 13, evab271. [Google Scholar] [CrossRef] [Scilit]
- Feng, C.; Wang, J.; Wu, L.; Kong, H.; Yang, L.; Feng, C.; Wang, K.; Rausher, M.; Kang, M. The genome of a cave plant, Primulina huaijiensis, provides insights into adaptation to limestone karst habitats. New Phytol. 2020, 227, 1249–1263. [Google Scholar] [CrossRef] [Scilit]
- Xia, X.M.; Du, H.L.; Hu, X.D.; Wu, J.J.; Yang, F.S.; Li, C.L.; Huang, S.X.; Wang, Q.; Liang, C.; Wang, X.Q. Genomic insights into adaptive evolution of the species-rich cosmopolitan plant genus Rhododendron. Cell Rep. 2024, 43, 114745. [Google Scholar] [CrossRef] [Scilit]
- Benazzo, A.; Trucchi, E.; Cahill, J.A.; Maisano Delser, P.; Mona, S.; Fumagalli, M.; Bunnefeld, L.; Cornetti, L.; Ghirotto, S.; Girardi, M.; et al. Survival and divergence in a small group: The extraordinary genomic history of the endangered Apennine brown bear stragglers. Proc. Natl. Acad. Sci. USA 2017, 114, E9589–E9597. [Google Scholar] [CrossRef] [Scilit]
- Burlakova, L.E.; Karatayev, A.Y.; Karatayev, V.A.; May, M.E.; Bennett, D.L.; Cook, M.J. Endemic species: Contribution to community uniqueness, effect of habitat alteration, and conservation priorities. Biol. Conserv. 2011, 144, 155–165. [Google Scholar] [CrossRef] [Scilit]
- Chen, Z.; Ai, F.; Zhang, J.; Ma, X.; Yang, W.; Wang, W.; Su, Y.; Wang, M.; Yang, Y.; Mao, K.; et al. Survival in the tropics despite isolation, inbreeding and asexual reproduction: Insights from the genome of the world’s southernmost poplar (Populus ilicifolia). Plant J. 2020, 103, 430–442. [Google Scholar] [CrossRef] [Scilit]
- Cao, Y.; Almeida-Silva, F.; Zhang, W.P.; Ding, Y.M.; Bai, D.; Bai, W.N.; Zhang, B.W.; Van de Peer, Y.; Zhang, D.Y. Genomic insights into adaptation to karst limestone and incipient speciation in East Asian Platycarya spp. (Juglandaceae). Mol. Biol. Evol. 2023, 40, msad121. [Google Scholar] [CrossRef] [Scilit]
- Yang, Z.; Liang, L.; Xiang, W.; Wang, L.; Ma, Q.; Wang, Z. Conservation genomics provides insights into genetic resilience and adaptation of the endangered Chinese hazelnut, Corylus chinensis. Plant Divers. 2024, 46, 294–308. [Google Scholar] [CrossRef] [Scilit]
- Dai, X.; Xiang, S.; Zhang, Y.; Yang, S.; Hu, Q.; Wu, Z.; Zhou, T.; Xiang, J.; Chen, G.; Tan, X.; et al. Genomic evidence for evolutionary history and local adaptation of two endemic apricots: Prunus hongpingensis and P. zhengheensis. Hortic. Res. 2024, 11, uhad215. [Google Scholar] [CrossRef] [Scilit]
- Feng, Y.; Comes, H.P.; Chen, J.; Zhu, S.; Lu, R.; Zhang, X.; Li, P.; Qiu, J.; Olsen, K.M.; Qiu, Y. Genome sequences and population genomics provide insights into the demographic history, inbreeding, and mutation load of two “living fossil” tree species of Dipteronia. Plant J. 2024, 117, 177–192. [Google Scholar] [CrossRef] [Scilit]
- Yang, Y.; Ma, T.; Wang, Z.; Lu, Z.; Li, Y.; Fu, C.; Chen, X.; Zhao, M.; Olson, M.S.; Liu, J. Genomic effects of population collapse in a critically endangered ironwood tree Ostrya rehderiana. Nat. Commun. 2018, 9, 5449. [Google Scholar] [CrossRef] [Scilit]
- Wang, X.; Xiao, Y.; He, Z.H.; Li, L.L.; Lv, Y.W.; Hu, X.S. Evolutionary divergence between Toona ciliata and Toona sinensis assayed with their whole genome sequences. Genes 2022, 13, 1799. [Google Scholar] [CrossRef] [Scilit]
- Jackson, A.C.; Carine, M.A.; Chapman, M.A. Genomics of ecological adaptation in Canary Island Descurainia (Brassicaceae) and comparisons with other Brassicaceae. Ecol. Evol. 2024, 14, e70144. [Google Scholar] [CrossRef] [Scilit]
- Wu, C.; Chen, W.X.; He, Z.H.; OuYang, K.X.; Que, Q.M.; Xie, H.; Xu, W.X.; Lee, S.Y.; Larekeng, S.H.; Shi, S.; et al. Identification and characterization of genes associated with wood property traits via genome sequencing in fast-growing species of genus Neolamarckia. Evol. Appl. 2026, 19, e70314. [Google Scholar] [CrossRef] [Scilit]
- Qiao, X.; Li, Q.; Yin, H.; Qi, K.; Li, L.; Wang, R.; Zhang, S.; Paterson, A.H. Gene duplication and evolution in recurring polyploidization-diploidization cycles in plants. Genome Biol. 2019, 20, 38. [Google Scholar] [CrossRef] [Scilit]
- Jiao, Y.; Wickett, N.J.; Ayyampalayam, S.; Chanderbali, A.S.; Landherr, L.; Ralph, P.E.; Tomsho, L.P.; Hu, Y.; Liang, H.; Soltis, P.S.; et al. Ancestral polyploidy in seed plants and angiosperms. Nature 2011, 473, 97–100. [Google Scholar] [CrossRef] [Scilit]
- Soltis, P.S.; Soltis, D.E. Ancient WGD events as drivers of key innovations in angiosperms. Curr. Opin. Plant Biol. 2016, 30, 159–165. [Google Scholar] [CrossRef] [Scilit]
- Xie, K.C.; Ao, C.Q.; Zhang, Q.; Chen, L.T.; Liu, J.Q. Diploid and tetraploid distribution of Allium przewalskianum Regel. (Liliaceae) in the Qinghai-Tibetan Plateau and adjacent regions. Caryologia 2008, 61, 192–200. [Google Scholar] [CrossRef] [Scilit]
- Cheng, J.; Li, J.; Zhang, Z.; Lu, H.; Chen, G.; Yao, B.; Qiang, S. Autopolyploidy-driven range expansion of a temperate-originated plant to pan-tropic under global change. Ecol. Monogr. 2021, 91, e01445. [Google Scholar] [CrossRef] [Scilit]
- Ding, M.; Chen, Z.J. Epigenetic perspectives on the evolution and domestication of polyploid plant and crops. Curr. Opin. Plant Biol. 2018, 42, 37–48. [Google Scholar] [CrossRef] [Scilit]
- Taylor, S.A.; Larson, E.L. Insights from genomes into the evolutionary importance and prevalence of hybridization in nature. Nat. Ecol. Evol. 2019, 3, 170–177. [Google Scholar] [CrossRef] [Scilit]
- López-Alvarez, D.; Manzaneda, A.J.; Rey, P.J.; Giraldo, P.; Benavente, E.; Allainguillaume, J.; Mur, L.; Caicedo, A.L.; Hazen, S.P.; Breiman, A.; et al. Environmental niche variation and evolutionary diversification of the Brachypodium distachyon grass complex species in their native circum-Mediterranean range. Am. J. Bot. 2015, 102, 1073–1088. [Google Scholar] [CrossRef] [Scilit]
- Marques, I.; Shiposha, V.; López-Alvarez, D.; Manzaneda, A.J.; Hernandez, P.; Olonova, M.; Catalán, P. Environmental isolation explains Iberian genetic diversity in the highly homozygous model grass Brachypodium distachyon. BMC Evol. Biol. 2017, 17, 139. [Google Scholar] [CrossRef] [Scilit]
- Guo, W.; Yang, J.; Sun, X.D.; Chen, G.J.; Yang, Y.P.; Duan, Y.W. Divergence in eco-physiological responses to drought mirrors the distinct distribution of Chamerion angustifolium cytotypes in the Himalaya-Hengduan Mountains region. Front. Plant Sci. 2016, 7, 1329. [Google Scholar] [CrossRef] [Scilit]
- Kryazhimskiy, S.; Plotkin, J.B. The population genetics of dN/dS. PLoS Genet. 2008, 4, e1000304. [Google Scholar] [CrossRef] [Scilit]
- Wang, X.; Heckel, G. Genome-wide relaxation of selection and the evolution of the island syndrome in Orkney voles. Genome Res. 2024, 34, 851–862. [Google Scholar] [CrossRef] [Scilit]
- Wright, S.D.; Gillman, L.N.; Ross, H.A.; Keeling, D.J. Slower tempo of microevolution in island birds: Implications for conservation biology. Evolution 2009, 63, 2275–2287. [Google Scholar] [CrossRef] [Scilit]
- Iverson, E.N.K.; Criswell, A.; Havird, J.C. Stronger evidence for relaxed selection than adaptive evolution in high-elevation animal mtDNA. Mol. Biol. Evol. 2025, 42, msaf061. [Google Scholar] [CrossRef] [Scilit]
- Cai, T.; Wen, Z.; Jiang, Z.; Zhen, Y. Distinct latitudinal patterns of molecular rates across vertebrates. Proc. Natl. Acad. Sci. USA 2025, 122, e2423386122. [Google Scholar] [CrossRef] [Scilit]
- Chen, J.; Ni, P.; Tran Thi, T.N.; Kamaldinov, E.V.; Petukhov, V.L.; Han, J.; Liu, X.; Šprem, N.; Zhao, S. Selective constraints in cold-region wild boars may defuse the effects of small effective population size on molecular evolution of mitogenomes. Ecol. Evol. 2018, 8, 8102–8114. [Google Scholar] [CrossRef] [Scilit]
- Liu, X.W.; Wang, Y.H.; Shen, S.K. Transcriptomic and metabolomic analyses reveal the altitude adaptability and evolution of different-colored flowers in alpine Rhododendron species. Tree Physiol. 2022, 42, 1100–1113. [Google Scholar] [CrossRef] [Scilit]
- Pielou, E.C. Ecological Diversity; John Wiley & Sons: New York, NY, USA, 1975. [Google Scholar]
- Jaccard, P. Etude comparative de la distribution florale dans une portion des Alpes et du Jura. Bull. Soc. Vaud. Sci. Nat. 1901, 37, 547–597. [Google Scholar]
- Kimura, M. On the probability of fixation of mutant genes in a population. Genetics 1962, 47, 713–719. [Google Scholar] [CrossRef] [Scilit]
- Kapralov, M.V.; Votintseva, A.A.; Filatov, D.A. Molecular adaptation during a rapid adaptive radiation. Mol. Biol. Evol. 2013, 30, 1051–1059. [Google Scholar] [CrossRef] [Scilit]
- Wang, X.; Xiao, Y.; Lv, Y.W.; He, Z.H.; Yeh, F.C.; Hu, X.S. A community-based framework integrates interspecific interactions into forest genetic conservation. Plants 2024, 13, 435. [Google Scholar] [CrossRef] [Scilit]
- Lu, B.; Jin, H.; Fu, J. Molecular convergent and parallel evolution among four high-elevation anuran species from the Tibetan region. BMC Genom. 2020, 21, 839. [Google Scholar] [CrossRef] [Scilit]
- Zhao, S.Y.; Chen, L.Y.; Muchuku, J.K.; Hu, G.W.; Wang, Q.F. Genetic adaptation of giant Lobelias (Lobelia aberdarica and Lobelia telekii) to different altitudes in East African mountains. Front. Plant Sci. 2016, 7, 488. [Google Scholar] [CrossRef] [Scilit]
- Li, L.L.; Xiao, Y.; Wang, X.; He, Z.H.; Lv, Y.W.; Hu, X.S. The Ka/Ks and πa/πs ratios under different models of gametophytic and sporophytic selection. Genome Biol. Evol. 2023, 15, evad151. [Google Scholar] [CrossRef] [Scilit]
- Wolfram, S. The Mathematica Book; Cambridge University Press: Cambridge, UK, 1996. [Google Scholar]
- Surina, B.; Balant, M.; Glasnović, P.; Radosavljević, I.; Fišer, Ž.; Fujs, N.; Castro, S. Population size as a major determinant of mating system and population genetic differentiation in a narrow endemic chasmophyte. BMC Plant Biol. 2023, 23, 383. [Google Scholar] [CrossRef] [Scilit]
- Glémin, S.; Muyle, A. Mating systems and selection efficacy: A test using chloroplastic sequence data in angiosperms. J. Evol. Biol. 2014, 27, 1386–1399. [Google Scholar] [CrossRef] [Scilit]
- Encinas-Viso, F.; Young, A.G.; Pannell, J.R. The loss of self-incompatibility in a range expansion. J. Evol. Biol. 2020, 33, 1235–1244. [Google Scholar] [CrossRef] [Scilit]
- Pujol, B.; Zhou, S.R.; Sanchez Vilas, J.; Pannell, J.R. Reduced inbreeding depression after species range expansion. Proc. Natl. Acad. Sci. USA 2009, 106, 15379–15383. [Google Scholar] [CrossRef] [Scilit]
- Zeitler, L.; Parisod, C.; Gilbert, K.J. Purging due to self-fertilization does not prevent accumulation of expansion load. PLoS Genet. 2023, 19, e1010883. [Google Scholar] [CrossRef] [Scilit]
- Gilbert, K.J.; Sharp, N.P.; Angert, A.L.; Conte, G.L.; Draghi, J.A.; Guillaume, F.; Hargreaves, A.L.; Matthey-Doret, R.; Whitlock, M.C. Local adaptation interacts with expansion load during range expansion: Maladaptation reduces expansion load. Am. Nat. 2017, 189, 368–380. [Google Scholar] [CrossRef] [Scilit]
- Pokrovac, I.; Pezer, Ž. Recent advances and current challenges in population genomics of structural variation in animals and plants. Front. Genet. 2022, 13, 1060898. [Google Scholar] [CrossRef] [Scilit]
- Anderson, J.T.; Song, B.H. Plant adaptation to climate change—Where are we? J. Syst. Evol. 2020, 58, 533–545. [Google Scholar] [CrossRef] [Scilit]
- Zhang, X.; Deng, T.; Wang, H.C.; Sun, H. Genomic insights into alpine plant adaptation. Plant Divers. 2026, 48, 439–450. [Google Scholar] [CrossRef] [Scilit]
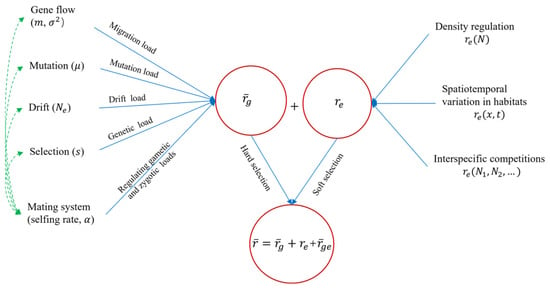
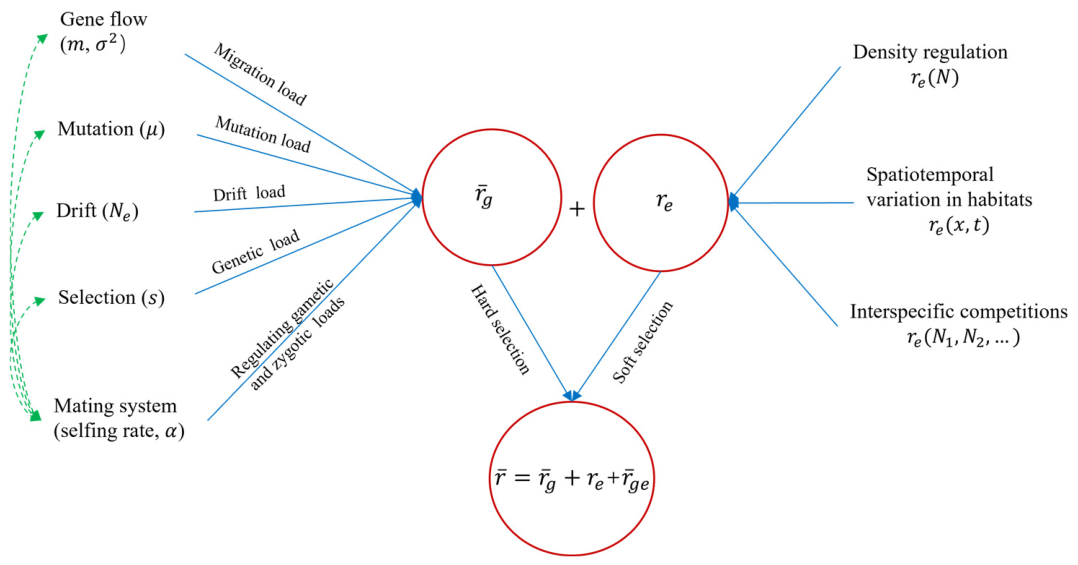
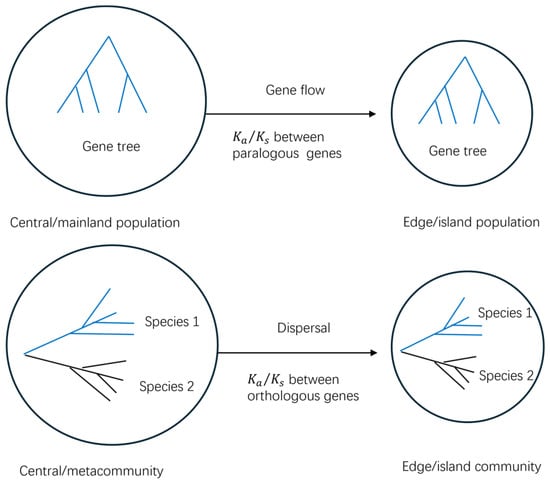
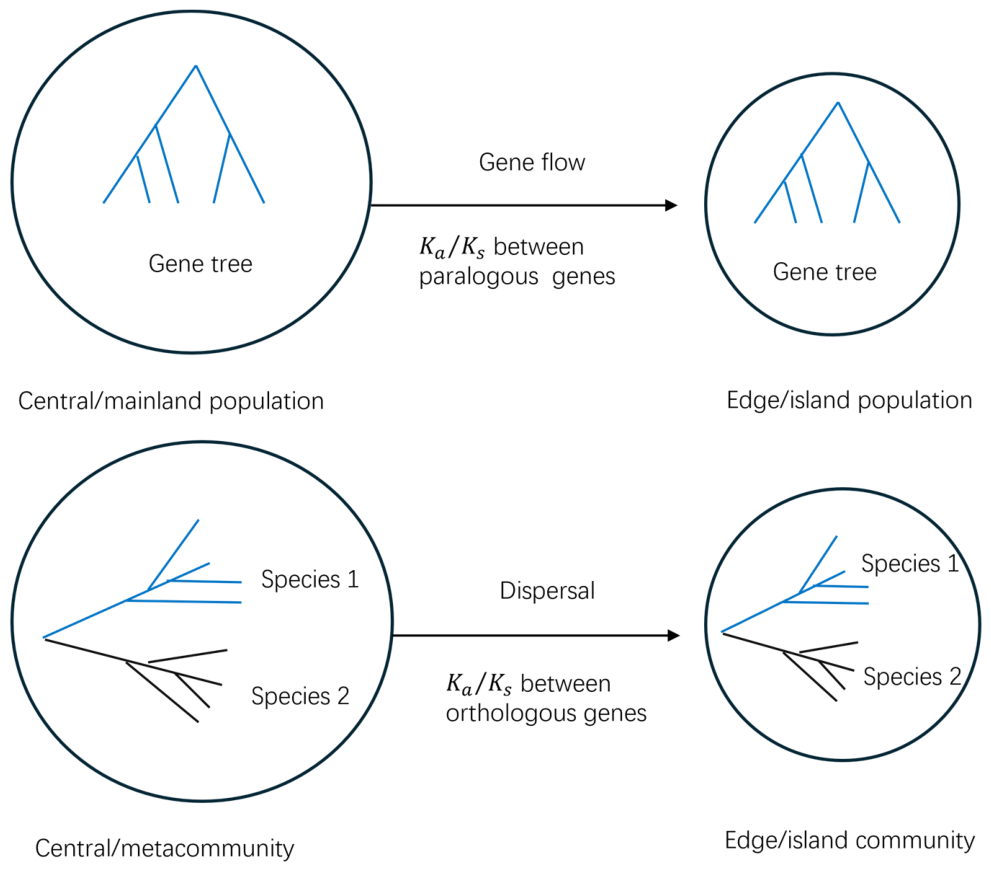
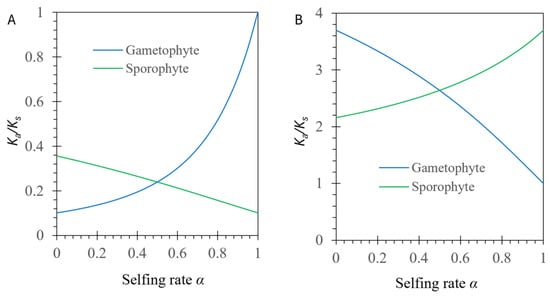
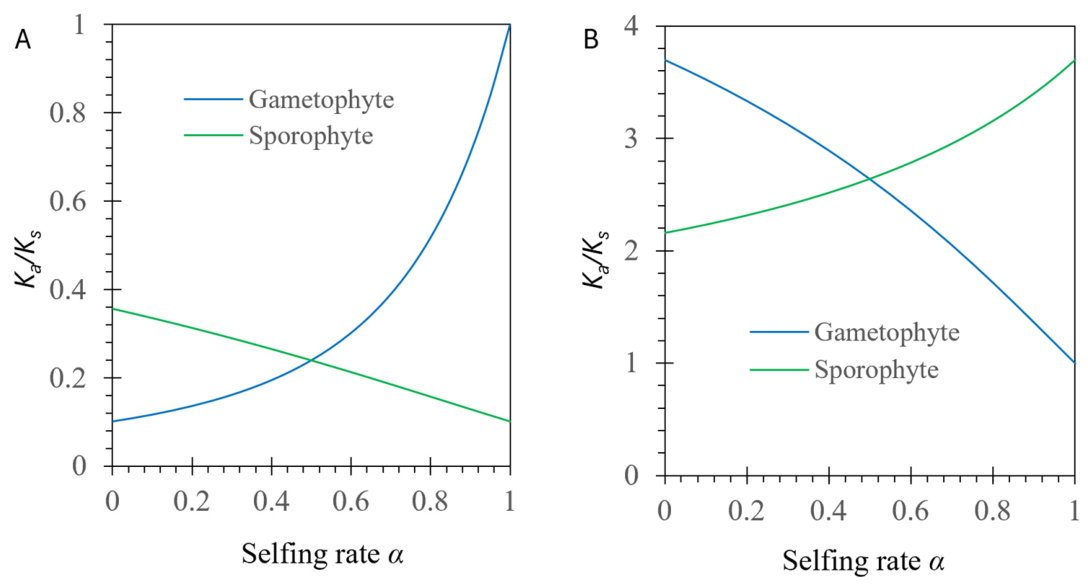
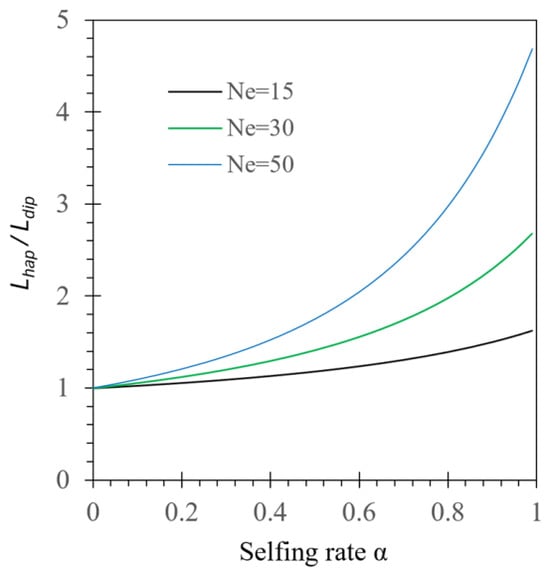
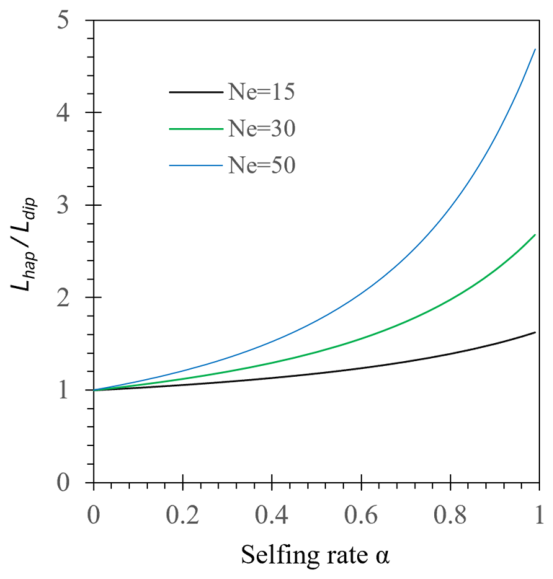

Disclaimer/Publisher’s Note: The statements, opinions and data contained in all publications are solely those of the individual author(s) and contributor(s) and not of MDPI and/or the editor(s). MDPI and/or the editor(s) disclaim responsibility for any injury to people or property resulting from any ideas, methods, instructions or products referred to in the content. |
© 2026 by the authors. Licensee MDPI, Basel, Switzerland. This article is an open access article distributed under the terms and conditions of the Creative Commons Attribution (CC BY) license.