Abstract
Acaryochloris marina is a distinctive cyanobacterium that uses chlorophyll d as its primary photosynthetic pigment and possesses two major light-harvesting systems: membrane-integral chlorophyll-binding Pcb/CBP complexes and water-soluble phycobiliproteins. How these antenna systems respond at the transcriptome level to contrasting light environments remains incompletely characterized. Here, we re-analyzed a publicly available RNA-seq dataset for A. marina MBIC11017 (NCBI BioProject PRJNA1130970), comparing cells grown under low-irradiance far-red light (LL-FR; 1.5–2 µmol photons m−2 s−1, 710-nm peak) and high-irradiance white light (HL-WL; 30–35 µmol photons m−2 s−1). Because light quality and irradiance both differ in this experimental design, the two effects cannot be separated; all transcriptional changes are therefore interpreted as responses to the combined LL-FR versus HL-WL contrast rather than to far-red wavelength alone. Of 8439 expressed genes, 1810 (21.4%) were significantly differentially expressed (adjusted p < 0.05). Using GFF-verified locus tags which corrected mis-annotations propagated in earlier analyses, the PS-I core gene set showed a mean log2 fold-change of +1.96 (3.9-fold; 11/11 loci significant), whereas the PS-II core gene set showed a mean log2 fold-change of +1.10 (2.1-fold; 12/20 loci significant). Light-harvesting genes showed the strongest response: 17/18 phycobiliprotein-pathway genes in KEGG amr00196 were upregulated, together with multiple putative Pcb/CBP loci (mean antenna log2FC = +3.51; 11.4-fold). Weighted gene co-expression network analysis placed the antenna-associate genes examined here within a module positively correlated with the LL-FR condition (r = 0.802, p = 0.017), and STRING analysis supported an enriched network of predicted or known protein associations (1115 nodes, 4763 edges; PPI enrichment p < 1.0 × 10⁻¹⁶). Recent matched-irradiance experiments indicate that, at equal photon flux, far-red wavelengths reduce phycobilisome content relative to white light. The transcriptional pattern reported here is therefore most parsimoniously interpreted as predominantly a low-irradiance response, with possible wavelength-associated CA5 contributions that cannot be isolated in the present design. Overall, the analysis reveals coordinated transcript-level changes across plasmid-encoded reacquired phycobiliprotein genes, chromosomal Pcb/CBP loci, chlorophyll biosynthesis genes, and photosystem core genes, consistent with coordinated regulation of light-harvesting components in A. marina.
1. Introduction
Photosynthetic organisms use light-harvesting antenna systems to absorb light energy and transfer excitation to the reaction centers of photosystems I and II. The absorption properties of these antenna systems help determine which light environments can support growth. Most oxygenic phototrophs rely on chlorophyll a and associated pigments that absorb mainly in the visible region of the spectrum. However, some cyanobacteria have evolved strategies that extend oxygenic photosynthesis into the far-red region, allowing them to grow in habitats where visible light is limited but longer wavelengths remain available [1,2,3].
Acaryochloris marina is one of the most remarkable examples of this adaptation. Unlike most cyanobacteria, which use chlorophyll a as their primary photosynthetic pigment, A. marina uses chlorophyll d (Chl d) as its dominant pigment, enabling efficient absorption of far-red light above 700 nm [4,5]. This spectral specialization allows the organism to occupy ecological niches such as shaded microbial communities and environments beneath other phototrophs, where shorter wavelengths have already been absorbed [6,7]. Genomic studies have further shown that A. marina has an expanded set of photosynthesis-related genes, including duplicated genes associated with light-harvesting and photosynthetic function, which may support its ability to adapt to different light conditions [8,9,10].
A distinctive feature of A. marina is its possession of two different light-harvesting antenna systems. One consists of membrane-integral Pcb (prochlorophyte chlorophyll-binding) proteins, also referred to as chlorophyll-binding proteins (CBPs). These proteins are related to the CP43 antenna subunit of photosystem II [11,12,13] and function as membrane-associated chlorophyll-binding complexes that expand the absorption cross-section of the photosystems [14,15]. In addition, some strains of A. marina contain genes encoding water-soluble phycobiliproteins. Comparative genomic studies suggest that these genes were reacquired by horizontal gene transfer, indicating a secondary acquisition of phycobiliprotein-based light harvesting within this lineage [16,17]. Notably, the strain MBIC11017 retains genes encoding C-phycocyanin, whereas other Acaryochloris strains lack these phycobiliprotein components [17,18]. The coexistence of chlorophyll-binding Pcb proteins and phycobiliproteins therefore gives A. marina an unusual hybrid antenna system among oxygenic phototrophs.
This dual antenna architecture is linked to a specialized form of chromatic acclimation (CA5), in which the composition and expression of light-harvesting proteins change in response to light quality [16,18,19]. Recent studies of A. marina MBIC11017 grown under contrasting light conditions suggest that horizontally acquired phycobiliprotein genes have become integrated into pre-existing regulatory networks involved in light harvesting [18,20]. However, the extent to which phycobiliprotein genes and chlorophyll-binding antenna genes respond in a coordinated manner at the transcriptome level remains unclear.
In this study, we re-analyzed a publicly available RNA-seq dataset for A. marina MBIC11017 (NCBI BioProject PRJNA1130970) to examine genome-wide transcriptional responses under low-irradiance far-red light and high-irradiance white light. We focused on whether genes encoding phycobiliproteins and chlorophyll-binding antenna proteins show coordinated expression under these contrasting conditions. By combining differential expression, pathway enrichment, and network-based analyses, we evaluated whether antenna-related transcriptional remodeling is a central feature of the combined LL-FR versus HL-WL response in A. marina.
2. Results
2.1. Read Mapping and Library Statistics
The eight RNA-seq libraries generated a total of 190,638,828 fragment pairs, of which 78,070,934 reads (41.0%) were assigned to annotated gene features following alignment to the Acaryochloris marina MBIC11017 reference genome (Table 1; Supplementary Figure S1). Sequencing depth and mapping efficiency were broadly comparable across samples, with assignment rates ranging from 34.0% to 48.7%. Normalization using DESeq2 yielded size factors ranging from 0.55 to 1.38, indicating moderate variation in library size but no systematic bias across experimental conditions.

Table 1.
Summary of RNA-seq library statistics for Acaryochloris marina MBIC11017 samples grown under high-irradiance white light (HL-WL) and low-irradiance far-red light (LL-FR) conditions.
2.2. Global Transcriptomic Patterns
Principal component analysis (PCA) of variance-stabilized expression values showed a clear separation between samples grown under high irradiance white light (HL-WL) and low irradiance far-red light (LL-FR) conditions (Figure 1A; Supplementary Figure S1). The first principal component (PC1), which explained 78.0% of the total variance, separated the two light environments, whereas the second principal component (PC2), which explained 15.0% of the variance, reflected the variability among biological replicates. Replicates from the LL-FR condition were slightly more dispersed along PC2, indicating that there was more transcriptional variation within the LL-FR condition.
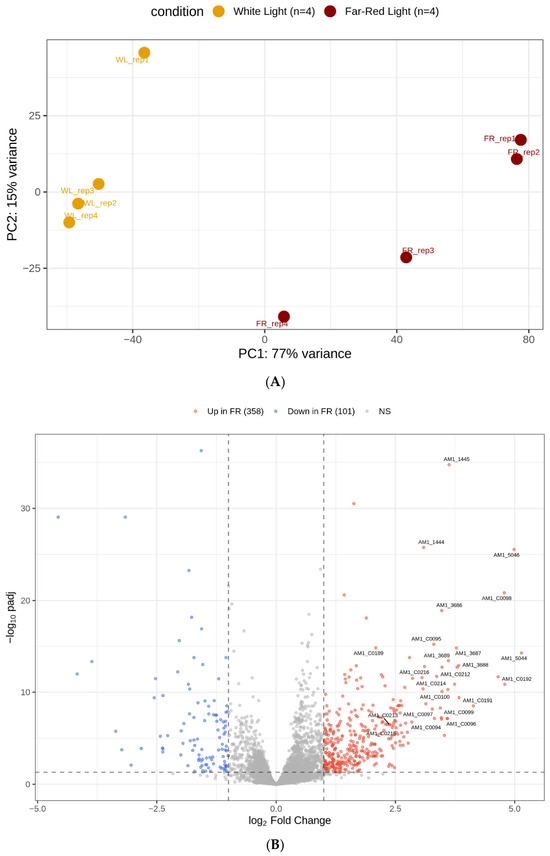
Figure 1.
(A) Principal component analysis (PCA) of RNA-seq libraries from Acaryochloris marina MBIC11017 grown under HL-WL and LL-FR conditions. (B) Volcano plot of differential gene expression between LL-FR and HL-WL conditions in Acaryochloris marina MBIC11017. In panel (B), the dashed horizontal line indicates an adjusted p-value threshold of 0.05 (−log10 padj = 1.30), and the dashed vertical lines indicate log2 fold-change thresholds of ±1.
2.3. Differential Expression Overview
Differential expression analysis identified extensive transcriptional differences between the two conditions. Of the 8439 genes tested, 1810 genes (21.4%) were significantly differentially expressed at an adjusted p value below 0.05. Among these genes, 1135 were upregulated and 675 were downregulated under LL-FR relative to HL-WL. When a stricter threshold of |log2FC| > 1 was applied, 358 genes showed strong upregulation and 101 genes showed strong downregulation. The overall distribution of fold changes and statistical significance is illustrated in the volcano plot (Figure 1B; Supplementary Figures S2–S4), where several of the most strongly induced genes correspond to members of light-harvesting antenna families.
2.4. Coordinated Upregulation of the Photosynthetic Apparatus in the LL-FR Versus HL-WL Contrast
Despite widespread transcriptional changes across the genome, genes encoding the core subunits of photosystem I and photosystem II were significantly upregulated under LL-FR relative to HL-WL. The PS-I gene set (11 gene loci, encoding 10 subunit types) showed a mean log2 fold change of +1.963 (3.9-fold; all 11/11 loci significant, p < 0.001), while the PS-II gene set (20 gene loci, encoding 15 subunit types) showed a mean log2 fold change of +1.103 (2.1-fold; 12/20 loci significant, p < 0.001). This pattern is also evident in the heatmap of selected photosynthesis-related genes (Figure 2), where both core photosystem genes and several antenna-associated genes are upregulated under LL-FR conditions, with antenna genes showing the strongest response.
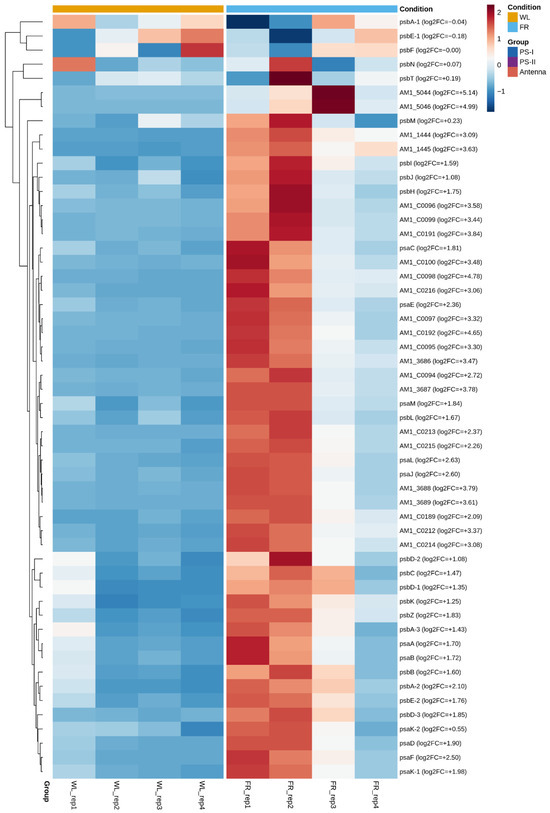
Figure 2.
Heatmap of normalized expression values for selected photosystem I, photosystem II, and light-harvesting genes in Acaryochloris marina grown under HL-WL and LL-FR conditions. Columns represent individual RNA-seq libraries, and rows represent genes. Values were normalized with DESeq2 and scaled by gene.
2.5. Upregulation of Phycobiliprotein Genes
The strongest transcriptional response in the LL-FR versus HL-WL contrast occurred within the KEGG photosynthesis–antenna protein pathway (amr00196). This pathway contains 18 phycobiliprotein-related genes, of which 17 were significantly upregulated under LL-FR conditions (Table 2). These genes encode multiple components of the phycobilisome, including C-phycocyanin α and β subunits (cpcA and cpcB), rod–core linker proteins (cpcC), rod cap linkers (cpcD), rod–rod linkers (cpcG), and proteins involved in chromophore attachment (cpcE and cpcF). Expression increases ranged from approximately 2-fold to 27.5-fold. Nearly all of these genes are located on the plasmid pREB3, consistent with previous genomic studies indicating that phycobiliprotein genes in A. marina were reacquired through horizontal gene transfer. The only chromosomal gene within this pathway, apcB (AM1_2376), which encodes an allophycocyanin β subunit, was also significantly upregulated (2.5-fold). Gene-set analysis confirmed strong coordinated induction of the pathway (Wilcoxon p = 8.33 × 10⁻¹⁷; permutation p < 10−5).
Table 2.
Light-harvesting and pigment-associated genes significantly upregulated under LL-FR relative to HL-WL in Acaryochloris marina MBIC11017. Genes are grouped by functional category and sorted by fold change within each group.
2.6. Additional Light-Harvesting and Pigment Biosynthesis Genes
In addition to the KEGG-defined phycobiliprotein pathway, several genes associated with light harvesting and pigment biosynthesis were strongly induced under LL-FR conditions (Table 2; Figure 3). Five chromosomally encoded loci (AM1_3686–3689 and AM1_5044) showed particularly strong induction, with expression increases ranging from approximately 11-fold to 35-fold. Although annotated as hypothetical proteins in RefSeq, their genomic context and expression patterns are consistent with chlorophyll-binding Pcb/CBP antenna proteins described previously in A. marina. Genes involved in chlorophyll biosynthesis were also significantly upregulated. The chlL and chlN genes, which encode subunits of the dark-operative protochlorophyllide oxidoreductase involved in chlorophyll synthesis, showed expression increases of 12.3-fold and 8.5-fold, respectively. In addition, the PS-II extrinsic protein psbU (AM1_5046), which contributes to stabilization of the oxygen-evolving complex, showed strong induction (31.8-fold). Several additional plasmid-encoded genes of unknown function (AM1_C0095, AM1_C0097, AM1_C0189, and AM1_C0214) were also upregulated and exhibited expression patterns similar to those of the phycobiliprotein genes.
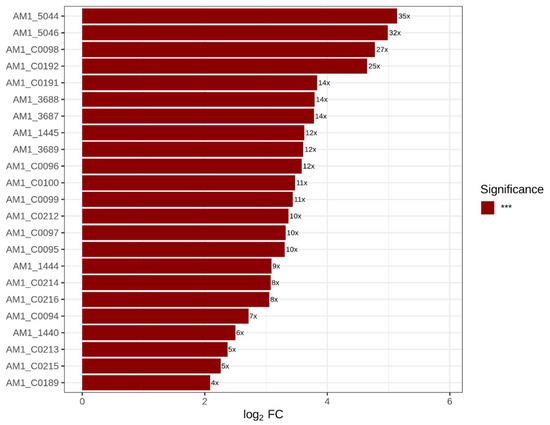
Figure 3.
Log2 fold changes in significantly upregulated genes associated with light harvesting and pigment biosynthesis in Acaryochloris marina under LL-FR relative to HL-WL conditions. Genes shown include members of the KEGG photosynthesis–antenna protein pathway together with additional light-harvesting and pigment-associated genes listed in Table 2. *** indicates statistical significance at adjusted p < 0.001 (Benjamini–Hochberg method).
2.7. KEGG Pathway Enrichment Analysis
KEGG pathway enrichment analysis further highlighted the importance of light-harvesting processes in the LL-FR versus HL-WL transcriptional response. Three pathways were significantly enriched among upregulated genes (adjusted p < 0.05; Table 3; Supplementary Figures S5 and S6). The Photosynthesis–antenna protein pathway (amr00196) showed the strongest enrichment, with 17 of 18 genes differentially expressed and a 7-fold enrichment (adjusted p = 1.86 × 10⁻¹²). The Photosynthesis pathway (amr00195) was also significantly enriched, with 38 of 86 genes upregulated (adjusted p = 1.04 × 10⁻¹⁰). These results are summarized in Figure 4A,B. Among downregulated genes, enrichment was observed in pathways associated with fatty acid degradation, cationic antimicrobial peptide resistance, and nitrotoluene degradation.
Table 3.
KEGG pathway enrichment analysis of differentially expressed genes in Acaryochloris marina under low-irradiance far-red light (LL-FR) relative to high-irradiance white light (HL-WL). Pathways enriched among upregulated and downregulated genes were identified using KEGG pathway analysis. Enrichment values represent fold enrichment relative to the background gene set. Arrows indicate enrichment among genes upregulated (↑) or downregulated (↓) under LL-FR conditions.
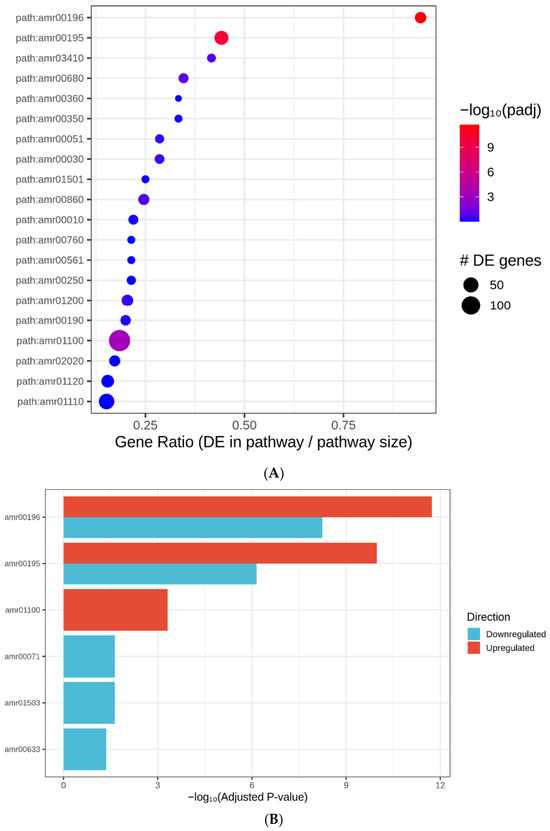
Figure 4.
(A) KEGG pathways significantly enriched among genes upregulated under LL-FR relative to HL-WL in Acaryochloris marina. Bubble size indicates the number of differentially expressed genes in each pathway, and color indicates significance as −log10(adjusted p value). (B) Summary of significantly enriched KEGG pathways among differentially expressed genes in Acaryochloris marina under LL-FR relative to HL-WL conditions.
2.8. Co-Expression Network Analysis
Weighted gene co-expression network analysis identified five gene modules based on correlated expression patterns (Figure 5A; Supplementary Figure S7). The turquoise module, containing 1352 genes, included all phycobiliprotein genes from the KEGG amr00196 pathway as well as all additional light-harvesting genes listed in Table 2. This module showed a significant positive correlation with LL-FR conditions (r = 0.802, p = 0.017) (Figure 5B). The eigengene expression pattern of this module across samples is shown in Figure 5C. Other modules also displayed strong associations with the experimental conditions, with the green module showing the strongest positive correlation with LL-FR (r = 0.91, p = 0.002) and the yellow module showing the strongest negative correlation (r = −0.86, p = 0.006). Because the scale-free topology fit of the WGCNA network (R2 = 0.66) is below the commonly recommended threshold of 0.80, the module assignments should be interpreted cautiously.
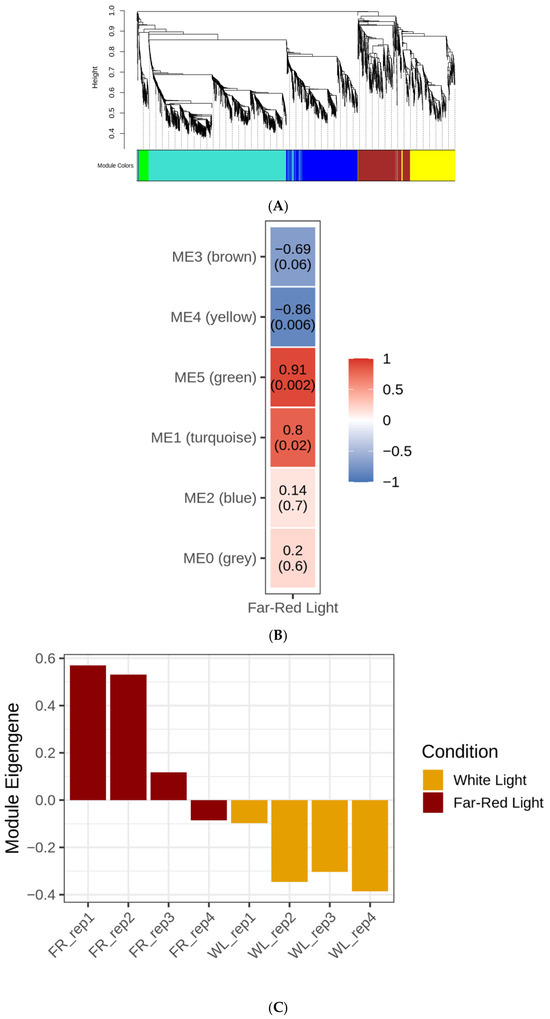
Figure 5.
(A) Gene dendrogram and module assignments from weighted gene co-expression network analysis of RNA-seq expression data from A. marina grown under HL-WL and LL-FR conditions. (B) Module–trait relationships between WGCNA modules and LL-FR conditions in A. marina. Values shown are Pearson correlation coefficients with corresponding p values. (C) Eigengene expression values for the turquoise WGCNA module across RNA-seq samples from A. marina grown under HL-WL and LL-FR conditions.
2.9. Protein–Protein Interaction Network
Potential functional relationships among differentially expressed genes were explored using the STRING protein–protein interaction database. The resulting interaction network contained 1115 nodes and 4763 edges, significantly exceeding the number expected by chance (PPI enrichment p < 1.0 × 10⁻¹⁶) (Supplementary Figure S8). Gene ontology enrichment analysis of the network identified biological processes related to photosynthesis, the electron transport chain, photosystem organization, and thylakoid components as significantly overrepresented. However, only 639 of the 1810 differentially expressed genes were mapped to STRING protein identifiers. The remaining 1171 genes, including many plasmid-encoded phycobiliprotein genes, were not in the database. As a result, the interaction network largely reflects proteins encoded by genes on the chromosome, whereas those encoded by plasmids are poorly represented. Together, the combined analyses of differential expression, pathway enrichment, co-expression and protein–protein interactions support a coordinated LL-FR versus HL-WL transcriptional response in Acaryochloris marina, marked by concerted upregulation of both photosystem genes and phycobiliprotein and chlorophyll-binding antenna systems, with the response of the latter being much greater in magnitude.
3. Discussion
3.1. Antenna Remodeling Is the Strongest Transcriptional Feature of the LL-FR/HL-WL Contrast
The present analysis indicates that, in the contrast between low-irradiance far-red light (LL-FR) and high-irradiance white light (HL-WL), Acaryochloris marina MBIC11017 simultaneously upregulates core photosystem genes and, more strongly, light-harvesting antenna genes. Using GFF-verified locus tags, all eleven PS-I core loci and a majority of PS-II core loci showed significantly increased expression under LL-FR, while the magnitude of induction was substantially greater for antenna-related genes (phycobiliprotein operon, chromosomally encoded Pcb/CBP candidates, and chlorophyll biosynthesis genes; mean antenna log2FC = +3.51 versus PS-I +1.96 and PS-II +1.10). Because LL-FR couples a far-red spectral shift with a 15–25-fold reduction in photon flux, the elevated photosystem and antenna transcript levels are most parsimoniously interpreted as a low-irradiance photoacclimation response—expansion of light-harvesting and biogenesis capacity under photon limitation—with a potential CA5-mediated component (via the AM1_5894 bacteriophytochrome) superimposed on phycobiliprotein gene regulation [18,19,20]. This interpretation is consistent with matched-irradiance physiological data showing that, at equal photon flux, far-red illumination decreases rather than increases phycobilisome content [20,21].
This interpretation is consistent with the distinctive photophysiology of A. marina, which uses chlorophyll d as its dominant pigment and already extends absorption into the far-red region [22,23]. Within the limits of this dataset, the LL-FR/HL-WL response appears less consistent with replacement of core reaction-center components than with increased effective light capture and biogenesis capacity through antenna-associated adjustments.
3.2. Strong Induction of Phycobiliprotein Genes Supports Integration of Reacquired Antenna Functions
The clearest transcriptional response in this study was the strong induction of phycobiliprotein genes. Seventeen of the eighteen genes in the KEGG photosynthesis–antenna protein pathway were significantly upregulated under LL-FR, and several showed greater than 20-fold increases in expression. Most of these genes are located on the pREB3 plasmid, consistent with previous work showing that phycobiliprotein genes in A. marina MBIC11017 were reacquired by horizontal gene transfer [16,18,19]. Their strong expression under LL-FR therefore supports the idea that these reacquired genes are not peripheral genomic additions, but are functionally engaged during the LL-FR/HL-WL response.
The induction of the chromosomally encoded apcB gene merits separate consideration in light of the unusual phycobilisome (PBS) architecture of A. marina. Unlike most cyanobacteria, A. marina lacks the core-membrane linker apcE and does not assemble a classical tricylindrical allophycocyanin core; its PBS consist of rod-shaped phycocyanin assemblies in which allophycocyanin subunits constitute only a minor population at the proximal (membrane-facing) end of the rod [11,12,13]. apcB upregulation in this organism is therefore unlikely to reflect remodeling of a canonical APC core. Instead, the most parsimonious interpretation is that apcB participates in the broader low-light-driven induction of phycobiliprotein synthesis observed across both plasmid-borne (cpcA, cpcB, cpcC, cpcD, cpcG, cpcE, cpcF) and chromosomal phycobiliprotein loci, perhaps contributing to the small allophycocyanin population at the rod base or to phycocyanin–rod assembly fidelity. Direct biochemical confirmation of apcB protein abundance, localization, and stoichiometry within rod-only PBS will require complementary proteomic and structural studies. We therefore do not interpret apcB induction as evidence of a canonical core; rather, the result indicates that both plasmid-acquired and ancestral chromosomal phycobiliprotein components are jointly mobilized under the LL-FR condition, consistent with regulatory integration of the horizontally acquired phycocyanin operon into the host light-harvesting program [18,20].
3.3. Multiple Antenna Systems Respond Under LL-FR
In addition to phycobiliprotein genes, several strongly induced loci were consistent with previously described chlorophyll-binding Pcb/CBP antenna proteins. These genes are of particular interest because they suggest that LL-FR conditions are associated with increased expression of both water-soluble and membrane-associated antenna systems. Upregulation of chlL and chlN further supports the possibility of increased pigment-related investment under these conditions, while the strong induction of psbU may reflect accompanying changes in PS-II stabilization or assembly.
Taken together, these findings support a model in which A. marina responds to the LL-FR versus HL-WL contrast through broad antenna remodeling rather than through a narrowly targeted response in a single light-harvesting subsystem. At the transcript level, the response appears to involve enhancement of both phycobiliprotein-based and chlorophyll-binding antenna capacity.
3.4. Relationship to Canonical FaRLiP Responses in Other Cyanobacteria
The transcriptional pattern observed in the LL-FR versus HL-WL contrast differs from the canonical far-red light photoacclimation (FaRLiP) program described in other cyanobacteria. In FaRLiP-capable organisms, far-red growth is associated with replacement of standard photosystem subunits by specialized far-red isoforms encoded within the FaRLiP gene cluster [24,25]. In contrast, the present dataset does not point to a transcript-level response dominated by photosystem core replacement. Instead, it indicates broad increases in photosystem gene expression, accompanied by particularly strong induction of antenna-associated genes. A structured comparison of key features is provided in Table 4.
Table 4.
Comparison of the Acaryochloris marina LL-FR/HL-WL transcriptional response with canonical FaRLiP cyanobacteria.
The comparison should therefore be interpreted cautiously: because irradiance and wavelength are confounded, these data do not define a distinct far-red acclimation mode for A. marina. Rather, they show that, in this dataset, the LL-FR/HL-WL transcriptomic response is characterized by increased light-harvesting and photosystem transcript abundance rather than FaRLiP-like replacement of core photosystem subunits.
3.5. Network Analyses Provide Supportive but Limited Evidence
The network-based analyses were broadly consistent with the differential expression results, but they should be interpreted cautiously. WGCNA grouped phycobiliprotein genes and additional antenna-associated genes into a module positively associated with LL-FR, supporting the view that these genes share similar expression dynamics across the sampled conditions. However, the limited sample size and the suboptimal scale-free topology fit reduce confidence in the stability of these module assignments. Accordingly, the co-expression results are best regarded as supportive rather than definitive.
STRING analysis likewise identified a significantly enriched interaction network associated with photosynthesis-related functions, including electron transport and thylakoid organization. However, many plasmid-encoded genes, including numerous phycobiliprotein-associated loci, were not represented in the database. The interaction network, therefore, captures only part of the transcriptional response and is weighted toward chromosomally encoded functions. Together, these analyses support the broader interpretation of coordinated transcript-level adjustment, but, by themselves, they do not establish regulatory integration or direct functional interactions among all components.
3.6. Limitations and Future Directions
Several limitations require explicit acknowledgment. First, the underlying experiment compared low-irradiance far-red light (1.5–2 µmol photons m−2 s−1, 710-nm peak) with high-irradiance white light (30–35 µmol photons m−2 s−1), differing by a factor of approximately 15–25 in photon flux in addition to spectral composition; the effects of light quality and irradiance therefore cannot be separated within this dataset [18]. This limitation is consequential for biological interpretation. Recent matched-irradiance experiments by Oliver et al. [20], conducted at a common photon flux of 20 µmol m−2 s−1 under fluorescent white versus 740-nm far-red illumination, reported that white-light-grown A. marina MBIC11017 contains a higher PSI/PSII ratio and greater phycobilisome content than its far-red-grown counterpart, which has a smaller membrane-embedded antenna pool. Wang et al. [21] similarly reported that, at equal intensity, far-red illumination decreases the PBP/Chl d ratio. Both observations are difficult to reconcile with a wavelength-driven interpretation of the present transcriptional pattern, in which antenna and photosystem genes are upregulated under LL-FR. The most parsimonious explanation is that the bulk of the transcriptional induction reported here reflects a low-light photoacclimation response, that is, an increase in light-harvesting and reaction-center biogenesis under photon limitation, onto which a smaller wavelength-specific component, mediated by the characterized bacteriophytochrome AM1_5894 (the candidate CA5 photoreceptor) [18,19,20], may be superimposed. Second, transcript abundance does not directly demonstrate protein accumulation, antenna stoichiometry, pigment composition, or photosystem assembly state, all of which may diverge from transcript levels under light-shift conditions. Third, network-level analyses are constrained by the small number of biological replicates (n = 4 per condition) and by incomplete representation of plasmid-encoded loci in current STRING and KEGG annotations. Fourth, the present manuscript does not aim to redefine type-5 chromatic acclimation (CA5), which is an established mechanism in A. marina [16,18,20]; rather, its contribution lies in describing the genome-wide, systems-level architecture of the LL-FR/HL-WL transcriptional response across plasmid-encoded acquired antenna genes, chromosomal Pcb/CBP loci, chlorophyll biosynthesis, and GFF-verified photosystem subunits, while providing a modular co-expression framework for future hypothesis-driven experiments.
Future work should test A. marina under disentangled light-quality and irradiance conditions and combine transcriptomic analysis with proteomic, pigment, and physiological measurements. Such experiments will be needed to determine whether the transcriptional patterns observed here correspond to quantitative remodeling of antenna composition, altered photosystem organization, or both.
4. Materials and Methods
4.1. Data Source and Experimental Design
Paired-end RNA-seq data were obtained from the NCBI Sequence Read Archive under BioProject PRJNA1130970 [18]. The dataset comprised Acaryochloris marina MBIC11017 cultures grown under low-irradiance far-red light (LL-FR; 1.5–2 µmol photons m−2 s−1, LED with 710-nm emission peak) and high-irradiance white light (HL-WL; 30–35 µmol photons m−2 s−1, cool-white fluorescent), with a 12-h light/dark cycle at 30 °C and four biological replicates per condition (eight libraries in total) [18]. The two conditions therefore differ both in spectral quality and in irradiance (by approximately 15–25), and the original study emphasized that this design limits the separation of irradiance- and spectrum-dependent effects [18]. As this confounding cannot be resolved post hoc, throughout this study, we interpret transcriptional differences as responses to the combined LL-FR versus HL-WL treatment rather than to far-red wavelength alone.
4.2. Read Alignment and Quantification
Raw sequencing reads were downloaded from the NCBI SRA using SRA Toolkit v2.11.3 (prefetch and fasterq-dump). Read quality was assessed using FastQC v0.11.5, and no libraries showed quality issues requiring exclusion. Reads were aligned to the A. marina MBIC11017 reference genome (GCA_000018105.1) using STAR v2.7.10b [26]. Quality-control summaries were compiled with MultiQC [27]. The resulting BAM files were sorted and indexed with SAMtools v1.6 [28]. Gene-level read counts were generated using featureCounts v2.1.1 [29].
4.3. Differential Expression Analysis
Differential expression analysis was performed in R v4.3.3 using DESeq2 v1.42.1 [30,31]. Genes with fewer than 10 reads across fewer than 2 samples were excluded prior to analysis, leaving 8439 genes for statistical testing. Log2 fold changes were shrunk using apeglm v1.24.0 [32]. p-values were adjusted for multiple testing using the Benjamini–Hochberg false discovery rate method [33]. Genes with adjusted p < 0.05 were considered differentially expressed. Positive log2 fold change values indicate higher expression under LL-FR relative to HL-WL.
4.4. Gene Set Analysis
To assess coordinated transcriptional responses, gene set analysis was performed for photosystem I (PS-I; 11 gene loci encoding 10 subunit types), photosystem II (PS-II; 20 gene loci encoding 15 subunit types), and selected light-harvesting antenna gene groups. For each gene set, log2 fold change values were evaluated using complementary statistical approaches, including a one-sample t-test against zero, a Wilcoxon-based test, and permutation testing (100,000 iterations), to determine whether the overall expression response of the set differed from the null expectation.
4.5. KEGG Pathway Enrichment
KEGG pathway-to-gene mappings for A. marina (organism code: amr) were obtained from the KEGG database [34] using the KEGGREST R package (v1.42.0). Enrichment analysis was performed using Fisher’s exact test, with the set of genes retained for differential expression analysis used as the background universe. Resulting p-values were adjusted using the Benjamini–Hochberg method, and pathways with adjusted p < 0.05 were considered significantly enriched.
4.6. Weighted Gene Co-Expression Network Analysis
Weighted gene co-expression network analysis (WGCNA) was performed using variance-stabilized expression values for the 3000 most variable genes [35]. A signed co-expression network was constructed using a soft-threshold power of 20. The resulting scale-free topology fit was R2 = 0.66, which is below the commonly recommended threshold of 0.80 and likely reflects, at least in part, the limited sample size. Gene modules were identified using dynamic tree cutting with a minimum module size of 30 and a merge cut height of 0.25. Because only eight samples were available, WGCNA results were interpreted as exploratory and used primarily to identify broad patterns of coordinated expression.
4.7. Protein–Protein Interaction Network Analysis
Differentially expressed genes were analyzed using the STRING database v12.0 [36], with A. marina MBIC11017 (taxid: 329726) specified as the reference organism. STRING integrates known and predicted functional associations. The submitted differentially expressed gene set, together with first-shell interactors, produced a network containing 1115 nodes and 4763 edges at medium confidence (combined score ≥ 0.400). The STRING protein–protein interaction enrichment p-value was used to assess whether the observed network contained more interactions than expected for a random set of proteins of similar size.
5. Conclusions
Comparison of high-irradiance white light (HL-WL; 30–35 µmol photons m−2 s−1) and low-irradiance far-red light (LL-FR; 1.5–2 µmol photons m−2 s−1) shows that Acaryochloris marina MBIC11017 undergoes extensive coordinated transcriptional remodeling. Genes encoding the cores of both photosystem I (11/11 loci) and photosystem II (12/20 loci), essentially the entire KEGG photosynthesis–antenna protein pathway (amr00196; 17/18 genes), and multiple chromosomal loci consistent with chlorophyll-binding Pcb/CBP antenna proteins are upregulated under LL-FR, with antenna-associated genes showing the strongest induction. Co-expression network analysis assigns these genes to a single module strongly correlated with LL-FR, and STRING analysis supports a significantly interconnected interaction network. Because light quality and irradiance cannot be separated in the source experiment, and because matched-irradiance physiological data indicate that far-red light does not enhance phycobilisome content, we interpret the bulk of the transcriptional response as a low-irradiance photoacclimation, with a possible wavelength-specific component layered onto phycobiliprotein regulation. The integrative analysis nonetheless provides a genome-wide, systems-level map of how plasmid-borne reacquired phycobiliprotein genes, ancestral chromosomal antenna components, chlorophyll biosynthesis, and the photosystem cores are co-mobilized under a combined low-light far-red shift, providing a co-expression framework for future experiments designed to disentangle wavelength- and intensity-driven regulation.
Supplementary Materials
The following supporting information can be downloaded at: https://www.mdpi.com/article/10.3390/plants15111605/s1, Figure S1: Pearson sample correlation matrix; Figure S2: Top 50 DE genes heatmap (Z-scored VST counts); Figure S3: MA plot; Figure S4: DESeq2 dispersion estimates; Figure S5: KEGG enrichment among all DE genes; Figure S6: KEGG enrichment among downregulated genes; Figure S7: WGCNA soft threshold selection (power 20, R2 = 0.66); Figure S8: STRING protein–protein interaction (PPI) network of differentially expressed genes in Acaryochloris marina.
Author Contributions
A.P.K.: Conceptualization, Data curation, Formal analysis, Writing—original draft. V.K.H.: Data curation, Writing, Formal analysis. D.K.: Conceptualization, Supervision, Writing—review & editing. All authors have read and agreed to the published version of the manuscript.
Funding
This work was supported by a Discovery Grant from the Natural Sciences and Engineering Research Council of Canada (NSERC), awarded to D.K. (Discovery Grant No. RGPIN-2024-04171), and by startup funds from Brock University.
Data Availability Statement
RNA-seq data: PRJNA1130970 [18]. Reference genome: GCA_000018105.1. STRING v12.0, taxid 329726.
Acknowledgments
We thank Ulrich & Miller [18] for making their data publicly available.
Conflicts of Interest
The authors declare no conflicts of interest.
Abbreviations
| Chl | chlorophyll |
| PS-I | photosystem I |
| PS-II | photosystem II |
| Pcb | prochlorophyte chlorophyll-binding protein |
| CBP | chlorophyll-binding protein |
| CA5 | chromatic acclimation type 5 |
| LL-FR | low-irradiance far-red light |
| HL-WL | high-irradiance white light |
| DE | differentially expressed |
| KEGG | Kyoto Encyclopedia of Genes and Genomes |
| WGCNA | weighted gene co-expression network analysis |
| PPI | protein–protein interaction |
| HGT | horizontal gene transfer |
| FaRLiP | far-red light photoacclimation |
| DPOR | dark-operative protochlorophyllide oxidoreductase |
| VST | variance-stabilizing transformation |
References
- Gan, F.; Bryant, D.A. Adaptive and acclimative responses of cyanobacteria to far-red light. Environ. Microbiol. 2015, 17, 3450–3465. [Google Scholar] [CrossRef]
- Nürnberg, D.J.; Morton, J.; Santabarbara, S.; Telfer, A.; Joliot, P.; Antonaru, L.A.; Ruban, A.V.; Cardona, T.; Krausz, E.; Boussac, A.; et al. Photochemistry beyond the red limit in chlorophyll f-containing photosystems. Science 2018, 360, 1210–1213. [Google Scholar] [CrossRef] [PubMed]
- Elias, E.; Oliver, T.J.; Croce, R. Oxygenic photosynthesis in far-red light: Strategies and mechanisms. Annu. Rev. Phys. Chem. 2024, 75, 231–256. [Google Scholar] [CrossRef]
- Miyashita, H.; Ikemoto, H.; Kurano, N.; Adachi, K.; Chihara, M.; Miyachi, S. Chlorophyll d as a major pigment. Nature 1996, 383, 402. [Google Scholar] [CrossRef]
- Loughlin, P.C.; Lin, Y.; Chen, M. Chlorophyll d and Acaryochloris marina: Current status. Photosynth. Res. 2013, 116, 277–293. [Google Scholar] [CrossRef]
- Kühl, M.; Chen, M.; Ralph, P.J.; Schreiber, U.; Larkum, A.W.D. A niche for cyanobacteria containing chlorophyll d. Nature 2005, 433, 820. [Google Scholar] [CrossRef]
- Mohr, R.; Voß, B.; Schliep, M.; Kurz, T.; Maldener, I.; Adams, D.G.; Larkum, A.W.D.; Chen, M.; Hess, W.R. A new chlorophyll d-containing cyanobacterium: Evidence for niche adaptation in the genus Acaryochloris. ISME J. 2010, 4, 1456–1469. [Google Scholar] [CrossRef]
- Miller, S.R.; Augustine, S.; Olson, T.L.; Blankenship, R.E.; Selker, J.; Wood, A.M. Discovery of a free-living chlorophyll d-producing cyanobacterium with a hybrid proteobacterial/Cyanobacterial small-subunit rRNA gene. Proc. Natl. Acad. Sci. USA 2005, 102, 850–855. [Google Scholar] [CrossRef] [PubMed]
- Swingley, W.D.; Chen, M.; Cheung, P.C.; Conrad, A.L.; Dejesa, L.C.; Hao, J.; Honchak, B.M.; Karbach, L.E.; Kurdoglu, A.; Lahiri, S.; et al. Niche adaptation and genome expansion in the chlorophyll d-producing cyanobacterium Acaryochloris marina. Proc. Natl. Acad. Sci. USA 2008, 105, 2005–2010. [Google Scholar] [CrossRef] [PubMed]
- Li, Z.-K.; Yin, Y.-C.; Zhang, L.-D.; Zhang, Z.; Dai, G.-Z.; Chen, M.; Qiu, B.-S. The identification of IsiA proteins binding chlorophyll d in the cyanobacterium Acaryochloris marina. Photosynth. Res. 2018, 135, 165–177. [Google Scholar] [CrossRef]
- Chen, M.; Bibby, T.S.; Nield, J.; Larkum, A.W.D.; Barber, J. Iron deficiency induces a chlorophyll d-binding Pcb antenna system around photosystem I in Acaryochloris marina. Biochim. Biophys. Acta Bioenerg. 2005, 1708, 367–374. [Google Scholar] [CrossRef]
- Chen, M.; Zhang, Y.; Blankenship, R.E. Nomenclature for membrane-bound light-harvesting complexes of cyanobacteria. Photosynth. Res. 2008, 95, 147–154. [Google Scholar] [CrossRef]
- Hamaguchi, T.; Kawakami, K.; Shinzawa-Itoh, K.; Inoue-Kashino, N.; Itoh, S.; Ifuku, K.; Yamashita, E.; Maeda, K.; Yonekura, K.; Kashino, Y. Structure of the far-red light utilizing photosystem I of Acaryochloris marina. Nat. Commun. 2021, 12, 2333. [Google Scholar] [CrossRef] [PubMed]
- Chen, M.; Bibby, T.S.; Nield, J.; Larkum, A.W.D.; Barber, J. Structure of a large photosystem II supercomplex from Acaryochloris marina. FEBS Lett. 2005, 579, 1306–1310. [Google Scholar] [CrossRef]
- Shen, L.; Gao, Y.; Tang, K.; Qi, R.; Fu, L.; Chen, J.-H.; Wang, W.; Ma, X.; Li, P.; Chen, M.; et al. Structure of a unique PSII-Pcb tetrameric megacomplex in a chlorophyll d-containing cyanobacterium. Sci. Adv. 2024, 10, eadk7140. [Google Scholar] [CrossRef]
- Ulrich, N.; Uchida, H.; Kanesaki, Y.; Hirose, E.; Murakami, A.; Miller, S.R. Reacquisition of light-harvesting genes in a marine cyanobacterium confers a broader solar niche. Curr. Biol. 2021, 31, 1539–1546. [Google Scholar] [CrossRef]
- Yamamoto, H.; Uesaka, K.; Tsuzuki, Y.; Yamakawa, H.; Itoh, S.; Fujita, Y. Comparative genomic analysis of the marine cyanobacterium Acaryochloris marina MBIC10699 reveals the impact of phycobiliprotein reacquisition and the diversity of Acaryochloris plasmids. Microorganisms 2022, 10, 1374. [Google Scholar] [CrossRef]
- Ulrich, N.; Miller, S.R. Integration of horizontally acquired light-harvesting genes into an ancestral regulatory network in the cyanobacterium Acaryochloris marina MBIC11017. mBio 2024, 15, e02423-24. [Google Scholar] [CrossRef] [PubMed]
- Loughlin, P.C.; Duxbury, Z.; Mukasa-Mugerwa, T.T.; Smith, P.M.C.; Willows, R.D.; Chen, M. Spectral properties of bacteriophytochrome AM1_5894 in the chlorophyll d-containing cyanobacterium Acaryochloris marina. Sci. Rep. 2016, 6, 27547. [Google Scholar] [CrossRef]
- Oliver, T.J.; Elias, E.; Croce, R. Acclimation to white light in a far-red light specialist: Insights from Acaryochloris marina MBIC11017. New Phytol. 2025, 247, 128–143. [Google Scholar] [CrossRef] [PubMed]
- Wang, Z.; Ueno, Y.; Toyofuku, R.; Tomo, T.; Akimoto, S. Changes in light-harvesting and energy-transfer processes of the chlorophyll d-dominated cyanobacterium Acaryochloris marina in response to different light qualities. Photosynth. Res. 2025, 163, 60. [Google Scholar] [CrossRef] [PubMed]
- Hu, Q.; Miyashita, H.; Iwasaki, I.; Kurano, N.; Miyachi, S.; Iwaki, M.; Itoh, S. A photosystem I reaction center driven by chlorophyll d in oxygenic photosynthesis. Proc. Natl. Acad. Sci. USA 1998, 95, 13319–13324. [Google Scholar] [CrossRef]
- Tomo, T.; Okubo, T.; Akimoto, S.; Yokono, M.; Miyashita, H.; Tsuchiya, T.; Noguchi, T.; Mimuro, M. Identification of the special pair of photosystem II in a chlorophyll d-dominated cyanobacterium. Proc. Natl. Acad. Sci. USA 2007, 104, 7283–7287. [Google Scholar] [CrossRef]
- Gan, F.; Zhang, S.; Rockwell, N.C.; Martin, S.S.; Lagarias, J.C.; Bryant, D.A. Extensive remodeling of a cyanobacterial photosynthetic apparatus in far-red light. Science 2014, 345, 1312–1317. [Google Scholar] [CrossRef] [PubMed]
- Zhao, C.; Gan, F.; Shen, G.; Bryant, D.A. RfpA, RfpB, and RfpC are the master control elements of far-red light photoacclimation. Front. Microbiol. 2015, 6, 1303. [Google Scholar] [CrossRef]
- Dobin, A.; Davis, C.A.; Schlesinger, F.; Drenkow, J.; Zaleski, C.; Jha, S.; Batut, P.; Chaisson, M.; Gingeras, T.R. STAR: Ultrafast universal RNA-Seq aligner. Bioinformatics 2013, 29, 15–21. [Google Scholar] [CrossRef]
- Ewels, P.; Magnusson, M.; Lundin, S.; Käller, M. MultiQC: Summarize analysis results for multiple tools and samples in a single report. Bioinformatics 2016, 32, 3047–3048. [Google Scholar] [CrossRef]
- Li, H.; Handsaker, B.; Wysoker, A.; Fennell, T.; Ruan, J.; Homer, N.; Marth, G.; Abecasis, G.; Durbin, R. The sequence alignment/Map format and SAMtools. Bioinformatics 2009, 25, 2078–2079. [Google Scholar] [CrossRef]
- Liao, Y.; Smyth, G.K.; Shi, W. featureCounts: An efficient general purpose program for assigning sequence reads to genomic features. Bioinformatics 2014, 30, 923–930. [Google Scholar] [CrossRef] [PubMed]
- Love, M.I.; Huber, W.; Anders, S. Moderated estimation of fold change and dispersion for RNA-Seq data with DESeq2. Genome Biol. 2014, 15, 550. [Google Scholar] [CrossRef]
- Anders, S.; Huber, W. Differential expression analysis for sequence count data. Genome Biol. 2010, 11, R106. [Google Scholar] [CrossRef]
- Zhu, A.; Ibrahim, J.G.; Love, M.I. Heavy-tailed prior distributions for sequence count data: Removing the noise and preserving large differences. Bioinformatics 2018, 35, 2084–2092. [Google Scholar] [CrossRef] [PubMed]
- Benjamini, Y.; Hochberg, Y. Controlling the false discovery rate: A practical and powerful approach to multiple testing. J. R. Stat. Soc. B 1995, 57, 289–300. [Google Scholar] [CrossRef]
- Kanehisa, M.; Goto, S. KEGG: Kyoto Encyclopedia of Genes and Genomes. Nucleic Acids Res. 2000, 28, 27–30. [Google Scholar] [CrossRef]
- Langfelder, P.; Horvath, S. WGCNA: An R package for weighted correlation network analysis. BMC Bioinform. 2008, 9, 559. [Google Scholar] [CrossRef]
- Szklarczyk, D.; Gable, A.L.; Nastou, K.C.; Lyon, D.; Kirsch, R.; Pyysalo, S.; Doncheva, N.T.; Legeay, M.; Fang, T.; Bork, P.; et al. The STRING database in 2021: Customizable protein-protein networks, and functional characterization of user-uploaded gene/measurement sets. Nucleic Acids Res. 2021, 49, D605–D612. [Google Scholar] [CrossRef] [PubMed]


Disclaimer/Publisher’s Note: The statements, opinions and data contained in all publications are solely those of the individual author(s) and contributor(s) and not of MDPI and/or the editor(s). MDPI and/or the editor(s) disclaim responsibility for any injury to people or property resulting from any ideas, methods, instructions or products referred to in the content. |
© 2026 by the authors. Licensee MDPI, Basel, Switzerland. This article is an open access article distributed under the terms and conditions of the Creative Commons Attribution (CC BY) license.