


Abstract
This study evaluates ChromaLIVETM, a multichromatic, mix-and-read fluorescent marker developed for continuous live-cell imaging, in the context of embryology. The aim was to evaluate whether this marker is compatible with dynamic embryonic development up to the blastocyst stage, with minimal impact on embryo viability, integrity, or normal growth of mouse embryos at the 2-cell stage that were cultured to the blastocyst stage under time-lapse imaging conditions, either in the presence or absence of ChromaLIVETM. Results showed comparable blastocyst formation rates between ChromaLiveTM and the control group, as well as similar proportions of high-quality blastocysts. Although minor but statistically significant delays were noted in two kinetics events (t3 and tSB), other developmental timings remained unaffected. Time-lapse confocal fluorescence imaging demonstrated that ChromaLIVETM dye provided stable, bright, high-resolution 3D visualizations of cellular compartments including membranes, cytoplasm and embryonic structures such as trophectoderm, inner cell mass and blastocoel throughout development. Finally, transcriptomic analyses revealed a limited set of gene-expression differences between stained and unstained embryos; although these included developmental and metabolic pathways, embryos developed to the blastocyst stage comparably to controls.
1. Introduction
Research in embryology is evolving rapidly with the integration of computer vision and AI-driven analysis approaches, creating an increasing need for live-cell imaging markers [1,2,3,4,5,6,7]. Ideal markers must enable temporal tracking of cellular movement and divisions throughout development up to the blastocyst stage, without interfering with embryo culture conditions or compromising viability, integrity, and normal development [8,9]. Such markers must be biologically inert and non-toxic, inducing no cellular stress, developmental delays, apoptosis, or impaired growth. Additionally, they should be sensitive to environmental and physiological changes, allowing the detection of cellular dynamics in real time [10,11,12]. For long-term imaging, markers must also yield a stable, bright and quantifiable signal throughout extended culture periods, while minimizing phototoxicity [9,12,13]. However, the widespread adoption of live imaging techniques in routine research workflows has been constrained by the limited availability of fluorescent markers suitable for long-term imaging. Most commercially available markers are cytotoxic, require complex staining protocols or cannot visualize multiple cellular structures simultaneously, restricting the depth and quality of biological information captured [10,14,15,16]. Our study introduces ChromaLIVETM, a non-target-specific, multichromatic live-cell dye that operates via a molecular rotor mechanism and passively integrates cellular membrane structures, enabling simultaneous visualization of multiple cellular organelles without requiring fixation or washing steps [13]. Several studies have subsequently demonstrated its compatibility with prolonged live-cell imaging in diverse cellular and 3D models, including human mesenchymal stem cells, primary chronic lymphocytic leukemia cells, cancer cell lines and liver spheroids [12,17,18,19,20,21]. These studies have shown that ChromaLIVE™ can provide temporally resolved information associated with changes in cellular morphology and physiological state.
These properties provided a rationale for investigating whether ChromaLIVE™ could be extended to preimplantation embryo imaging. However, because embryonic systems may respond differently to fluorescent probes than conventional cell or organoid models, the present study focused on evaluating its compatibility, safety and effectiveness in capturing key developmental dynamics during prolonged culture.
2. Materials and Methods
2.1. Mouse Embryos Culture Conditions
Cryopreserved 2-cell stage F1 hybrid mouse embryos (B6C3F1 × B6D2F1) were purchased for this study (Embryotech™ Laboratories Inc., Haverhill, MA, USA) and thawed following the provider’s recommendations. This F1 hybrid cross is the standard model used for embryo-based reagent testing in clinical embryology laboratories. The 2-cell stage mouse embryos were cultured to the blastocyst stage in SAGE 1-Step™ (CooperSurgical, Trumbull, CT, USA), containing ChromaLIVE™ (Saguaro Biosciences, Quebec, QC, Canada; 1:1000 dilution, which is the pre-validated working solution, n = 49) or in SAGE 1-Step™ medium alone, serving as the control group (Ctrl, n = 47). These embryos were maintained in an incubator equipped with Time-Lapse technology (MIRI® TL, Esco Medical, Ramuciai, Lithuania; 37 °C, 5% CO2, 5% O2).
2.2. Morphokinetic Analysis
Embryonic development was continuously monitored using time-lapse imaging from the 2-cell stage to the blastocyst stage. Embryo quality was assessed morphologically following standard grading criteria, in which blastocyst quality and cell survival are evaluated visually. Developmental events were annotated and embryos were graded by a senior embryologist according to ESHRE guidelines [22]. Blastocyst rate was calculated as the number of blastocysts divided by the total number of embryos cultured. Embryo quality was assessed using the Gardner classification, with good-quality blastocysts defined as grade A or B [23,24].
2.3. Confocal Live Imaging Setting
A total of 19 live embryos were cultured in 35 mm uncoated Petri dishes (Cat. P35G-1.5–20-C, MAtTEK, Ashland, MA, USA) and imaged using the Yokogawa CellVoyager CQ1 (Yokogawa Electric Corporation, Tokyo, Japan) spinning disk confocal microscope equipped with an Olympus (Hachioji, Tokyo, Japan) UPLXAPO 20x dry lens (NA 0.75) and CellPathfinder software (version R3.08.03). Imaging was performed over a 96 h culture period to monitor live embryo development. High-resolution z-stack images were acquired every 6 h, with a 5 µm z-step between optical sections, for a total of 17 z-slices per embryo. Kinetic imaging intervals were timed to capture key development stages throughout the culture. Fluorescence signals from the 3 ChromaLIVE™ channels were collected, with excitation and emission settings listed in Table 1. Briefly, the first excitation wavelength was set at 488 nm, with fluorescence emission collected around 600 nm (ChromaLIVE-488_Yellow) and 700 nm (ChromaLIVE-488_Red). The second excitation wavelength was set at 561 nm, with fluorescence emission collected around 600 nm (ChromaLIVE-561).
Table 1.
Imaging parameters for the ChromaLIVETM dye.
2.4. Transcriptomic Analysis
Two-cell mouse embryos were cultured up to 96 h to the blastocyst stage under 3 different conditions: ChromaLIVE TM (1:1000, n = 3), DMSO (0.1% v/v, n = 3) and Control (no additive, n = 3). To distinguish dye-specific effects from vehicle effects, we used a two-factor design that accounted for the presence of solvent (DMSO). This approach allowed us to isolate dye-specific transcriptional responses independently of vehicle-related effects. RNA isolation from individual blastocysts cultured under each condition was performed using the SMART-Seq mRNA kit (Takara, Kusatsu, Shiga, Japan), following the manufacturer’s recommendations. Libraries were prepared as poly-A-selected, single-read (SR100) libraries and sequenced on an Illumina NextSeq 2000 (San Diego, CA, USA). The integrity of the raw sequencing data was assessed, with all FASTQ files meeting stringent base quality control standards (mean Phred score ≥ 30). Adapter sequences and low-quality bases were successfully removed using fastp, ensuring no significant overrepresented sequences remained post-trimming. Comprehensive quality reports generated by MultiQC confirmed uniform read quality and processing consistency across all samples. Transcript quantification was performed using Salmon, providing highly accurate expression estimates. This methodology accounted for fragment-level GC bias and sequence-specific biases, enhancing the reliability of the abundance estimates.
Differential Expression Analysis
Differential expression analysis was conducted with DESeq2 v1.40.1. Genes with an adjusted p-value (FDR) < 0.05 (Benjamini–Hochberg) and |log2FC| > 1 were deemed as differentially expressed genes (DEGs). Log fold changes were shrunk using lfcShrink with the type = “apeglm” or “normal” method as appropriate. Principal Component Analysis (PCA) was performed using rlog-transformed counts from DESeq2. Volcano plots and bar plots of DEGs were generated to illustrate the differential expression landscape between conditions.
2.5. Statistical Analyses
Statistical analyses were performed using the chi-square test for comparisons of rates and the Welch two-sample t-test for comparisons of continuous variables (ChromaLIVE™ group as compared to the Ctrl group). p-value < 0.05 was considered statistically significant.
3. Results
3.1. Blastocyst Assessment and Embryo Developmental Kinetics
The blastocyst rate (ChromaLIVETM = 73.4% vs. Ctrl = 82.9%) and good quality blastocyst (ChromaLIVETM =48.6% vs. Ctrl = 47.4%) rates were comparable between the two groups. ChromaLIVETM embryos reached certain developmental stages later than control embryos: t3 (ChromaLIVETM = 8.7 h vs. Ctrl= 6.8 h) and tSB (ChromaLIVETM = 59.3 h vs. Ctrl = 51.1 h) (Table 2). Importantly, other developmental timings were comparable in the presence of ChromaLIVETM, with no difference in the cell cycles (s2, s3, cc3a, cc3b, cc3, ECC3) (Table 2 and Table 3).
Table 2.
Morphokinetic parameters in the ChromaLIVE TM as compared to the control group. tn: time to n number of blastomeres. tM: time to morula; tSC: time to start of compaction; tEC: time to end of compaction; tSB: time to start of blastulation. A Welch t-test was used to compare the two culture conditions. * p < 0.05. n = number of visualized and annotated events.
Table 3.
Embryonic cell cycles in the ChromaLIVE TM group as compared to the control group. s2: time between division to three cells and subsequent division to four cells. s3: time between division to five cells and subsequent division to eight cells; cc3: blastomere cell cycle duration of the third cell cycle (a = t5 − t4, b = t6 − t4, c = t7 − t4); ECC3: embryo cell cycle (t8 − t4). A Welch t-test was used to compare the two culture conditions. No statistically significant difference was found. n = number of visualized and annotated events.
3.2. Confocal Live Imaging
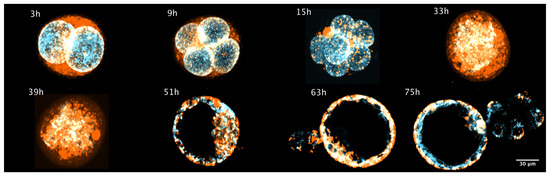
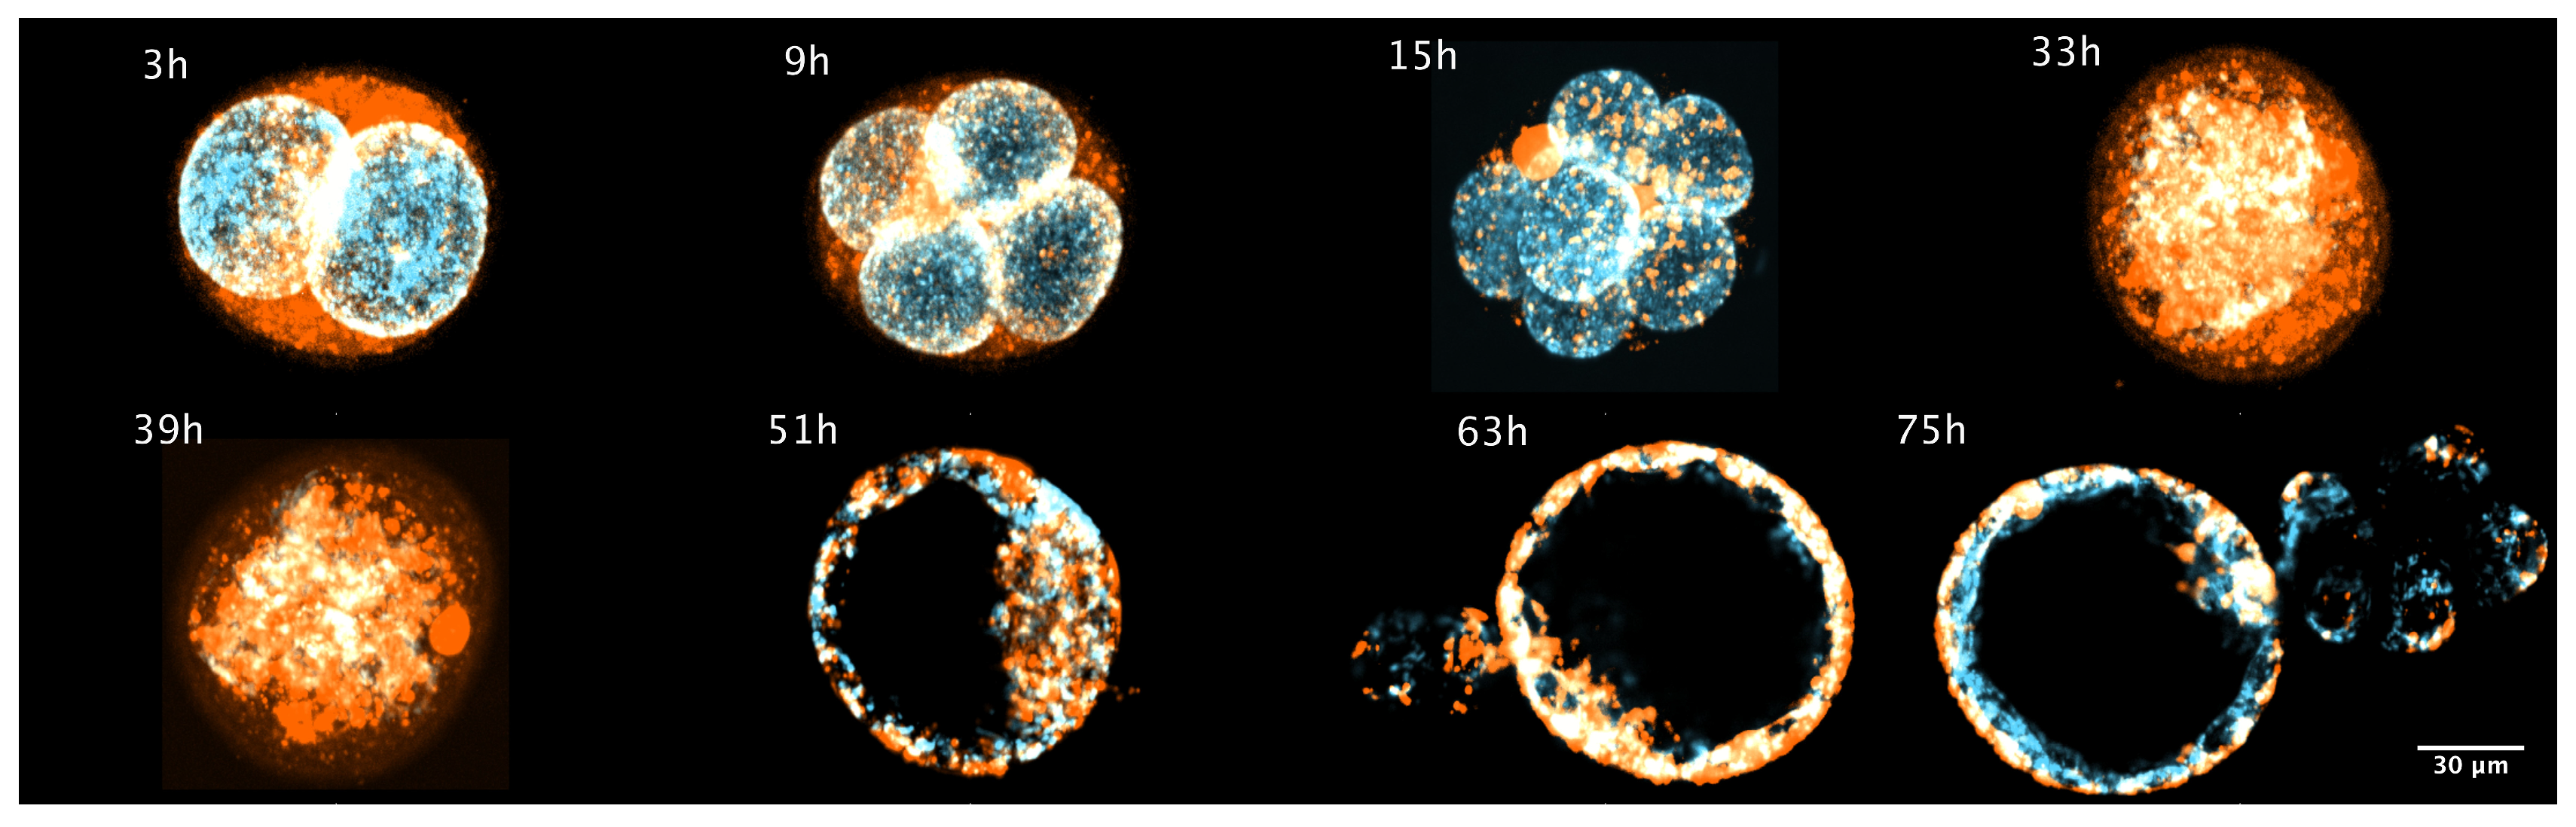
The staining pattern of ChromaLIVETM clearly revealed well-distinguished embryonic compartments across developmental stages. During early cleavage stages (2-cell to 8-cell), blastomere membranes, cytoplasm and nuclei were distinctly visualized, while at the blastocyst stage, the trophectoderm, inner cell mass, and blastocoel cavity were readily distinguishable (Figure 1). This enabled detailed and dynamic 3D visualization of the embryo’s structural organization throughout development. A video of the ChromaLIVETM embryo development is available in the Supplementary Files.
Figure 1.
Kinetic imaging of ChromaLIVETM-stained embryos showing temporal changes in staining patterns across development stages. Each panel depicts a maximum-intensity projection of merged ChromaLIVETM channels, with ChromaLIVETM_488 displayed in orange and ChromaLIVETM_561 in blue. n = 19 embryos.
3.3. Transcript Analyses
3.3.1. Sequencing and Mapping Metrics
RNA-seq generated high-quality libraries across all conditions (control, DMSO, and ChromaLIVETM). After preprocessing, reads mapped at high rates to the reference transcriptome (approximately 90% across samples), with >9 million reads quantified per sample. Gene-level summarization yielded an expression matrix of 77,179 genes across the cohort.
3.3.2. Principal Component Analysis (PCA)
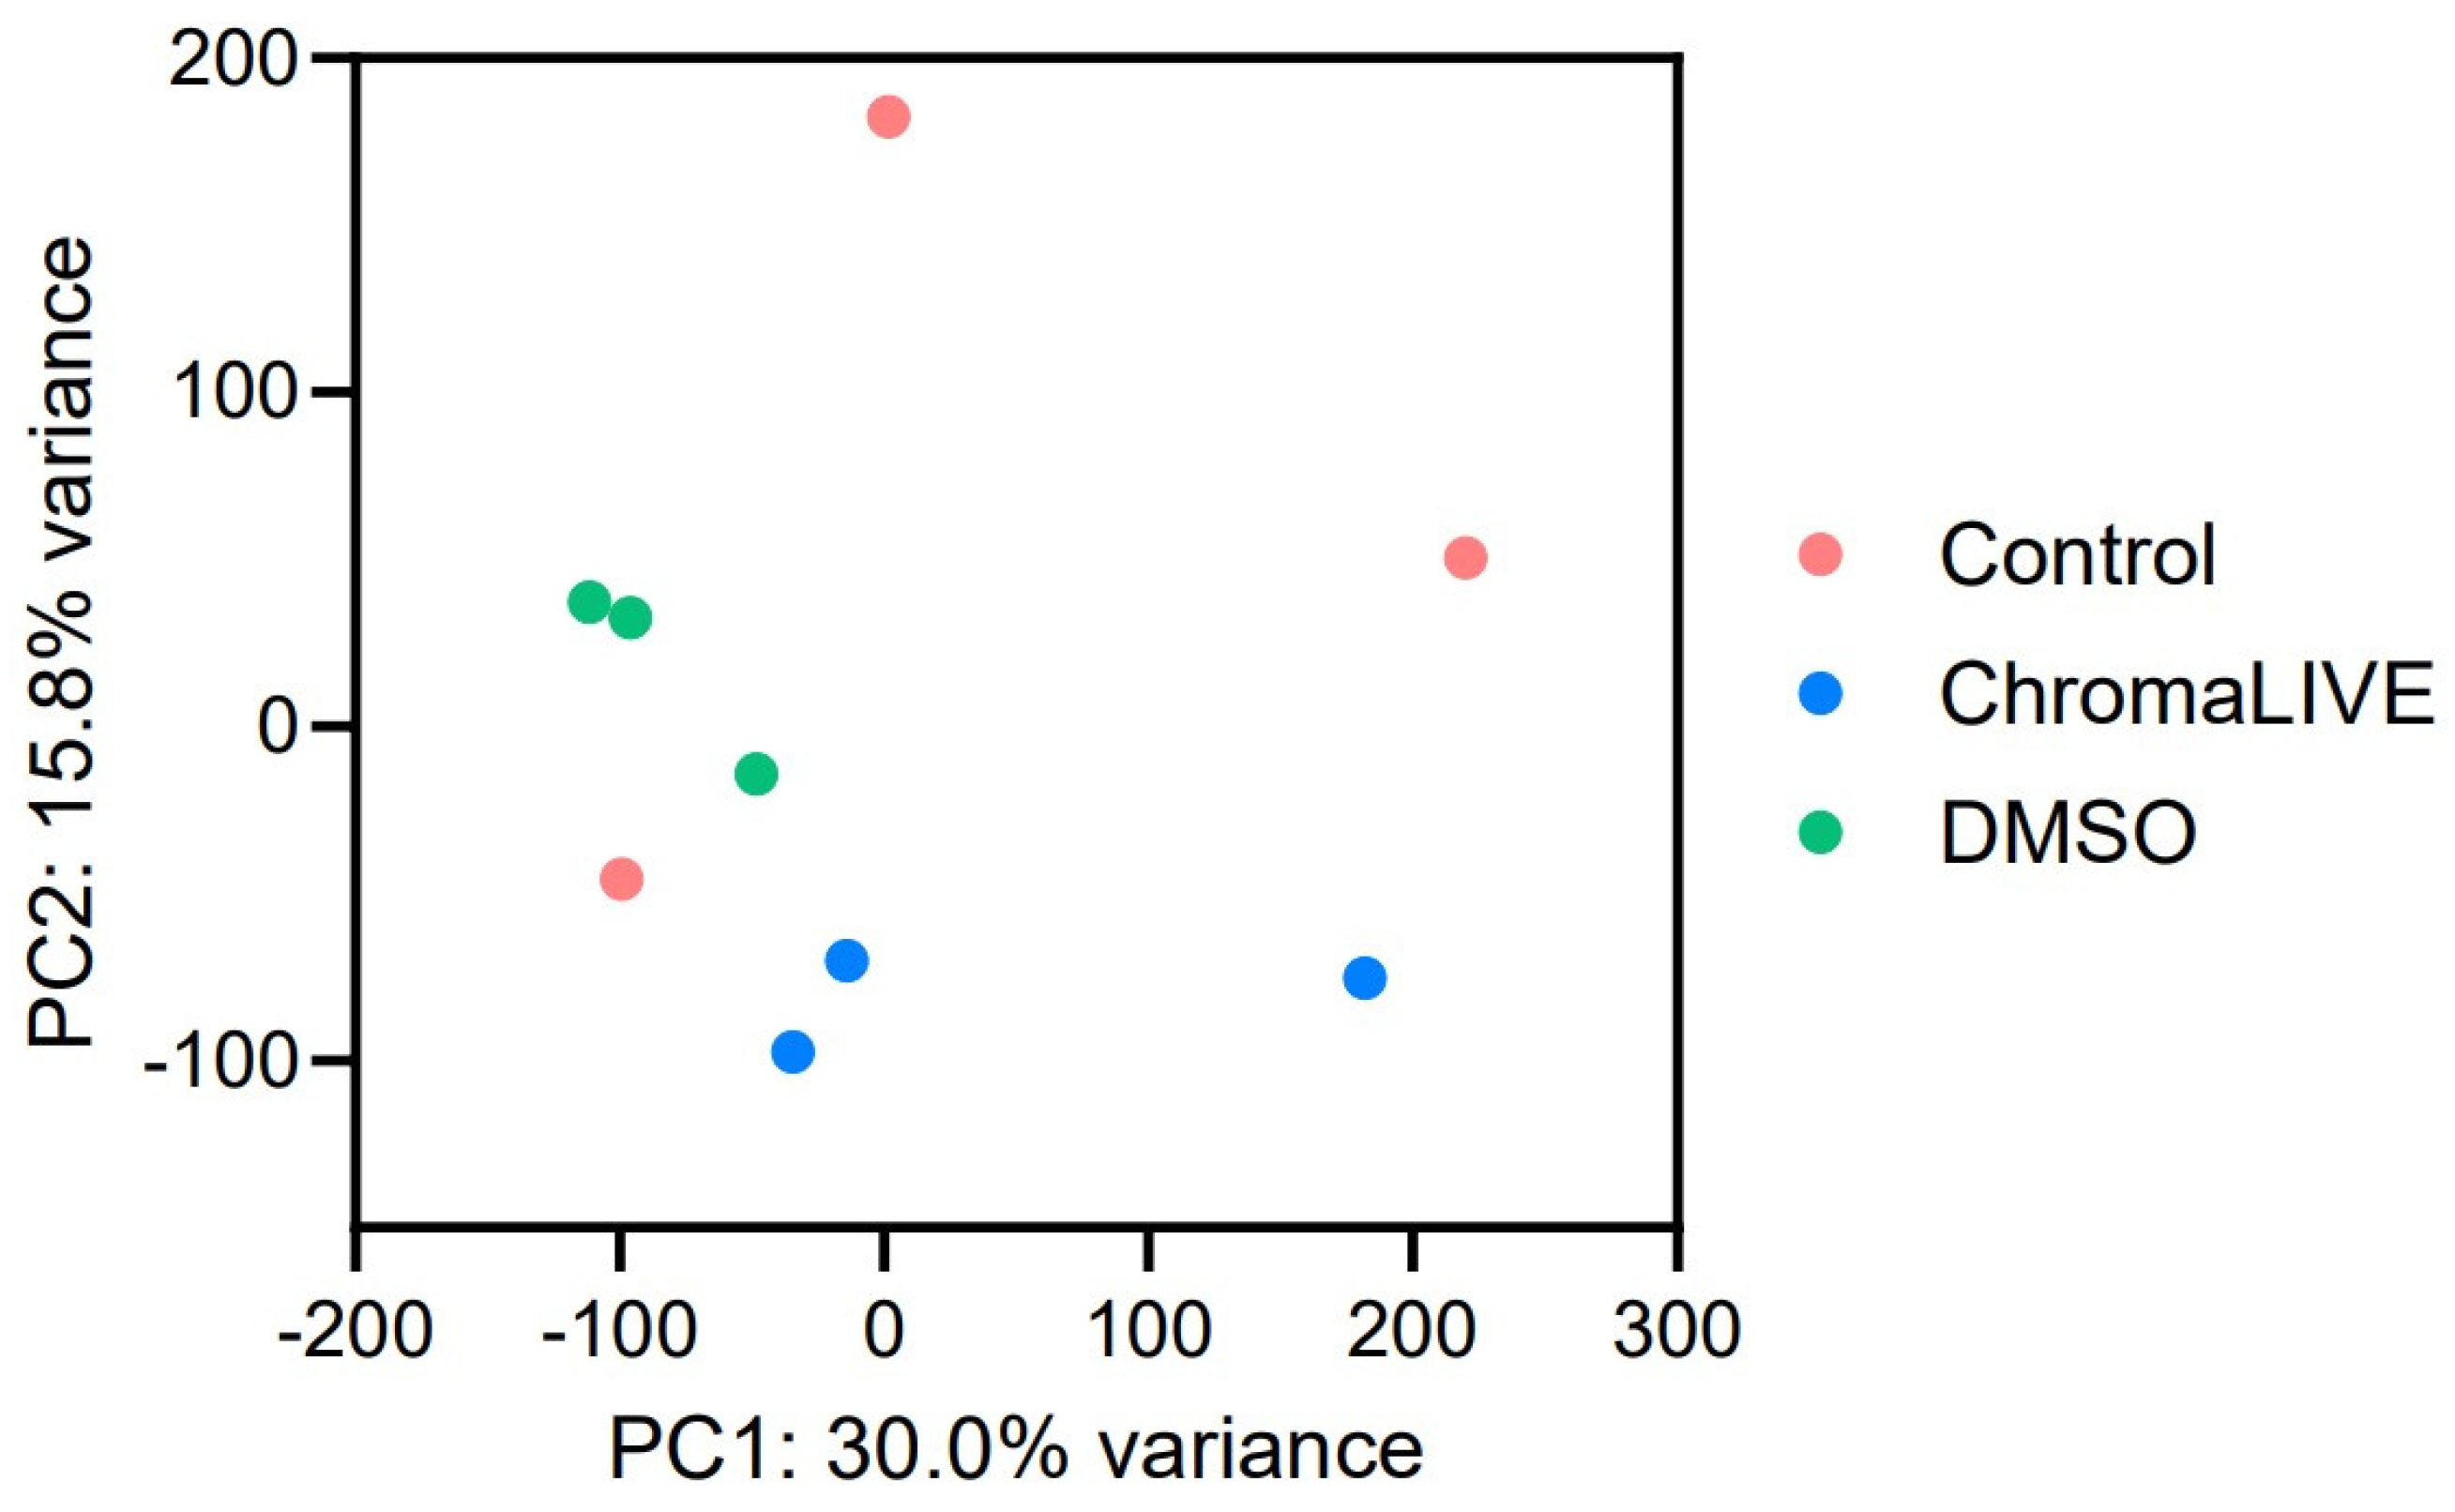
PCA was performed to evaluate global variance in gene expression across experimental groups (Figure 2). The distribution of samples in PCA space did not reveal distinct clustering associated with treatment condition. In particular, the first principal component (PC1), which explains approximately 30.0% of the total variance, did not separate ChromaLIVE™-treated, DMSO, and control samples. Overall, substantial overlap was observed among all groups across the first two principal components (PC1: 30.0%; PC2: 15.8%). Notably, greater dispersion was observed among control replicates along PC2 compared with ChromaLIVE™ and DMSO groups.
Figure 2.
Principal Component Analysis of gene expression profiles. PCA was performed on variance-stabilized counts from all samples. The first two principal components are shown, explaining 30.0% and 15.8% of the total variance, respectively. n = 3 embryos per condition.
3.3.3. Differential Expression Results
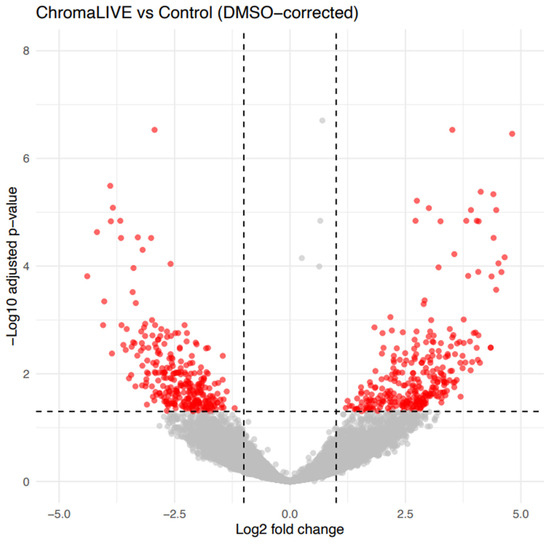
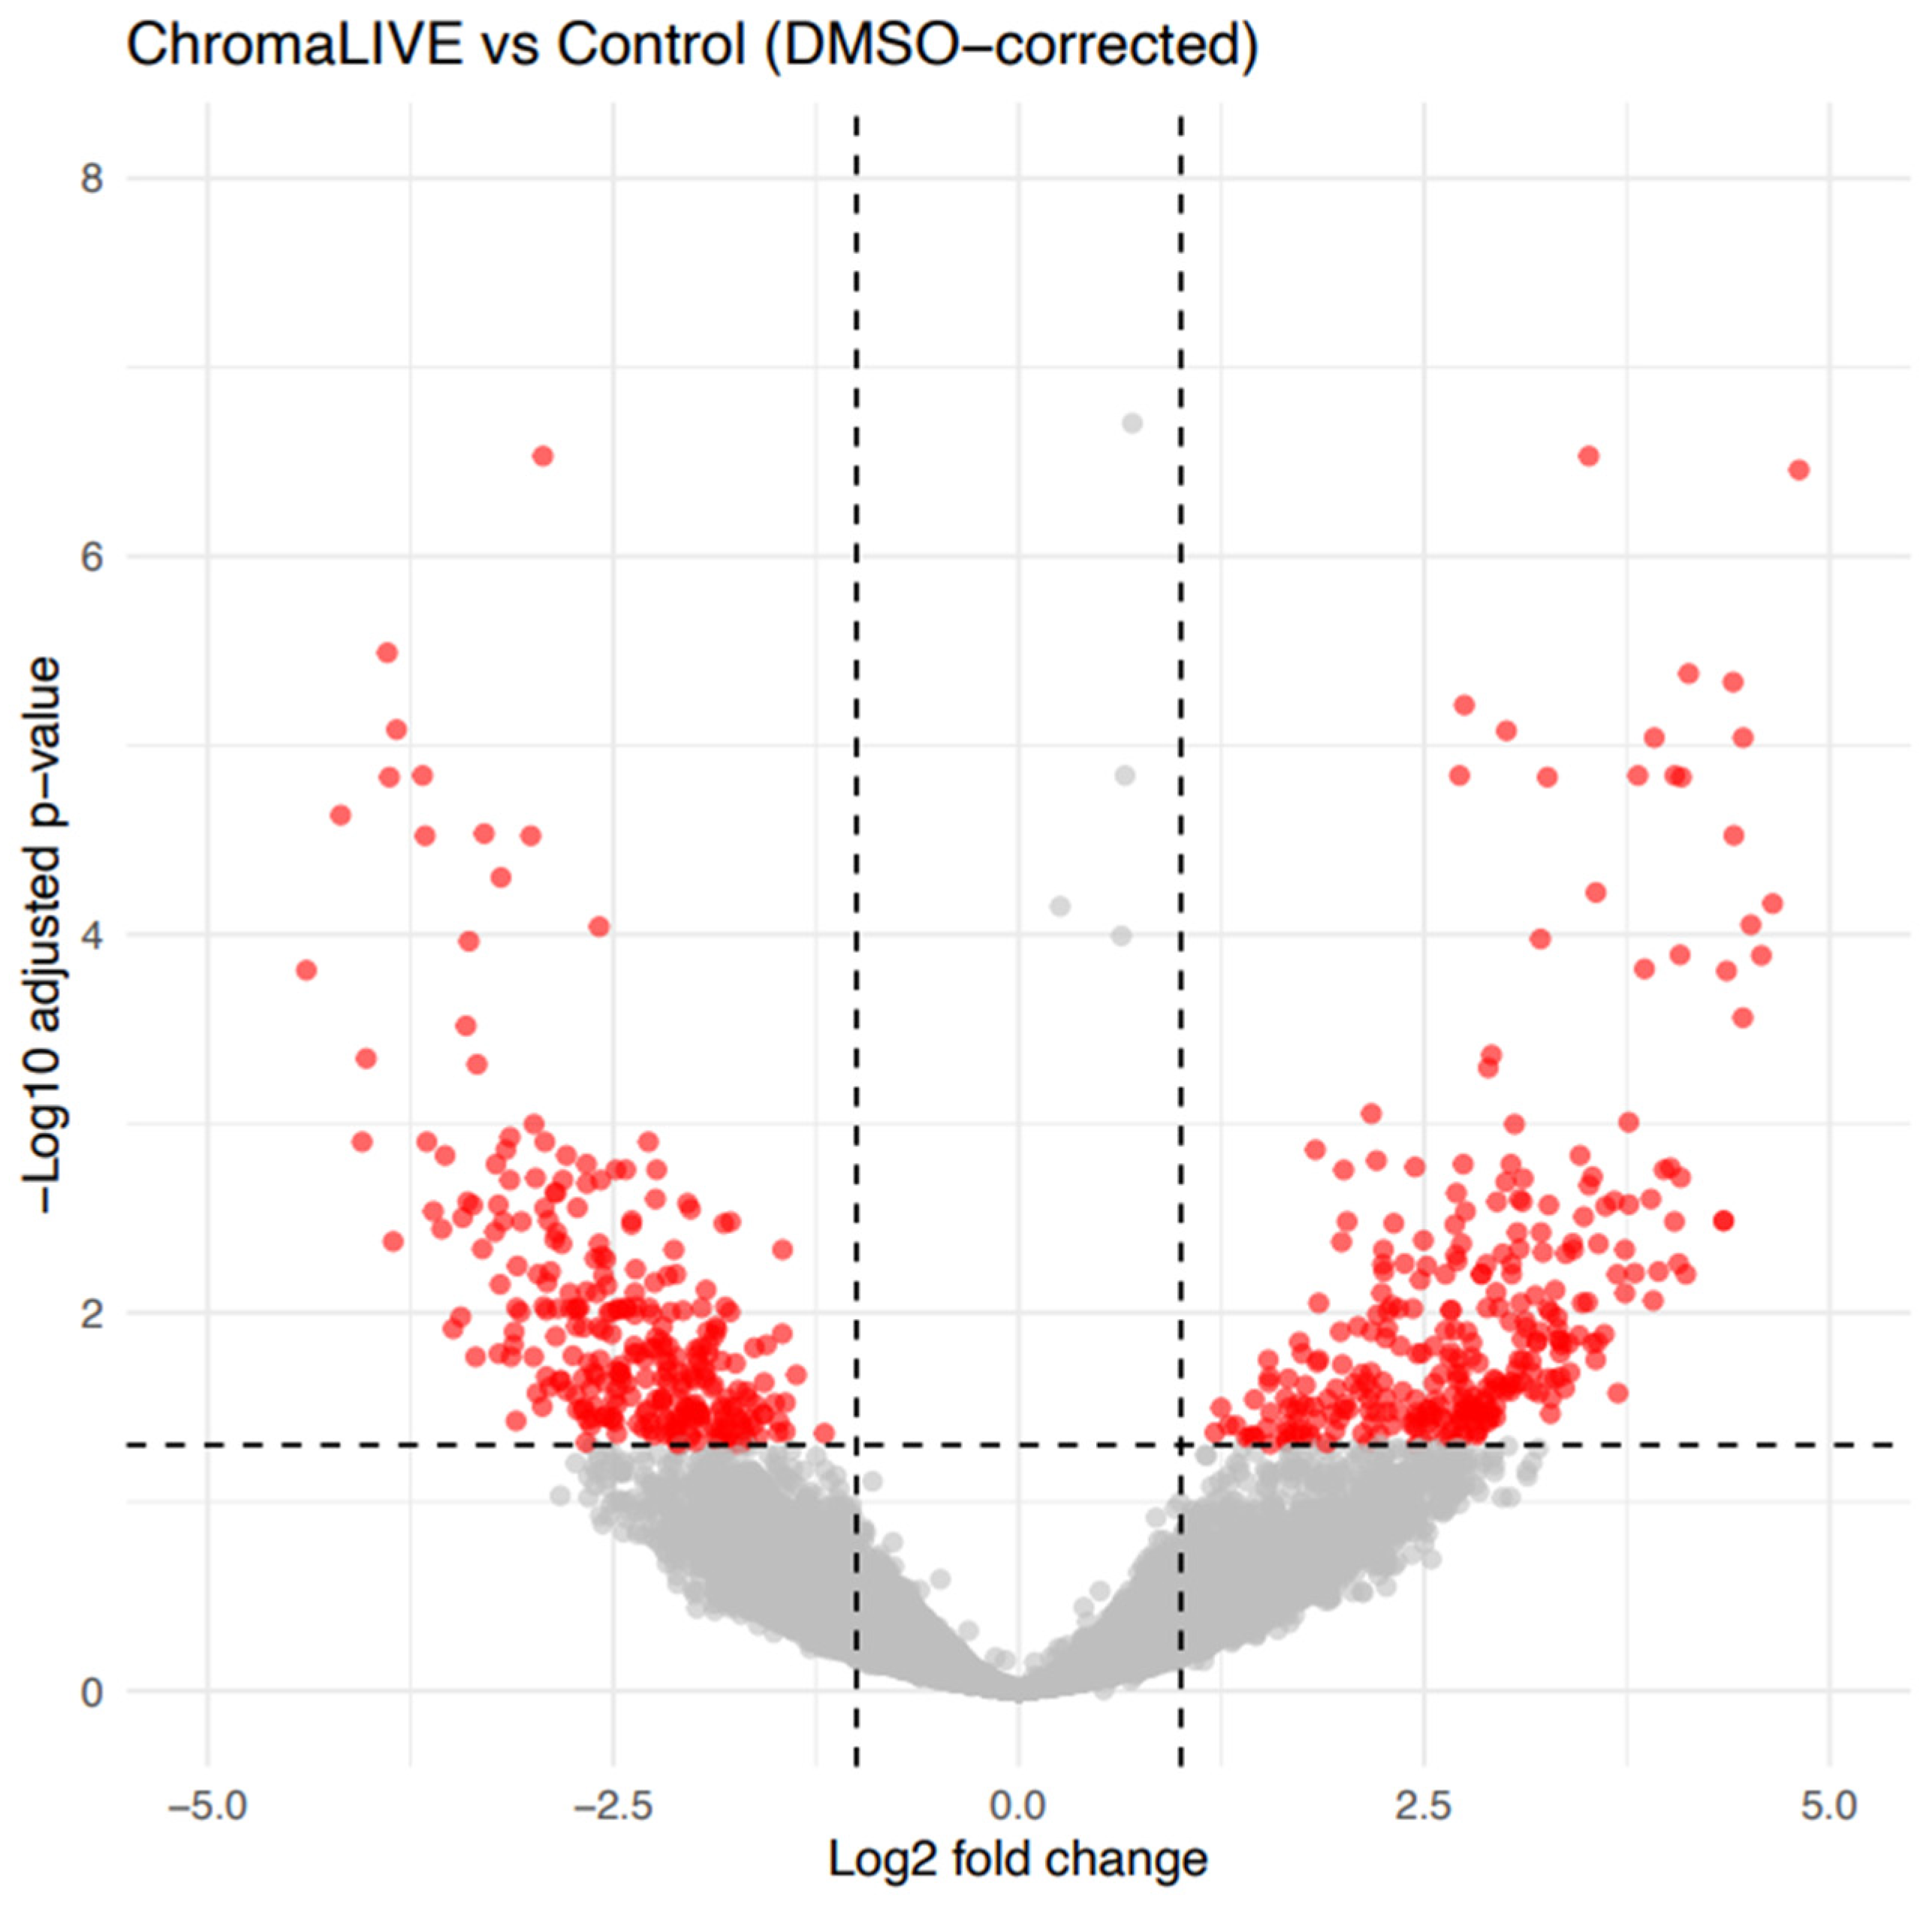
Consistent with the PCA results, differential expression analysis revealed a limited set of transcriptional changes associated with ChromaLIVE™ exposure. A total of 556 genes met differential expression criteria (FDR < 0.05 and |log2FC| > 1), representing approximately 0.72% of the expressed transcriptome (556/77,179 genes). Among these, 285 genes were upregulated and 271 were downregulated. While these represent a small fraction of detected features, they include genes associated with developmental and metabolic processes (Figure 3).
Figure 3.
Volcano plot of differential gene expression in ChromaLIVETM–stained embryos. The volcano plot displays DEGs in ChromaLIVETM condition compared to the Ctrl after correction for the DMSO solvent effect. The x-axis corresponds to the log2 fold change (log2FC), and the y-axis represents the −log10 adjusted p-value (FDR: False Discovery Rate). Red dots indicate DEGs meeting both statistical and biological thresholds (FDR < 0.05 and |log2FC| > 1), and gray dots represent genes that are not significantly differentially expressed (ns). Vertical dashed lines mark log2FC cutoffs, and the horizontal dashed line indicates the significance threshold (FDR = 0.05).
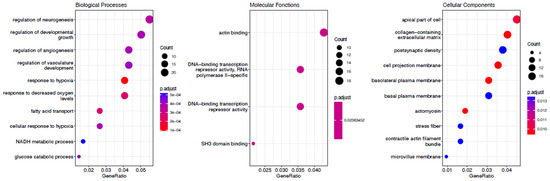
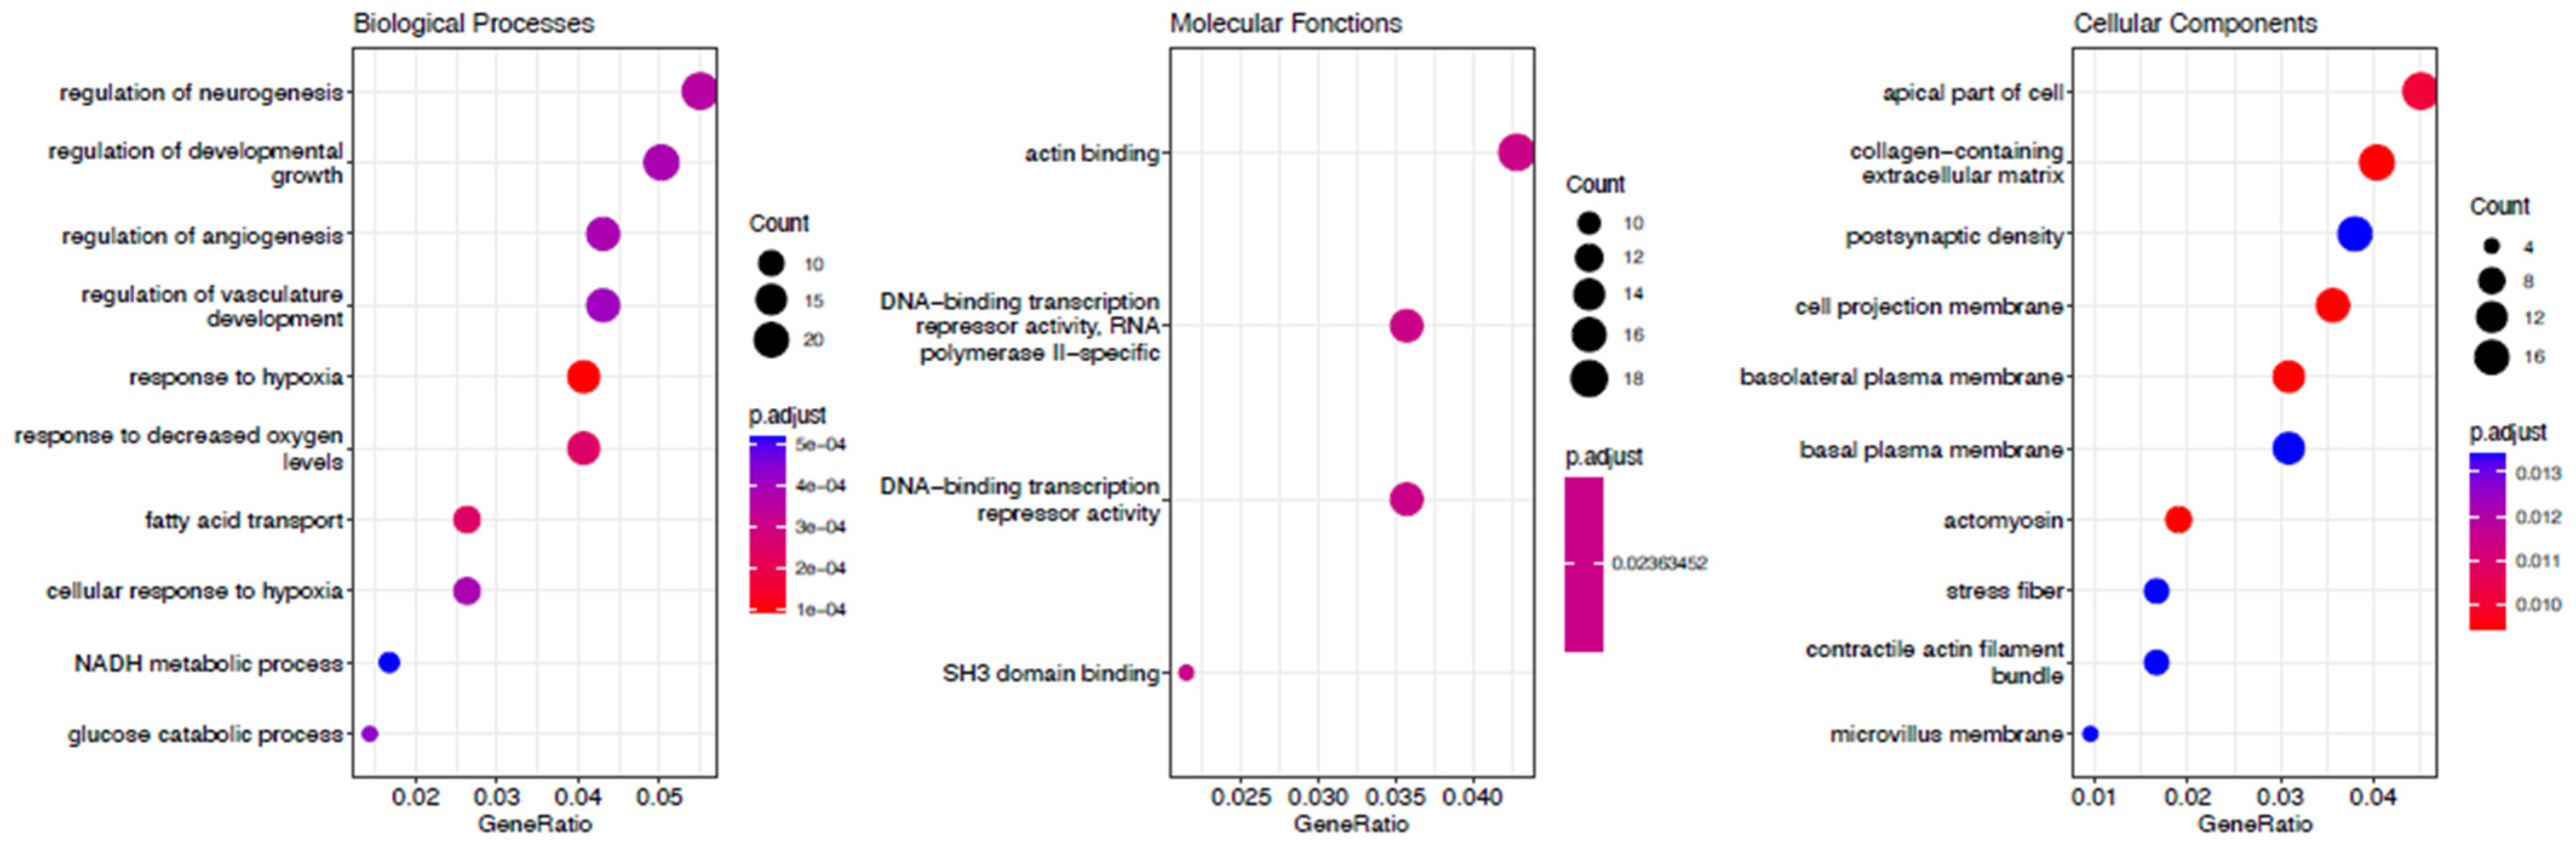
Among the most significantly upregulated genes were Itgb3, Slc2a1, Sema4c, Sbsn, and Prlr, representing transcripts involved in cellular adhesion, glucose transport, developmental signaling, epithelial differentiation, and hormone-responsive pathways (Figure 4). Conversely, strongly downregulated genes included Txnip, Mrs2, and Npr3, which participate in redox regulation, mitochondrial function, and signaling pathways (Figure 4). Importantly, these genes span diverse biological processes rather than clustering within a single functional pathway or stress-response program (Figure 4).
Figure 4.
Gene Ontology enrichment analysis of differentially expressed genes in ChromaLIVE™-treated samples. Dot plots represent significantly enriched GO terms among DEGs (FDR < 0.05, |log2FC| > 1) for the three main ontologies: Biological Processes (left), Molecular Functions (center), and Cellular Components (right). Dot size indicates the number of genes associated with each term, while color reflects the adjusted p-value (Benjamini–Hochberg).
Enrichment analysis indicated that differentially expressed genes were associated with developmental growth, hypoxia, vasculature development, and metabolism (Figure 4). Canonical apoptosis- and stress-response transcripts were not prominently represented.
4. Discussion
In this study, we evaluated the effect of ChromaLIVE™ exposure on preimplantation mouse embryo development and morphokinetics in a time-lapse live-cell imaging culture system. Overall, embryos cultured in the presence of ChromaLIVE™ demonstrated comparable blastocyst formation rates and blastocyst quality to those cultured under standard conditions. These findings indicate that live embryos staining with this fluorescent probe over an extended culture period does not impair their ability to reach the blastocyst stage nor compromise morphological quality. Similar observations of preserved developmental competence following exposure to low-toxicity live-cell dyes have been reported in other mammalian embryo and stem-cell models [25,26,27,28].
Despite these comparable global outcomes, differences in early developmental kinetics were observed. While most developmental stages were unaffected, embryos exposed to ChromaLIVE exhibited delayed timing at early cleavage events (t3) and onset of blastulation (tSB). In contrast, other cleavage events from t4 to stages associated with compaction (tSC and tEC) occurred within a timeframe comparable to controls, indicating preservation of the overall development kinetics.
The observed delays may reflect a transient cellular adaptation to the presence of the dye, rather than toxic effects. Potential contributing factors may include metabolic adaptations or alterations in redox homeostasis. An additional factor that could have contributed to the kinetic delay is the solvent of ChromaLIVE™ dye. The working solution contains 0.1% DMSO, which may affect developmental timing [29,30]. To isolate dye-specific transcriptional responses from vehicle-related effects, our transcriptomic analysis included a DMSO-only control group. While DMSO alone induced minimal transcriptional changes, the combination of dye and solvent may underlie the observed transient kinetic delay. The vehicle was further controlled in the transcriptomic experiment, which revealed a DMSO-specific effect on development. The early-cleavage delays (t3) resolved by the blastocyst stage are consistent with a transient rather than sustained effect.
From a regulatory perspective, these early kinetic differences are inconsequential because they did not impair developmental competence. The two-cell mouse embryo assay (MEA) is a non-binding guidance developed to detect embryotoxic contaminants in culture media and reagents [31,32]; the present study was not designed as a formal MEA compliance assessment, and this specific threshold is therefore not used here as a pass/fail criterion. The blastocyst formation rate obtained for the ChromaLIVE™ group (73.4%) falls within the broader range of acceptance limits (≥70–80%) employed in contemporary quality-control practice and peer-reviewed literature [33], and the two groups did not differ significantly in blastocyst formation. Moreover, the absence of significant differences in later time points, including t4 to stages associated with compaction, suggests that embryos are able to compensate for early kinetic delays. This developmental plasticity aligns with existing evidence that mammalian embryos can recover from moderate stressors, as long as critical cellular thresholds are not exceeded [34,35,36]. Preimplantation embryos are particularly sensitive to environmental perturbations during early cleavage, when epigenetic reprogramming and metabolic shifts occur [37]. However, these shifts did not persist into later milestones in our study.
At the molecular level, transcriptomic profiling of ChromaLIVE™-exposed embryos, corrected for the DMSO solvent effect, identified 556 differentially expressed genes (285 upregulated, 271 down-regulated), representing less than 1% of the expressed transcriptome. The limited proportion of affected transcripts, together with the balanced distribution of up- and down-regulated genes, indicates that ChromaLIVE™ exposure induces modest transcriptional changes. Interestingly, the differentially expressed genes do not belong to signaling pathways associated with cellular viability, embryonic development, or other critical processes responsible for embryo integrity (Figure 4), thereby reinforcing the hypothesis that ChromaLIVE™ exerts no toxic effect. Importantly, global transcriptional profiles showed no distinct clustering of stained embryos compared with DMSO-only and unstained samples, while greater variability was observed among control replicates, suggesting that intrinsic biological heterogeneity outweighed any dye-related transcriptional effects. Collectively, these findings indicate that ChromaLIVE™ does not produce major transcriptomic perturbations under the conditions tested. Prior validation of the dye in other live-cell imaging studies using diverse cell types further supports its favorable safety profile [12,13,17,18,19,20,21].
Future studies should focus on optimizing the application of ChromaLIVE™ in embryology by refining imaging parameters such as exposure duration, excitation intensity, imaging frequency and evaluating formulations with reduced DMSO content to further minimize potential DMSO effects on highly sensitive cellular models. Adjustment of fluorescence imaging settings to minimize light exposure frequency has been shown to reduce phototoxic effects in gametes and embryos [38,39], and may further attenuate the observed early kinetic delays while preserving imaging quality. Investigating additional molecular and cellular responses, such as mitochondrial function, reactive oxygen species production, spindle integrity, and DNA-damage markers, would provide deeper insight into the cellular adaptations associated with kinetic live imaging. In addition, epigenetic analyses of embryos cultured with and without ChromaLIVE™ would determine whether transient kinetic shifts are associated with persistent changes in DNA methylation patterns relevant to post-implantation development.
Beyond demonstrating biocompatibility, our results also highlight the imaging performance and biological informativeness of ChromaLIVE™. Although the mechanisms underlying ChromaLIVE™ redistribution during embryo development remain to be established, the broad staining patterns observed throughout embryo development are consistent with the reported physicochemical properties of this dye [13]. Unlike conventional targeted probes that bind covalently to specific molecular targets or require enzymatic activation, ChromaLIVE™ operates via a molecular rotor mechanism and is highly sensitive to the viscosity and polarity of the local physicochemical environment. Consequently, changes in intracellular properties can result in changes in fluorescence intensity and staining pattern across its different spectral channels. This complementary information on cellular membranes and intracellular compartments may explain the ability of this dye to simultaneously visualize multiple embryonic structures. In the present study, the dye enabled consistent, high-resolution visualization of multiple cellular compartments throughout preimplantation development, including blastomere membranes and cytoplasm during early cleavage, as well as trophectoderm, inner cell mass, and blastocoel formation at the blastocyst stage. This multiplex structural resolution provides spatial and temporal information that is typically difficult to obtain using conventional live-cell dyes, which often label only single organelles or require complex staining procedures. Compared with label-free approaches such as phase-contrast or differential interference contrast (DIC) microscopy, ChromaLIVE™ resolves individual blastomeres and delineates membranes, cytoplasm, and specific structures in three dimensions and over time. This facilitates tasks that are difficult with label-free imaging alone, such as counting cells and tracking defined cellular structures. The ability to simultaneously resolve multiple embryonic compartments in a non-invasive manner enhances interpretability of developmental dynamics and may facilitate quantitative morphokinetic analyses and computational image-based phenotyping. Thus, ChromaLIVE™ offers substantial analytical value for studying embryo architecture and developmental processes in real time.
Several limitations of this study should be considered when interpreting these findings. The morphokinetic experiment did not include a dedicated DMSO-matched cohort; consequently, dye- and vehicle-specific effects on morphokinetic data cannot be fully disentangled from the present design. Embryo numbers, particularly for the transcriptomic analysis (n = 3 per condition), limit statistical power and should be considered when interpreting the differential expression results. Embryo quality was assessed morphologically rather than through quantitative live/dead cell counts, and confocal imaging was performed at 20× magnification, which, while sufficient to address the present research questions, does not resolve subcellular detail achievable at higher magnification. Finally, as noted above, the F1 hybrid strain used here develops more robustly in vitro than inbred strains, so the tolerance observed may not generalize without confirmation in additional genetic backgrounds.
Extending analyses beyond the blastocyst stage is essential to assess potential influence of ChromaLIVE™ on implantation success, early placentation, or fetal development. Longitudinal studies, including embryo transfer into pseudo-pregnant murine recipient females, are necessary to evaluate implantation rates and post-implantation outcomes. Because F1 hybrid embryos are more robust in vitro than inbred embryos, the developmental tolerance observed here may not fully generalize to inbred strains; confirmation in such strains would be a useful extension. Finally, as non-invasive embryo assessment through live-cell imaging technologies becomes increasingly integrated into assisted reproduction, standardized frameworks for safety validation of fluorescent probes across laboratories, culture systems, and imaging platforms will be essential [40,41]. In this context, the application of ChromaLIVE™ in AI-based embryology studies represents a promising future direction, offering high-quality and high-content time-resolved data to train predictive algorithms for embryo selection. Overall, our results indicate that, under the conditions tested, ChromaLIVE™ enables high-resolution live imaging for tracking embryo development with no evidence of a major impact on blastocyst formation or quality, while producing a limited transcriptional response. Nonetheless, careful interpretation and further validation remain essential when extending live-cell imaging assays beyond preimplantation stages.
5. Conclusions
This study highlights the feasibility of using ChromaLIVE™, a fluorescent marker for continuous tracking of embryos without impairing their development or blastocyst quality. Although slight differences in early cleavage kinetics were observed, RNAseq analysis evidenced that these variations reflect benign molecular and cellular adaptations, confirming the marker’s safety at both the phenotypic and molecular levels. These findings validate this marker as a robust tool for high-resolution embryo imaging, with potential applications in reproductive research and AI-driven embryo assessment.
Supplementary Materials
The following supporting information can be downloaded at: https://www.mdpi.com/article/10.3390/jdb14030039/s1. Video S1: Video of a ChromaLIVETM embryo development.
Author Contributions
Conceptualization, D.M., K.A., S.M. and I.B.; methodology, D.M., K.A., S.M. and I.B.; software, S.M., K.A. and I.B.; validation, K.A. and, S.M.; investigation, D.M. and K.A.; resources, D.M., S.M. and I.B.; writing—original draft preparation, D.M., S.M. and I.B.; writing—review and editing, D.M., S.M., I.B., M.-H.G.-P., P.M. and M.B.; visualization, K.A.; supervision, S.M., D.M. and I.B. All authors have read and agreed to the published version of the manuscript.
Funding
This research received no external funding.
Institutional Review Board Statement
This study did not require ethical approval.
Informed Consent Statement
Not applicable.
Data Availability Statement
Data Availability Statements are available internally.
Acknowledgments
We warmly acknowledge the embryology staff who assisted in embryo culture and handling.
Conflicts of Interest
I.B. is affiliated with Saguaro Biosciences, the company that develops and commercializes ChromaLIVE™. The company had no role in the design of the study, in the collection, analyses, or interpretation of data. The remaining authors declare no conflicts of interest.
References
- Reichmann, J.; Eguren, M.; Lin, Y.; Schneider, I.; Ellenberg, J. Live imaging of cell division in preimplantation mouse embryos using inverted light-sheet microscopy. Methods Cell Biol. 2018, 145, 279–292. [Google Scholar] [CrossRef] [Scilit] [PubMed]
- Strnad, P.; Gunther, S.; Reichmann, J.; Krzic, U.; Balazs, B.; de Medeiros, G.; Norlin, N.; Hiiragi, T.; Hufnagel, L.; Ellenberg, J. Inverted light-sheet microscope for imaging mouse pre-implantation development. Nat. Methods 2016, 13, 139–142. [Google Scholar] [CrossRef] [Scilit] [PubMed]
- McDole, K.; Guignard, L.; Amat, F.; Berger, A.; Malandain, G.; Royer, L.A.; Turaga, S.C.; Branson, K.; Keller, P.J. In toto imaging and reconstruction of post-implantation mouse development at the single-cell level. Cell 2018, 175, 859–876.e33. [Google Scholar] [CrossRef] [Scilit] [PubMed]
- Høgset, H.; Horgan, C.C.; Armstrong, J.P.K.; Bergholt, M.S.; Torraca, V.; Chen, Q.; Keane, T.J.; Bugeon, L.; Dallman, M.J.; Mostowy, S.; et al. In vivo biomolecular imaging of zebrafish embryos using confocal Raman spectroscopy. Nat. Commun. 2020, 11, 6172. [Google Scholar] [CrossRef] [Scilit] [PubMed]
- Chow, D.J.X.; Tan, T.C.Y.; Upadhya, A.; Lim, M.; Dholakia, K.; Dunning, K.R. Viewing early life without labels: Optical approaches for imaging the early embryo. Biol. Reprod. 2024, 110, 1157–1174. [Google Scholar] [CrossRef] [Scilit] [PubMed]
- Morawiec, S.; Ajduk, A.; Stremplewski, P.; Kennedy, B.F.; Szkulmowski, M. Full-field optical coherence microscopy enables high-resolution label-free imaging of the dynamics of live mouse oocytes and early embryos. Commun. Biol. 2024, 7, 1057. [Google Scholar] [CrossRef] [Scilit] [PubMed]
- Ghosh, B.; Agarwal, K. Viewing life without labels under optical microscopes. Commun. Biol. 2023, 6, 559. [Google Scholar] [CrossRef] [Scilit] [PubMed]
- Khodavirdilou, R.; Pournaghi, M.; Oghbaei, H.; Rastgar Rezaei, Y.; Javid, F.; Khodavirdilou, L.; Shakibfar, F.; Latifi, Z.; Hakimi, P.; Nouri, M.; et al. Toxic effect of light on oocyte and pre-implantation embryo: A systematic review. Arch. Toxicol. 2021, 95, 3161–3169. [Google Scholar] [CrossRef] [Scilit] [PubMed]
- Fu, Y.; Zhang, X.; Wu, L.; Wu, M.; James, T.D.; Zhang, R. Bioorthogonally activated probes for precise fluorescence imaging. Chem. Soc. Rev. 2025, 54, 201–265. [Google Scholar] [CrossRef] [Scilit] [PubMed]
- Kardash, E.; Reichman-Fried, M.; Maître, J.L.; Boldajipour, B.; Papusheva, E.; Messerschmidt, E.M.; Heisenberg, C.P.; Raz, E. A role for Rho GTPases and cell-cell adhesion in single-cell motility in vivo. Nat. Cell Biol. 2010, 12, 47–53. [Google Scholar] [CrossRef] [Scilit] [PubMed]
- DuBuc, T.Q.; Dattoli, A.A.; Babonis, L.S.; Salinas-Saavedra, M.; Röttinger, E.; Martindale, M.Q.; Postma, M. In vivo imaging of Nematostella vectensis embryogenesis and late development using fluorescent probes. BMC Cell Biol. 2014, 15, 44. [Google Scholar] [CrossRef] [Scilit] [PubMed]
- Lopez Serrano, C.; Bilem, I.; Findley, T.; Goldberg, I.; Laroche, G.; Durrieu, M.C. Integrating ChromaLIVE™ dye with an AI-powered image analysis for real-time monitoring of human mesenchymal stem cells differentiation. Biochem. Biophys. Rep. 2025, 43, 102174. [Google Scholar] [CrossRef] [Scilit] [PubMed]
- Cottet, M.; Marrero, Y.F.; Mathien, S.; Audette, K.; Lambert, R.; Bonneil, E.; Chng, K.; Campos, A.; Andrews, D.W. Live Cell Painting: New nontoxic dye to probe cell physiology in high content screening. SLAS Discov. 2023, 29, 100121. [Google Scholar] [CrossRef] [Scilit] [PubMed]
- Choy, E.; Chiu, V.K.; Silletti, J.; Feoktistov, M.; Morimoto, T.; Michaelson, D.; Ivanov, I.E.; Philips, M.R. Endomembrane trafficking of Ras: The CAAX motif targets proteins to the ER and Golgi. Cell 1999, 98, 69–80. [Google Scholar] [PubMed]
- Hirota, N.; Yasuda, D.; Hashidate, T.; Yamamoto, T.; Yamaguchi, S.; Nagamune, T.; Nagase, T.; Shimizu, T.; Nakamura, M. Amino acid residues critical for endoplasmic reticulum export and trafficking of platelet-activating factor receptor. J. Biol. Chem. 2010, 285, 5931–5940. [Google Scholar] [CrossRef] [Scilit] [PubMed]
- Pendergraft, S.S.; Sadri-Ardekani, H.; Atala, A.; Bishop, C.E. Three-dimensional testicular organoid: A novel tool for the study of human spermatogenesis and gonadotoxicity in vitro. Biol. Reprod. 2017, 96, 720–732. [Google Scholar] [CrossRef] [Scilit] [PubMed]
- Li, M.X.; Brito, G.C.; Ylanko, J.; Buzina, A.; Leber, B.; Usta, S.; Tsui, H.; Spaner, D.E.; Andrews, D.W. High-content imaging of primary chronic lymphocytic leukemia cells predicts patient cohorts with distinct cellular drug responses. iScience 2025, 28, 114216. [Google Scholar] [CrossRef] [Scilit] [PubMed]
- Sivagurunathan, S.; Byrne, P.; Muñoz, A.F.; Arevalo, J.; Carpenter, A.E.; Singh, S.; Kost Alimova, M.; Cimini, B.A. Alternate dyes for image-based profiling assays. SLAS Discov. 2025, 36, 100268. [Google Scholar] [CrossRef] [Scilit] [PubMed]
- Lippincott, M.J.; Tomkinson, J.; Bilem, I.; Suzuki, M.; Nakde, A.; Endou, T.; Mathien, S.; Lavoie-Perusse, F.; Basualto-Alarcón, C.; Way, G.P. High-content live-cell time-lapse imaging predicts cells about to die via apoptosis. bioRxiv 2025. [Google Scholar] [CrossRef] [Scilit]
- Liu, C.; Hillsley, A.; Sekhar, M.; Jones, C.A.; Sturm, G.; Fujimori, T.; Wiene, D.M.; Cheng, K.W.; Chandler, T.; Lin, A.; et al. A multimodal perturbation atlas defines the phenotypic resolution of cellular morphology. bioRxiv 2026. [Google Scholar] [CrossRef] [Scilit]
- Dubinsky, D.; Harel, S.; Bein, A.; Nyska, A.; Ya’ari, S.; Koç, B.; Anas, F.; Bentwich, I.; Wolf, L. Non-invasive quantification of viability in liver spheroids using deep learning. Front. Bioeng. Biotechnol. 2026, 14, 1797474. [Google Scholar] [CrossRef] [Scilit] [PubMed]
- ESHRE Working Group on Time-Lapse Technology; Apter, S.; Ebner, T.; Freour, T.; Guns, Y.; Kovacic, B.; Le Clef, N.; Marques, M.; Meseguer, M.; Montjean, D.; et al. Good practice recommendations for the use of time-lapse technology. Hum. Reprod. Open 2022, 2020, hoaa008. [Google Scholar]
- Gardner, D.K.; Lane, M. Culture and selection of viable blastocysts: A feasible proposition for human IVF? Hum. Reprod. Update 1997, 3, 367–382. [Google Scholar] [CrossRef] [Scilit] [PubMed]
- Gardner, D.K.; Reed, L.; Linck, D.; Sheehan, C.; Lane, M. Quality control in human in vitro fertilization. Semin. Reprod. Med. 2005, 23, 319–324. [Google Scholar] [CrossRef] [Scilit] [PubMed]
- Squirrell, J.M.; Wokosin, D.L.; White, J.G.; Bavister, B.D. Long-term two-photon fluorescence imaging of mammalian embryos without compromising viability. Nat. Biotechnol. 1999, 17, 763–767. [Google Scholar] [CrossRef] [Scilit] [PubMed]
- Marikawa, Y. Toward better assessments of developmental toxicity using stem cell-based in vitro embryogenesis models. Birth Defects Res. 2022, 114, 972–982. [Google Scholar] [CrossRef] [Scilit] [PubMed]
- Abdulhasan, M.; Ruden, X.; You, Y.; Harris, S.M.; Ruden, D.M.; Awonuga, A.O.; Alvero, A.; Puscheck, E.E.; Rappolee, D.A. Using live imaging and FUCCI embryonic stem cells to rank DevTox risks: Adverse growth effects of PFOA compared with DEP are 26 times faster, 1,000 times more sensitive, and 13 times greater in magnitude. Front. Toxicol. 2021, 3, 709747. [Google Scholar] [CrossRef] [Scilit] [PubMed]
- Li, M.; Gong, J.; Gao, L.; Zou, T.; Kang, J.; Xu, H. Advanced human developmental toxicity and teratogenicity assessment using human organoid models. Ecotoxicol. Environ. Saf. 2022, 238, 113429. [Google Scholar] [CrossRef] [Scilit] [PubMed]
- Kang, M.-H.; You, S.-Y.; Hong, K.; Kim, J.-H. DMSO impairs the transcriptional program for maternal-to-embryonic transition by altering histone acetylation. Biomaterials 2020, 230, 119604. [Google Scholar] [CrossRef] [Scilit] [PubMed]
- Verheijen, M.; Lienhard, M.; Schroeders, Y.; Clayton, O.; Nudischer, R.; Boerno, S.; Timmermann, B.; Selevsek, N.; Schlapbach, R.; Gmuender, H.; et al. DMSO induces drastic changes in human cellular processes and epigenetic landscape in vitro. Sci. Rep. 2019, 9, 4641. [Google Scholar] [CrossRef] [Scilit] [PubMed]
- Food and Drug Administration. Mouse Embryo Assay for Assisted Reproduction Technology Devices—Guidance for Industry and FDA Staff; FDA: Silver Spring, MD, USA, 2021. [Google Scholar]
- Agrawala, S.; David, A.; Kaskar, K.; Gibbons, W.; Cochran, R. Evaluating human embryo culture media performance using C57BL-6N mouse embryos. Fertil. Steril. 2021, 116, e7–e8. [Google Scholar] [CrossRef] [Scilit]
- Esfandiari, N.; Gubista, A. Mouse embryo assay for human in vitro fertilization quality control: A fresh look. J. Assist. Reprod. Genet. 2020, 37, 1123–1127. [Google Scholar] [CrossRef] [Scilit] [PubMed]
- Latham, K.E. Stress signaling in mammalian oocytes and embryos: A basis for intervention and improvement of outcomes. Cell Tissue Res. 2016, 363, 159–167. [Google Scholar] [CrossRef] [Scilit] [PubMed]
- Ramos-Ibeas, P.; Heras, S.; Gómez-Redondo, I.; Planells, B.; Fernández-González, R.; Pericuesta, E.; Laguna-Barraza, R.; Pérez-Cerezales, S.; Gutiérrez-Adán, A. Embryo responses to stress induced by assisted reproductive technologies. Mol. Reprod. Dev. 2019, 86, 96–108. [Google Scholar] [CrossRef] [Scilit] [PubMed]
- Pribenszky, C.; Vajta, G.; Molnár, M.; Du, Y.; Lin, L.; Bolund, L.; Yovich, J. Stress for stress tolerance? A fundamentally new approach in mammalian embryology. Biol. Reprod. 2010, 83, 690–697. [Google Scholar] [CrossRef] [Scilit] [PubMed]
- Chason, R.J.; Csokmay, J.; Segars, J.H.; DeCherney, A.H.; Armant, D.R. Environmental and epigenetic effects upon preimplantation embryo metabolism and development. Trends Endocrinol. Metab. 2011, 22, 412–420. [Google Scholar] [CrossRef] [Scilit] [PubMed]
- Hoebe, R.A.; Van Oven, C.H.; Gadella, T.W., Jr.; Dhonukshe, P.B.; Van Noorden, C.J.; Manders, E.M. Controlled light-exposure microscopy reduces photobleaching and phototoxicity in fluorescence live-cell imaging. Nat. Biotechnol. 2007, 25, 249–253. [Google Scholar] [CrossRef] [Scilit] [PubMed]
- Kiepas, A.; Voorand, E.; Mubaid, F.; Siegel, P.M.; Brown, C.M. Optimizing live-cell fluorescence imaging conditions to minimize phototoxicity. J. Cell Sci. 2020, 133, jcs242834. [Google Scholar] [CrossRef] [Scilit] [PubMed]
- Domingo-Muelas, A.; Skory, R.M.; Moverley, A.A.; Ardestani, G.; Pomp, O.; Rubio, C.; Tetlak, P.; Hernandez, B.; Rhon-Calderon, E.A.; Navarro-Sánchez, L.; et al. Human embryo live imaging reveals nuclear DNA shedding during blastocyst expansion and biopsy. Cell 2023, 186, 3166–3181.e18. [Google Scholar] [CrossRef] [Scilit] [PubMed]
- Akizawa, H.; Domingo-Muelas, A.; Pardo-Figuerez, M.; Hernandez, B.; Ardestani, G.; Skory, R.M.; Venturas, M.; Tetlak, P.; Bissiere, S.; Sakkas, D.; et al. Capturing aberrant cell behaviors producing defects in human embryos via live imaging. Sci. Adv. 2025, 11, eady6402. [Google Scholar] [CrossRef] [Scilit] [PubMed]

Disclaimer/Publisher’s Note: The statements, opinions and data contained in all publications are solely those of the individual author(s) and contributor(s) and not of MDPI and/or the editor(s). MDPI and/or the editor(s) disclaim responsibility for any injury to people or property resulting from any ideas, methods, instructions or products referred to in the content. |
© 2026 by the authors. Licensee MDPI, Basel, Switzerland. This article is an open access article distributed under the terms and conditions of the Creative Commons Attribution (CC BY) license.