


Abstract
University geospatial hubs support research dissemination, teaching, public data access, and community engagement, but their value depends on whether resources can be found, accessed, interpreted, integrated, and reused. This study evaluates 747 publicly listed items in North Carolina Central University’s CoDE Open Data Hub using FAIR principles as an interpretive framework and the Federal Geographic Data Committee Content Standard for Digital Geospatial Metadata (FGDC CSDGM) as the domain-specific measurement basis. Nineteen criteria were scored on explicit criterion-specific 0–2 rules using live ArcGIS item properties, formal metadata XML, and available layer properties. Discoverability was evaluated for a proportionally stratified sample of 153 items through exact-title, keyword, location, item-type, category-browsing, and click-depth tests. The equal-criterion benchmark averaged 28.57 of 38 (75.19%); equal FAIR-dimension weighting produced a mean of 73.26%, and 95.85% of items retained the same descriptive performance band. Independent rescoring of 50 stratified items produced 76.74% exact criterion-level agreement, a linear weighted Cohen’s kappa of 0.587, and an absolute-agreement ICC of 0.715 for total scores. FAIR-aligned scores were highest for Findability (87.25%) and Accessibility (85.96%), followed by Reusability (67.26%) and Interoperability (52.59%). Exact-title and item-type searches retrieved all sampled items, while keyword search was successful for 88.24%. The results distinguish public availability from technical reuse readiness and identify spatial reference, attribute definitions, lineage, limitations, category structure, and navigation depth as priorities. The performance bands are study-specific descriptive summaries rather than FGDC compliance levels or FAIR certification. The study provides an evidence-preserving, type-aware method for applying FAIR principles alongside geospatial metadata standards in heterogeneous ArcGIS Hub catalogs.
1. Introduction
Web-based geospatial platforms now serve as core components of spatial data infrastructures, allowing institutions to publish data, maps, applications, documents, and analytical products through searchable public catalogs. Within universities, these platforms also support teaching, research dissemination, student project publication, and community-engaged scholarship. Their usefulness, however, depends not only on the volume of available content but also on whether users can find, interpret, evaluate, and reuse individual resources [1,2,3,4].
Metadata is the principal mechanism through which these functions are supported. Clear titles, descriptions, keywords, geographic coverage, dates, source information, lineage, spatial reference, attribute definitions, distribution options, and use constraints determine whether a resource can be found, accessed, integrated, and reused. These concerns align with the FAIR principles, which frame effective data stewardship in terms of Findability, Accessibility, Interoperability, and Reusability [5]. Research on metadata quality has similarly emphasized completeness, accuracy, provenance, consistency, timeliness, and accessibility as conditions for effective discovery and reuse [6,7,8]. Large-scale studies of open data portals show that inconsistent or incomplete metadata reduces searchability, interoperability, and practical use [9,10,11,12,13].
These issues are especially relevant in ArcGIS Hub, where catalog search and item presentation depend on ArcGIS Online item details, categories, tags, sharing settings, and, when enabled, standards-based metadata. ArcGIS distinguishes between item information visible on the item page and fuller metadata records maintained through an organizational metadata style [14,15,16]. Consequently, an item may be publicly accessible and easy to open yet lack the technical documentation required for advanced geospatial analysis.
North Carolina Central University’s CoDE Open Data Hub is being developed as a university geospatial knowledge platform with support from NASA award 22-MUREPDEAP-0002 and National Science Foundation award 2226312. Part of this study measures the quality and discoverability of the catalog as it existed on 19 June 2026 and establishes a repeatable benchmark for subsequent development.
The study addresses three research questions:
- To what extent do current CoDE Hub items support Findability, Accessibility, Interoperability, and Reusability through the metadata evidence available in ArcGIS item records, formal metadata, and layer properties?
- How do FAIR-aligned and FGDC CSDGM-informed metadata scores vary across item types and individual criteria?
- How effectively can public users locate Hub items through exact-title, thematic, geographic, type-based, and category-based discovery pathways?
The study combines a complete catalog census, programmatic extraction of live ArcGIS metadata, a transparent 0–2 scoring framework, and a structured discoverability protocol. FAIR provides the organizing framework for interpretation, while FGDC CSDGM supplies the geospatial metadata elements used to construct measurable indicators.
2. Background and Conceptual Framework
2.1. University Geospatial Hubs as Spatial Data Infrastructure
University geospatial hubs occupy an intermediate position between institutional repositories, teaching environments, and public spatial data infrastructures. Unlike narrowly defined data catalogs, they commonly contain hosted feature layers, web maps, dashboards, StoryMaps, reports, images, instructional files, and project applications. This heterogeneity increases the range of audiences served but also complicates consistent description, governance, and discovery. The challenge is not simply to expose content online; it is to connect diverse resources to sufficient contextual and technical documentation so that they can be interpreted across levels of expertise [2,17,18].
2.2. Metadata Quality and Geospatial Reuse
Metadata quality is multidimensional. Completeness addresses whether expected elements are present; clarity and specificity address whether those elements are meaningful; provenance and lineage support evaluation of origin and processing; and accessibility determines whether metadata can be found and used. Bruce and Hillmann [6] conceptualized metadata quality as a continuum rather than a simple present-or-absent condition, while Ochoa and Duval [8] demonstrated that scalable assessment can combine automated measures with explicit quality rules. For open data portals, automated assessments have shown that weak descriptions, inaccessible resources, inconsistent formats, and incomplete licensing information remain common even in mature catalogs [4,9,10,13].
Geospatial metadata requires additional technical elements because the meaning and suitability of spatial data depend on location, coordinate reference, scale, geometry, time, attributes, and processing history. The FGDC Content Standard for Digital Geospatial Metadata (CSDGM), Version 2 (FGDC-STD-001-1998) [19], organizes these requirements into the following sections: identification, data quality, spatial data organization, spatial reference, entity and attribute, distribution, and metadata reference. Related standards, ISO 19157:2013 [20] and ISO 19115-1:2014 [21], formalize geographic data-quality and metadata concepts for contemporary spatial data infrastructures. Research on geospatial data quality further emphasizes that quality information must be structured and accessible in ways that support dynamic fitness-for-use decisions [22,23]. Although current federal practice also recognizes ISO metadata standards, CSDGM remains a useful operational framework for ArcGIS organizations that use the FGDC metadata style and for legacy or project-specific records that follow that structure.
The persistent cost of metadata authorship has also motivated automated and semi-automated approaches. These methods derive metadata from dataset structure, geometry, processing workflows, web resources, or publication services, but they generally retain a role for human review and item-specific contextualization [24,25,26,27,28,29]. Recent large-scale FAIR assessment work also demonstrates the value of a customized rubric, explicit applicability rules, calibration, and retained evidence when diverse data products are assessed consistently [30]. This distinction is central to the CoDE workflow: automation can improve coverage and consistency, but technical and interpretive fields still require accountable editorial judgment.
2.3. FAIR Principles as the Organizing Framework
The FAIR principles define four related goals for the stewardship of digital resources: they should be findable through rich metadata and searchable systems, accessible through clear retrieval mechanisms, interoperable through shared structures and representations, and reusable through sufficient contextual, licensing, provenance, and domain-specific information [5]. FAIR is intentionally general, so assessment requires indicators suited to the data community and technical environment. The Research Data Alliance FAIR Data Maturity Model therefore treats FAIR evaluation as a community-specific operationalization task in which indicators, priorities, applicability, and scoring procedures must be made explicit [31]. Recent analyses similarly show that FAIR assessment tools differ substantially in their metrics and that a metric may operationally assess a different or broader function than its declared FAIR dimension [30,32,33,34].
For geospatial resources, FAIR implementation depends on metadata that describe spatial reference, geometry, geographic coverage, attributes, distribution, provenance, and use conditions. Geospatial studies have likewise emphasized the role of standards and minimum information profiles in making spatial data and GIS products more interoperable and reusable [35,36]. In this study, FAIR provides the conceptual structure, while FGDC CSDGM provides the domain-specific content areas from which the 19 assessment criteria were derived. The resulting scores are FAIR-aligned measures of the evidence available in the Hub, not a formal certification against every FAIR sub-principle.
2.4. Discoverability as an Outcome of Metadata and Catalog Design
Discoverability concerns whether a user can identify and reach an appropriate resource through search or browsing. It is influenced by metadata content, catalog indexing, ranking, information architecture, and navigation burden. Studies of open data portals distinguish discoverability from mere technical availability: a resource can be public yet remain difficult to locate without an exact title or direct link [37]. Research on geospatial discovery systems identifies title, subject, place, format, spatial footprint, and faceted browsing as core retrieval elements [2], while usability experiments show that both metadata records and catalog interfaces can obstruct spatial data discovery and selection [38]. Recent geospatial search research further demonstrates that semantic enrichment, natural-language processing, and ranking methods can improve retrieval relevance, although such methods require evaluation against explicit relevance judgments and user tasks [39]. Recent geoportal usability studies likewise show that navigation, search-result presentation, user guidance, map interaction, and metadata descriptions jointly shape discovery outcomes [40,41]. Meaningful themes and place keywords, predictable titles, consistent categories, clear item types, visible ranking, and manageable click-depth therefore support exploratory discovery.
2.5. Study Contribution
This study evaluates a heterogeneous university ArcGIS Hub catalog through a combined FAIR and geospatial metadata framework. It brings together a complete catalog census, programmatic extraction of live ArcGIS item information, FGDC CSDGM-informed scoring, and a structured discoverability test. The contribution is a practical method for showing how broad FAIR dimensions are expressed through specific geospatial metadata fields and public catalog functions.
3. Materials and Methods
3.1. Study Design and Assessment Date
This study used a descriptive, cross-sectional case-study design combining a complete metadata census with a proportionally stratified discoverability assessment. A case-study design was appropriate because the objective was to characterize the operational state of a heterogeneous institutional catalog while preserving item-level evidence and platform context. The complete census avoided sampling error for metadata-quality estimates, whereas manual discoverability testing was applied to a stratified sample because search, browsing, and click-depth observations required direct interaction with the public interface.
The assessment reflects the state of the Hub on 19 June 2026, following routine metadata completion work undertaken during platform development. FAIR was used as an organizing and interpretive framework rather than as a claim of formal certification. FGDC CSDGM was selected as the domain-specific content basis because the Hub contains geospatial resources, ArcGIS supports standards-based metadata, and the standard provides observable elements concerning identification, spatial reference, entities and attributes, distribution, provenance, and metadata responsibility. The assessment therefore evaluates publicly retrievable evidence that supports FAIR-related functions; it does not validate every mandatory or conditional CSDGM element or every FAIR sub-principle.
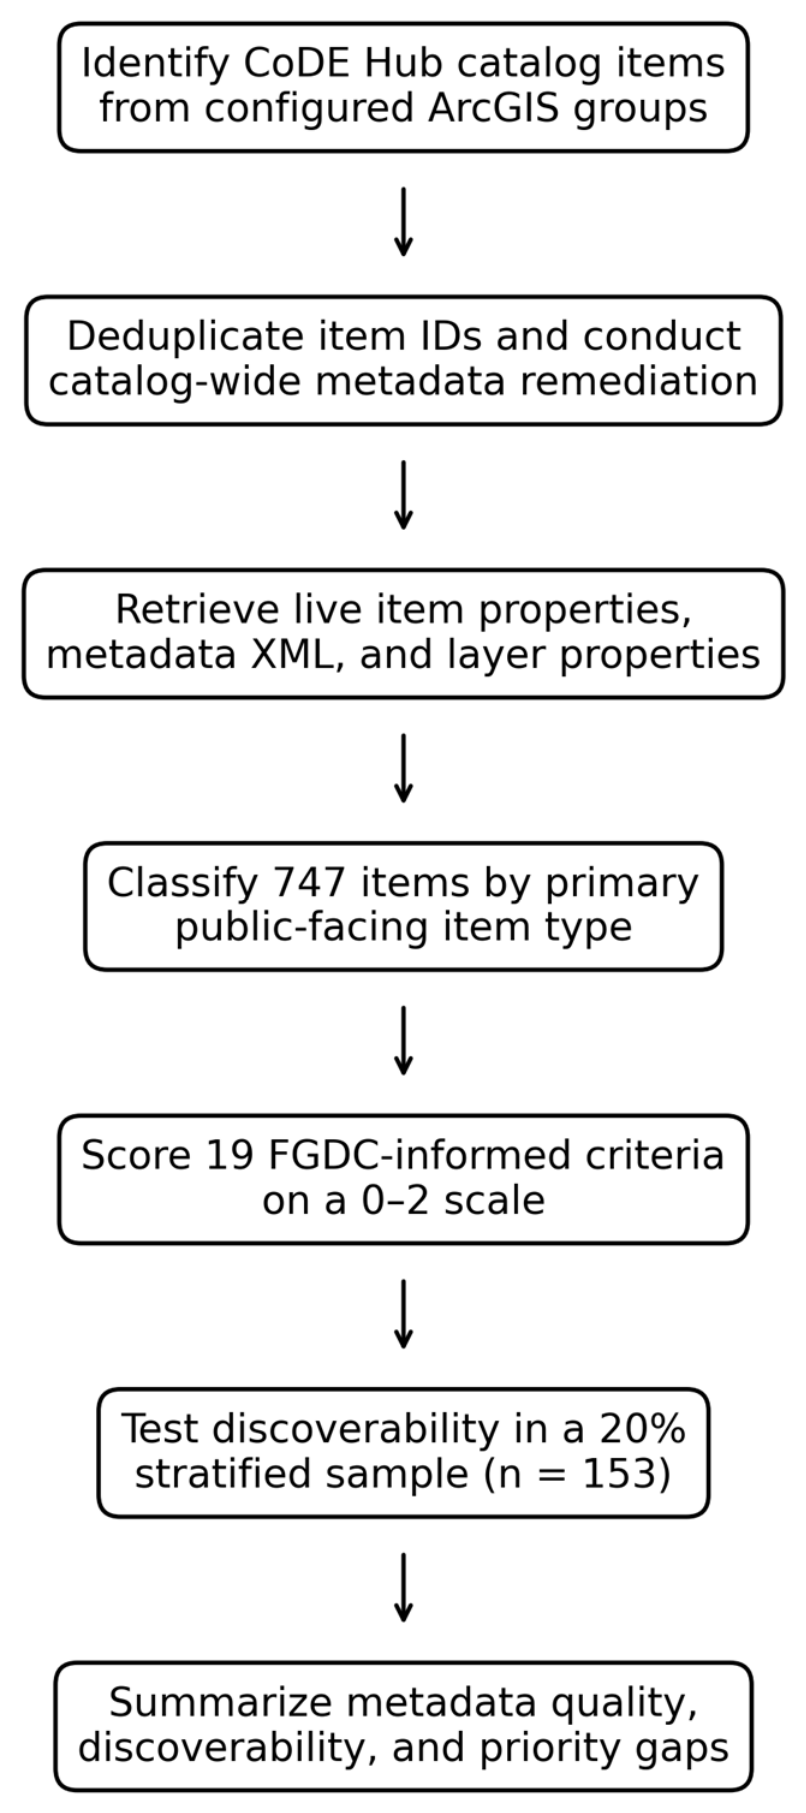
The 19-criterion scoring rules and the original 50% and 75% performance bands were fixed before the final assessment run. The same rules-based script was applied to every item, and the evidence supporting each criterion score was retained. Alternative weighting, applicability-normalized scoring, and threshold analyses were added during revision as post hoc robustness checks applied to the archived item-level scores. They are not presented as preregistered analyses and are distinct from the independent inter-assessor reliability assessment described in Section 3.6. The overall workflow for the metadata and discoverability assessment is shown in Figure 1.
Figure 1.
Workflow for the FAIR- and FGDC CSDGM-informed metadata and discoverability assessment.
3.2. Catalog Inventory and Unit of Analysis
The unit of analysis was an individual ArcGIS item included in the public CoDE Hub catalog. The catalog was defined from ArcGIS Online (2026.R1, February 2026 release) and ArcGIS Hub (cloud release current on 19 June 2026; Esri, Redlands, CA, USA) groups configured as Hub content sources [14,15,16]. Item identifiers were retrieved programmatically, deduplicated across groups, and matched to current ArcGIS item records. The final census contained 747 public items.
The inventory workflow comprised:
- retrieval and deduplication of item identifiers from catalog groups;
- collection of current item-page properties, including title, summary, description, tags, categories, credits, terms of use, access level, owner, item type, and creation and modification dates;
- download and parsing of standards-based metadata XML where available;
- retrieval of feature-layer geometry, spatial reference, and field information where accessible; and
- classification of each item according to its primary public-facing function.
3.3. FAIR- and FGDC CSDGM-Informed Assessment Framework
The assessment used FAIR as the organizing framework and FGDC CSDGM, Version 2 (FGDC-STD-001-1998) [19], as the geospatial metadata standard from which observable criteria were derived. The seven CSDGM content areas were operationalized as 19 criteria and mapped to FAIR through a functional crosswalk. Because one metadata element can support more than one FAIR objective, the revised mapping distinguishes a primary FAIR dimension from secondary FAIR relationships. The primary dimension represents the criterion’s most direct function in this assessment and is used for numerical aggregation so that one observed score is not counted more than once. Secondary relationships acknowledge conceptual overlap and guide interpretation. For example, access constraints are assigned primarily to Accessibility because they describe retrieval conditions, while their effect on permissible downstream use is recorded as a secondary relationship to Reusability; use constraints are assigned primarily to Reusability and secondarily to Accessibility.
Primary assignments followed three rules: the criterion had to be observable from the available public evidence; the assignment had to correspond to the most immediate user or machine function supported; and the relationship had to remain traceable to a FAIR principle or domain-relevant metadata requirement. The mapping is therefore an operational model for this catalog rather than an assertion that the criteria are mutually exclusive or sufficient for complete FAIR assessment. Persistent identifiers, long-term metadata persistence after data removal, machine-actionable controlled vocabularies, and qualified links between related resources were outside the available evidence. Reported FAIR scores summarize the selected indicators and do not certify full FAIR compliance [30,31,32]. The functional crosswalk between the FGDC CSDGM-informed criteria and their primary and secondary FAIR relationships is presented in Table 1.
Table 1.
Functional crosswalk of FGDC CSDGM-informed criteria to primary and secondary FAIR relationships.
3.4. Scoring, Weighting, Applicability, and Descriptive Performance Bands
Each applicable criterion was scored on a three-level ordinal scale. A score of 0 indicated that no usable evidence was available; 1 indicated evidence that was present but generic, incomplete, vague, or insufficient for confident interpretation; and 2 indicated evidence that was specific, clear, and useful for the discovery, access, interoperability, or reuse function represented by the criterion. The three levels distinguish absence, nominal presence, and operational usefulness without implying measurement precision unsupported by the metadata. This approach also avoids treating a populated field as equivalent to a useful field. Criterion-specific rules were applied consistently across item-page properties, formal metadata XML, and accessible layer or schema properties, and the score and evidence string were retained for every item and criterion [6,8,10,12,30].
The evidence hierarchy prioritized item-specific information over generic or inherited text. Where the same criterion appeared in more than one source, explicit item-level metadata or accessible layer properties were used before organizational boilerplate. Generic statements could receive partial credit but could not receive the same score as specific, item-relevant evidence. The complete decision rules are shown in Table 2 and reproduced in the archived scoring-rules file.
Table 2.
Criterion-specific operational definitions for scores of 0, 1, and 2.
Equal criterion weighting was retained for the primary 38-point index because the study did not possess validated stakeholder-derived or empirically estimated importance weights. Imposing unequal weights would therefore add normative assumptions that could not be defended from the available evidence. Each criterion contributes at most two points, which makes the index transparent and reproducible. Because the 38-point total gives greater influence to FAIR dimensions represented by more criteria, an equal-dimension sensitivity analysis was also conducted by averaging the four normalized FAIR-dimension percentages, with each dimension contributing 25%.
As a post hoc sensitivity analysis, catalog heterogeneity was addressed through a core-plus-extension model. Seventeen criteria form a common profile for identification, discovery, access, provenance, use conditions, responsibility, and currency. Spatial reference and attribute definitions form a technical extension that is applicable to data-bearing services and files and is treated as not applicable to narrative or composite products without an exposed schema. Applicability-normalized percentages were calculated as observed points divided by the maximum points for the criteria applicable to an item. The common 19-criterion score is retained as a catalog-wide benchmark, while the type-aware score tests whether conclusions depend on structurally irrelevant criteria.
The 50% and 75% cut points were derived from the ordinal anchors. A score of 50% corresponds to an average of 1.0 per applicable criterion, the threshold for partial or weak evidence. A score of 75% corresponds to an average of 1.5, indicating performance midway between partial and complete evidence and therefore predominantly complete or useful. Scores below 50% average less than partial evidence. These categories are descriptive performance bands, not FGDC compliance classes or FAIR certification thresholds; continuous scores and criterion-level distributions remain the primary results.
For the common benchmark, the maximum total score was 38 and percentage scores were calculated as (observed score/38) × 100. The resulting percentage is a transparent descriptive index of the evidence observed across the 19 criteria; it is not a claim that the intervals between 0, 1, and 2 represent a continuous physical quantity.
FAIR-aligned dimension scores were calculated for each item by summing the criteria assigned primarily to each dimension and dividing by that dimension’s maximum possible score. Findable included six criteria (maximum 12), Accessible four (maximum 8), Interoperable three (maximum 6), and Reusable six (maximum 12). Mean percentages were then calculated across all 747 items. The original 38-point total and FGDC content-area summaries were retained so that FAIR interpretation did not replace the more detailed geospatial metadata results. Robustness was examined using equal FAIR-dimension weighting, applicability-normalized scores, and alternative 70/50 and 80/60 performance-band cut points. The descriptive performance bands used in the primary assessment are summarized in Table 3.
Table 3.
Descriptive performance bands derived from the ordinal score anchors.
3.5. Discoverability Assessment
Discoverability was assessed for a proportionally stratified sample of 153 items, representing 20.48% of the catalog. Sampling was conducted independently within each broad item-type class using a fixed random seed of 20260619. The stratum sample size was the ceiling of 20% of the stratum, with a minimum of one item, ensuring representation of all eight broad classes: datasets/hosted feature layers (45 of 223), web maps (33 of 161), web applications (13 of 64), dashboards (3 of 12), StoryMaps (11 of 52), document/file resources (35 of 173), training resources (1 of 3), and other items (12 of 59). The protocol approximated the experience of a public user navigating the Hub without administrator privileges.
The five search and browsing tests were scored 0 (unsuccessful), 1 (partially successful), or 2 (successful) using the rules in Table 4. Location was excluded from an item’s denominator when no meaningful place query could be derived. Click-depth was recorded separately. A search-based percentage was computed from applicable tests, and the final discoverability band combined that percentage with navigation burden so that a high retrieval score did not automatically imply an efficient path. The archived assessment did not record exact numerical rank or first-page status; the reported results therefore measure retrieval success rather than rank-sensitive findability. A repeated assessment should retain target rank, first-page/top-k status, default sort, query text, and result count.The criteria used to assign the final discoverability performance bands are summarized in Table 5.
Table 4.
Discoverability test protocol and criterion-specific scoring logic.
Table 5.
Discoverability performance bands.
3.6. Analysis, Robustness, and Quality Control
Programmatic metadata extraction and analysis were conducted using ArcGIS Notebooks Runtime 13.0 (Esri, Redlands, CA, USA), within the ArcGIS Online 2026.R1 environment. The runtime included ArcGIS API for Python 2.4.2. The automated script retained the evidence used for every criterion score and generated a separate scoring-rules file, permitting item-level inspection and deterministic reruns. The rules and output columns were reviewed against the manuscript tables, and arithmetic totals were recalculated from the criterion-level score columns using a separate verification script. Independent inter-assessor reliability was evaluated by having a second assessor rescore a 50-item stratified subsample (6.69% of the 747-item catalog) using the frozen 19-criterion rubric and the same 0–2 decision rules. The subsample approximated the catalog distribution while retaining all eight broad item classes: 15 datasets/hosted feature layers, 11 web maps, 4 web applications, 1 dashboard, 3 StoryMaps, 11 document/file resources, 1 training resource, and 4 other items. Reliability was calculated across 950 paired criterion ratings using exact agreement and linear weighted Cohen’s kappa, with quadratic weighted kappa as a sensitivity statistic. Agreement between the two 38-point item totals was evaluated with a two-way random-effects, absolute-agreement, single-measure intraclass correlation coefficient (ICC[A,1]). Performance-band agreement was summarized using percent agreement and Cohen’s kappa. The second-assessor ratings were used to quantify reproducibility and did not replace the original census scores.
The metadata analysis used descriptive statistics because the assessment covered the complete catalog census. Summary outputs included item counts by type; mean, median, minimum, and maximum scores; performance-band frequencies; criterion and dimension completeness; and mean scores by item type. Robustness analyses compared the equal-criterion benchmark with equal FAIR-dimension weighting, an applicability-normalized core-plus-extension score, and alternative classification thresholds. Spearman rank correlation and performance-band agreement were used to assess whether conclusions changed under these design choices. Discoverability outputs included success distributions for each test, final discoverability bands, and click-depth statistics.
4. Results
4.1. Catalog Composition
The final assessment included 747 public catalog items. Datasets or hosted feature layers were the largest group (223 items; 29.85%), followed by document or file resources (173; 23.16%) and web maps (161; 21.55%). Training resources were the least frequent category (3; 0.40%); the complete catalog composition by item type is reported in Table 6.
Table 6.
Audited CoDE Hub items by type.
4.2. Overall Metadata Descriptive Performance
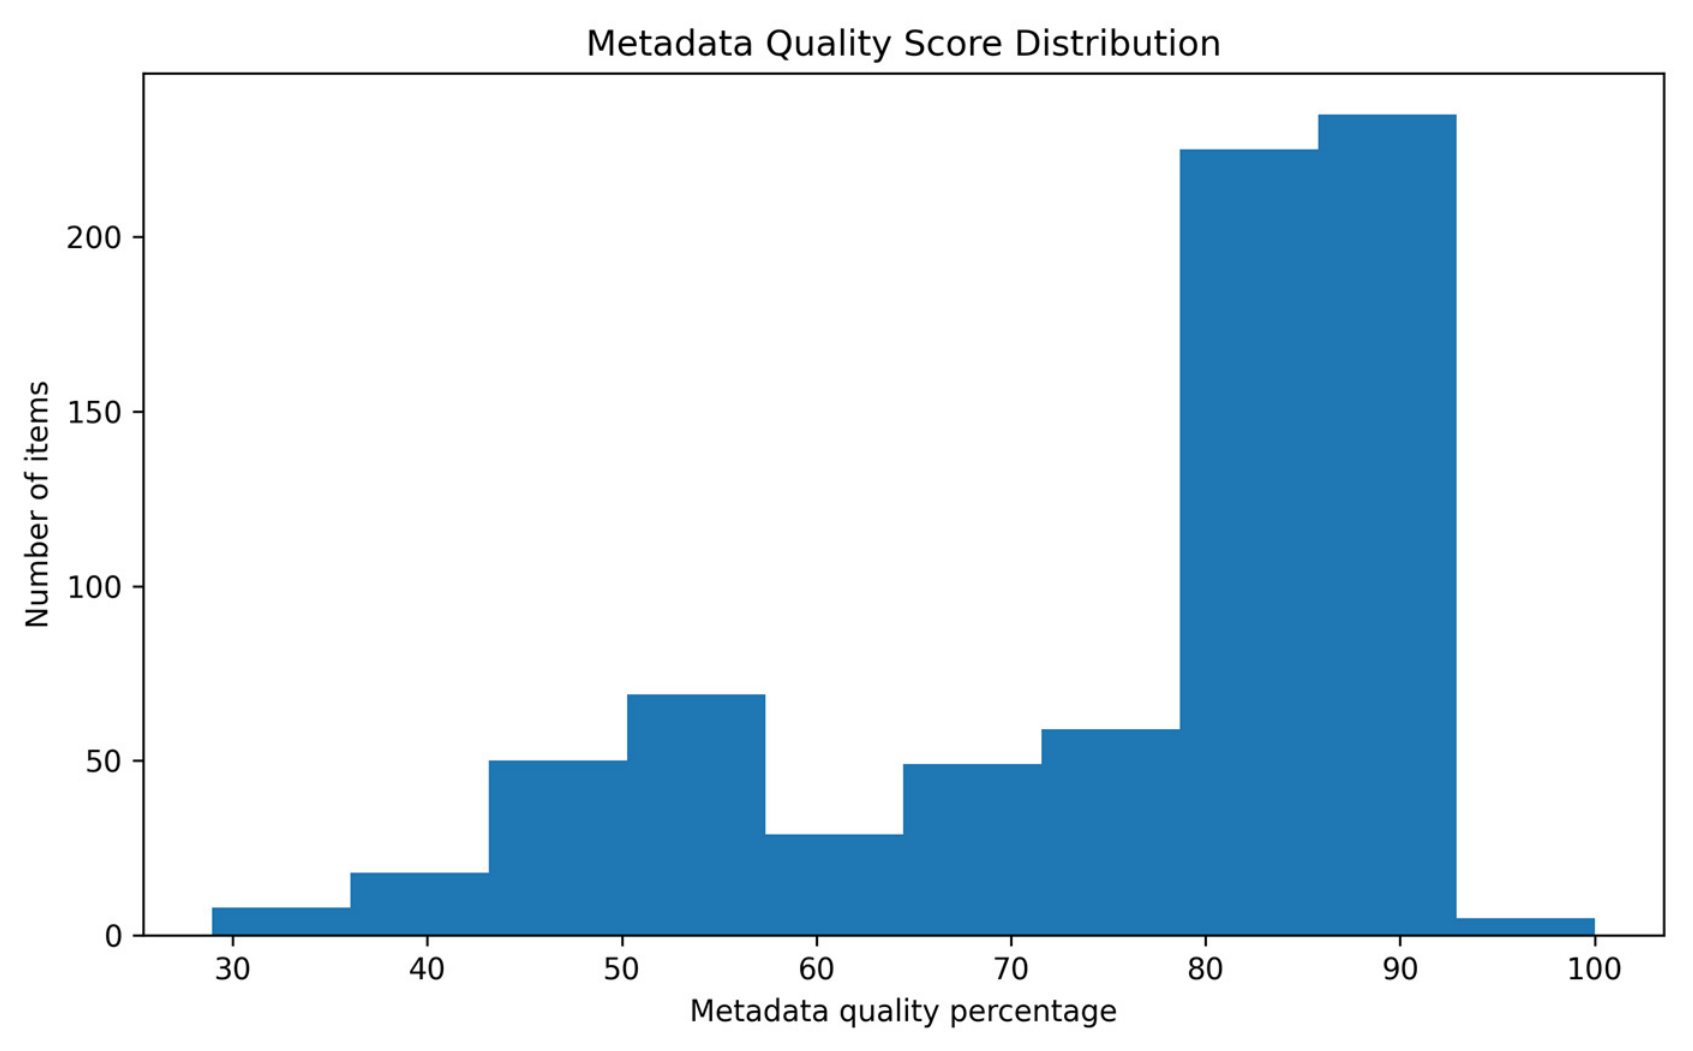
The mean metadata score was 28.57 of 38 (75.19%), and the median was 31. Scores ranged from 11 to 38. Using the predefined descriptive thresholds, 490 items (65.60%) were in the high performance band, 207 (27.71%) were moderate, and 50 (6.69%) were low (Table 7). The distribution of metadata quality percentage scores across the 747 items is shown in Figure 2.These bands summarize the observed evidence and should not be interpreted as FGDC compliance levels or FAIR certification.
Table 7.
Overall metadata descriptive performance bands.
Figure 2.
Distribution of metadata quality percentage scores across the 747 items.
4.3. FAIR-Aligned Performance
The FAIR-aligned results show the strongest performance for Findability (87.25%) and Accessibility (85.96%). Reusability averaged 67.26%, while Interoperability was lowest at 52.59%. The pattern reflects strong descriptive, indexing, distribution, and access information across the catalog, alongside weaker spatial-reference and attribute documentation as shown in Table 8.
Table 8.
Mean FAIR-aligned metadata scores across 747 items.
Findability was supported by strong titles, abstracts, theme keywords, and complete item dates. Accessibility benefited from clear distribution formats and identifiable contacts. The lower Interoperability score was driven primarily by incomplete spatial-reference and attribute documentation. Reusability was limited by uneven lineage and limitation statements, although purpose, use constraints, and metadata responsibility were generally stronger.
4.4. Completeness by FGDC-Informed Dimension and Criterion
Performance varied substantially across dimensions. Spatial data organization was strongest (98.26%), followed by metadata reference information (91.70%) and distribution information (90.90%). Identification information averaged 79.87%. Table 9 showed that data quality information was lower (54.66%), and the weakest dimensions were entity and attribute information (43.51%) and spatial reference information (16.00%).
Table 9.
Metadata completeness by FGDC-informed dimension.
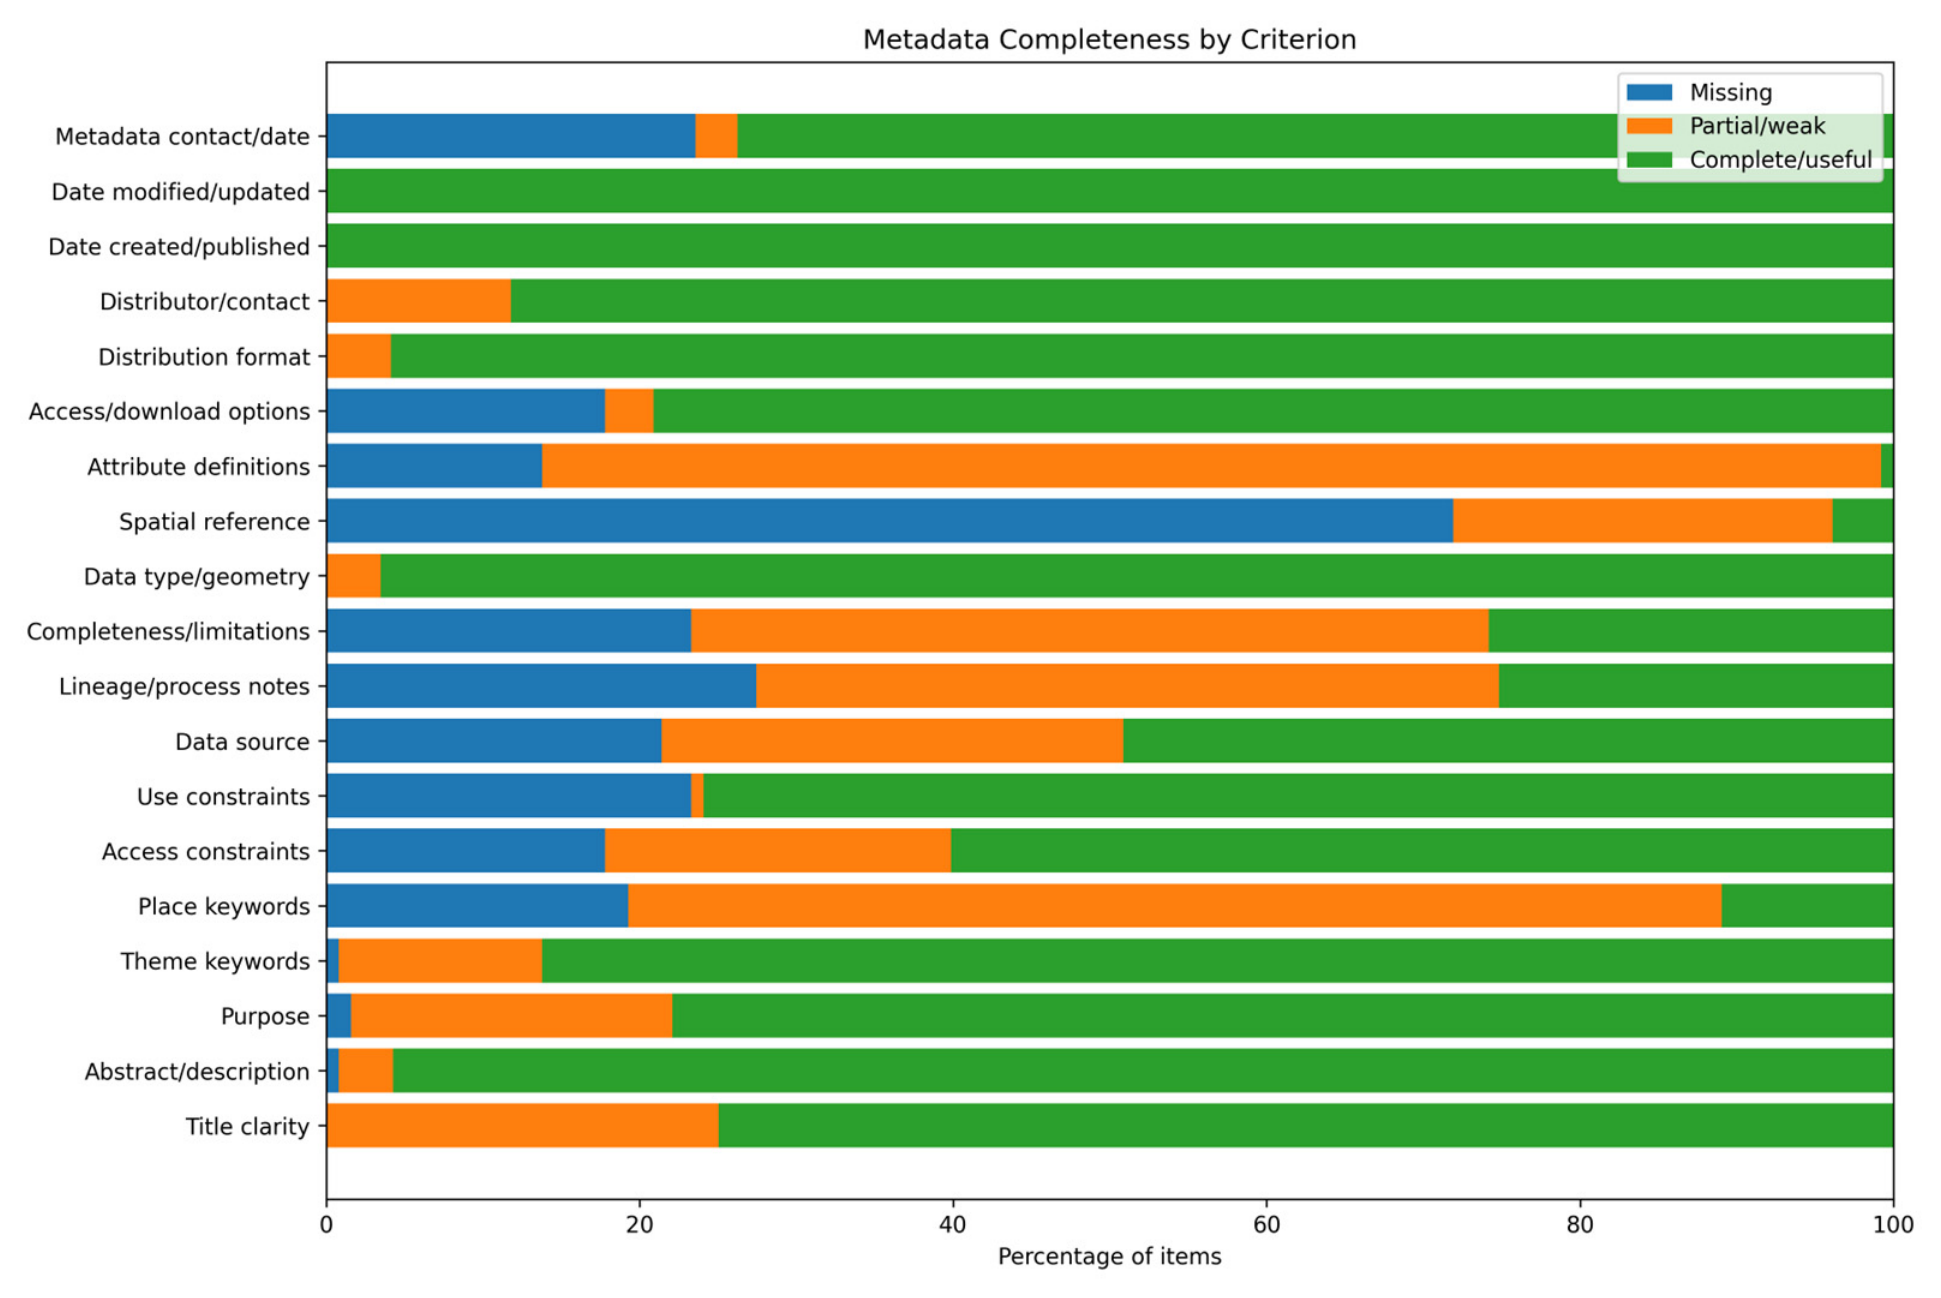
At criterion level, creation and modification dates were complete for all items. Data type or geometry was complete for 96.52%, abstracts or descriptions for 95.72%, and distribution format for 95.85%. The largest technical gap was spatial reference: 71.89% of items lacked coordinate-system evidence and only 3.88% received a complete score. Attribute definitions were complete for only 0.80%, although 85.41% received partial credit because fields or generic attribute statements were present. Place keywords were complete for 10.98%; lineage was complete for 25.17%; and completeness or limitation statements were complete for 25.84%. Table 10 below shows these results. The distribution of complete, partial, and missing metadata across individual criteria is illustrated in Figure 3.
Table 10.
Metadata completeness by individual criterion.
Figure 3.
Complete, partial, and missing metadata by criterion.
4.5. Metadata Descriptive Performance by Item Type
Benchmark metadata performance differed by item type. Dashboards had the highest mean percentage (82.46%), followed by document or file resources (82.31%) and StoryMaps (81.88%). Datasets or hosted feature layers had the lowest mean percentage (66.10%), and items in the residual other category averaged 70.29%. The lower benchmark score for datasets reflects both genuine technical documentation gaps and the greater relevance of spatial reference, attribute, lineage, and limitation information to data-bearing products; the type-aware sensitivity analysis in Section 4.7 addresses this applicability issue. Benchmark metadata performance by item type is summarized in Table 11.
Table 11.
Benchmark metadata descriptive performance by item type.
4.6. Discoverability
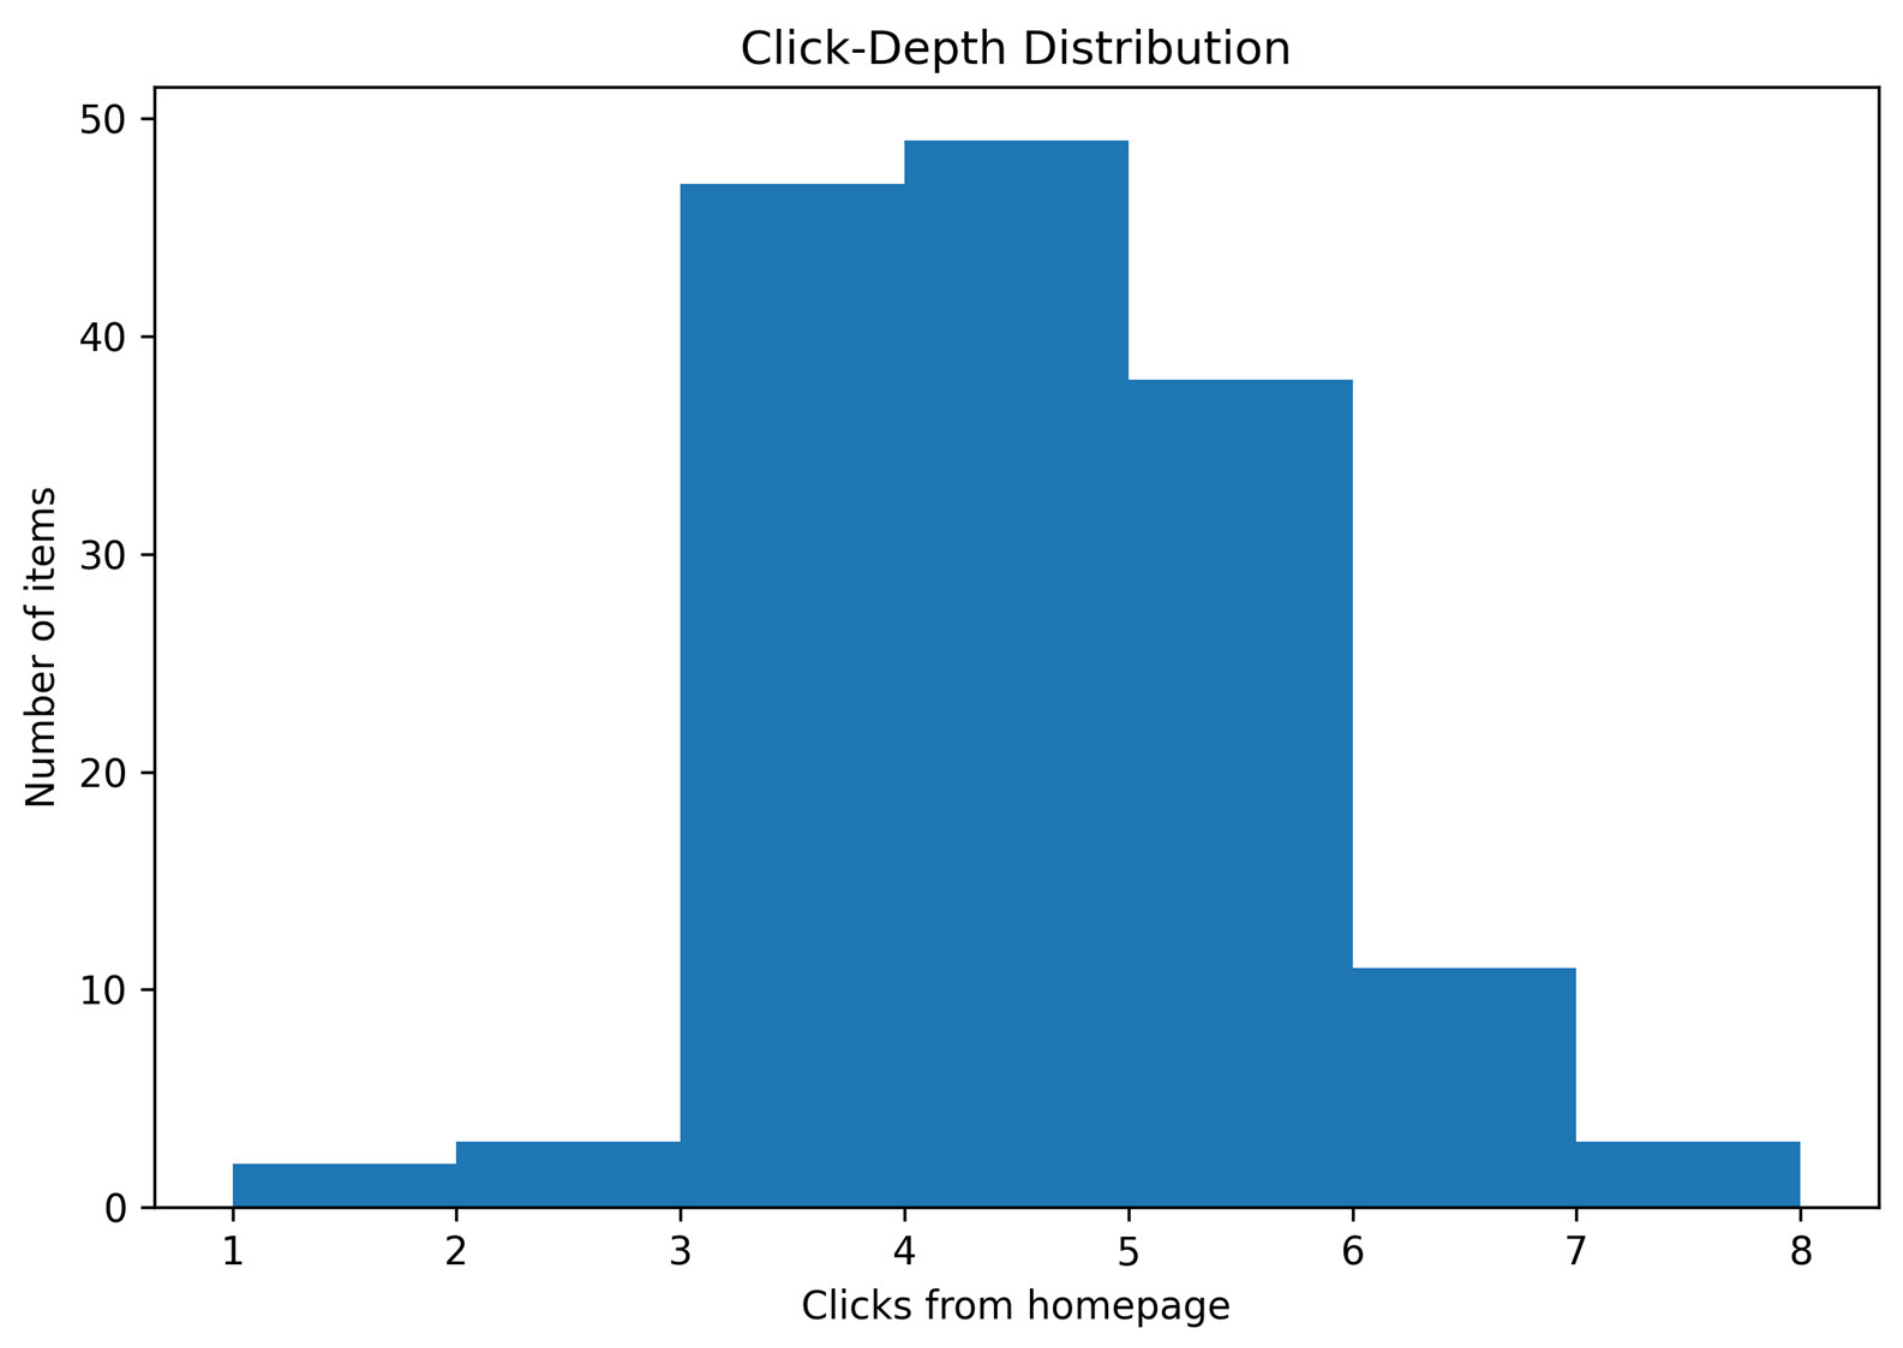
The discoverability assessment included 153 items and represented every broad catalog class. The mean search-based discoverability percentage was 80.00%, and the mean click depth was 4.07, with a range of 1 to 7 clicks. After incorporating navigation burden, 43 items (28.10%) were classified as highly discoverable, 58 (37.91%) as moderately discoverable, and 52 (33.99%) as low discoverability. Because exact result rank was not archived, these bands describe retrieval success and navigation burden rather than first-page or top-k visibility (Table 12).
Table 12.
Discoverability classification of sampled items.
Exact-title and data-type searches were successful for every sampled item. Keyword search was successful for 88.24% and partially successful for the remaining 11.76%. Location search was fully successful for 4.03% of applicable items and partially successful for 94.63%. Because the catalog is heavily concentrated in North Carolina, the location results mainly reflect limited differentiation among resources that share the same broad geographic context. Category browsing was fully successful for 29.41%, partially successful for 48.37%, and unsuccessful for 22.22%. Exact-title, keyword, and item-type searches, therefore, performed strongly, while category structure and navigation depth were the more consequential constraints on exploratory use (Table 13). The distribution of click depth for the discoverability sample is shown in Figure 4.
Table 13.
Search and browsing performance.
Figure 4.
Click-depth distribution for the discoverability sample.
4.7. Robustness and Sensitivity Analyses
Under equal FAIR-dimension weighting, the catalog mean was 73.26%, compared with 75.19% under equal criterion weighting. The two scores were strongly associated (Spearman rho = 0.988), and 716 of 747 items (95.85%) retained the same descriptive performance band. Equal-dimension weighting classified 467 items (62.52%) as high, 234 (31.33%) as moderate, and 46 (6.16%) as low. The broad pattern of stronger Findability and Accessibility and weaker Interoperability and Reusability was unchanged.
In the core-plus-extension sensitivity analysis, spatial reference and attribute definitions were treated as applicable to datasets or hosted feature layers and excluded from the denominator for other broad item types without exposed schema properties. The applicability-normalized mean was 79.93%. Item rankings remained highly consistent with the common benchmark (Spearman rho = 0.977), and 697 items (93.31%) retained the same performance band. This indicates that the common index is useful as a catalog benchmark, while type-aware normalization provides a more defensible comparison across heterogeneous products.
Performance-band proportions were more sensitive to the cut points than item rankings. Using 70% and 50% as cut points produced 551 high (73.76%), 146 moderate (19.54%), and 50 low items (6.69%). Using stricter 80% and 60% cut points produced 404 high (54.08%), 183 moderate (24.50%), and 160 low items (21.42%). Continuous scores, criterion distributions, and dimension profiles are therefore emphasized over the categorical labels.
The weighting, applicability, and threshold-sensitivity results are consolidated in Table 14.
Table 14.
Robustness and sensitivity analysis of weighting, applicability, and performance-band thresholds.
4.8. Inter-Assessor Reliability
Independent rescoring of 50 items produced exact agreement for 729 of 950 criterion-level ratings (76.74%). Linear weighted Cohen’s kappa was 0.587, and quadratic weighted kappa was 0.630. The original scores for this subsample averaged 28.86 of 38 (75.95%), compared with 29.60 of 38 (77.89%) for the second assessor. The absolute-agreement ICC(A,1) for total scores was 0.715. Performance-band classifications agreed for 41 of 50 items (82.00%), with a band-level Cohen’s kappa of 0.566. Among the 221 disagreements, 189 (19.89% of all paired ratings) differed by one score level and 32 (3.37%) differed by two levels; the overall inter-assessor reliability results are summarized in Table 15.
Table 15.
Inter-assessor reliability results for the 50-item validation subsample.
Criterion-level agreement was strongest for data source (linear weighted kappa = 0.828), purpose (0.805), distributor/contact (0.706), and metadata contact/date (0.662). Date created/published and date modified/updated each had 100% exact agreement, but kappa was not estimable because both assessors assigned the same score to every sampled item. The lowest criterion-level kappas were observed for completeness/limitations (−0.018), access/download options (0.042), place keywords (0.145), and access constraints (0.161). These results indicate that the aggregate scoring framework is reproducible while also identifying interpretive criteria that would benefit from more explicit decision examples.
5. Discussion
5.1. FAIR Profile of the CoDE Hub
The assessment indicates a strong foundation for Findability (87.25%) and Accessibility (85.96%). Most items contain useful descriptions, theme keywords, clear item types, distribution information, responsible contacts, and current creation and modification dates. These features support known-item retrieval and routine public access. The 75.19% benchmark and the high-band share of 65.60% should, however, be interpreted as descriptive summaries of the selected evidence rather than certification. The equal-dimension and threshold analyses show that the overall pattern is stable even though the number of items assigned to a categorical band depends on the chosen cut points.
The value of the combined framework is not the single catalog percentage alone. By preserving criterion-level evidence from item information, formal metadata XML, and layer properties, the assessment links broad FAIR-related outcomes to specific fields that can be corrected. This addresses a recurring challenge in FAIR operationalization: assessment metrics necessarily embody implementation choices, and their declared FAIR dimension may not capture every function they evaluate [30,32,33,34]. The primary-secondary crosswalk and sensitivity analyses make those choices explicit.
5.2. Interoperability and Reusability
Interoperability was the weakest FAIR-aligned dimension (52.59%), while Reusability averaged 67.26%. Spatial-reference documentation was missing for most items, complete attribute definitions were rare, and lineage and limitation statements were often generic or incomplete. These gaps matter because coordinate systems, field definitions, units, codes, domains, processing history, and known limitations determine whether data can be integrated correctly and evaluated for fitness for purpose [22,23,38,42].
The contrast between strong Accessibility and weaker Interoperability and Reusability illustrates a broader governance sequence: institutions can publish and expose resources faster than they can document schemas, spatial reference, provenance, quality, and limitations. A portal can therefore be operationally open but analytically under-documented. Opening a resource answers whether it can be reached; technical metadata answer whether it can be integrated, interpreted, and reused responsibly. Similar differences between availability and reuse readiness have been reported across open-data and FAIR assessment contexts [4,9,10,12,13,30].
5.3. Discoverability and Catalog Navigation
The discoverability results distinguish known-item retrieval from exploratory navigation. Exact-title, keyword, and item-type searches performed strongly, while place-based search, category browsing, and click-depth exposed greater difficulty for users without prior knowledge of a specific item. The low full-success rate for location search aligns with weak place-keyword performance, although the measure has limited diagnostic value in a catalog where most resources share a North Carolina context. These results reinforce the distinction between metadata-based retrieval and the organization of the catalog interface [2,38].
The average click depth of 4.07 qualifies the strong search score: a relevant item may be retrievable but still require several navigation actions before the user reaches the item page or usable resource. Discoverability is therefore a system outcome jointly produced by metadata, indexing, result ranking, category architecture, and interface design [37,40,41]. Because the archived protocol did not record numerical rank, the current results should not be interpreted as top-k performance. Future evaluations should log first-page status and rank and may test semantic enrichment or NLP-based ranking, but these methods should be evaluated against transparent relevance judgments and user tasks rather than assumed to improve discovery automatically [39,41].
5.4. Implications for Ongoing CoDE Hub Development
The findings identify clear priorities for the next development cycle: item-specific spatial reference, field-level attribute documentation, processing lineage, explicit limitations, controlled place terms, and more consistent item-type requirements. These elements should be embedded in the publication lifecycle rather than addressed only through periodic cleanup. A sustainable workflow should assign responsibility before publication, require item-type templates, validate machine-retrievable fields, flag generic or missing evidence, and route exceptions for accountable review. Periodic audits can then measure drift and improvement. Prior research shows that metadata profiles, training, integrated authoring workflows, programmatic extraction, and recurring FAIR monitoring can improve consistency while reducing the burden on individual data producers [25,27,28,29,30,33,43,44].
The item-type results show why one undifferentiated checklist is inadequate for a catalog containing datasets, services, maps, applications, dashboards, StoryMaps, documents, and training materials. A common core is necessary for consistent identification, source attribution, access, use conditions, responsibility, and currency. Data-bearing products additionally require coordinate reference, schema, units, domains, processing history, and quality information. The strong correlation between the common benchmark and the applicability-normalized score indicates that the main conclusions are not an artifact of type handling, while the higher type-aware mean shows that structurally irrelevant criteria can affect comparisons among product classes.
Place-based discovery requires attention at both the metadata and interface levels. State-level tags are sufficient for some resources, while county, municipality, watershed, campus, or project-area terms are more useful for local data. Controlled geographic vocabularies, consistent place tags, coherent categories, direct catalog entry points, and reduced click-depth would make the current content structure more legible to users who do not already know item titles.
5.5. Methodological Contribution and Transferability
The methodological contribution is an evidence-preserving governance instrument rather than the 75.19% value itself. The workflow integrates item-page information, standards-based XML, and layer properties; operationalizes broad FAIR concepts with domain-specific metadata criteria; distinguishes primary from secondary FAIR relationships; retains human-readable evidence; and tests sensitivity to weighting, thresholds, and item-type applicability. Each missing or partial score points to a specific field, template, validation rule, or interface intervention. This complements metadata-automation and FAIR-monitoring research by using computational extraction to support accountable review rather than treating automation as a substitute for judgment [23,24,26,29,30,32,33,34,39,45].
The independent rescoring adds an empirical check on the repeatability of the rubric. Agreement was strongest for criteria supported by relatively explicit evidence, such as purpose, source attribution, and responsible contact information, while criteria requiring more interpretive judgments showed lower kappa values. This pattern supports retaining evidence strings and criterion-specific rules and suggests that future versions of the rubric should add worked examples for limitations, access/download status, place specificity, and access constraints.
The method is transferable to other university, local government, or community ArcGIS Hub catalogs, but the NCCU prevalence estimates are not statistically generalizable to all portals. Transfer requires adaptation of the item-type classes, organizational metadata style, controlled vocabularies, evidence hierarchy, applicability matrix, and scoring rules. FAIR supplies a common interpretive structure, while FGDC, ISO, or other community standards can supply locally appropriate measurable fields. Comparative multi-hub research is needed to determine which observed gaps are platform-specific and which represent broader metadata-governance patterns.
5.6. Limitations and Future Evaluation
Several limitations bound interpretation. First, the assessment represents one catalog state after metadata remediation and does not estimate the pre-intervention condition or causal effect of the remediation. Second, the authors participated in Hub development, creating potential self-assessment bias. Independent rescoring of 50 items provides an external check on the rubric, but the validation sample covers 6.69% of the catalog and criterion-level agreement was uneven; the full 747-item census was not independently duplicated. Third, the rubric evaluates publicly retrievable evidence and may classify undocumented information as missing even when it exists elsewhere; conversely, generic boilerplate can receive partial credit without being fully item-specific. Fourth, applicability and evidence availability differ among item types, so the common index is supplemented by a type-aware sensitivity analysis. Fifth, the FAIR mapping remains an operational interpretation and does not test persistent identifiers, metadata persistence after removal, machine-actionable vocabularies, qualified links, or every FAIR sub-principle. Sixth, search rank, indexing, categories, and interface paths are temporally unstable. Finally, one institutional case cannot establish prevalence across university hubs.
Future reliability work should expand independent rescoring beyond the 50-item validation sample and refine the decision rules for criteria with lower agreement, particularly completeness/limitations, access/download options, place keywords, and access constraints. Repeated assessments should measure temporal change, while task-based usability testing with students, researchers, agency partners, and community users should test whether formal metadata performance translates into efficient discovery and appropriate reuse. Comparative analysis of other university ArcGIS Hub catalogs would distinguish platform-specific findings from broader governance challenges.
6. Conclusions
This study established a current-state benchmark for metadata descriptive performance and discoverability in the NCCU CoDE Open Data Hub. Across 747 items, the equal-criterion benchmark was 75.19%, with 65.60% of items in the high descriptive performance band. Equal FAIR-dimension weighting produced a similar mean of 73.26% and preserved the performance band of 95.85% of items. Findability (87.25%) and Accessibility (85.96%) were strongest, Reusability averaged 67.26%, and Interoperability was lowest at 52.59%. Independent rescoring of 50 items yielded 76.74% exact criterion-level agreement, a linear weighted Cohen’s kappa of 0.587, and an absolute-agreement ICC of 0.715 for total scores. These values summarize the selected evidence and do not constitute formal FGDC validation or FAIR certification.
The Hub supports reliable known-item retrieval and routine public access but is less consistent for exploratory navigation and technical reuse. The broader contribution is a transparent, evidence-preserving method that combines FAIR interpretation with geospatial metadata standards, separates common from type-specific requirements, and converts audit findings into actionable governance controls. The method can be adapted to other heterogeneous hubs, while the case findings require comparative and longitudinal research before broader generalization.
Author Contributions
Conceptualization, Chima Okoli, Jasmine Allen and Tony Esimaje; methodology, Chima Okoli; software, Chima Okoli and Tony Esimaje; formal analysis, Jasmine Allen; investigation, Timothy Mulrooney; data curation, Timothy Mulrooney and Chima Okoli; visualization, Chima Okoli; writing—original draft preparation, Chima Okoli; writing—review and editing, Timothy Mulrooney, Jasmine Allen and Tony Esimaje; project administration, Timothy Mulrooney; funding acquisition, Timothy Mulrooney. All authors have read and agreed to the published version of the manuscript.
Funding
This research was funded by the National Aeronautics and Space Administration, award number 22-MUREPDEAP-0002, and the National Science Foundation, grant number 2226312.
Data Availability Statement
The item-level assessment dataset, scoring rules, discoverability results, inter-assessor reliability results, and analysis scripts are available at https://doi.org/10.17605/OSF.IO/X45JQ. The public Hub catalog is available at https://code-deegsnccu.hub.arcgis.com/ (accessed on 19 June 2026). Because ArcGIS item metadata can be revised after publication, the archived assessment files should be treated as the authoritative record of the state evaluated on 19 June 2026.
Acknowledgments
The authors acknowledge additional support for the broader CoDE Hub project from the National Science Foundation under grant number 2326731 and the National Institutes of Health through the Research Centers for Minority Institutions under grant number 5U54MD012392-03. The opinions, findings, conclusions, and recommendations expressed are those of the authors and do not necessarily reflect the views of the funding agencies.
Conflicts of Interest
The authors contributed to the development and administration of the NCCU CoDE Open Data Hub. The authors declare no conflicts of interest.
References
- Rajabifard, A.; Feeney, M.-E.F.; Williamson, I.P. Future directions for SDI development. Int. J. Appl. Earth Obs. Geoinf. 2002, 4, 11–22. [Google Scholar] [CrossRef] [Scilit]
- Hardy, D.; Durante, K. A metadata schema for geospatial resource discovery use cases. Code4Lib J. 2014, 25. Available online: https://journal.code4lib.org/articles/9710 (accessed on 19 June 2026).
- Longley, P.A.; Goodchild, M.F.; Maguire, D.J.; Rhind, D.W. Geographic Information Science and Systems, 4th ed.; Wiley: Chichester, UK, 2015. [Google Scholar]
- Quarati, A.; De Martino, M.; Rosim, S. Geospatial open data usage and metadata quality. ISPRS Int. J. Geo-Inf. 2021, 10, 30. [Google Scholar] [CrossRef] [Scilit]
- Wilkinson, M.D.; Dumontier, M.; Aalbersberg, I.J.; Appleton, G.; Axton, M.; Baak, A.; Blomberg, N.; Boiten, J.-W.; da Silva Santos, L.B.; Bourne, B.E. The FAIR guiding principles for scientific data management and stewardship. Sci. Data 2016, 3, 160018. [Google Scholar] [CrossRef] [Scilit]
- Bruce, T.R.; Hillmann, D.I. The continuum of metadata quality: Defining, expressing, exploiting. In Metadata in Practice; Hillmann, D.I., Westbrooks, E.L., Eds.; American Library Association: Chicago, IL, USA, 2004; pp. 238–256. [Google Scholar]
- Park, J.-R. Metadata quality in digital repositories: A survey of the current state of the art. Cat. Classif. Q. 2009, 47, 213–228. [Google Scholar] [CrossRef] [Scilit]
- Ochoa, X.; Duval, E. Automatic evaluation of metadata quality in digital repositories. Int. J. Digit. Libr. 2009, 10, 67–91. [Google Scholar] [CrossRef] [Scilit]
- Vetrò, A.; Canova, L.; Torchiano, M.; Minotas, C.O.; Iemma, R.; Morando, F. Open data quality measurement framework: Definition and application to open government data. Gov. Inf. Q. 2016, 33, 325–337. [Google Scholar] [CrossRef] [Scilit]
- Neumaier, S.; Umbrich, J.; Polleres, A. Automated quality assessment of metadata across open data portals. J. Data Inf. Qual. 2016, 8, 2. [Google Scholar] [CrossRef] [Scilit]
- Machova, R.; Lnenicka, M. Evaluating the quality of open data portals on the national level. J. Theor. Appl. Electron. Commer. Res. 2017, 12, 21–41. [Google Scholar] [CrossRef] [Scilit]
- Kubler, S.; Robert, J.; Neumaier, S.; Umbrich, J.; Le Traon, Y. Comparison of metadata quality in open data portals using the analytic hierarchy process. Gov. Inf. Q. 2018, 35, 13–29. [Google Scholar] [CrossRef] [Scilit]
- Nogueras-Iso, J.; Lacasta, J.; Urena-Camara, M.A.; Ariza-Lopez, F.J. Quality of metadata in open data portals. IEEE Access 2021, 9, 60364–60382. [Google Scholar] [CrossRef] [Scilit]
- Esri. Metadata in ArcGIS Online. Available online: https://doc.arcgis.com/en/arcgis-online/manage-data/metadata.htm (accessed on 19 June 2026).
- Esri. Add and Manage Content—ArcGIS Hub. Available online: https://doc.arcgis.com/en/hub/content/add-content.htm (accessed on 19 June 2026).
- Esri. Explore Content—ArcGIS Hub. Available online: https://doc.arcgis.com/en/hub/content/explore-content.htm (accessed on 19 June 2026).
- Harvey, F. A Primer of GIS: Fundamental Geographic and Cartographic Concepts, 2nd ed.; Guilford Press: New York, NY, USA, 2016. [Google Scholar]
- Kresse, W.; Danko, D.M. (Eds.) Springer Handbook of Geographic Information; Springer: Berlin, Germany, 2012. [Google Scholar] [CrossRef] [Scilit]
- FGDC-STD-001-1998; Content Standard for Digital Geospatial Metadata, Version 2. Federal Geographic Data Committee: Washington, DC, USA, 1998. Available online: https://www.fgdc.gov/standards/projects/metadata/base-metadata/v2_0698.pdf (accessed on 19 June 2026).
- ISO 19157:2013; Geographic Information—Data Quality. ISO: Geneva, Switzerland, 2013.
- ISO 19115-1:2014; Geographic Information—Metadata—Part 1: Fundamentals. ISO: Geneva, Switzerland, 2014.
- Devillers, R.; Bédard, Y.; Jeansoulin, R. Multidimensional management of geospatial data quality information for its dynamic use within GIS. Photogramm. Eng. Remote Sens. 2005, 71, 205–215. [Google Scholar] [CrossRef] [Scilit]
- Wagner, M.; Henzen, C. Quality assurance for spatial research data. ISPRS Int. J. Geo-Inf. 2022, 11, 334. [Google Scholar] [CrossRef] [Scilit]
- Batcheller, J.K. Automating geospatial metadata generation—An integrated data management and documentation approach. Comput. Geosci. 2008, 34, 387–398. [Google Scholar] [CrossRef] [Scilit]
- Batcheller, J.K.; Gittings, B.M.; Dunfey, R.I. A method for automating geospatial dataset metadata. Future Internet 2009, 1, 28–46. [Google Scholar] [CrossRef] [Scilit]
- Florczyk, A.J.; López-Pellicer, F.J.; Nogueras-Iso, J.; Zarazaga-Soria, F.J. Automatic generation of geospatial metadata for web resources. Int. J. Spat. Data Infrastruct. Res. 2012, 7, 151–172. [Google Scholar] [CrossRef]
- Giuliani, G.; Guigoz, Y.; Lacroix, P.; Ray, N.; Lehmann, A. Facilitating the production of ISO-compliant metadata of geospatial datasets. Int. J. Appl. Earth Obs. Geoinf. 2016, 44, 239–243. [Google Scholar] [CrossRef] [Scilit]
- Trilles, S.; Díaz, L.; Huerta, J. Approach to facilitating geospatial data and metadata publication using a standard geoservice. ISPRS Int. J. Geo-Inf. 2017, 6, 126. [Google Scholar] [CrossRef] [Scilit]
- Wang, Z.; Shi, X.; Yang, H.; Yu, B.; Cai, Y. Automatic Extraction and Cluster Analysis of Natural Disaster Metadata Based on the Unified Metadata Framework. ISPRS Int. J. Geo-Inf. 2024, 13, 201. [Google Scholar] [CrossRef] [Scilit]
- Hutchison, V.B.; Norkin, T.; Zolly, L.S.; Hsu, L. State of the Data: Assessing the FAIRness of US Geological Survey Data. Data Sci. J. 2024, 23, 22. [Google Scholar] [CrossRef] [Scilit]
- RDA FAIR Data Maturity Model Working Group. FAIR Data Maturity Model: Specification and Guidelines; Research Data Alliance: Didcot, UK, 2020. [CrossRef]
- Candela, L.; Mangione, D.; Pavone, G. The FAIR Assessment Conundrum: Reflections on Tools and Metrics. Data Sci. J. 2024, 23, 33. [Google Scholar] [CrossRef] [Scilit]
- Minghini, M.; Escriu, J.; Kotsev, A. Monitoring the FAIRness of geospatial data: Lessons learnt from the European Union. Int. Arch. Photogramm. Remote Sens. Spat. Inf. Sci. 2025, 48, 179–184. [Google Scholar] [CrossRef] [Scilit]
- Ponciano, C.; Würriehausen, F.; Schaffert, M.; Müller, H.; Ponciano, J.-J. From Stars to LETTERS: A Multi-Dimensional, FAIR-Aligned Framework for Geospatial Metadata Quality Evaluation. ISPRS Int. J. Geo-Inf. 2026, 15, 197. [Google Scholar] [CrossRef] [Scilit]
- Ivánová, I.; Brown, N.; Fraser, R.; Tengku, N.; Rubinov, E. FAIR and standard access to spatial data as the means for achieving sustainable development goals. Int. Arch. Photogramm. Remote Sens. Spat. Inf. Sci. 2019, 42, 33–39. [Google Scholar] [CrossRef] [Scilit]
- Thompson, P.T.; Ojha, S.; Powell, C.D.; Pennell, K.G.; Moseley, H.N.B. A proposed FAIR approach for disseminating geospatial information system maps. Sci. Data 2023, 10, 389. [Google Scholar] [CrossRef] [Scilit]
- Machova, R.; Hub, M.; Lnenicka, M. Usability evaluation of open data portals: Evaluating data discoverability, accessibility, and reusability from a stakeholders’ perspective. Aslib J. Inf. Manag. 2018, 70, 252–268. [Google Scholar] [CrossRef] [Scilit]
- Kalantari, M.; Syahrudin, S.; Rajabifard, A.; Subagyo, H.; Hubbard, H. Spatial metadata usability evaluation. ISPRS Int. J. Geo-Inf. 2020, 9, 463. [Google Scholar] [CrossRef] [Scilit]
- Ferrari, E.; Striewski, F.; Tiefenbacher, F.; Bereuter, P.; Oesch, D.; Di Donato, P. Search Engine for Open Geospatial Consortium Web Services Improving Discoverability through Natural Language Processing-Based Processing and Ranking. ISPRS Int. J. Geo-Inf. 2024, 13, 128. [Google Scholar] [CrossRef] [Scilit]
- Król, K. Retrospective Analysis of Municipal Geoportal Usability in the Context of the Evolution of Online Data Presentation Techniques. ISPRS Int. J. Geo-Inf. 2024, 13, 307. [Google Scholar] [CrossRef] [Scilit]
- Ankama, S.; Degbelo, A.; Naoseb, E.; Henzen, C.; Bernard, L. How Well Do Current Geoportals Support Geodata Discovery? An Empirical Study. ISPRS Int. J. Geo-Inf. 2026, 15, 82. [Google Scholar] [CrossRef] [Scilit]
- Kalantari, M.; Rajabifard, A.; Olfat, H.; Williamson, I. Geospatial metadata 2.0—An approach for volunteered geographic information. Comput. Environ. Urban Syst. 2014, 48, 35–48. [Google Scholar] [CrossRef] [Scilit]
- Mulrooney, T. Facilitating a statewide GIS metadata standard through training, outreach and programmatic metadata evaluation. Int. J. Adv. Softw. 2019, 12, 166–178. [Google Scholar]
- Mulrooney, T. Facilitating the New Statewide GIS Metadata Standard through Training and Outreach; NCDOT Project 2017-20, Report FHWA/NC/2017-20; North Carolina Central University: Durham, NC, USA, 2019. Available online: https://connect.ncdot.gov/projects/research/RNAProjDocs/2017-20FinalReport.pdf (accessed on 19 June 2026).
- Mulrooney, T. Turning Data into Information: Assessing and Reporting GIS Metadata Integrity Using Integrated Computing Technologies. Ph.D. Thesis, University of North Carolina at Greensboro, Greensboro, NC, USA, 2009. [Google Scholar]

Disclaimer/Publisher’s Note: The statements, opinions and data contained in all publications are solely those of the individual author(s) and contributor(s) and not of MDPI and/or the editor(s). MDPI and/or the editor(s) disclaim responsibility for any injury to people or property resulting from any ideas, methods, instructions or products referred to in the content. |
© 2026 by the authors. Published by MDPI on behalf of the International Society for Photogrammetry and Remote Sensing. Licensee MDPI, Basel, Switzerland. This article is an open access article distributed under the terms and conditions of the Creative Commons Attribution (CC BY) license.