


Abstract
Urban healthcare systems are fundamentally constrained by the mismatch between static resource configurations and dynamically evolving patient demand. Under the tiered healthcare system, traditional static planning methods struggle to capture the complexity and randomness of patient flows. While recent reinforcement learning (RL) approaches enable adaptive decision-making, they suffer from dimensionality explosion and unstable convergence due to massive action spaces and delayed spatiotemporal credit assignment in city-scale environments. To address this gap, we propose Twin–Game: a digital twin-driven hierarchical reinforcement learning (HRL) framework that formulates adaptive healthcare resource optimization as a “Twin Game” between a simulation-based game environment (Strategic Sandbox) and a hierarchical decision policy. First, we construct the “first twin”—an offline digital twin that serves as the Strategic Sandbox parameterized with Wuhan’s observed facility, population, and transportation data, while patient arrivals and disease profiles are generated synthetically under documented assumptions because individual-level clinical flow data are not publicly available. This environment integrates a dynamic gravity model with a two-way referral mechanism to represent the nonlinear coupling between hospital attractiveness, crowding levels, and patient choice behaviors. Second, we build the “second twin”—an Option-based HRL policy. The Manager (Macro-level Strategic Layer) uses a Deep Q-Network (DQN) for discrete spatial attention allocation; the Worker (Micro-level Execution Layer) uses Proximal Policy Optimization (PPO) for continuous, fine-grained controls such as bed expansion ratios and personnel scheduling. The two twins interact in a closed-loop game, performing strategy search and game evolution under complex constraints to optimize allocation. Experimental results from the Wuhan case indicate that the Twin–Game framework outperforms static baselines and single-layer RL in reducing average travel times, enhancing resource utilization, and improving tiered diagnosis and treatment within the simulation setting. The results should be interpreted as simulation-based decision-support evidence rather than direct clinical validation. This study provides a data-driven, game-theoretic decision support tool for building resilient urban healthcare systems.
1. Introduction
With rapid urbanization and the global shift toward aging societies, urban healthcare systems face a dual challenge: a surge in service demand and a persistent structural mismatch in resource allocation [1,2,3]. A common manifestation of this imbalance is the polarization of healthcare utilization, where high-level hospitals are chronically overloaded, while primary care institutions remain underutilized. This phenomenon reflects deeper systemic issues in hierarchical healthcare delivery, where patient choices, service capacity, and spatial accessibility interact in complex and dynamic ways.
To mitigate these challenges, many countries—including China—have introduced tiered healthcare systems aimed at redistributing patient flows across different levels of care [4]. Nevertheless, the effective coordination of such multi-tier systems remains a formidable challenge. Patient choices are stochastic and heterogeneously influenced; transportation reshapes accessibility and supply evolves over time. This interplay yields a highly nonlinear, dynamic system, rendering traditional planning inadequate.
The spatial optimization of healthcare facilities has long been central to medical geography and urban planning. Foundational studies include the maximal covering location problem proposed by Church and ReVelle [5] and classical location–allocation models [6]. Subsequent research has expanded these approaches by incorporating accessibility measures [7], dynamic catchment areas [8], and equity-oriented analyses [9,10,11,12,13,14,15]. Despite these advances, most existing methods rely on static assumptions or single-level formulations, which are insufficient for capturing the hierarchical structure and dynamic interactions inherent in tiered healthcare systems [2,16]. In particular, the coordination of optimization across multiple service tiers remains an underexplored field, especially within policy contexts such as tiered diagnosis and treatment [1,4,17,18].
Reinforcement learning (RL), particularly its deep variants (Deep Reinforcement Learning, DRL), provides a promising paradigm for sequential decision-making under uncertainty. Recent studies have demonstrated the effectiveness of DRL in healthcare and urban systems, including medical imaging workflows [19], emergency resource allocation [20], traffic signal control [21], mobility systems [22,23], and spatial optimization problems such as facility location and coverage maximization [24,25,26,27]. However, applying DRL to city-scale hierarchical healthcare systems remains challenging. The problem involves mixed discrete–continuous decision spaces and long-horizon spatiotemporal dependencies, leading to severe credit assignment difficulties and the well-known issue of dimensionality explosion. Consequently, conventional single-level DRL approaches often suffer from instability and limited scalability.
Hierarchical deep reinforcement learning (HDRL) provides a natural solution by introducing temporal abstraction through the Option framework [28,29,30]. Recent advancements, including Option-Critic architectures [31], PPO-based hierarchical policies [32,33], DQN-style control [34], and data-efficient hierarchical variants [35], have significantly improved learning stability and scalability. The decoupling of high-level strategic decisions from low-level execution renders HDRL particularly suitable for addressing large-scale, structured optimization problems.
Despite these advances, a unified framework that simultaneously captures hierarchical system dynamics, represents patient-flow mechanisms under explicit simulation assumptions, and supports learning-based decision-making remains largely absent. Recent urban digital-twin research further highlights the value of closed-loop simulation platforms for lifecycle management and policy evaluation [36]. To bridge this gap, this study reformulates urban healthcare resource optimization as a Twin–Game, a closed-loop interaction between a simulation-based environment model and a learning-based decision agent. Specifically, we construct an Environment Twin, which simulates the complex dynamics of urban healthcare systems through a dynamic gravity model and bidirectional referral mechanisms, and a Strategy Twin, implemented as a hierarchical deep reinforcement learning (HDRL) agent that learns adaptive resource allocation strategies within this environment. Through this interaction, the framework enables systematic exploration of trade-offs between efficiency and equity, ultimately seeking Pareto-oriented solutions rather than claiming a directly observed Pareto frontier.
We test the proposed framework using Wuhan, a major medical hub in central China [37], as a real-world urban case whose facility locations, population distribution, administrative context, and travel impedance are observed. Because patient-level clinical flows and disease incidence records were unavailable, the evaluation is a calibrated simulation rather than a full empirical validation. The results demonstrate that the proposed approach can improve both system efficiency and spatial equity within the Wuhan sandbox. Therefore, claims about broader applicability are limited to methodological transferability and require further cross-city validation. The main contributions of this study are summarized as follows.
- (1)
- Environment Twin: A simulation-based digital twin is constructed as a Strategic Sandbox by integrating a dynamic gravity model with a bidirectional referral mechanism, capturing the coupling between patient attraction and system congestion under explicit assumptions.
- (2)
- Strategy Twin: A Twin–Game framework based on hierarchical deep reinforcement learning is proposed, where a DQN-based manager performs high-level spatial decision-making and PPO-based workers handle fine-grained resource allocation, effectively addressing large-scale spatiotemporal optimization challenges.
- (3)
- Case-based Simulation Evaluation: The framework is evaluated in a Wuhan digital twin parameterized by observed facility, population, and transport data, with simulated patient demand used to test efficiency, equity, and tiered-care outcomes under controlled assumptions.
2. Study Area and Data Overview
2.1. Overview of the Study Area
Wuhan, capital of Hubei Province and central China’s largest city, is the only sub-provincial city among the six central provinces [3]. The city administers 13 districts, covering a total area of 8569.15 square kilometers, with a permanent population of approximately 13.8 million [3]. As of late 2024, the city operated 7049 medical institutions—85 tertiary hospitals, 98 secondary hospitals, 6531 primary healthcare institutions, 80 specialized public health institutions, and 65 other facilities—collectively providing 106,400 beds, or 7.61 beds per thousand residents [37]. However, the healthcare landscape is characterized by centripetal clustering: premium resources are concentrated in core districts such as Wuchang and Jianghan, driving irrational patient flows and leaving primary care utilization rates below 50% [37,38].
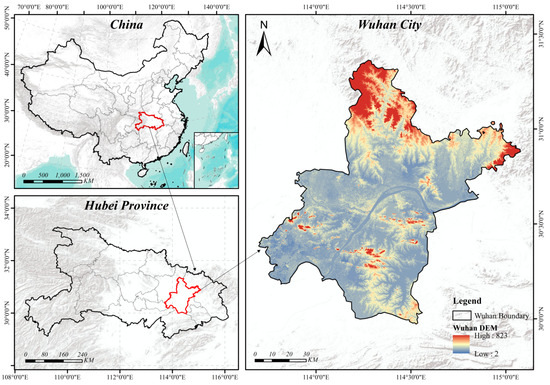
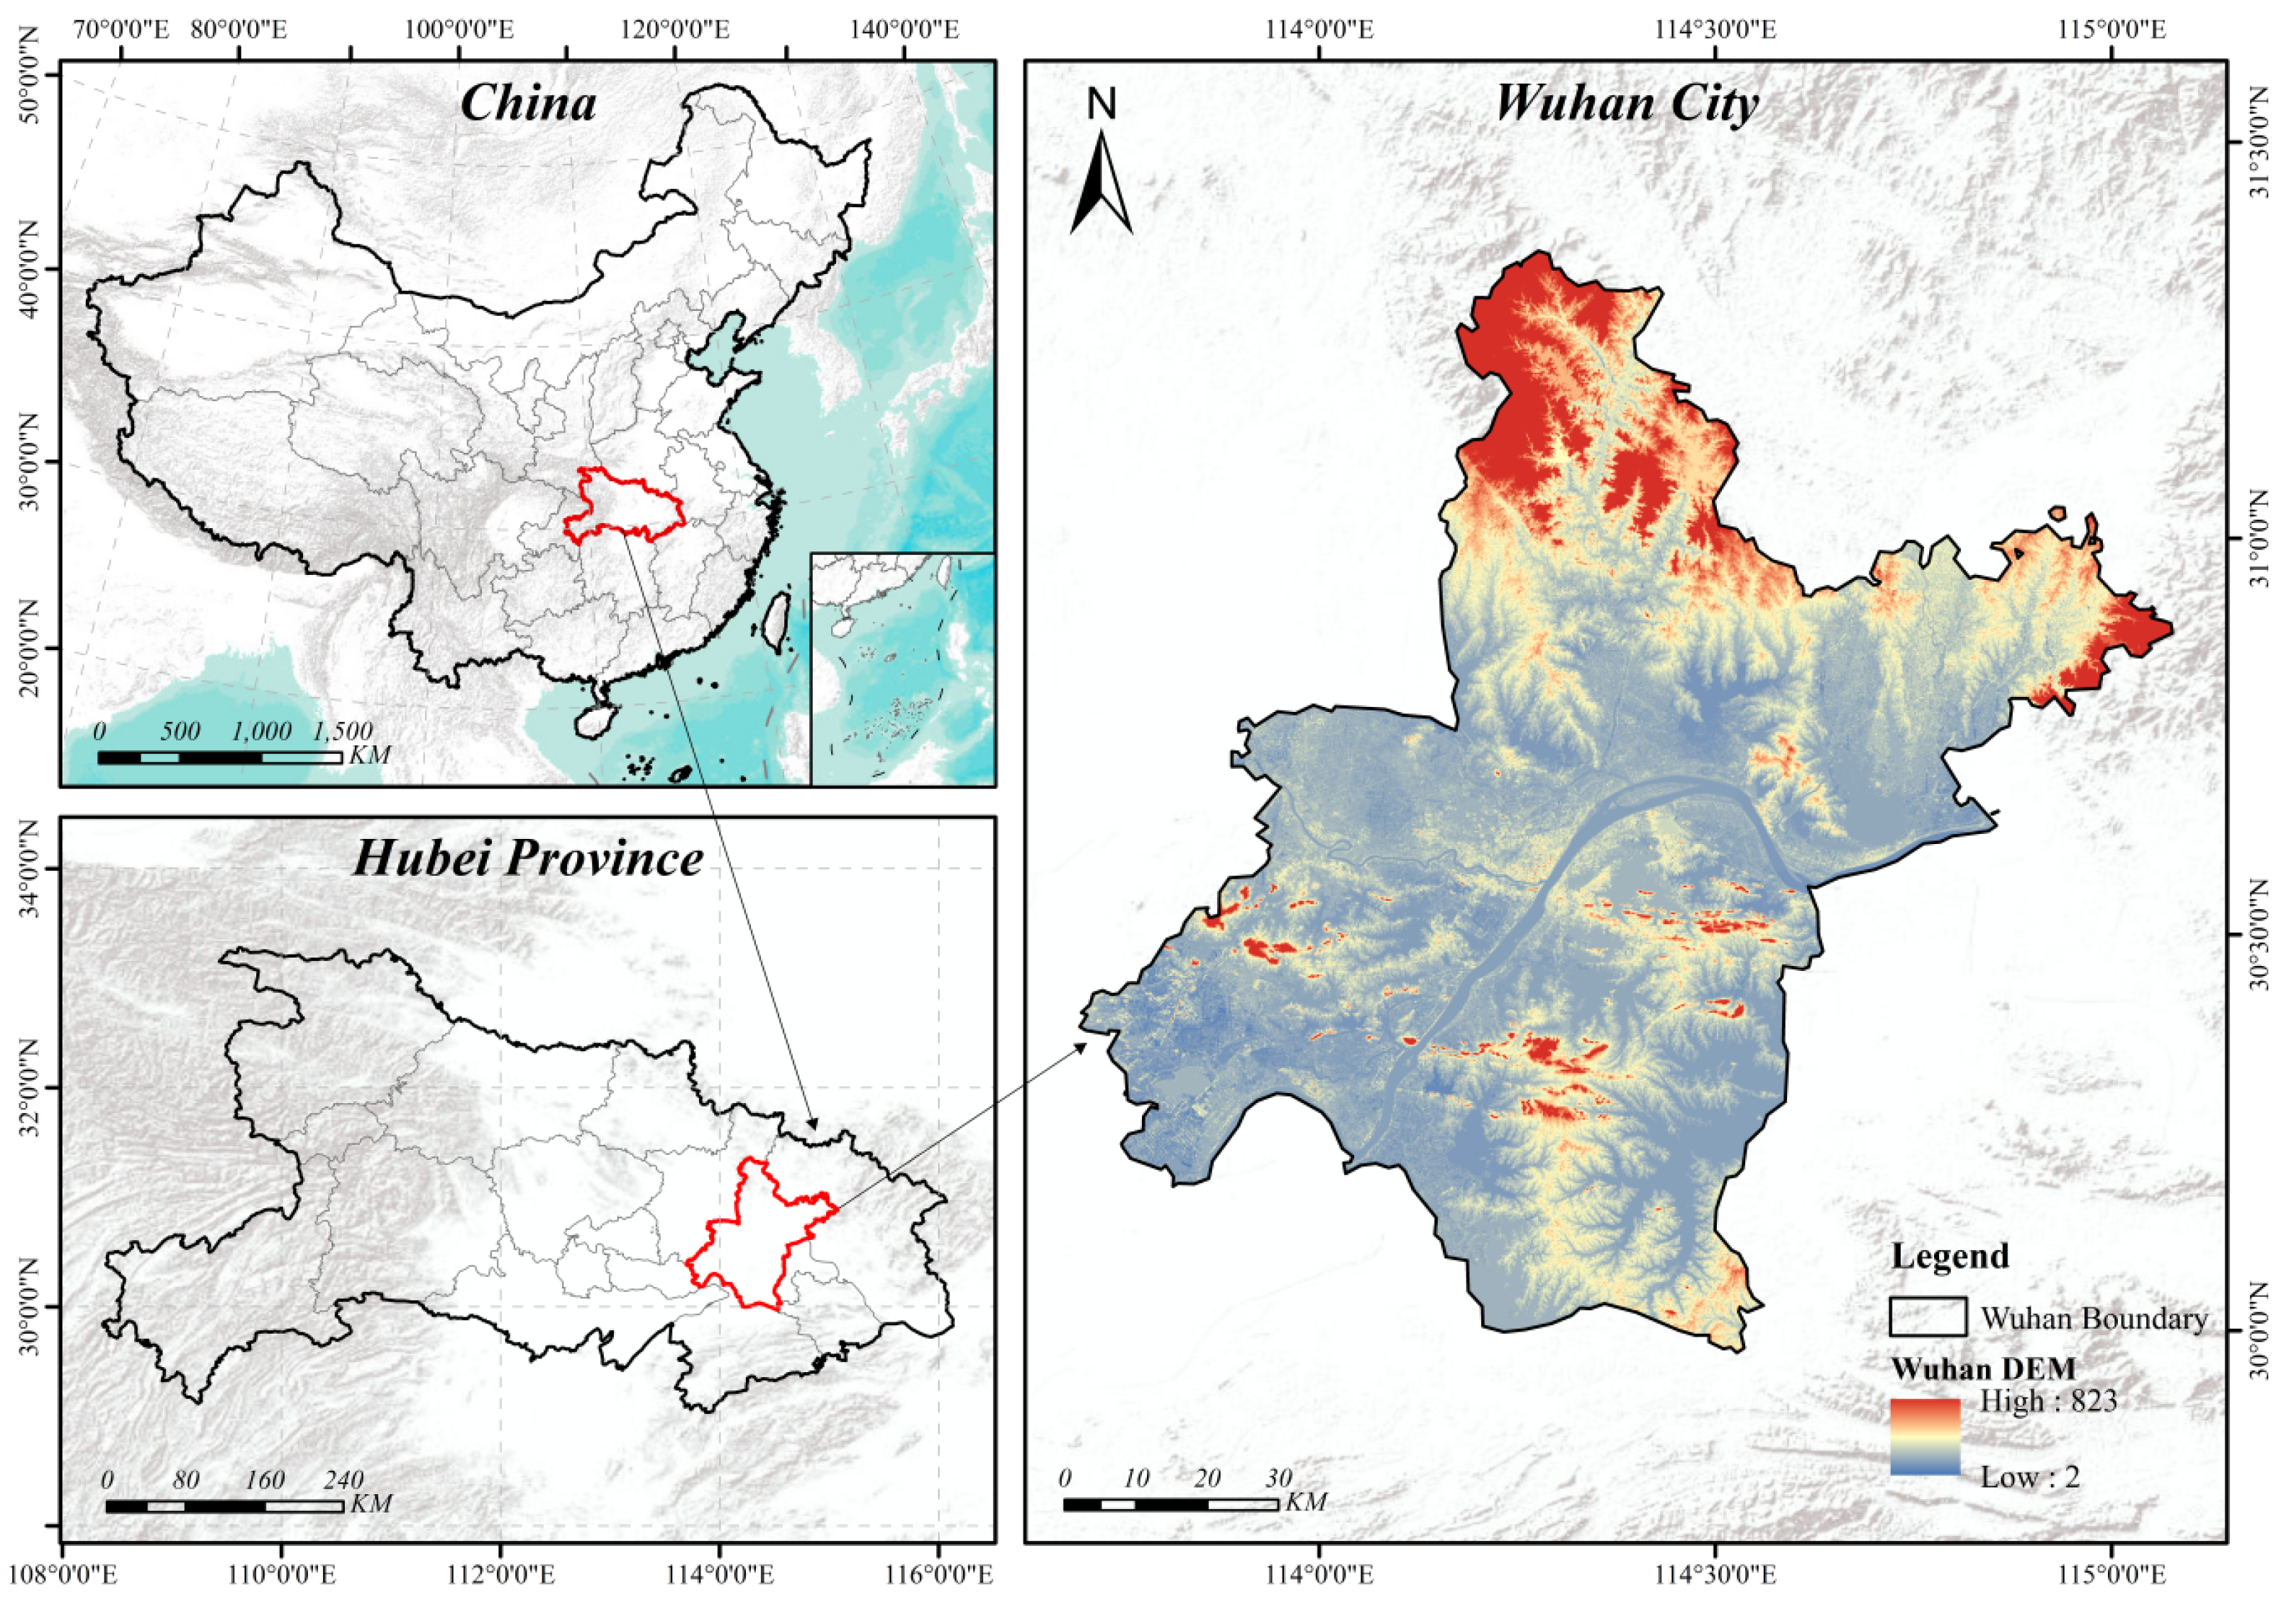
The geographic distribution of Wuhan’s healthcare resources exhibits pronounced centripetal clustering, with core urban districts like Wuchang, Jianghan, and Qiaokou dominating access to premium resources [38]. This spatial polarization, coupled with resource scarcity in outlying districts, directly fuels irrational patient behavior in healthcare seeking. Figure 1 shows the geographic scope and administrative divisions of Wuhan City. Currently, tertiary hospitals in central districts face systemic risks due to prolonged overcapacity, while utilization rates at primary-level institutions remain below 50%, highlighting resource idleness and waste. Therefore, addressing spatial mismatches and establishing balanced tiered healthcare systems have become urgent priorities for enhancing urban public health resilience [39,40]—a critical challenge shared by major cities nationwide.
Figure 1.
Study area map. Geographic scope and administrative divisions of Wuhan City.
2.2. Data Sources and Processing
Table 1 summarizes the data sources used in this study, and Table 2 lists the preprocessing workflow.
Table 1.
Data sources used in this study.
Table 2.
Data preprocessing workflow.
It should be emphasized that the observed datasets and the simulated datasets play different roles. Official facility records, LandScan population grids, administrative statistics, and road-network travel times provide the empirical spatial structure of the Wuhan case. In contrast, daily patient flows and disease incidence profiles are generated within the digital twin because privacy-protected individual-level hospital visit trajectories and diagnosis records were not accessible. Accordingly, this study evaluates whether the proposed decision framework performs well under a transparent and reproducible Wuhan-parameterized simulation, but it does not claim direct validation against observed individual patient trajectories.
Hospital inclusion criteria. Not every point labelled as a medical POI was included in the optimization set. Facilities were retained only when they met the following criteria: (1) the institution appeared in official Wuhan Municipal Health Commission records or could be matched reliably to a verified Amap POI; (2) its geographic coordinates and administrative district were available after geocoding; (3) its service tier could be identified as tertiary hospital, secondary/general hospital, or primary/community health service institution; and (4) basic capacity information, such as beds or an equivalent service-capacity proxy, could be assigned. Duplicated POIs, non-clinical administrative offices, pharmacies, laboratories without outpatient service, and records with unresolved locations were excluded. The final facility set therefore represents clinically relevant service providers rather than all healthcare-related POIs.
The grid was selected as a compromise between spatial detail and computational tractability. It is finer than most subdistrict-level planning units and is comparable to a walkable neighborhood scale, while keeping the state and action representations manageable for city-scale HRL training. Because results in spatial analysis may be affected by the modifiable areal unit problem (MAUP), Section 5.6 reports a grid-size sensitivity analysis using coarser and finer alternatives.
2.3. Analysis of Wuhan’s Healthcare Facility Landscape
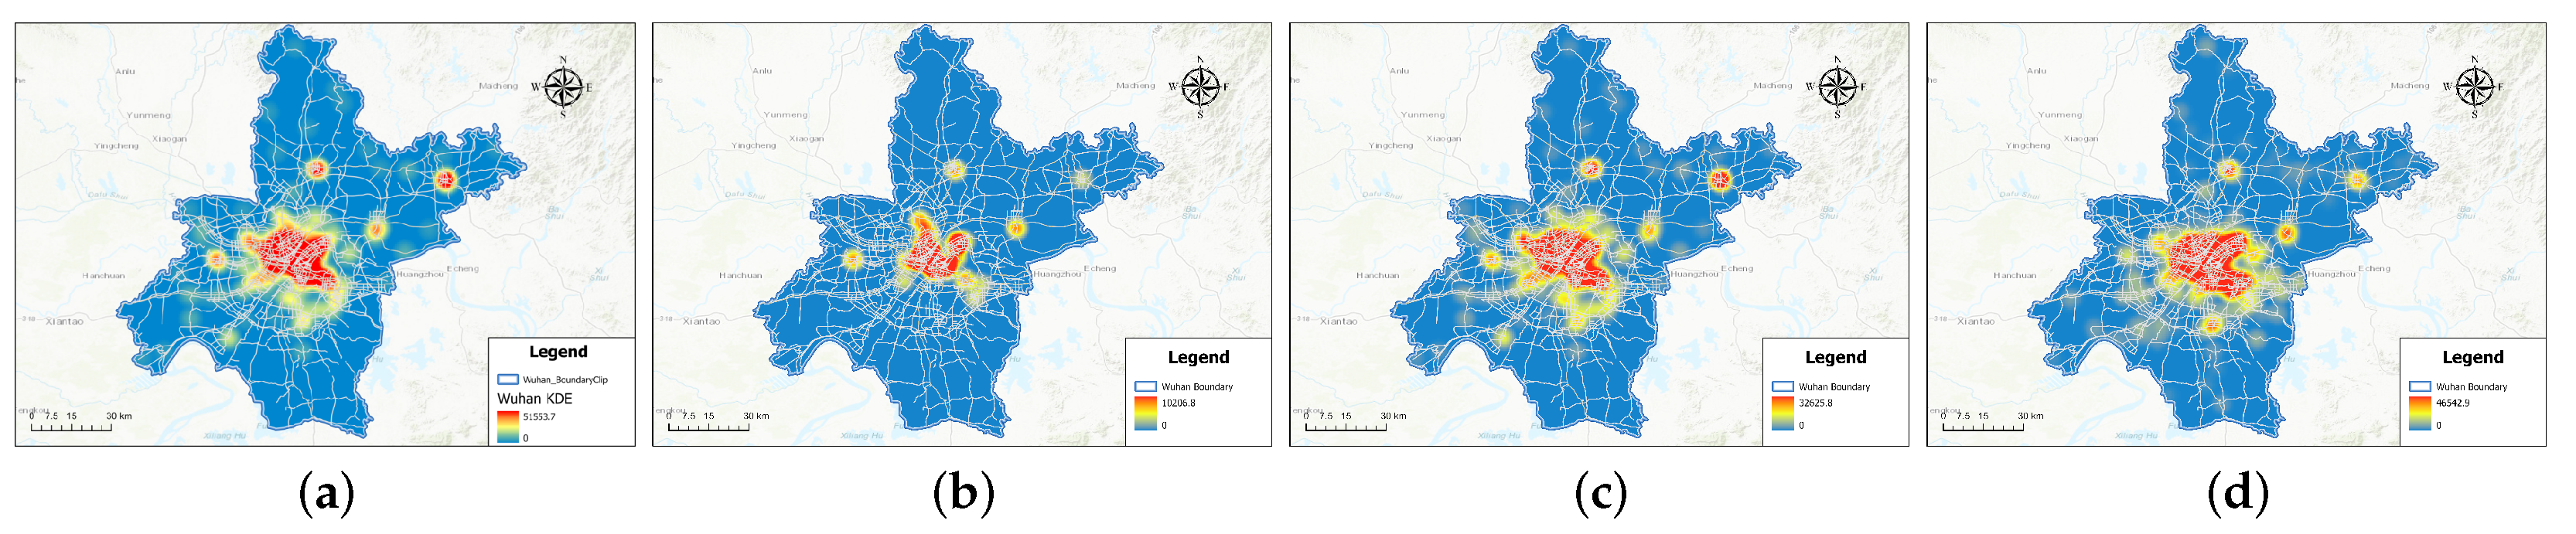
We categorized the 7049 healthcare institutions in Wuhan into three tiers—tertiary hospitals, general hospitals, and community health service centers—to assess their influence. Our kernel density analysis (Figure 2) reveals three core “game imbalances” in Wuhan.
Figure 2.
Kernel density analysis map of Wuhan’s medical resources. Spatial concentration of healthcare facilities by tier. (a) All institutions combined; (b) tertiary hospitals; (c) general hospitals; (d) community health service centers.
Through further data investigation, we identified the following characteristics of Wuhan’s medical facilities.
(1) Spatial Polarization: Medical resources exhibit a distinct “center-periphery” structure with a vacuum in peripheral zones. High-quality tertiary hospitals are highly concentrated in the city’s core areas, forming powerful medical hubs. In contrast, outlying districts and emerging population centers face a scarcity of quality resources. Residents in these areas must engage in long-distance “healthcare seeking games” to access quality care, which not only increases healthcare costs but also exacerbates traffic congestion and medical pressure in central districts.
(2) Structural “Goliath” Effect: Institutional setup exhibits a pronounced top-heavy imbalance. A few massive tertiary hospitals monopolize the vast majority of beds and hardware resources, boasting massive scale and comprehensive functions. In contrast, most primary-level institutions, such as community health service centers, appear underpowered and under-resourced. This structure renders primary-level facilities incapable of fulfilling their role as “health gatekeepers,” failing to effectively divert patients with common and chronic conditions.
(3) Efficiency Deadlock: This uneven distribution directly causes extreme disparities in resource utilization efficiency. Tertiary hospitals in central urban areas operate in a state of chronic overload, with bed shortages, immense pressure on medical staff, and potential risks to healthcare quality. Meanwhile, secondary hospitals and primary institutions in outlying districts face resource idleness, low bed occupancy rates, and underutilized service capacities, resulting in significant wasteful allocation. The system is thus locked in an efficiency deadlock between overload in the center and idleness in the periphery.
This “spatial concentration, structural imbalance, and efficiency disparity” is the core challenge and must be addressed to advance tiered diagnosis and resource decentralization.
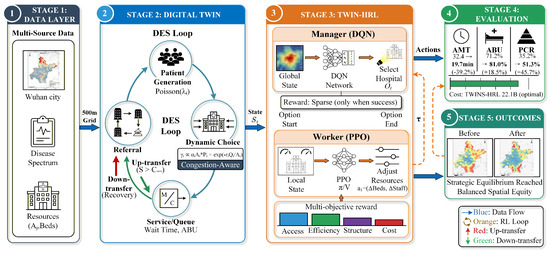
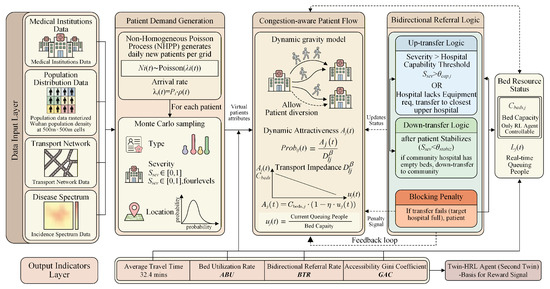
Figure 3 outlines the pipeline: Data Layer → first twin, digital twin with patient generation, congestion-aware choice, and referral logic → second twin, Twin–Game with Manager–Worker. Percentages shown in the figure such as 66.7% denote BTR; PCR and Gini are given in Table 6.
Figure 3.
Twin–Game optimization workflow: Digital twin-driven hierarchical reinforcement learning for adaptive urban healthcare resource allocation.
3. Methodology I: Modeling the Game Environment with an Urban Healthcare Digital Twin
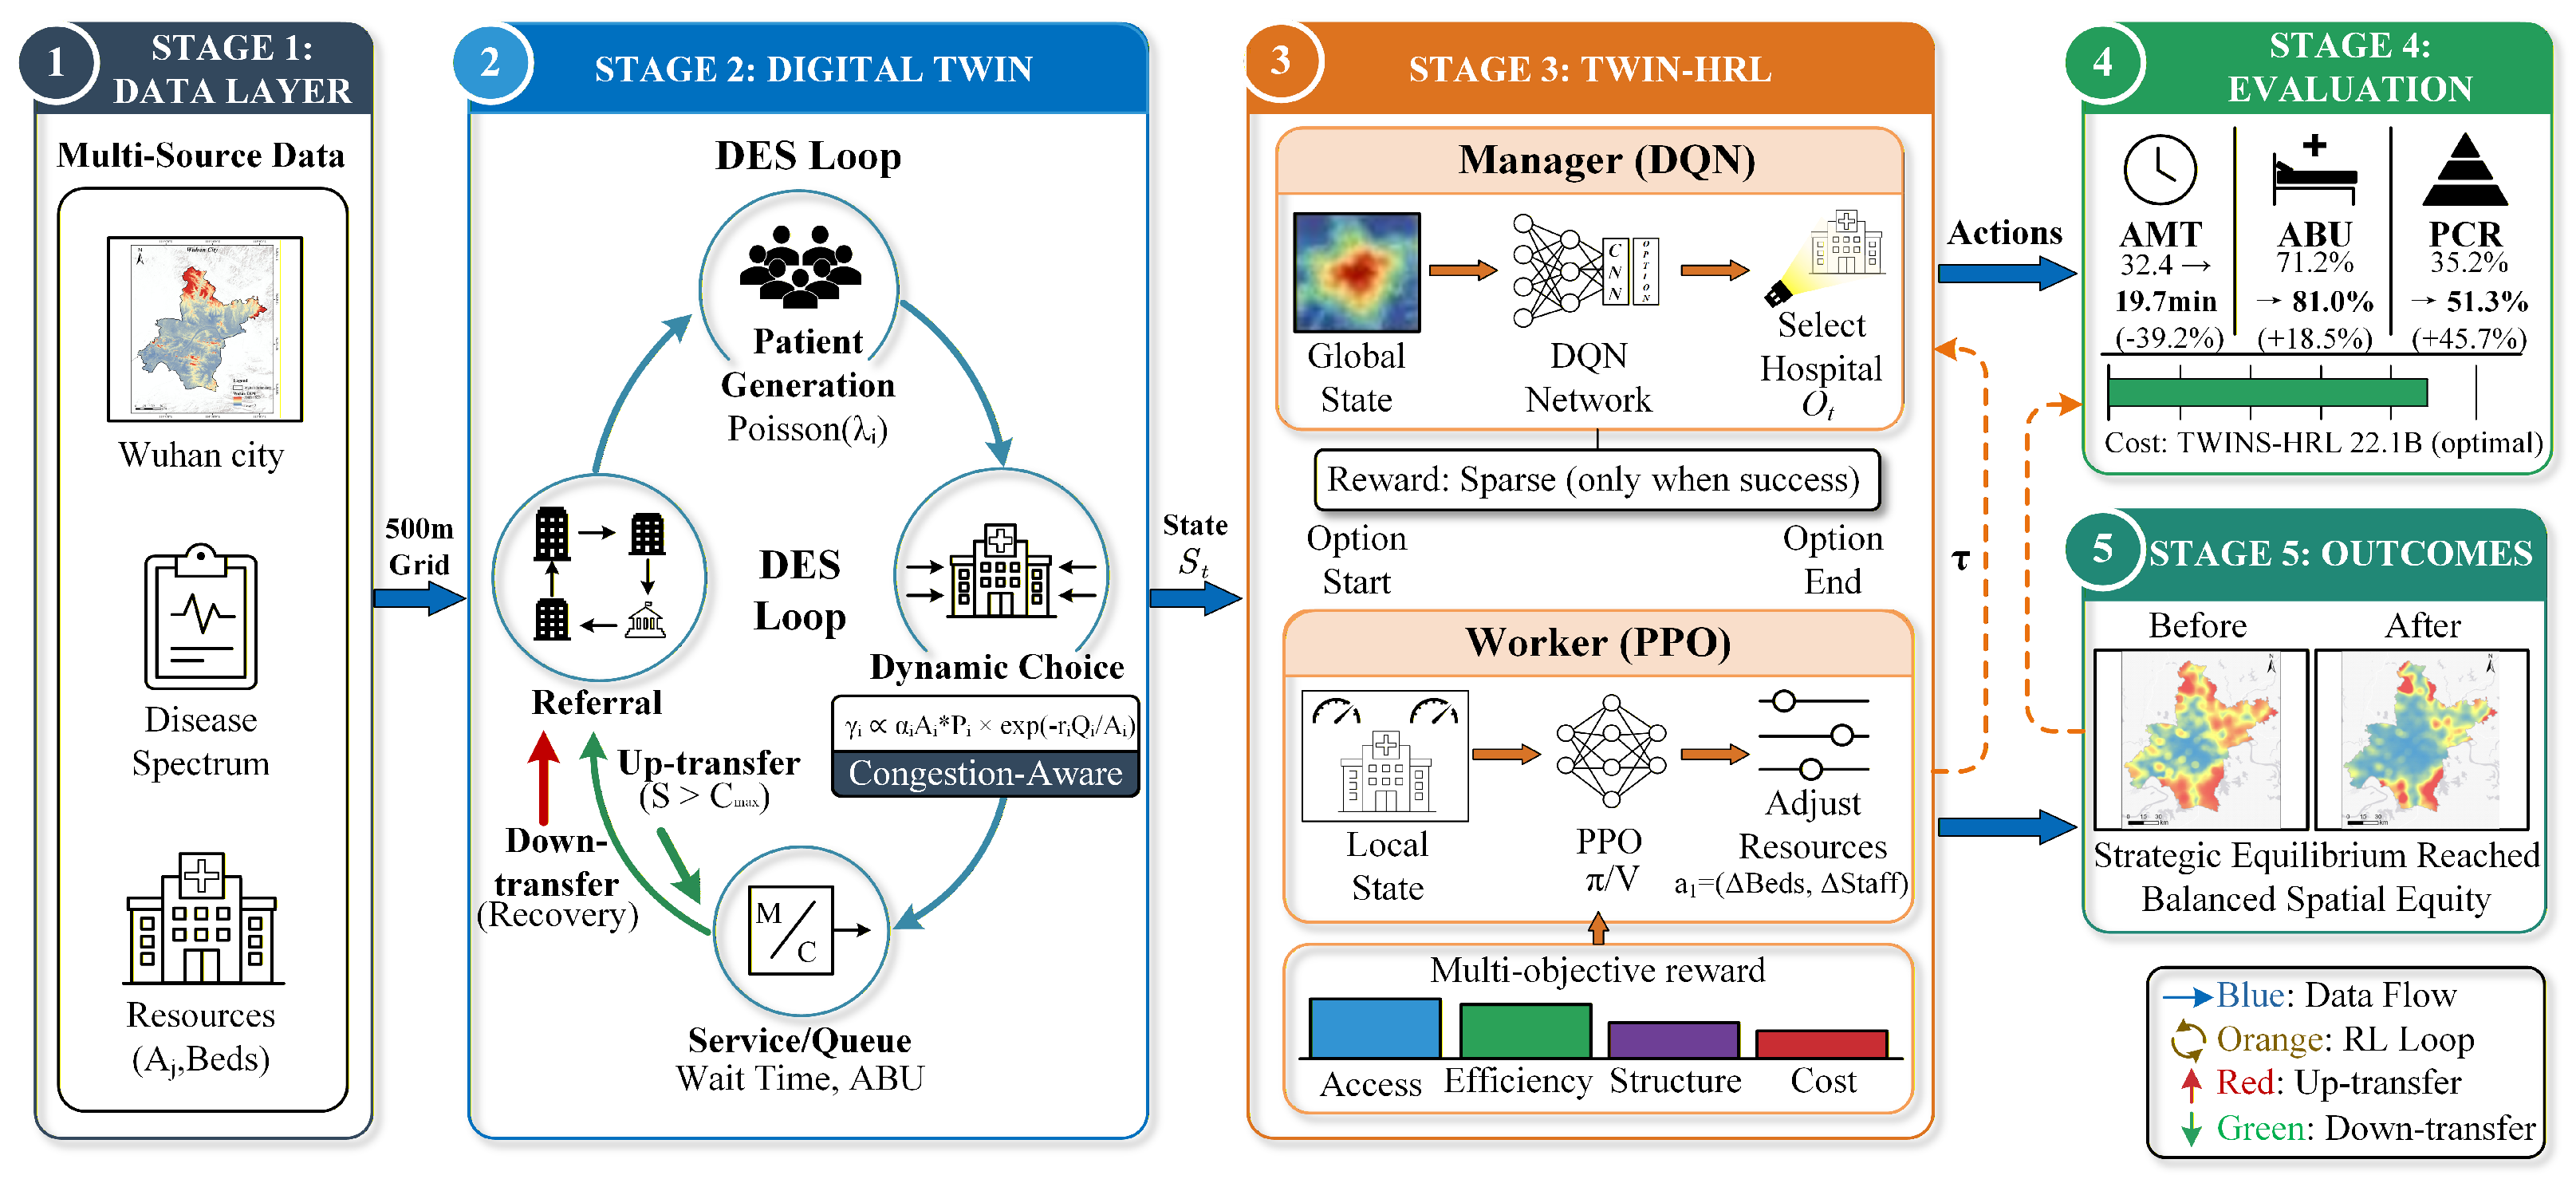
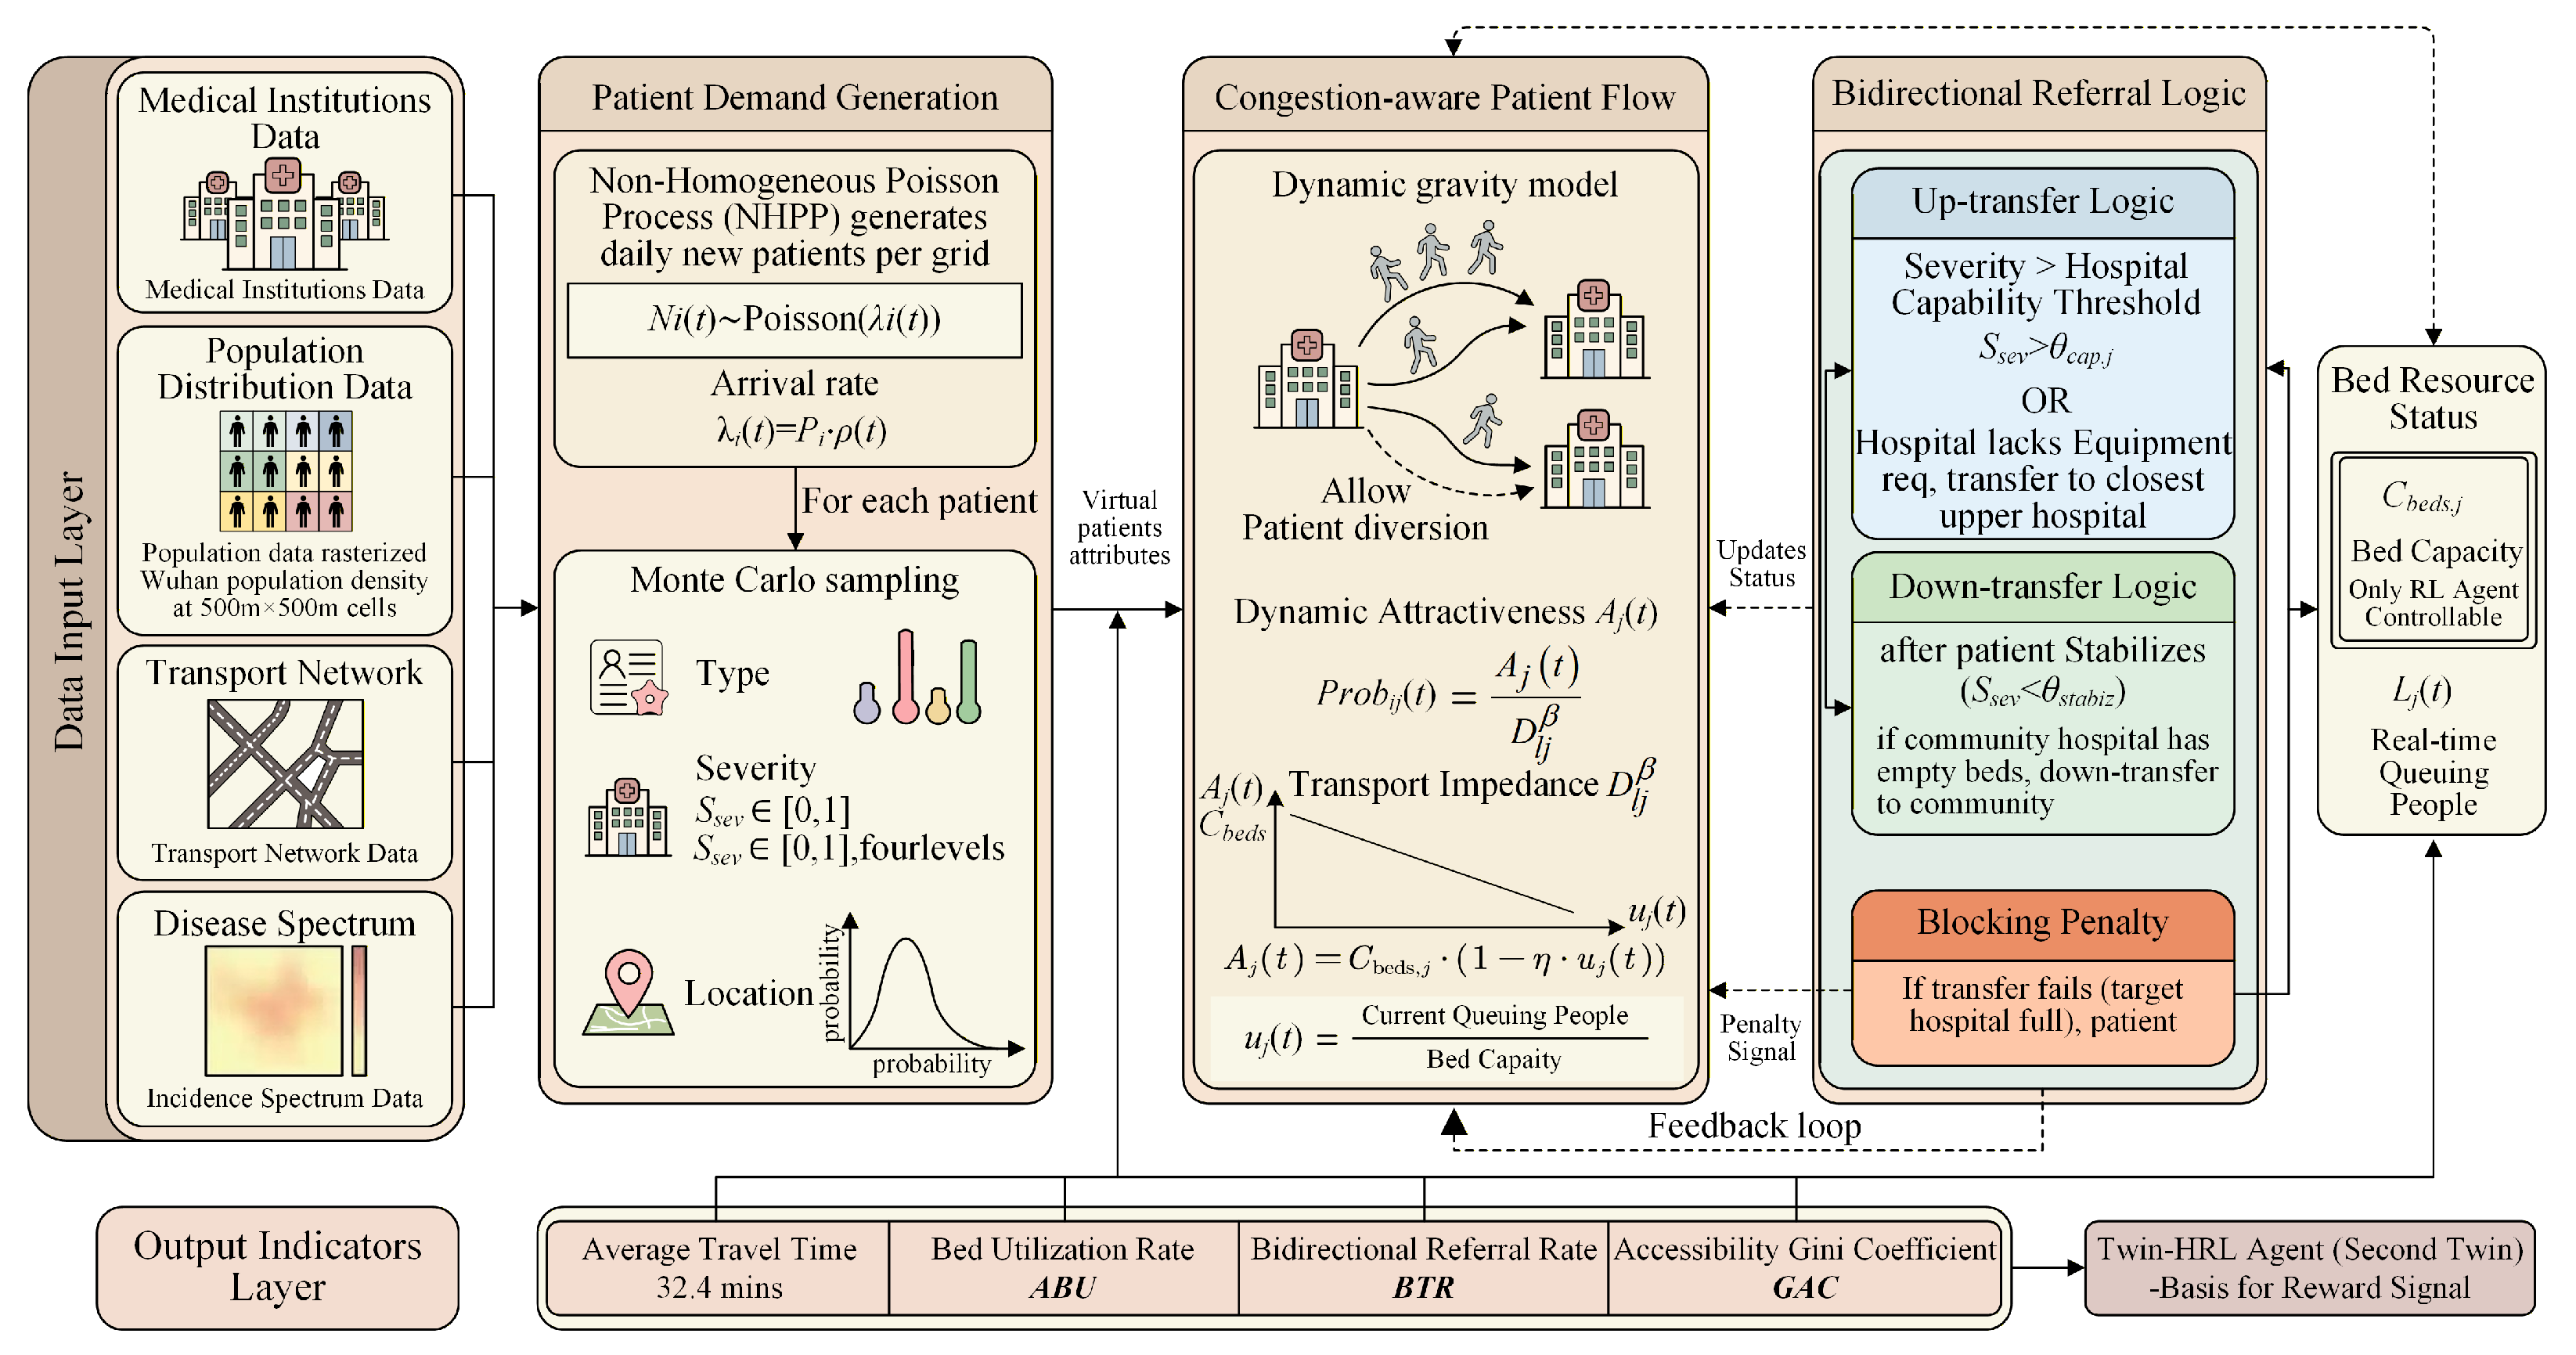
To describe the urban healthcare digital environment, we modeled patient demand, healthcare settings, and treatment processes in Wuhan City under explicit simulation assumptions. This resulted in the construction of a simulation-based digital twin that serves as the Strategic Sandbox for Wuhan’s urban healthcare system, enabling policy evaluation and resource allocation decisions [41,42,43]. Spatiotemporal big data platforms and urban simulation frameworks provide foundational support for this integrative modeling approach [44,45]. Figure 4 illustrates the architecture of this first twin (the Strategic Sandbox).
Figure 4.
First twin (digital twin Strategic Sandbox). Architecture or workflow of the Environment Twin used for patient demand generation, congestion-aware facility choice, and bidirectional referral simulation.
3.1. Spatiotemporal Demand Generation
To represent the randomness and spatiotemporal heterogeneity of urban healthcare demand in the absence of individual-level visit records, we developed a patient demand generator based on a Non-homogeneous Poisson Process (NHPP). This choice is a parsimonious approximation commonly used for count arrivals. It captures first-order variation in population exposure and temporal seasonality, but it does not explicitly model contagion, behavioral feedback, socio-economic heterogeneity, or day-to-day dependence. Therefore, conclusions drawn from this component should be interpreted as scenario-based simulation results rather than forecasts of actual daily visits.
With the city divided into N grid regions, daily new patients in region i at step t follow:
where is the regional population and is the seasonality curve estimated from aggregated monthly outpatient statistics. Specifically, monthly outpatient counts were first normalized by their annual mean to obtain twelve relative intensity factors; these factors were then fitted with a periodic smoothing curve and linearly interpolated to the daily simulation step. The aggregate intensity is scaled so that the citywide daily volume is consistent with reported annual outpatient levels, and spatial heterogeneity is introduced through the population surface. More complex demand generators, such as negative-binomial arrivals, agent-based health-seeking models, or models conditioned on age and income, are reserved for future work when more detailed data become available.
(1) Patient Arrival Generation: The NHPP component first generates the number of new patients in each grid and time step according to Equation (1), thereby creating the spatiotemporal demand volume entering the healthcare system.
(2) Disease Attribute Sampling: For each generated patient p, we assign disease attribute tuples using Monte Carlo sampling . Disease type is sampled according to aggregate disease-spectrum proportions rather than individual diagnosis records. Severity is a normalized value used for subsequent referral threshold determination, following the four-level disease severity classification standard from emergency medicine [46]; Table 3 gives the four levels. Location is set to the geometric center corresponding to the grid cell i.
Table 3.
Four-level disease severity classification.
3.2. Coupled Patient Flow Dynamics
This serves as the core physical engine of the Strategic Sandbox. Unlike static planning models, patient flow within this environment depends not only on distance but also dynamically couples with the hospital’s real-time state, similar to cyberGIS-based urban analytics [47].
We propose the Congestion-Aware Dynamic Gravity Model [48]. For a patient residing in region i, the probability of selecting healthcare facility j is defined as:
Here denotes traffic impedance between region i and institution j, determined based on road-network travel time; is the distance decay exponent in the gravity model. Because complete historical origin–destination patient flows were unavailable, was not calibrated against individual patient trajectories. Instead, it was chosen from values commonly used in healthcare accessibility and gravity-model studies, then adjusted so that simulated catchment patterns were plausible relative to Wuhan’s observed center–periphery facility structure and checked through sensitivity analysis. is dynamic attractiveness, a function of physical facilities and congestion levels.
The Coupling Mechanism: To simulate “crowd avoidance” behavior, the attractiveness nonlinearly decays with the real-time crowding level of the facility:
Here is the total number of beds in facility j, a variable adjustable by the RL agent’s action ; is the current number of people waiting in line; and is the crowding penalty factor. That is, when the RL agent increases the number of beds at a hospital, the hospital’s crowding decreases, its attractiveness increases, and the likelihood of diverting more patients increases. In-facility time for patient p is the sum of queueing delay and service duration; in the simulation it is determined by the chosen facility’s current queue length and service capacity.
3.3. Bidirectional Referral Logic
To simulate tiered healthcare policies, we embedded a rule-based state machine within the environment [49].
(1) Up-transfer logic: When a patient p arrives at the initial care facility j, an up-transfer is triggered if any of the following conditions is met:
The parameter is the service capacity threshold of institution j; when exceeds this value, an up-transfer is triggered (lower thresholds for primary care hospitals, higher for tertiary hospitals). The threshold values follow tiered-care policy logic and were set within clinically plausible ranges reported in the literature, then checked through sensitivity analysis. The set denotes facility j’s equipment set, temporarily represented by the number of available beds. Beds are used as a capacity proxy because consistent facility-level bed information is available for all hospitals, whereas detailed equipment inventories are incomplete in the public data. When the condition holds, the patient is redirected to the nearest eligible higher-level hospital .
(2) Down-transfer logic: When a patient p at a higher-level hospital k enters the recovery phase, i.e., , and their local community center c has available resources, i.e., , a down-transfer is triggered.
Blocking and Penalty: If a “required-to-transfer-but-not-transferred” situation occurs due to bed unavailability at the higher-level hospital, the patient remains at the current tier, resulting in a negative reward for the system. This penalty is implicitly reflected in the accessibility reward and structural reward.
3.4. Multi-Objective Evaluation System
We evaluate the system along three dimensions: accessibility (average travel time and equity of care time distribution), efficiency (bed utilization level and spatial balance), and structure (tiered diagnosis and treatment flows). The corresponding symbols and formal mathematical definitions are given in Table 4 and Table 5 in Section 5.2.
Table 4.
Evaluation metrics and definitions.
Table 5.
Formal definitions of evaluation metrics (notation: ; = mean total care time; = bed occupancy at facility j).
4. Methodology II: Twin–Game Optimization Framework
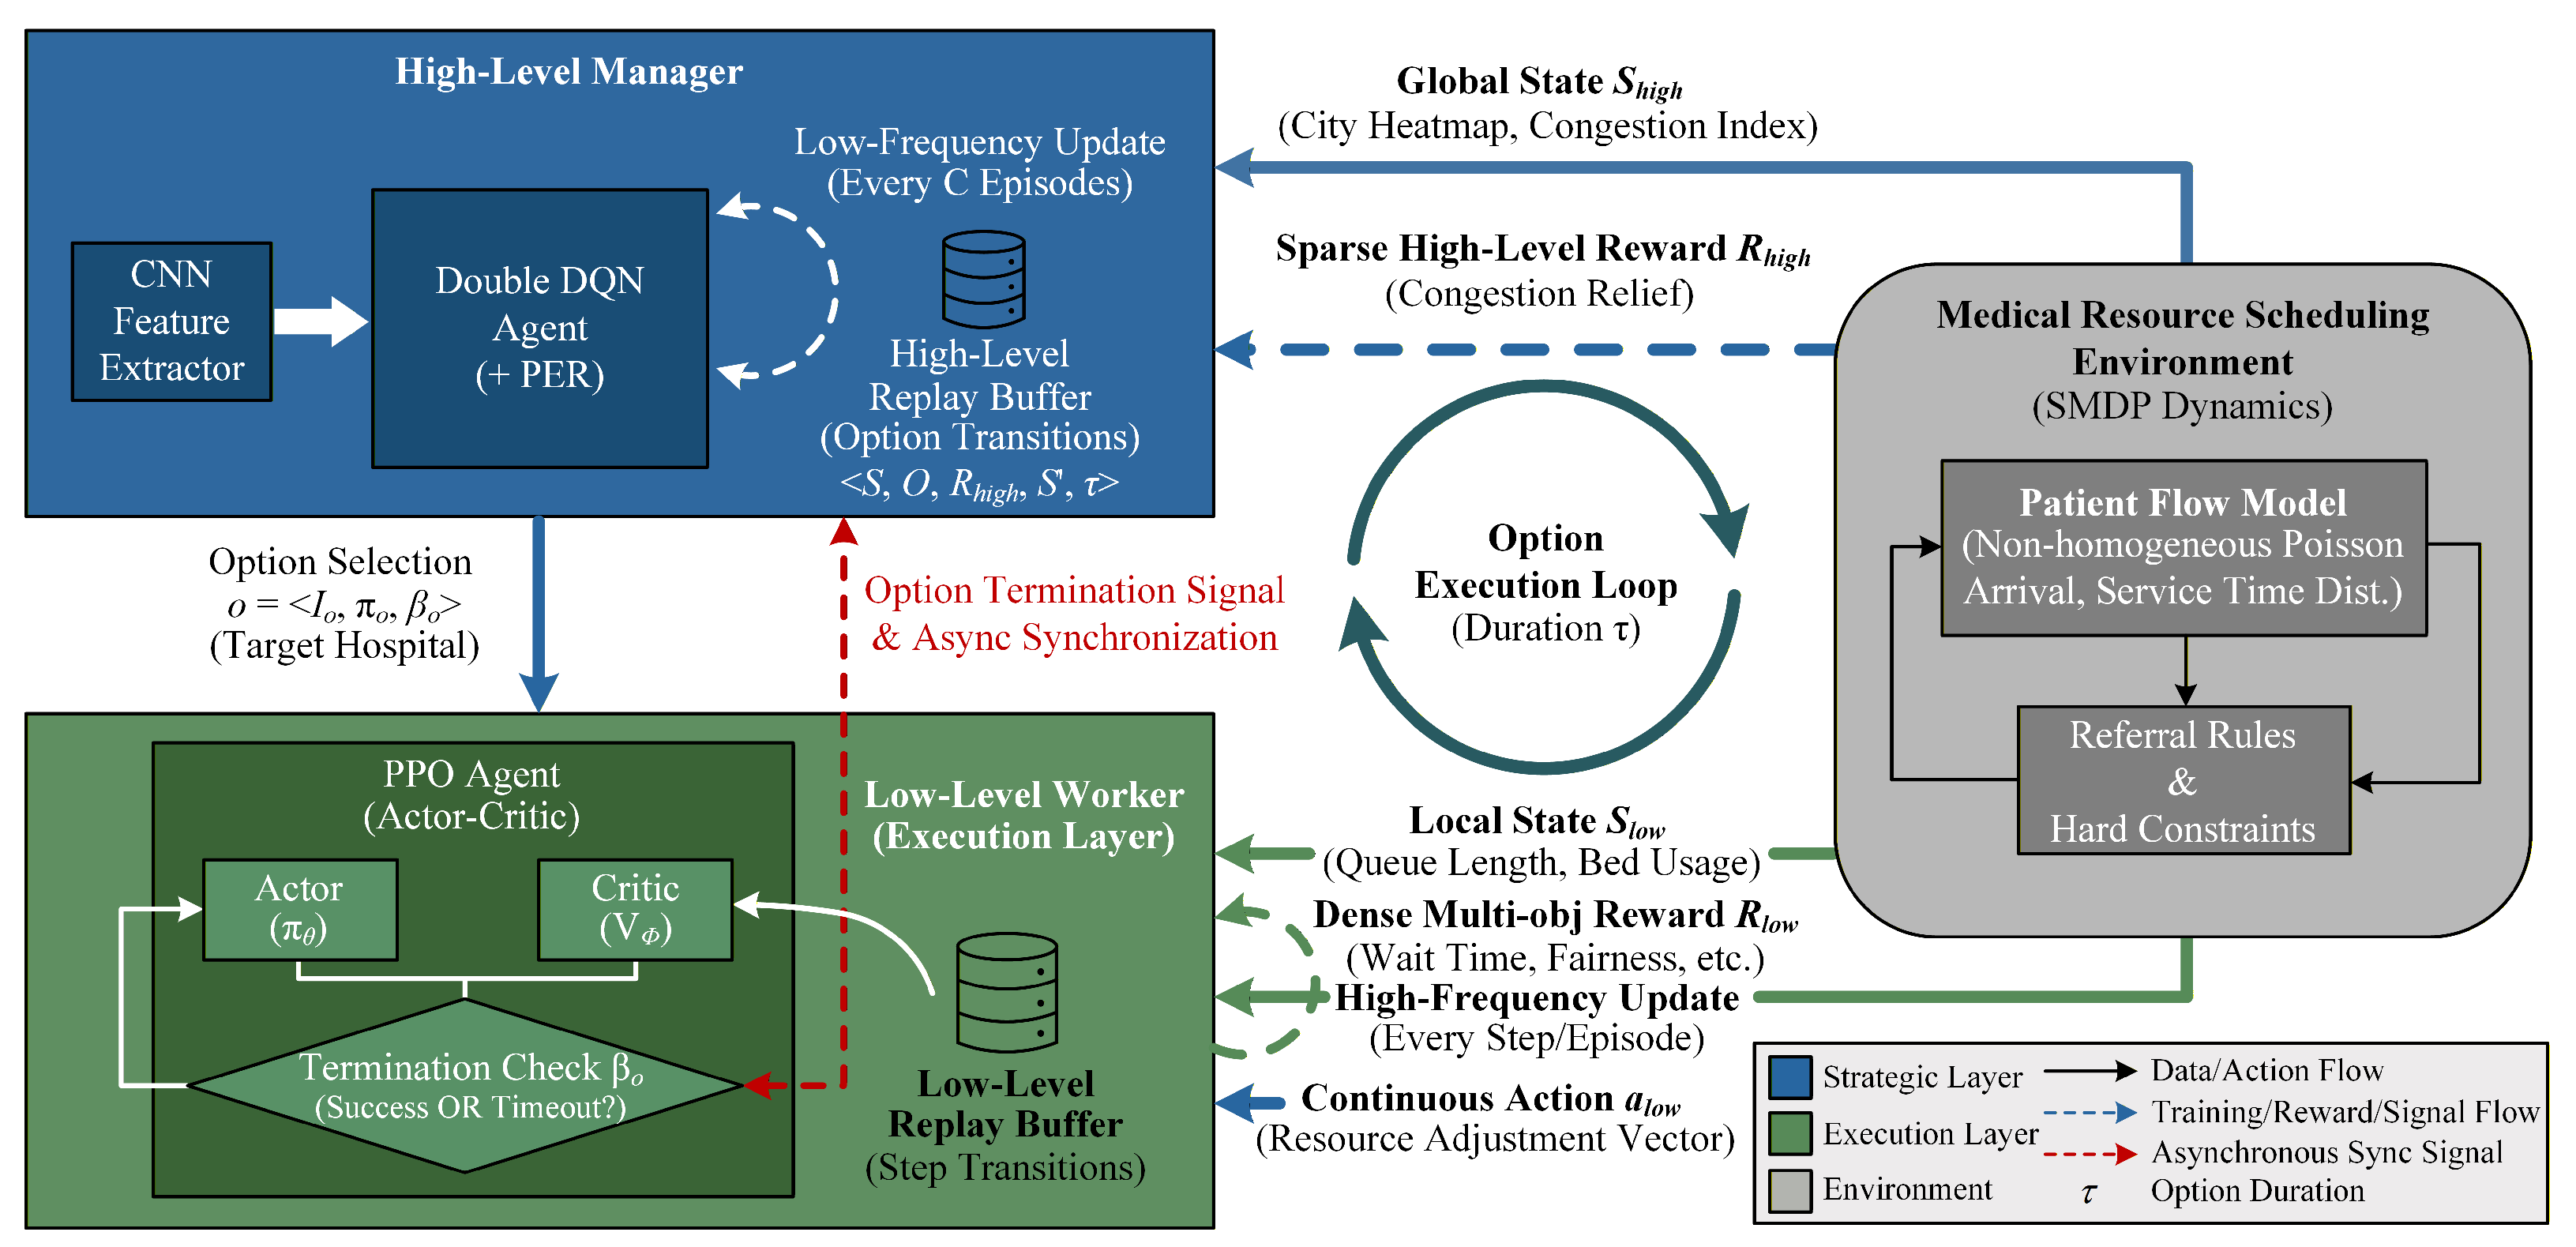
The practical role of Twin–Game is to serve as an offline decision-support and policy-screening system for health authorities, rather than an automatic real-time command system. In a real deployment, the workflow can be initiated as follows. First, municipal health departments integrate facility registries, bed capacity, staffing information, population distribution, and travel-time data into the Environment Twin. Second, planners define policy constraints, such as maximum feasible bed expansion, staffing limits, budget ceilings, and tiered-care targets. Third, the Strategy Twin is trained or updated in the sandbox and generates candidate interventions, including where additional capacity is most needed, which facilities should be prioritized for staffing adjustment, and how referral rules may redistribute patients. Finally, the recommended strategies are reviewed by domain experts and decision-makers before phased implementation. Thus, Twin–Game functions as a transparent “what-if” simulation platform for comparing allocation policies before real-world intervention. Figure 5 summarizes the hierarchical reinforcement learning algorithm used in the Strategy Twin.
Figure 5.
Conceptual diagram of HRL algorithm. Hierarchical decision structure and data flow.
4.1. Problem Formulation Based on Semi-Markov Processes
The medical resource scheduling problem exhibits hierarchical decision-making characteristics, making it difficult to accurately model using traditional Markov Decision Process (MDP). This study formalizes the problem as a Semi-Markov Decision Process (SMDP), where the decision time span is determined by the duration of Option execution, accurately reflecting the temporal scale difference between high-level strategic decisions and low-level operational execution.
Formal Definition: The healthcare resource scheduling problem is defined as an SMDP tuple
The state space is divided into the high-level , capturing city-wide macro-level status such as healthcare resource heatmaps, crowding indices, and referral flow matrices, and the low-level , capturing individual hospital micro-level status such as queue lengths, bed occupancy rates, and medical staff allocation. The action space represents discrete selection of existing hospitals or candidate facility sites, and represents continuous resource adjustment or activation-and-scaling vectors. An Option is a triplet
where denotes the activation condition set, the underlying policy, and the termination probability function. The transition P is given by the patient flow dynamics (NHPP arrivals, referral rules, resource constraints); the duration of Option execution is the SMDP time scale. High-level rewards are sparse (feedback when an Option alleviates congestion) and low-level rewards dense; the value function uses continuous-time discounting over Option steps.
4.2. Hierarchical Architecture with Spatio-Temporal Abstraction
The Twin–Game architecture originates from framing the interaction between the digital twin and the hierarchical policy as a game: the first twin provides the Strategic Sandbox, the second twin learns the strategy. Recent work on deep RL for spatial optimization has demonstrated the feasibility of learning-based approaches for facility location and coverage problems [24,25,50], while recent digital-twin studies emphasize the role of dynamic simulation in urban decision support [36]. This achieves an isomorphic mapping between problem structure and solution structure.
4.2.1. Design Philosophy
Decisions are decoupled along space (upper: discrete hospital choice over N; lower: continuous allocation in ), information (upper: aggregated heatmaps; lower: per-facility status), and time (upper: infrequent Option choices; lower: frequent step-level execution).
4.2.2. Option Framework
An Option is defined as the triplet in Equation (7).
(1) Activation Condition : Triggered by threshold-based mechanisms, activated only when hospital congestion index, queue length, or bed utilization exceeds warning thresholds. Formally defined as:
(2) Base Policy : Learned with PPO; the action vector encodes resource adjustments (beds, personnel).
(3) Termination Condition : Terminates when congestion eases, i.e., , or upon execution timeout , ensuring system responsiveness.
4.3. High-Level Strategy: Target Selection
The Manager, based on DQN, identifies the most critical intervention points across the entire city healthcare system.
4.3.1. Action Space
The high-level action space is defined as , where only hospitals or candidate facility sites meeting activation criteria enter the candidate set. Existing hospitals are selected for capacity and staffing adjustment, whereas candidate sites are used only in scenario analysis to test possible additions of general hospitals or community health service centers. This implements state-dependent action filtering to enhance exploration efficiency and clarifies the link between formal actions and the spatial planning outputs.
4.3.2. Network Architecture
A convolutional neural network (CNN) extracts spatial features from the city heatmap, capturing spatial correlation patterns between hospitals through multiple convolutional layers. The output layer employs a Q-value head to compute the action value for each hospital.
4.3.3. Training Algorithm
The Manager is trained with Double DQN and Priority Experience Replay (PER) to minimize TD error and improve sample efficiency [34].
4.3.4. Sparse Reward Design
High-level rewards provide significant positive feedback only when the Option succeeds [30,33]:
The three components represent congestion relief reward, queue improvement reward, and efficiency penalty, respectively. The coefficients – are set following the sparse-reward design principles for hierarchical decision-making [28].
4.4. Base Strategy: Continuous Resource Scaling
To execute each Option’s fine-grained controls, the Worker employs PPO to search for optimal resource scaling schemes—including bed expansion ratios and personnel scheduling—within a continuous action space. This complements the Manager’s discrete spatial attention allocation with dense, step-level feedback.
4.4.1. Continuous Action Space
The underlying action vector is defined as , representing adjustments to bed capacity and various medical personnel categories, subject to safety boundary constraints and resource allocation constraints. For candidate facility sites in scenario analysis, the same action vector is interpreted as an activation-and-scaling decision: a site is selected only if the high-level Manager chooses it and the resulting capacity adjustment exceeds the minimum feasible planning threshold. These candidate-site outputs are planning scenarios rather than direct construction decisions.
4.4.2. PPO Algorithm
The Worker is trained with PPO: a Gaussian policy for the Actor and a value head for the Critic, updated via the clipped surrogate objective and GAE for the advantage [32].
4.4.3. Multi-Objective Compound Reward System
To guide the Workers in alleviating congestion while aligning with tiered diagnosis and treatment policies, we designed a five-dimensional compound reward function encompassing accessibility, efficiency, fairness, structure, and cost. This function is computed at each time step t to guide agents toward exploring the Pareto optimal frontier:
The sub-rewards are defined as follows.
(1) Accessibility Reward (). Aims to minimize patients’ time costs. We directly penalize the average total care time within the system:
where is the total care time for patient i. Waiting time remains the main controllable component inside the simulator, but evaluation uses the broader total-care-time metric for consistency.
(2) Efficiency Reward (). Aims to optimize resource utilization and balance load. Defined as
(3) Healthcare Equity Incentive (). To prevent “sacrificing the interests of a minority for overall efficiency,” we introduce the Gini coefficient as a penalty term on total care time so that regional disparities in healthcare accessibility remain within reasonable bounds [51,52]:
Using total care time rather than waiting time alone keeps the training objective aligned with the accessibility metric reported in Table 4. Waiting-time variance is still implicitly reduced because travel and queue delays co-vary in the simulator.
(4) Tiered Diagnosis and Treatment Structure Incentive (). This rewards alignment with tiered diagnosis and treatment policy (“primary care as first contact, two-way referrals, separation of acute and chronic care”) [2,49]:
where , , and are as defined in Section 3.4 (Table 5). The weights , , follow the evaluation indicator system for tiered diagnosis and treatment effectiveness [18].
(5) Operational Cost Penalty (). To prevent agents from expanding resources without limit, constraints on construction and operational costs are introduced [5,51]:
The first term penalizes bed expansion magnitude (construction cost), the second overcrowding (safety); together they discourage unlimited expansion and overfitting to the simulation [6,12]. Baseline weights are , , , , , set by grid search; sensitivity is reported in Section 5.5 [12,26]. To reduce the risk of circular evaluation, these rewards are used only for policy learning, whereas the final comparison is computed after training on held-out simulation seeds and reports raw, non-normalized indicators. In addition, Section 5.4 examines whether each reward component is necessary rather than simply reproducing the training objective.
4.5. Joint Training Algorithm
The training procedure follows a nested Manager–Worker loop. At the beginning of each episode, the digital twin is initialized with the current facility capacities, grid-level demand distribution, and queue states. At each high-level decision point, the Manager observes citywide congestion and referral heatmaps and selects an Option o via -greedy exploration. The selected Worker then executes for the target facility or region, producing continuous resource-adjustment actions subject to budget, staffing, and capacity bounds. The Worker continues until congestion eases or the maximum Option duration is reached. The environment then updates patient arrivals, facility choice probabilities, queue lengths, service completion, and referral states. Low-level transitions are stored in , while high-level transitions are stored in .
Algorithm 1 summarizes the expanded joint training procedure. The lower layer is updated every episode using PPO with generalized advantage estimation, whereas the upper layer is updated every C episodes using Double DQN with prioritized replay and target-network synchronization. Training stops when the moving averages of AMT, Gini, PCR, and BTR become stable or the maximum number of episodes is reached. Under standard conditions, PPO converges locally for fixed options and DQN approximates when the lower layer is sufficiently good [30,32]. In the present study, convergence behavior is interpreted together with the supplementary summaries reported in Supplementary Table S1; nevertheless, broader uncertainty analysis over additional demand, referral, and queueing assumptions remains future work. This expanded procedure clarifies how the digital twin, patient-flow simulator, referral logic, and HRL agent interact during model training and evaluation.
| Algorithm 1 Joint Manager–Worker Training in the Twin–Game Sandbox |
|
5. Experiments
5.1. Experimental Setup
Experimental environment: All experiments were conducted on a workstation equipped with an NVIDIA GeForce RTX 3090 (24 GB VRAM), 64 GB RAM, and an Intel Core i7 processor (14th generation). The simulation environment and reinforcement learning algorithms were implemented in Python 3.12, and the deep learning framework used was PyTorch 2.2.
Four configurations are compared: Current (baseline configuration reconstructed from official Wuhan facility records, Amap POIs, and reported aggregate primary-care utilization), GA (genetic algorithm baseline), Flat-RL (single-layer deep Q-learning), and Twin–Game (the hierarchical RL framework proposed in this study). All comparison methods use the same facility set, candidate-site pool, travel-time matrix, demand generator, and evaluation seeds; differences therefore arise from the optimization strategy rather than from different simulation inputs.
For practical implementation, the Twin–Game workflow can be initiated whenever updated facility and demand data become available, for example during annual health-resource planning or emergency-capacity assessment. The system outputs recommended intervention priorities rather than mandatory decisions. These outputs include a ranked list of congested facilities, suggested resource-adjustment ranges, and expected changes in travel time, primary-care rate, referral rate, and equity. Human decision-makers can then evaluate feasibility, budget, land-use constraints, staffing availability, and policy acceptability before implementation.
5.2. Evaluation Metrics
We evaluate the performance of each approach using the metrics in Table 4; their formal definitions (formulas) are given in Table 5. Section 3.4 introduces the three metric dimensions (accessibility, efficiency, structure). Although several evaluation metrics correspond to terms encouraged by the reward function, the evaluation is not computed from cumulative rewards. Instead, all methods are retrained under their own objectives and then tested on the same held-out simulation seeds, where raw system outcomes are calculated directly from generated patient trajectories. We also report convergence status, response time, and ablation/sensitivity results to provide evidence beyond the optimized scalar reward.
5.3. Experimental Results
Table 6 presents the performance of the four schemes across various indicators.
Table 6.
Comparison of indicators across different scenarios (including waiting and total care times).
Three observations are noteworthy. First, the Current scheme yields a primary care rate of 30.40% in the reported simulation, which is consistent with the underutilization of primary care observed in Wuhan and supports the face validity of the Strategic Sandbox. This baseline is reconstructed from official facility records and aggregate public statistics, but it should not be interpreted as validation against observed individual patient flows. Second, Twin–Game provides the best structural and queueing performance among the compared methods: it achieves the highest PCR and the lowest average waiting and total care times in Table 6. Its Gini value is not the lowest among all methods, indicating that the learned policy reflects a trade-off between accessibility, referral structure, and equity rather than a uniform improvement in every metric. Third, Flat-RL shows weaker structure and queueing performance than Twin–Game. A plausible explanation is that the single-layer policy is more exposed to the mixed action space and long-horizon credit assignment, which may destabilize exploration in this simulation setting (Table 7).
Table 7.
Performance comparison of different methods.
Efficiency metrics for each method on a new Wuhan simulation are shown in Table 7:
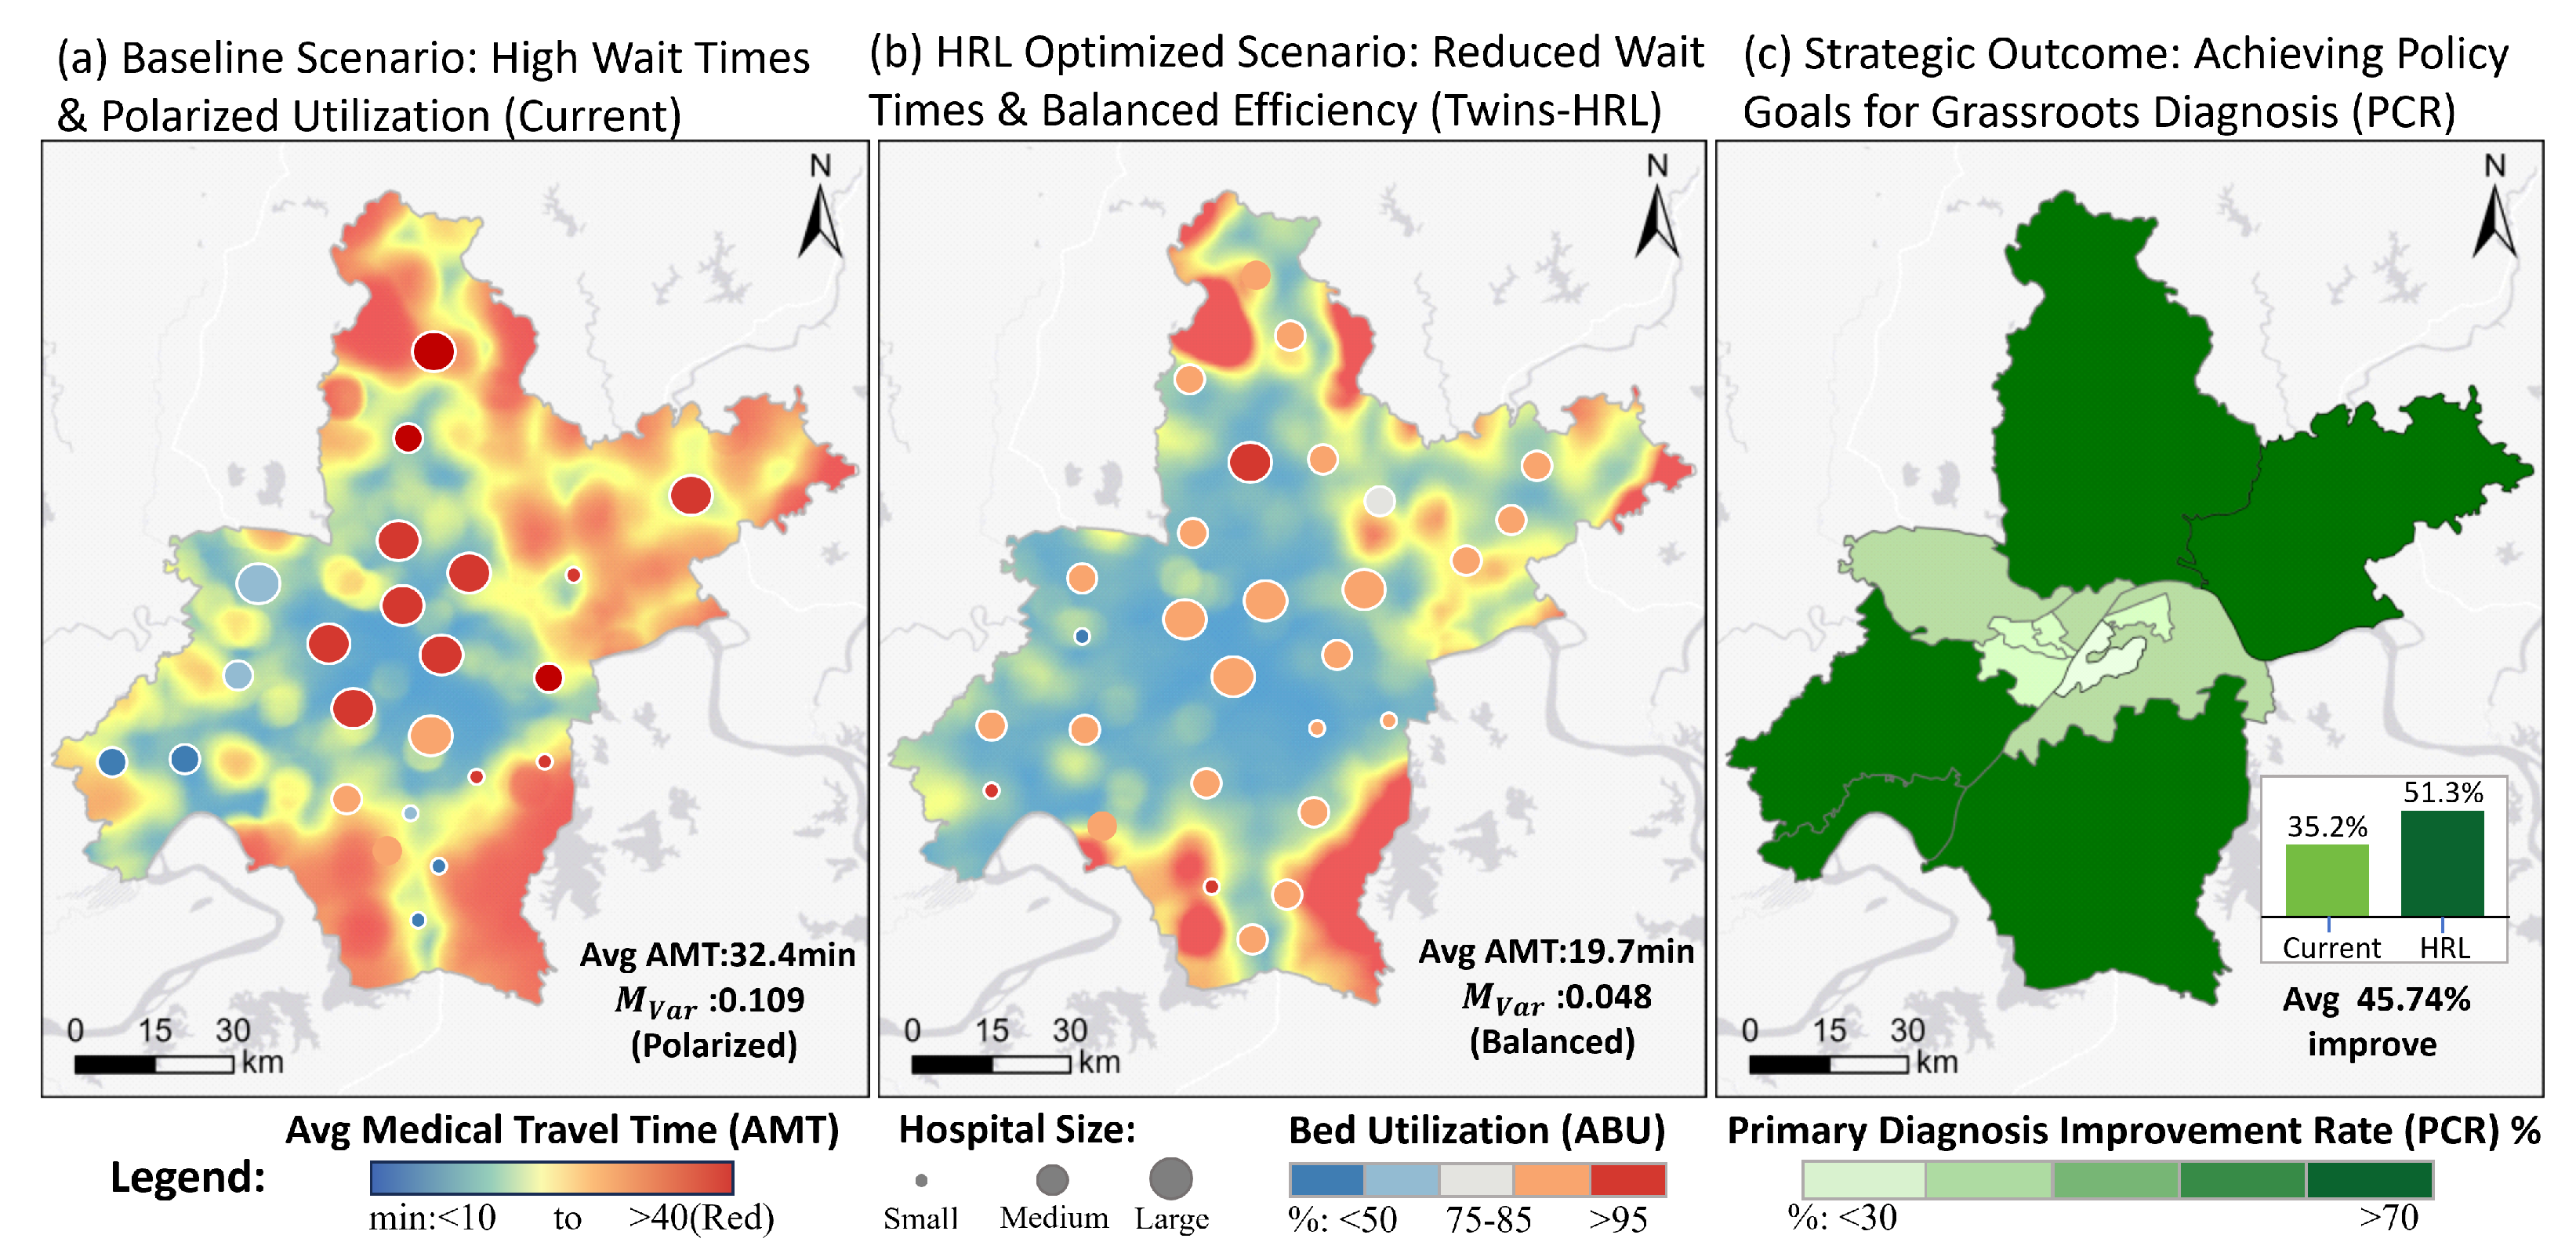
To examine where the improvements occur, Figure 6 aggregates hospitals into regional clusters (each point is a cluster; size denotes total beds and color denotes bed occupancy). The visualization indicates that Twin–Game reduces extreme congestion in core areas while increasing service capacity and utilization in peripheral districts, consistent with the improvements in Table 6.
Figure 6.
Spatial multi-metric comparison under the Second Twin (HRL/Twin–Game).
All methods share the same Strategic Sandbox, input data, candidate facility pool, demand seeds, travel-time matrix, and evaluation metrics. Flat-RL faces a city-scale joint action space (discrete where × continuous how) and delayed spatiotemporal credit assignment; this may destabilize exploration and help explain its weaker structural and queueing outcomes relative to Twin–Game in the reported experiment. In contrast, Twin–Game’s Manager–Worker decomposition with Options provides spatial and temporal abstraction, which may contribute to faster convergence and better trade-offs. GA modestly improves PCR and waiting time over Current but remains limited by rigid objectives and high runtime without fast inference. The convergence and robustness interpretation should therefore be read together with the supplementary summaries in Supplementary Table S1.
5.4. Ablation Analysis
To validate the effectiveness of each model component, we conducted ablation experiments by sequentially removing the structure incentive (), the equity incentive (), and the cost penalty () from the reward function. Results are summarized in Table 8.
Table 8.
Ablation study: Model variants, key metrics, and stability.
- Removing the structure incentive () reduced PCR while leaving several aggregate accessibility indicators close to the full model, highlighting the role of structure incentives in promoting tiered diagnosis rather than simply minimizing travel time.
- Removing the equity incentive () produced a lower reported Gini (improved numerical equity by this metric) but at the cost of reduced BTR and altered referral flows. This indicates an empirical trade-off: the equity reward term does not unconditionally improve all fairness dimensions, but balances equity with referral structure performance and accessibility objectives. The results also show that the equity and cost-penalty variants can be numerically similar on some global accessibility metrics while still differing in operating stability and bed-occupancy patterns.
- Removing the cost penalty () led to unstable policies in some runs and larger variance in final metrics, showing that operational-cost constraints help stabilize learning and avoid excessive resource expansion.
5.5. Sensitivity Analysis of Reward Weights
In multi-objective reinforcement learning, the choice of weights – in the composite reward can be questioned as arbitrary. To quantify the influence of each weight and verify that conclusions are not overly sensitive to small perturbations, we conducted a compensated one-at-a-time (OAT) sensitivity analysis. For each , we perturbed it by ; the other four weights were then rescaled proportionally so that remained constant, ensuring that only the relative emphasis on that term changed. We retrained the policy under each configuration and re-evaluated on the same test environment. Table 9 reports AMT, PCR, BTR, and Gini for all perturbed configurations. Across all ten OAT settings, the metrics remain in a similar range to the baseline and continue to outperform the Current scheme. The accessibility weight shows the largest impact on AMT; the equity weight most strongly affects Gini; and the structure weight drives PCR and BTR. Overall, the baseline set , , , , appears to lie in a reasonably stable region under the tested perturbations, although broader sensitivity ranges and additional random-seed replication would still be desirable.
Table 9.
Compensated OAT sensitivity: each weight perturbed by , others rescaled to preserve .
5.6. MAUP and Grid-Size Sensitivity
Because spatial aggregation can affect accessibility and equity indicators, we conducted an additional sensitivity experiment to examine the modifiable areal unit problem (MAUP). The baseline model uses grids. We repeated the evaluation with and grids while keeping the same facility set, road-network travel-time estimation procedure, and model hyperparameters. The setting captures finer intra-neighborhood variation but increases computational burden, whereas the setting smooths local heterogeneity and reduces the number of decision units.
As shown in Table 10, the rank ordering of the methods and the main conclusion remain stable across grid sizes: Twin–Game maintains lower AMT and Gini and higher PCR/BTR than the Current scheme. However, the coarser grid slightly weakens the measured equity improvement because peripheral pockets of poor accessibility are spatially averaged. These results suggest that is an acceptable balance between representational fidelity and computational tractability, but the table should be interpreted as a robustness check rather than evidence that MAUP has been eliminated. Future applications should report scale sensitivity when changing study areas or planning objectives.
Table 10.
Grid-size sensitivity analysis for the Twin–Game scheme.
5.7. Spatial Distribution Analysis
Spatial analysis of the healthcare facility layout generated by the Twin–Game scheme reveals several patterns. In this scenario analysis, the candidate-site option allows the Manager to select potential underserved locations, and the Worker then assigns feasible capacity increments under the same continuous resource-scaling rules used for existing facilities. Seven new general hospitals and 23 community health service centers were therefore placed in outlying districts in the scenario output, which improved modeled medical accessibility in peripheral areas. These outputs should be interpreted as planning alternatives for evaluation rather than direct construction decisions. Some tertiary hospitals in central districts enhanced service efficiency through specialty optimization and medical consortium development rather than simple bed expansion. Medical service corridors formed along major transportation corridors, fully leveraging transportation advantages. Densely populated new urban areas received healthcare resource allocations commensurate with demand. The spatial Gini coefficient decreased from 0.387 to 0.291, with system-wide Gini decreasing from 0.5544 to 0.4398 as shown in Table 6, indicating a more balanced distribution of healthcare resources within the simulation scenario.
Note on bed-capacity proxy and spatial Gini. In the referral rule and capacity modeling, available beds are used only as a service-capacity proxy because consistent bed counts are available for all facilities; they are not intended to represent specific equipment inventories or the full scope of clinical capability. The spatial Gini reported above is computed from regional total care times (travel + waiting) using the Gini formula given in Table 5, with regional accessibility measures normalized by resident population as described in Section 2.2.
6. Conclusions
This study proposed Twin–Game, a digital twin-driven hierarchical reinforcement learning framework for adaptive urban healthcare resource optimization under the tiered healthcare system. Across the Strategic Sandbox parameterized for Wuhan, Twin–Game shows simulation-based improvements in structure and queueing performance: it increases the primary care rate and reduces average waiting and total care times relative to the compared schemes (Table 6). The Gini results indicate a trade-off rather than a uniform improvement in every equity metric. In addition, the spatial analysis indicates that these gains are associated with redistributing capacity and load across the urban core and peripheral districts (Section 5.7).
These results suggest the potential role of hierarchical abstraction in city-scale scheduling. The Manager focuses on where to intervene by selecting critical facilities, while the Worker optimizes how to adjust resources with continuous controls. This decomposition may mitigate spatiotemporal credit assignment and exploration instability that hinder flat policies in large joint action spaces, which helps explain the observed performance differences in the reported experiments (Table 7).
Several limitations remain. First, the demand generator and referral logic rely on simplified assumptions and rule-based state machines; integrating data-driven models such as learned referral policies could improve realism [49]. Second, the current study uses simulated patient flows and simulation-generated disease profiles; validation with real electronic health records or operational data would strengthen the evidence. Third, the framework is evaluated in a single city, Wuhan; transfer to other cities with different healthcare structures and demographics requires further study. Fourth, although the grid-size sensitivity analysis suggests qualitatively similar conclusions, MAUP cannot be fully eliminated and should be examined in future planning applications. Finally, while this revision reports supplementary summaries for the main comparison and robustness analyses, broader uncertainty analysis over additional demand-generation, referral-behavior, and queueing assumptions remains important future work.
We also checked the notation and equation consistency throughout the manuscript, especially the definitions of accessibility, equity, total care time, and referral-related indicators, so that the reward terms and evaluation metrics use consistent symbols. Future work may extend the Twin–Game framework to multi-city or regional coordination, incorporate uncertainty in demand forecasts such as robust or distributionally robust RL, and explore online adaptation mechanisms that continuously update the policy as new data become available.
Supplementary Materials
The following supporting information can be downloaded at: https://www.mdpi.com/article/10.3390/ijgi15060273/s1, Supplementary Materials: data construction and preprocessing details, patient-demand and disease-attribute simulation assumptions, facility-choice and referral mechanisms, Twin–Game decision architecture, reward design, training and evaluation protocol, supplementary result tables, robustness checks, and reproducibility notes.
Author Contributions
Conceptualization, Shaohua Wang and Yuxuan Hu; methodology, Yuxuan Hu, Shaohua Wang and Haojian Liang; software, Yuxuan Hu and Haojian Liang; validation, Yuxuan Hu and Haojian Liang; formal analysis, Yuxuan Hu; investigation, Yuxuan Hu; resources, Shaohua Wang; data curation, Yuxuan Hu and Haojian Liang; writing—original draft preparation, Yuxuan Hu; writing—review and editing, Shaohua Wang and Haojian Liang; visualization, Yuxuan Hu and Haojian Liang; supervision, Shaohua Wang; project administration, Shaohua Wang; funding acquisition, Shaohua Wang All authors have read and agreed to the published version of the manuscript.
Funding
This study was financially supported by the National Natural Science Foundation of China (Grant No. 42471495, Grant No. 42501580), the Beijing Municipal Science and Technology Program (Grant No. Z251100003625002), the Talent Introduction Program Youth Project of the Chinese Academy of Sciences (E43302020D, E2Z105010F), the China Southern Power Grid Company Limited Science and Technology Project (ZBKJXM20240174), and the Guangzhou Energy Institute Project (E4C1020301).
Data Availability Statement
The data used in this study were derived from publicly available sources, including official health statistics, Wuhan Municipal Health Commission records, OpenStreetMap road-network data, AutoNavi Map API travel-time estimates, and LandScan population data. The simulation-generated patient-flow data and disease profiles are available from the corresponding author upon reasonable request.
Conflicts of Interest
The authors declare no conflict of interest.
Correction Statement
This article has been republished with a minor correction to the Funding statement. This change does not affect the scientific content of the article.
References
- Li, W.M.; Li, W.Z.; Zeng, X.Y. Key issues affecting the advancement of the tiered healthcare system in China. Chin. Health Policy Res. 2018, 11, 12–19. (In Chinese) [Google Scholar]
- Liu, Q.; Wang, B.; Kong, Y.; Cheng, K.K. China’s primary health-care reform. Lancet 2011, 377, 2064–2066. [Google Scholar] [PubMed]
- National Health Commission of the People’s Republic of China. China Health Statistics Yearbook; Peking Union Medical College Press: Beijing, China, 2024. Available online: http://www.nhc.gov.cn/ (accessed on 1 December 2024).
- General Office of the State Council. Guiding Opinions on Promoting the Development of a Tiered Healthcare System; General Office of the State Council: Beijing, China, 2015. Available online: http://www.gov.cn/zhengce/content/2015-09/11/content_10158.htm (accessed on 1 December 2023).
- Church, R.; ReVelle, C. The maximal covering location problem. Pap. Reg. Sci. Assoc. 1974, 32, 101–118. [Google Scholar] [CrossRef] [Scilit]
- Daskin, M.S.; Dean, L.K. Location of health care facilities. In Operations Research and Health Care: A Handbook of Methods and Applications; Springer: New York, NY, USA, 2005; pp. 43–76. [Google Scholar]
- Luo, W.; Wang, F. Measures of spatial accessibility to health care in a GIS environment: Synthesis and a case study in the Chicago region. Environ. Plan. B Plan. Des. 2003, 30, 865–884. [Google Scholar] [CrossRef] [Scilit] [PubMed]
- McGrail, M.R.; Humphreys, J.S. Measuring spatial accessibility to primary health care services: Utilising dynamic catchment sizes. Appl. Geogr. 2014, 54, 182–188. [Google Scholar] [CrossRef] [Scilit]
- Guagliardo, M.F. Spatial accessibility of primary care: Concepts, methods and challenges. Int. J. Health Geogr. 2004, 3, 3. [Google Scholar] [CrossRef] [Scilit] [PubMed]
- Rushton, G. Public health, GIS, and spatial analytic tools. Annu. Rev. Public Health 2003, 24, 43–56. [Google Scholar] [PubMed]
- Joseph, A.E.; Bantock, P.R. Measuring potential physical accessibility to general practitioners in rural areas: A method and case study. Soc. Sci. Med. 1982, 16, 85–90. [Google Scholar] [CrossRef] [Scilit] [PubMed]
- Wang, F. Measurement, optimization, and impact of health care accessibility: A methodological review. Ann. Assoc. Am. Geogr. 2012, 102, 1104–1112. [Google Scholar] [CrossRef] [Scilit] [PubMed]
- Kang, J.Y.; Michels, A.; Lyu, F.; Wang, S.; Agbodo, N.; Freeman, V.L.; Wang, S. Rapidly measuring spatial accessibility of COVID-19 healthcare resources: A case study of Illinois, USA. Int. J. Health Geogr. 2020, 19, 36. [Google Scholar] [CrossRef] [Scilit] [PubMed]
- Tsou, K.W.; Hung, Y.T.; Chang, Y.L. An accessibility-based integrated measure of relative spatial equity in urban public facilities. Cities 2005, 22, 424–435. [Google Scholar] [CrossRef] [Scilit]
- Li, Y.; Wang, E.; Li, S.; Cui, Q.; Xie, H. Dynamic Measurement and Equity Analysis of Walking Accessibility in Primary Healthcare Institutions Under Diverse Supply–Demand Scenarios: Evidence from Shenyang. ISPRS Int. J. Geo-Inf. 2026, 15, 40. [Google Scholar] [CrossRef] [Scilit]
- Yip, W.; Hsiao, W.C. What drove the cycles of Chinese health system reforms? Health Syst. Reform 2015, 1, 52–61. [Google Scholar] [CrossRef] [Scilit] [PubMed]
- Chen, Q.H.; Fang, L. A study on patients’ healthcare choice behavior and its influencing factors. China Health Econ. 2017, 36, 23–26. (In Chinese) [Google Scholar]
- Zhao, D.; Zhang, L.; Wang, F. Construction of an evaluation indicator system for the implementation effectiveness of tiered diagnosis and treatment. China Hosp. Manag. 2019, 39, 12–15. (In Chinese) [Google Scholar]
- Rentiya, Z.S.; Mandal, S.; Inban, P.; Vempalli, H.; Dabbara, R.; Ali, S.; Kaur, K.; Adegbite, A.; Intsiful, T.A.; Jayan, M.; et al. Revolutionizing breast cancer detection with artificial intelligence and machine learning breakthroughs in imaging and diagnosis: Literature review. Eng. Sci. 2025, 38, 1859. [Google Scholar]
- Li, C.; Zhang, T.; Zhang, X.; Chen, X. Deep reinforcement learning for emergency resource allocation in urban rail stations. In Proceedings of the CICTP 2024, Shenzhen, China, 23–26 July 2024; pp. 1411–1422. [Google Scholar]
- Rasheed, F.; Yau, K.L.A.; Noor, R.M.; Wu, C.; Low, Y.C. Deep reinforcement learning for traffic signal control: A review. IEEE Access 2020, 8, 208016–208044. [Google Scholar] [CrossRef] [Scilit]
- Gu, W.; Li, M.; Wang, C.; Shang, J.; Wei, L. Strategic sourcing selection for bike-sharing rebalancing: An evolutionary game approach. Transp. Res. Part Logist. Transp. Rev. 2021, 156, 102522. [Google Scholar] [CrossRef] [Scilit]
- Li, W.; Wang, S.; Zhang, X.; Jia, Q.; Tian, Y. Understanding intra-urban human mobility through an exploratory spatiotemporal analysis of bike-sharing trajectories. Int. J. Geogr. Inf. Sci. 2020, 34, 2451–2474. [Google Scholar]
- Liang, H.; Wang, S.; Li, H.; Zhou, L.; Chen, H.; Zhang, X.; Chen, X. SPONet: Solving spatial optimization problems using deep reinforcement learning for urban spatial decision analysis. Int. J. Digit. Earth 2024, 17, 2299211. [Google Scholar]
- Wang, S.; Liang, H.; Zhong, Y.; Zhang, X.; Su, C. DeepMCLP: Solving the MCLP with deep reinforcement learning for urban spatial computing. In Proceedings of the Spatial Data Science Symposium (SDSS), Virtual, 5–6 September 2023. [Google Scholar]
- Lam, A.Y.; Leung, Y.W.; Chu, X. Electric vehicle charging station placement. In Proceedings of the IEEE International Conference on Smart Grid Communications (SmartGridComm), Vancouver, BC, Canada, 21–24 October 2013; pp. 510–515. [Google Scholar]
- Sun, W.; Ren, J.; Zhai, J.; Li, W. Just green enough in urban renewal: A multifunctional and pragmatic approach in realizing multiscale urban green space optimization in built-up residential areas. Urban For. Urban Green. 2023, 82, 127891. [Google Scholar] [CrossRef] [Scilit]
- Dietterich, T.G. Hierarchical reinforcement learning with the MAXQ value function decomposition. J. Artif. Intell. Res. 2000, 13, 227–303. [Google Scholar] [CrossRef] [Scilit]
- Precup, D. Temporal Abstraction in Reinforcement Learning. Ph.D. Thesis, University of Massachusetts Amherst, Amherst, MA, USA, 2000. [Google Scholar]
- Sutton, R.S.; Precup, D.; Singh, S. Between MDPs and semi-MDPs: A framework for temporal abstraction in reinforcement learning. Artif. Intell. 1999, 112, 181–211. [Google Scholar] [CrossRef] [Scilit]
- Bacon, P.L.; Harb, J.; Precup, D. The Option-Critic architecture. In Proceedings of the AAAI Conference on Artificial Intelligence, San Francisco, CA, USA, 4–9 February 2017; Volume 31. [Google Scholar]
- Schulman, J.; Wolski, F.; Dhariwal, P.; Radford, A.; Klimov, O. Proximal policy optimization algorithms. arXiv 2017, arXiv:1707.06347. [Google Scholar]
- Kulkarni, T.D.; Narasimhan, K.; Saeedi, A.; Tenenbaum, J. Hierarchical deep reinforcement learning: Integrating temporal abstraction and intrinsic motivation. In Proceedings of the Advances in Neural Information Processing Systems, Barcelona, Spain, 5–10 December 2016; Volume 29. [Google Scholar]
- Mnih, V.; Kavukcuoglu, K.; Silver, D.; Rusu, A.A.; Veness, J.; Bellemare, M.G.; Graves, A.; Riedmiller, M.; Fidjeland, A.K.; Ostrovski, G.; et al. Human-level control through deep reinforcement learning. Nature 2015, 518, 529–533. [Google Scholar] [CrossRef] [Scilit] [PubMed]
- Nachum, O.; Gu, S.S.; Lee, H.; Levine, S. Data-efficient hierarchical reinforcement learning. In Proceedings of the Advances in Neural Information Processing Systems, Montreal, QC, Canada, 3–8 December 2018; Volume 31. [Google Scholar]
- Lu, Q.; Li, H. Digital-twin–driven urban lifecycle paradigm: Evidence from the Singapore–Nanjing eco Hi-Tech Island. Front. Sustain. Cities 2026, 8, 1733281. [Google Scholar] [CrossRef] [Scilit]
- Wuhan Municipal Health Commission. Wuhan Health Statistics Yearbook; Wuhan Municipal Health Commission: Wuhan, China, 2024. Available online: http://wjw.wuhan.gov.cn/ (accessed on 1 December 2024).
- Sun, Y.; Wang, S.; Wang, Y. Estimating local-scale urban heat island intensity using nighttime light satellite imageries. Sustain. Cities Soc. 2020, 57, 102125. [Google Scholar] [CrossRef] [Scilit]
- Kelman, I.; Gaillard, J.C.; Lewis, J.; Mercer, J. Learning from the history of disaster vulnerability and resilience research and practice for climate change. Nat. Hazards 2016, 82, 129–143. [Google Scholar] [CrossRef] [Scilit]
- Ye, X.; Wang, S.; Lu, Z.; Song, Y.; Yu, S. Towards an AI-driven framework for multi-scale urban flood resilience planning and design. Comput. Urban Sci. 2021, 1, 11. [Google Scholar] [CrossRef] [Scilit]
- Grieves, M.; Vickers, J. Digital twin: Mitigating unpredictable, undesirable emergent behavior in complex systems. In Transdisciplinary Perspectives on Complex Systems: New Findings and Approaches; Springer: Cham, Switzerland, 2016; pp. 85–113. [Google Scholar]
- Jones, D.; Snider, C.; Nassehi, A.; Yon, J.; Hicks, B. Characterising the digital twin: A systematic literature review. CIRP J. Manuf. Sci. Technol. 2020, 29, 36–52. [Google Scholar] [CrossRef] [Scilit]
- Bruynseels, K.; Santoni de Sio, F.; van den Hoven, J. Digital twins in health care: Ethical implications of an emerging engineering paradigm. Front. Genet. 2018, 9, 31. [Google Scholar] [CrossRef] [Scilit] [PubMed]
- Wang, S.; Zhong, Y.; Wang, E. An integrated GIS platform architecture for spatiotemporal big data. Future Gener. Comput. Syst. 2019, 94, 160–172. [Google Scholar] [CrossRef] [Scilit]
- Zhou, L.; Dang, X.; Sun, Q.; Wang, S. Multi-scenario simulation of urban land change in Shanghai by random forest and CA-Markov model. Sustain. Cities Soc. 2020, 55, 102045. [Google Scholar]
- National Health and Family Planning Commission. Standards and Specifications for Emergency Triage and Treatment of Critically Ill Patients; National Health and Family Planning Commission: Beijing, China, 2013; (In Chinese). Available online: http://www.nhc.gov.cn/ (accessed on 1 December 2023).
- Lyu, F.; Wang, S.; Han, S.Y.; Catlett, C.; Wang, S. An integrated cyberGIS and machine learning framework for fine-scale prediction of urban heat island using satellite remote sensing and urban sensor network data. Urban Inform. 2022, 1, 6. [Google Scholar] [PubMed]
- Fotheringham, A.S.; O’Kelly, M.E. Spatial Interaction Models: Formulations and Applications; Kluwer Academic Publishers: Dordrecht, The Netherlands, 1989; Volume 1. [Google Scholar]
- Barnett, M.L.; Song, Z.; Landon, B.E. Trends in physician referrals in the United States, 1999–2009. Arch. Intern. Med. 2012, 172, 163–170. [Google Scholar] [PubMed]
- Liang, H.; Wang, S.; Li, H.; Ye, H.; Zhong, Y. A trade-off algorithm for solving p-center problems with a graph convolutional network. ISPRS Int. J. Geo-Inf. 2022, 11, 270. [Google Scholar]
- Marsh, M.T.; Schilling, D.A. Equity measurement in facility location analysis: A review and framework. Eur. J. Oper. Res. 1994, 74, 1–17. [Google Scholar] [CrossRef] [Scilit]
- Huang, M.; Luo, D.; Wang, Z.; Cao, Y.; Wang, H.; Bi, F.; Huang, Y.; Yi, L. Equity and efficiency of maternal and child health resources allocation in Hunan Province, China. BMC Health Serv. Res. 2020, 20, 300. [Google Scholar] [CrossRef] [Scilit] [PubMed]

Disclaimer/Publisher’s Note: The statements, opinions and data contained in all publications are solely those of the individual author(s) and contributor(s) and not of MDPI and/or the editor(s). MDPI and/or the editor(s) disclaim responsibility for any injury to people or property resulting from any ideas, methods, instructions or products referred to in the content. |
© 2026 by the authors. Published by MDPI on behalf of the International Society for Photogrammetry and Remote Sensing. Licensee MDPI, Basel, Switzerland. This article is an open access article distributed under the terms and conditions of the Creative Commons Attribution (CC BY) license.