


Abstract
Tourism safety in high altitude destinations is strongly affected by the combined effects of environmental constraints, tourism exposure, and safety support capacity. The Qinghai–Tibet Plateau (QTP), characterized by high altitude, complex terrain, sparse settlements, and limited emergency accessibility in remote areas, provides a representative case for tourism risk assessment in extreme plateau environments. To predict and interpret the spatial pattern of tourism risk on the QTP, this study constructs an assessment framework based on “Hazard–formative factors + Risk exposure + Safety security” and integrates XGBoost with SHAP interpretable machine learning. Eleven indicators representing environmental conditions, tourism exposure, and safety support capacity were used to model tourism risk at a 1 km × 1 km spatial resolution. The optimized XGBoost model achieved an AUC of 0.877, indicating good predictive performance. The results show that tourism risk on the QTP presents a spatial pattern of “high in the northwest and low in the southeast”. High risk and relatively high risk areas account for approximately 74.98% of the study area and are mainly distributed in remote hinterlands and northwestern plateau regions, whereas low risk areas are concentrated around southeastern river valleys, towns, mature scenic areas, and major transport corridors. SHAP analysis indicates that Distance to towns is the most important factor influencing predicted tourism risk, followed by Reception facility kernel density, Relief degree of land surface, and Scenic spot kernel density. Nonlinear and interaction analyses further suggest that remoteness, tourism facilities, terrain relief, and scenic area concentration jointly shape the predicted risk pattern. The findings provide spatial evidence for differentiated tourism risk management, including regular tourism development in relatively safe urban and scenic nodes, controlled management of medium risk tourism corridors, and stricter access management in remote high risk areas.
1. Introduction
With the global expansion of the tourism industry and the increasing demand for nature based and adventure travel, with distinctive landscapes and relatively pristine environments have become increasingly attractive tourism destinations [1]. However, the expansion of tourism activities into environmentally fragile areas inevitably increases tourists’ exposure to natural hazards and emergency response constraints [2]. Under climate change, the increasing frequency and intensity of extreme weather events further amplify tourism related risks, particularly in mountain, plateau, island, and other ecologically sensitive destinations [3,4].
The Qinghai–Tibet Plateau (QTP) is one of the most representative high altitude tourism destinations worldwide. It contains unique plateau landscapes and cultural resources, but its tourism development is also constrained by high altitude, hypoxia, complex terrain, fragile ecosystems, and rapidly changing climatic conditions [5,6]. These characteristics make the QTP a suitable case for examining tourism risk in extreme high altitude environments, where natural environmental constraints, tourism exposure, and safety support conditions are closely intertwined. Therefore, accurately identifying the spatial distribution and influencing mechanisms of tourism risk on the QTP is important for both regional tourism safety management and the broader understanding of tourism risk formation in fragile environments.
Existing studies have made important progress in tourism risk assessment. In terms of research scale, previous studies have examined tourism risks at scenic spot, urban, regional, and national levels [7,8]. In terms of indicator systems, many studies have followed disaster risk theory and selected indicators from dimensions such as hazard, exposure, vulnerability, and resilience or safety capacity [4,9,10,11]. In terms of methods, early studies mainly relied on qualitative or semi–quantitative approaches, including the Analytic Hierarchy Process, fuzzy comprehensive evaluation, and weighted linear models [12,13,14]. More recently, machine learning methods, such as Random Forest, neural networks, and XGBoost, have been increasingly applied to tourism safety and environmental risk prediction because of their ability to capture nonlinear relationships [15,16].
Despite these advances, several limitations remain when existing approaches are applied to high altitude plateau regions. First, traditional weighting and linear models are limited in representing nonlinear and interactive relationships among altitude, terrain, climate, infrastructure, and tourism facilities [17,18]. Second, although machine learning models can improve predictive accuracy, their “black–box” nature restricts their explanatory value for tourism risk governance [19]. Third, many risk assessments rely heavily on historical disaster records. In sparsely populated and weakly monitored areas of the QTP, such records may be spatially incomplete and may underestimate latent risks formed by persistent environmental conditions such as high altitude, terrain fragmentation, cold climate, and weak accessibility [3,20]. Fourth, existing QTP related tourism studies have mainly focused on tourism resources, climate change impacts, cultural ecosystem services, tourist flows, or tourism corridors, while spatially explicit tourism risk prediction and interpretable analysis of risk driving mechanisms remain insufficient [21].
To address these limitations, this study constructs a tourism risk assessment framework based on the “Hazard–formative factors + Risk exposure + Safety security” nexus. Different from approaches that directly use historical hazard frequency as the core hazard indicator, this framework emphasizes baseline environmental and accessibility conditions that continuously shape potential tourism risks in high altitude regions. Furthermore, this study integrates XGBoost with SHAP interpretable analysis to predict the spatial distribution of tourism risk and identify the nonlinear and interactive effects of key influencing factors. Specifically, this study aims to (1) construct a tourism risk indicator system suitable for the high altitude geographical context of the QTP; (2) predict the spatial pattern of tourism risk using an optimized XGBoost model; and (3) interpret the relative importance, nonlinear effects, and interaction patterns of influencing factors using SHAP. The contribution of this study lies in combining spatial risk prediction with interpretable machine learning, thereby providing both a risk map and a mechanism oriented explanation for tourism safety management in extreme plateau environments.
2. Study Area and Data Source
2.1. Study Area
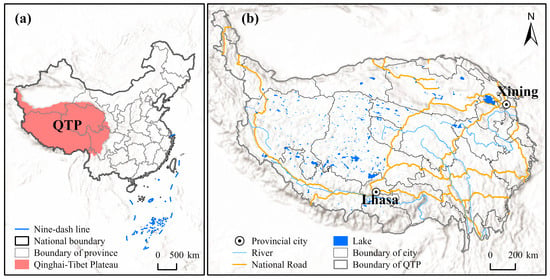
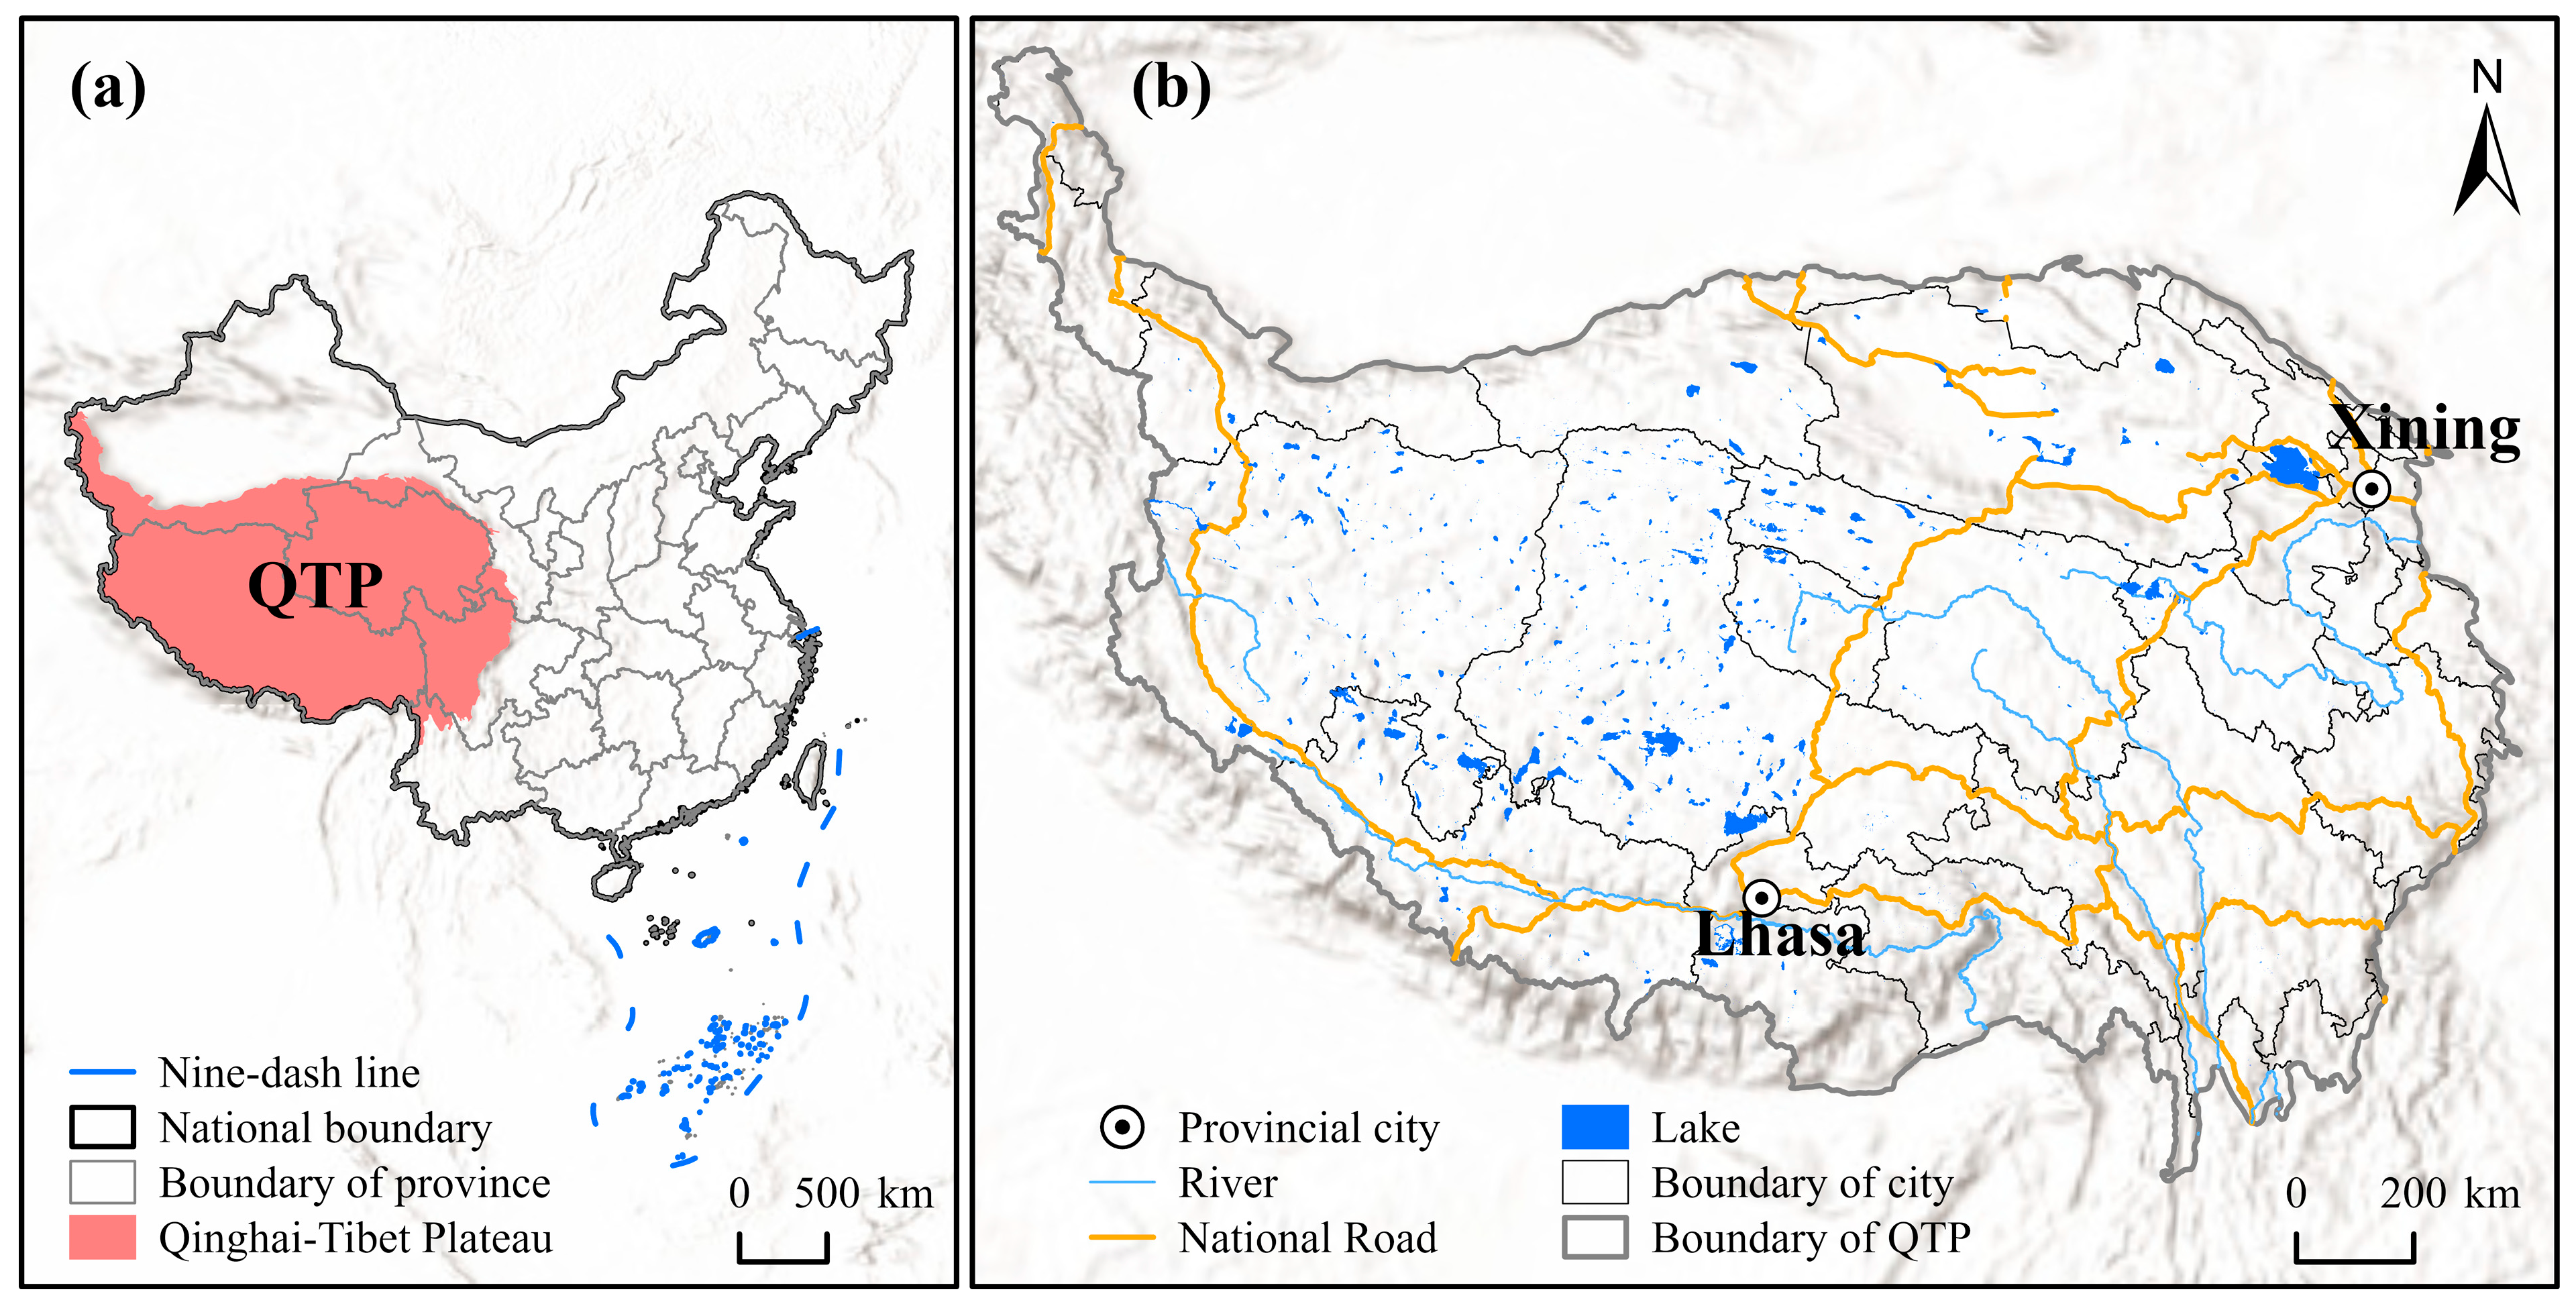
The Qinghai–Tibet Plateau, renowned as the “Roof of the World”, is the largest plateau globally, with an average elevation exceeding 4000 m. Located in western and southwestern China, it spans Qinghai, Xizang, Sichuan, Yunnan, Gansu, and Xinjiang, covering an area of approximately 2.5 million km2, which accounts for more than one fourth of China’s land territory [22] (Figure 1). The region contains diverse landforms, including high mountains, alpine valleys, plateau lakes, glaciers, grasslands, and desert basins, forming a distinctive natural foundation for tourism development.
Figure 1.
Study area. (a) Location of the Qinghai–Tibet Plateau (QTP) in China. (b) Topography and administrative divisions of the QTP.
In recent years, the improvement of transport infrastructure, the expansion of self-driving tourism, and the promotion of online media have increased the tourism attractiveness of the QTP [23]. Taking Qinghai and Tibet as examples, the total number of tourist arrivals increased from 51.9286 million in 2016 to 85.8518 million in 2020, representing a growth rate of 65.3%. However, tourism activities are increasingly extending from established cities and mature scenic areas to remote self-driving routes, alpine valleys, grasslands, and wilderness areas, where emergency rescue, medical services, communication coverage, and road accessibility are often limited.
The QTP is therefore particularly suitable for this study because it presents a clear spatial mismatch between highly attractive tourism resources and unevenly distributed safety support capacity. This mismatch makes it possible to examine how hazard–formative environmental conditions, tourism exposure, and safety security jointly influence tourism risk. Scientifically evaluating tourism risk in this region can provide spatial evidence for scenic area management, self-driving route planning, emergency resource allocation, and regional tourism safety governance [24].
2.2. Data Sources and Processing
The details and sources of the data utilized in this study are listed in Table 1. To meet the spatial modeling requirements of machine learning, all raw datasets were pre–processed in ArcGIS 10.8. This included unifying the projection system to the WGS 1984 Albers coordinate system and resampling the data into a 1 km × 1 km raster format. Specific processing steps for certain data are as follows: For discrete meteorological station monitoring data, Kriging interpolation was applied to generate continuous raster surfaces for annual mean temperature and annual precipitation. For vector data such as town locations, transportation networks, and tourism facilities, Euclidean distance and kernel density estimations were computed and rasterized. Regarding natural disaster data, geological and meteorological disaster records posing a direct threat to tourism activities were filtered to construct the high risk sample set.
Table 1.
Details about the data used in this study.
3. Methodology
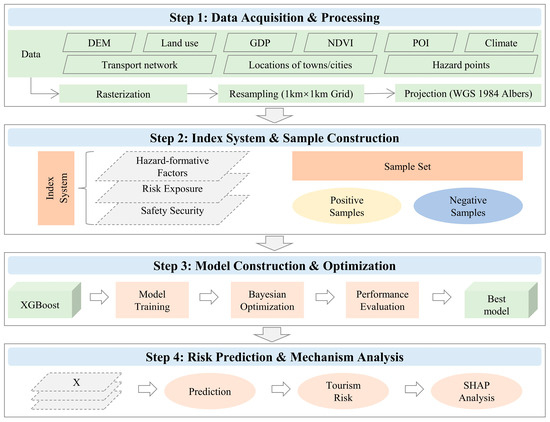
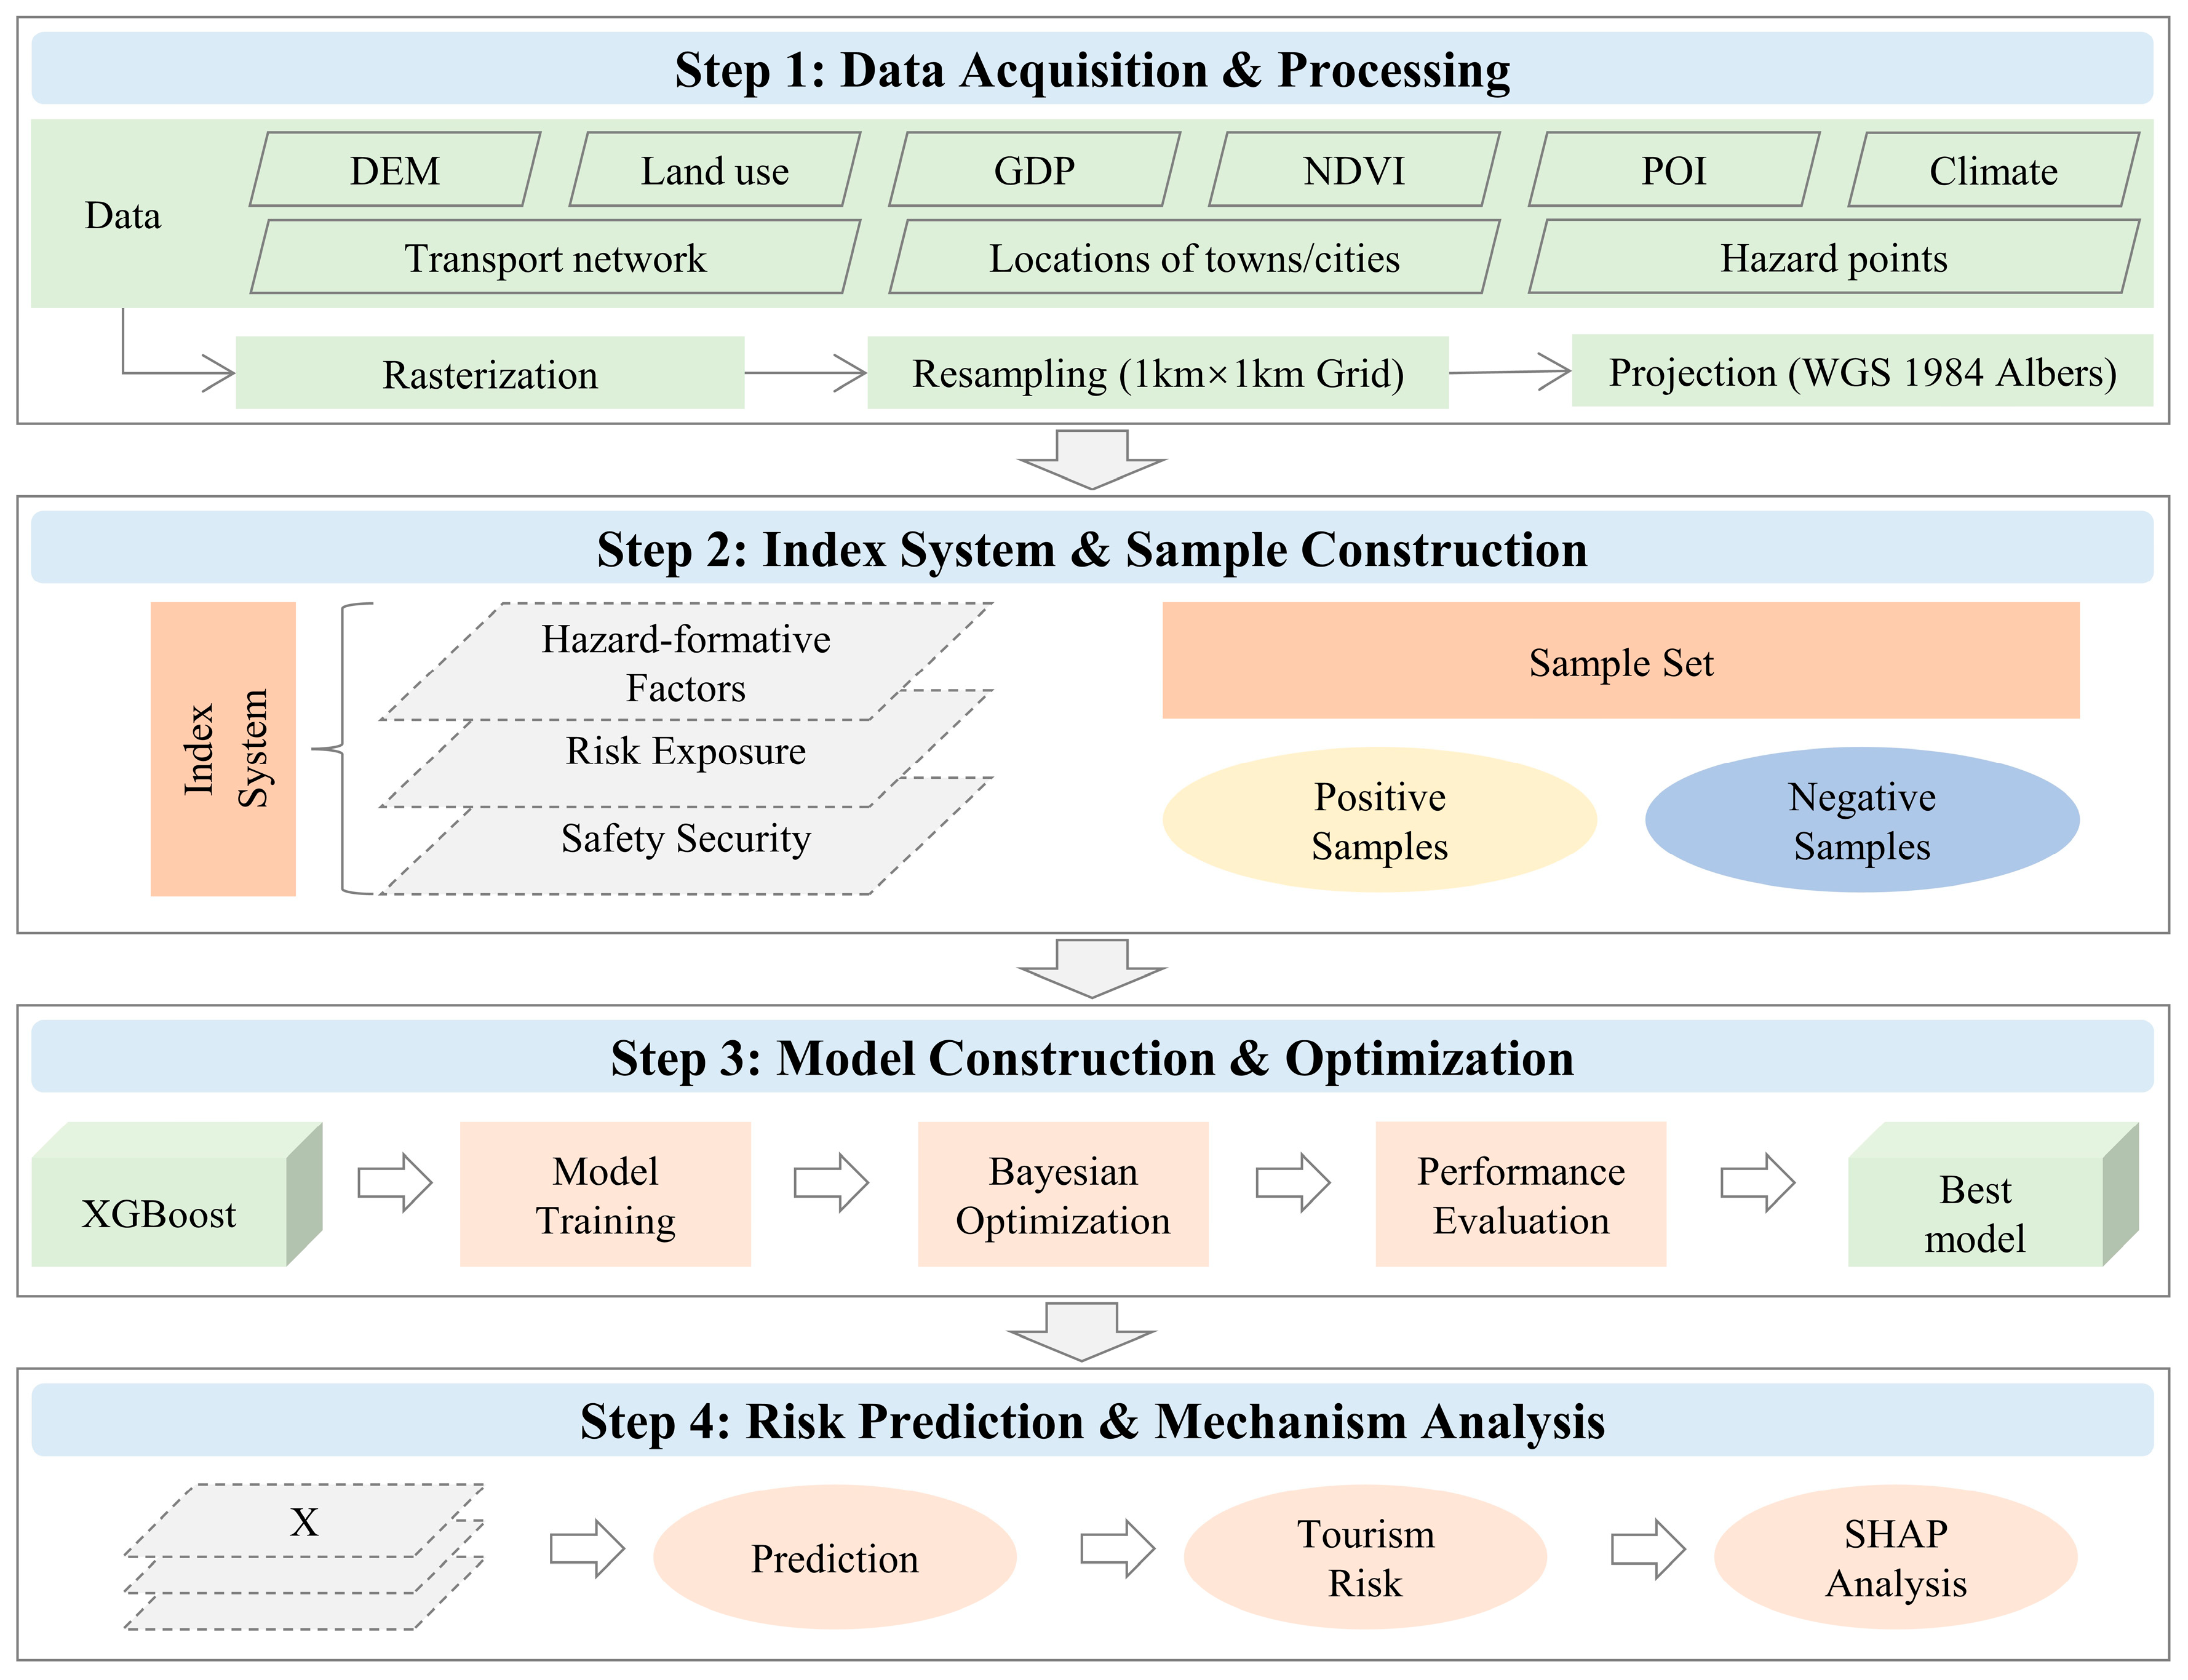
The analytical framework of this study is illustrated in Figure 2, comprising four main steps: data collection and processing, indicator selection and sample construction, model construction and optimization, and risk prediction and mechanism analysis.
Figure 2.
Research framework.
3.1. Indicator Selection
Tourism risk evaluation measures the probability of tourists encountering risks under the combined effects of environmental conditions, tourism activities, and safety support capacity at a destination [24]. Considering the geographical characteristics of the QTP and the availability of spatial data, this study structures the tourism risk evaluation across three dimensions: Hazard–formative factors, Risk exposure, and Safety security [11,25]. The term “Hazard–formative factors” is used to emphasize relatively stable environmental background conditions that form or amplify potential tourism hazards, rather than only the observed frequency of historical hazard events. In the QTP, historical disaster records are spatially uneven because of sparse population, limited monitoring capacity, and low accessibility in remote areas. Therefore, elevation, terrain relief, vegetation, temperature, and precipitation were selected to represent the environmental basis of potential tourism hazards [26]. Risk exposure reflects the possibility that tourists enter or stay in risk prone environments, while safety security represents the external support conditions that may reduce accident consequences through rescue, medical services, accessibility, and infrastructure [10]. Given data accessibility constraints, tourist vulnerability, such as high altitude adaptability, health status, travel mode, outdoor experience, and risk perception, was not included in the quantitative framework. Ultimately, 11 indicators were selected for the evaluation system (Table 2).
Table 2.
Evaluation index system of tourism risk on the Qinghai–Tibet Plateau.
3.1.1. Hazard–Formative Factors
Hazard–formative factors refer to the environmental conditions that breed potential risks [26]. Due to the QTP’s complex terrain and rapid climate fluctuations, tourists face a high probability of encountering geological disasters, extreme weather, and altitude sickness. These risks are heavily dictated by environmental variables such as terrain, altitude, vegetation, temperature, and precipitation [4,27]. Therefore, 5 indicators were selected as hazard–formative factors: Elevation, Relief degree of land surface, Vegetation coverage, Annual mean temperature, and Annual precipitation [4,9,26,27,28].
3.1.2. Risk Exposure
Risk exposure denotes the extent to which tourists are exposed to hazardous environments, typically measured by the duration of their stay within such contexts [11]. The higher the attractiveness and reception capacity of a region, the longer tourists tend to stay [8]. Consequently, three indicators–Landscape diversity, Scenic spot kernel density, and Reception facility kernel density–were selected to measure regional tourism risk exposure [8,26,29].
3.1.3. Safety Security
Safety security evaluates the external protective conditions available when tourists face potential risks, primarily determined by local medical capacities and the feasibility of emergency rescue [9]. The timelier the rescue and the higher the medical service quality, the lesser the risk loss incurred [30]. Thus, three indicators were chosen to gauge regional safety security conditions: GDP, Distance to towns, and Distance to main roads [9,31,32].
3.2. Training Sample Construction
Before predicting tourism risks, it is necessary to construct a reliable and highly discriminative training sample set. Existing studies on disaster and tourism risk modeling commonly use historical hazard or disaster records as positive samples and relatively safe areas as negative samples [3,9]. Following this logic, this study constructed positive and negative samples by considering both historical hazard occurrence and safety support conditions.
Positive samples were defined as locations where historical geological or meteorological disaster records occurred during 2015–2024 and where such events could directly or indirectly threaten tourism activities. The selected disaster types included landslides, debris flows, collapses, snowstorms, extreme precipitation events, and other hazards that may affect tourist mobility, road safety, outdoor activities, or emergency rescue. Records with incomplete coordinates, duplicated locations, or events clearly unrelated to tourism safety were removed. After screening, 11,284 high risk points were retained as positive samples.
Negative samples were defined as locations with relatively stronger safety support conditions rather than areas with absolutely no risk. Specifically, town administrative centers and mature scenic spot core locations were selected because they generally have better road accessibility, communication conditions, medical resources, tourism management capacity, and emergency response facilities. We acknowledge that these areas may also have high tourist exposure. Therefore, the negative samples should be interpreted as relatively lower risk samples under stronger safety security conditions, rather than risk free areas. This definition is consistent with the objective of this study, which is to assess relative spatial tourism risk by jointly considering hazard–formative factors, risk exposure, and safety security. After screening, 625 low risk points were retained as negative samples.
The initial sample set therefore contained 11,284 positive samples and 625 negative samples. To reduce the influence of class imbalance on model training, random down–sampling was applied only to the majority class. Specifically, 625 positive samples were randomly selected from the 11,284 high risk points to match the 625 negative samples, forming a balanced modeling sample set of 1250 points. The balanced sample set was then divided into training and testing subsets at a ratio of 7:3, with approximately 875 samples used for model training and 375 samples used for model testing. This procedure reduced the possibility that the classifier would be dominated by the majority class and allowed a more balanced evaluation of high and low risk identification.
Although down–sampling may discard part of the spatial information contained in the majority class, it is a transparent and widely used strategy for imbalanced classification. In this study, the sampling process was conducted with a fixed random seed, and the retained positive samples were checked to ensure that they covered the main high risk regions of the QTP.
3.3. Tourism Risk Prediction Based on XGBoost
Extreme Gradient Boosting (XGBoost) is an ensemble machine learning algorithm based on the gradient boosting framework, renowned for its exceptional predictive performance on structured data tasks [33]. By applying a second order Taylor expansion to the loss function and incorporating L1 and L2 regularization terms into the objective function, it effectively controls model complexity, mitigating overfitting while enhancing accuracy. In recent years, XGBoost has been widely applied in environmental risk assessment and safety predictions [7,15]. Within geospatial modeling contexts, compared to traditional linear models, XGBoost can autonomously identify high order nonlinear relationships and complex interactions among variables without the need to predefine mathematical function forms [33]. This advantage is particularly valuable for the highly complex human environment system of the QTP, where tourism risks are driven by a multidimensional coupling of natural and social factors [26]. Therefore, XGBoost represents an ideal computational tool for conducting tourism risk prediction in this study. The specific operational workflow is as follows:
- (1)
- Hyperparameter optimization: To maximize model performance, Bayesian optimization was employed for parameter tuning. Compared to conventional grid search or random search strategies, Bayesian optimization builds a probabilistic proxy model mapping the mathematical parameter space, which significantly boosts search efficiency and reduces computational overhead [34].
- (2)
- Model performance evaluation: To guarantee the robustness and reliability of the predictions, the model was evaluated on the test set using Accuracy (the proportion of correctly predicted classifications), Precision (the correct identification rate for actual positive samples), Recall (the ability to capture all positive samples), F1 Score (the harmonic mean of Precision and Recall), and AUC (the discriminative capability under varying thresholds), thereby validating the optimally tuned model [35].
- (3)
- Risk prediction and mapping: By utilizing the 11 aforementioned risk factor rasters as input features, the optimized model predicted the continuous tourism risk across the entire QTP. The output was generated as probabilities ranging from 0 to 1, where higher values indicate a greater likelihood of being a high risk area. Based on these probability values, the Natural Breaks classification method in ArcGIS was utilized to categorize the tourism risk into five distinct levels: High, Relatively high, Medium, Relatively low, and Low risk.
3.4. Influencing Factor Analysis Based on SHAP
Although XGBoost provides superb predictive power, its intrinsic “black–box” architecture obfuscates the specific contribution mechanisms of individual variables outputting the predictions. To solve this dilemma, this study introduced the SHAP (SHapley Additive exPlanations) framework for model interpretation. Grounded in Shapley value theory from cooperative game theory, SHAP decomposes the final predicted value into the marginal quantitative contribution of each feature, boasting excellent theoretical properties such as local consistency and global additivity [36]. Compared to traditional feature importance rankings, SHAP not only measures the magnitude of importance but fundamentally reveals the positive/negative directional impact of variables and their nonlinear threshold dynamics [37]. In cutting-edge research, SHAP is increasingly adopted across environmental sciences, disaster risk assessments, and spatial predictions to interpret complex internal machine learning mechanisms [38,39]. In the present study, calculating SHAP values allows the model’s overarching predictions to be mathematically attributed back to the input features of each sampling grid. It quantifies the precise contribution direction and magnitude of each factor regarding the predicted tourist risk, thereby rigorously revealing key driving forces and their operational modes over the QTP.
4. Results
4.1. Model Performance Evaluation
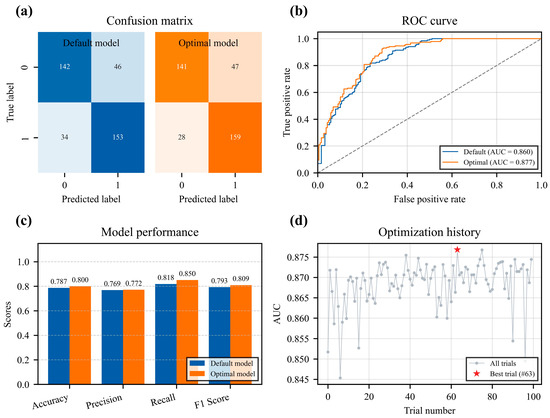
Using the Optuna framework, Bayesian optimization algorithm was executed with the objective function set to maximize AUC, performing 100 iterative searches to tune the vital hyper–parameters of the XGBoost model (e.g., learning rate, max tree depth, subsample ratio). The optimization trajectory and final model performance are visually delineated in Figure 3. Observing the hyperparameter tuning progress (Figure 3d), the performance trajectory demonstrated fluctuant incremental ascent until stabilizing towards convergence, peaking at the 63rd iteration. This implies the strategy effectively triangulated near optimal solutions across the vast multidimensional parameter space [34]. Analytics from the confusion matrix (Figure 3a) and evaluation metrics (Figure 3c) confirmed that the optimized model outclassed the default baseline across Accuracy, Precision, Recall, and the F1 Score. The Receiver Operating Characteristic (ROC) curve and Area Under Curve (AUC) further validated this statistical supremacy (Figure 3b). Both curves sat significantly above the diagonal line of a random guess, with the optimal curve eclipsing the baseline persistently, pulling the AUC score up from 0.860 to 0.877. An AUC spanning between 0.85 and 0.90 is mathematically deemed indicative of an excellent classification and discriminative capacity [40]. Consequently, the XGBoost based predictive framework established herein secures high precision and stability, flawlessly capable of capturing the underlying nonlinear correlations tying multidimensional environmental indicators to spatial tourism risks across the QTP.
Figure 3.
Performance evaluation and hyperparameter optimization of the XGBoost model. (a) Confusion matrice of the default and optimal models. (b) Receiver Operating Characteristic (ROC) curve and AUC score. (c) Model performance of Accuracy, Precision, Recall, and F1 Score. (d) Optimization history of the Bayesian hyperparameter tuning process.
4.2. Tourism Risk Analysis
4.2.1. Overall Characteristics of Tourism Risk
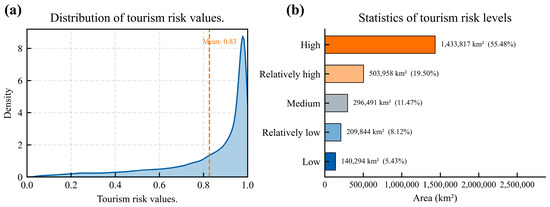
According to the probability distribution and the structural proportions of different risk levels (Figure 4), the overarching tourism risk on the QTP is distinctly high. The probability density curve (Figure 4a) exhibits a negatively skewed structural distribution with the mean predicted probability scaling to an alarming 0.83, inferring that the vast majority of the region is under high risk exposure. Statistical areal assessments (Figure 4b) reveal that the High risk and Relatively high risk zones overwhelmingly dominate the plateau terrain, accumulating an estimated footprint of 1.9378 million km2, equating to 74.98% of the study area constraint. In stark contrast, the amalgamation of Low risk and Relatively low risk classifications occupies merely 0.3501 million km2 (13.55%). This verifies that, subjugated by rigid natural environmental restrictions, executing tourism activities across the QTP encounters ubiquitous systemic risks, rendering optimally safe operational zones quite scarce.
Figure 4.
Statistical characteristics of tourism risk on the Qinghai–Tibet Plateau. (a) Probability density curve of predicted tourism risk values. (b) Area and percentage of different tourism risk levels.
4.2.2. Spatial Distribution of Tourism Risk
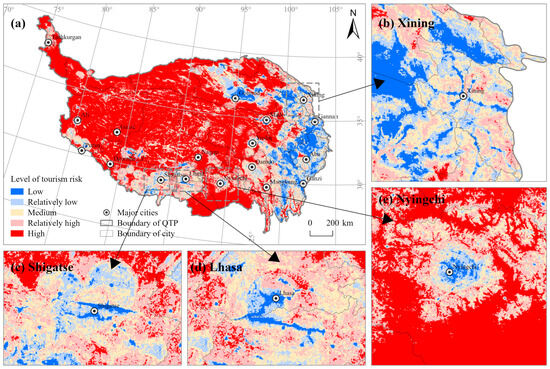
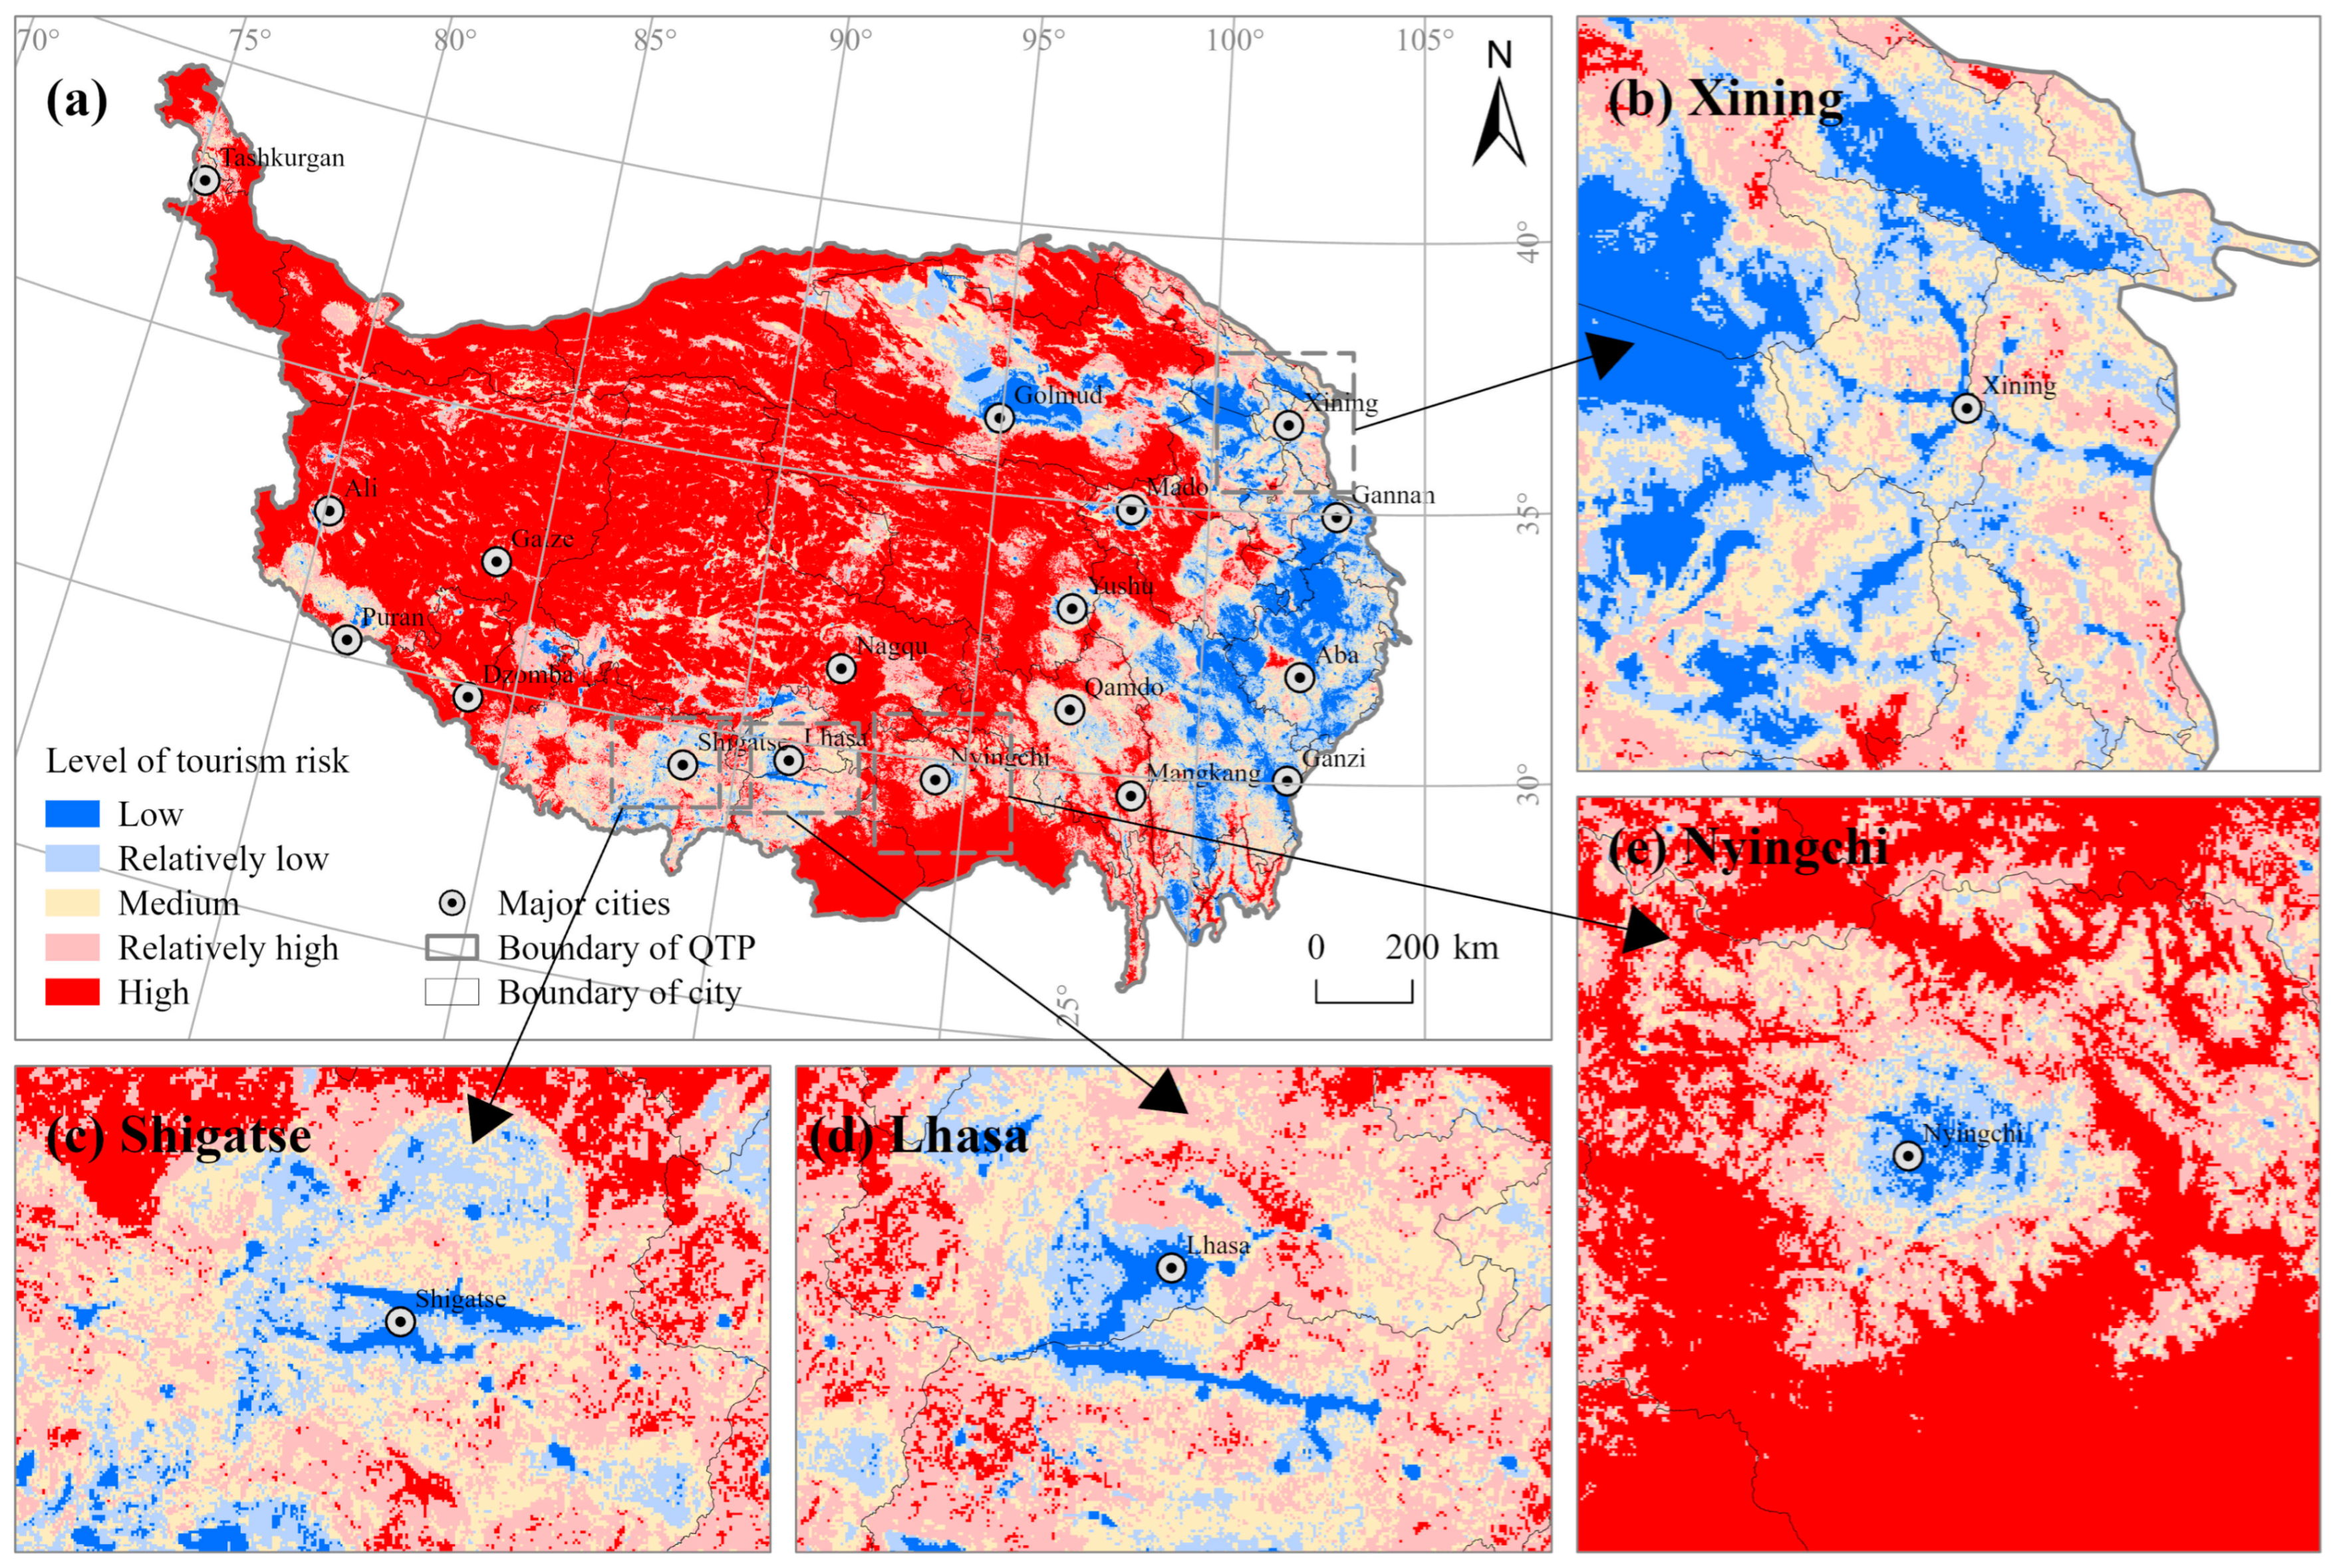
The macroscopic spatial arrangement of tourism risk across the QTP predominantly formulates a gradient of “High in the northwest, Low in the southeast” (Figure 5). High risk topologies manifest as contiguous, sprawling patches, while low risk jurisdictions exhibit punctiform (point–like) or linear corridor distributions constrained predominantly near urban agglomerations and deep river valleys.
Figure 5.
Spatial distribution of tourism risk on the Qinghai-Tibet Plateau. (a) Overall distribution; (b) Detail of Xining; (c) Detail of Shigatse; (d) Detail of Lhasa; (e) Detail of Nyingchi.
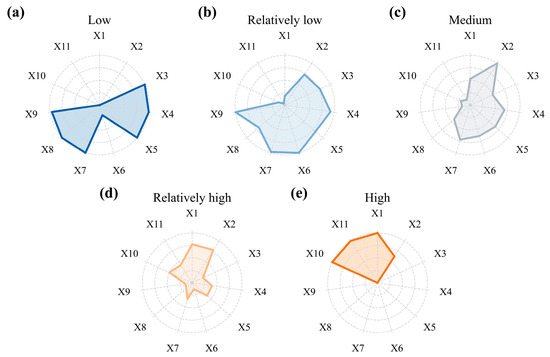
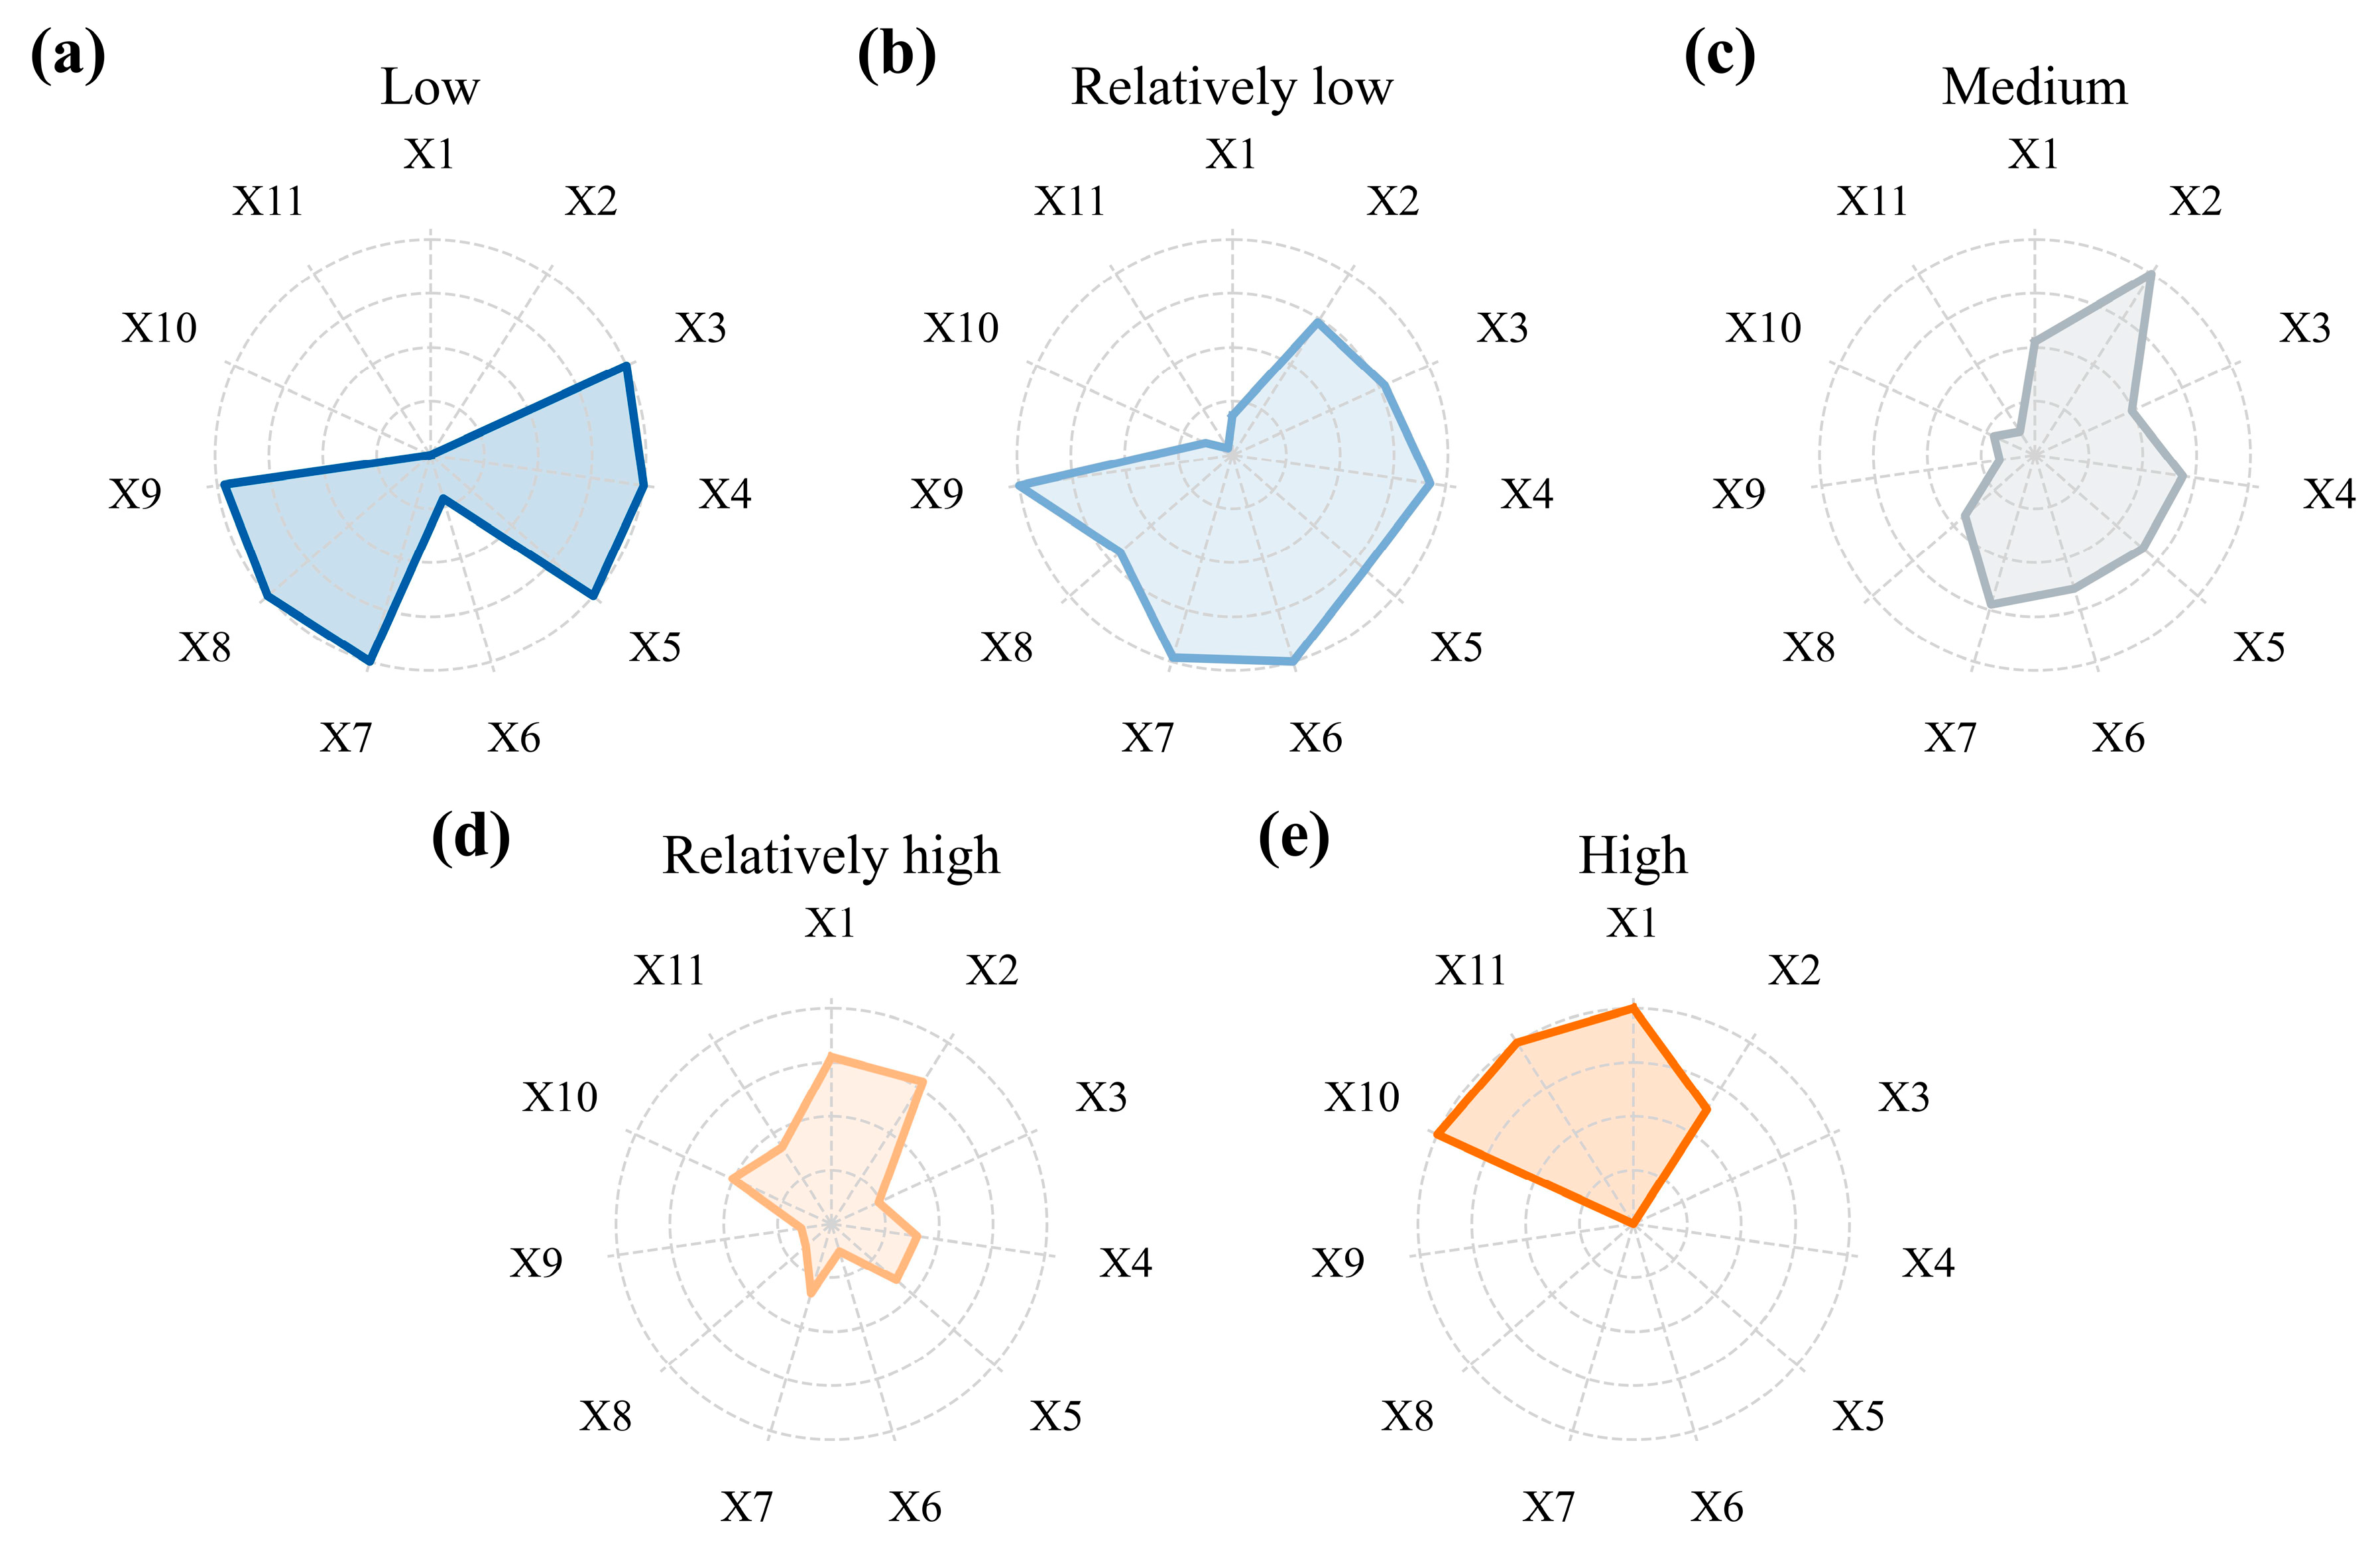
Specifically, the Low risk and Relatively low risk regions cluster distinctly to the eastern and southeastern margins of the QTP, alongside peripheral halos orbiting major cities. Key locations entail Xining and Haidong in Qinghai (the Hehuang Valley), Lhasa and Nyingchi in Tibet (the Yarlung Zangbo river basin), Aba and Garze prefectures in Sichuan, and Lijiang in Yunnan. The environmental economic signature of these areas translates into “High security, High exposure, Excellent baseline environment.” Statistically (Figure 6), their socioeconomic and comfort components such as GDP (X9) and Annual mean temperature (X4) overwhelmingly exceed regional norms. Concurrently, hazard constraints like Elevation (X1), Distance to towns (X10), and Distance to main roads (X11) sit at remarkably lower tiers. This signifies that these regions possess comparatively pleasant climates, superior atmospheric oxygen concentration (due to lower altitudes), excellent transportation connectivity, and robust logistical/medical back–line support. The sophisticated infrastructural coverage successfully offsets the “high exposure” penalties generated by extended tourist visitation, rendering these loci the safest territories for initiating plateau tourism protocols.
Figure 6.
Indicator characteristics of different tourism risk levels. (a) Low tourism risk. (b) Relatively low tourism risk. (c) Medium tourism risk. (d) Relatively high tourism risk. (e) High tourism risk.
Intermediate (Medium) risk zones principally function as buffer transition strips delineating high and low risk proximities prominently observed flanking the margins of the Qaidam Basin and sections of the Hengduan Mountains’ alpine gorges. Notably, transversing deep into physically hostile hinterlands, ribbon–like medium risk buffers emerge tracking major trunk arteries (i.e., the Qinghai–Tibet and Sichuan–Tibet Highways), creating localized “safety corridors” amidst extreme risk backgrounds. Variables here demonstrate balanced equilibrium representing transitional ecological and social attributes. Elements spanning elevation, climate variables, and vegetative stability average halfway between maximum safety and extreme hazard profiles. While traffic corridor effects extend rudimentary accessibility and infrastructure arrays, they fall short of providing the dense safeguard saturation characterized by primary civic hubs. Subsequently, any shock from sudden natural disasters or individual emergencies encounters moderate rescue latency and restricted environmental buffering mechanisms, leaving discernible latent vulnerabilities.
The High risk and Relatively high risk environments subsume the geographic majority of the plateau, blanketing the isolated continuous hinterlands and the deep northwest. Prominent topographies include the Qiangtang Plateau across northern Tibet, Hoh Xil spreading modern western Qinghai, and the massive Kunlun Mountains cordillera bridging southern Xinjiang. The geospatial signature dictating these expanses correlates to strictly “High altitude, High hazard, Low security.” Statistically characterized by extreme ceilings in Elevation (X1), Distance to towns (X10), and Distance to main roads (X11), concurrent with absolute minimums regarding Annual mean temperature (X4), Vegetation coverage (X3), and GDP (X9). The inference identifies that extreme stratospheric elevations paired alongside inhospitable atmospheric lethality (hyper–frigid and hypoxic) forge the foundational hazard architecture. Compounded inextricably by exhaustive distances severing these regions from civic centers and trunk grids, mandatory medical infrastructures and supply–chain logistics are practically non-existent. Should an incidental crisis materialize here, injecting external physical rescue remains functionally improbable, cementing the extreme baseline logic elevating these grids to peak risk parameters.
4.3. Influencing Factor Analysis
To explore the intricate driving mechanisms through which respective indicators formulate tourism hazards, the SHAP framework unpacks the optimized model. The analytical narrative dissects intrinsic causality along three sequential paradigms: identifying paramount individual contributors, decoding their nonlinear quantitative behaviors (threshold dynamics), and unveiling complex interactive synergies bridging multiple variables.
4.3.1. Key Influencing Factors Identification
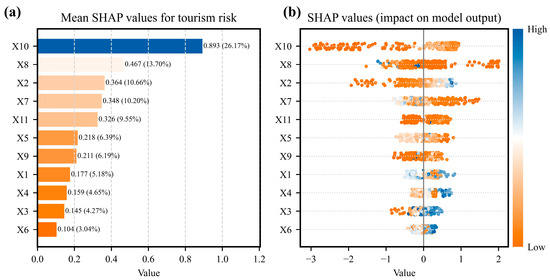
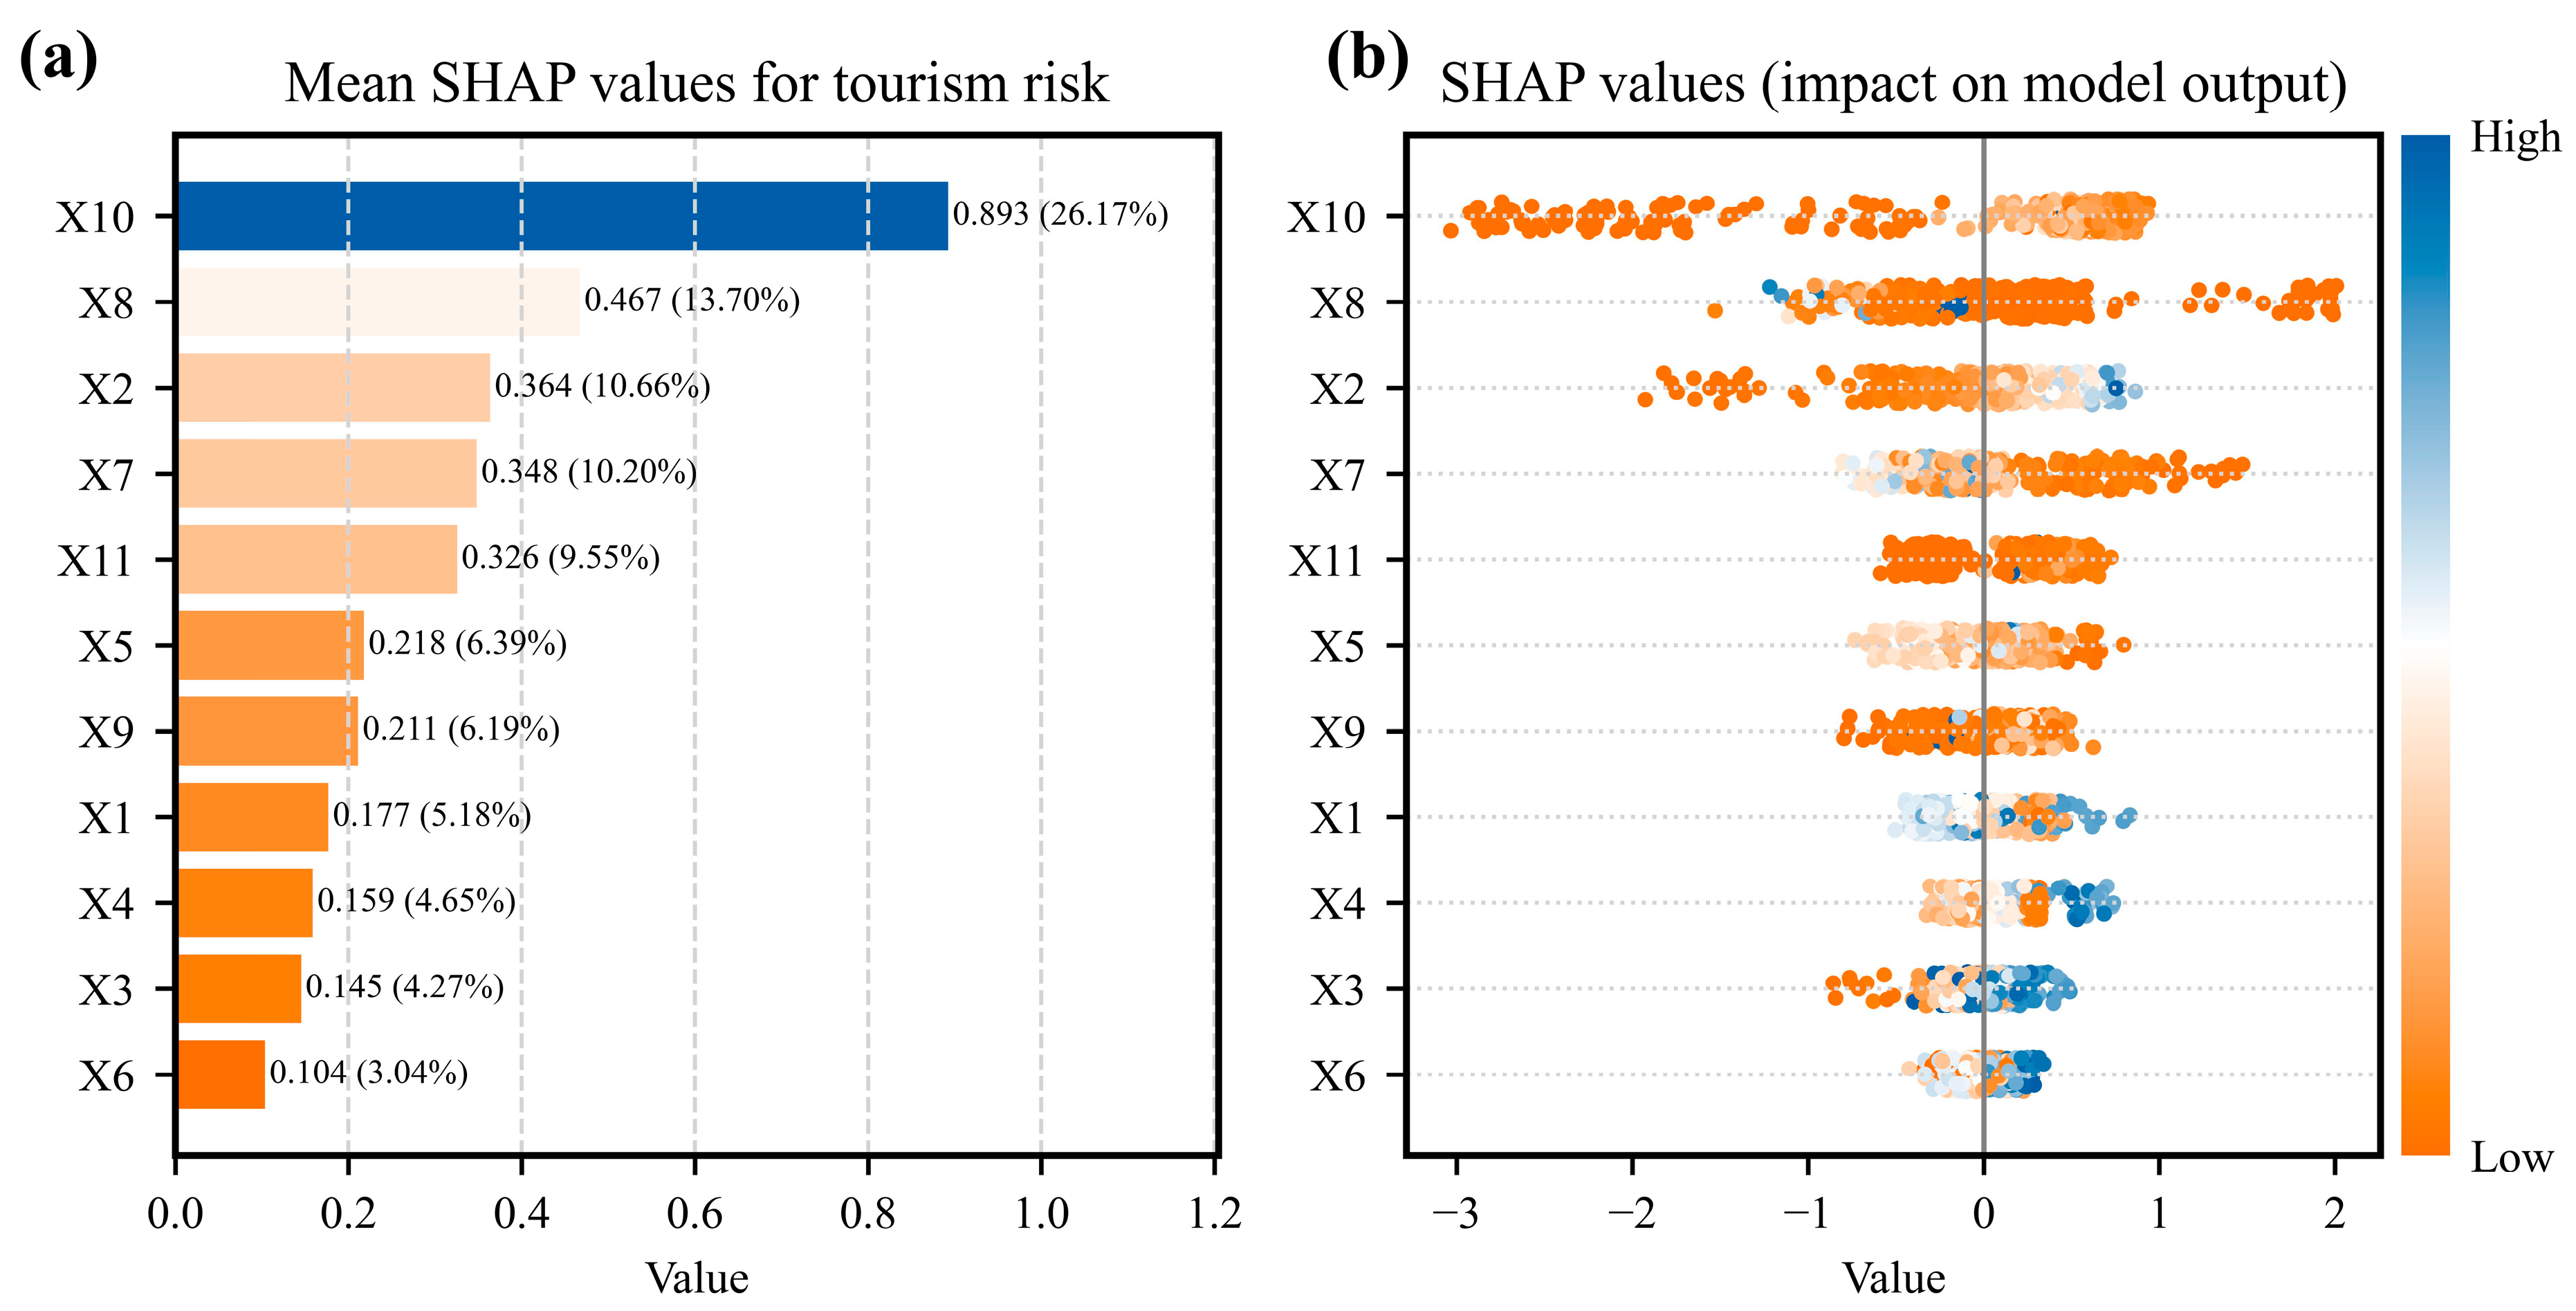
Based on relative mean absolute SHAP values (Figure 7a), Distance to towns (X10) is the most important factor in the model, with a contribution of 26.17%. This result indicates that accessibility to towns, which is closely related to emergency response, medical support, supplies, and communication conditions, plays a central role in differentiating predicted tourism risk on the QTP. However, this does not imply that environmental factors are unimportant. Rather, it suggests that in high altitude and sparsely populated areas, safety support capacity strongly regulates how environmental hazards translate into tourism risk. Reception facility kernel density (X8), Relief degree of land surface (X2), and Scenic spot kernel density (X7) follow, with contribution values of 13.70%, 10.66%, and 10.20%, respectively. The cumulative contribution of these four factors exceeds 60%, indicating that tourism risk on the QTP is jointly shaped by safety security, hazard–formative environmental conditions, and tourism exposure.
Figure 7.
Importance ranking and contribution distribution of tourism risk influencing factors based on SHAP values. (a) Feature importance ranking based on mean absolute SHAP values. (b) SHAP summary plot showing the impact direction and magnitude of features.
Transitioning to evaluate the directional impact dictated by each variable (Figure 7b), SHAP value clusters regarding Distance to towns (X10), Distance to main roads (X11), Relief degree of land surface (X2), and Elevation (X1) manifest predominantly inside the positive axis threshold. This mathematically certifies that maximum index values within these metrics (e.g., immense spatial remoteness, violently undulating terrain ruptures, supreme altitude ceilings) exponentially aggravate the projected tourism risk. In direct inverse contrast, the distribution spectrum detailing Reception facility kernel density (X8), Scenic spot kernel density (X7), Vegetation coverage (X3), and GDP (X9) universally crowds along the negative SHAP baseline. Consequently, high observational values tied to these indicators (signifying dense hospitality infrastructure matrices, rich ecological canopy, and elite economic benchmarks) successfully inject suppressing mechanics functioning to neutralize hazard probabilities.
4.3.2. Nonlinear Acting Mechanisms of Key Factors
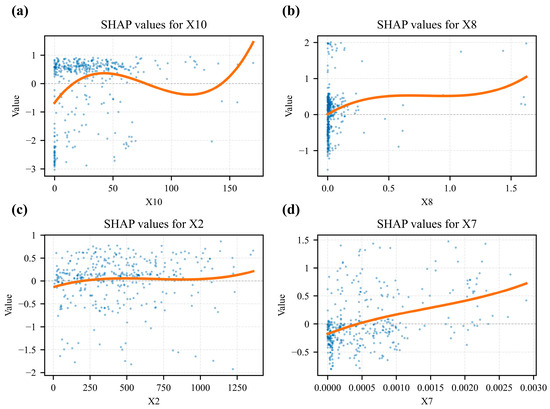
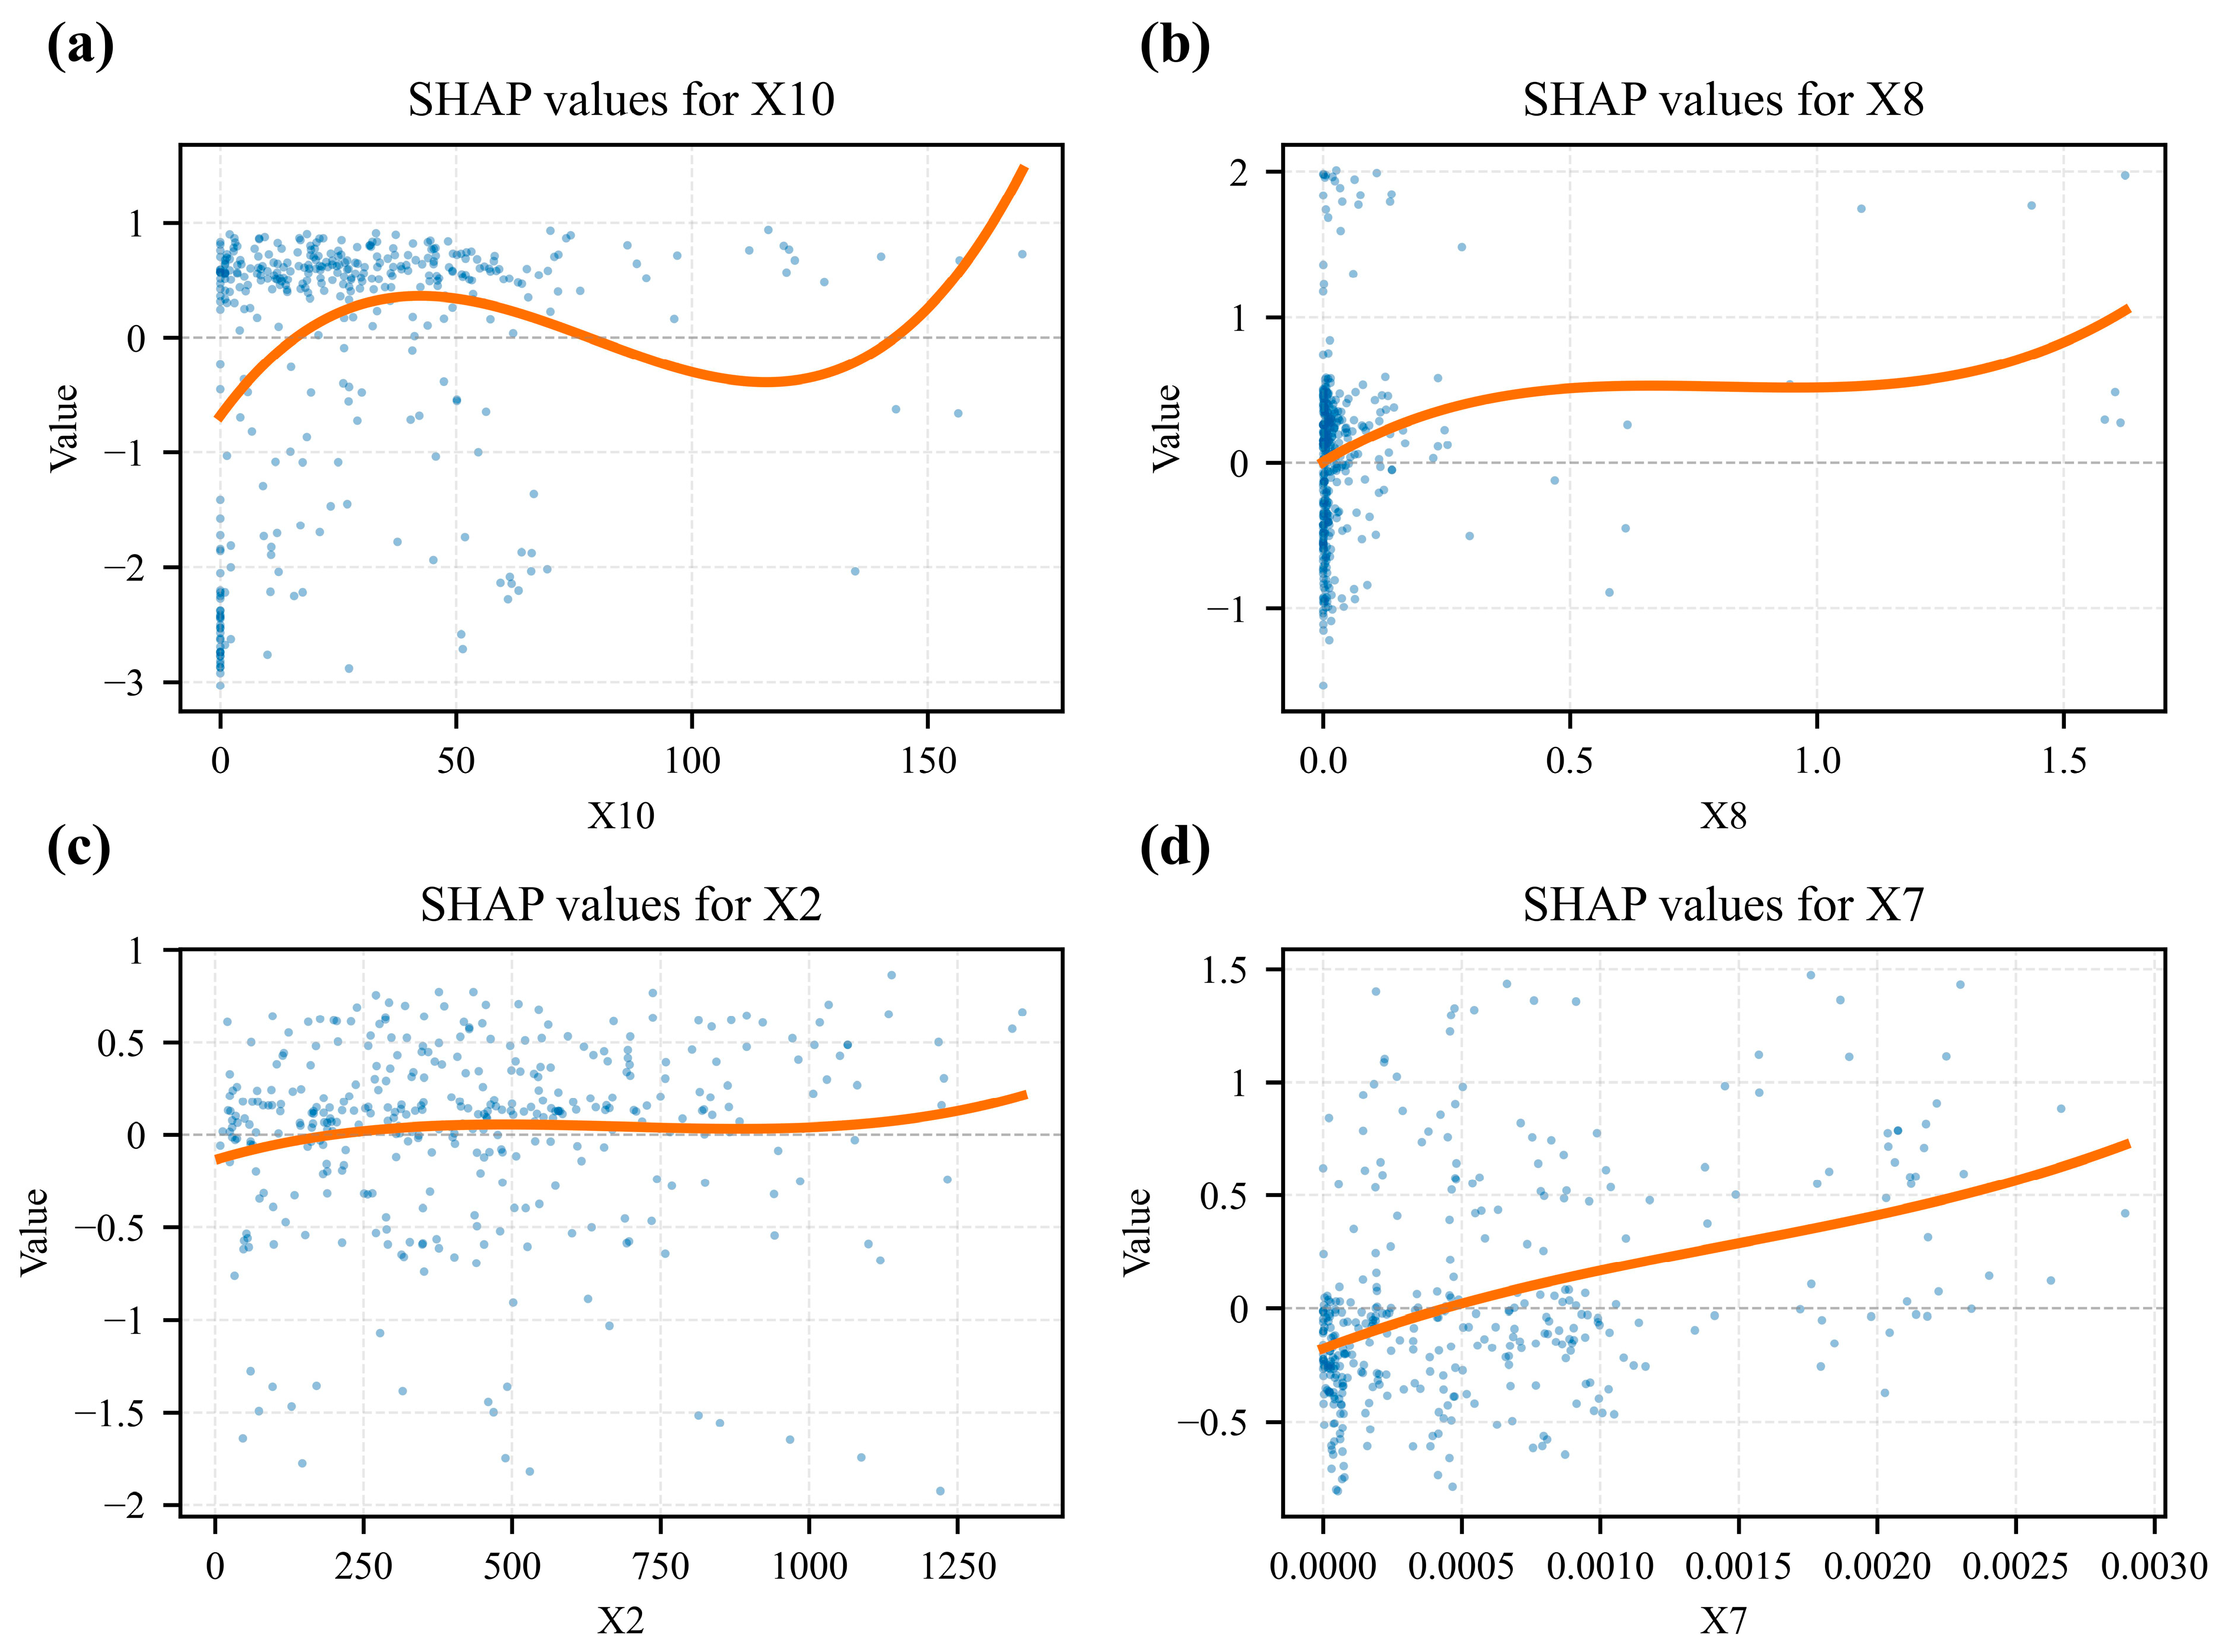
SHAP dependency plots were used to examine the nonlinear associations between key factors and model predicted tourism risk (Figure 8).
Figure 8.
SHAP dependence plots for the top four most important features. The plots show the effect of single features on the model’s output for tourism risk: (a) Distance to towns (X10), (b) Reception facility kernel density (X8), (c) Relief degree of land surface (X2), and (d) Scenic spot kernel density (X7). The blue dots represent individual predictions, and the orange line shows the overall trend.
For Distance to towns (X10), SHAP values generally increase as the distance from towns increases (Figure 8a). This indicates that areas farther from towns tend to receive higher predicted risk contributions in the model. The increase is particularly evident within approximately 0–50 km, after which SHAP values fluctuate within a relatively high range. This pattern suggests that the safety support function of towns may weaken with increasing distance, while beyond a certain distance, additional remoteness contributes less additional variation to the predicted risk.
For Reception facility kernel density (X8), SHAP values decrease as facility density increases, especially in low density areas (Figure 8b). This indicates that the presence of basic tourism reception facilities is associated with lower predicted risk. However, when facility density reaches a relatively high level, the marginal reduction in SHAP values becomes weaker, suggesting a possible diminishing marginal effect of additional facilities.
For Relief degree of land surface (X2), higher terrain relief is generally associated with higher SHAP values (Figure 8c). This result indicates that rugged terrain tends to increase predicted tourism risk, probably because complex terrain can affect road accessibility, tourist mobility, and rescue difficulty. However, the relationship is not strictly linear, and the effect becomes less clear in areas with extremely high relief, which may be related to limited tourism activity and sparse infrastructure in such areas.
For Scenic spot kernel density (X7), SHAP values generally show a negative or weakly negative contribution when scenic spot density increases (Figure 8d). This suggests that mature scenic areas may reduce predicted risk through better management, infrastructure, and service capacity. Nevertheless, in some high density scenic areas, SHAP values fluctuate, indicating that concentrated tourist activities may increase exposure and partially offset the risk reducing effect of management and facilities.
4.3.3. Interactive Mechanisms Between Key Factors
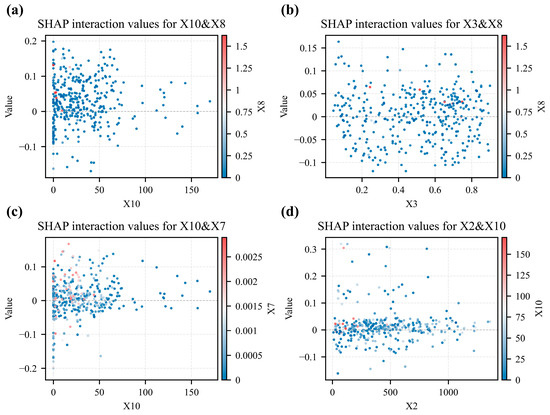
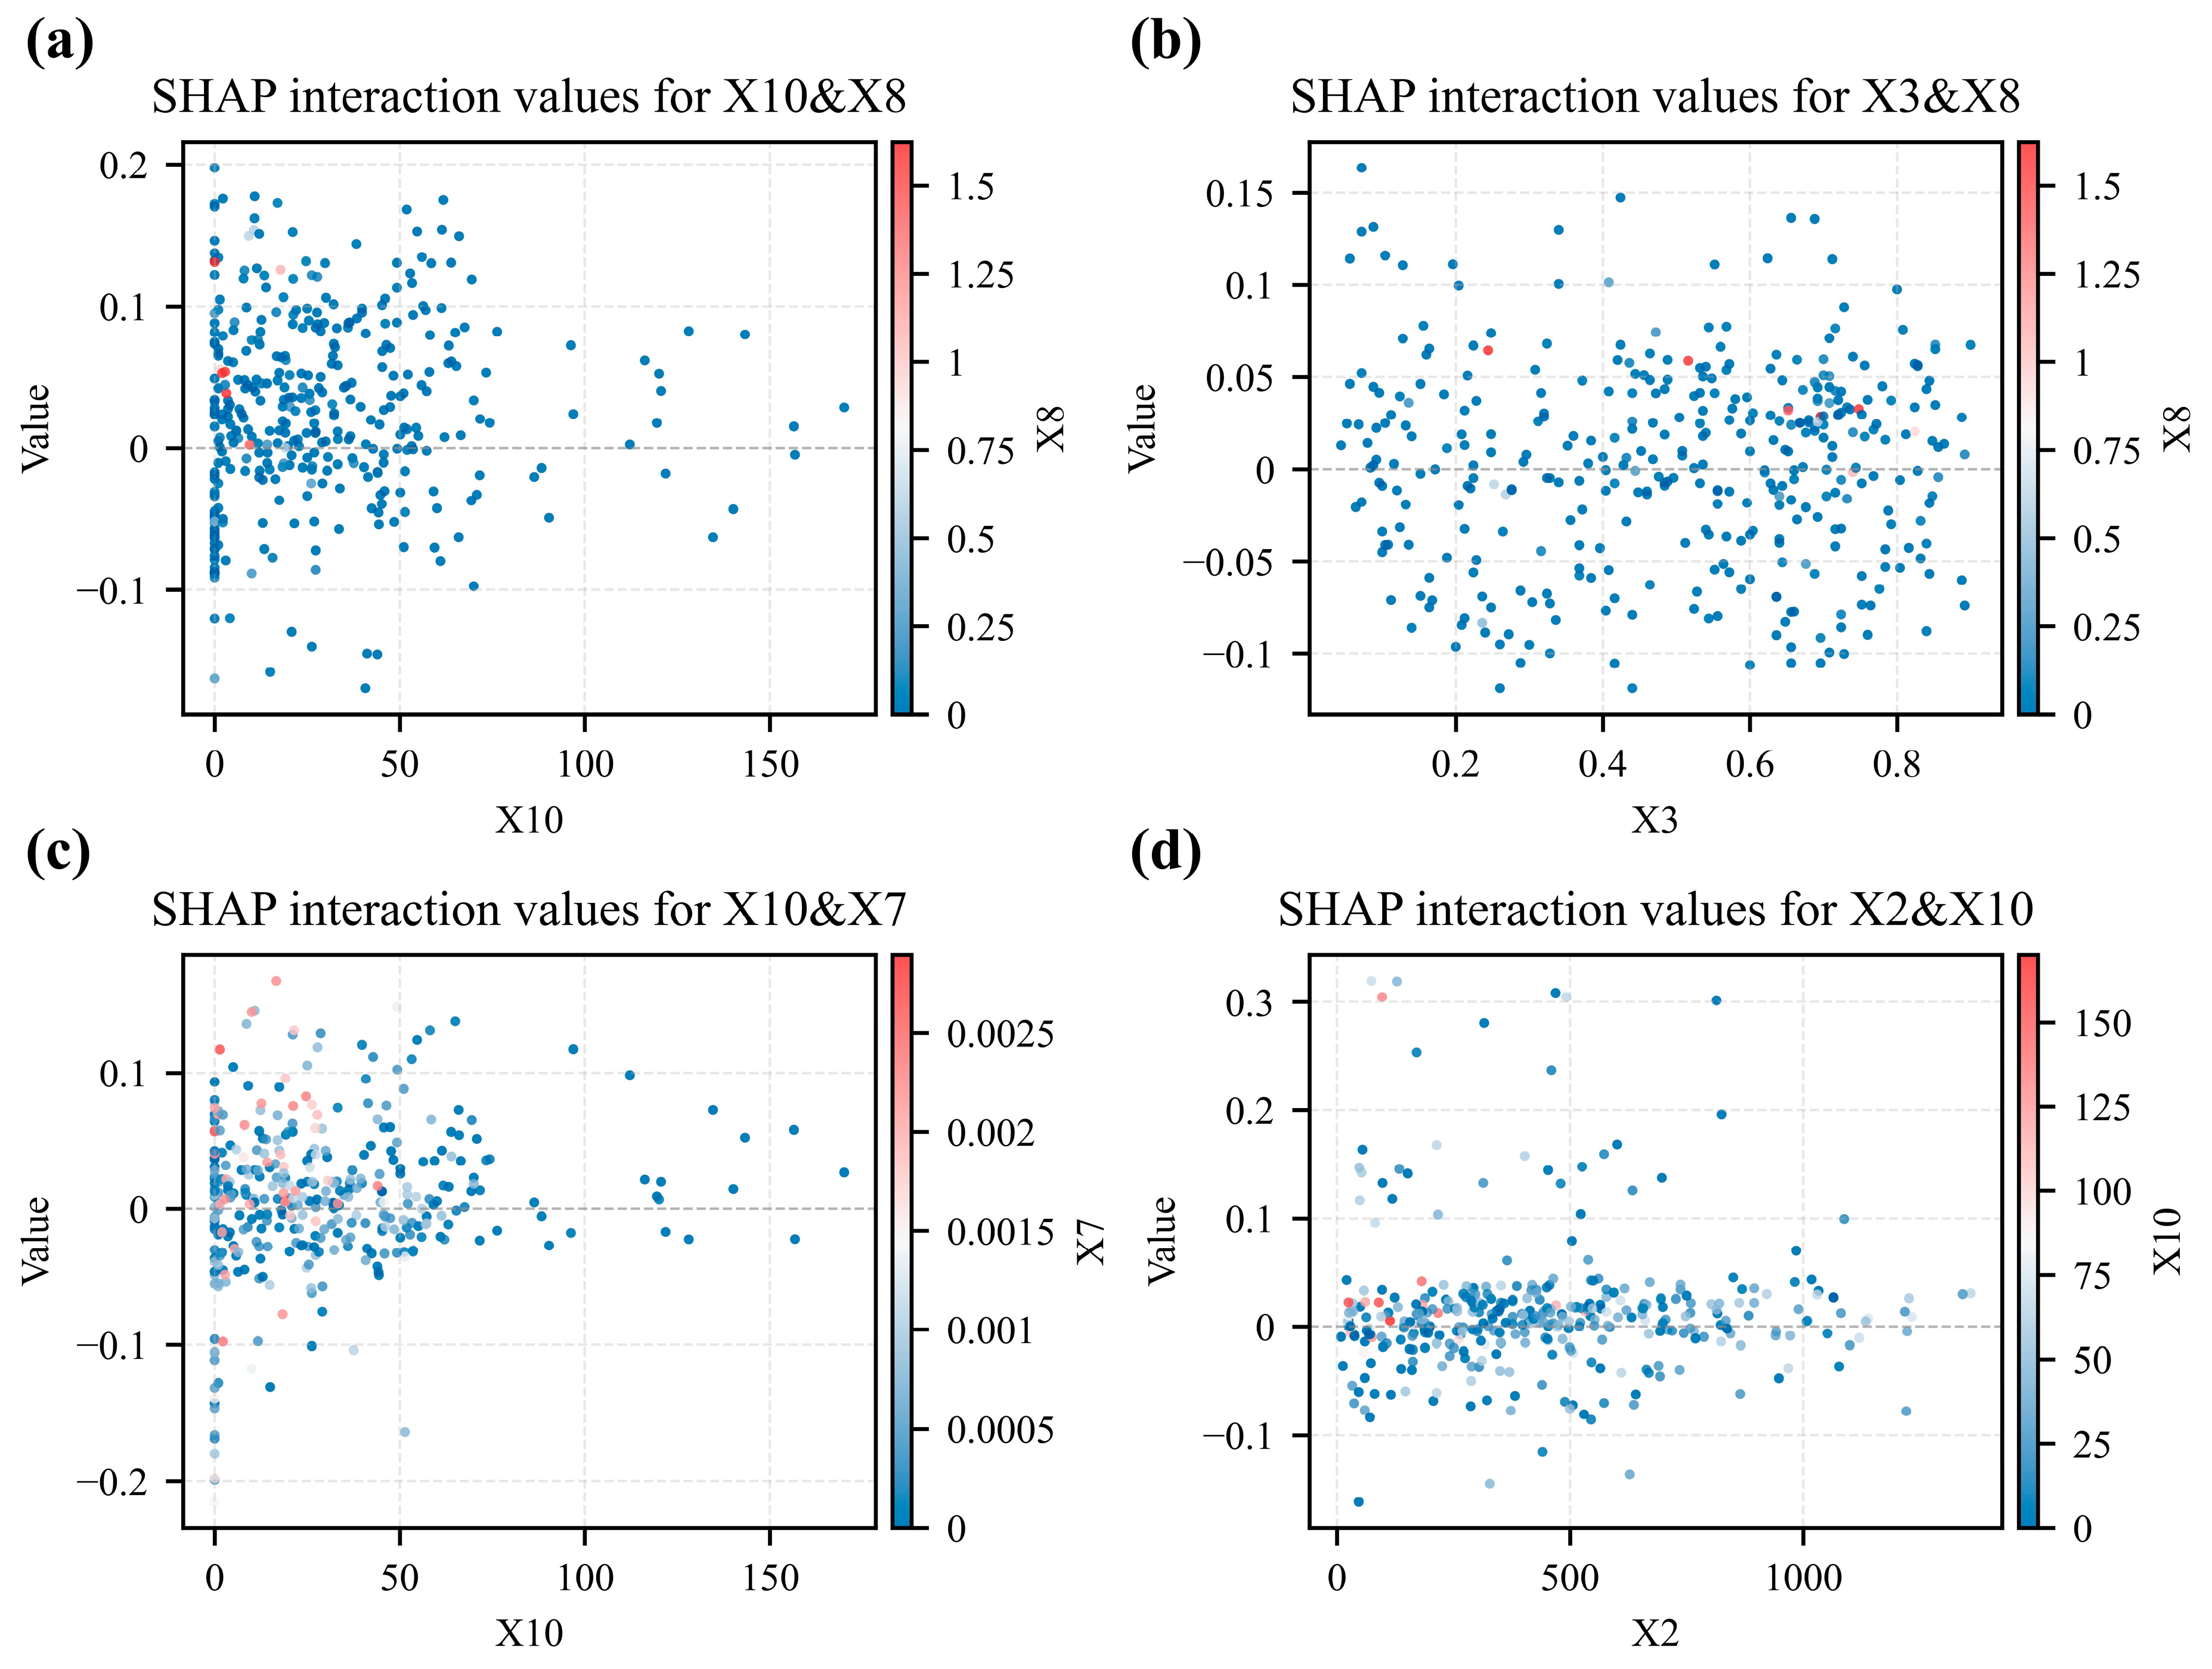
SHAP interaction values were used to examine whether the influence of one factor on predicted tourism risk varies with another factor (Figure 9).
Figure 9.
SHAP interaction effects of the top four strongest interacting factor pairs on tourism risk. (a) Interaction between distance to towns and reception facility kernel density. (b) Interaction between vegetation coverage and reception facility kernel density. (c) Interaction between distance to towns and scenic spot kernel density. (d) Interaction between relief degree of land surface and distance to towns.
The interaction between Distance to towns (X10) and Reception facility kernel density (X8) is relatively prominent (Figure 9a). In areas far from towns, low reception facility density is associated with higher predicted risk contributions, whereas higher facility density may partly offset the risk contribution of remoteness.
The interaction between Vegetation coverage (X3) and Reception facility kernel density (X8) suggests that areas with better ecological conditions and stronger facility support tend to have lower predicted risk contributions (Figure 9b). This pattern may reflect the combined effects of relatively stable environmental conditions and better tourism service capacity.
The interaction between Distance to towns (X10) and Scenic spot kernel density (X7) indicates that scenic spot concentration may reduce predicted risk in some remote areas (Figure 9c), probably because mature scenic areas often have more standardized management, route organization, and emergency services.
For the interaction between Relief degree of land surface (X2) and Distance to towns (X10), the interaction values show a positive tendency in some areas where both terrain relief and remoteness are high (Figure 9d). However, when terrain relief exceeds a high threshold, many interaction values cluster around zero, indicating that the interaction effect is not uniformly strong across all rugged areas.
5. Discussion
5.1. Expansion of the Tourism Risk Evaluation Framework
The main framework adjustment of this study lies in replacing direct disaster event indicators, such as landslides, earthquakes, debris flows, and extreme weather events, with hazard–formative factors, including elevation, terrain relief, vegetation coverage, temperature, and precipitation. In many tourism and disaster risk assessments, historical disaster events or their occurrence frequency are commonly used to represent the hazard dimension [3,41,42]. This approach is effective when disaster records are complete, spatially balanced, and sufficiently representative. However, in the QTP, historical disaster records are often spatially uneven because of sparse population, limited monitoring capacity, low accessibility, and relatively low levels of routine tourism activity in remote areas. Therefore, directly using disaster event frequency as an evaluation indicator may underestimate potential risks in areas where hazards are likely to occur but records are incomplete.
From the perspective of disaster formation, events such as landslides, debris flows, snowstorms, and extreme precipitation are not isolated phenomena; they are closely related to underlying environmental conditions, including terrain, altitude, vegetation, temperature, and precipitation [6,26]. For example, steep terrain and strong relief may increase the possibility of slope related hazards and traffic interruption; high altitude and low temperature may increase physiological stress and emergency difficulty for tourists; and precipitation conditions may influence the occurrence of weather related and geomorphological hazards. Therefore, using hazard–formative factors allows the evaluation framework to capture the environmental basis of potential tourism hazards in a spatially continuous way, rather than relying only on discrete historical disaster points.
This adjustment does not deny the importance of historical disaster events. Instead, historical disaster records were used in this study to construct positive training samples, while hazard–formative factors were used as predictive indicators. In this way, the model learns the relationship between recorded risk events and the environmental conditions under which they occur, and then extends this relationship to areas lacking sufficient event records. This design helps reduce dependence on incomplete disaster inventories and improves the applicability of the risk assessment framework to large, sparsely monitored plateau regions.
At the same time, the framework integrates Risk exposure and Safety security to avoid treating environmental hazards as the only source of tourism risk. Tourism risk is shaped not only by where hazardous conditions exist, but also by whether tourists are likely to enter or stay in these areas and whether emergency support can be provided in time. The SHAP results further show that safety security variables, especially Distance to towns, play an important role in the model, indicating that accessibility, rescue capacity, and infrastructure conditions can regulate how environmental hazards translate into tourism risk. Therefore, the “Hazard–formative factors + Risk exposure + Safety security” framework provides a more suitable structure for tourism risk assessment in high altitude regions where historical disaster records are incomplete and safety support capacity is unevenly distributed.
5.2. Spatial Pattern and Generative Mechanisms of Tourism Risk on the QTP
Empirical diagnostic mapping shows that tourism risk on the QTP not only follows a broad spatial gradient of “high in the northwest and low in the southeast”, but also presents a clearer point–axis structure around towns and transport corridors. The emergence of medium risk transitional zones along major roadways suggests that transportation networks can partially mitigate the strong environmental constraints of the plateau and create relatively safer travel corridors [43].
At a finer scale, the spatial pattern also reflects a pronounced mismatch between high landscape attractiveness and limited safety support capacity. Areas with rich tourism resources and high destination attractiveness are often located in regions with harsh terrain and fragile environments, especially in the Sanjiangyuan and Hengduan Mountain blocks [26]. This indicates that tourism development in these regions is constrained by the coexistence of strong attraction and weak protection.
This result is consistent with previous findings from the Nepalese Himalayas, where visually attractive mountain destinations were also found to face high environmental vulnerability and limited emergency support capacity [44]. In the QTP, similar spatial conditions imply that tourism activities in highly attractive but remote areas are more likely to face greater safety risks.
The SHAP interaction results further show that terrain fragmentation and remoteness may jointly increase predicted tourism risk in some locations. This means that when physical accessibility is poor, rescue difficulty and response delay are more likely to increase. Therefore, tourism development in plateau regions cannot simply follow conventional low altitude models, but must account for the specific constraints of high altitude environments and limited rescue accessibility [45].
5.3. Superiority and Applicability of Interpretable Machine Learning
The integration of XGBoost with SHAP improves tourism risk modeling by combining high predictive performance with interpretability. Compared with traditional linear or weighted models, this framework can better capture the nonlinear relationships and threshold effects among tourism risk factors, while also reducing the subjectivity commonly seen in manual weighting approaches [14].
More importantly, the SHAP analysis makes it possible to identify how different variables contribute to predicted risk in both magnitude and direction. This helps avoid overly simplified assumptions, such as treating all infrastructure investment as linearly reducing risk. In reality, the relationship between risk and influencing factors is often nonlinear, and the marginal effect of additional infrastructure may weaken once a certain level of support capacity has been reached [36].
The SHAP interaction analysis also provides a clearer picture of how factors work together. It shows that physical infrastructure can partly reduce the risk contribution of remoteness, while terrain conditions may intensify the difficulty of emergency response. Such results are difficult to obtain from conventional black-box machine learning models.
Overall, this framework extends tourism risk research beyond spatial prediction alone. It not only identifies where risk is likely to be higher, but also helps explain why risk is concentrated in certain areas and how environmental and socioeconomic factors jointly shape that pattern. This makes interpretable machine learning a useful tool for understanding the complex human environment system of tourism on the QTP.
5.4. Policy Implications for Tourism Risk Management on the QTP
Based on the spatial pattern and influencing mechanisms identified above, tourism risk management on the QTP should shift from general post event response to differentiated and spatially targeted risk governance. Considering the high altitude, hypoxia, sparse population, long rescue distances, and easily disrupted road networks of the QTP, management strategies should be designed according to different risk levels and tourism scenarios. Similar mountain and high altitude tourism studies have also emphasized that environmental constraints and limited infrastructure capacity should be explicitly considered in tourism planning and impact management [46].
First, low and relatively low risk areas, mainly distributed around major towns, river valleys, mature scenic spots, and transport corridors, can be regarded as priority zones for regular tourism development. In these areas, local governments should continue improving visitor centers, medical service points, oxygen supply facilities, emergency communication systems, and road maintenance. For mature scenic areas near cities such as Lhasa, Nyingchi, Xining, and Lijiang, tourism management should focus on crowd flow control during peak seasons, emergency evacuation routes, public risk information boards, and real time weather and traffic alerts. These measures can strengthen routine safety management while maintaining the tourism carrying capacity of relatively accessible areas.
Second, medium risk areas, especially those located along major highways or in transition zones between urban nodes and remote plateau hinterlands, should be managed as controlled tourism corridors. These areas are suitable for self-driving tourism and organized group tourism, but they require stronger roadside emergency support. Specific measures include establishing emergency supply stations at key road nodes, improving mobile communication coverage, deploying oxygen and first aid equipment, setting up warning signs for altitude sickness and extreme weather, and creating temporary shelter points in sections vulnerable to snowstorms, landslides, debris flows, or road icing. Emergency logistics studies have shown that pre–positioning rescue resources and optimizing supply nodes can improve response efficiency under disaster conditions [47]. Therefore, for long distance self-driving routes on the QTP, tourist registration, itinerary reporting, vehicle inspection, and route level emergency supply planning should be encouraged.
Third, high and relatively high risk areas, mainly located in remote hinterlands, high altitude wilderness areas, the Qiangtang Plateau, Hoh Xil, the Kunlun Mountains, and other sparsely populated regions, should be subject to stricter access management. Independent and unregistered travel should be discouraged or restricted in extremely remote areas. For scientific expeditions, special interest tourism, or organized adventure activities, management authorities should require qualified guides, satellite communication devices, emergency positioning equipment, portable oxygen supplies, and pre–approved travel routes. In areas where road rescue is difficult, coordination among tourism departments, transportation authorities, meteorological agencies, medical institutions, and emergency management departments should be strengthened. GIS based emergency planning and route optimization can provide technical support for identifying safer rescue routes and alternative evacuation pathways in hazard prone areas [48].
Fourth, risk warning and emergency response should be linked to real time environmental thresholds. For example, tourism routes should issue warnings or temporary closures when extreme precipitation, snowstorms, road icing, landslide warnings, or severe temperature drops are forecast. High altitude tourist areas should provide health warnings related to altitude sickness and recommend gradual ascent, rest points, and oxygen supply. A multi-source early warning platform integrating meteorological forecasts, road condition information, scenic spot visitor flow, mobile communication signals, and emergency reports would improve the timeliness and precision of tourism risk management. Previous studies have demonstrated that tourists’ digital footprints and location based service data can be used to identify tourist mobility patterns and human flow responses to extreme weather events [49,50], providing a useful basis for dynamic tourism risk warnings on the QTP.
Finally, policy implementation should be integrated with existing local tourism and emergency management systems. Rather than building a completely new governance structure, the results of this study can support the refinement of scenic area management, self-driving route planning, emergency rescue station layout, and tourism safety publicity in Qinghai, Xizang, Sichuan, Yunnan, Gansu, and Xinjiang. The risk map generated in this study can be used as a spatial reference for identifying priority areas for infrastructure investment, emergency resource allocation, route–level risk warnings, and differentiated tourism access management.
5.5. Research Limitations and Future Directions
Although this study improves spatial tourism risk prediction on the QTP by integrating interpretable machine learning and multi-source spatial data, several limitations remain.
First, tourist vulnerability was not included in the quantitative indicator system because spatially continuous and reliable data on individual tourist characteristics are difficult to obtain at the regional scale. In reality, tourists differ substantially in high altitude adaptability, age, health status, travel mode, outdoor experience, risk perception, equipment preparation, and activity intensity. These differences directly affect their vulnerability to altitude sickness, extreme weather, traffic interruption, and outdoor accidents. Previous tourism risk studies have shown that travelers’ self–protection behavior and risk perception significantly influence their responses to health and safety risks [51]. Future studies should incorporate tourist vulnerability indicators using questionnaire surveys, social media data, mobile phone signaling data, travel trajectory data, online rescue records, and health related information, so as to support differentiated risk assessment for self-driving tourists, hikers, elderly tourists, and expedition groups.
Second, the definition of negative samples may introduce selection bias. In this study, towns and mature scenic areas were used as relatively low risk samples because they generally have stronger safety support capacity. However, these areas may also have high tourist exposure, and their lower risk may result from better infrastructure rather than intrinsically safer environmental conditions. Therefore, the negative samples should be understood as relatively low risk samples under stronger safety security conditions. Future research should combine areas with no disaster records, low tourist exposure, emergency incident data, and field investigation records to construct more refined negative samples.
Third, random down–sampling was used to address the imbalance between positive and negative samples. Although this approach reduces class bias, it may discard part of the spatial heterogeneity contained in the majority class. Future studies should compare multiple imbalance learning strategies, such as repeated down–sampling, ensemble down–sampling, synthetic oversampling, cost–sensitive learning, and spatially stratified cross validation, to improve both model robustness and geographical representativeness.
Fourth, the current model is mainly based on static or long term average spatial indicators and therefore cannot fully capture short term dynamic risks caused by sudden weather changes, road closures, landslides, snowstorms, or seasonal tourism peaks. Dynamic risk assessment studies have emphasized the need to incorporate changing environmental conditions, especially under extreme rainfall or other rapidly evolving hazard scenarios [52]. In addition, dynamic exposure modeling provides an important direction for improving geo risk assessment by representing temporal changes in exposed populations and assets [53]. Future studies should therefore integrate high frequency remote sensing data, real time meteorological forecasts, traffic monitoring, road condition reports, and tourist flow data to develop dynamic tourism risk prediction models.
Finally, the current study mainly reveals model based associations rather than causal mechanisms. SHAP improves interpretability by identifying feature contributions, nonlinear relationships, and interaction patterns, but it does not prove causality. Future research can combine interpretable machine learning with field surveys, process based disaster models, and causal inference methods to better explain the mechanisms of tourism risk formation in high altitude environments. Moreover, agent based modeling has been increasingly used in tourism research to simulate tourist movement, decision making, congestion, and overtourism processes [54,55]. Integrating such behavioral simulation approaches with spatial risk models may help reveal how tourists respond to environmental constraints and how collective mobility patterns reshape tourism risk exposure.
6. Conclusions
This study developed a tourism risk assessment framework for the Qinghai–Tibet Plateau based on the “Hazard–formative factors + Risk exposure + Safety security” nexus and integrated XGBoost with SHAP to predict and interpret spatial tourism risk. By incorporating 11 indicators related to environmental background conditions, tourism exposure, and safety support capacity, the study provides a spatially explicit assessment of tourism risk in an extreme high altitude destination.
The optimized XGBoost model achieved an AUC of 0.877, suggesting that the proposed framework has good predictive performance. The predicted tourism risk on the QTP shows a clear spatial pattern of “high in the northwest and low in the southeast”. High risk and relatively high risk areas dominate the plateau and are mainly distributed in remote hinterlands, northwestern plateau regions, and areas far from towns and major roads. In contrast, low risk and relatively low risk areas are mainly concentrated around southeastern river valleys, urban nodes, mature scenic areas, and transport corridors. This spatial pattern reflects the combined influence of harsh environmental conditions, uneven tourism facility distribution, and spatial differences in emergency accessibility.
The SHAP results further indicate that Distance to towns is the most important factor in the model, followed by Reception facility kernel density, Relief degree of land surface, and Scenic spot kernel density. These findings suggest that tourism risk on the QTP is not determined solely by natural environmental constraints such as altitude and terrain, but is also closely associated with safety support capacity and tourism service facilities. The nonlinear analysis shows that increasing distance from towns is generally associated with higher predicted risk, while higher reception facility density tends to reduce predicted risk, especially in low density areas. The interaction analysis suggests that tourism facilities and scenic area management may partly compensate for weak accessibility in some remote areas, whereas rugged terrain and remoteness may jointly increase risk in certain locations. However, these results should be interpreted as model–based associations rather than direct causal relationships.
This study contributes to tourism risk research in two aspects. First, by emphasizing hazard–formative environmental conditions rather than relying only on historical disaster frequencies, the proposed framework is suitable for plateau regions where disaster records are spatially uneven or incomplete. Second, by combining XGBoost with SHAP, the study moves beyond risk mapping alone and provides an interpretable explanation of factor importance, nonlinear responses, and interaction patterns. These insights can support more differentiated tourism safety governance on the QTP. Specifically, relatively low risk areas around towns and mature scenic spots can support regular tourism development; medium risk corridors along major roads require strengthened emergency stations, communication coverage, and route–level warnings; and remote high risk hinterlands require stricter access management, itinerary reporting, emergency positioning, and interdepartmental rescue coordination.
Several limitations remain. Tourist vulnerability, including high altitude adaptability, health status, travel mode, outdoor experience, and risk perception, was not included because spatially continuous individual level data are difficult to obtain at the regional scale. The use of towns and mature scenic areas as relatively low risk samples may also introduce selection bias, and random down–sampling may reduce the spatial heterogeneity of high risk samples. In addition, the current model is mainly based on static or long–term average spatial indicators and cannot fully capture short term dynamic risks caused by extreme weather, road closures, seasonal tourism peaks, or sudden disasters. Future studies should incorporate tourist behavior data, emergency incident records, real time meteorological and traffic information, and dynamic exposure data to develop more refined and human centered tourism risk assessment models for the QTP and other extreme tourism environments.
Author Contributions
Conceptualization, Ziqiang Li and Jianchao Xi; Methodology, Ziqiang Li and Jianchao Xi; Software, Ziqiang Li; Formal Analysis, Ziqiang Li; Validation, Zumilaiti Aihemaitijiang; Investigation, Sui Ye and Zumilaiti Aihemaitijiang; Data Curation, Sui Ye; Writing—Original Draft, Ziqiang Li; Writing—Review and Editing, Jianchao Xi, Sui Ye and Zumilaiti Aihemaitijiang; Visualization, Ziqiang Li; Supervision, Jianchao Xi; Project Administration, Jianchao Xi; Funding Acquisition, Jianchao Xi. All authors have read and agreed to the published version of the manuscript.
Funding
This research was funded by the National Natural Science Foundation of China, grant number U24A20583.
Data Availability Statement
The raw data supporting the conclusions of this article will be made available by the authors on request.
Acknowledgments
The authors are grateful to those who reviewed the article. The anonymous reviewers are acknowledged for their valuable comments.
Conflicts of Interest
All authors declare no financial or non–financial competing interests.
References
- Steiger, R.; Knowles, N.; Pöll, K.; Rutty, M. Impacts of climate change on mountain tourism: A review. J. Sustain. Tour. 2024, 32, 1984–2017. [Google Scholar] [CrossRef] [Scilit]
- Scott, D.; Hall, C.M.; Gössling, S. Global tourism vulnerability to climate change. Ann. Tour. Res. 2019, 77, 49–61. [Google Scholar] [CrossRef] [Scilit]
- Rosselló, J.; Becken, S.; Santana-Gallego, M. The effects of natural disasters on international tourism: A global analysis. Tour. Manag. 2020, 79, 104080. [Google Scholar] [CrossRef] [Scilit]
- León-Cruz, J.F.; Neger, C.; Gössling, S. Extreme weather risks for tourism in the European Union. Nat. Hazards 2025, 121, 18275–18294. [Google Scholar] [CrossRef] [Scilit]
- Wang, L.-E.; Zeng, Y.; Zhong, L. Impact of Climate Change on Tourism on the Qinghai–Tibetan Plateau: Research Based on a Literature Review. Sustainability 2017, 9, 1539. [Google Scholar] [CrossRef] [Scilit]
- Ye, T.; Shi, P.; Cui, P. Integrated Disaster Risk Research of the Qinghai-Tibet Plateau Under Climate Change. Int. J. Disaster Risk Sci. 2023, 14, 507–509. [Google Scholar] [CrossRef] [Scilit]
- Liu, S.; Liu, R.; Tan, N. A Spatial Improved-kNN-Based Flood Inundation Risk Framework for Urban Tourism under Two Rainfall Scenarios. Sustainability 2021, 13, 2859. [Google Scholar] [CrossRef] [Scilit]
- Camatti, N.; Hrast Essenfelder, A.; Giove, S. Mapping the exposure of tourism to weather extremes: The need for a spatially-explicit gridded dataset for disaster risk reduction. Environ. Res. Lett. 2024, 19, 064008. [Google Scholar] [CrossRef] [Scilit]
- Aznar–Crespo, P.; Aledo, A.; Melgarejo–Moreno, J. Social vulnerability to natural hazards in tourist destinations of developed regions. Sci. Total Environ. 2020, 709, 135870. [Google Scholar] [CrossRef] [Scilit] [PubMed]
- Mitrică, B.; Şerban, P.-R.; Roznoviețchi, I.; Micu, D.; Persu, M.; Grigorescu, I.; Amihăesei, V.; Dumitraşcu, M.; Damian, N. The tourism sector’s vulnerability to climate change–related phenomena. Case study: Romania. Int. J. Disaster Risk Reduct. 2025, 118, 105248. [Google Scholar] [CrossRef] [Scilit]
- Becken, S.; Mahon, R.; Rennie, H.G.; Shakeela, A. The tourism disaster vulnerability framework: An application to tourism in small island destinations. Nat. Hazards 2014, 71, 955–972. [Google Scholar] [CrossRef] [Scilit]
- Tsaur, S.H.; Tzeng, G.H.; Wang, K.C. Evaluating tourist risks from fuzzy perspectives. Ann. Tour. Res. 1997, 24, 796–812. [Google Scholar] [CrossRef] [Scilit]
- Hsu, T.-H.; Lin, L.-Z. Using fuzzy set theoretic techniques to analyze travel risk: An empirical study. Tour. Manag. 2006, 27, 968–981. [Google Scholar] [CrossRef] [Scilit]
- Orencio, P.M.; Fujii, M. A localized disaster-resilience index to assess coastal communities based on an analytic hierarchy process (AHP). Int. J. Disaster Risk Reduct. 2013, 3, 62–75. [Google Scholar] [CrossRef] [Scilit]
- Li, Y.; Tang, J.; Zhang, C.; Li, Q.; Chi, S.; Zhang, Y.; Qi, H.; Zhang, C. Analysis and machine-learning-based prediction of beach accidents on a recreational beach in China. Anthr. Coasts 2024, 7, 29. [Google Scholar] [CrossRef] [Scilit]
- Fleitas, P.E.; Sarasola, L.B.; Ferrer, D.C.; Muñoz, J.; Petrone, P. Machine learning approach to identify malaria risk in travelers using real-world evidence. Heliyon 2024, 10, e28534. [Google Scholar] [CrossRef] [Scilit] [PubMed]
- Song, J.; Xu, H. Safety Risk Evaluation of Tourism Management System Based on PSO-BP Neural Network. Wirel. Commun. Mob. Comput. 2023, 2023, 2968129. [Google Scholar] [CrossRef] [Scilit]
- Selcuk, O.; Cizel, B. Using qualitative comparative analysis approach in tourism studies: A critical review. Qual. Quant. 2024, 58, 933–960. [Google Scholar] [CrossRef] [Scilit]
- Estevão, C.; Costa, C. Natural disaster management in tourist destinations: A systematic literature review. Eur. J. Tour. Res. 2020, 25, 2502. [Google Scholar] [CrossRef] [Scilit]
- Ritchie, B.W.; Jiang, Y. A review of research on tourism risk, crisis and disaster management: Launching the annals of tourism research curated collection on tourism risk, crisis and disaster management. Ann. Tour. Res. 2019, 79, 102812. [Google Scholar] [CrossRef] [Scilit]
- Hsu, J.L.; Sharma, P. Disaster and risk management in outdoor recreation and tourism in the context of climate change. Int. J. Clim. Change Strateg. Manag. 2022, 15, 712–728. [Google Scholar] [CrossRef] [Scilit]
- Wang, Y.; Li, Z.; Deng, X. Assessment of cultural ecosystem services of the Qinghai–Tibetan Plateau: Guarding the beauty of the Plateau, co-creating a better future. Ecol. Indic. 2024, 166, 112405. [Google Scholar] [CrossRef] [Scilit]
- Hu, L.; Xu, J.; Bao, C.; Pei, T. Influential Factor Detection for Tourism on the Qinghai–Tibet Plateau Based on Social Media Data. ISPRS Int. J. Geo-Inf. 2021, 10, 579. [Google Scholar] [CrossRef] [Scilit]
- Li, Z.; Ye, S.; Xi, J. Assessing Risks in Cross–Regional Tourism Corridors: A Case Study of Tibetan Plateau Tourism. ISPRS Int. J. Geo-Inf. 2024, 13, 171. [Google Scholar] [CrossRef] [Scilit]
- Calgaro, E.; Dominey–Howes, D.; Lloyd, K. Application of the Destination Sustainability Framework to explore the drivers of vulnerability and resilience in Thailand following the 2004 Indian Ocean Tsunami. J. Sustain. Tour. 2014, 22, 361–383. [Google Scholar] [CrossRef] [Scilit]
- Zhang, Y.-Q.; Wang, Y.-L.; Li, H.; Li, X.-M. Risk assessment of mountain tourism on the Western Sichuan Plateau, China. J. Mt. Sci. 2023, 20, 3360–3375. [Google Scholar] [CrossRef] [Scilit]
- Burtscher, J.; Gatterer, H.; Niederseer, D.; Vonbank, K.; Burtscher, M. Flying to high-altitude destinations. Minerva Medica 2025, 116, 43–61. [Google Scholar] [CrossRef] [Scilit] [PubMed]
- Sun, Y.; Yang, Q.; Chen, P. Dynamic Evaluation of Tourism Safety Risk in the Changbai Mountains Scenic Spot. Sci. Geogr. Sin. 2019, 39, 770–778. [Google Scholar] [CrossRef]
- Schirpke, U.; Tasser, E.; Tappeiner, U. Predicting scenic beauty of mountain regions. Landsc. Urban Plan. 2013, 111, 1–12. [Google Scholar] [CrossRef] [Scilit]
- Nicholl, J.; West, J.; Goodacre, S.; Turner, J. The relationship between distance to hospital and patient mortality in emergencies: An observational study. Emerg. Med. J. 2007, 24, 665. [Google Scholar] [CrossRef] [Scilit] [PubMed]
- Beere, P.; Brabyn, L. Providing the evidence: Geographic accessibility of maternity units in New Zealand. N. Z. Geogr. 2006, 62, 135–143. [Google Scholar] [CrossRef] [Scilit]
- Jones, A.P.; Bentham, G. Emergency medical service accessibility and outcomefrom road traffic accidents. Public Health 1995, 109, 169–177. [Google Scholar] [CrossRef] [Scilit]
- Chen, T.; Guestrin, C. XGBoost: A Scalable Tree Boosting System. In Proceedings of the 22nd ACM SIGKDD International Conference on Knowledge Discovery and Data Mining, San Francisco, CA, USA, 13–17 August 2016; Association for Computing Machinery: New York, NY, USA, 2016; pp. 785–794. [Google Scholar]
- Snoek, J.; Larochelle, H.; Adams, R.P. Practical Bayesian Optimization of Machine Learning Algorithms. arXiv 2012, arXiv:1206.2944. [Google Scholar] [CrossRef] [Scilit]
- Halder, K.; Srivastava, A.K.; Ghosh, A.; Das, S.; Banerjee, S.; Pal, S.C.; Chatterjee, U.; Bisai, D.; Ewert, F.; Gaiser, T. Improving landslide susceptibility prediction through ensemble recursive feature elimination and meta–learning framework. Sci. Rep. 2025, 15, 5170. [Google Scholar] [CrossRef] [Scilit]
- Fu, X.; Wang, M.; Zhang, D.; Chen, F.; Peng, X.; Wang, L.; Tan, S.K. An XGBoost–SHAP framework for identifying key drivers of urban flooding and developing targeted mitigation strategies. Ecol. Indic. 2025, 175, 113579. [Google Scholar] [CrossRef] [Scilit]
- Huang, S.; Shao, Y.; Hu, L.; Bi, J.; Ma, Z. Unveiling the Spatio-Temporal Patterns and mechanisms of poverty incidence in Southwest China through multi-sourced data and interpretable machine learning. Appl. Geogr. 2025, 176, 103541. [Google Scholar] [CrossRef] [Scilit]
- Wang, Z.; Zhou, R.; Rui, J.; Yu, Y. Revealing the impact of urban spatial morphology on land surface temperature in plain and plateau cities using explainable machine learning. Sustain. Cities Soc. 2025, 118, 106046. [Google Scholar] [CrossRef] [Scilit]
- Gu, T.; Zhao, H.; Yue, L.; Guo, J.; Cui, Q.; Tang, J.; Gong, Z.; Zhao, P. Attribution analysis of urban social resilience differences under rainstorm disaster impact: Insights from interpretable spatial machine learning framework. Sustain. Cities Soc. 2025, 118, 106029. [Google Scholar] [CrossRef] [Scilit]
- Mandrekar, J.N. Receiver Operating Characteristic Curve in Diagnostic Test Assessment. J. Thorac. Oncol. 2010, 5, 1315–1316. [Google Scholar] [CrossRef] [Scilit]
- Becken, S.; Hughey, K.F.D. Linking tourism into emergency management structures to enhance disaster risk reduction. Tour. Manag. 2013, 36, 77–85. [Google Scholar] [CrossRef] [Scilit]
- Ye, X.; Wen, J.; Zhu, Z.; Sun, R. Natural disaster risk assessment in tourist areas based on multi scenario analysis. Earth Sci. Inform. 2022, 15, 659–670. [Google Scholar] [CrossRef] [Scilit]
- Prideaux, B. The role of the transport system in destination development. Tour. Manag. 2000, 21, 53–63. [Google Scholar] [CrossRef] [Scilit]
- Nyaupane, G.P.; Chhetri, N. Vulnerability to Climate Change of Nature-Based Tourism in the Nepalese Himalayas. Tour. Geogr. 2009, 11, 95–119. [Google Scholar] [CrossRef] [Scilit]
- Mao, Y.; Yang, X.; He, B. Assessment of emergency rescue capability in mountainous tourism destinations under climate extremes. J. Mt. Sci. 2025, 22, 4174–4189. [Google Scholar] [CrossRef] [Scilit]
- Geneletti, D.; Dawa, D. Environmental impact assessment of mountain tourism in developing regions: A study in Ladakh, Indian Himalaya. Environ. Impact Assess. Rev. 2009, 29, 229–242. [Google Scholar] [CrossRef] [Scilit]
- Caunhye, A.M.; Nie, X.; Pokharel, S. Optimization models in emergency logistics: A literature review. Socio-Econ. Plan. Sci. 2012, 46, 4–13. [Google Scholar] [CrossRef] [Scilit]
- Francini, M.; Artese, S.; Gaudio, S.; Palermo, A.; Viapiana, M.F. To support urban emergency planning: A GIS instrument for the choice of optimal routes based on seismic hazards. Int. J. Disaster Risk Reduct. 2018, 31, 121–134. [Google Scholar] [CrossRef] [Scilit]
- Salas-Olmedo, M.H.; Moya-Gómez, B.; García-Palomares, J.C.; Gutiérrez, J. Tourists’ digital footprint in cities: Comparing Big Data sources. Tour. Manag. 2018, 66, 13–25. [Google Scholar] [CrossRef] [Scilit]
- Chen, Z.; Gong, Z.; Yang, S.; Ma, Q.; Kan, C. Impact of extreme weather events on urban human flow: A perspective from location–based service data. Comput. Environ. Urban Syst. 2020, 83, 101520. [Google Scholar] [CrossRef] [Scilit]
- Wang, J.; Liu-Lastres, B.; Ritchie, B.W.; Mills, D.J. Travellers’ self-protections against health risks: An application of the full Protection Motivation Theory. Ann. Tour. Res. 2019, 78, 102743. [Google Scholar] [CrossRef] [Scilit]
- Li, R.; Huang, S.; Dou, H. Dynamic Risk Assessment of Landslide Hazard for Large-Scale Photovoltaic Power Plants under Extreme Rainfall Conditions. Water 2023, 15, 2832. [Google Scholar] [CrossRef] [Scilit]
- Pittore, M.; Wieland, M.; Fleming, K. Perspectives on global dynamic exposure modelling for geo-risk assessment. Nat. Hazards 2017, 86, 7–30. [Google Scholar] [CrossRef] [Scilit]
- Moreno, J.; Parada, J.; Peña-Miranda, D.D. Agent–Based Model Applied for the Study of Overtourism in an Urban Context. Sustainability 2025, 17, 3248. [Google Scholar] [CrossRef] [Scilit]
- Baktash, A.; Huang, A.; de la Mora Velasco, E.; Jahromi, M.F.; Bahja, F. Agent-based modelling for tourism research. Curr. Issues Tour. 2023, 26, 2115–2127. [Google Scholar] [CrossRef] [Scilit]

Disclaimer/Publisher’s Note: The statements, opinions and data contained in all publications are solely those of the individual author(s) and contributor(s) and not of MDPI and/or the editor(s). MDPI and/or the editor(s) disclaim responsibility for any injury to people or property resulting from any ideas, methods, instructions or products referred to in the content. |
© 2026 by the authors. Published by MDPI on behalf of the International Society for Photogrammetry and Remote Sensing. Licensee MDPI, Basel, Switzerland. This article is an open access article distributed under the terms and conditions of the Creative Commons Attribution (CC BY) license.