


Abstract
The relationship between economic development and residents’ perceived urban well-being remains an important question in urban research. This study examines whether the relationship between GDP and city-level satisfaction exhibits non-linear patterns or plateau effects. Using the 2024 nationwide Urban Physical Examination (UPE) resident survey in China, this study assesses how city economic level relates to perceived urban well-being, proxied by city-level overall satisfaction. The survey was conducted in April–June 2024 in the main urban districts of 47 cities, using 499,500 valid questionnaires. We aggregate satisfaction to the city level, match it with GDP and key city characteristics, and estimate the GDP–satisfaction association using restricted cubic splines (RCS) to test for potential non-linearity. Across unadjusted and covariate-adjusted models (accounting for population scale and density, industrial structure, fiscal capacity, and regional effects), results show a robust positive association between economic level and satisfaction, while nested-model tests provide no evidence that spline terms improve fit over a linear specification within the observed GDP range. Substantial dispersion around the fitted curve indicates that GDP is an enabling capacity rather than a sufficient condition, pointing to cross-city differences in how effectively resources are converted into lived urban quality. We propose using GDP-adjusted satisfaction benchmarking within the UPE cycle to identify underperforming cities and prioritize targeted governance and renewal actions.
1. Introduction
China has entered a phase of high urbanization in which rapid economic expansion coexists with persistent “urban maladies”. By the end of 2023, the urbanization rate of permanent residents reached 66.16%, indicating a predominantly urban society [1]. Yet, high GDP does not necessarily translate into a “healthy city” in residents’ daily experience: even economically advanced cities may face severe congestion, recurrent pluvial flooding, public safety concerns, and environmental degradation, while some less affluent cities may offer more affordable housing, more manageable commuting burdens, and better everyday accessibility [2]. In response, China has promoted the Urban Physical Examination (UPE) as a problem-oriented governance instrument since 2018, with pilots launched in 11 cities in 2019 and subsequent expansion [3,4]. A distinctive feature of UPE is the institutionalization of large-scale resident surveys, where city-level satisfaction serves as a key people-centred indicator to assess perceived “urban well-being” alongside objective diagnostics [5,6]. City-level satisfaction should be interpreted as an evaluative perception of urban living conditions rather than a direct measure of health outcomes. Therefore, it is an important initiative that can effectively reflect the health and resident well-being of the city.
From an academic standpoint, the link between economic development and perceived urban well-being is theoretically non-linear and empirically debated. Subjective well-being (SWB) research generally finds that income is positively associated with evaluative measures (e.g., life satisfaction), but the marginal returns may diminish due to adaptation and social comparison [7,8,9]. Cross-country evidence, however, often reports a robust positive association between national income and average SWB, suggesting that the growth–well-being relationship can be context-dependent rather than universally plateauing. These debates imply that the GDP–satisfaction relationship may exhibit threshold, plateau, or other non-linear patterns—functional forms that are substantively important for policy interpretation [10]. Meanwhile, urban perceived health/quality of life (QoL) is multidimensional and shaped by demographic pressure, the built environment, public service provision, and environmental management—domains emphasized in the “healthy city” paradigm [11,12]. In the UPE context, these domains also tend to covary with economic level; therefore, empirical models that relate GDP to resident-rated city satisfaction should, at minimum, account for key city characteristics (e.g., population, density, industrial structure, fiscal capacity) to reduce omitted-variable bias [13]. Methodologically, restricted cubic splines (RCS) provide a flexible and interpretable approach to diagnosing and testing non-linearity without imposing arbitrary cut-points [14].
In addition, urban economics provides important theoretical insights for understanding the relationship between economic development and urban satisfaction at the city level [15]. Cities with higher economic productivity often benefit from agglomeration economies, improved infrastructure provision, and broader access to public services. These factors may enhance residents’ perceived quality of life and urban satisfaction. At the same time, urban development may also generate agglomeration diseconomies such as congestion, environmental pressure, housing affordability challenges, and governance complexity [16]. As cities grow and economic activity intensifies, these negative externalities may partially offset the benefits associated with economic growth. From the perspective of spatial equilibrium theory, individuals may sort across cities based on trade-offs between wages, amenities, and living costs [17]. Consequently, the relationship between economic development and urban satisfaction may not necessarily be strictly linear, and diminishing marginal returns to economic growth may emerge at higher development levels.
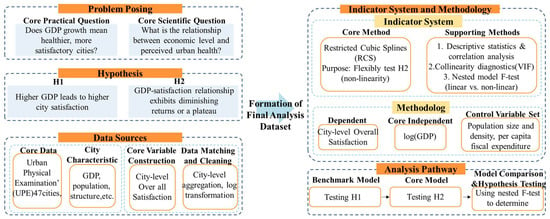
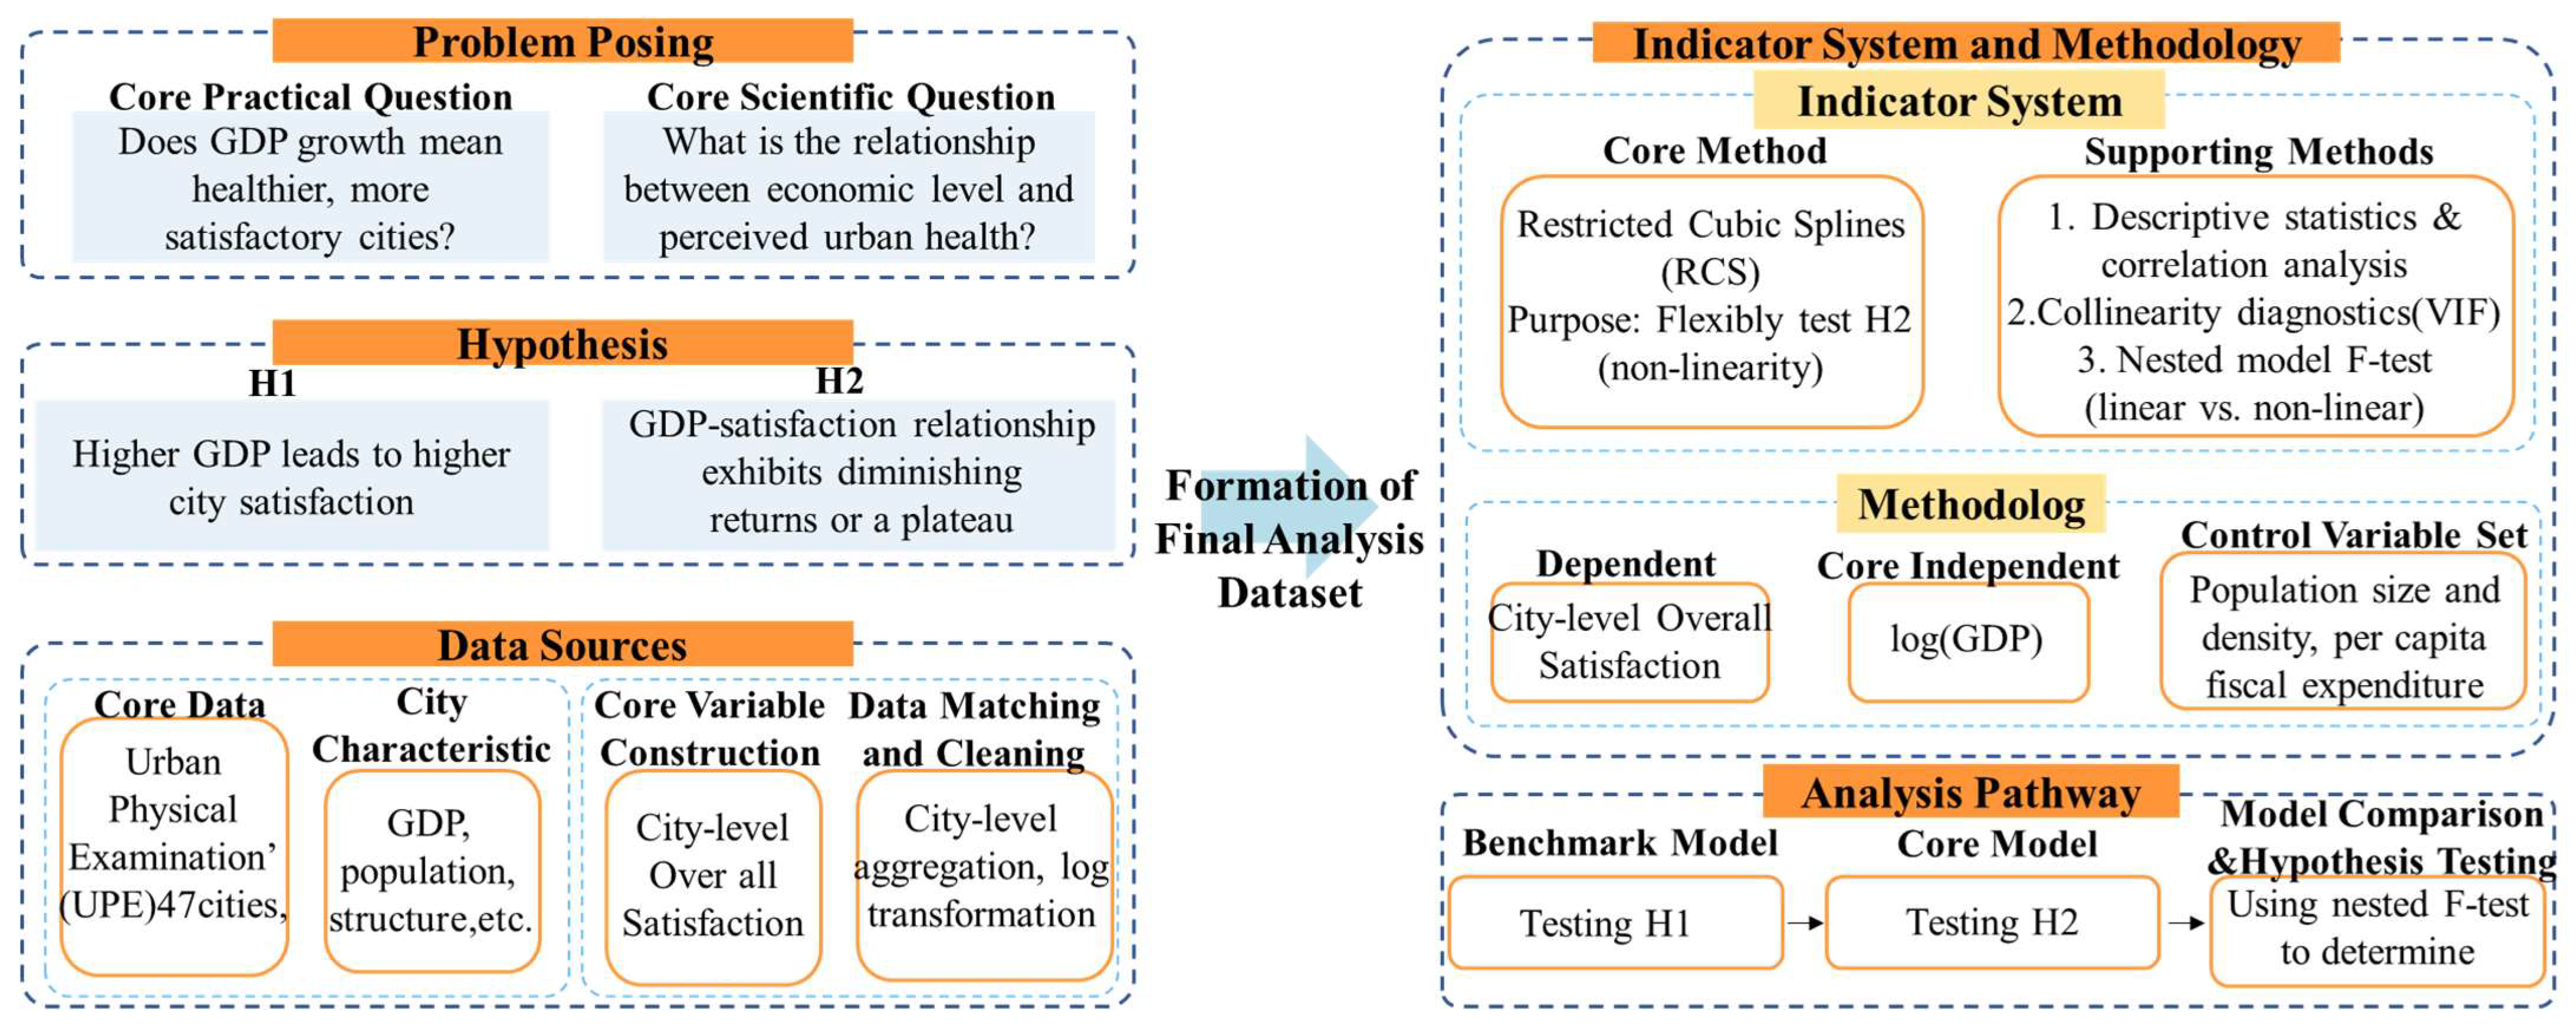
Against this background, this study examines whether and how city economic level (GDP) is associated with city-level overall satisfaction—used as a parsimonious proxy for perceived urban well-being—using the 2024 nationwide UPE resident survey dataset (details reported in the Section 2). We estimate both a linear benchmark model and an RCS specification, and formally test non-linearity via nested-model comparisons, in both unadjusted and covariate-adjusted settings (Figure 1). The analysis is organized around two core expectations: H1: higher GDP is associated with higher city-level satisfaction; H2: The relationship between economic development and city-level satisfaction may exhibit diminishing marginal returns at higher levels of GDP. By clarifying the functional form of the GDP–perceived urban well-being relationship under an institutionalized people-centred governance framework (UPE), the study provides evidence for differentiated policy interpretation beyond “more growth is always better” [18].
Figure 1.
Research framework.
2. Data and Methods
2.1. Data Sources
This study draws on the nationwide Urban Physical Examination (UPE) resident survey organized by the Ministry of Housing and Urban-Rural Development (MoHURD) in 2024. The questionnaire was designed to capture residents’ perceived urban conditions across four spatial scales—dwelling, neighborhood/community, block, and city—and operationalized through 45 indicators spanning eight domains (e.g., safety and durability, ecological livability, safety resilience, and jobs–housing balance). The survey was implemented between April and June 2024 within the main urban districts of the sampled cities. In total, 692,800 questionnaires were collected from 47 cities; after data cleaning, 499,500 valid responses were retained, yielding an effective response rate of 71.96%.
The target population comprised local permanent residents aged 16 years and above who had resided in the city for at least six months, excluding short-term visitors and transient workers with shorter stays. To enhance representativeness and comparability across cities, the fieldwork adopted multiple sampling and quota-control strategies, including proportional stratified sampling and cross-quota controls, to ensure broad and balanced coverage in respondents’ spatial distribution and socio-demographic structure (gender, age, occupation, and income).
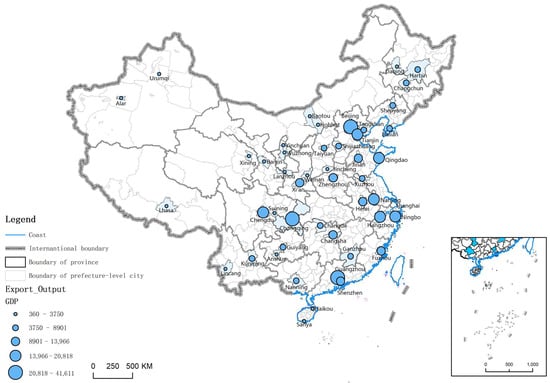
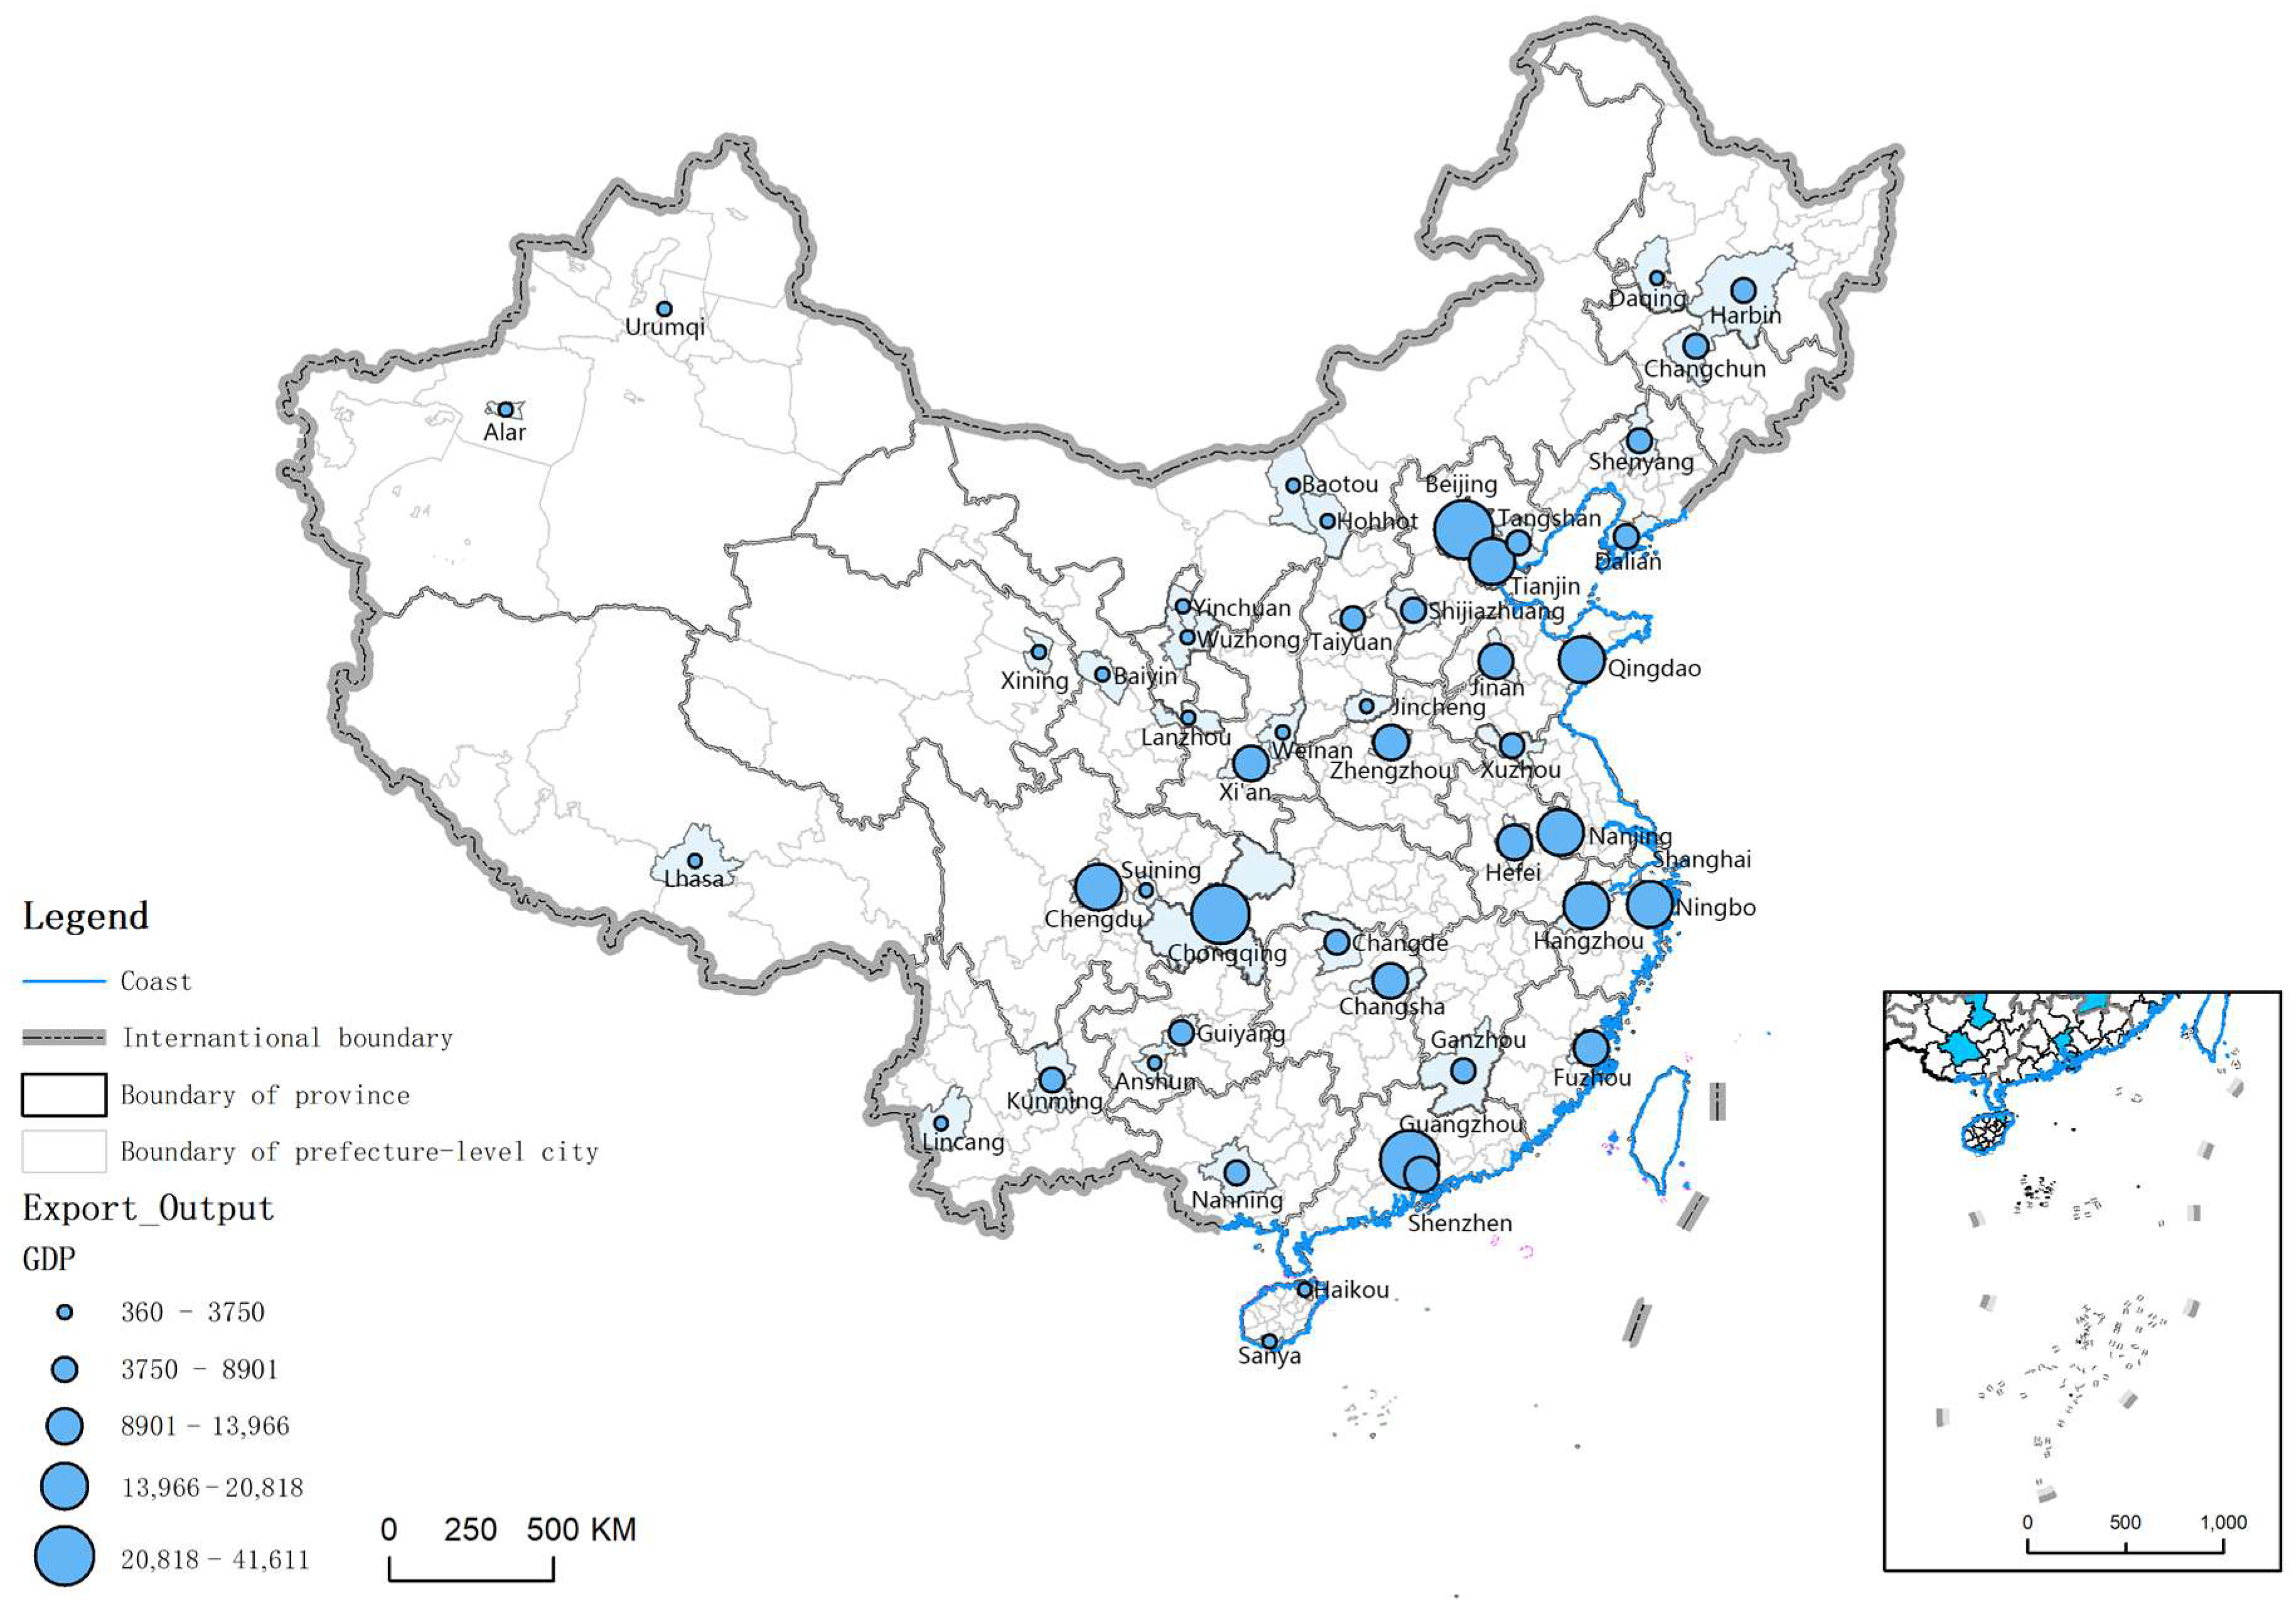
The 47 cities included in this study correspond to the cities participating in the 2024 Urban Physical Examination (UPE) resident survey organized by MoHURD. These cities were selected within the national UPE program to represent a diversity of development contexts in terms of economic level, population scale, and geographic location across China. The present study does not independently sample cities but uses the subset of cities for which complete survey data and matching socioeconomic indicators were available. This rationale is visualized in the national overview figure (Figure 2), which maps the sample cities and highlights between-city variation in GDP and population size.
Figure 2.
GDP and spatial distribution map of sample cities.
The original survey dataset contains nearly half a million individual responses. However, the primary objective of this study is to examine the relationship between city-level economic development and aggregate perceptions of urban satisfaction. Therefore, individual responses were aggregated to the city level to construct mean satisfaction scores for each city. This aggregation allows the analysis to align conceptually with the research question, which focuses on cross-city variation rather than individual-level determinants of subjective well-being. Similar aggregation strategies have been widely used in cross-regional studies examining macro-level determinants of subjective well-being. We acknowledge that aggregating micro-level responses into city-level averages inevitably reduces statistical variation and may introduce potential ecological inference limitations. However, given the city-level focus of the research question, the aggregation approach provides a transparent and conceptually consistent analytical framework. In the empirical analysis, individual responses are aggregated to the city level to construct the study outcome (overall satisfaction as a proxy for perceived urban well-being), while GDP and other city characteristics are matched at the same administrative level. Descriptive statistics of all study variables are reported in Table 1.
Table 1.
Descriptive statistics.
2.2. Methods and Preprocessing
- (1)
- Data preprocessing and analytic sample
The MoHURD UPE microdata were first screened according to the survey’s eligibility criteria (permanent residents aged ≥16 years with a minimum six-month residence). We then aggregated individual responses to the city level to construct the dependent variable, overall city satisfaction (Satisfaction), using the arithmetic mean of valid responses within each city. City-level socioeconomic covariates were harmonized to the same administrative level and matched to the 47 sampled cities. Given the strong right-skewness typical of macroeconomic indicators, GDP was log-transformed (log(GDP)) prior to modeling. Control variables were transformed when appropriate (e.g., logarithmic transformation for population and fiscal expenditure per capita) to reduce skewness and to improve linearity in covariate–outcome relations.
Both GDP and population are included in the regression models to capture different dimensions of urban development. GDP reflects the overall economic productivity of a city, whereas population size serves as a proxy for urban scale and the agglomeration of amenities and infrastructure typically associated with larger cities. Because these variables may exhibit strong correlation in cross-city datasets, both variables are log-transformed before entering the regression models. Logarithmic transformation is a common approach in empirical urban and regional studies, as it reduces skewness, stabilizes variance, and allows the estimated coefficients to be interpreted in elasticity terms when examining potentially non-linear relationships. Importantly, population is included primarily as a control variable to account for scale-related urban characteristics, while GDP captures economic development. Including both variables helps reduce omitted-variable bias when estimating the association between economic development and city-level satisfaction.
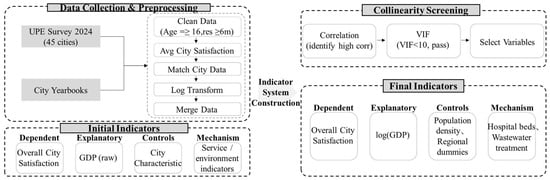
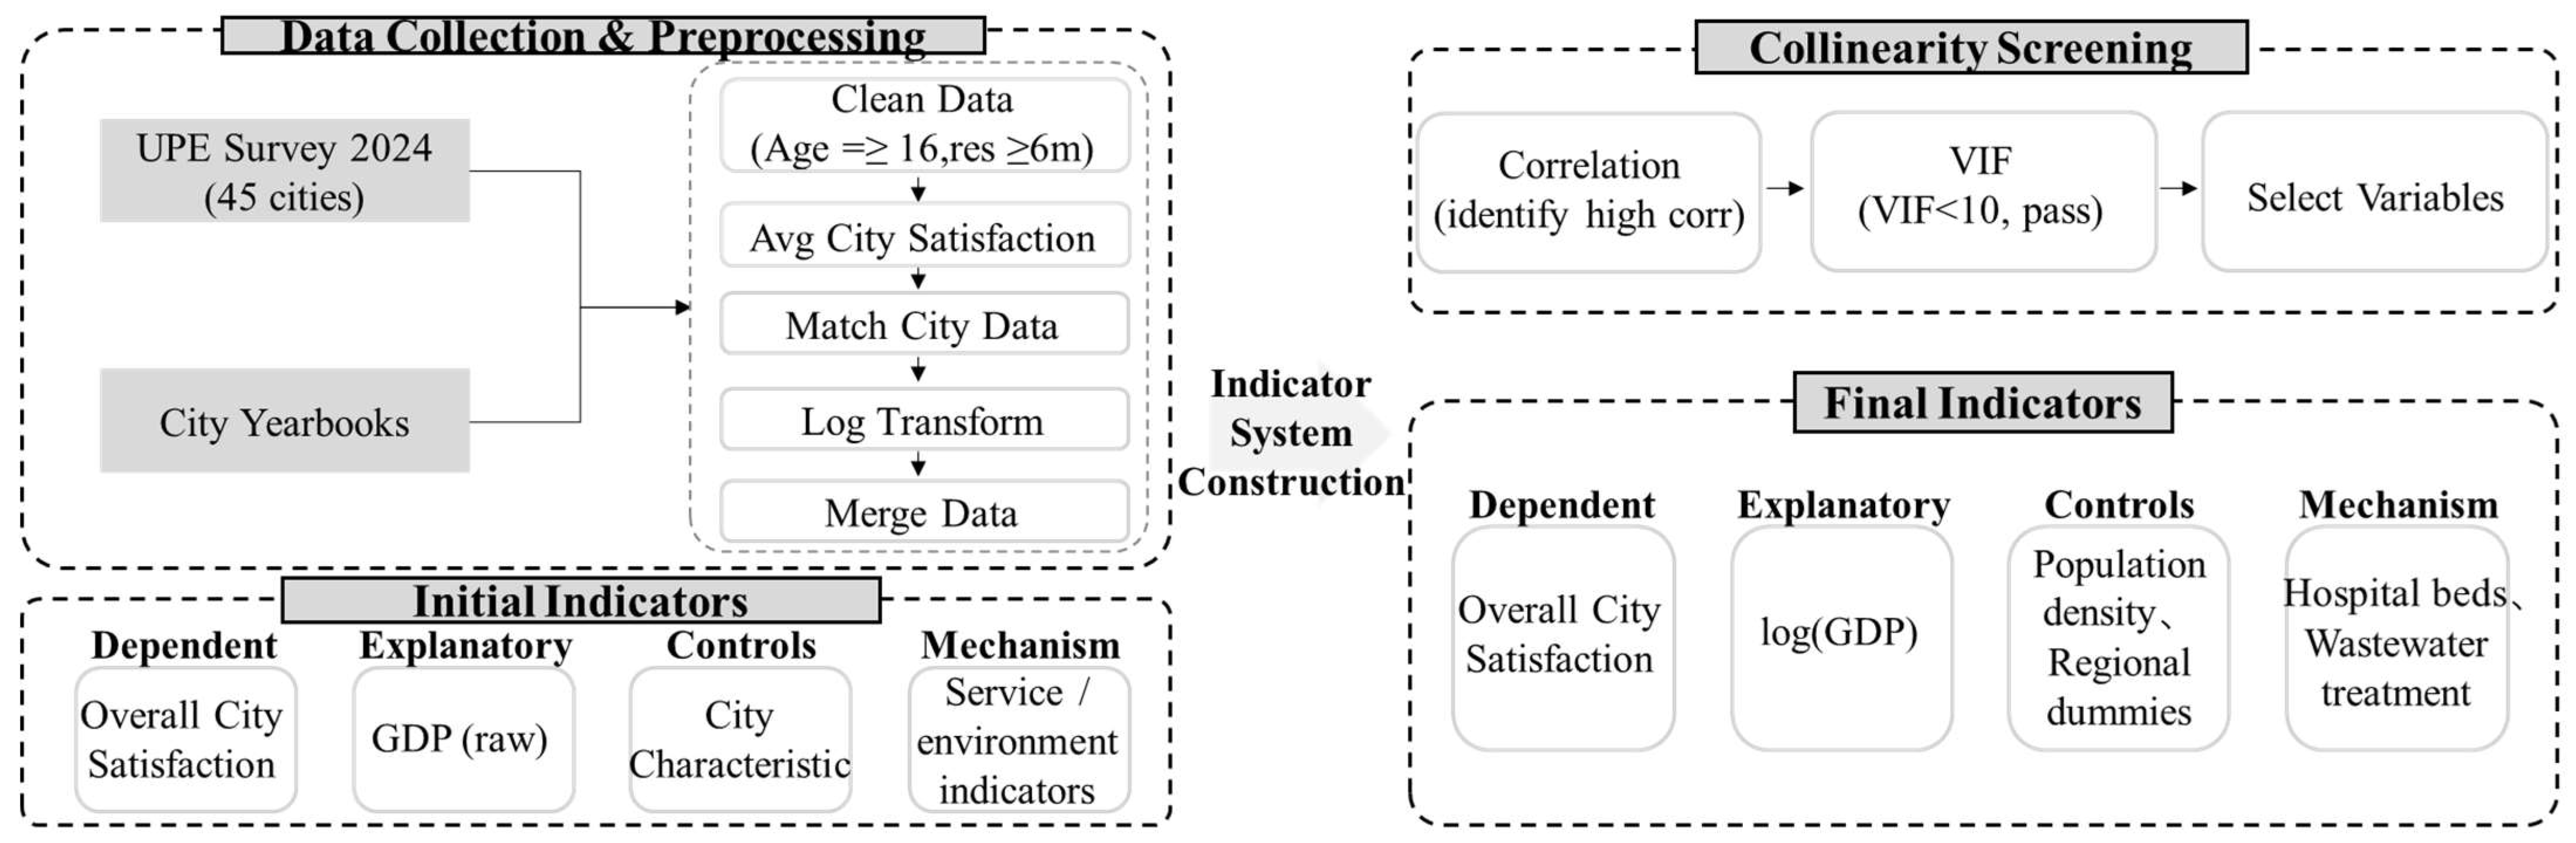
In addition, to ensure model stability, we diagnosed collinearity among candidate covariates (pairwise correlations and VIF) and retained the final set of covariates used in the adjusted models. The overall analytical procedure of indicator construction, data preprocessing, and statistical modeling is summarized in Figure 3.
Figure 3.
Indicator System technical roadmap.
- (2)
- Restricted cubic splines for non-linear GDP–satisfaction associations
To characterize potential non-linear associations between economic level and perceived urban well-being, we modeled log(GDP) using restricted cubic splines (RCS) (also referred to as natural cubic splines) [19,20]. RCS offers a flexible yet parsimonious functional form: it allows curvature within the data range while constraining the relationship to be linear in the tails, reducing implausible extrapolation [21]. Spline specifications are used to test whether the marginal effect of GDP on city-level satisfaction changes across different levels of economic development.
Let denote the city-level satisfaction score for city , denote , and denote a vector of city-level covariates. The RCS regression can be written as:
where is approximated by an RCS basis expansion:
with knots , and . A commonly used restricted basis is:
In practice, spline complexity can be parameterized either by the number of knots or by the degrees of freedom (df) of the spline basis. Consistent with best practices for small-to-moderate samples, we adopted an RCS specification with df = 4 for the main analysis and evaluated robustness using alternative df settings (df = 3 and df = 5) to ensure that substantive conclusions were not driven by overfitting or underfitting. The main objective of the spline specification is to test whether the marginal relationship between GDP and satisfaction departs from linearity within the observed range of economic development. Given the relatively small number of city-level observations, the spline specification is used primarily as an exploratory diagnostic tool rather than as a fully parameterized non-linear model. The df choice reflects a standard trade-off: sufficient flexibility to capture plausible curvature while maintaining interpretability and statistical power given the city-level sample size [21,22].
- (3)
- Model specification: unadjusted vs. adjusted
We estimated two nested specifications, each under both linear and RCS functional forms for :
- (a)
- Unadjusted modelwhere is either a linear term () or the RCS function .
- (b)
- Adjusted modelwhere includes city demographic and structural characteristics (e.g., population size, population density, industrial structure, fiscal capacity) and broad regional indicators to account for spatially clustered heterogeneity.
- (4)
- Inference on non-linearity: nested-model F test
To formally assess whether the GDP–satisfaction association departs from linearity, we conducted a nested-model F test comparing the RCS model (full) against the linear model (restricted) [23]. The null hypothesis is that all spline terms beyond the linear component jointly equal zero:
Let and denote residual sums of squares from the linear and RCS models, respectively; let be the number of additional spline parameters beyond linearity; and let be the number of parameters in the full model (including the intercept). The test statistic is:
which follows an distribution under . We applied this procedure to both the unadjusted and adjusted specifications, thereby testing non-linearity conditional on covariates.
- (5)
- Reporting and visualization
For interpretability, we report model-predicted satisfaction across the observed range of log(GDP) and visualize the fitted RCS curve with 95% confidence intervals (CI). In addition to the spline plots, we present scatterplots of GDP versus satisfaction with an overlaid trend line to convey the raw association prior to functional-form modeling.
3. Results
Given the geographical distribution of the sampled cities across China, we additionally tested for potential spatial dependence in the regression residuals. Specifically, we calculated the global Moran’s I statistic based on the spatial weight matrix constructed from inter-city geographic distances.
The results indicate that the residual Moran’s I statistic is not statistically significant, suggesting that spatial autocorrelation does not materially affect the regression estimates. Therefore, the OLS and spline model results reported in this study are unlikely to be biased by spatial dependence among the sampled cities. Therefore, we use non-spatially measured models in the analysis of the results.
3.1. Descriptive Relationship Between GDP and City-Level Satisfaction
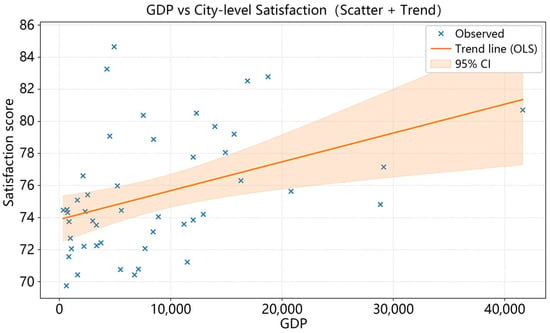
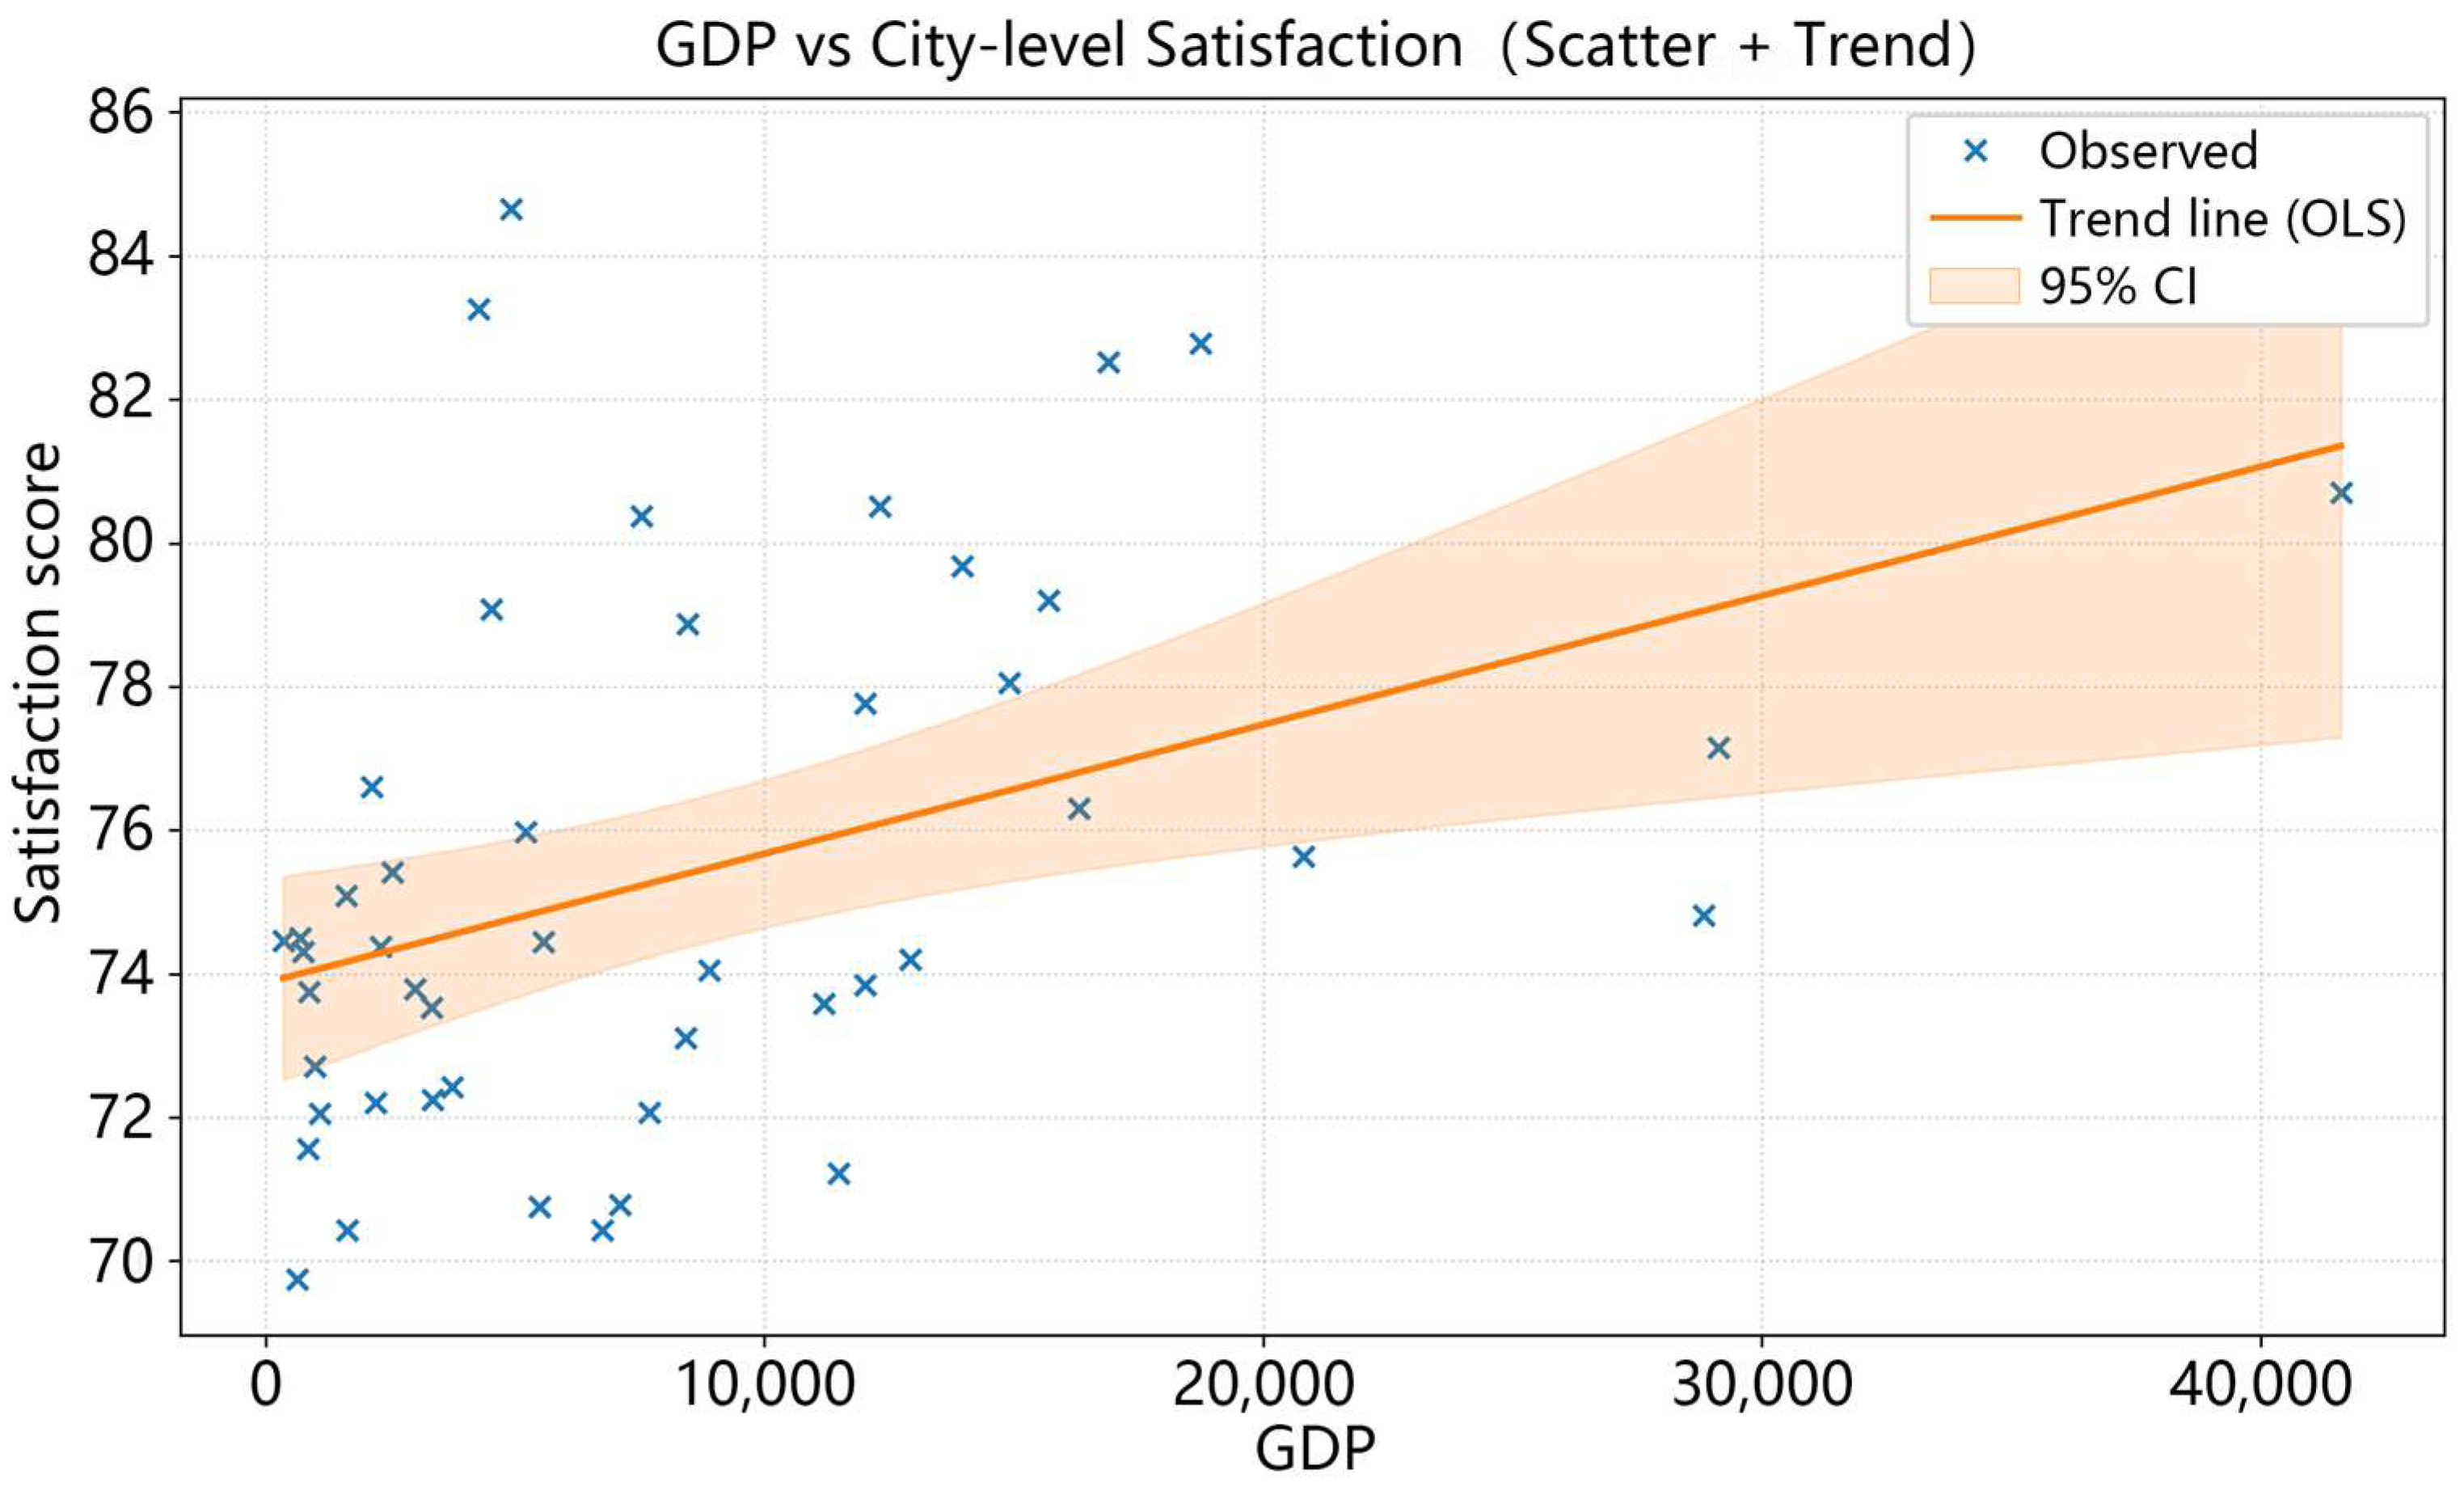
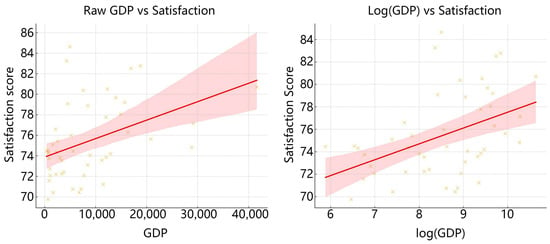
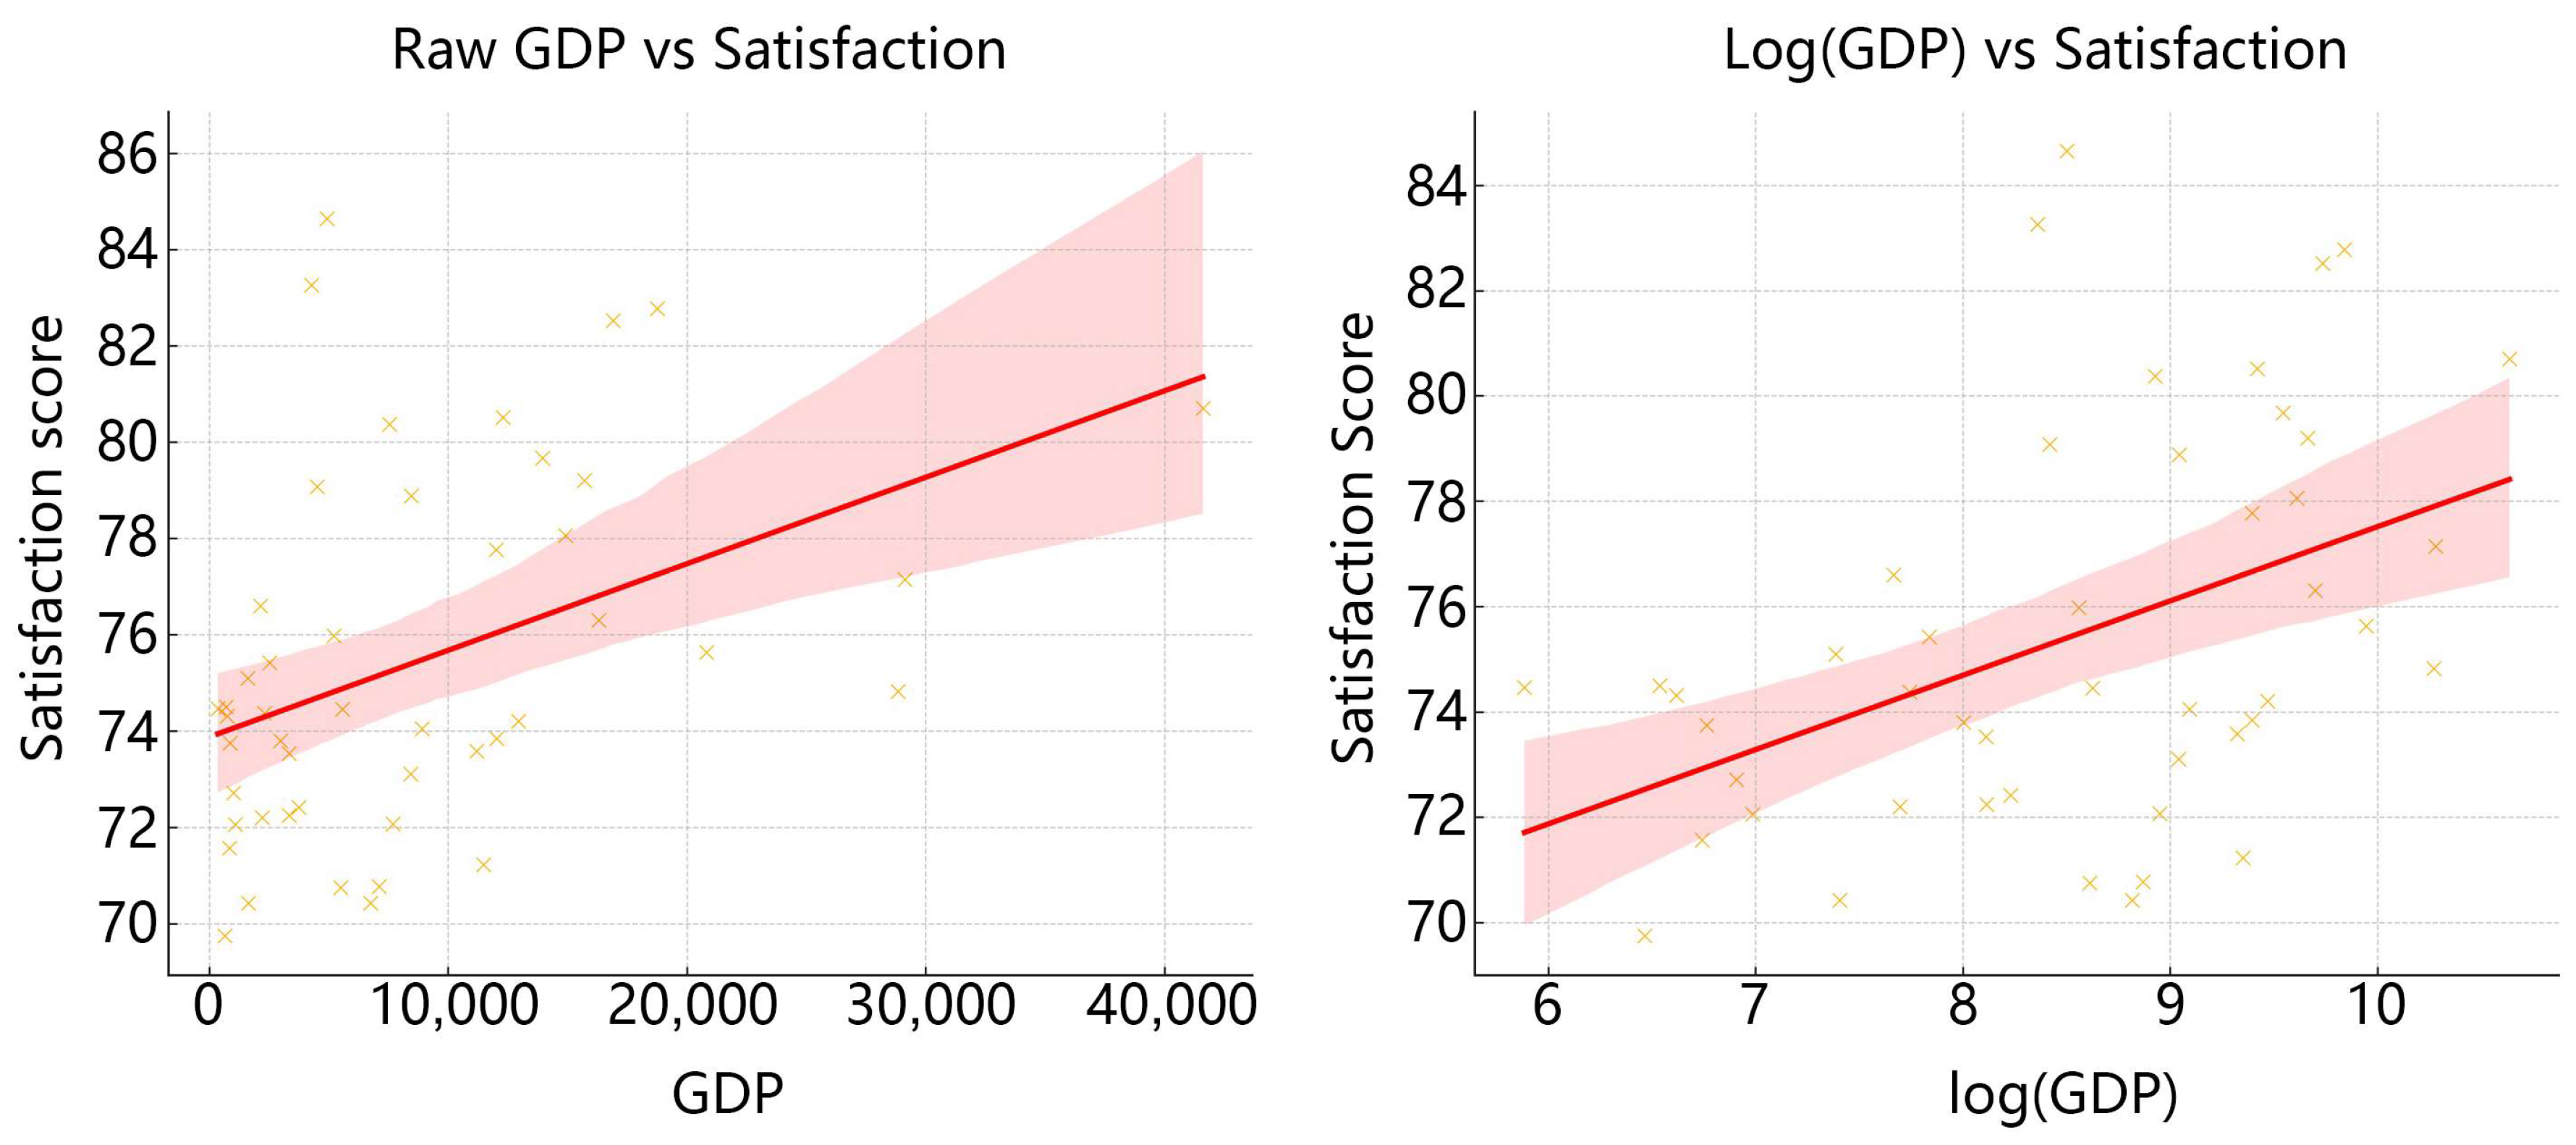
Figure 3 presents the bivariate relationship between GDP and city-level overall satisfaction (city-aggregated UPE score) across 47 sampled cities. The scatterplot indicates a moderate positive association: cities with higher GDP tend to report higher average satisfaction, although the dispersion is substantial, suggesting that economic level alone does not fully explain perceived urban well-being.
The OLS fitted trend line corroborates this pattern. Using GDP as a continuous predictor, the association is statistically positive (Pearson r = 0.41; R2 = 0.17; slope p = 0.004). At the same time, the 95% CI widens toward the upper tail of GDP, consistent with fewer high-GDP observations and greater uncertainty in that range. Notably, several mid- and low-GDP cities achieve satisfaction levels comparable to (or exceeding) some higher-GDP cities, implying meaningful heterogeneity associated with non-economic city attributes (e.g., urban management, service provision, and environmental conditions).
3.2. Covariate Screening and Multicollinearity Diagnostics
To ensure that the subsequent multivariable (linear and RCS) estimates are not distorted by redundant predictors, we conducted a structured collinearity diagnosis prior to model estimation. Specifically, we examined (i) the pairwise Pearson correlation structure of candidate variables and (ii) variance inflation factors (VIFs) for the covariate set intended for inclusion in adjusted models. This step is necessary in a city-level design, where macro indicators (e.g., economic scale, population scale, fiscal capacity, and service provision) can be strongly interrelated, potentially inflating standard errors and obscuring substantive interpretation.
The correlation matrix for the broader pool of city-level indicators, including UPE domain-level indices and auxiliary socioeconomic/service indicators is shown in Figure 4. Two patterns are particularly notable. First, overall satisfaction is highly correlated with several UPE domain indices those sub-level dimensions we set in the questionnaire (e.g., ecological livability, safety resilience, jobs–housing balance), with correlations typically above 0.89 (and up to ≈0.96 in the strongest pairs). This coherence indicates that the domain indices capture closely related latent perceptions; accordingly, we do not treat these domain indices as exogenous controls in the GDP–satisfaction model to avoid mechanical overlap/over-adjustment (i.e., controlling for components of the outcome). Second, a “scale-and-capacity” cluster emerges among macro indicators—GDP, fiscal expenditure, population, and healthcare capacity measures (e.g., hospitals and beds)—with several pairs exhibiting correlations above 0.80 (e.g., GDP vs. fiscal expenditure ≈ 0.93; beds vs. hospitals ≈ 0.94). This pattern suggests that raw-size indicators contain substantial shared variance and should not be simultaneously included in their original forms.
Figure 4.
Relationship between urban resident satisfaction and GDP chart and trend.
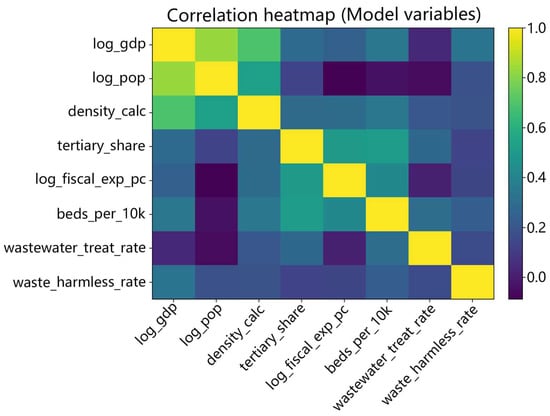
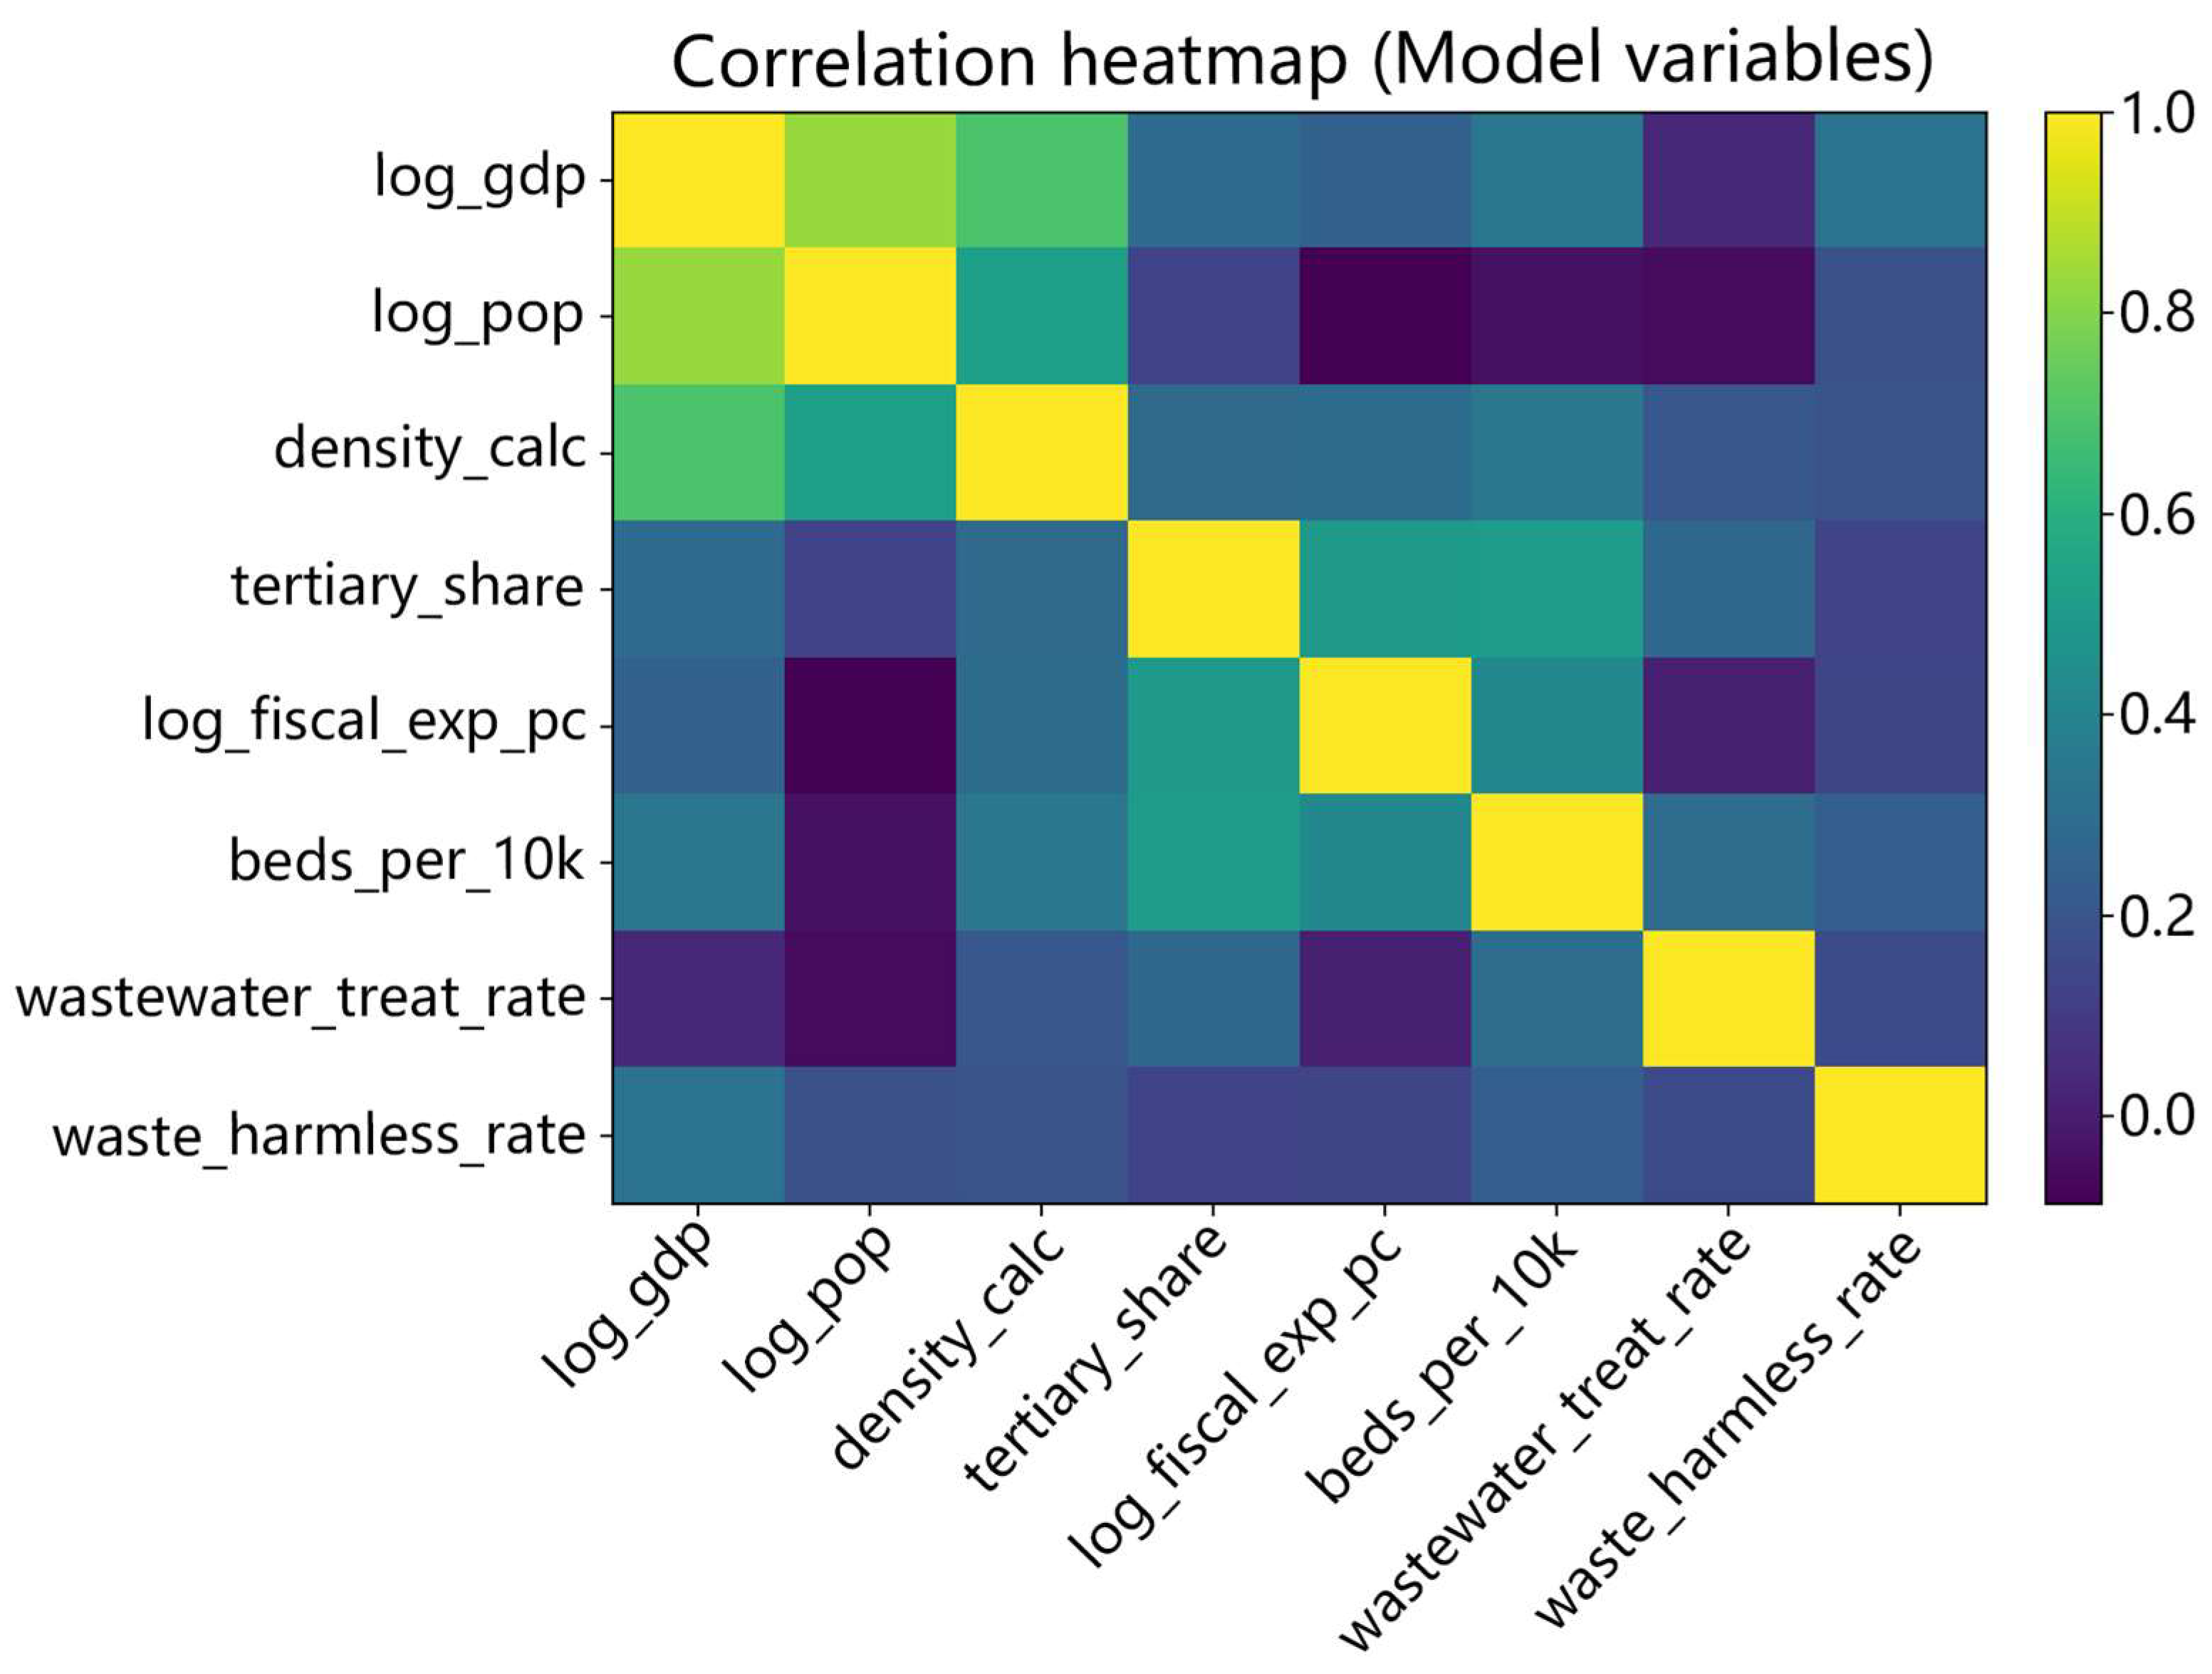
Figure 5 narrows the focus to the covariate candidates intended for econometric modeling after harmonization and transformation: log(GDP), log(population), population density, tertiary-industry share, log(fiscal expenditure per capita), and three service/environment indicators (beds per 10,000 persons, wastewater treatment rate, harmless domestic waste treatment rate). Within this set, the strongest association is observed between log(GDP) and log(population) (r ≈ 0.83), followed by log(GDP) and population density (r ≈ 0.69). The remaining correlations are moderate (generally ≤ 0.52), indicating that most covariates provide non-redundant information once variables are expressed in per capita terms or log-transformed where appropriate. Therefore, we used the 8 indicators shown in Figure 6.
Figure 5.
Correlation matrix for the broader pool of city-level indicators.
Figure 6.
The final indicators used in the econometric model.
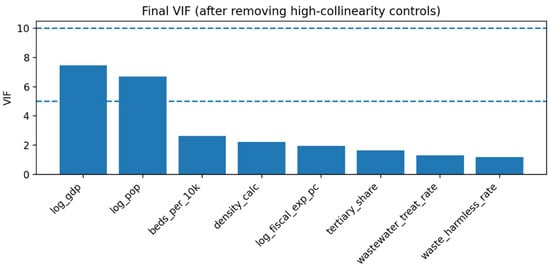
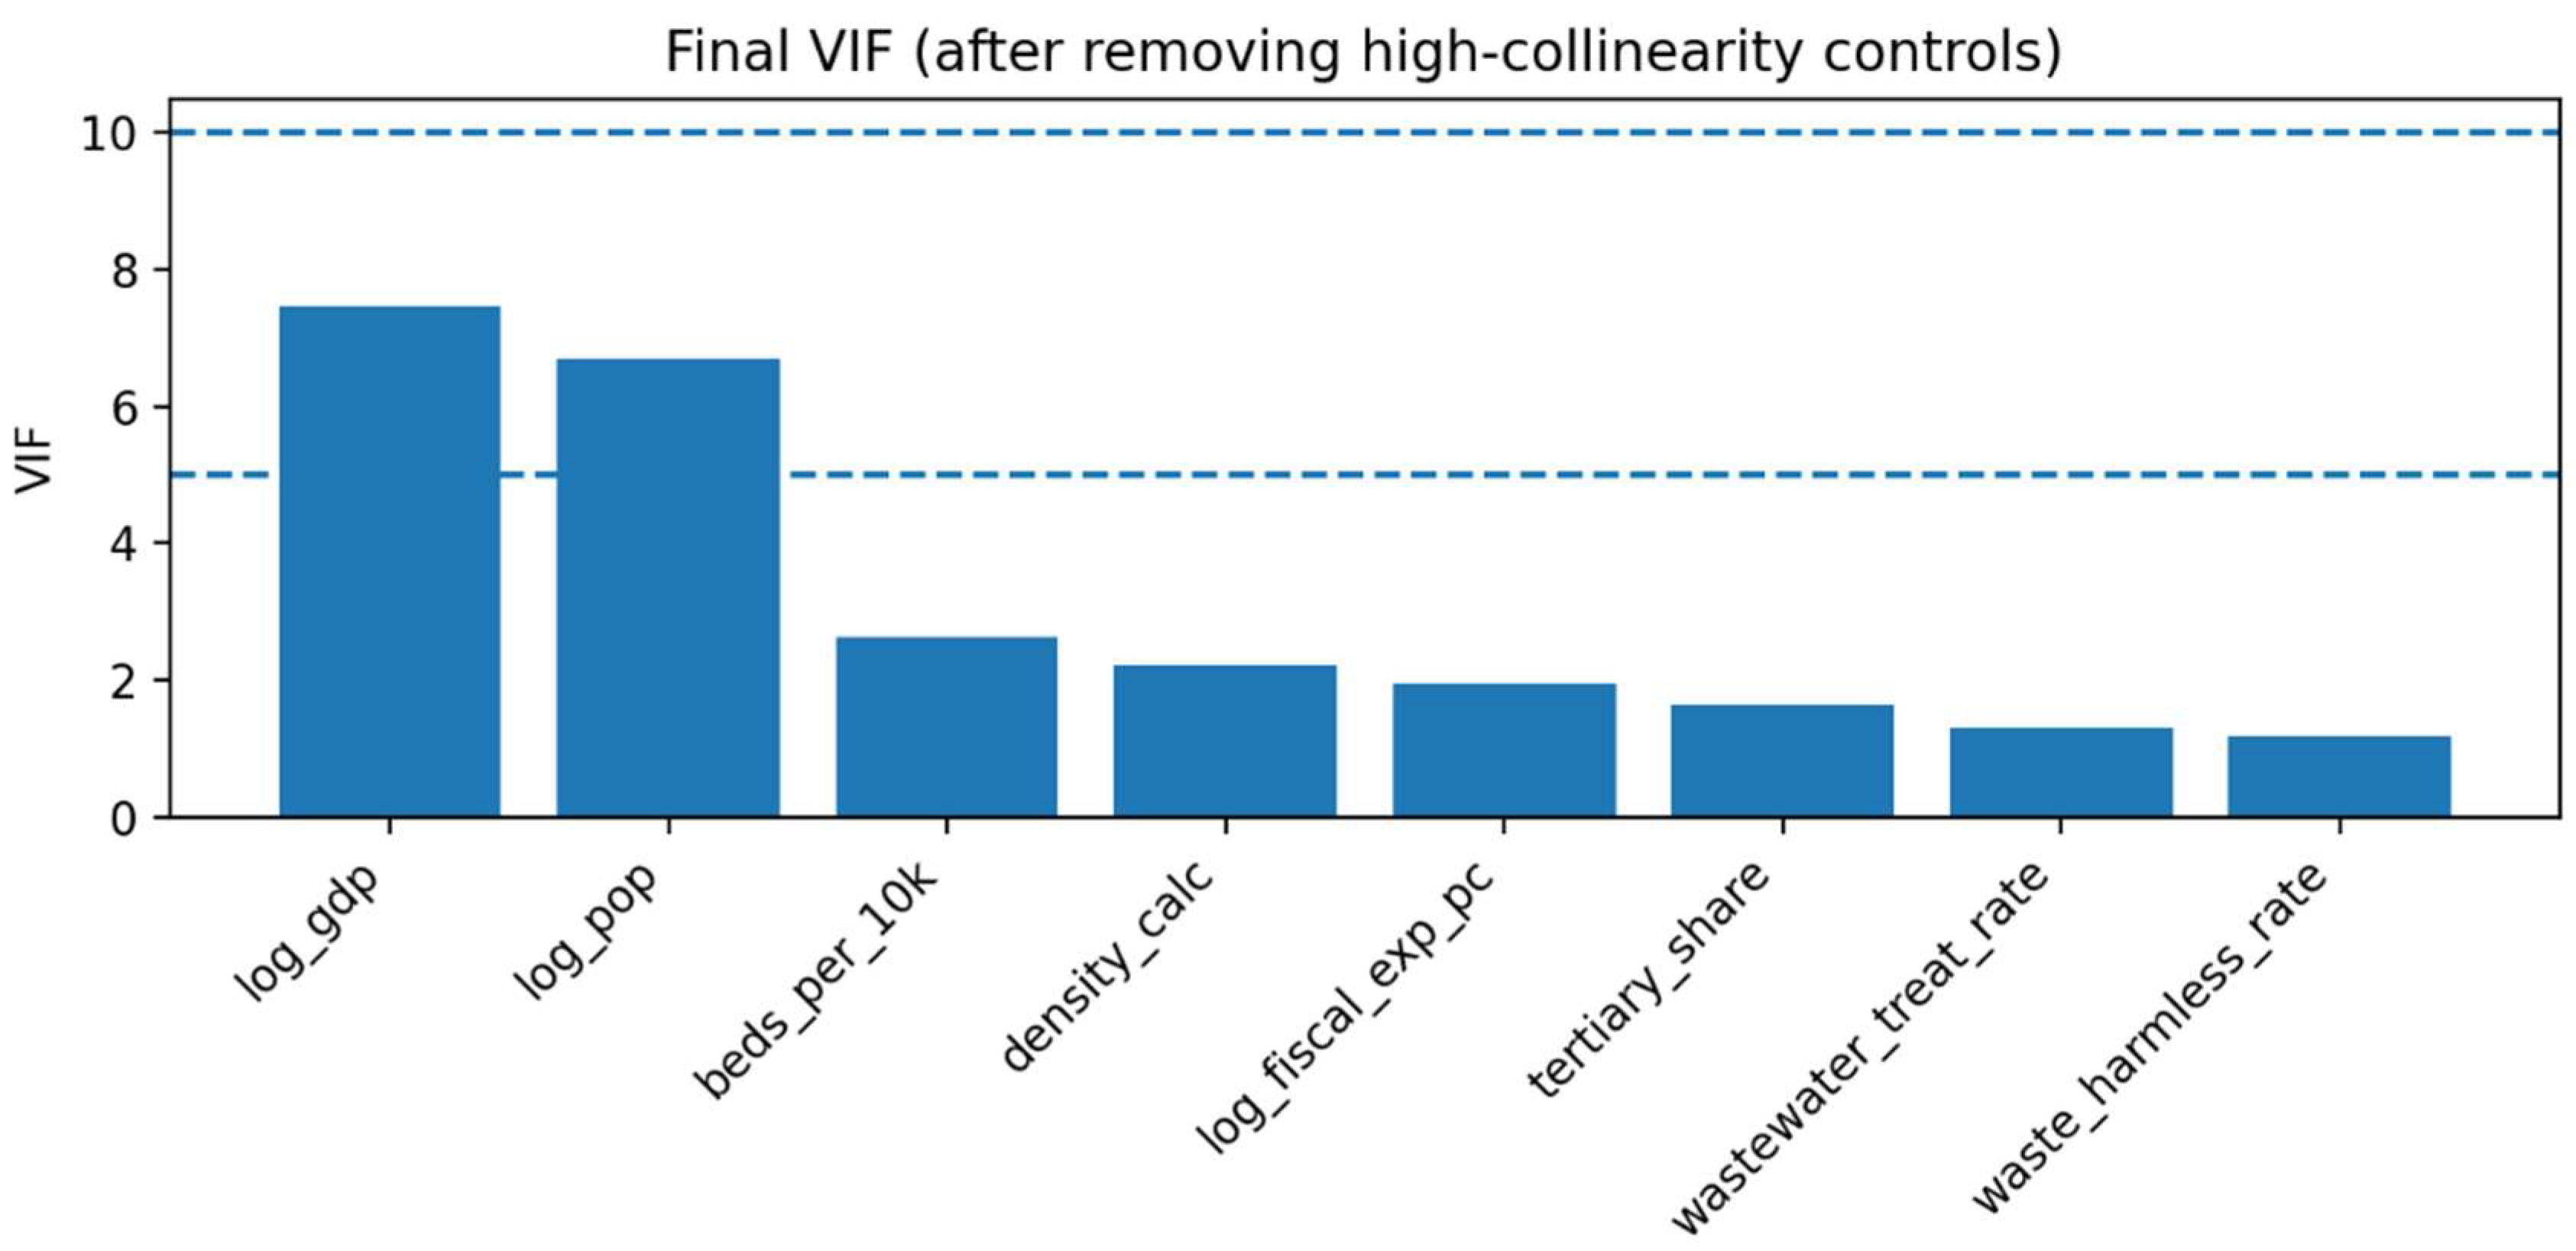
To further ensure that there is no collinearity between the variables used in the end, we further use VIF diagnostics. Table 2 reports VIF and tolerance values for the model-candidate covariate set. The largest VIFs correspond to log(GDP) (VIF = 7.48) and log(population) (VIF = 6.70), consistent with the high pairwise correlation noted above. Importantly, these values remain below the conventional threshold for severe multicollinearity (VIF > 10), while other predictors exhibit low-to-moderate VIFs (1.19–2.64), suggesting limited collinearity concerns for the remaining covariates. Together, the correlation heatmaps and VIF results indicate that multicollinearity is manageable and primarily concentrated in the expected overlap between economic scale and population scale.
Table 2.
Collinearity diagnostics.
Final covariate choice for adjusted models. Balancing statistical stability with parsimony in a city-level sample, the baseline adjusted specification retains a core set of controls that capture demographic pressure and structural capacity: log(population), population density, tertiary-industry share, and log(fiscal expenditure per capita), along with broad regional indicators (to absorb spatially clustered heterogeneity). The three service/environment indicators are retained as analytically meaningful descriptors and can be used in extended specifications/sensitivity checks; however, the main adjusted results emphasize the parsimonious control set to preserve degrees of freedom and minimize redundancy.
This covariate-screening procedure provides a transparent foundation for the subsequent estimation of the GDP–satisfaction relationship, including formal tests of non-linearity under the RCS framework.
3.3. Functional Form Assessment of the GDP–Satisfaction Relationship
3.3.1. Model Specification
Building on the descriptive pattern reported in and the covariate screening above, we next focus on the functional form of the economic–perceived urban well-being association. Figure 7 plots raw GDP against city-level overall satisfaction. Two features are salient. First, GDP is highly right-skewed, with most observations concentrated at the lower end and a small number of very high-GDP cities forming a long upper tail. This uneven distribution implies that a linear fit in the raw scale may be disproportionately influenced by a few high-GDP observations. Second, the dispersion of satisfaction is sizable across the GDP range, indicating that economic scale alone is insufficient to account for perceived urban well-being.
Figure 7.
Scatter plots of raw GDP vs. logGDP and overall city satisfaction.
To improve scale comparability and mitigate skewness, Figure 7 re-expresses the predictor as log(GDP). After transformation, observations are more evenly distributed along the x-axis, and the GDP–satisfaction gradient becomes easier to interpret. Importantly, visual inspection suggests possible departures from strict linearity, particularly at the lower end of log(GDP) where the fitted relation appears slightly curved rather than strictly monotonic. This motivates the use of a flexible functional form that can capture smooth curvature while avoiding arbitrary stratification. This phenomenon is usually considered to be a nonlinear relationship between variables.
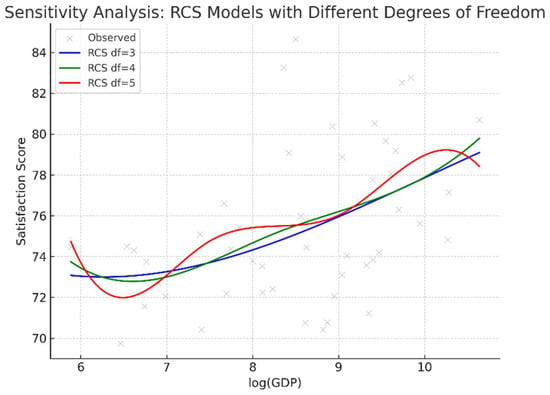
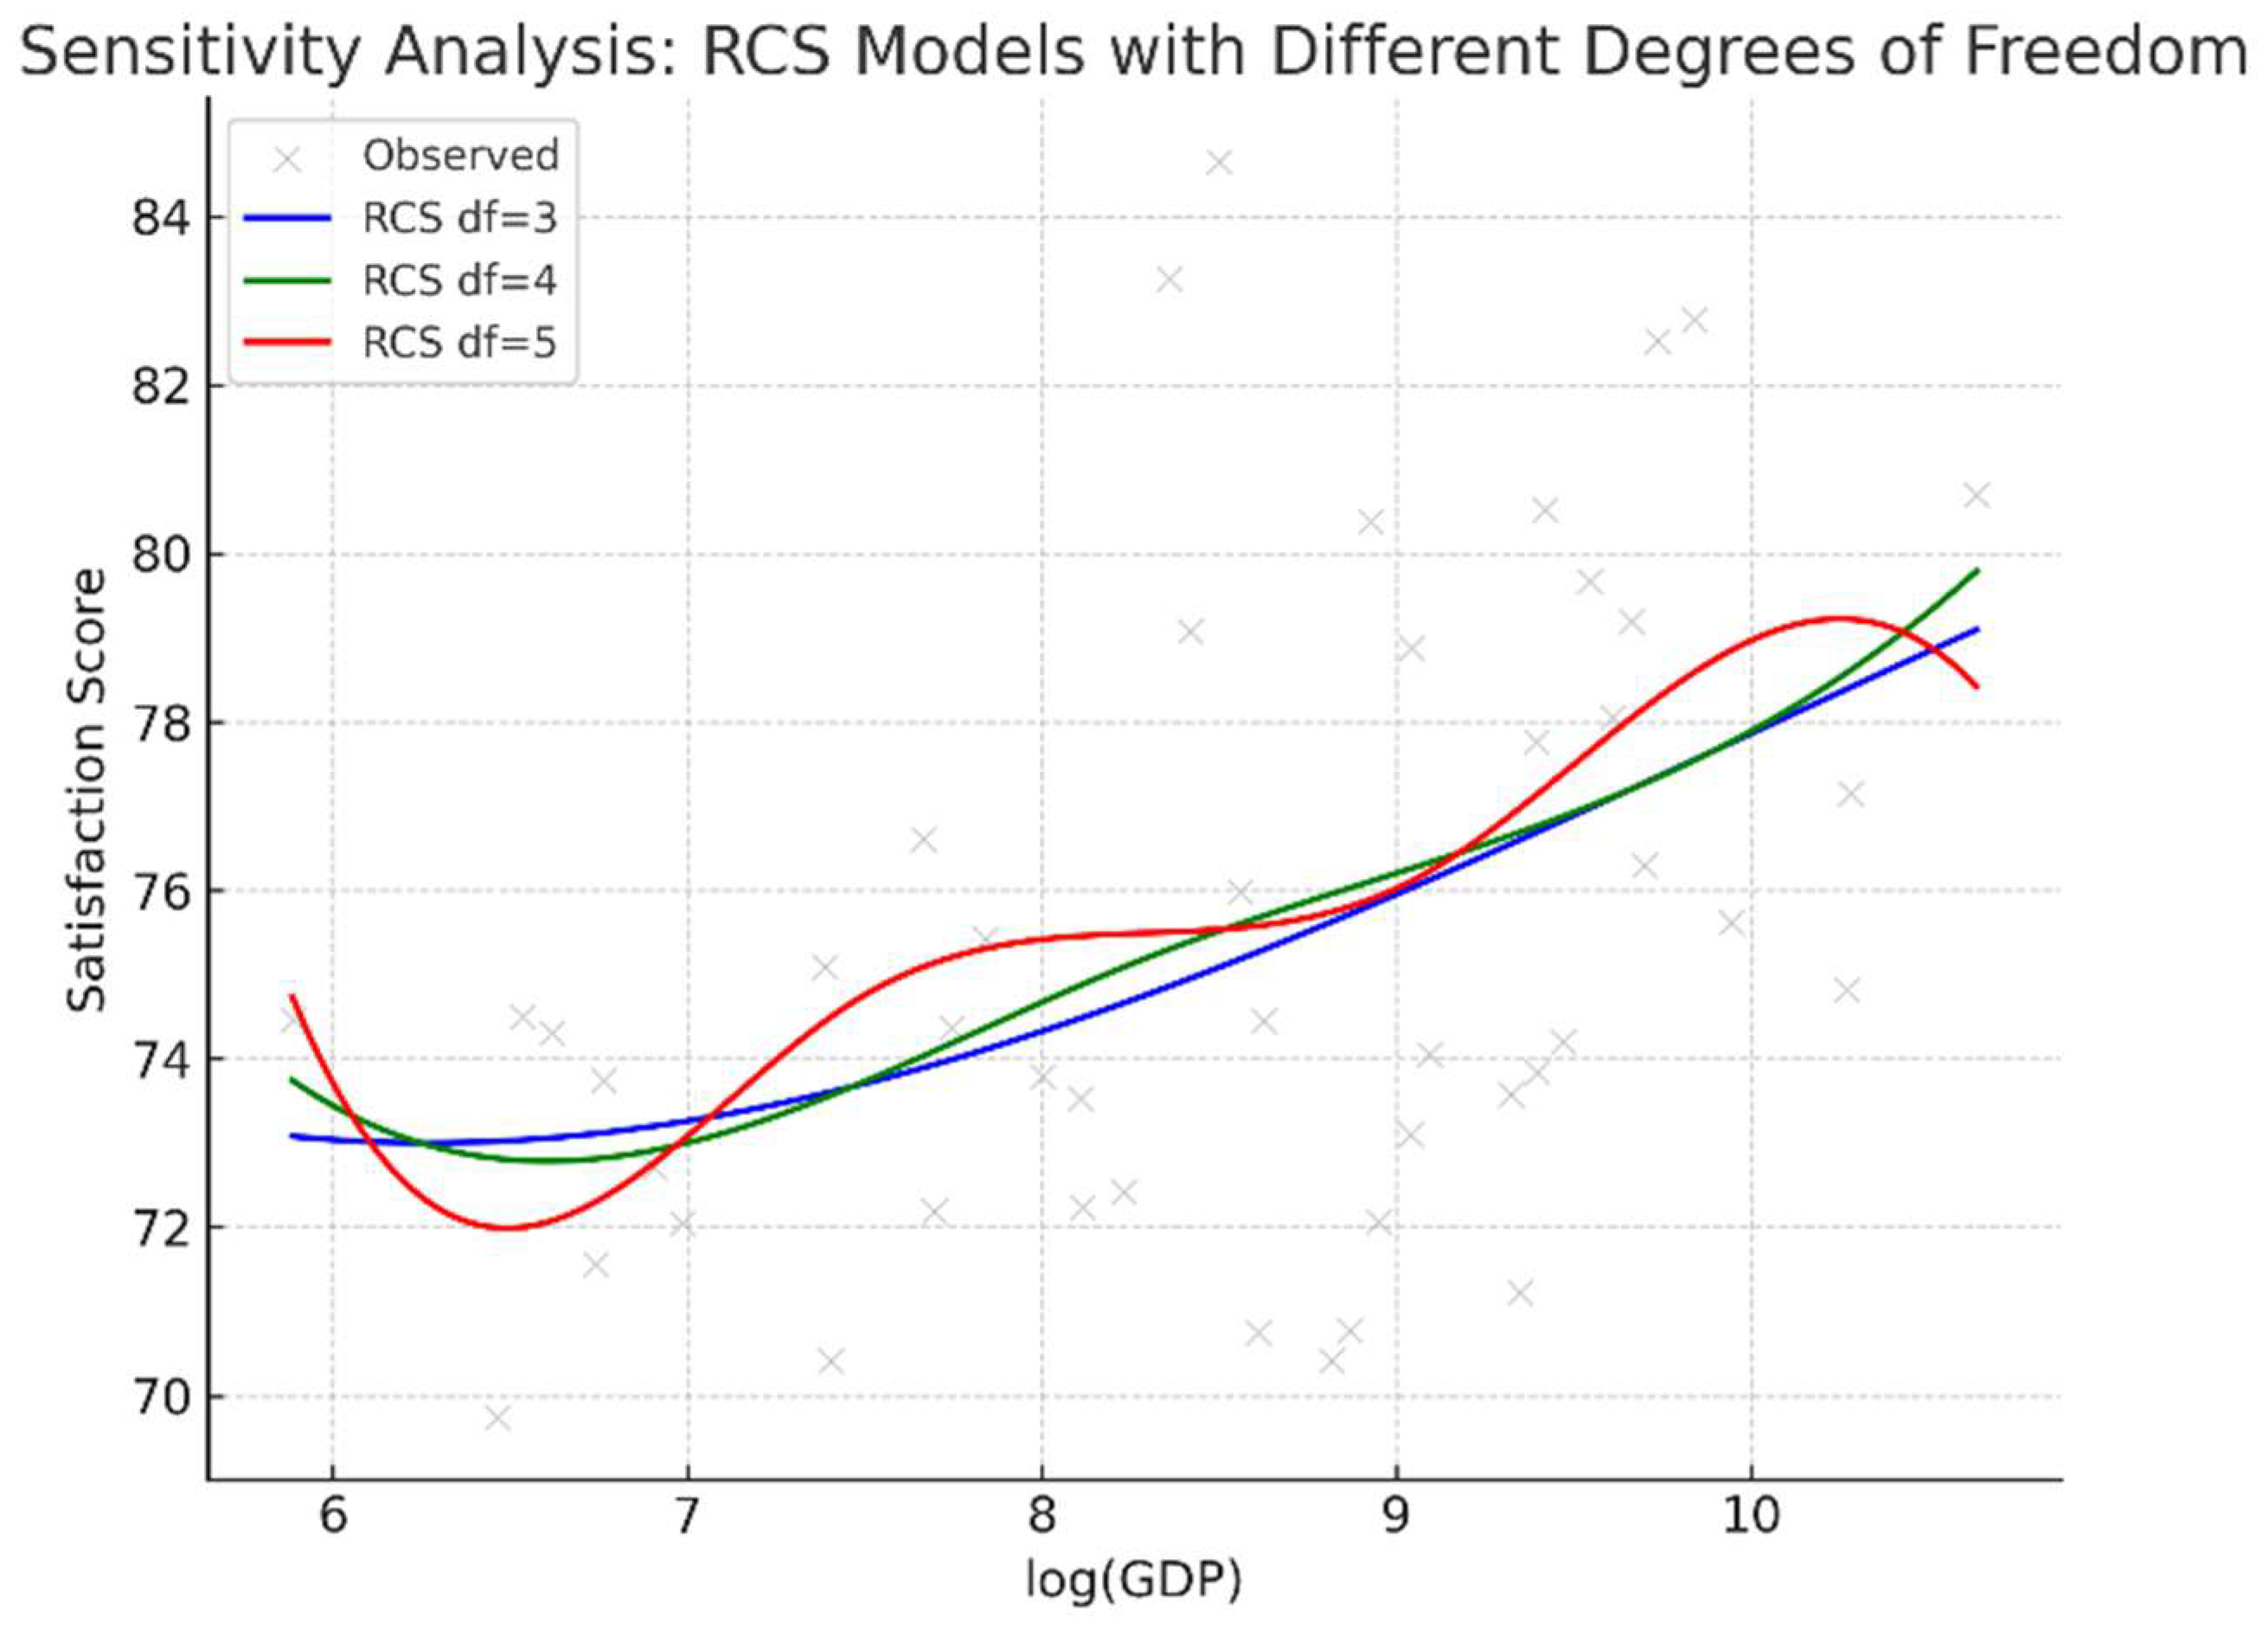
Accordingly, we adopted restricted cubic splines (RCS) for log(GDP). A key modeling decision is the spline complexity, commonly parameterized by the degrees of freedom (df). Figure 7 compares RCS fits under df = 3, 4, and 5. The three specifications yield a consistent overall pattern—an increasing association between log(GDP) and satisfaction—while differing in smoothness. The df = 3 model produces the smoothest curve and largely approximates a near-linear trend; df = 5 introduces more local curvature (i.e., greater sensitivity to small-sample fluctuations, especially near the tails); and df = 4 provides a middle-ground specification that allows moderate curvature without overfitting. Based on this sensitivity check and the city-level sample size, df = 4 was selected as the main specification, with df = 3 and df = 5 retained as robustness alternatives. Following common empirical practice in spline modeling, we use 4 degrees of freedom as a baseline specification to allow moderate flexibility while avoiding excessive model complexity.
3.3.2. RCS Estimation Results
Using the selected spline specification (RCS with df = 4), we estimated the GDP–satisfaction association under two nested model settings: an unadjusted model including only , and an adjusted model controlling for city characteristics (population scale and density, industrial structure, fiscal capacity, and region indicators).
- (1)
- Unadjusted RCS
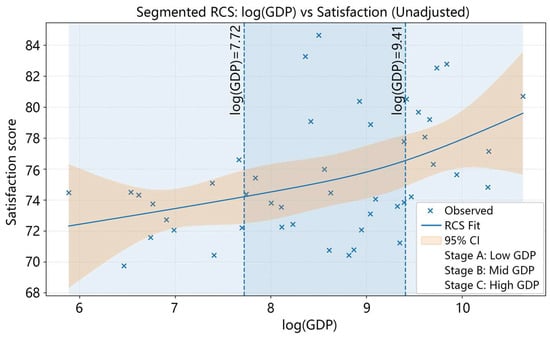
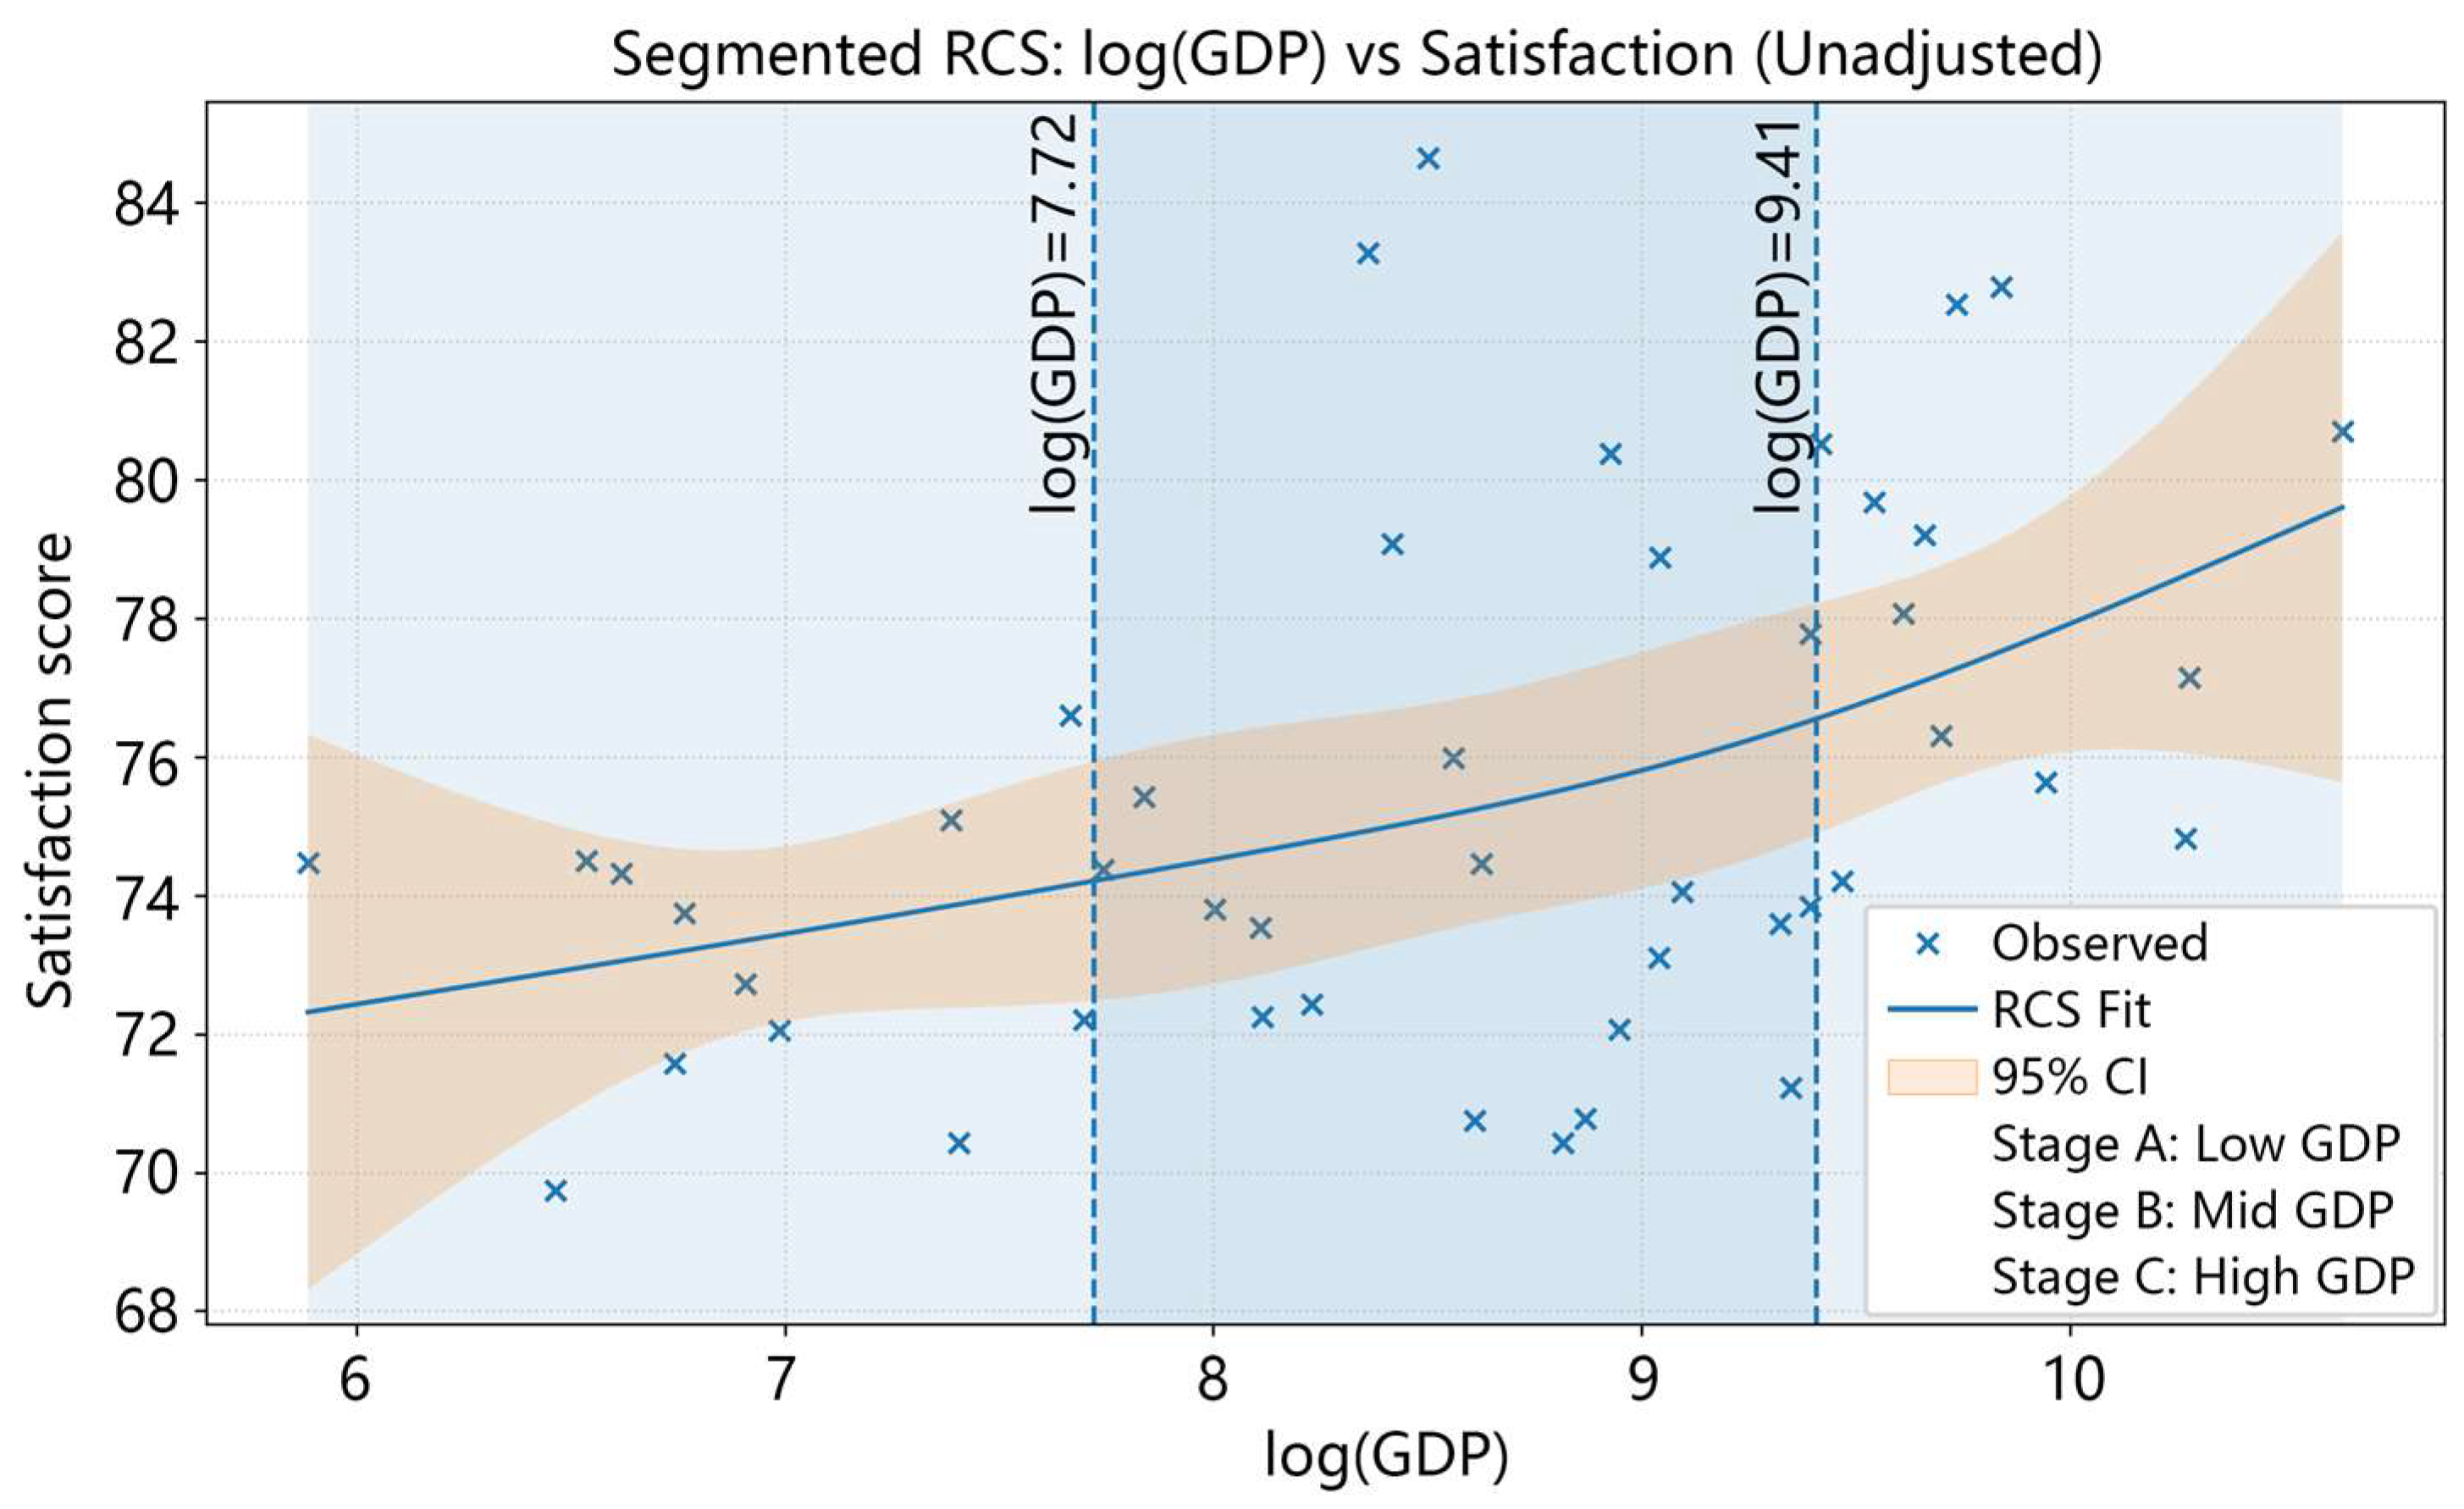
The unadjusted RCS curve indicates a positive, largely monotonic association between and city-level satisfaction (Figure 8). The fitted line rises gradually across the observed range, with slightly stronger gains toward the upper tail, while the 95% CI expands at both ends, reflecting greater uncertainty where observations are sparse. In terms of magnitude, predicted satisfaction increases from 73.19 (95% CI: 71.71–74.67) at the 10th percentile of to 77.37 (95% CI: 75.78–78.96) at the 90th percentile—an absolute difference of approximately 4.18 points (holding other terms absent in this model). Consistent with the segmented visualization, the GDP distribution can be partitioned into three ranges using the two vertical cut-points (Stage A/B/C) at and (corresponding to GDP and in the original scale), within which the curve remains smooth and upward-sloping rather than exhibiting abrupt jumps. In this research, these cut points are used only as descriptive reference values to illustrate the distributional stages of economic development in the sample. The vertical reference lines illustrate approximate stages of economic development for descriptive interpretation.
Figure 8.
RCS Models with Different Degrees of Freedom.
- (2)
- Adjusted RCS
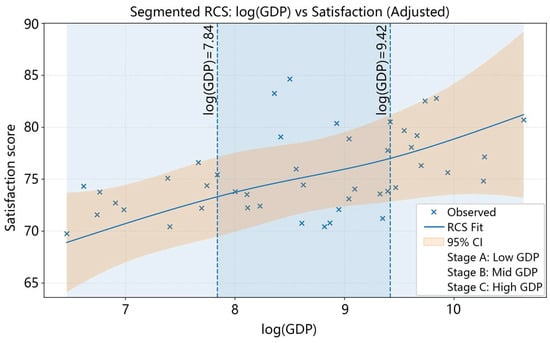
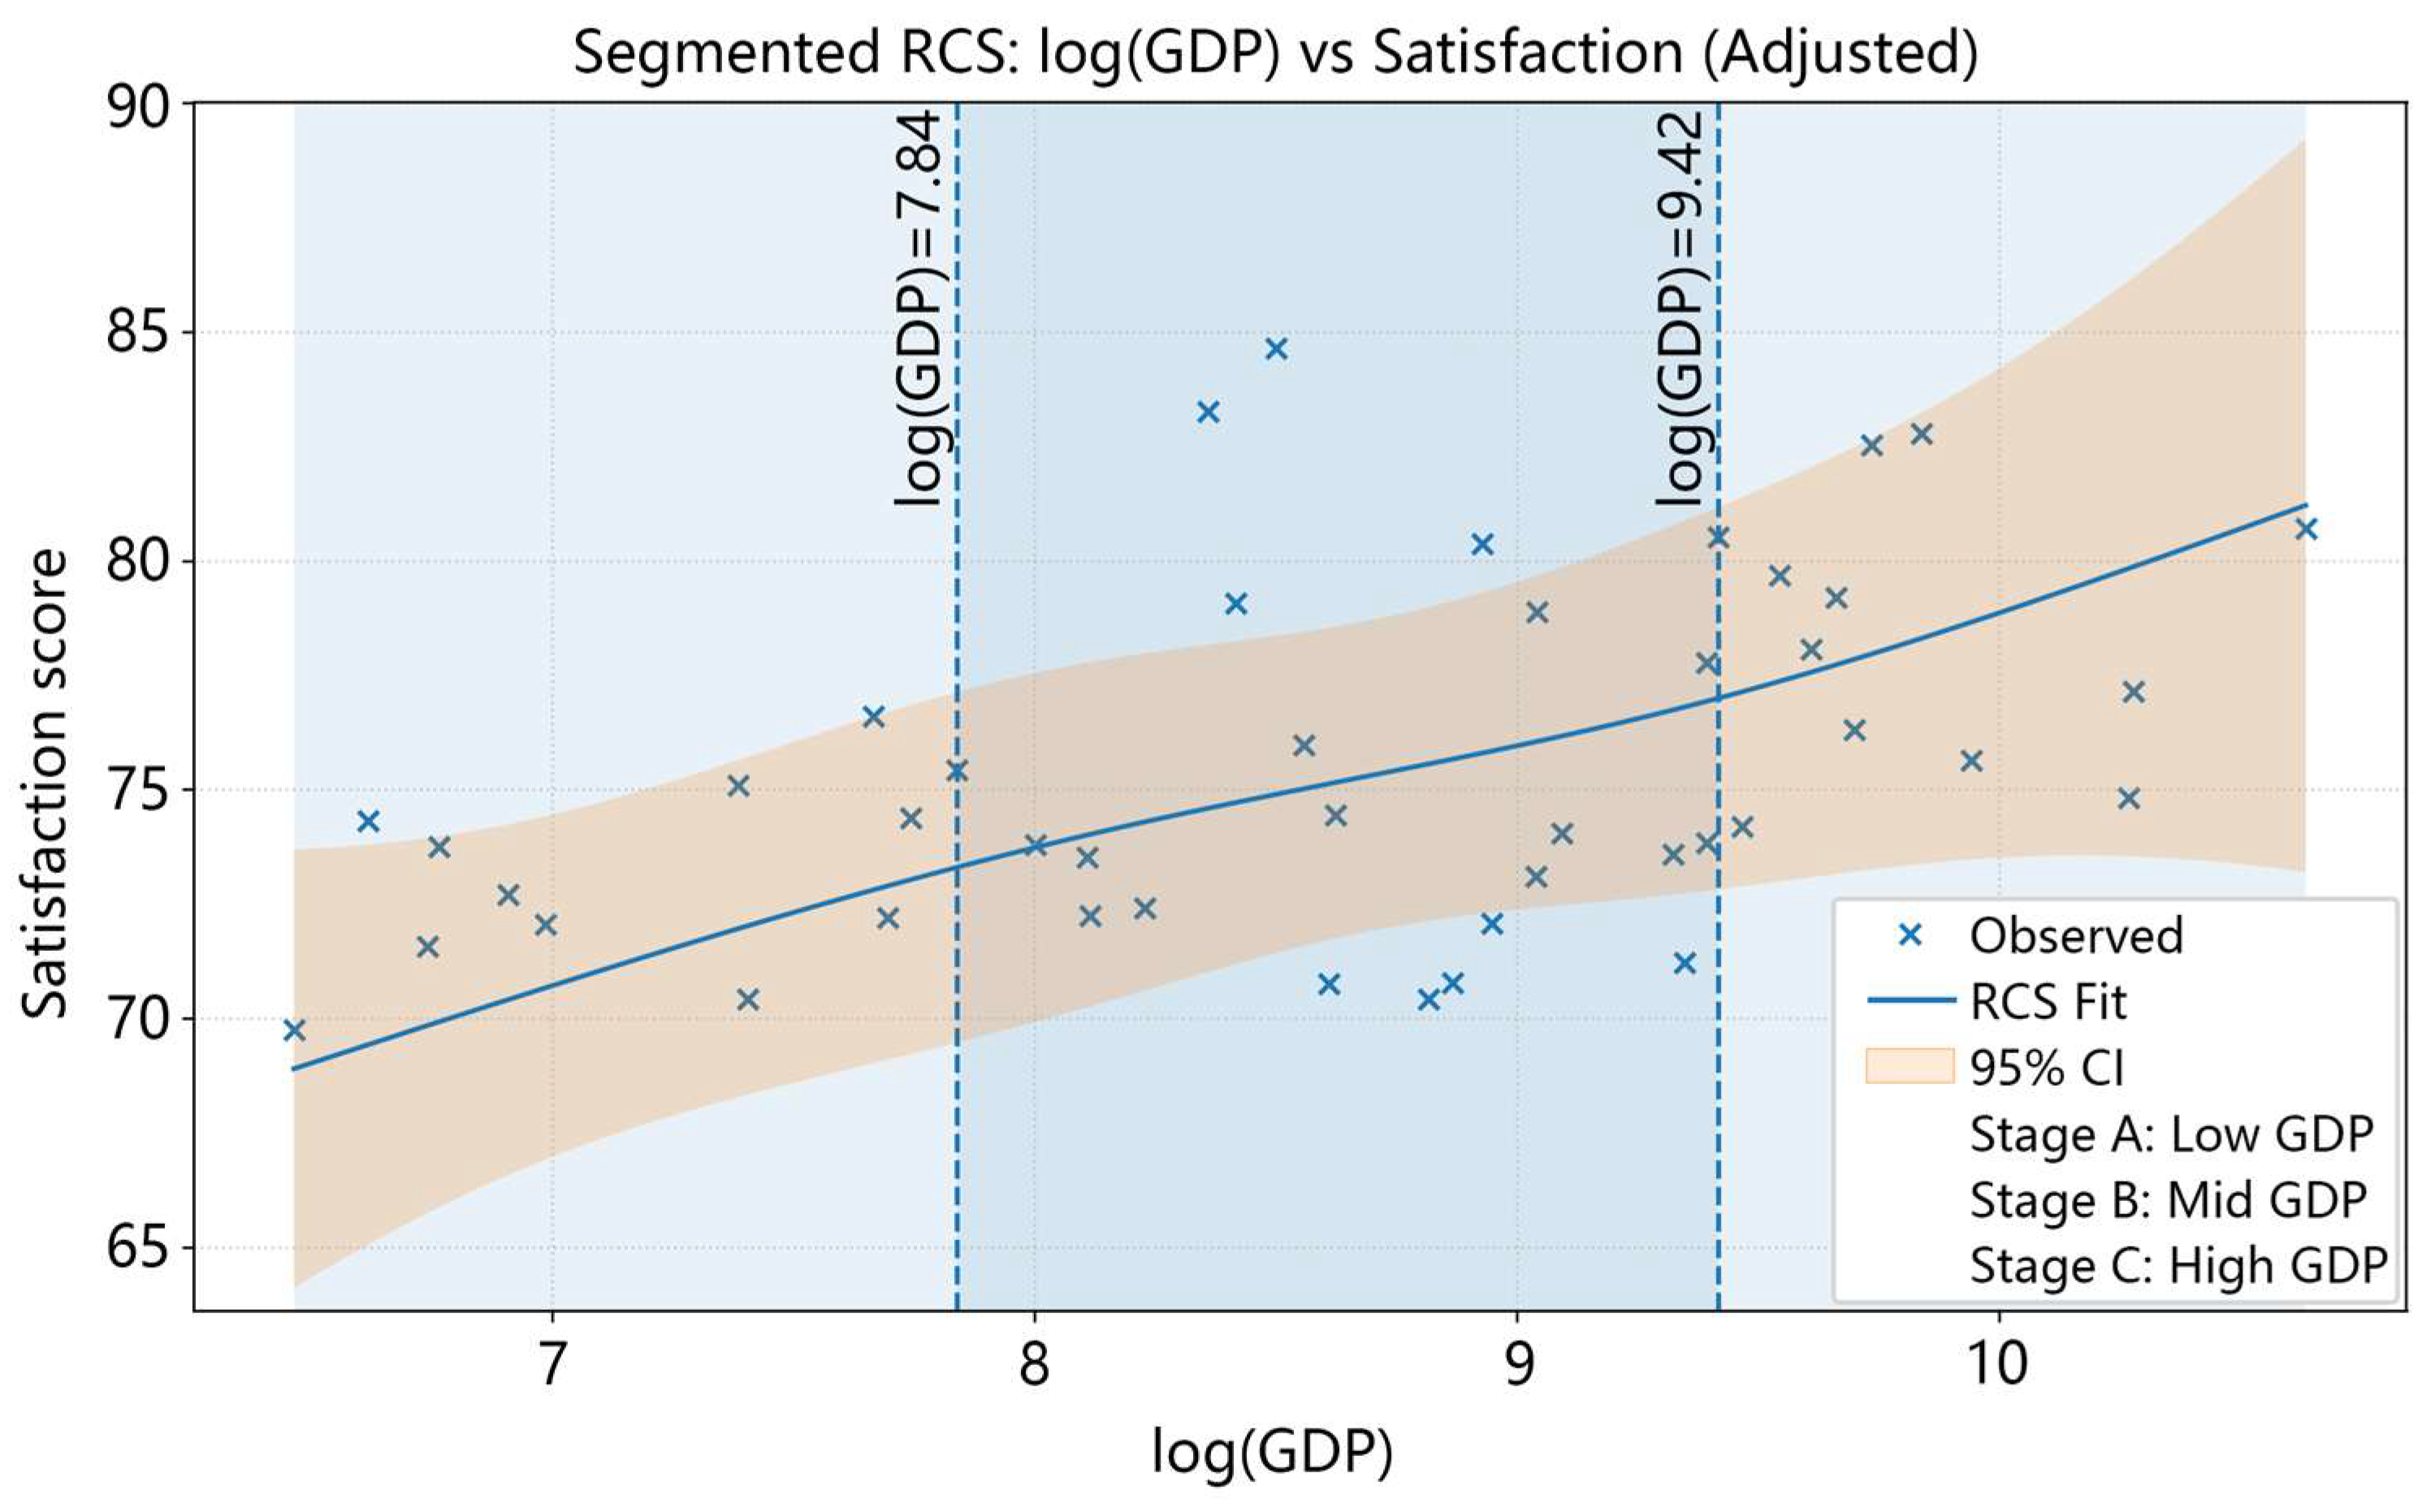
After adjustment for the screened covariates, the overall shape remains qualitatively unchanged: satisfaction still increases with , and the curve remains smooth without pronounced inflection (Figure 9). However, the adjusted model explains a substantially larger share of cross-city variation (R2 = 0.41; Adj. R2 = 0.23) than the unadjusted model (R2 = 0.20; Adj. R2 = 0.14), indicating that non-economic city attributes jointly account for meaningful heterogeneity in perceived urban well-being. Predicted satisfaction rises from 70.51 (95% CI: 66.71–74.31) at the 10th percentile of to 78.16 (95% CI: 73.33–83.00) at the 90th percentile, corresponding to an approximate increase of 7.65 points (evaluated at the covariate baseline used for prediction). The segmented cut-points are highly consistent with the unadjusted model ( and ; GDP and ), again suggesting gradual rather than discontinuous changes across the economic spectrum.
Figure 9.
RCS estimates of the GDP–satisfaction relationship (unadjusted). Note: The lines are illustrative reference values rather than statistically estimated breakpoints.
- (3)
- Formal non-linearity tests
Two cities were excluded from the adjusted regression models because of missing values in selected city-level covariates (Alar and Shihezi are both lower county-level cities in Xinjiang, and the statistics lack tertiary share and fiscal expenditure). The adjusted models are intolerant of missing values for samples and show no evidence of systematic bias. Therefore the adjusted models include 45 cities (Figure 10; Table 3). Despite the visual flexibility of the spline, the nested-model F tests comparing the linear specification against the RCS specification provide no statistical evidence of non-linearity in either setting (Table 3): unadjusted ; adjusted . However, given the relatively small sample size (47 cities), the analysis may have limited statistical power to detect subtle non-linear patterns such as weak thresholds or plateaus. The results do not provide statistical evidence of a plateau within the observed range of GDP levels. Taken together, these results indicate that the GDP–satisfaction association is robustly positive, while any curvature implied by the fitted spline is weak and not statistically distinguishable from a linear trend given the current city-level sample.
Figure 10.
RCS estimates of the GDP–satisfaction relationship (adjusted). Note: The lines are illustrative reference values rather than statistically estimated breakpoints.
Table 3.
Comparison of RCS univariate model and full model parameters.
3.3.3. Robustness and Specification Sensitivity
To assess whether the substantive conclusions depend on modeling choices rather than the underlying data pattern, we conducted a set of specification and sensitivity checks focusing on (i) the scale of the economic indicator, (ii) spline flexibility, and (iii) potential instability at the distribution tails (Table 4).
Table 4.
Robustness and specification sensitivity checks.
- (1)
- Scale transformation (GDP vs. log(GDP))
Because city GDP is markedly right-skewed, modeling GDP on the raw scale may overweight a small number of high-GDP cities and obscure the central tendency in the majority of observations. The log transformation improves leverage balance and yields a more interpretable gradient across the economic spectrum. Consistent with the visual comparison in Section 3.3.1, the positive GDP–satisfaction association is preserved after transformation, while the log scale provides a more stable basis for functional-form assessment.
- (2)
- Spline complexity (df sensitivity)
We re-estimated spline models using alternative degrees of freedom (df = 3 and df = 5) to evaluate the robustness of the inferred curve shape. Across these alternatives, the fitted RCS functions remained qualitatively consistent: the association between log(GDP) and satisfaction is generally increasing, and any curvature is modest. The df = 3 model produced a smoother, near-linear trajectory, whereas df = 5 allowed more local fluctuations, particularly near the tails where observations are sparse and uncertainty is inherently higher. These comparisons support df = 4 as a parsimonious main specification that balances flexibility and stability, while indicating that the key inference—an overall positive association with weak curvature—does not hinge on a specific df setting.
- (3)
- Tail uncertainty and influence considerations.
Across unadjusted and adjusted RCS plots, confidence intervals widen toward both ends of the log(GDP) distribution, reflecting reduced information at the extremes. This pattern underscores that fine-grained interpretation of slope changes at the lowest or highest GDP ranges should be treated cautiously. Importantly, however, the formal nested-model tests show that introducing spline terms does not yield a statistically detectable improvement over a linear specification (Section 3.3.2), indicating that any apparent tail curvature is not sufficiently supported by the available city-level sample.
- (4)
- Implication for subsequent reporting
Taken together, the sensitivity checks suggest that (i) the positive GDP–satisfaction relationship is robust to reasonable transformations and spline parameterizations, and (ii) the evidence for non-linearity is weak. Accordingly, we retain the RCS specification primarily as a transparent visualization tool for the functional form, while using the linear model as the benchmark for parsimonious inference and interpretation.
- (5)
- Alternative economic indicator: GDP per capita
To distinguish between a potential city-size effect and differences in per capita economic welfare, we conducted additional robustness analyses using GDP per capita as an alternative economic indicator.
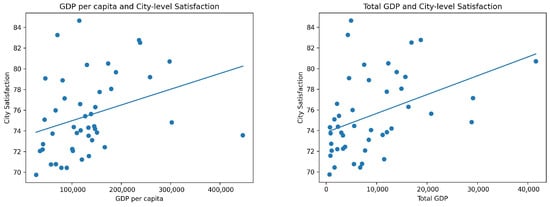
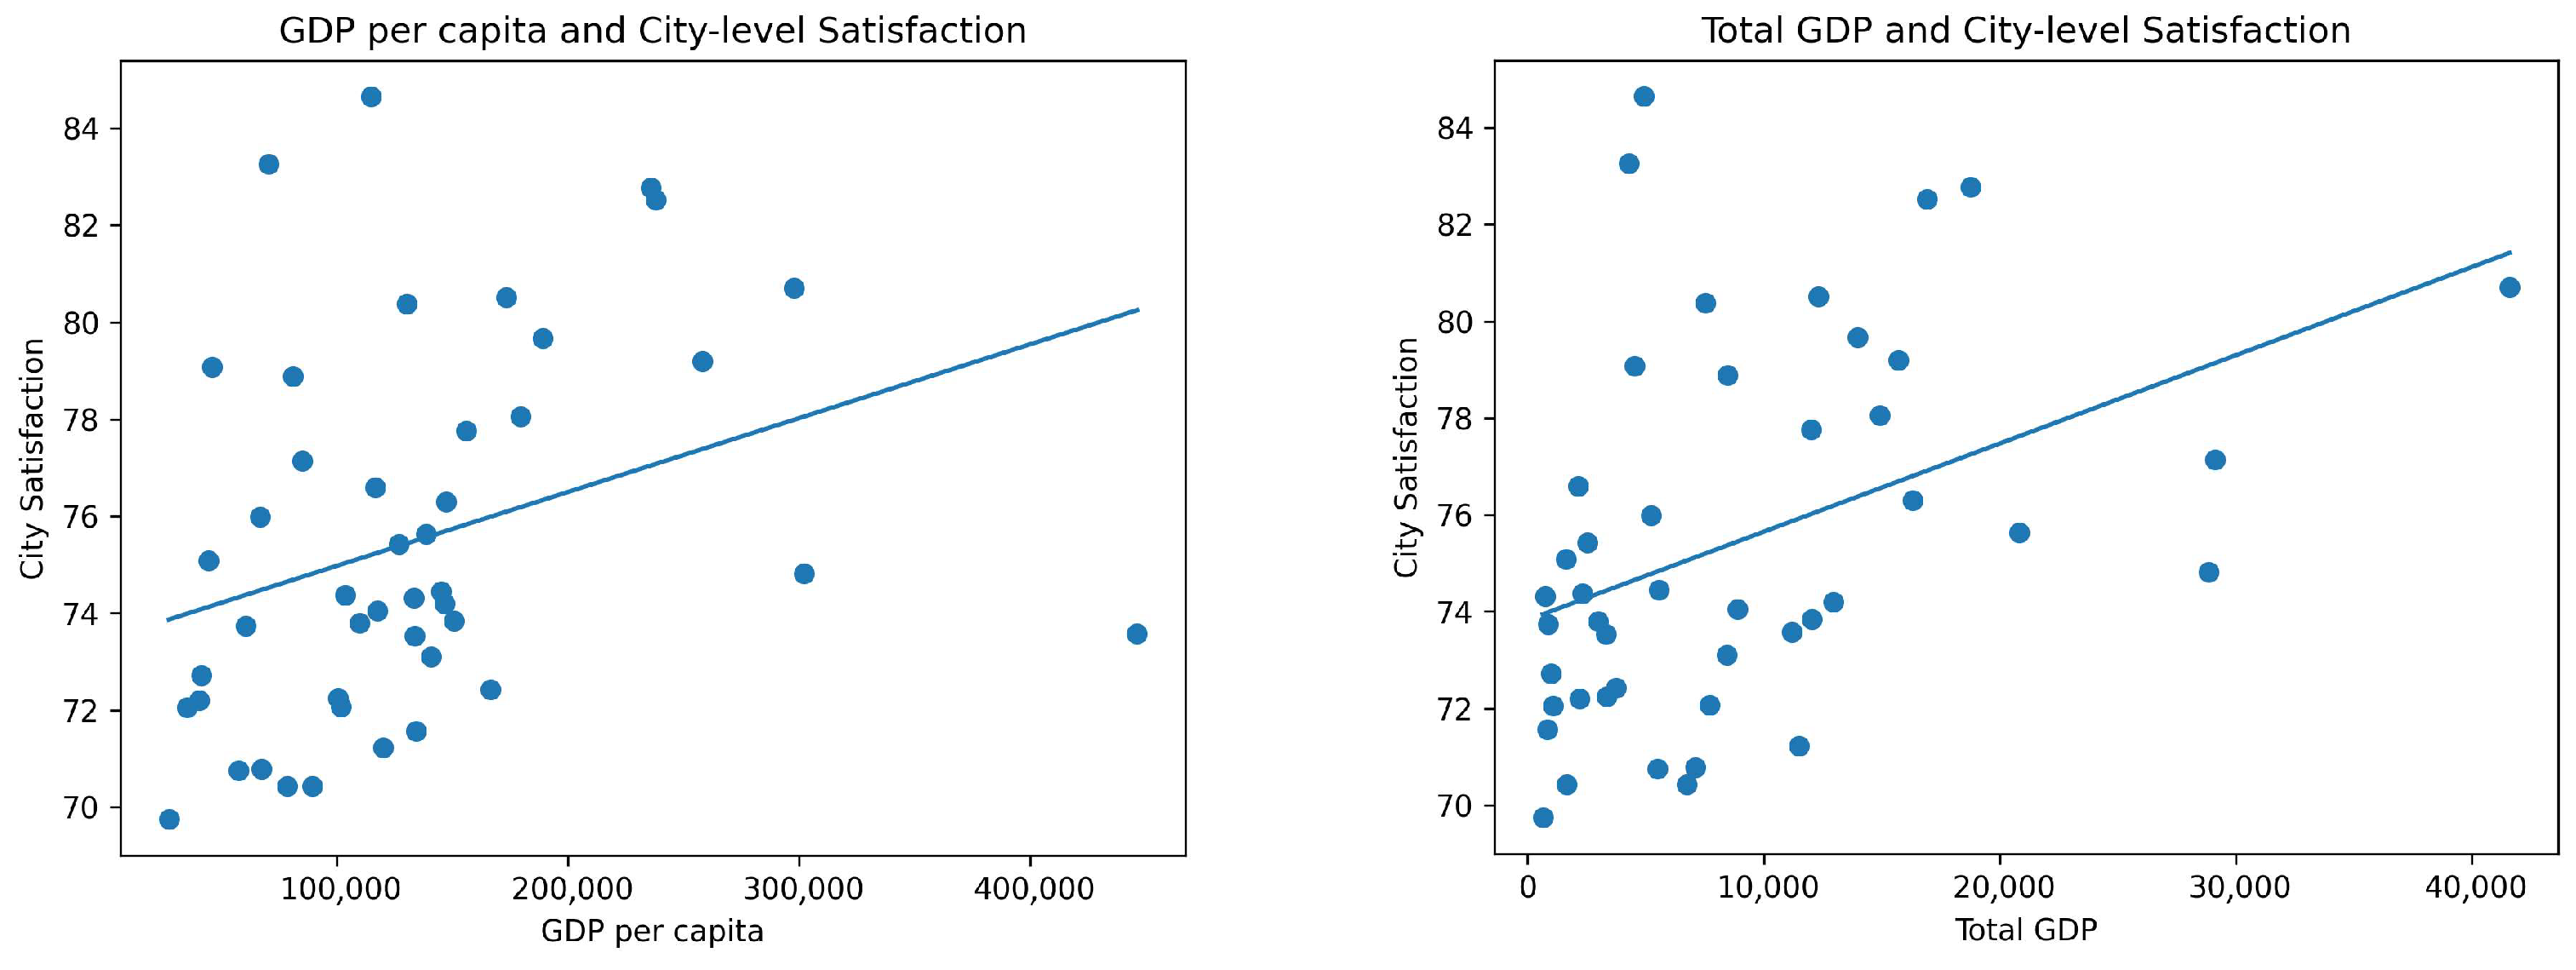
The regression results indicate that GDP per capita is positively associated with city-level overall satisfaction. The estimated coefficient for log(GDP per capita) is 2.43 (p = 0.010), suggesting that cities with higher per capita economic output tend to report higher average satisfaction levels. The model explains approximately 14.6% of the variation in satisfaction across cities (R2 = 0.146).
Importantly, the direction and statistical significance of the relationship are consistent with the main results based on total GDP. This finding suggests that the positive association between economic development and perceived urban well-being is not solely driven by city scale, but also reflects differences in economic welfare levels across cities. The comparison between total GDP and GDP per capita is illustrated in Figure 11.
Figure 11.
GDP vs. GDP per capita comparison.
4. Discussion
4.1. Interpretation of the GDP–Satisfaction Relationship
This study provides a city-level assessment of how economic capacity (GDP) is associated with perceived urban well-being, proxied by UPE-based overall satisfaction aggregated to the city level. Across both the descriptive bivariate evidence and the regression-based specifications, the central empirical result is consistent: cities with higher GDP tend to report higher overall satisfaction, but the relationship is far from deterministic, as indicated by substantial between-city dispersion around the fitted trend. Comparable data on per capita disposable income were not consistently available for all cities in the sample; therefore, GDP per capita was used as the primary alternative economic indicator. The robustness analysis using GDP per capita yields similar results, further indicating that the observed association reflects differences in economic welfare rather than merely city size.
- (1)
- “No plateau within the observed range”: GDP as an enabling capacity for urban well-being. The near-linear increasing profile can be read as evidence that, for the sampled cities, additional economic capacity continues to translate into improvements in domains that residents experience directly and evaluate positively—such as infrastructure maintenance, public service coverage, environmental management capacity, and the city’s ability to respond to risks and disruptions. Under the UPE framework, overall satisfaction is a comprehensive, people-centred outcome that plausibly reflects the cumulative performance of these systems. If economic resources are effectively converted into public goods and urban management quality, then a plateau is not inevitable; rather, “economic upgrading” may continue to yield observable gains in perceived urban well-being.
- (2)
- “Diminishing returns may exist but are difficult to detect at city level”: bounded outcomes and offsetting externalities. The absence of statistically detectable curvature does not rule out diminishing marginal returns in principle. Satisfaction is a bounded, composite perception; as baseline conditions improve, incremental gains become harder to achieve and to measure. Moreover, higher-GDP cities frequently face countervailing pressures—congestion, housing cost burdens, environmental externalities, and governance complexity—that can partially offset the benefits of economic affluence. Empirically, this tension is visible in two ways: (i) the fitted curve’s confidence band expands toward the distribution tails (especially at high ), indicating greater uncertainty where observations are sparse; and (ii) cities with similar GDP can differ markedly in satisfaction, suggesting that the conversion efficiency from economic resources to lived urban quality varies widely. In short, a “plateau story” may be conceptually plausible, but the current cross-sectional city-level design—particularly with limited density in the extreme GDP ranges—may be underpowered to distinguish subtle curvature from noise.
- (3)
- The most policy-relevant reading of these findings is therefore not “GDP matters” per se, but what GDP represents and what it does not. GDP appears to operate as a resource base that is generally associated with higher perceived urban well-being; however, the large dispersion around the curve indicates that GDP is necessary but not sufficient. Some cities achieve relatively high satisfaction at modest GDP levels (suggesting strengths in governance, service delivery, or urban form), while others underperform relative to their GDP (suggesting that negative externalities or misallocation may dominate residents’ daily experience). This “overperformer/underperformer” pattern is precisely why a flexible functional-form assessment is valuable: it frames GDP as an enabling condition, while directing analytical and policy attention toward the factors that shape how economic capacity is translated into resident-perceived urban well-being. In this research, given the limited sample size, the spline results should be interpreted cautiously, and future studies with larger cross-city datasets may provide more reliable evidence regarding potential non-linear relationships.
4.2. Comparison with Existing Literature
Our findings contribute to, and partially reconcile, several established but sometimes divergent strands of research on the economy–well-being nexus.
First, the direction and overall monotonicity of the GDP–satisfaction relationship aligns with the dominant “positive gradient” view in macro-level well-being research [24,25]. Cross-country and long-run evidence generally indicates that higher average economic development is associated with higher average subjective well-being, and some influential re-analyses argue against a clear “satiation point” at the national level [12]. Consistent with this perspective, our city-level results show a robust positive association between economic capacity and residents’ overall evaluation of their city, and the flexible RCS specification does not yield statistically detectable curvature relative to a linear benchmark [8,10].
Second, our results differ in emphasis from the “income satiation/diminishing returns” literature that is largely grounded in individual-level data. Studies distinguishing evaluative well-being from experienced affect have reported plateau-like patterns for some components of well-being (e.g., emotional well-being) beyond a threshold income, while other work identifies turning points and region-specific satiation levels [8,10]. In contrast, we do not observe a statistically identifiable plateau within the GDP range covered by the 47-city sample. This discrepancy is not necessarily contradictory: (i) our outcome—city-level overall satisfaction—is closer to an evaluative judgment (how residents appraise their city as a whole) than to momentary affect, and evaluative measures are commonly found to scale more linearly with economic resources; (ii) we use city GDP (scale capacity) rather than household income, and the mapping from aggregate resources to individual experience depends on how effectively cities convert fiscal and economic capacity into public goods and everyday urban functioning [26].
Third, relative to urban quality-of-life (QoL) and “unhappy cities” scholarship, our evidence underscores the non-sufficiency of economic prosperity and highlights the role of urban externalities and governance capacity in explaining cross-city heterogeneity [27]. In the cities literature, QoL is often conceptualized as multidimensional, where economic performance is only one component among services, environment, safety, housing, mobility, and social cohesion; consequently, GDP per capita tends to be positively associated with life satisfaction, but it does not fully account for the spatial distribution of well-being [12,27,28]. Related urban-economics arguments emphasize that large, prosperous cities can simultaneously generate disamenities (e.g., congestion, high costs, stressors) that offset gains in average well-being, producing substantial dispersion even at similar levels of development [29]. Our results mirror this core insight: the scatter around the fitted GDP–satisfaction curve is substantial, and after adjustment the model fit improves (higher R2), implying that non-economic city attributes systematically structure perceived urban well-being beyond GDP alone [30].
Fourth, compared with China-focused evidence, our findings are consistent with the view that urban well-being in China is jointly shaped by structural urbanization conditions and city-level governance/service performance [31,32]. Research on life satisfaction in urbanizing China highlights the importance of city context (e.g., city size and institutional conditions) for residents’ evaluations [33]. Complementary applied studies in the Chinese context suggest that resilience, management, and service provision are salient correlates of subjective well-being and satisfaction, reinforcing the interpretation that “conversion efficiency” from resources to lived experience matters [31]. Importantly, this resonates with the institutional design of China’s Urban Physical Examination (UPE) practice, which explicitly treats residents’ satisfaction as a core output alongside objective performance metrics and action lists—thereby embedding subjective evaluation into urban governance cycles [31].
4.3. Policy Implications
The following policy implications should be interpreted as exploratory governance insights informed by the empirical findings rather than as direct causal prescriptions derived from stage-specific econometric estimates. Because the regression analysis does not explicitly estimate heterogeneous slopes across GDP groups, the differentiated policy discussion is intended to illustrate how similar overall economic trends may translate into different governance priorities under varying development conditions. Differentiated strategies by GDP range may still be informative in practice because constraints and marginal returns often vary across development stages, even when the overall empirical association between GDP and satisfaction appears broadly monotonic. For lower-GDP cities, the highest-yield interventions typically concentrate on basic-function reliability—maintenance of aging infrastructure, drainage and flood control, neighborhood safety and lighting, last-mile accessibility, and visible micro-environment upgrades that quickly reduce daily friction. In these contexts, resident satisfaction often responds strongly to improvements that stabilize core services and reduce recurrent disruptions, and the governance priority is to build credible, measurable delivery capacity rather than pursuing broad, capital-intensive expansion.
For middle-GDP cities, the policy frontier shifts from “coverage” to system integration and quality upgrading. Rapid spatial expansion, motorization, and rising expectations mean that residents increasingly evaluate the city through time-cost and convenience: commuting reliability, congestion management, facility accessibility, and the perceived fairness of service distribution. Here, simply increasing investment is rarely sufficient; what matters is coordination across land use–transport–public services–environment, to avoid fragmented projects that raise costs without improving lived experience. In practice, UPE results can be used to identify whether dissatisfaction clusters around jobs–housing balance, mobility, ecological livability, or safety resilience, and then to implement integrated packages rather than single-sector fixes.
For higher-GDP cities, the binding constraints tend to be externalities, cost pressures, and governance complexity. High GDP can coexist with persistent dissatisfaction if congestion, housing burdens, environmental exposure hotspots, or “fine-grained” neighborhood management deficits dominate residents’ daily experience. One possible governance implication is to place greater emphasis on externality control and governance modernization: demand management and multimodal transport reliability, affordability-oriented housing and rental governance, refined environmental exposure mitigation at the neighborhood scale, and responsive, data-driven urban management that closes the “last-mile governance gap.” In these cities, satisfaction gains are often achieved less by adding more infrastructure and more by improving operational performance and equity in service access.
These regional considerations should be interpreted as contextual governance perspectives rather than econometrically estimated heterogeneity effects. Regional differentiation should be layered on top of GDP staging because “the same GDP” can imply different structural pressures. In coastal and high-density regions, satisfaction is often constrained by congestion, time-cost, high living expenses, and environmental exposure concentrated in dense neighborhoods; thus, policies should emphasize demand management, exposure hotspot governance, and equitable service reallocation. In inland or lower-density regions, accessibility coverage, basic public-service catchments, and infrastructure reliability frequently dominate perceived outcomes; thus, policies should emphasize service completion, maintenance regimes, and resilience of essential systems. For shrinking or slow-growth regions, the conversion-efficiency lens is particularly important: the priority is not expansion but right-sizing services, maintaining quality under fiscal constraints, and preventing “infrastructure decay” from eroding perceived urban well-being.
Finally, the results reinforce a governance shift: treat resident satisfaction not as a generic “soft indicator,” but as a performance metric that reveals where economic growth is not translating into lived benefits. The GDP–satisfaction curve can be institutionalized as a diagnostic tool within UPE practice—supporting differentiated renewal strategies, more accountable action lists, and a clearer focus on conversion efficiency. Over time, repeating the same analysis across survey waves would allow policymakers to evaluate whether cities are moving upward (raising satisfaction) and toward the benchmark (improving conversion), which is arguably the most actionable interpretation of “high-quality urban development” in a people-centred governance framework. Future research using larger samples of cities may further explore whether non-linear thresholds or plateau effects emerge at higher levels of economic development.
5. Conclusions
5.1. Summary
This study examined whether and how economic development (GDP) is associated with perceived urban well-being, proxied by city-level overall satisfaction aggregated from the 2024 nationwide Urban Physical Examination (UPE) resident survey. Using 47 Chinese cities, we first documented a moderate positive bivariate association between GDP and satisfaction, while also observing substantial cross-city dispersion—indicating that economic prosperity does not automatically translate into uniformly higher perceived urban well-being.
To move beyond a linear assumption, we employed restricted cubic splines (RCS) to flexibly assess the functional form of the GDP–satisfaction relationship. After log-transforming GDP to reduce skewness and leverage effects, the RCS estimates revealed a smooth, generally increasing association between log(GDP) and city-level satisfaction. However, nested-model tests comparing linear and spline specifications provided no statistical evidence of non-linearity in either the unadjusted model or the covariate-adjusted model. Together, these results suggest that, within the observed GDP range of the sampled cities, higher economic capacity is consistently associated with higher satisfaction, but the magnitude of perceived urban well-being is also strongly shaped by non-economic factors reflected in the dispersion around the fitted curve.
From a governance perspective, the findings support interpreting GDP as an enabling capacity rather than a sufficient condition. The observed heterogeneity implies that cities differ in their conversion efficiency—how effectively economic resources are translated into service quality, environmental conditions, mobility reliability, safety, and other everyday experiences that residents evaluate in the UPE system.
5.2. Future Work
Several limitations point to directions for future research and policy-oriented refinement.
First, the study is that individual-level responses are aggregated to the city level, which reduces the effective sample size for regression analysis. This aggregation may lead to some loss of information and limits the statistical power for detecting subtle non-linear relationships. Future research could apply multilevel modeling frameworks in which individual satisfaction responses are nested within cities while incorporating city-level economic indicators as contextual variables. Such approaches would allow researchers to simultaneously examine individual-level and city-level determinants of urban satisfaction.
Second, the study uses a cross-sectional design. While the association between GDP and satisfaction is robust, causal interpretation remains limited. Future research using larger cross-city samples could further examine whether non-linear thresholds or plateau effects emerge at higher levels of economic development. Longitudinal analyses using repeated UPE waves would allow testing whether changes in economic capacity and governance performance precede changes in resident satisfaction, and whether functional form evolves over time.
Third, although we controlled for key city characteristics and screened for collinearity, the current models cannot fully capture institutional and governance processes (e.g., budgeting rules, service delivery efficiency, responsiveness to complaints, and implementation capacity) that likely explain why similarly wealthy cities diverge in perceived outcomes. Future research could integrate administrative performance metrics, digital governance indicators, or objective service accessibility measures to better operationalize the “conversion” mechanism.
Fourth, the non-linearity tests may be constrained by the sample size and tail coverage at extreme GDP levels. With a broader set of cities, or pooled multi-year data, future work could more powerfully detect subtle curvature, potential thresholds, or heterogeneous functional forms across regions and city types (e.g., shrinking vs. fast-growing cities).
Finally, perceived urban well-being is inherently multidimensional. Future studies could move beyond overall satisfaction to model domain-specific perceptions (e.g., resilience, ecological livability, jobs–housing balance) and to examine whether economic development relates differently to each domain—thereby producing more targeted and actionable policy insights for UPE-guided urban renewal.
Through the results of the study, we should also find some issues of concern, such as: the relationship between economic development and city-level satisfaction may differ across stages of economic development. In particular, the scatterplots may suggest heterogeneous patterns across low-, middle-, and high-GDP groups of cities. Future research could further explore heterogeneous relationships across different stages of economic development using larger samples and more flexible modeling approaches. In this research, preliminary inspection of the spatial distribution of the sample does not indicate strong regional clustering patterns that would systematically bias the results. Future research with larger datasets could further explore spatial spillover effects using spatial econometric models.
Author Contributions
Conceptualization, Ju He; methodology, Jincheng Cai; software, Ju He and Jincheng Cai; validation, Ju He and Jincheng Cai; formal analysis, Ju He and Jincheng Cai; investigation, Ju He and Jincheng Cai; resources, Ju He; data curation, Ju He and Jincheng Cai; writing—original draft preparation, Ju He and Jincheng Cai; writing—review and editing, Ju He and Jincheng Cai; visualization, Jincheng Cai; supervision, Ju He; project administration, Ju He; funding acquisition, Ju He. All authors have read and agreed to the published version of the manuscript.
Funding
This research was funded by National Natural Science Foundation of China (grant number 42401291); National Key R&D Program of China (grant number 2025YFC3811300).
Data Availability Statement
The raw data supporting the conclusions of this article will be made available by the authors on request.
Conflicts of Interest
The authors declare no conflict of interest.
References
- Organizational Chart. Available online: https://www.stats.gov.cn/english/AI/OS/202208/t20220824_1887612.html (accessed on 23 December 2025).
- Connor, D.S.; Xie, S.; Jang, J.; Frazier, A.E.; Kedron, P.; Jain, G.; Yu, Y.; Kemeny, T. Big Cities Fuel Inequality within and across Generations. PNAS Nexus 2025, 4, pgae587. [Google Scholar] [CrossRef] [Scilit]
- Zhang, W.; Cao, J.; He, J.; Chen, L. City Health Examination in China: A Methodology and Empirical Study. Chin. Geogr. Sci. 2021, 31, 951–965. [Google Scholar] [CrossRef] [Scilit]
- Liu, H.; Fang, C. China’s New Program Gives Cities Check-Ups. Nat. Cities 2025, 2, 910–912. [Google Scholar] [CrossRef] [Scilit]
- Shi, T.; Zhu, W.; Fu, S. Quality of Life in Chinese Cities. China Econ. Rev. 2021, 69, 101682. [Google Scholar] [CrossRef] [Scilit]
- Pazos-García, M.J.; López-López, V.; Iglesias-Antelo, S.; Vila-Vázquez, G. Quality of Life in Cities: An Outcome and a Resource? Eur. Res. Manag. Bus. Econ. 2025, 31, 100264. [Google Scholar] [CrossRef] [Scilit]
- Kahneman, D.; Deaton, A. High Income Improves Evaluation of Life but Not Emotional Well-Being. Proc. Natl. Acad. Sci. USA 2010, 107, 16489–16493. [Google Scholar] [CrossRef] [Scilit]
- Killingsworth, M.A. Experienced Well-Being Rises with Income, Even above $75,000 per Year. Proc. Natl. Acad. Sci. USA 2021, 118, e2016976118. [Google Scholar] [CrossRef] [Scilit]
- Roszkowska, E.; Wachowicz, T.; Michalska, E. Sustainable Cities and Quality of Life: A Multi-Criteria Approach for Evaluating Perceived Satisfaction with Public Administration. Sustainability 2025, 17, 10106. [Google Scholar] [CrossRef] [Scilit]
- Killingsworth, M.A.; Kahneman, D.; Mellers, B. Income and Emotional Well-Being: A Conflict Resolved. Proc. Natl. Acad. Sci. USA 2023, 120, e2208661120. [Google Scholar] [CrossRef] [Scilit]
- He, X.; Zhou, Y.; Yuan, X.; Zhu, M. The Coordination Relationship between Urban Development and Urban Life Satisfaction in Chinese Cities—An Empirical Analysis Based on Multi-Source Data. Cities 2024, 150, 105016. [Google Scholar] [CrossRef] [Scilit]
- Nicolás-Martínez, C.; Pérez-Cárceles, M.C.; Riquelme-Perea, P.J.; Verde-Martín, C.M. Are Cities Decisive for Life Satisfaction? A Structural Equation Model for the European Population. Soc. Indic. Res. 2024, 174, 1025–1051. [Google Scholar] [CrossRef] [Scilit]
- Yu, X.; Yang, T.; Zhou, J.; Zhang, W.; Zhan, D. Commuting Characteristics, Perceived Traffic Experience and Subjective Well-Being: Evidence from Hangzhou, China. Transp. Res. Part Transp. Environ. 2024, 127, 104043. [Google Scholar] [CrossRef] [Scilit]
- Desquilbet, L.; Mariotti, F. Dose-Response Analyses Using Restricted Cubic Spline Functions in Public Health Research. Stat. Med. 2010, 29, 1037–1057. [Google Scholar] [CrossRef] [Scilit]
- Wrede, M. Wages, Rents, Unemployment, and the Quality of Life: A Consistent Theory-Based Measure. J. Reg. Sci. 2015, 55, 609–625. [Google Scholar] [CrossRef] [Scilit]
- Glaeser, E.L.; Kolko, J.; Saiz, A. Consumer City. J. Econ. Geogr. 2001, 1, 27–50. [Google Scholar] [CrossRef] [Scilit]
- Loschiavo, D. Big-City Life (Dis)Satisfaction? The Effect of Urban Living on Subjective Well-Being. J. Econ. Behav. Organ. 2021, 192, 740–764. [Google Scholar] [CrossRef] [Scilit]
- Jebb, A.T.; Tay, L.; Diener, E.; Oishi, S. Happiness, Income Satiation and Turning Points around the World. Nat. Hum. Behav. 2018, 2, 33–38. [Google Scholar] [CrossRef] [Scilit]
- Gauthier, J.; Wu, Q.V.; Gooley, T.A. Cubic Splines to Model Relationships between Continuous Variables and Outcomes: A Guide for Clinicians. Bone Marrow Transplant 2020, 55, 675–680. [Google Scholar] [CrossRef] [Scilit] [PubMed]
- Austin, P.C. Graphical Methods to Illustrate the Nature of the Relation between a Continuous Variable and the Outcome When Using Restricted Cubic Splines with a Cox Proportional Hazards Model. Stat. Methods Med. Res. 2025, 34, 277–285. [Google Scholar] [CrossRef] [Scilit]
- Discacciati, A.; Palazzolo, M.G.; Park, J.-G.; Melloni, G.E.M.; Murphy, S.A.; Bellavia, A. Estimating and Presenting Non-Linear Associations with Restricted Cubic Splines. Int. J. Epidemiol. 2025, 54, dyaf088. [Google Scholar] [CrossRef] [Scilit]
- Arnes, J.I.; Hapfelmeier, A.; Horsch, A.; Braaten, T. Greedy Knot Selection Algorithm for Restricted Cubic Spline Regression. Front. Epidemiol. 2023, 3, 1283705. [Google Scholar] [CrossRef] [Scilit]
- Schuster, N.A.; Rijnhart, J.J.M.; Twisk, J.W.R.; Heymans, M.W. Modeling Non-Linear Relationships in Epidemiological Data: The Application and Interpretation of Spline Models. Front. Epidemiol. 2022, 2, 975380. [Google Scholar] [CrossRef] [Scilit] [PubMed]
- Oishi, S.; Cha, Y.; Komiya, A.; Ono, H. Money and Happiness: The Income–Happiness Correlation Is Higher When Income Inequality Is Higher. PNAS Nexus 2022, 1, pgac224. [Google Scholar] [CrossRef] [Scilit] [PubMed]
- Prati, G. The Relationship Between Rural-Urban Place of Residence and Subjective Well-Being Is Nonlinear and Its Substantive Significance Is Questionable. Int. J. Appl. Posit. Psychol. 2024, 9, 27–43. [Google Scholar] [CrossRef] [Scilit]
- Xu, S.; Chen, M.; Yuan, B.; Zhou, Y.; Zhang, J. Resident Satisfaction and Influencing Factors of the Renewal of Old Communities. J. Urban Plan. Dev. 2024, 150, 04023061. [Google Scholar] [CrossRef] [Scilit]
- Carlsen, F.; Leknes, S. The Paradox of the Unhappy, Growing City: Reconciling Evidence. Cities 2022, 126, 103648. [Google Scholar] [CrossRef] [Scilit]
- Węziak-Białowolska, D. Quality of Life in Cities—Empirical Evidence in Comparative European Perspective. Cities 2016, 58, 87–96. [Google Scholar] [CrossRef] [Scilit]
- Glaeser, E.L.; Gottlieb, J.D.; Ziv, O. Unhappy Cities. J. Labor Econ. 2016, 34, S129–S182. [Google Scholar] [CrossRef] [Scilit]
- Sørensen, J.F.L. Why Are City Residents Less Happy than the Rest of the Population in Developed Countries? Studying the Urban-Rural Happiness Gap in Denmark Using Blinder-Oaxaca Decomposition. Appl. Res. Qual. Life 2026, 21, 35–54. [Google Scholar] [CrossRef] [Scilit]
- Liao, L.; Du, M.; Huang, J. The Effect of Urban Resilience on Residents’ Subjective Happiness: Evidence from China. Land 2022, 11, 1896. [Google Scholar] [CrossRef] [Scilit]
- Guo, D.; Kong, S.; Li, X.; Liu, Y.; Sun, W. Urbanization and Subjective Well-Being of Native Urban Residents: Evidence from the “New-Type Urbanization Pilot Policy” in China. Ann. Reg. Sci. 2025, 74, 4. [Google Scholar] [CrossRef] [Scilit]
- Chen, J.; Davis, D.S.; Wu, K.; Dai, H. Life Satisfaction in Urbanizing China: The Effect of City Size and Pathways to Urban Residency. Cities 2015, 49, 88–97. [Google Scholar] [CrossRef] [Scilit]

Disclaimer/Publisher’s Note: The statements, opinions and data contained in all publications are solely those of the individual author(s) and contributor(s) and not of MDPI and/or the editor(s). MDPI and/or the editor(s) disclaim responsibility for any injury to people or property resulting from any ideas, methods, instructions or products referred to in the content. |
© 2026 by the authors. Published by MDPI on behalf of the International Society for Photogrammetry and Remote Sensing. Licensee MDPI, Basel, Switzerland. This article is an open access article distributed under the terms and conditions of the Creative Commons Attribution (CC BY) license.