


Abstract
Contingency epidemic outbreaks, such as the novel coronavirus (COVID-19) pandemic in 2020, have underscored the vital function of public health emergency response systems within national strategic frameworks. Public health surveillance and early warnings are imperative for safeguarding peoples’ lives, maintaining social stability, and promoting economic development. Existing studies are inadequate for accurately evaluating the efficiency of an urban public health surveillance system from a comprehensive perspective. In this work, an integrated framework was proposed for the evaluation of the spatial allocation efficiency of urban public health surveillance. This integrated approach incorporates three key aspects, spatial coverage, overlap, and accessibility, enabling a measurable evaluation of the overall spatial allocation efficiency. We utilized the proposed method to investigate the placement efficiency of the nucleic acid testing sites during the epidemic in Nanchang, China. The findings showed that using the integrated evaluation method based on coverage, overlap, and accessibility provides a more accurate reflection of the efficiency of existing site placements. It offers a flexible measurement system for evaluating urban surveillance site allocation strategies. This study introduces a novel perspective for the efficiency assessment of public health surveillance site placements, contributes to the development of public health emergency response systems, and provides a technical foundation for future contingency planning in public health surveillance.
1. Introduction
Increased human mobility has significantly heightened the risk of infectious disease transmission in the context of globalization. Public health is currently confronted with a multitude of challenges, including the rapid spread of emerging infectious diseases, the long-term accumulation of chronic illnesses, health concerns arising from environmental pollution, and others. The COVID-19 epidemic served to underscore the persistent and severe threat posed by infectious diseases on a national scale [1,2]. Public health surveillance, as a vital defensive mechanism, plays a pivotal role in safeguarding public health by collecting and analyzing health-related data in real time. In general, it is designed to promptly identify potential risks, to provide scientific evidence for decision-making, and to facilitate early interventions with a view to curbing the spread of epidemics and mitigating health hazards [3]. Moreover, it has the capacity to optimize the allocation of public health resources and enhance the efficiency of medical and epidemic prevention resources, thereby ensuring the stable operation of society. Establishing an efficient public health surveillance system constitutes a core strategy for addressing public health challenges and safeguarding the health of the population.
The development of public health emergency response systems encompasses several critical areas, including the geographical layout of surveillance and early warning sites, the construction and resource allocation of medical treatment systems, material security, collaborative mechanisms, and others. In this context, the efficiency assessment and optimization of surveillance and early warning site placements have become focal points of research. Currently, the assessment of the spatial allocation efficiency of public health surveillance primarily relies on cross-sectional and panel data. The methodologies employed include stochastic frontier analysis [4,5], spatial analysis [6,7,8], composite multi-indicator evaluation methods [9], and others. In addition, the organizational effectiveness evaluation model can also be utilized to assess the efficiency of public service facility institutions [10]. This model incorporates the important metric of consumer satisfaction, which serves as a pivotal indicator in evaluating the performance of public services. In light of the proliferation of data sources and technical advancements, a number of studies have evaluated the spatial layout efficiency of service sites from the perspective of minimizing costs [11,12,13,14]. Specifically, these methodologies aim to minimize the total cost of providing services while ensuring that the total demand reaches a required service level. Other studies have employed the Malmquist index to assess the spatial efficiency of site layouts in which the overall efficiency is broken down into changes in technical and allocative efficiency [15,16,17]. Furthermore, the intensive coverage model is also utilized to evaluate the spatial layout efficiency of facilities, with the objective of quantifying their spatial individual coverages [18,19]. From the perspective of accessibility, spatial analysis models have been employed to construct comprehensive, balanced indicators that are applied to analyze the relative equality of facility allocations [20,21]. In general, the calculation of spatial accessibility is predicated on the Two-Step Floating Catchment Area (2SFCA) model, a methodology that considers both supply and demand factors [22]. While the aforementioned methodologies provide valuable insights into efficiency measurement, they fail to disaggregate the internal spatial heterogeneity of efficiency or pinpoint specific spatial units suffering from coverage gaps or resource redundancy.
Previous studies typically evaluated the efficiency of surveillance site placements using a single evaluation criterion [23,24,25,26]. The corresponding methodologies predominantly concentrated on individual factors or the layout of sites in isolation, with little consideration given to the serviced population or potential issues such as over-concentration of sites in certain sub-areas. While a certain degree of spatial overlap can be essential in high-demand areas to ensure service capacity and resilience during crises, excessive overlap in areas where demand is already met may indicate redundancy and inefficient allocation of limited resources. There is still a significant gap in the comprehensive evaluation of public health surveillance site layouts, and it is required to introduce flexible methods and technical means that integrate a range of aspects or factors. The configuration of public health surveillance and early warning placements must be dynamic, with the capacity to support core objectives of public health while demonstrating adaptability in response to evolving circumstances [27,28]. Human needs are prioritized in the process of planning and designing public health placements, which are supposed to address current challenges, adapt to unanticipated shifts, and satisfy potential requirements. This is of particular significance when dealing with unexpected public health crises such as the COVID-19 pandemic [29].
In view of the above considerations, this article aims to introduce a comprehensive framework for assessing the allocation efficiency of public health surveillance site layouts. The proposed framework implements an integration of multiple factors, including the overall coverage of resources across the entire region, the potential for over-concentration and resource wastage in sub-areas, as well as the spatial accessibility of the site layout for the serviced population. Specifically, this study employs an improved coverage model (SFSAC) to measure the coverage and overlap of surveillance site layouts and utilizes a Gaussian 2SFCA method to assess the spatial accessibility of surveillance sites to the population. Coverage is defined as a geometric measure of service area extent, reflecting the potential reach of services. Accessibility is a measure of realized service availability, which incorporates both supply capacity and population demand within travel catchments, reflecting the ease of obtaining services. In addition, public health service metrics often exhibit heavy-tailed distributions in urban spaces, and we introduce head/tail breaks to conduct the optimized classification/stratification for each individual factor. The three indicators can be stratified independently using head/tail breaks, and the intersection of their high-level strata can be conducted to identify distinct efficiency levels. Finally, a comprehensive evaluation of the efficiency of public health surveillance site layouts can be achieved through the integration of three key factors: spatial coverage, overlap, and accessibility. The present methodology is verified using an empirical case study of the efficiency assessment of the nucleic acid testing site placement during the epidemic in Nanchang, China. It provides a theoretical basis and practical guidance for the efficiency assessment of public health site placements, and also has the flexibility to be utilized for evaluating other surveillance site allocation strategies.
2. Methods
2.1. Evaluation Indicators of Spatial Allocation Efficiency
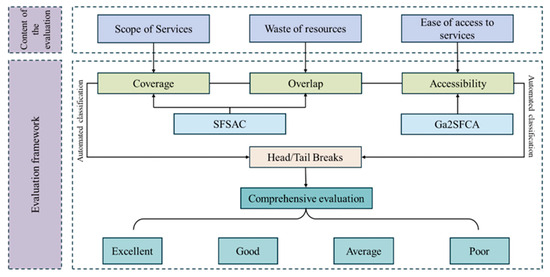
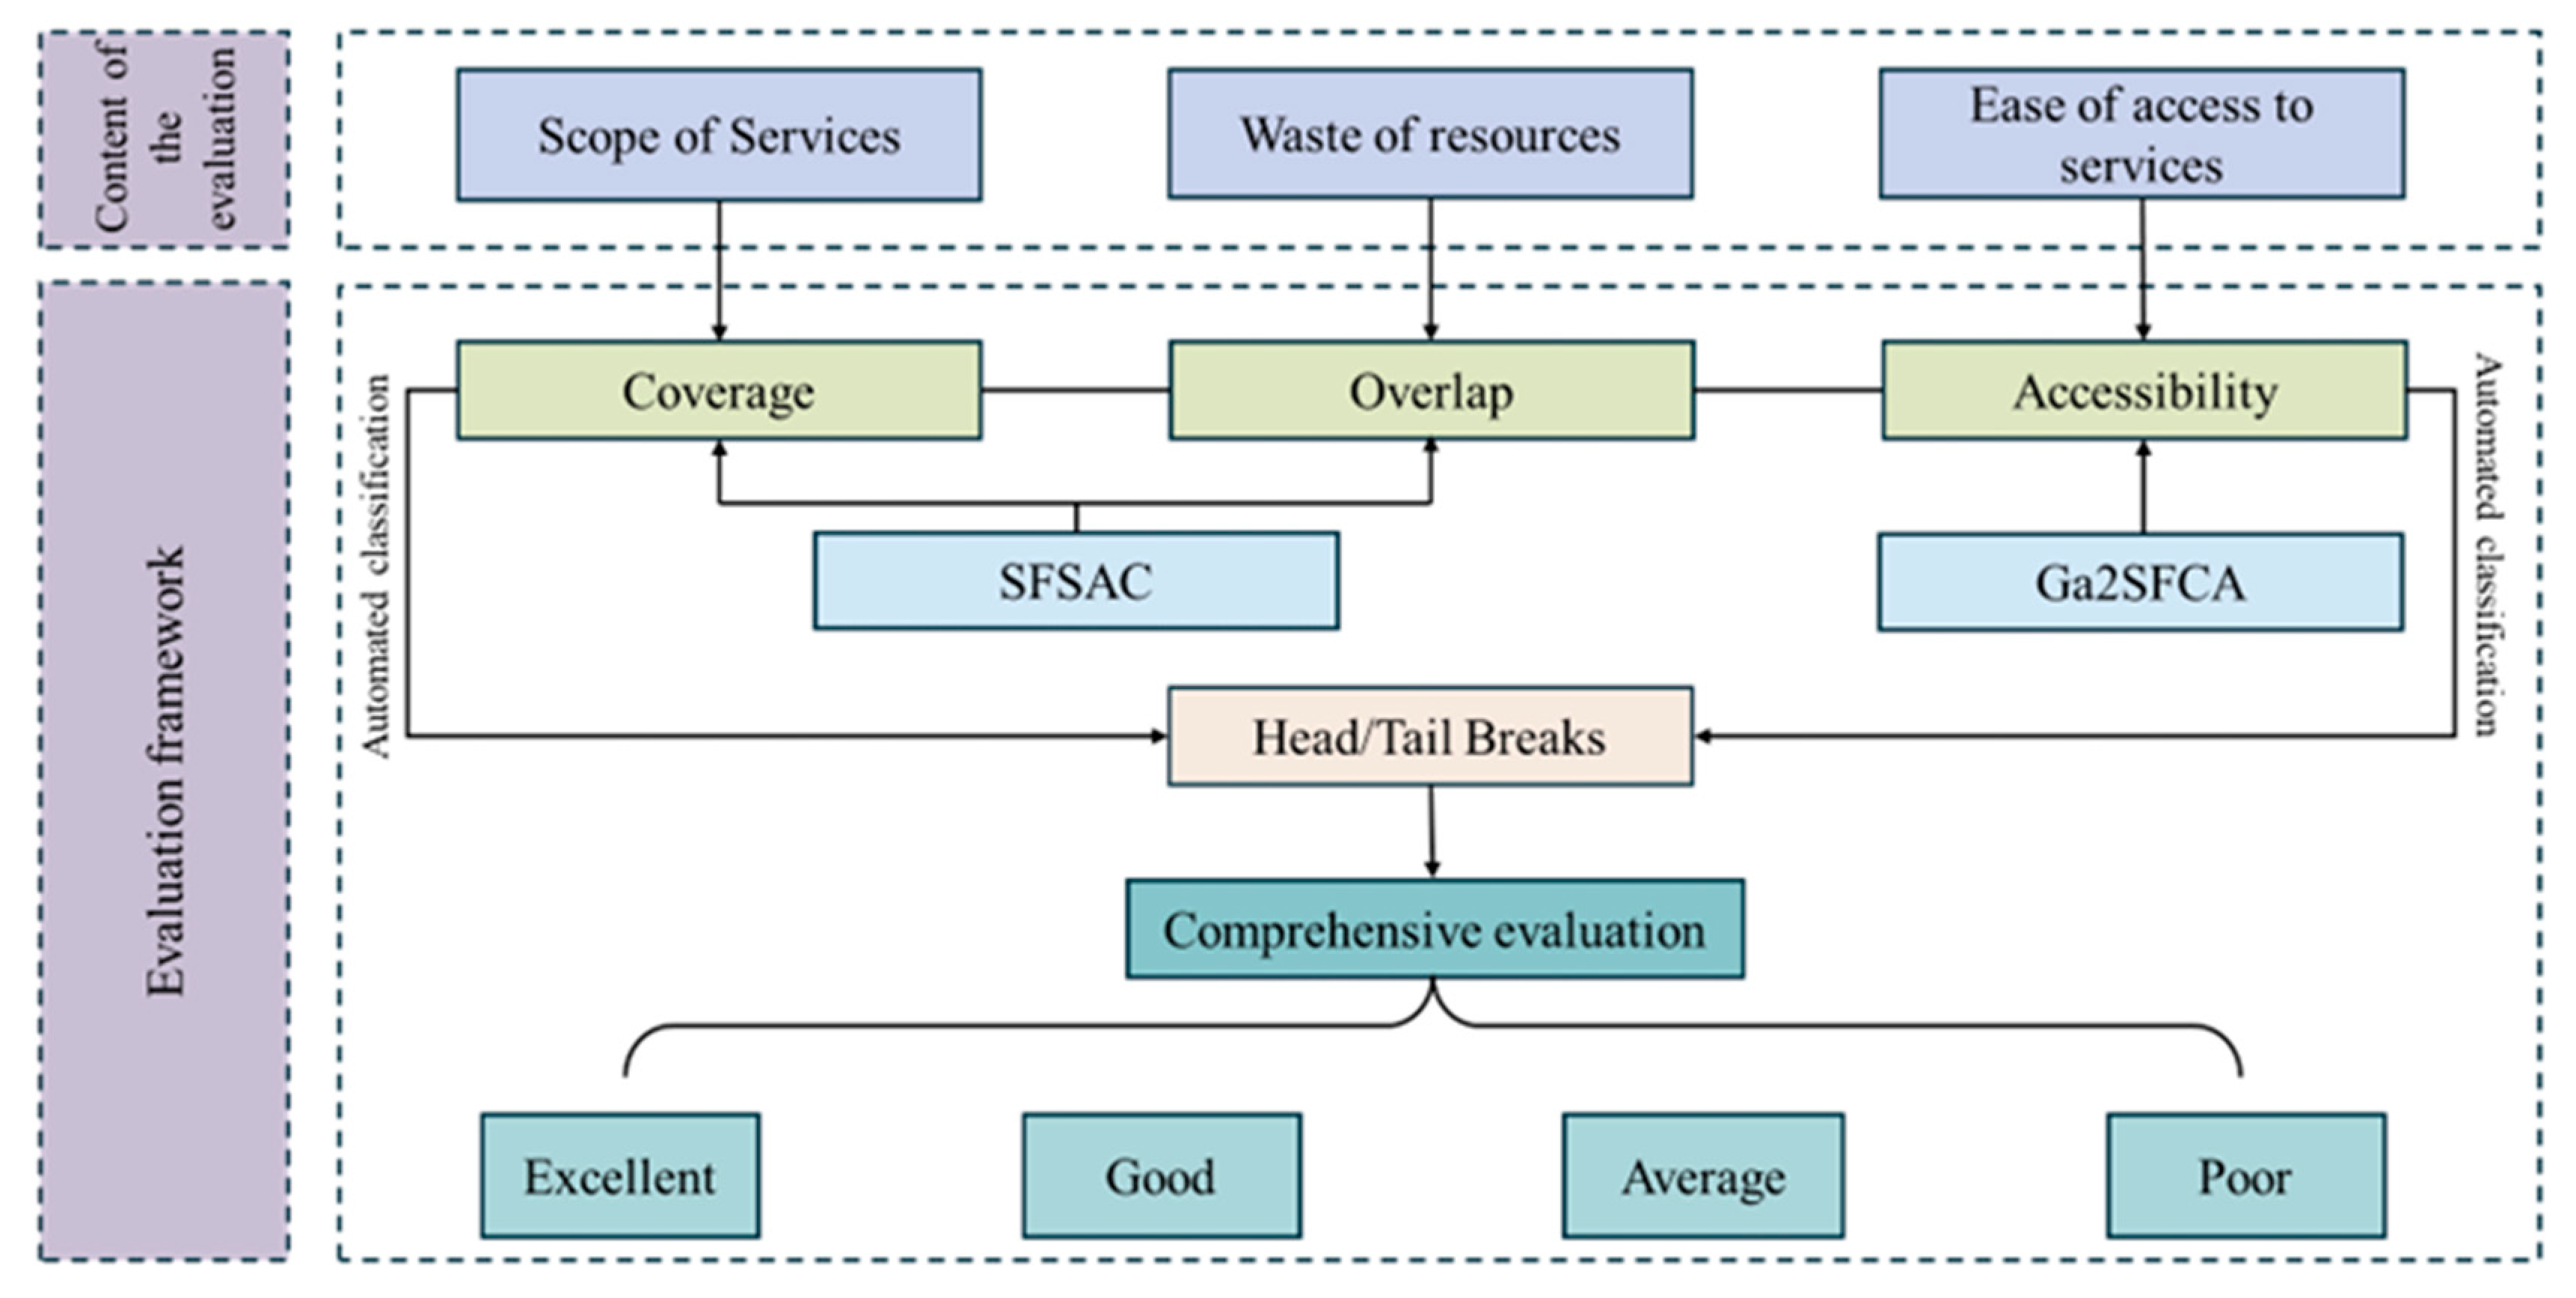
There are three core indicators in this study for the enhanced, comprehensive evaluation of the efficiency of urban public health surveillance site placement. In consideration of the surveillance site allocation in a study area, the focus is directed towards the scope of services, the wastage of resources, and the accessibility for the population to services; in this regard, three evaluation indicators are introduced: spatial coverage, overlap, and accessibility (Figure 1). The calculation of these three indicators can be facilitated using the improved coverage model and the Gaussian 2SFCA method, respectively. To integrate the calculations of multiple indicators, existing studies typically employed simplistic additive multi-factor models, where the weights for multi-factor assessments were determined using methods such as the analytic hierarchy process (AHP) or entropy weighting. We introduce head/tail breaks to implement the optimized classification/stratification for the evaluation indicators. This process has the capacity to naturally capture the spatial hierarchical structure of a heavy-tailed distributed dataset, thereby facilitating a holistic assessment of surveillance site placement efficiency. Note that three evaluation indicators can be naturally stratified or categorized without subjectivity and are synthesized for a comprehensive, objective evaluation.
Figure 1.
Evaluation indicators of the spatial allocation efficiency of public health surveillance and the integrated framework.
2.2. Improved Coverage Model (SFSAC)
The coverage model (FSAC) is a standardized approach employed to investigate the maximum coverage areas for public service facilities with a specified threshold range. It is an effective means of evaluating the efficiency of facility services accounting for the number of facilities, their locations, and service radii, as well as potential service coverage gaps. Traditional coverage models are often influenced by the region’s size and tend to overlook the effects of service ranges crossing boundaries when dealing with overlapping service areas. This might lead to issues such as redundant calculations of overlapping areas and misinterpretations of indicators. To provide a more comprehensive evaluation of public health surveillance site placement in urban settings, this study proposes an improved coverage model (SFSAC) to measure both the coverage and overlap of service areas within study units. Here, the coverage and overlap indicators distributed in study units were defined in a geographical domain, calculated as follows:
where a represents the surveillance sites (e.g., nucleic acid testing sites) and b denotes the study units (e.g., populated grids). and indicate the percentage of service areas covered by surveillance sites and the redundancy of overlapping service areas, respectively. is the total area of a study unit b, and denotes the coverage area from a certain site a. The symbols, “” and “” represent the spatial intersection and union processes, respectively; that is to say, and are the intersecting and unified coverage areas of surveillance sites located within the study unit, respectively. Note that the coverage area for a given study unit encompasses the service areas of its interior sites, as well as those of surveillance sites located outside the unit but whose coverages extend into it.
The service range of public health surveillance sites must be calculated based on the urban transportation network in a certain study area, with a pivotal threshold parameter of service radius. This radius threshold for service coverage can be pre-determined in accordance with a variety of research requirements. In consideration of the ‘15-min walking radius’ concept of urban life circle and the travel-time tolerance of urban walking activities, the threshold parameters of service radius in this study were set as 15 and 30 min, respectively.
We can utilize the improved coverage model to examine the spatial coverage and overlap indicators for surveillance site placements. The calculations of both and range from 0 to 1. An value approaching 1 indicates an expanded coverage area of surveillance sites for a study unit b. Conversely, an value approaching 1 signifies a higher degree of redundancy in service area coverage, suggesting substantial resource wastage.
2.3. Gaussian 2SFCA Method (Ga-2SFCA)
The 2SFCA method is a robust approach to measure spatial accessibility by analyzing the interaction between service supply and demand across regions [30]. It conducts the quantification of spatial accessibility and provides a comprehensive account of supply and demand whilst offering particular advantages when dealing with small populations and addressing the challenges posed by search domains that extend across administrative boundaries [31]. The conventional 2SFCA model categorizes service facilities as either accessible or inaccessible, operating under the assumption that all facilities within the threshold provide an equivalent level of spatial accessibility to demand units. This assumption disregards the distance decay effect, which leads to a reduction in service capacity as the distance increases.
In this study, we employed a Gaussian 2SFCA method to calculate the accessibility of supply facilities (i.e., public health surveillance sites) to demand units (e.g., populated grids). The Gaussian function, with its inverse S-shaped curve, is well-suited to model the attenuation of service capacity with distance, particularly in densely populated areas. The Ga-2SFCA model incorporates a Gaussian distance decay function into the traditional 2SFCA method, allowing for a more accurate quantitative calculation of accessibility in site selection. The Gaussian function used to capture the distance decay effect is represented as follows:
where denotes a searching radius parameter (e.g., 15 or 30 min), is the distance between the demand unit i and the supply facility j, and indicates the corresponding selection weight in accordance with the distance decay effect.
For each supply facility (e.g., surveillance sites), we identify all the demand units for it using a searching radius threshold, and then calculate its supply-demand ratio as follows:
where represents the supply-demand ratio of the supply facility j, refers to its service capacity (e.g., nucleic acid testing capacity), and denotes the population of the demand unit k within the searching area.
Subsequently, for each demand unit, its relevant supply facilities can be identified according to a certain radius threshold (e.g., 15 or 30 min). The supply-demand ratio values of all the supply facilities can then be aggregated, with the weight determined by the distance between the demand unit and supply facility according to the distance decay function. The spatial accessibility of demand units can be calculated as follows:
where is the accessibility of the demand unit i and denotes the supply-demand ratio of a supply facility j located within its searching area. A higher value of accessibility indicates greater or more convenient access for a demand unit to its supply facilities.
It should be noted that the calculations of both supply-demand ratios of supply facilities and spatial accessibility of demand units incorporate the Gaussian distance decay function. In short, the used Ga-2SFCA model incorporates two key steps for the calculation of spatial accessibility. The first process is to ascertain the congestion level of supply facilities, referring to the supply-demand ratio within the service area of each supply site. The second step involves the accessibility measurement of each demand unit within its designated search area, considering all supply sites capable of serving it; this ensures that the supply-demand ratio of each supply facility within the service area contributes to the overall accessibility of the demand unit.
2.4. Head/Tail Breaks for Optimized Stratification
To integrate the three indicators for a comprehensive evaluation of surveillance allocation efficiency, we introduce the head/tail breaks method to implement optimized classification/stratification for them. In brief, head/tail breaks is initially developed to classify heavy-tailed distributed data [32]. Here, a heavy-tailed distribution exhibits an obvious imbalance between the head and tail, indicating an extremely right-skewed distribution with far more small values in the tail than large values in the head. In consideration of the coverage measures distributed in populated grids, for instance, there are far more low-coverage grids than high-coverage ones; thus, the coverage demonstrates a heavy-tailed distribution, and we can utilize head/tail breaks to facilitate the rapid data stratification and reveal its inherent hierarchical structure. By deriving strata based on the data’s own distributional property, head/tail breaks provide an objective basis for stratifying each indicator. This objectivity is crucial when later integrating the three indicators via set rules, as it minimizes subjective bias in threshold selection that could affect the final efficiency classification.
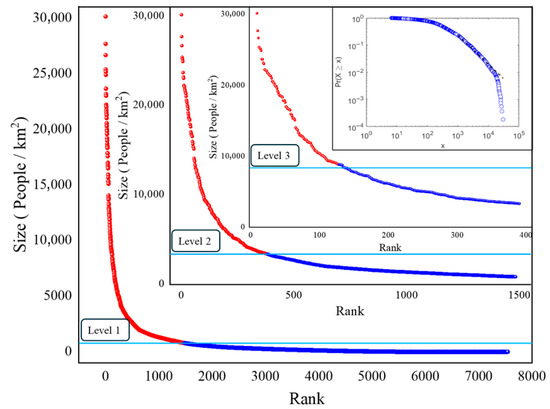
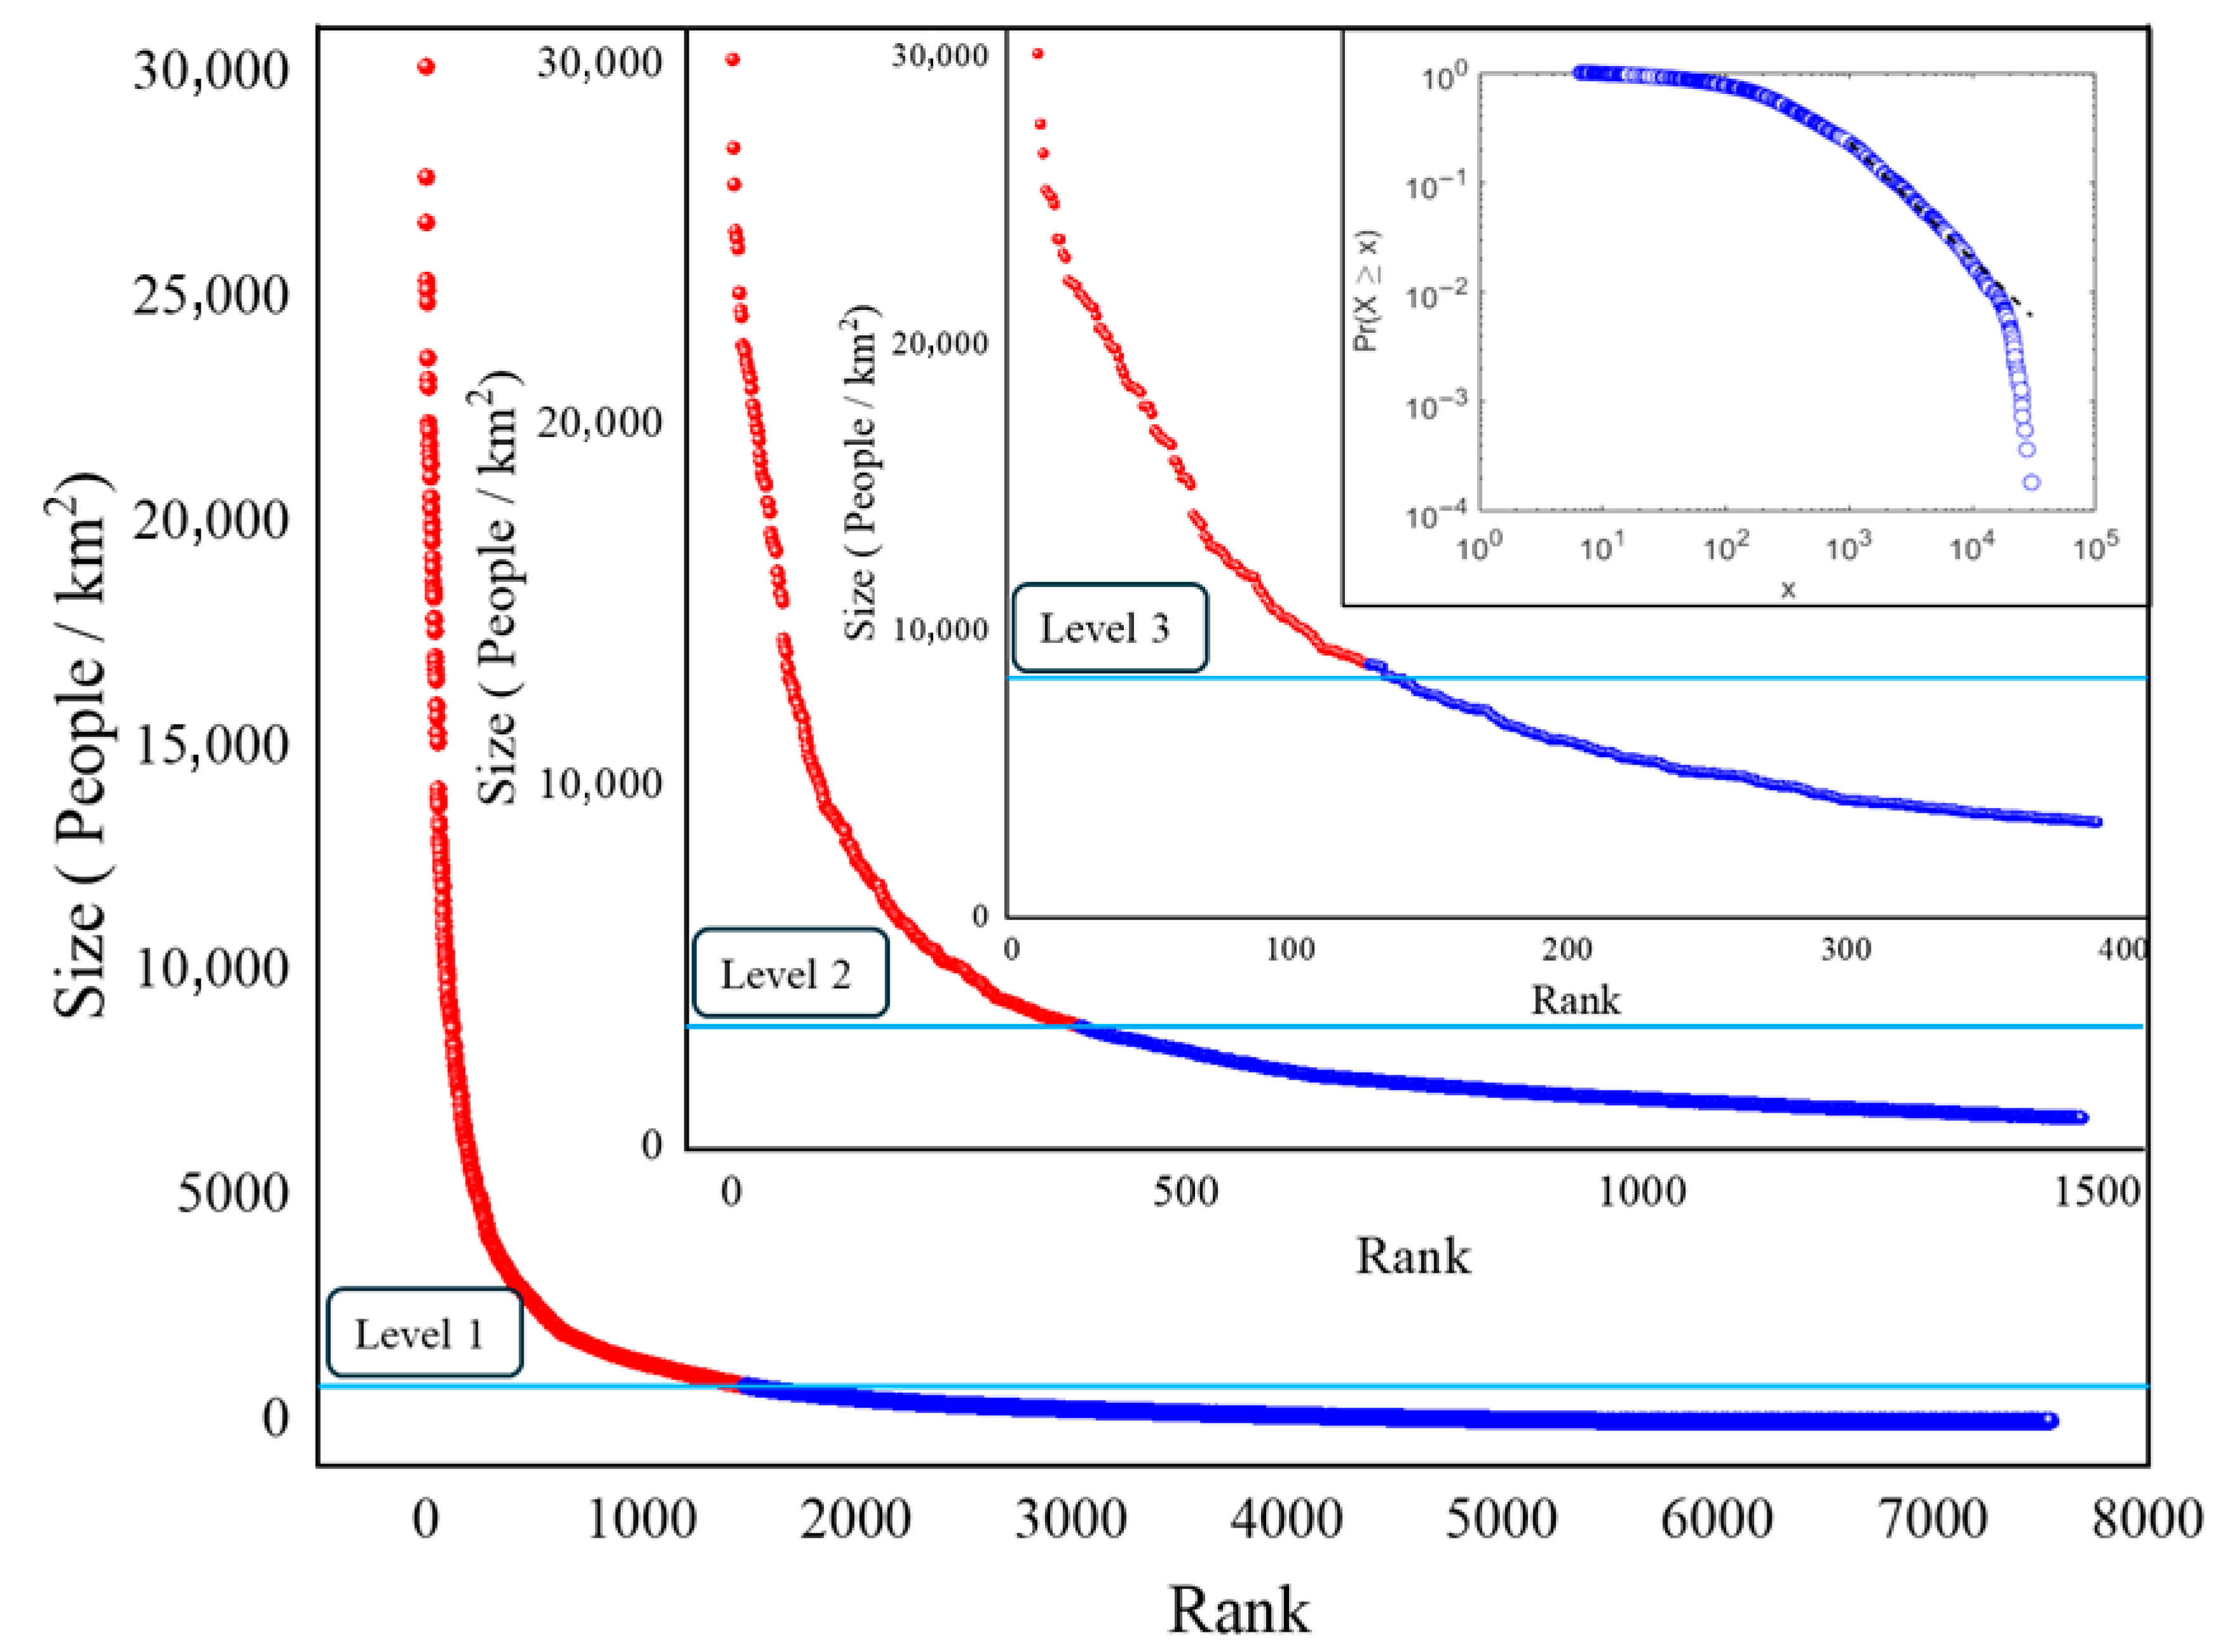
In essence, head/tail breaks is a recursive function that iteratively partitions the data into head and tail parts using the arithmetic mean. The partitioning process continues until the head violates the notion of far more smalls than larges. Let us illustrate the head/tail breaks process using the gridded data of population density in Nanchang as an example. There are a total of 7529 population-density grids with a mean of 775.15 persons/km2 in the raw dataset. These grids can be partitioned into two parts: the head, which contains grids with values that exceed the mean, and the tail, which contains grids with values below the mean. The head part still exhibits a heavy-tailed distribution with the mean of 3314.53 persons/km2 and the partitioning continues to derive the head and tail parts. After the third process of partitioning, the generated head is no longer heavy-tailed distributed, and the partitioning terminates. The head/tail breaks process involves three partitioning iterations in total (Figure 2), with the populated grids being classified or stratified to generate a structural hierarchy comprising four levels or scales (level 0 is the raw data). The notion of far more small values than large ones recurs across different levels of the hierarchy (scaling law). The so-called hierarchy can be quantified by an index called ht-index, which is calculated as the number of recurring times plus one [33]. A higher ht-index measure signifies a more profound hierarchical structure or stronger spatial heterogeneity within the dataset.
Figure 2.
Nested rank-size plots indicating the hierarchical structure of the populated grids in Nanchang. The partitioning process is conducted using head/tail breaks. The ranks of grids based on the descending size are shown in x-axis and their sizes (i.e., population densities) are shown in y-axis. The horizontal blue line indicates the mean value for the partitioning at each level and the grids at the head parts are shown in red dots. The upper right panel shows the power-law fitting for the populated grids in double-logarithm coordinates.
It is beneficial to introduce head/tail breaks to implement the optimized stratification for the three evaluation indicators of public health surveillance allocation efficiency. Head/tail breaks is a population-based optimized stratification technique, capable of naturally determining the number of classes or strata; it can reveal the spatial structural hierarchy and scaling property of those evaluation indicators [34]. We utilize head/tail breaks to stratify the three evaluation indicators, respectively, and then implement a comprehensive evaluation for the overall surveillance allocation efficiency by integrating them.
2.5. Integrated Evaluation for Overall Efficiency
To evaluate the overall allocation efficiency of public health surveillance in an urban area, we can measure the spatial coverage, overlap, and accessibility indicators for all the study units (e.g., populated grids). Subsequently, their structural hierarchies can be generated using head/tail breaks, respectively. Note that the heads of the hierarchy are expected to represent the dominant components across levels or scales [34]. For instance, the heads at the first and second levels of the spatial-accessibility hierarchy represent its primary and secondary components, respectively.
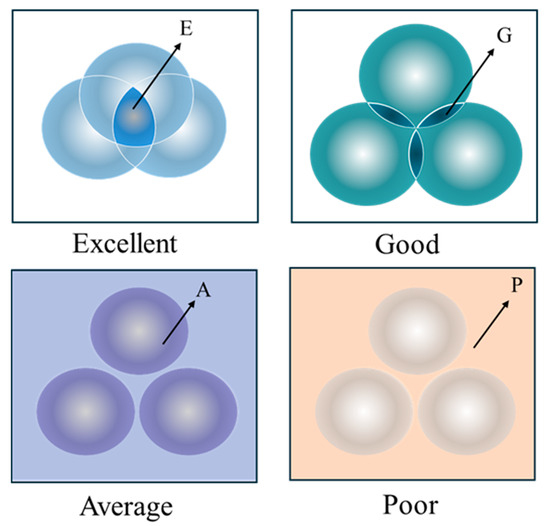
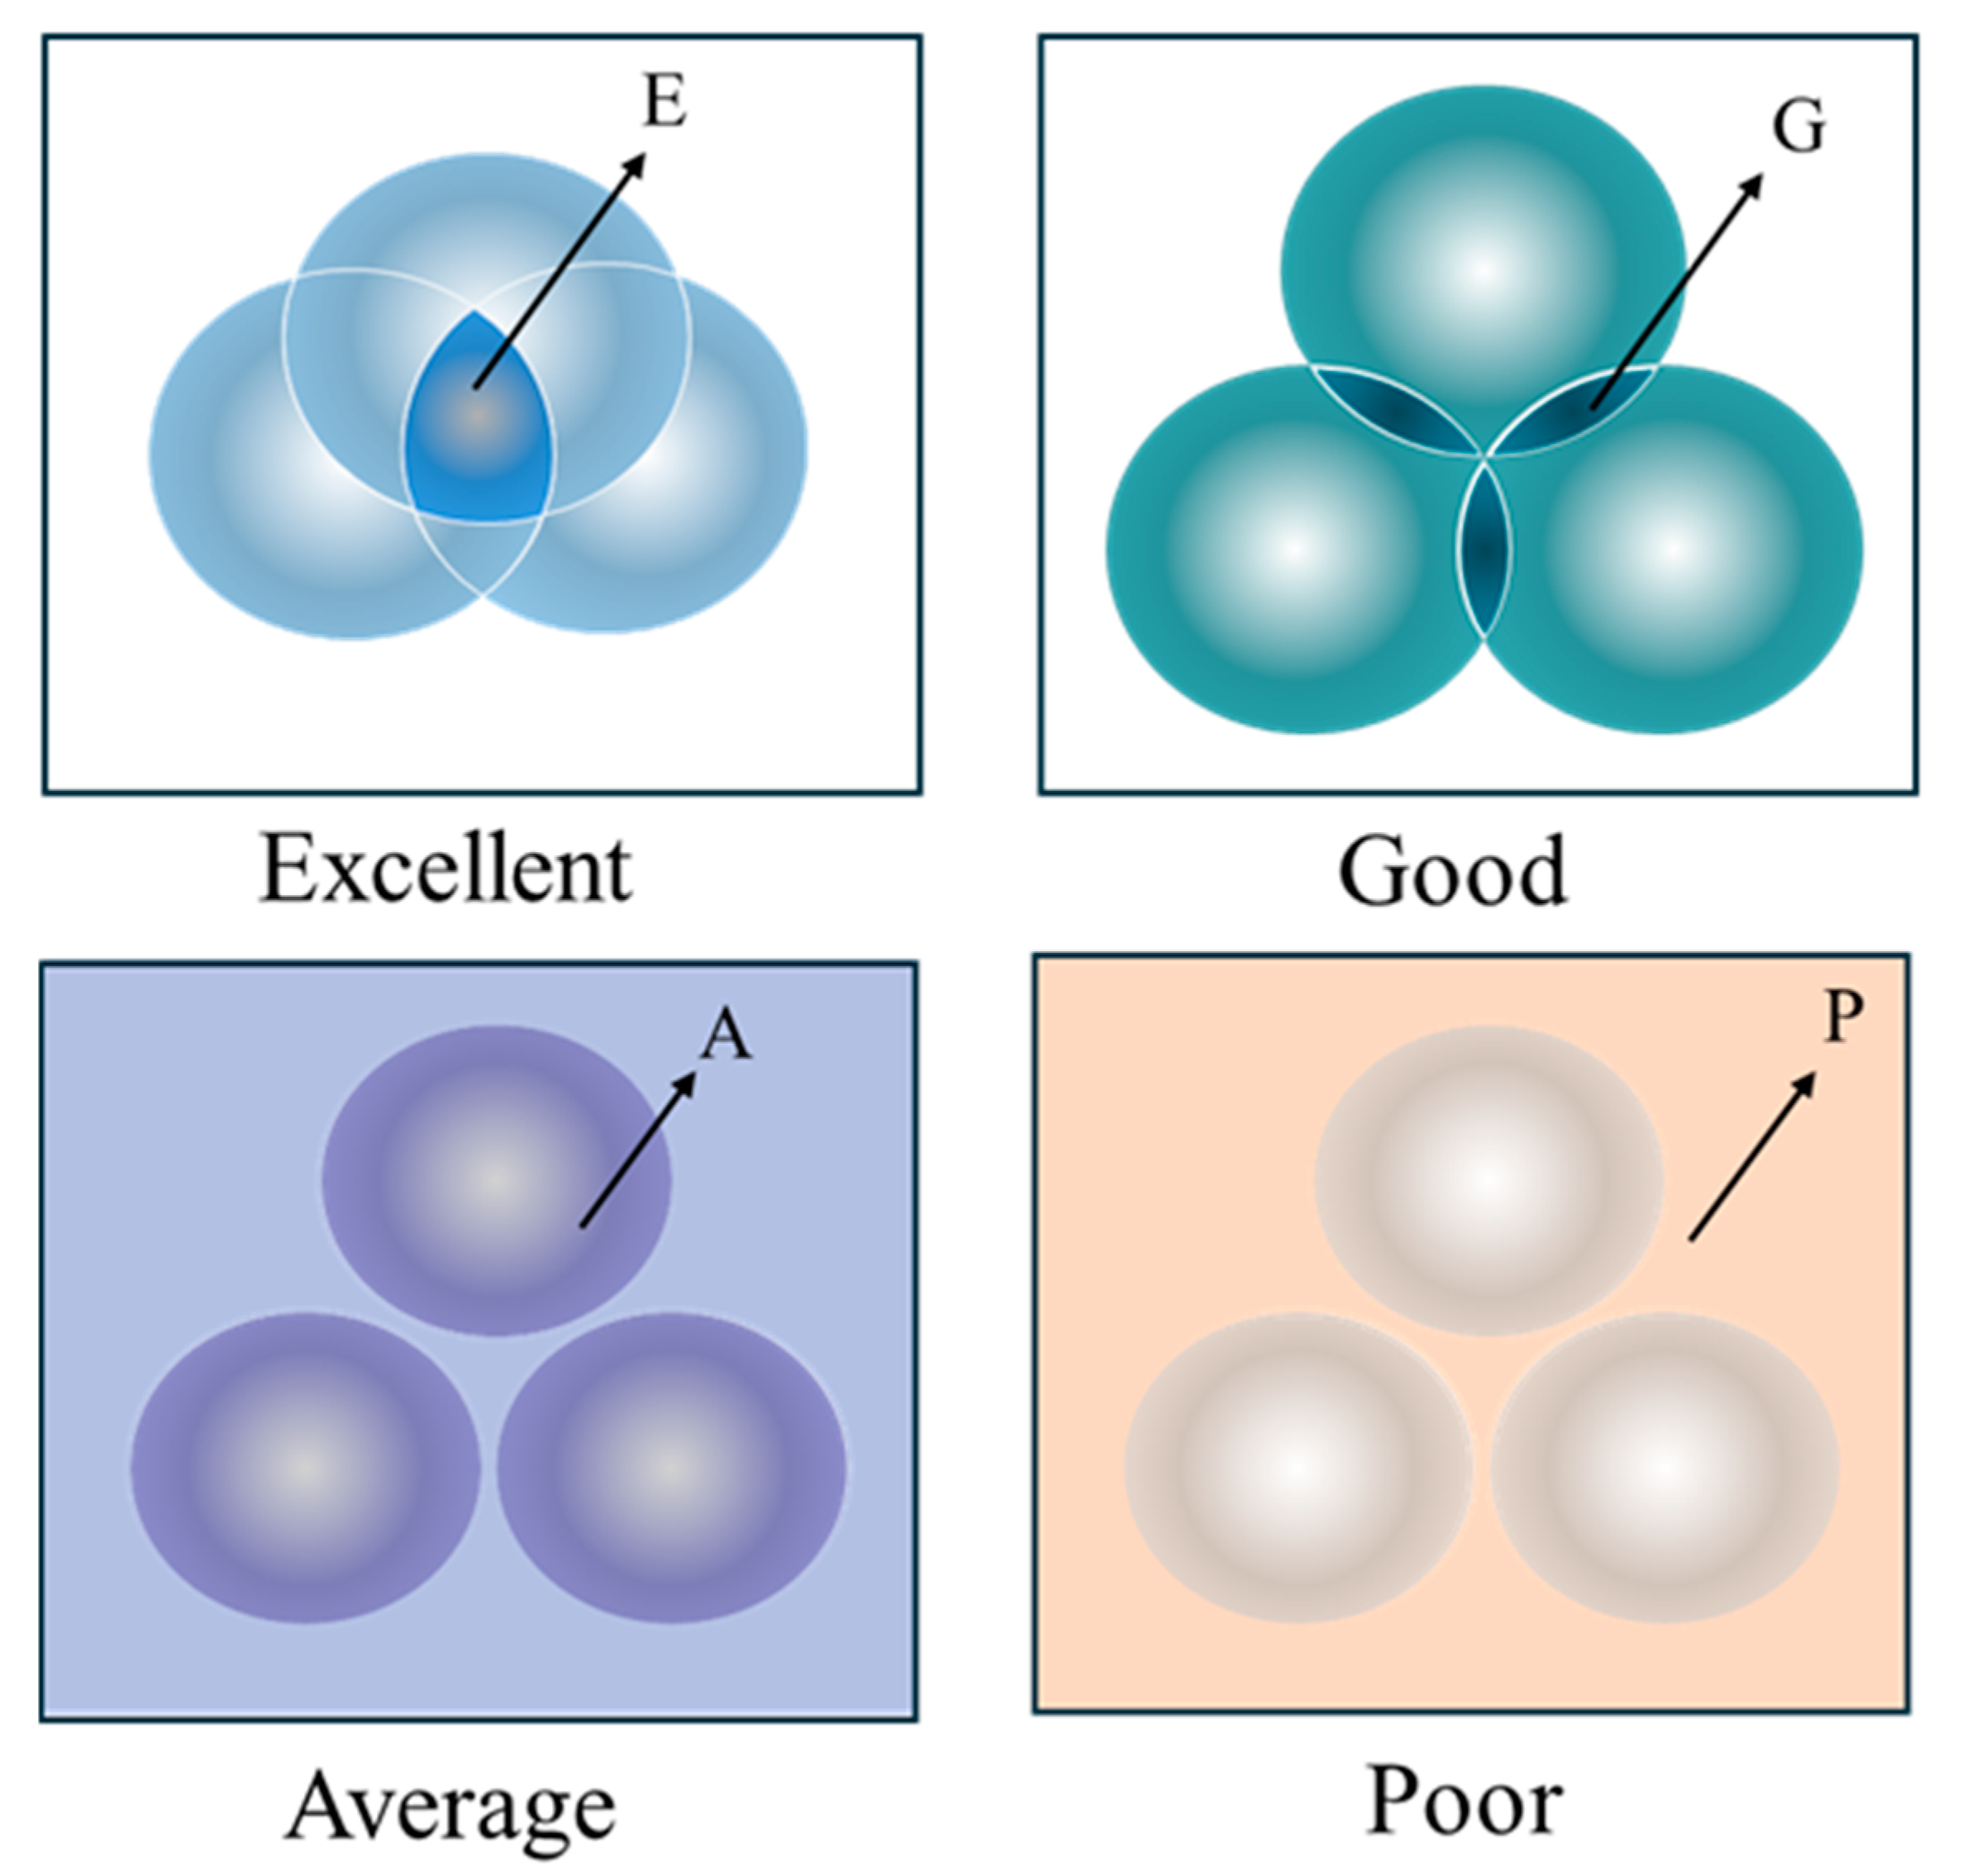
In this study, the focus is on the heads at the highest levels of the respective hierarchies, indicating the highest-coverage units, the lowest-overlap ones, and the highest-accessibility ones. We integrate the three evaluation indicators to assess the overall efficiency of surveillance site placements. As demonstrated in Figure 3, the intersection of three heads at the highest levels of their hierarchies indicates the study units with an “Excellent” level of urban public health surveillance, and the intersection of any two out of three highest heads represents the units with a “Good” level. Similarly, any one out of three highest heads are identified as the units with an “Average” level, whereas the remaining units are at a “Poor” level of surveillance. There are a total of four levels/categories of public health surveillance identified for all the study units by integrating the coverage, overlap, and accessibility indicators. We can implement a comprehensive evaluation of the overall allocation efficiency of urban public health surveillance and provide support for strategies to adjust and optimize surveillance site allocations.
Figure 3.
Illustration of the integrated evaluation for the overall allocation efficiency of public health surveillance.
3. Case Study and Results
3.1. Data Sources and Experimental Setup
We utilized the efficiency evaluation of nucleic acid testing sites in Nanchang during the epidemic as an empirical case study. Nanchang, the capital of Jiangxi Province and a pivotal central city in the middle reaches of the Yangtze River, experienced two primary outbreaks of the epidemic in early 2020 and Spring 2022. The proposed method was utilized to investigate the placement efficiency of nucleic acid testing sites, which served as a representative case example for examining the capacity of urban public health surveillance in major Chinese cities. We collected the data of nucleic acid testing sites in Nanchang in April 2022, including their geographical locations, the number of testing consoles, and the number of tests conducted, from the Jiangxi Provincial Health Commission, the Nanchang Municipal Health Commission, and the Nanchang Center for Disease Control and Prevention. The final dataset of nucleic acid testing sites was comparatively verified for accuracy through publicly available news and media sources.
The populated grids were recognized as the study units serviced by surveillance sites (i.e., nucleic acid testing sites). The gridded population distribution data in Nanchang were sourced from WorldPop.org and record the total numbers of persons in grids or pixels with a spatial resolution of 100 m. We further calibrated these populated grids with the Seventh National Population Census data to generate the study units serviced in this case example (a total of 7529 grids with a resolution of 1 km). Furthermore, the road data were sourced from OpenStreetMap.org, encompassing various categories of urban and rural roads, and were utilized to generate the transportation network dataset of Nanchang in 2022.
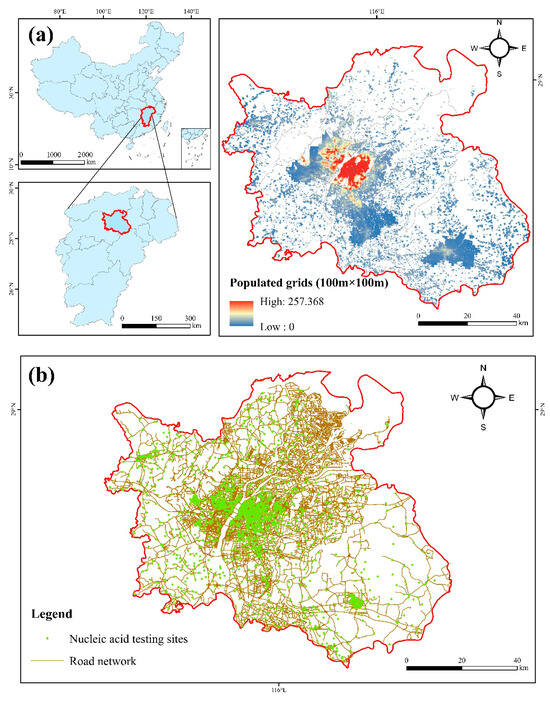
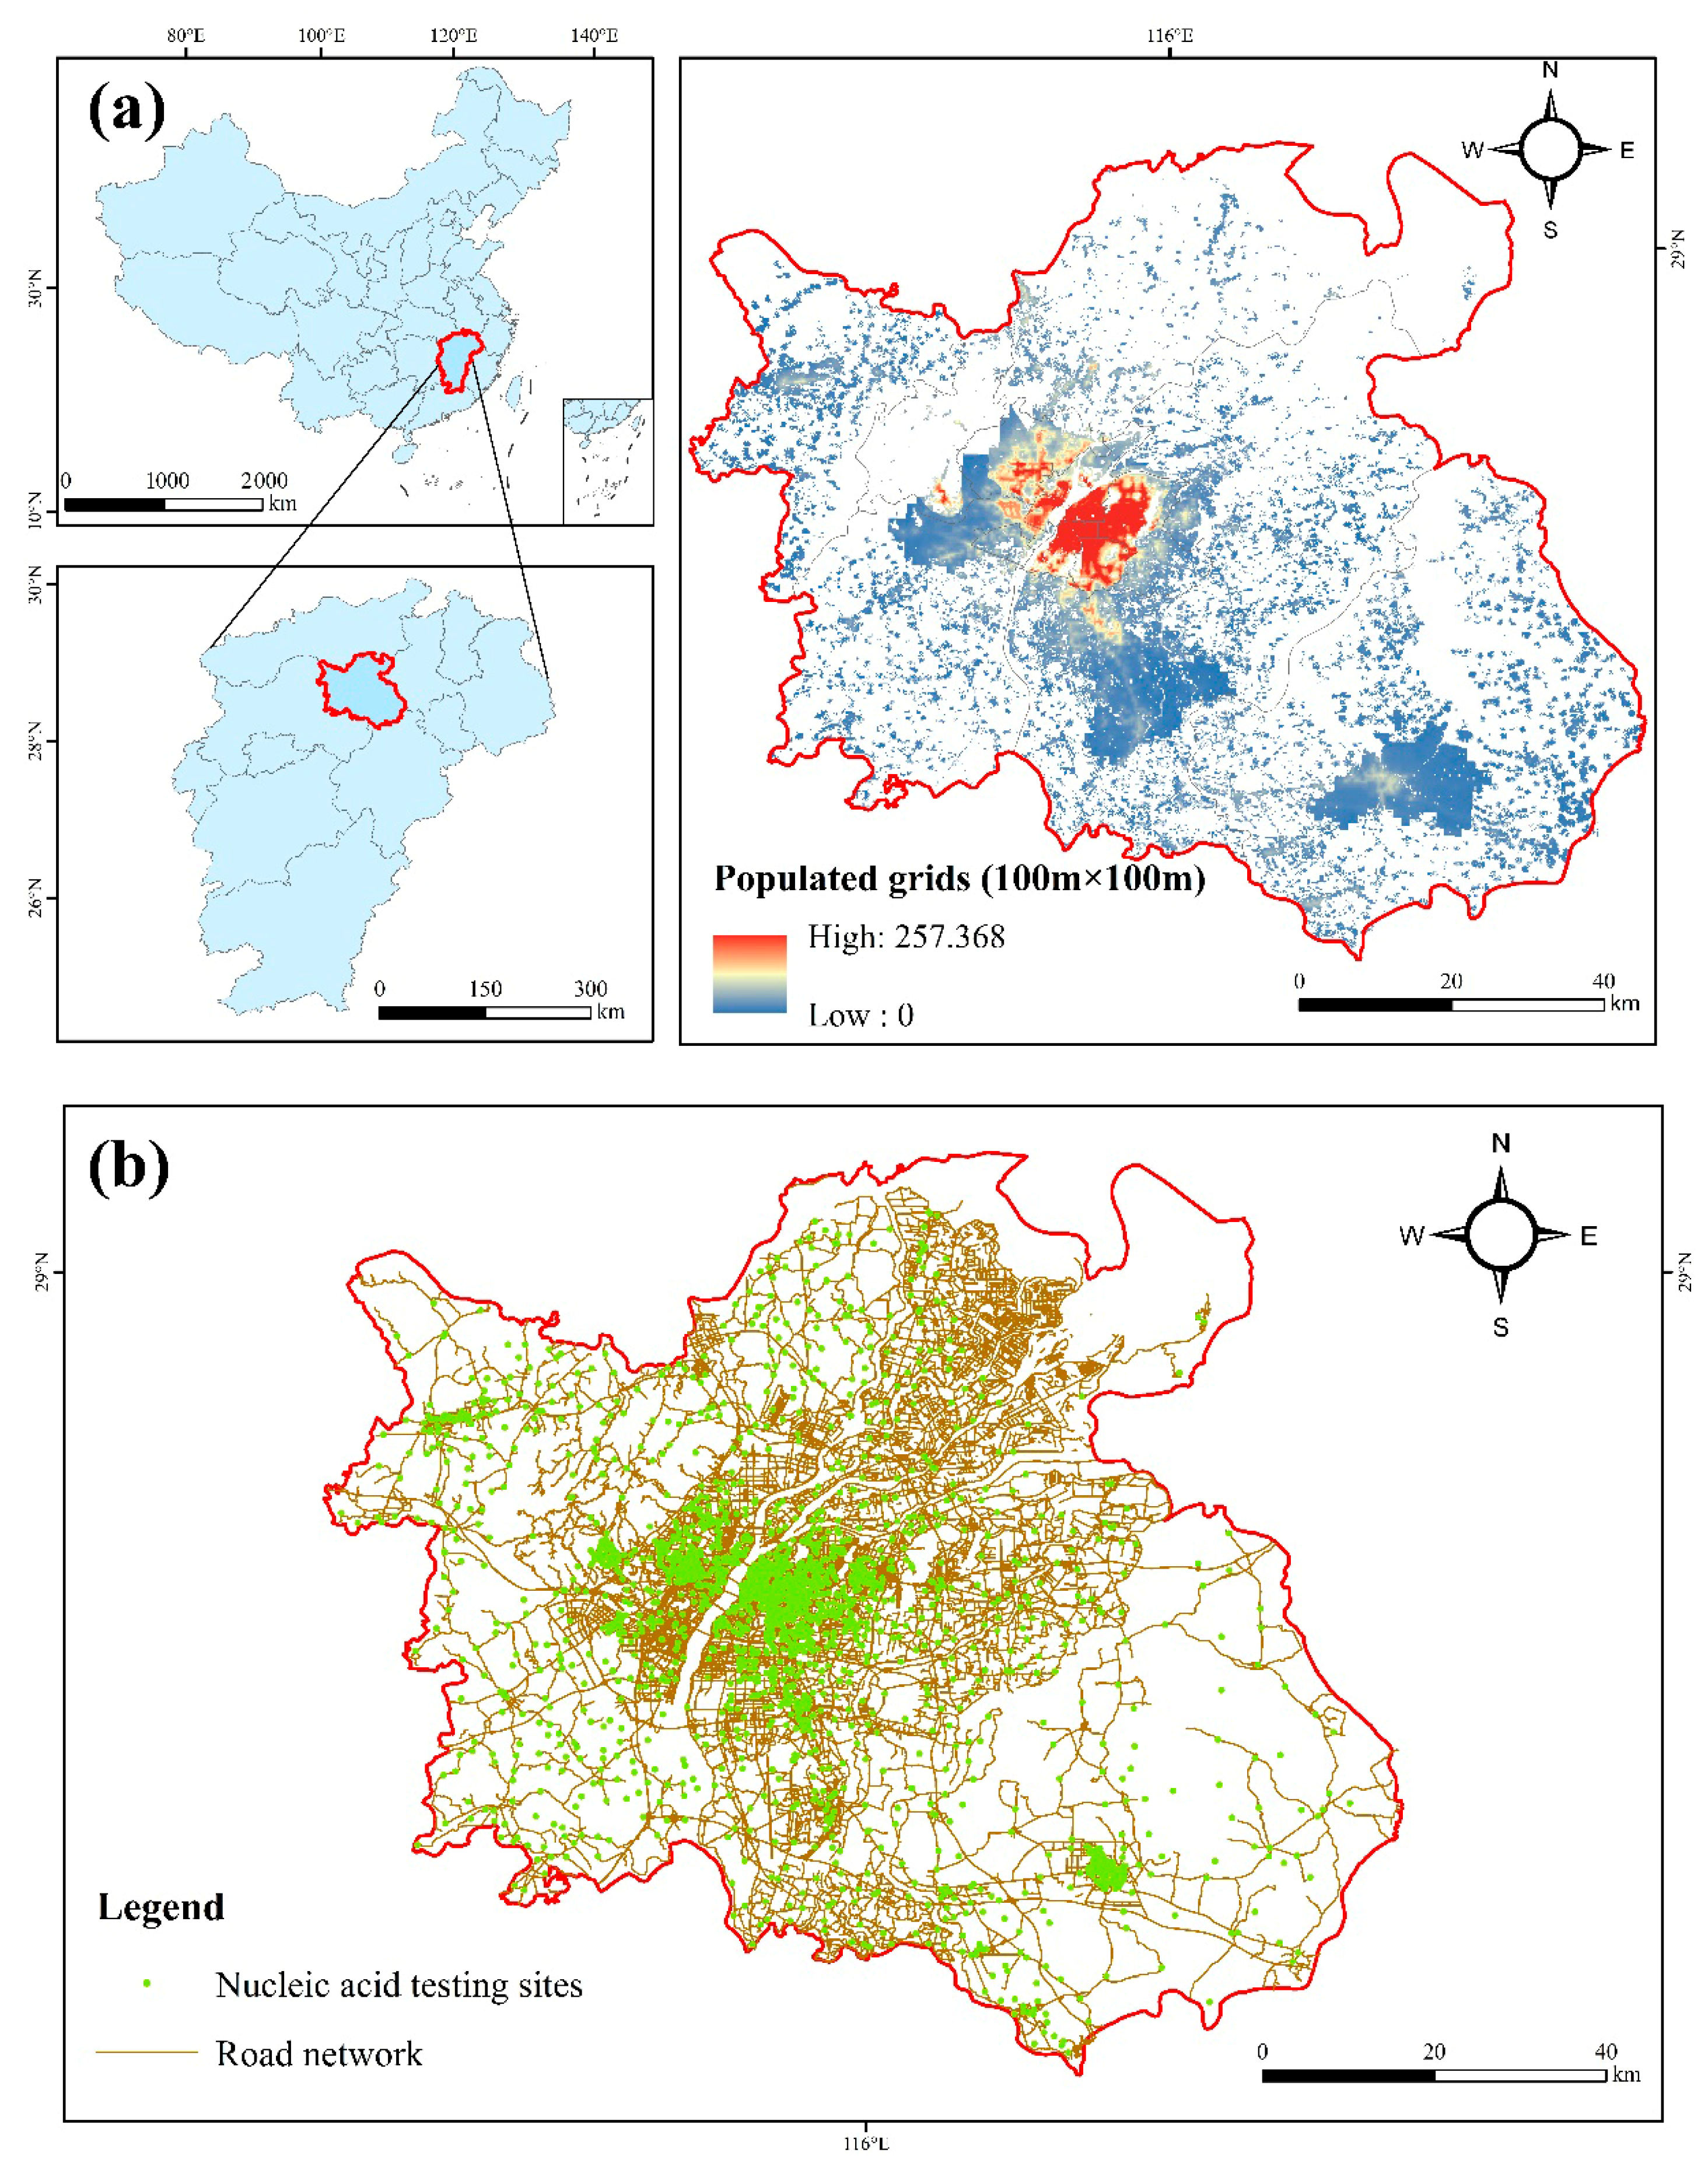
As illustrated in Figure 4, a total of 2797 nucleic acid testing sites were identified in Nanchang on a single day in April 2022, with the majority located within the central urban area. The testing sites were equipped with a varying number of testing consoles, indicative of their respective surveillance supply capacities (averaging approximately three consoles). They provided a daily total of over five million nucleic acid tests for the population in Nanchang. In relation to the populated grids serviced by these supply facilities, an acceptable walking speed of 5 km/h was employed to calculate the pedestrian travel time through road network. The selection of a pedestrian-based network was primarily motivated by the context of emergency testing during lockdown or restricted mobility periods in Nanchang, where walking was often the primary mode for accessing local sites. Furthermore, the spatial coverage, overlap, and accessibility indicators were examined, respectively, based on two service radii of 15 and 30 min. The three evaluation indicators were naturally stratified using head/tail breaks and were ultimately integrated to form an evaluation of the overall allocation efficiency of nucleic acid testing sites.
Figure 4.
Geographical location of Nanchang City in central China (a) and the nucleic acid testing sites in April 2022 during the epidemic (b).
3.2. Evaluations of Spatial Coverage and Overlap in Populated Grids
The spatial coverage and overlap indicators were calculated in populated grids using the improved coverage model (SFSAC). The two indicators demonstrated a substantial heavy-tailed distribution based on two service radii of 15 and 30 min. There were far more low-coverage grids than high-coverage ones, whereas there were far more high-overlap grids than low-overlap ones. Note that the overlap indicator estimated in grids was still heavy-tailed distributed when the concepts of the head and tail were exchanged, and the head/tail breaks process remained applicable [34].
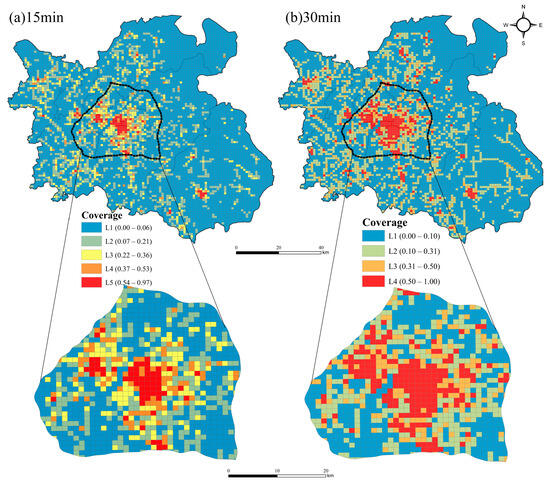
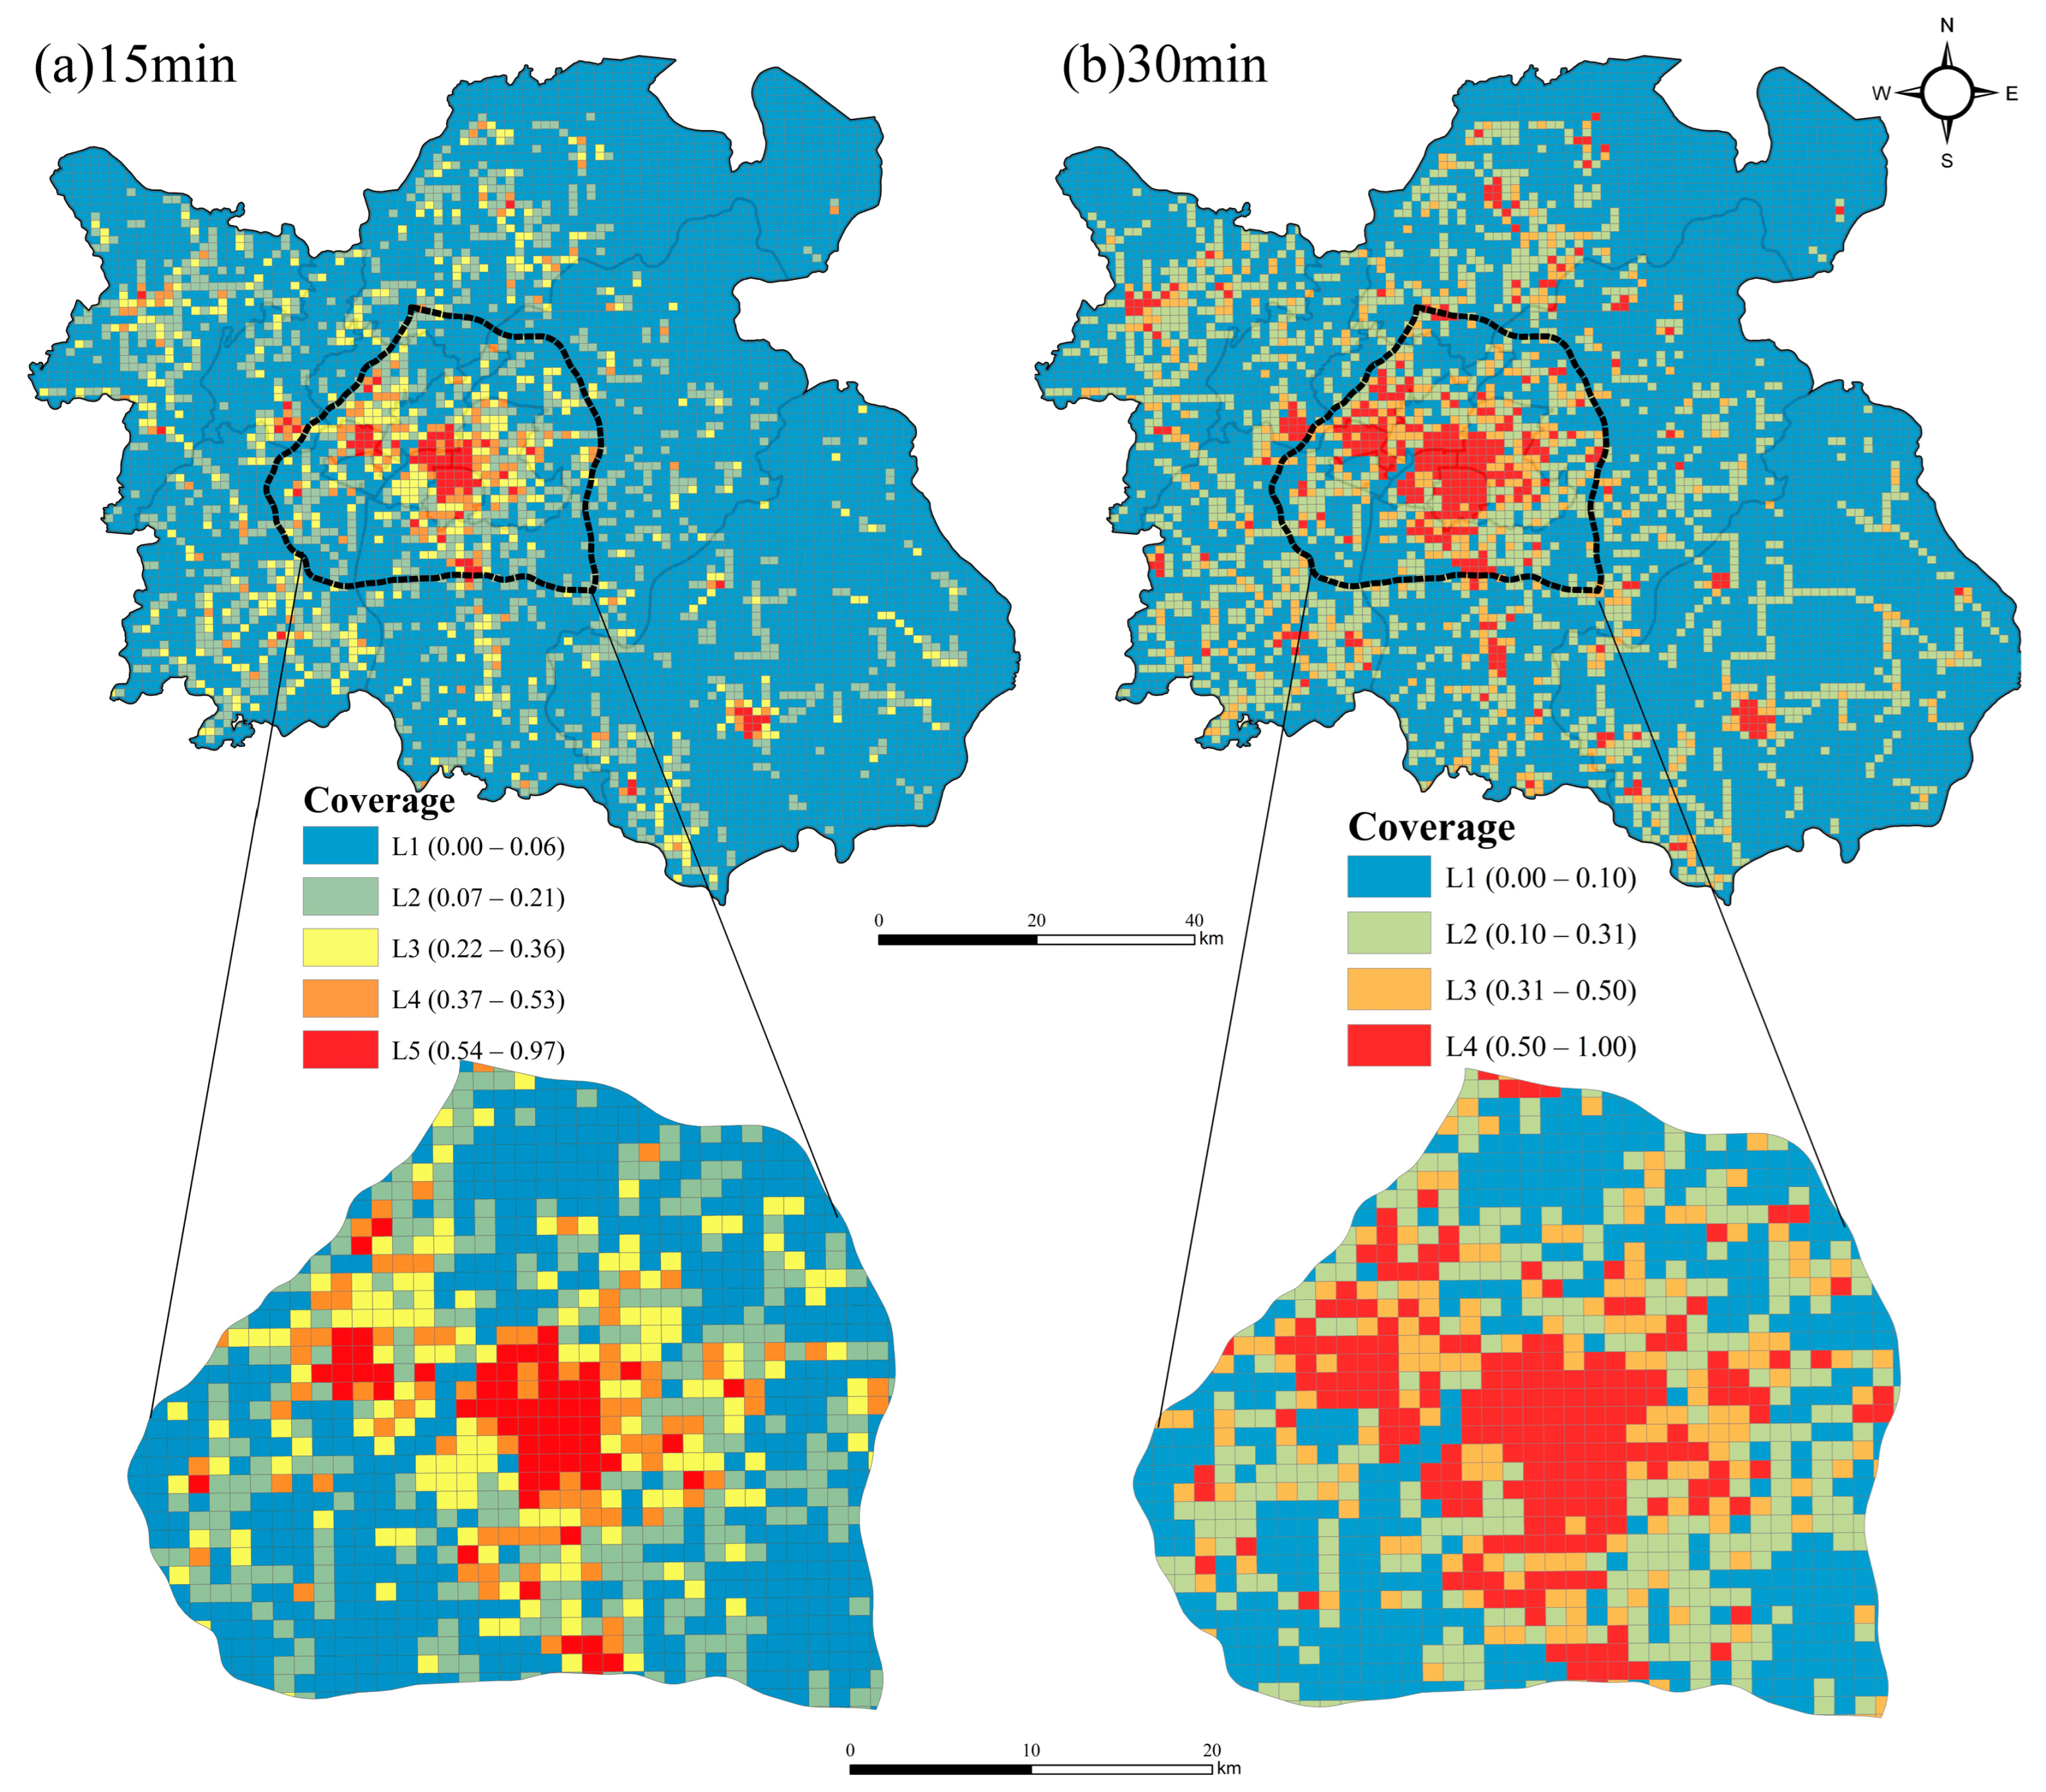
Specifically, the coverage indicator estimated in grids was characterized by a total of five and four hierarchical levels using head/tail breaks, based on two service radii of 15 and 30 min, respectively. That is to say, the partitioning process recurred four and three times (ht-index = 5 and ht-index = 4, respectively). As shown in Table 1, the 15-min coverage grids were stratified into five categories: L1 (0.00–0.06), L2 (0.06–0.21), L3 (0.21–0.36), L4 (0.36–0.53), and L5 (0.53–1.00); and the 30-min coverage grids had four categories: L1 (0.00–0.10), L2 (0.10–0.31), L3 (0.32–0.50), and L4 (0.50–1.00). Following the scaling law, there are far more low-coverage grids than high-coverage ones from the bottom levels to the top. Concurrently, the grids at each level of the hierarchy exhibit approximate similarity in coverage. In general, the spatial coverage in populated grids exhibits a decreasing trend from central urban areas to surrounding towns (Figure 5), indicating clear hierarchical and regional disparities. The majority of central urban grids demonstrated higher levels of coverage in comparison to those in surrounding rural areas. The augmentation of service radius contributed to the increase in high-coverage grids, especially within central urban areas (see the bottom panels in Figure 5). However, the 15-min coverage grids exhibited slightly stronger spatial heterogeneity or greater complexity, with a structural hierarchy of more levels than that of the 30-min coverage grids.
Table 1.
Head/tail breaks statistics for the stratification of coverage indicators.
Figure 5.
Spatial coverage in populated grids serviced by nucleic acid testing sites based on two service radii: (a) 15 min; and (b) 30 min. Note that the bottom panels illustrate the zoom-in layouts of central urban areas in Nanchang, and the visualization of thematic mapping in Figure 5, Figure 6 and Figure 7 is based on the stratification by head/tail breaks.
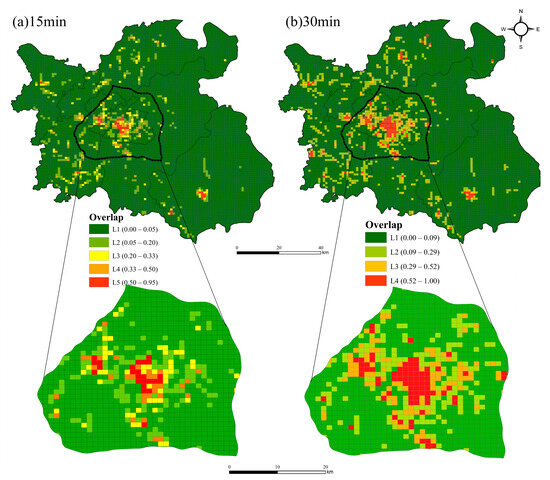
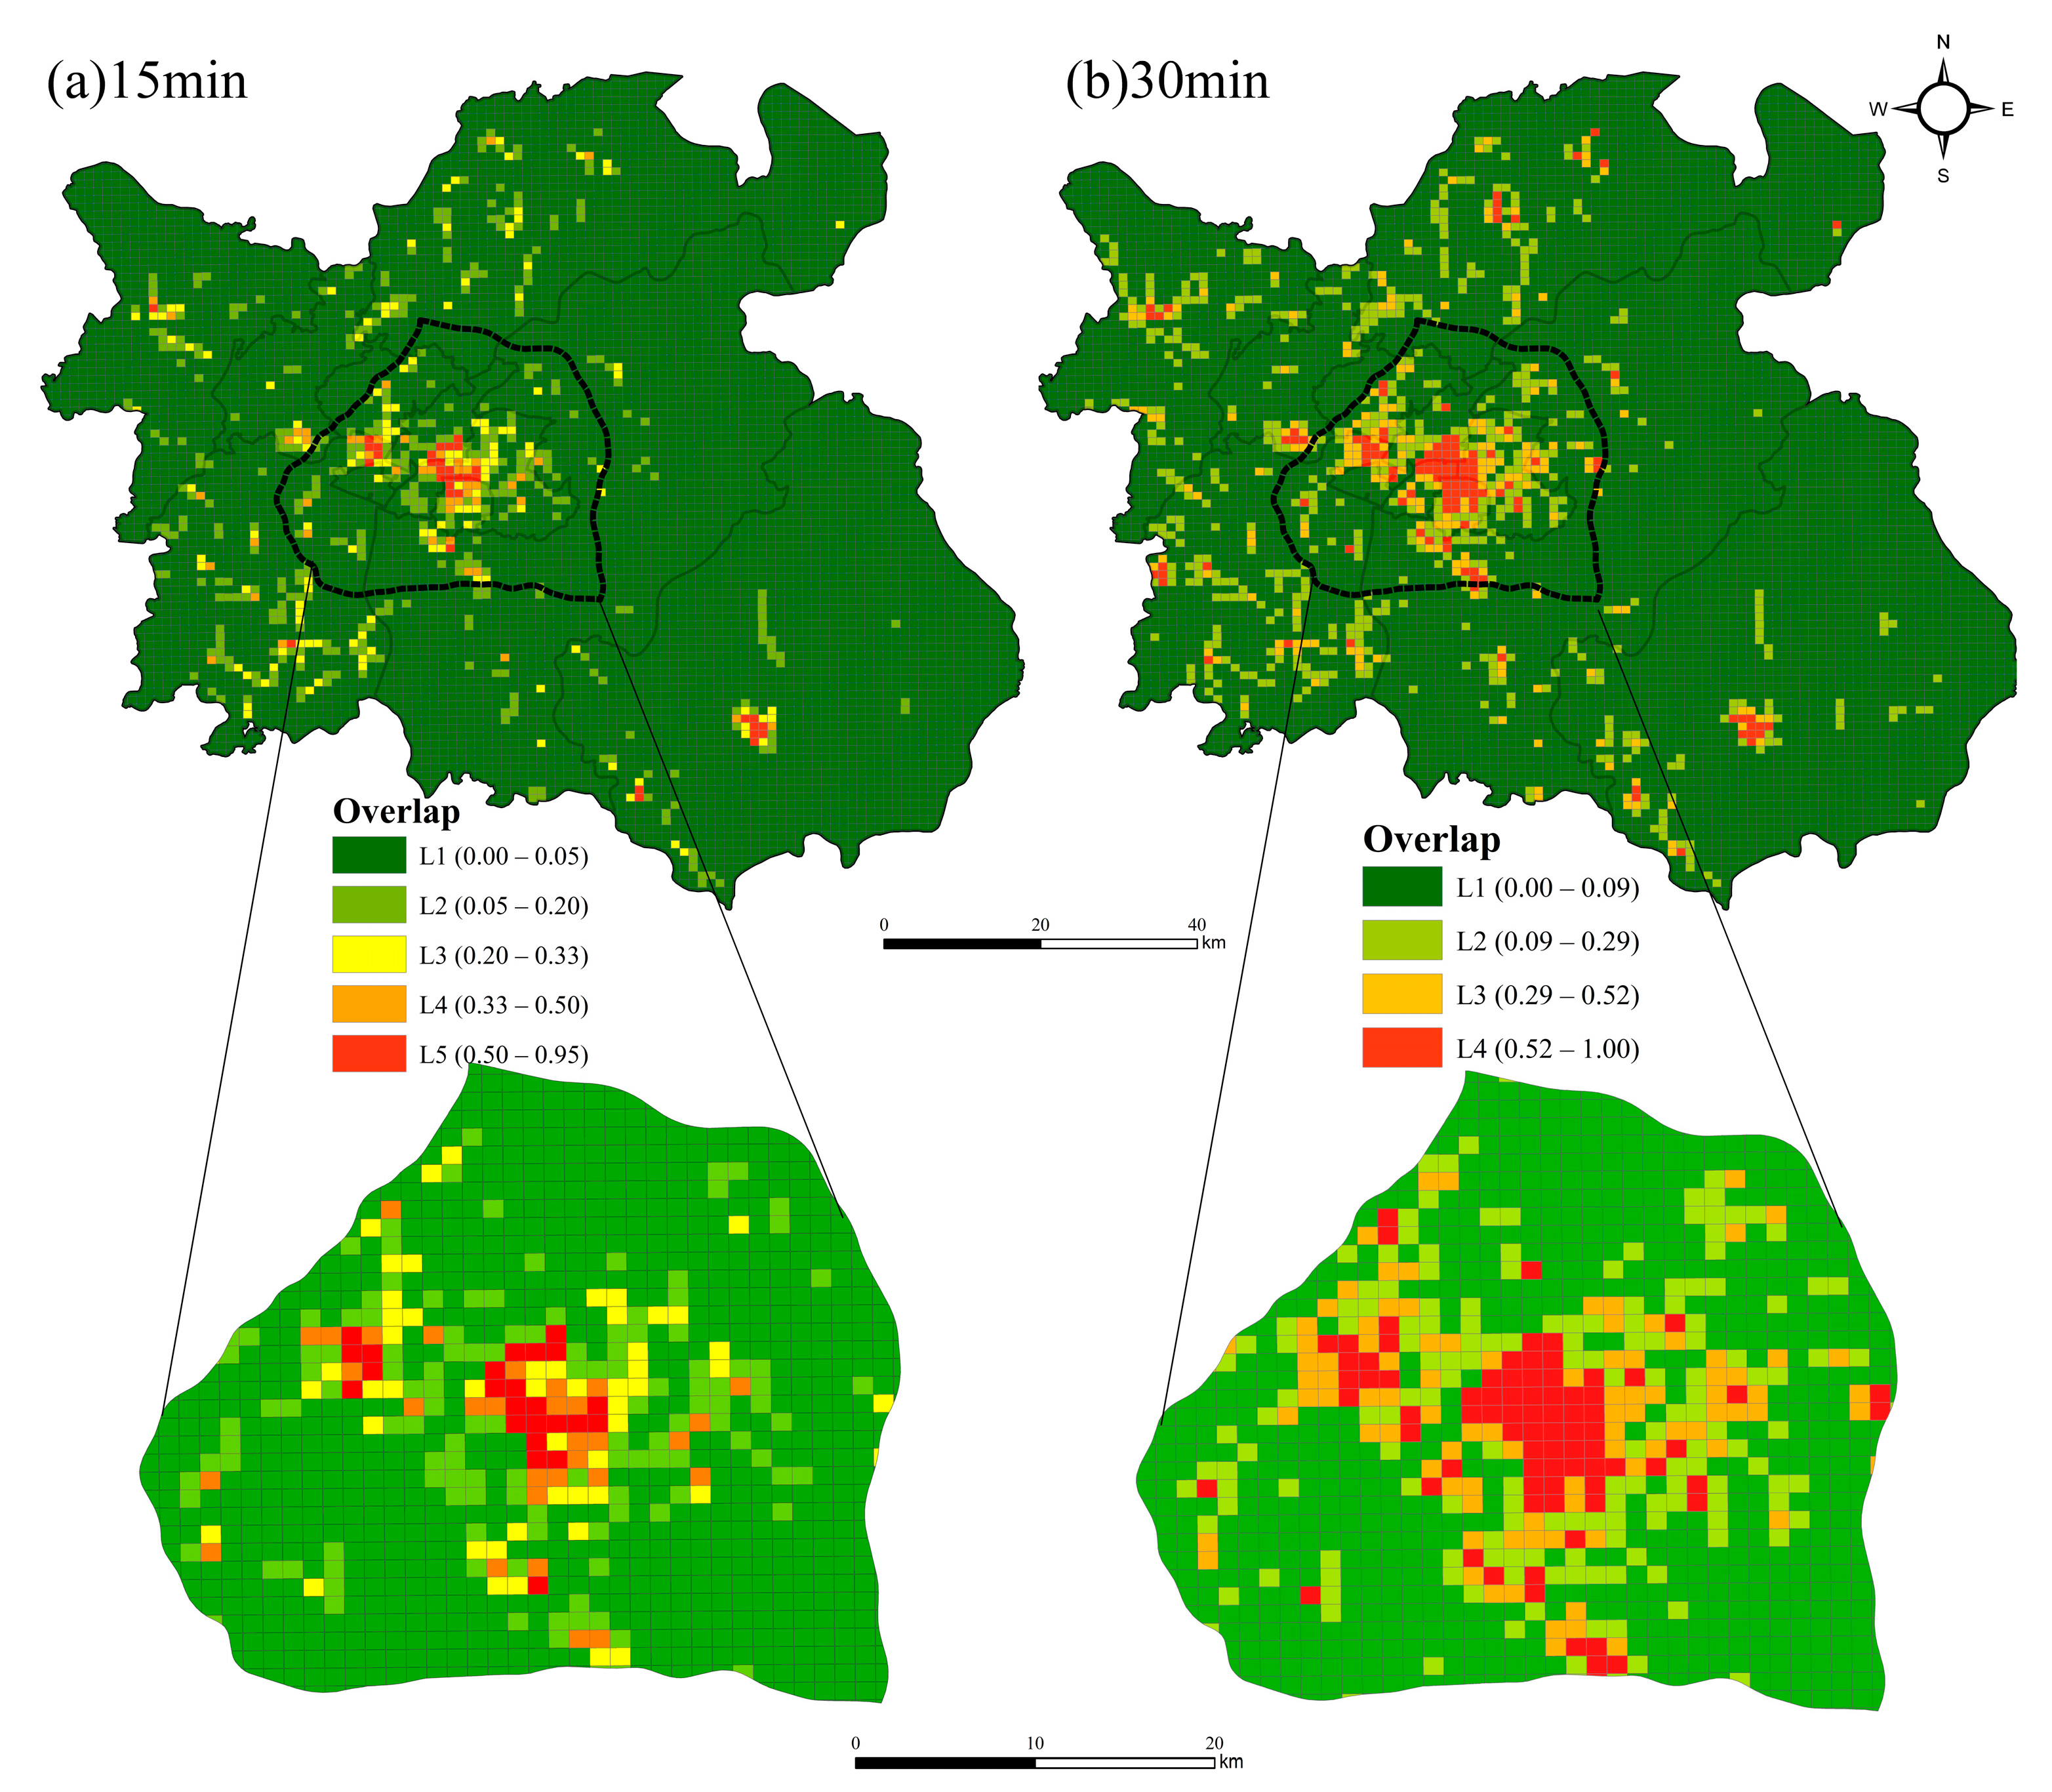
The populated grids with no service coverage (i.e., with a coverage estimate of 0) were excluded for the calculation of the overlap indicator. Based on two service radii, there were 2811 and 3357 grids remaining for the overlap measurement, respectively. A total of four and three iterations of partitioning process were conducted for the 15-min and 30-min overlap grids (Table 2). They were characterized by a structural hierarchy of five and four levels (ht-index = 5 and ht-index = 4, respectively). The 15-min overlap grids were stratified into five categories: L1 (0.00–0.05), L2 (0.05–0.20), L3 (0.20–0.33), L4 (0.33–0.50), and L5 (0.50–0.95); and the 30-min overlap grids had four categories: L1 (0.00–0.09), L2 (0.09–0.29), L3 (0.29–0.52), and L4 (0.52–1.00). Similarly, a smaller service radius generated a hierarchy of more levels for the overlap in grids, indicating stronger spatial heterogeneity or greater complexity. The augmentation of service radius contributed to the increase in high-overlap grids in central urban areas, where a number of grids exhibit an overlap value approaching 1 (Figure 6). This might be primarily attributed by the dense allocation of testing sites in central urban areas, resulting in considerable overlap between service zones and inefficiencies in resource allocation. In general, the overlap in grids exhibits significant hierarchical structures and regional disparities similar to the coverage; however, it is imperative to balance the increases in coverage and overlap caused by the dense site allocation and augmentation of service radius.
Table 2.
Head/tail breaks statistics for the stratification of overlap indicators.
Figure 6.
Spatial overlap in populated grids serviced by nucleic acid testing sites based on two service radii: (a) 15 min; and (b) 30 min.
3.3. Evaluation of Spatial Accessibility in Populated Grids
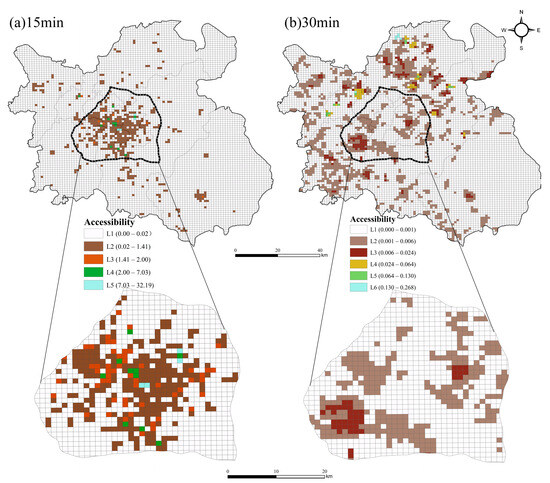
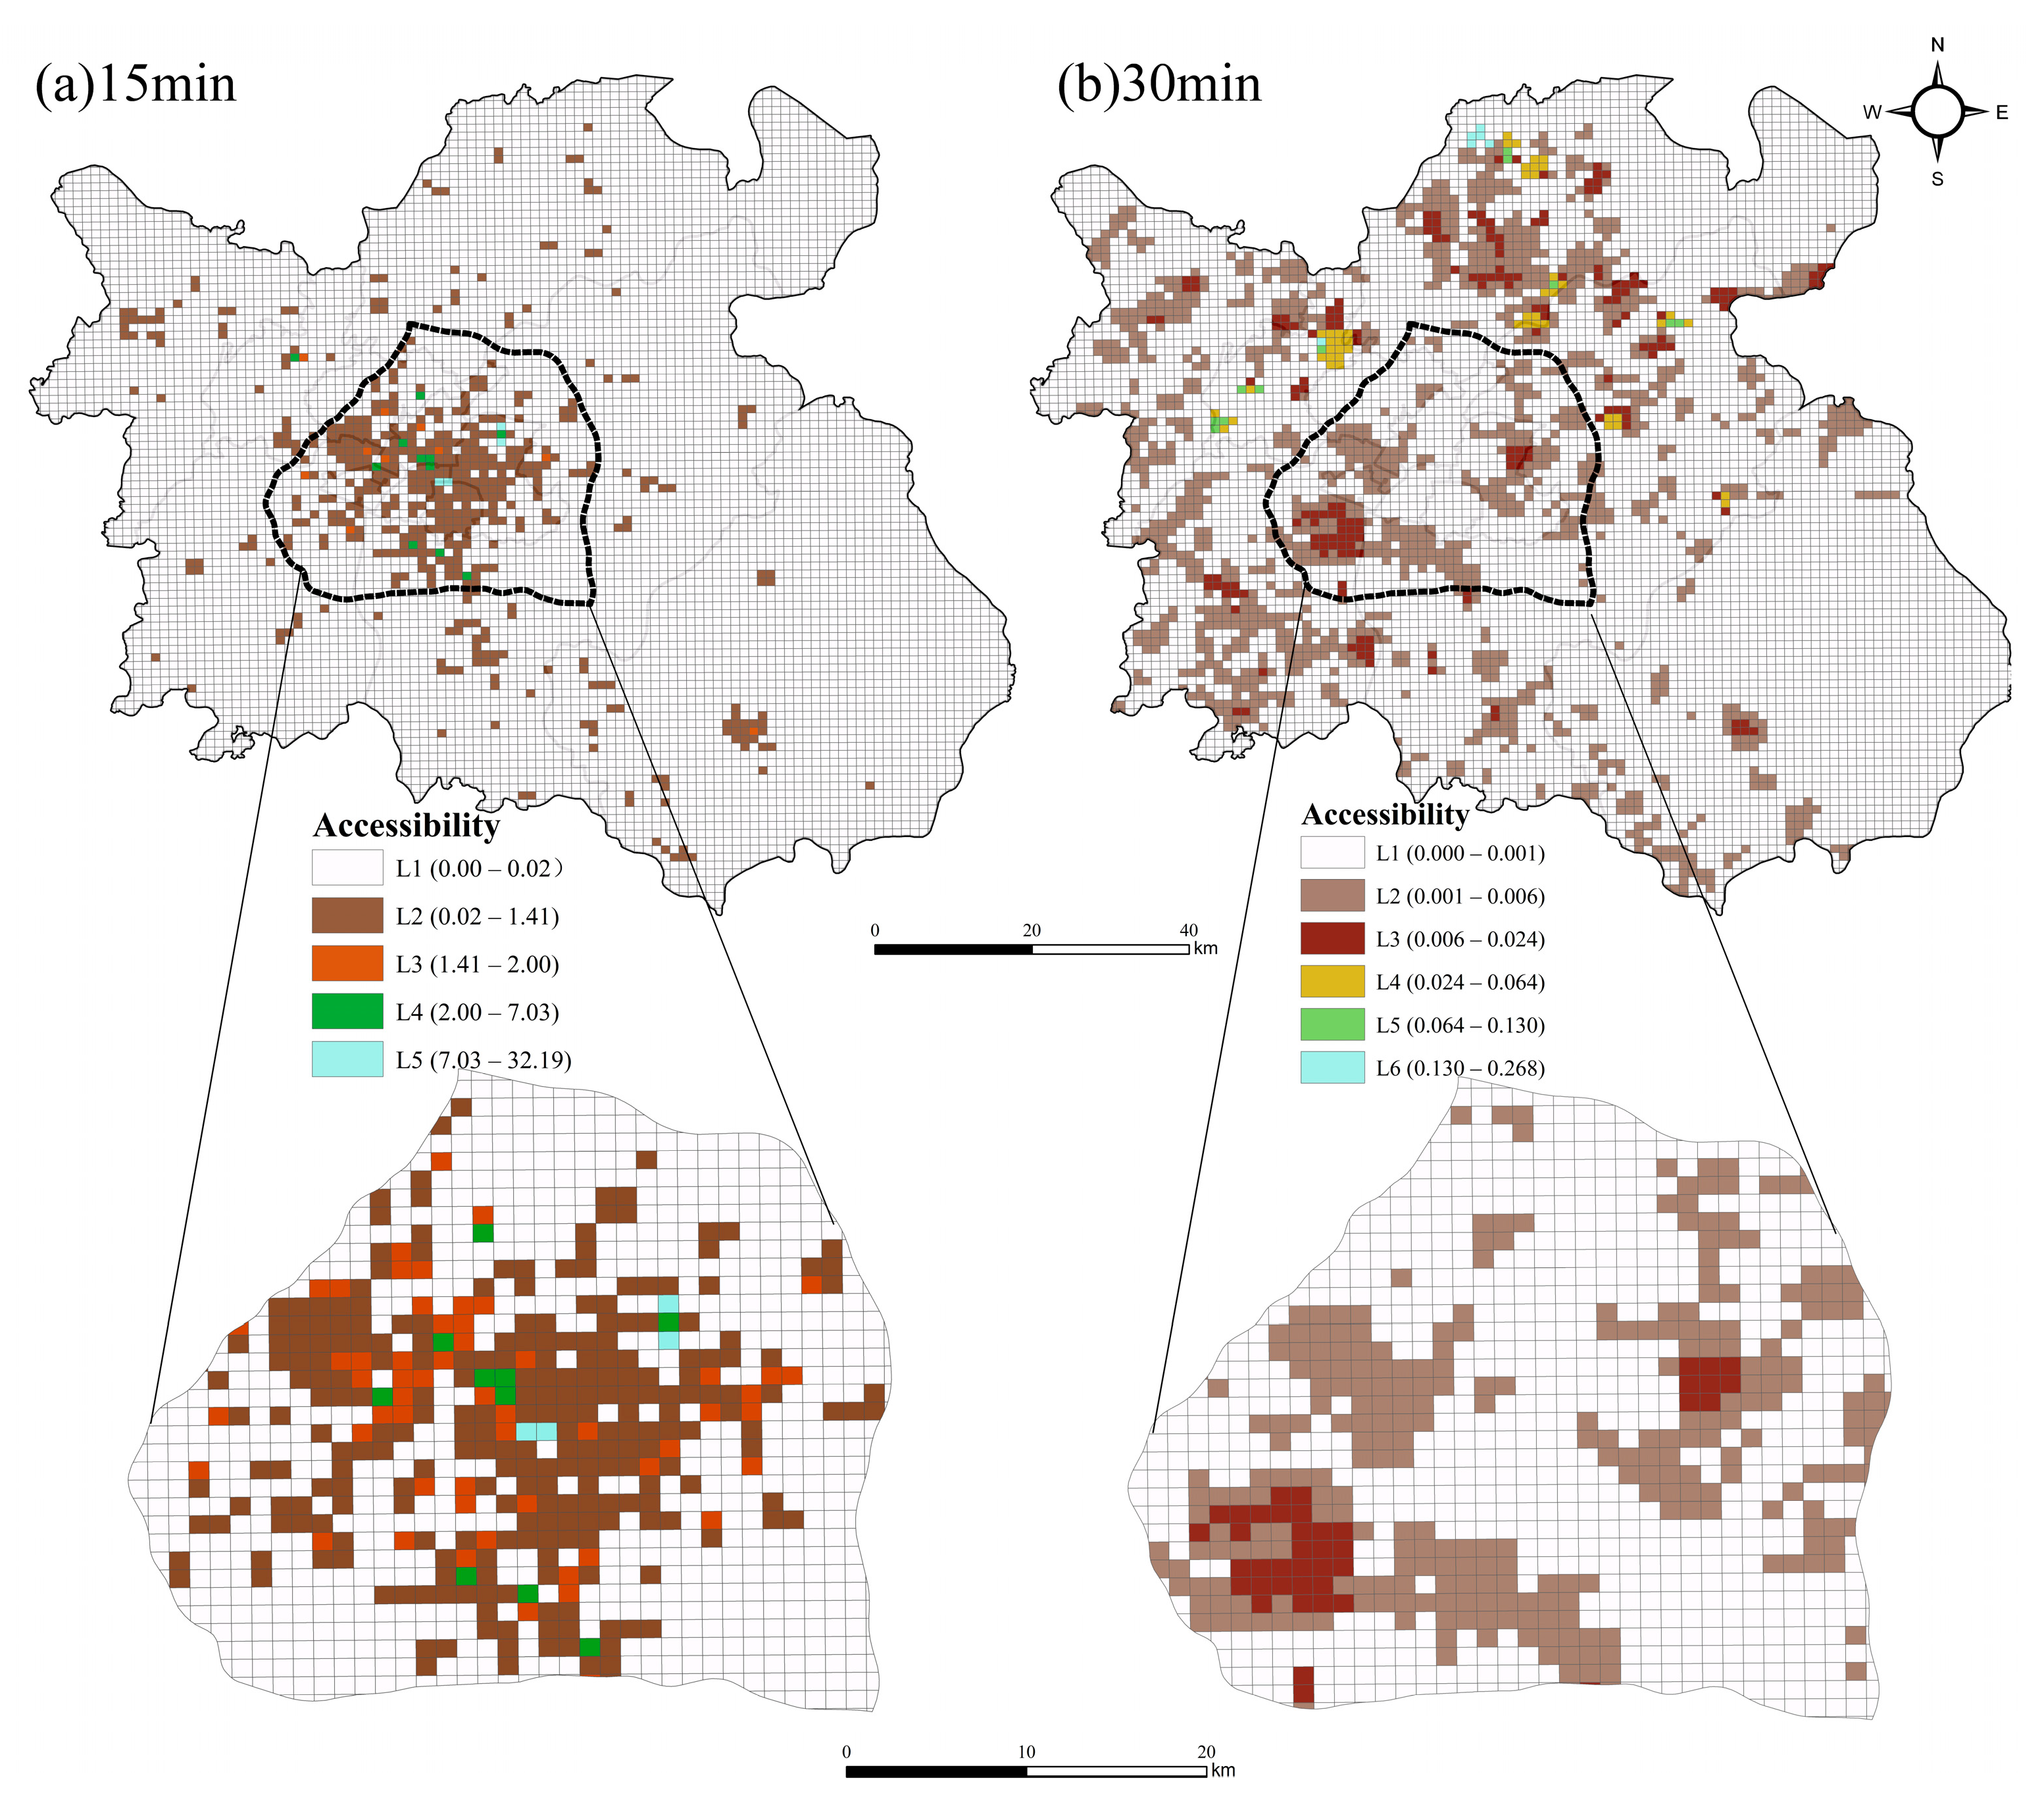
We further utilized the Ga-2SFCA method to investigate the spatial accessibility for populated grids to nucleic acid testing sites. Here, two service radii of 15 and 30 min were applied to calculate the distances between demand units (i.e., populated grids) and supply facilities (i.e., testing sites), respectively. The quantity of testing consoles was used as a metric to represent the service capacity of each testing site, thereby facilitating the calculation of its supply-demand ratio. The accessibility indicator in grids exhibited a clear heavy-tailed distribution based on two service radii, and there were far more low-value accessibility grids than high-value accessibility ones. The partitioning process of head/tail breaks recurred four and five times (ht-index = 5 and ht-index = 6, respectively), and the accessibility indicator can be characterized by a total of five and four levels. As shown in Table 3, the 15-min accessibility grids were stratified into five categories: L1 (0.0000–0.0296), L2 (0.0296–0.4198), L3 (0.4198–2.0017), L4 (2.0017–7.0360), and L5 (7.0360–32.1999); and the 30-min coverage grids had six categories: L1 (0.0000–0.0016), L2 (0.0016–0.0063), L3 (0.0063–0.0241), L4 (0.0241–0.0643), L5 (0.0643–0.1306), and L6 (0.1306–0.2686).
Table 3.
Head/tail breaks statistics for the stratification of accessibility indicators.
The augmentation of service radius contributed to the increase in the accessibility grids and the generation of a structural hierarchy of more levels for spatial accessibility in populated grids. Nevertheless, it should be noted that the 15-min accessibility grids showed a clear clustering pattern with a particular core located within central urban areas; but the 30-min accessibility grids demonstrated a dispersing pattern across urban and rural areas (Figure 7). This may be caused by the dense allocation of testing sites and a higher road network density in central urban areas, providing more convenient transportation for the population to the sites. In general, the accessibility in grids exhibits evident hierarchical structures; more attention should be paid to the variation in accessibility distributions and the regional disparities that are engendered by site allocation and search radius.
Figure 7.
Spatial accessibility in populated grids serviced by nucleic acid testing sites based on two searching radii: (a) 15 min; and (b) 30 min.
3.4. Integrated Evaluation of Spatial Allocation Efficiency
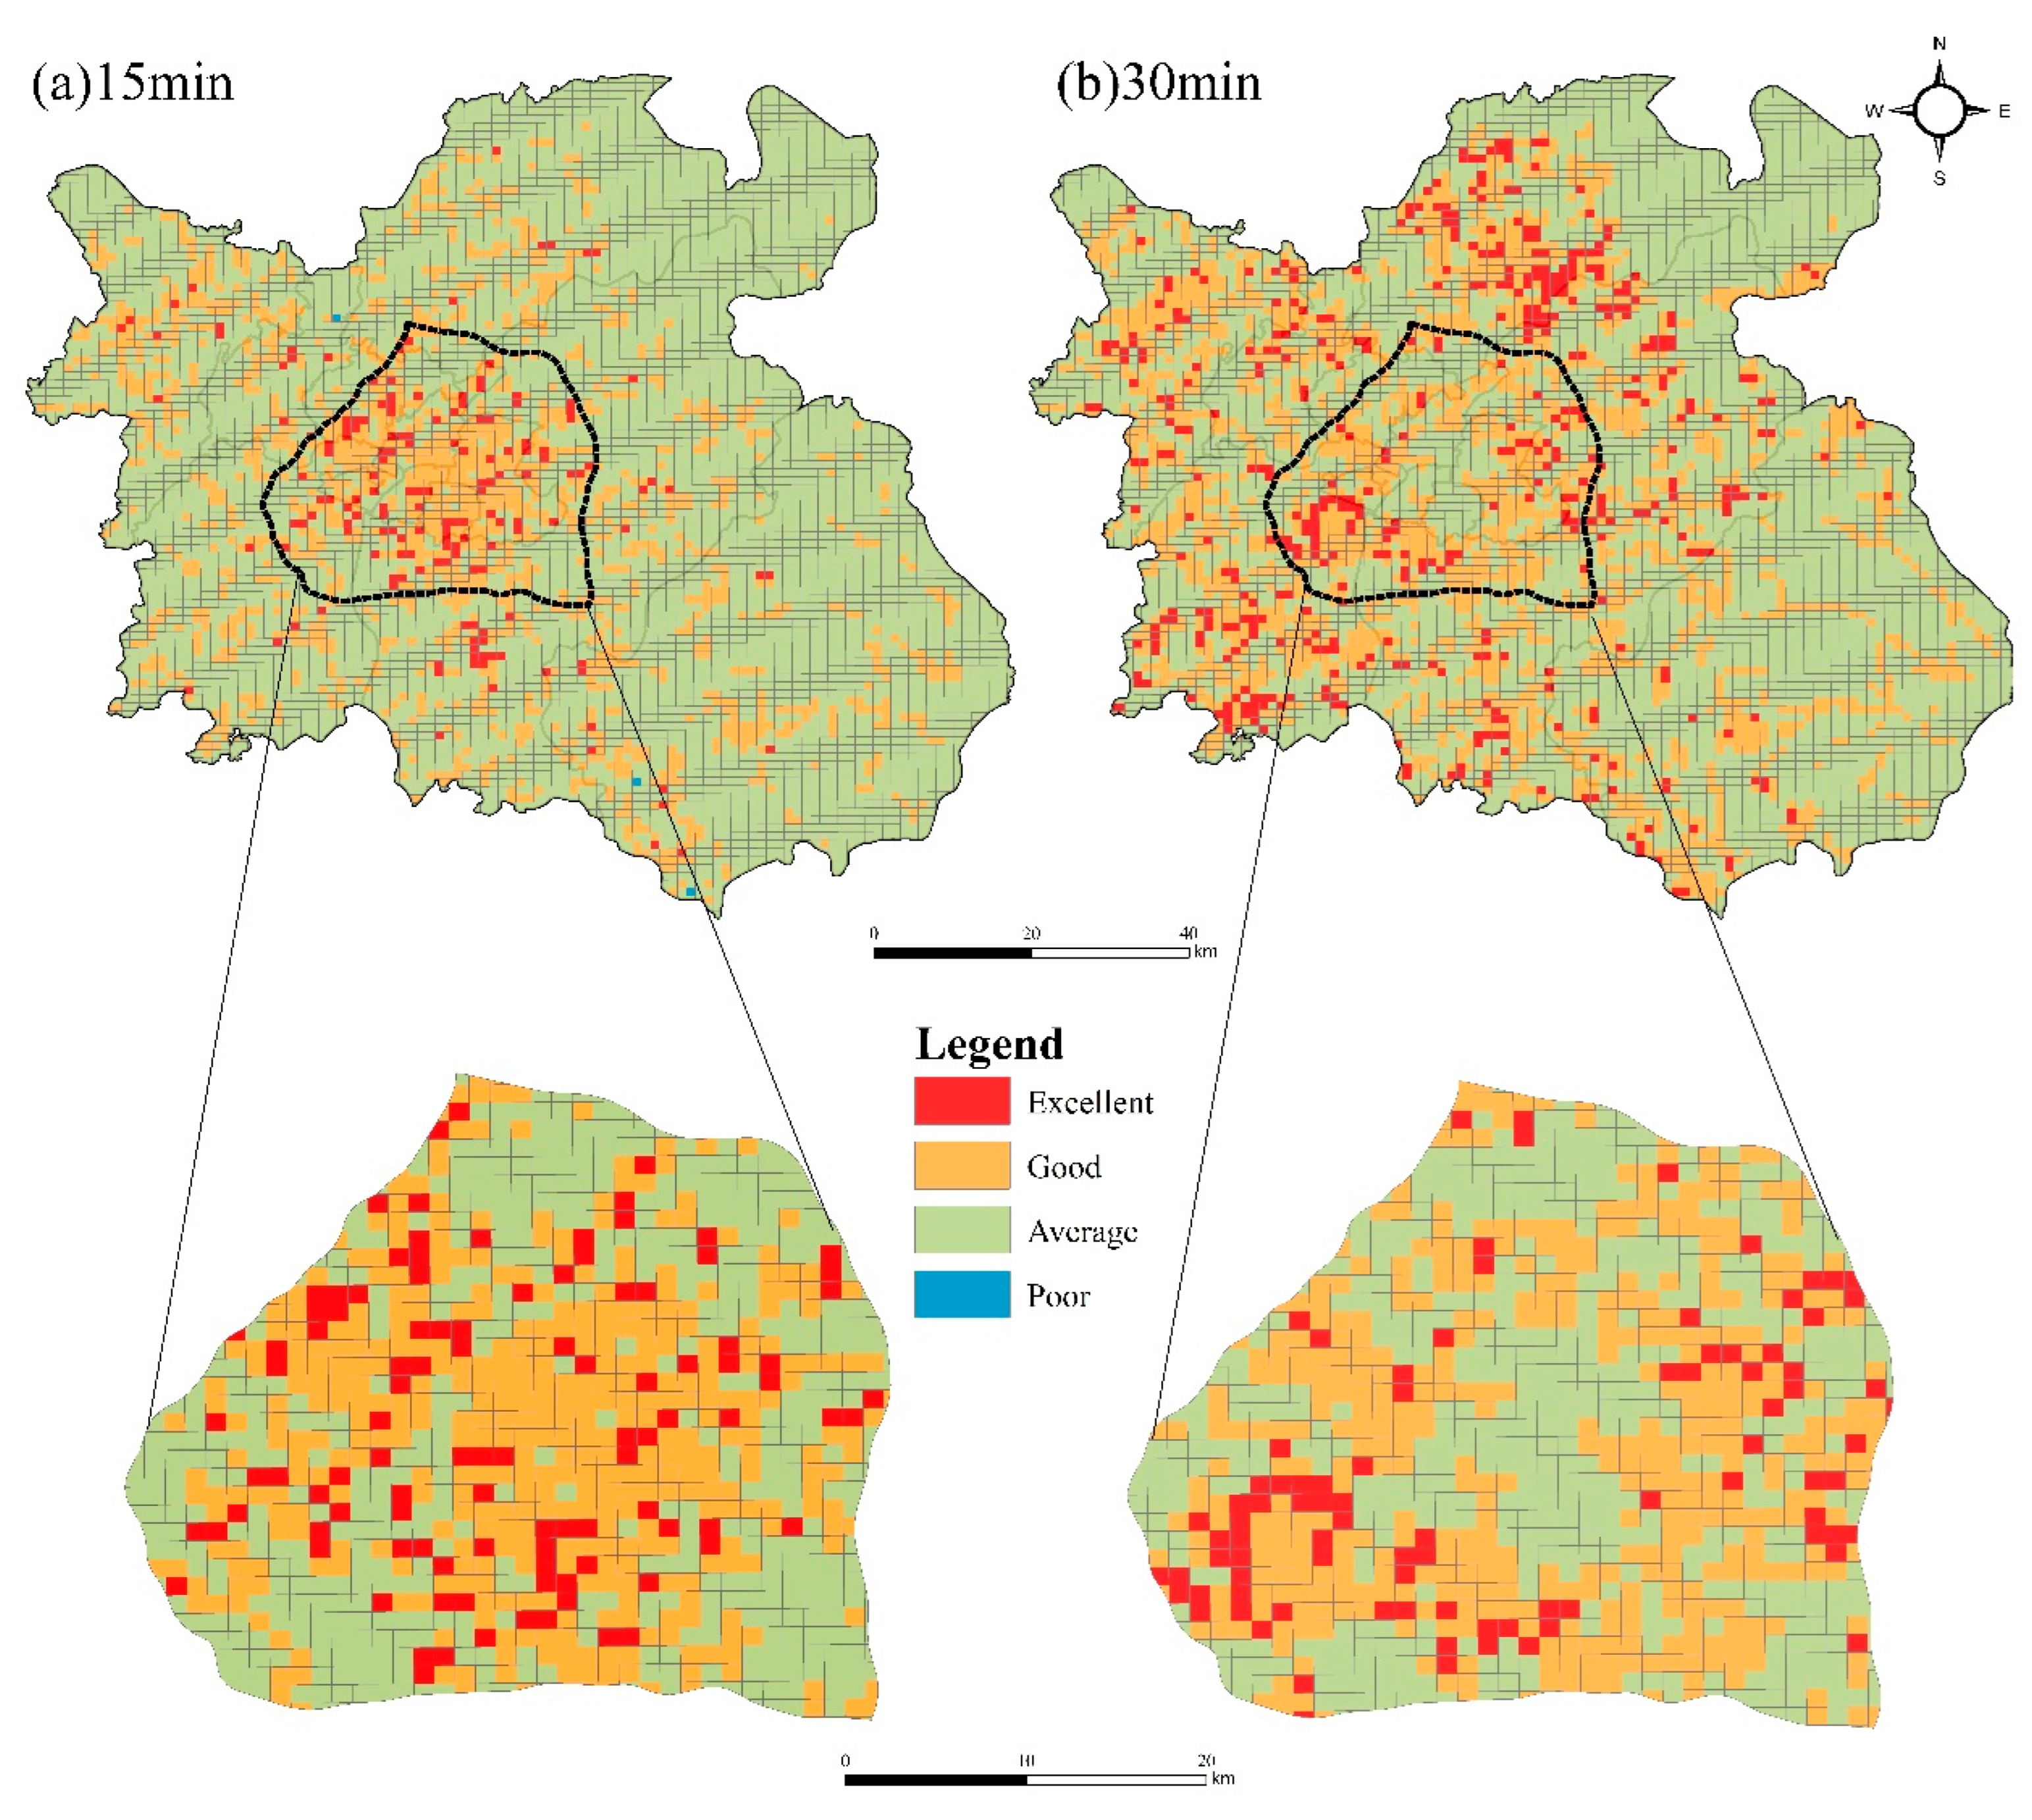
Based on the calculations of the spatial coverage, overlap, and accessibility indicators and their structural hierarchies derived by head/tail breaks, the integrated evaluation of the overall allocation efficiency of nucleic acid testing sites can be implemented in populated grids. We focused on the heads at the respective highest level of the three hierarchies: the highest-coverage grids, the lowest-overlap grids, and the highest-accessibility grids. By the intersection of three heads based on two service radii, all the populated grids were evaluated and categorized as four levels of urban public health surveillance (i.e., nucleic acid testing service in this study).
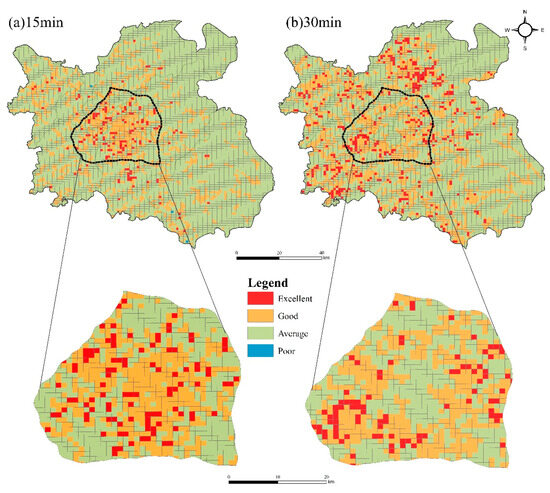
As depicted in Figure 8, the populated grids with an “Average” level were identified as the dominant ones in the integrated evaluation; 78.30% and 64.88% of the populated grids were characterized as either the highest-coverage or the lowest-overlap grids, or the highest-accessibility grids, based on 15-min and 30-min service radii, respectively. In addition, 19.50% and 28.88% of the grids were recognized as being of an “Good” level, respectively. Moreover, a mere 2.16% and 6.24% of the grids were found to be at an “Excellent” level, respectively, based on two service radii. In other words, only an extreme minority of the populated grids can satisfy the intersection of three heads at the highest level of their hierarchies. These “Excellent” grids primarily concentrated in central urban areas based on the 15-min radius, whereas they showed a dispersed pattern based on the 30-min radius (Figure 8). Note that typically no grids with a “Poor” level of surveillance were identified in this case study (only three out of 7529 grids were found with the 15-min radius). Nearly all the grids have attained at least one out of the three highest levels of spatial coverage, overlap, and accessibility.
Figure 8.
Estimation of surveillance levels in populated grids serviced by nucleic acid testing sites based on two service radii: (a) 15 min; and (b) 30 min.
A thorough evaluation of the allocation efficiency in populated grids has the potential to inform strategies that adjust and optimize the spatial allocation of nucleic acid testing sites. The optimization of surveillance allocation should be focused on specific demand units that are at an “Average” or “Poor” level. This should be achieved by improving the site allocation strategy to enhance the surveillance levels for these units; concurrently, the current levels for those units that are at “Excellent” and “Good” levels should be maintained.
4. Discussion
Evaluating the spatial efficiency of public service allocation has been a critical issue in facilitating optimized strategies of urban public service facilities [35]. As a pivotal component of urban public service, public health surveillance plays a vital role in advancing the safety of residents’ lives and the stability of urban communities. The strategic placement of service facilities for addressing public health emergencies exerts a direct influence on the rationality and equity of public health services, and is conducive to enhancing the regional emergency response capacity [36]. This work proposes an integrated approach to evaluating the allocation efficiency of urban public health surveillance. The approach estimates the coverage, overlap, and accessibility in target units (e.g., populated grids) serviced by surveillance sites, and thereby incorporates three indicators to achieve an integrated assessment of the overall allocation efficiency. The case study of the nucleic acid testing site placement in Nanchang has verified the effectiveness and significance of the methodology employed. The estimated levels of surveillance in grids can provide significant information for the strategic adjustment and optimization of regional surveillance site allocations.
Various evaluation indicators or criteria have been established for assessing the spatial configuration of public service facilities [37], and were primarily applied for healthcare resources and others. This study provides a novel and comprehensive perspective on the evaluation of surveillance allocation efficiency and contributes valuable insights and methodologies to the development of urban public health emergency response systems. In essence, the proposed approach integrates a range of aspects, including the scope of surveillance services, the wastage of resources, and the accessibility of services to the population, into the evaluation of surveillance allocation efficiency. This bridges the gap between an integrated evaluation perspective and a single criterion or individual indicators in the literature. In addition, the detailed quantification of spatial configuration efficiency offers decision-making support for the spatial layout and optimization of surveillance sites and also serves as a valuable reference for future responses to sudden public health emergencies.
Another significant contribution of this study is the technical framework that is both objective and quantitative in nature, with the aim of evaluating the efficiency of surveillance sites. The integration of the coverage, overlap, and accessibility indicators was based on their structural hierarchies, which are naturally and objectively derived by head/tail breaks. Unlike the majority of existing stratification methods, head/tail breaks is capable of naturally determining the number of strata/classes, reveals the hierarchical structures of geographical variables, and precisely captures the dominant components across hierarchical levels [34]. The present approach is devoid of subjective parameters or presets while dealing with the evaluation of surveillance allocation efficiency. It is flexible and versatile for the efficiency evaluation of other public health surveillance strategies, as well as those of a wider range of related fields.
This study has identified several limitations and further analyses in future work. Firstly, additional evaluation indicators are required to be integrated with the three indicators in this work, for a more comprehensive evaluation of surveillance allocation efficiency. Incorporating more indicators into efficiency evaluation might better reflect the spatial configuration of urban public service site allocations [38]. Secondly, the current case study employed two service radii and future work should introduce a broader range of service radii for parameter sensitivity analysis and modeling assumption justification. It is acknowledged that different service radius parameters may be appropriate for various categories of service facilities when considering spatial accessibility to the population [39]. Thirdly, our case study focused on a peak epidemic period to evaluate the surveillance system under high stress; however, future work has been identified to extend this framework into a dynamic or multi-period assessment model. It is imperative to incorporate additional socioeconomic and humanity factors into the calculation of evaluation indicators of surveillance allocation efficiency, such as community development levels and population age demographics. Additionally, the comparative integration of two or more assessment methods has the potential to improve evaluation accuracy [40]; one of our ongoing works entails the introduction of additional methods for the evaluation of surveillance allocation efficiency, with the aim of enhancing methodological performance. Lastly, the efficiency evaluation criteria might differ between permanent surveillance infrastructures (e.g., sentinel hospitals and wastewater monitoring stations) and ad hoc emergency response facilities (e.g., temporary testing sites); future research would focus on the validation of methodological universality and robustness in the context of various trade-offs between redundancy, cost, resilience, and others.
5. Conclusions
In conclusion, this article proposed an integrated framework for the evaluation of the spatial allocation efficiency of urban public health surveillance. The approach investigates the spatial coverage and overlap of the study units serviced by surveillance sites using the improved coverage model, as well as the accessibility of study units to surveillance sites based on the Ga-2SFCA method. More importantly, the approach implements the optimized stratification of the three indicators using head/tail breaks and integrates these indicators to estimate the surveillance levels of individual study units, thereby facilitating an evaluation of the overall efficiency of urban public health surveillance. We utilized the present technique to examine the allocation efficiency of the nucleic acid testing sites in Nanchang during the COVID-19 epidemic. The findings verified the feasibility, performance, and flexibility of our integrated approach for the efficiency evaluation of public health surveillance. This study demonstrates a novel, comprehensive perspective and provides a technical foundation in the related fields of urban public health surveillance and public service allocations.
Author Contributions
Conceptualization, Bisong Hu; methodology, Shuzhen Xiao and Bisong Hu; validation, Bisong Hu; formal analysis, Shuzhen Xiao; investigation, Shuzhen Xiao and Bisong Hu; resources, Shuzhen Xiao and Bisong Hu; data curation, Shuzhen Xiao and Bisong Hu; writing—original draft preparation, Shuzhen Xiao; writing—review & editing, Bisong Hu; visualization, Shuzhen Xiao; supervision, Bisong Hu; project administration, Bisong Hu; funding acquisition, Bisong Hu. All authors have read and agreed to the published version of the manuscript.
Funding
This research was funded by the Key Project of Jiangxi Provincial Natural Science Foundation (Grant No. 20242BAB26018) and the National Natural Science Foundation of China (Grant No. 42061075). The funders had no role in study design, data collection and analysis, decision to publish, or preparation of the manuscript.
Data Availability Statement
The data used in this article are publicly available. All data generated or analyzed to support the findings of this study are available upon reasonable request from the corresponding author.
Conflicts of Interest
The authors declare no conflicts of interest.
References
- Palacios Cruz, M.; Santos, E.; Velázquez Cervantes, M.A.; León Juárez, M. COVID-19, una emergencia de salud pública mundial. Rev. Clínica Española 2021, 221, 55–61. [Google Scholar] [CrossRef] [Scilit]
- Hu, B.; Zhang, Q.; Tao, V.; Wang, J.; Lin, H.; Zuo, L.; Meng, Y. Assessing work resumption in hospitals during the COVID-19 epidemic in China using multiscale geographically weighted regression. Trans. GIS 2022, 26, 2023–2040. [Google Scholar] [CrossRef] [Scilit]
- Ebi, K.L.; Schmier, J.K. A stitch in time: Improving public health early warning systems for extreme weather events. Epidemiol. Rev. 2005, 27, 115–121. [Google Scholar] [CrossRef] [Scilit] [PubMed]
- Rosko, M.D.; Mutter, R.L. Stochastic frontier analysis of hospital inefficiency: A review of empirical issues and an assessment of robustness. Med. Care Res. Rev. 2008, 65, 131–166. [Google Scholar] [CrossRef] [Scilit] [PubMed]
- Li, T.; Rosenman, R. Cost inefficiency in Washington hospitals: A stochastic frontier approach using panel data. Health Care Manag. Sci. 2001, 4, 73–81. [Google Scholar] [CrossRef] [Scilit] [PubMed]
- Shao, H.; Lv, S.; Cao, C. The Fairness and Influencing Factors of the Spatial Distribution of Public Services in Beijing–Tianjin–Hebei. Sustainability 2023, 15, 9217. [Google Scholar] [CrossRef] [Scilit]
- Chen, C. Discussion on the Optimization Method of Public Service Facility Layout from the Perspective of Spatial Equity: A Study Based on the Central City of Shanghai. Land 2023, 12, 1780. [Google Scholar] [CrossRef] [Scilit]
- Li, Z.; Cai, C.; Tao, Y. Research on Allocation of Residential Space and Public Service Facilities Using Beijing as an Example. Sens. Mater. 2023, 35, 941–963. [Google Scholar] [CrossRef] [Scilit]
- Taleai, M.; Sliuzas, R.; Flacke, J. An integrated framework to evaluate the equity of urban public facilities using spatial multi-criteria analysis. Cities 2014, 40, 56–69. [Google Scholar] [CrossRef] [Scilit]
- Czaplak, J. Analysis of the effectiveness of public services provision by local governments in the years 2007–2013. Oeconomia Copernic. 2016, 7, 223–243. [Google Scholar] [CrossRef] [Scilit]
- Cote, M.J.; Syam, S.S.; Vogel, W.B.; Cowper, D.C. A mixed integer programming model to locate traumatic brain injury treatment units in the Department of Veterans Affairs: A case study. Health Care Manag. Sci. 2007, 10, 253–267. [Google Scholar] [CrossRef] [Scilit] [PubMed]
- Mahar, S.; Bretthauer, K.M.; Salzarulo, P.A. Locating specialized service capacity in a multi-hospital network. Eur. J. Oper. Res. 2011, 212, 596–605. [Google Scholar] [CrossRef] [Scilit]
- Ghaderi, A.; Jabalameli, M.S. Modeling the budget-constrained dynamic uncapacitated facility location–network design problem and solving it via two efficient heuristics: A case study of health care. Math. Comput. Model. 2013, 57, 382–400. [Google Scholar] [CrossRef] [Scilit]
- Aktaş, E.; Ülengin, F.; Önsel Şahin, Ş. A decision support system to improve the efficiency of resource allocation in healthcare management. Socio-Econ. Plan. Sci. 2007, 41, 130–146. [Google Scholar] [CrossRef] [Scilit]
- Gong, J.; Shi, L.; Wang, X.; Sun, G. The efficiency of health resource allocation and its influencing factors: Evidence from the super efficiency slack based model-Tobit model. Int. Health 2023, 15, 326–334. [Google Scholar] [CrossRef] [Scilit]
- Feng, Q.; Ao, Y.B.; Chen, S.Z.; Martek, I. Evaluation of the allocation efficiency of medical and health resources in China’s rural three-tier healthcare system. Public Health 2023, 218, 39–44. [Google Scholar] [CrossRef] [Scilit]
- Gong, Y.; Ma, D.; Feng, W. Study on the allocation efficiency of medical and health resources in Hainan Province: Based on the super-efficiency SBM-Malmquist model. PLoS ONE 2024, 19, e0294774. [Google Scholar] [CrossRef] [Scilit]
- Tong, D. Regional Coverage Maximization: A New Model to Account Implicitly for Complementary Coverage. Geogr. Anal. 2012, 44, 1–14. [Google Scholar] [CrossRef] [Scilit]
- Jang, H.; Lee, J.-H. A hierarchical location model for determining capacities of neonatal intensive care units in Korea. Socio-Econ. Plan. Sci. 2019, 68, 100695. [Google Scholar] [CrossRef] [Scilit]
- Rong, P.; Zheng, Z.; Kwan, M.-P.; Qin, Y. Evaluation of the spatial equity of medical facilities based on improved potential model and map service API: A case study in Zhengzhou, China. Appl. Geogr. 2020, 119, 102192. [Google Scholar] [CrossRef] [Scilit]
- Xu, D.; Wu, Q.; Feng, Y.; Wu, S. COVID-19: Evaluation of Fever Clinic and Fever Sentinel Configuration—A Case Study of Harbin, China. Sustainability 2022, 14, 9117. [Google Scholar] [CrossRef] [Scilit]
- Tao, Z.; Cheng, Y.; Liu, J. Hierarchical two-step floating catchment area (2SFCA) method: Measuring the spatial accessibility to hierarchical healthcare facilities in Shenzhen, China. Int. J. Equity Health 2020, 19, 164. [Google Scholar] [CrossRef] [Scilit] [PubMed]
- Yao, J.; Murray, A.T. Locational Effectiveness of Clinics Providing Sexual and Reproductive Health Services to Women in Rural Mozambique. Int. Reg. Sci. Rev. 2014, 37, 172–193. [Google Scholar] [CrossRef] [Scilit]
- DeVerteuil, G. Reconsidering the legacy of urban public facility location theory in human geography. Prog. Hum. Geogr. 2000, 24, 47–69. [Google Scholar] [CrossRef] [Scilit]
- Teixeira, J.C.; Antunes, A.P. A hierarchical location model for public facility planning. Eur. J. Oper. Res. 2008, 185, 92–104. [Google Scholar] [CrossRef] [Scilit]
- Batta, R.; Lejeune, M.; Prasad, S. Public facility location using dispersion, population, and equity criteria. Eur. J. Oper. Res. 2014, 234, 819–829. [Google Scholar] [CrossRef] [Scilit]
- Chisci, E.; Masciello, F.; Michelagnoli, S. The Italian USL Toscana Centro model of a vascular hub responding to the COVID-19 emergency. J. Vasc. Surg. 2020, 72, 8–11. [Google Scholar] [CrossRef] [Scilit]
- Vdovin, E.; Smolova, M.; Smolova, D. Emergency architecture. Modular construction of healthcare facilities as a response to pandemic outbreak. E3S Web Conf. 2021, 274, 01013. [Google Scholar] [CrossRef] [Scilit]
- Brambilla, A.; Sun, T.; Elshazly, W.; Ghazy, A.; Barach, P.; Lindahl, G.; Capolongo, S. Flexibility during the COVID-19 Pandemic Response: Healthcare Facility Assessment Tools for Resilient Evaluation. Int. J. Environ. Res. Public Health 2021, 18, 11478. [Google Scholar] [CrossRef] [Scilit]
- Kanuganti, S.; Sarkar, A.K.; Singh, A.P. Quantifying Accessibility to Health Care Using Two-step Floating Catchment Area Method (2SFCA): A Case Study in Rajasthan. Transp. Res. Procedia 2016, 17, 391–399. [Google Scholar] [CrossRef] [Scilit]
- Radke, J.; Mu, L. Spatial Decompositions, Modeling and Mapping Service Regions to Predict Access to Social Programs. Ann. GIS 2000, 6, 105–112. [Google Scholar] [CrossRef] [Scilit]
- Jiang, B. Head/Tail Breaks: A New Classification Scheme for Data with a Heavy-Tailed Distribution. Prof. Geogr. 2013, 65, 482–494. [Google Scholar] [CrossRef] [Scilit]
- Jiang, B.; Yin, J. Ht-Index for Quantifying the Fractal or Scaling Structure of Geographic Features. Ann. Assoc. Am. Geogr. 2013, 104, 530–540. [Google Scholar] [CrossRef] [Scilit]
- Hu, B.; Wu, T.; Yin, Q.; Wang, J.; Jiang, B.; Luo, J. Calibrating Spatial Stratified Heterogeneity for Heavy-Tailed Distributed Data. Ann. Am. Assoc. Geogr. 2024, 114, 1568–1586. [Google Scholar] [CrossRef] [Scilit]
- Keyimu, M.; Abulikemu, Z.; Abudurexiti, A. Quantitative Evaluation of the Equity of Public Service Facility Layout in Urumqi City for Sustainable Development. Sustainability 2024, 16, 4913. [Google Scholar] [CrossRef] [Scilit]
- Xie, C.; Jiang, L.; Huang, G.; Pu, H.; Gong, B.; Lin, H.; Ma, S.; Chen, X.; Long, B.; Si, G.; et al. Comparison of different samples for 2019 novel coronavirus detection by nucleic acid amplification tests. Int. J. Infect. Dis. 2020, 93, 264–267. [Google Scholar] [CrossRef] [Scilit]
- Zhao, M.; Xu, G.; Li, Y. Evaluating urban public facilities of Shenzhen by application of open source data. Geo-Spat. Inf. Sci. 2016, 19, 129–139. [Google Scholar] [CrossRef] [Scilit]
- Wang, C.C.; Sepasgozar, S.M.E.; Wang, M.; Sun, J.; Ning, X. Green Performance Evaluation System for Energy-Efficiency-Based Planning for Construction Site Layout. Energies 2019, 12, 4620. [Google Scholar] [CrossRef] [Scilit]
- Wu, H.; Liu, L.; Yu, Y.; Peng, Z. Evaluation and Planning of Urban Green Space Distribution Based on Mobile Phone Data and Two-Step Floating Catchment Area Method. Sustainability 2018, 10, 214. [Google Scholar] [CrossRef] [Scilit]
- Tang, X.; Tan, Z.; Hu, S.; Geng, H. Evaluating spatial service and layout efficiency of municipal Wi-Fi facilities for SmartCity planning: A case study of Wuhan city, China. Socio-Econ. Plan. Sci. 2019, 65, 101–110. [Google Scholar] [CrossRef] [Scilit]

Disclaimer/Publisher’s Note: The statements, opinions and data contained in all publications are solely those of the individual author(s) and contributor(s) and not of MDPI and/or the editor(s). MDPI and/or the editor(s) disclaim responsibility for any injury to people or property resulting from any ideas, methods, instructions or products referred to in the content. |
© 2026 by the authors. Published by MDPI on behalf of the International Society for Photogrammetry and Remote Sensing. Licensee MDPI, Basel, Switzerland. This article is an open access article distributed under the terms and conditions of the Creative Commons Attribution (CC BY) license.