


Abstract
Most machine learning (ML)-based facility location studies utilize uniform grid partitioning, often overlooking spatial heterogeneity. This limitation can compromise the validity and practical applicability of the resulting site selections. In response to this issue, this paper uses fire stations as the research subject and proposes a location prediction method that considers the heterogeneous characteristics within cities. Firstly, the Gaussian Mixture Model (GMM) is adopted based on the Point of Interest (POI) data to determine the clustering centres of the study area. Secondly, a Voronoi diagram is constructed to divide the study area reasonably. Then, a comprehensive feature matrix is constructed by integrating multi-source spatial data and five machine learning models: Random Forest (RF), Gradient Boosting Decision Tree (GBDT), Support Vector Machine (SVM), Extreme Gradient Boosting (XGBoost) and Logistic Regression (LR). These are then used for training and evaluation. Finally, the GBDT model with the best performance in terms of both the F1 score and the AUC value was selected to predict the location of fire stations in Chengguan District, Lanzhou City. The results demonstrate the GBDT model’s effectiveness in identifying the rationale behind existing fire station locations and predicting potential new locations. It predicts 12 suitable locations for new fire stations, and the suitability of these predicted locations is validated by comparing them with the existing fire station locations, 8 of which are in the same block as existing fire stations in Chengguan District. Adding micro fire stations at four new predicted locations would improve response efficiency. The results of the feature importance analysis show that road accessibility is the primary factor affecting fire station location selection. This study’s proposed method effectively enhances the reasonableness of fire station site selection and provides a basis for planning fire stations in new urban areas in the future.
1. Introduction
As urbanisation in China continues to advance, the urban environment is becoming increasingly complex. Urbanisation is accompanied by increased population density, taller and denser buildings, and expanded commercial activities. These factors have significantly increased the fire risk in cities [1]. According to statistics from China’s National Fire and Rescue Bureau, the national fire rescue team responded to 908,000 fires in 2024 (data from the National Fire and Rescue Bureau of China), resulting in 2001 deaths, 2665 injuries, and direct property losses amounting to 7.74 billion yuan. Among these incidents, classified by location, building fires accounted for 43.1%, with 79% of them occurring in residential areas. In terms of ignition factors, electrical faults and careless use of fire were the leading causes, representing 32.3% and 21.8% of the total cases, respectively [2]. These sobering statistics underscore the persistent complexity and critical challenges associated with urban fire safety management. As a core facility for urban fire safety, the location of fire stations can significantly improve the quality and efficiency of emergency services and is important for research in the fields of medical treatment, disaster relief, and humanitarian logistics [3]. Therefore, the scientific planning of the number and spatial location of fire stations has become an important research topic in the field of urban public safety [4].
Research into optimizing fire station layouts is crucial for enhancing emergency response efficiency and reducing fire losses through strategic station placement [5,6]. Early studies relied primarily on operational research models, including the P-median model [7], the P-centre model [8], the Set Covering model [9] and the Maximum Covering Location Problem (MCLP) [10]. The P-median model, proposed by Hakimi [11], aims to minimize the total distance between demand points and facilities to optimize service performance. Shang et al. [12] constructed an urban fire risk assessment index system and systematically analyzed urban fire risk. They used the P-centre model to determine the location plan for fire stations, with response time, service scope division, and risk assessment as the core elements. Xu Qian et al. [13] used the Analytic Hierarchy Process (AHP) to evaluate the response times and service areas of existing fire stations, then applied the set covering model to plan locations for new stations. Adesina et al. [14] constructed an MCLP model to determine the optimal location of urban fire protection facilities and evaluate the maximum coverage rate of fire protection facilities for the service population. These models typically fall under the category of NP-hard problems, relying on deterministic optimization methods to determine facility locations by maximizing coverage of demand points or minimizing distance [15]. In contrast, machine learning (ML) methods can handle datasets and complex relationships more efficiently by learning from the data, bypassing the exhaustive search required in traditional models.
In recent years, improvements in data science and computing power have enabled the application of ML algorithms to location problems [16,17]. Compared with traditional models, ML algorithms can handle large-scale, complex spatial data and demonstrate greater adaptability and predictive ability [18]. Sharma et al. [19] developed an ML model to analyze the types and characteristics of emergency events across different spatial and temporal levels, and to predict their likelihood. This information supports resource allocation planning for fire rescue departments. Wang [20] evaluated existing urban fire planning based on historical fire data and used an improved K-means algorithm to identify potential fire station locations. The effectiveness of this method was verified through simulation experiments. Aydın [21] proposed using an ML classification algorithm to determine fire station requirements by dividing the area into 808 blocks. The model predicted whether fire services were needed in each block, with an 85.43% similarity to actual requirements. Gao [22] divided the study area into 500 m × 500 m grids and constructed the required feature factor set at a scale of 500 m. The fire susceptibility of the study area was modelled using the random forest and BP neural network algorithms. Based on this, a method for optimizing the layout of fire stations was proposed.
In summary, the traditional location model based on operational research usually fails to consider the heterogeneity and rapidly changing needs of cities in complex urban environments. Although location methods based on ML can handle large-scale spatial data, they ignore regional differences due to excessive dependence on grid division. Therefore, this paper proposes a location prediction method for urban fire stations based on Gaussian mixture model (GMM) clustering and ML, with the aim of planning the layout of fire stations more reasonably. GMM clustering combined with a Voronoi diagram is used to divide the region, capturing the spatial differences within the city more accurately. Then, considering urban fire risk distribution and road accessibility, multi-source spatial data such as points of interest (POIs), road density and population density are fused to extract various feature variables. Five ML models, including Random Forest (RF) and Gradient Boosting Decision Tree (GBDT), are used to systematically study and evaluate the location of urban fire stations. This provides strong data support and a basis for decision-making in urban planning and public safety management.
2. Study Area and Data Sources
2.1. Study Area
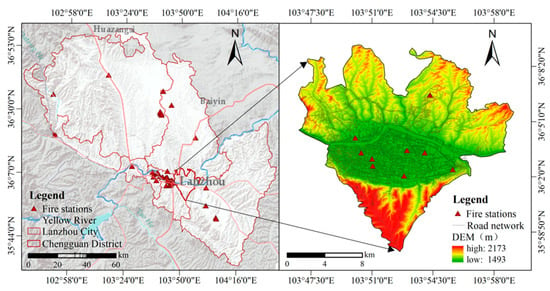
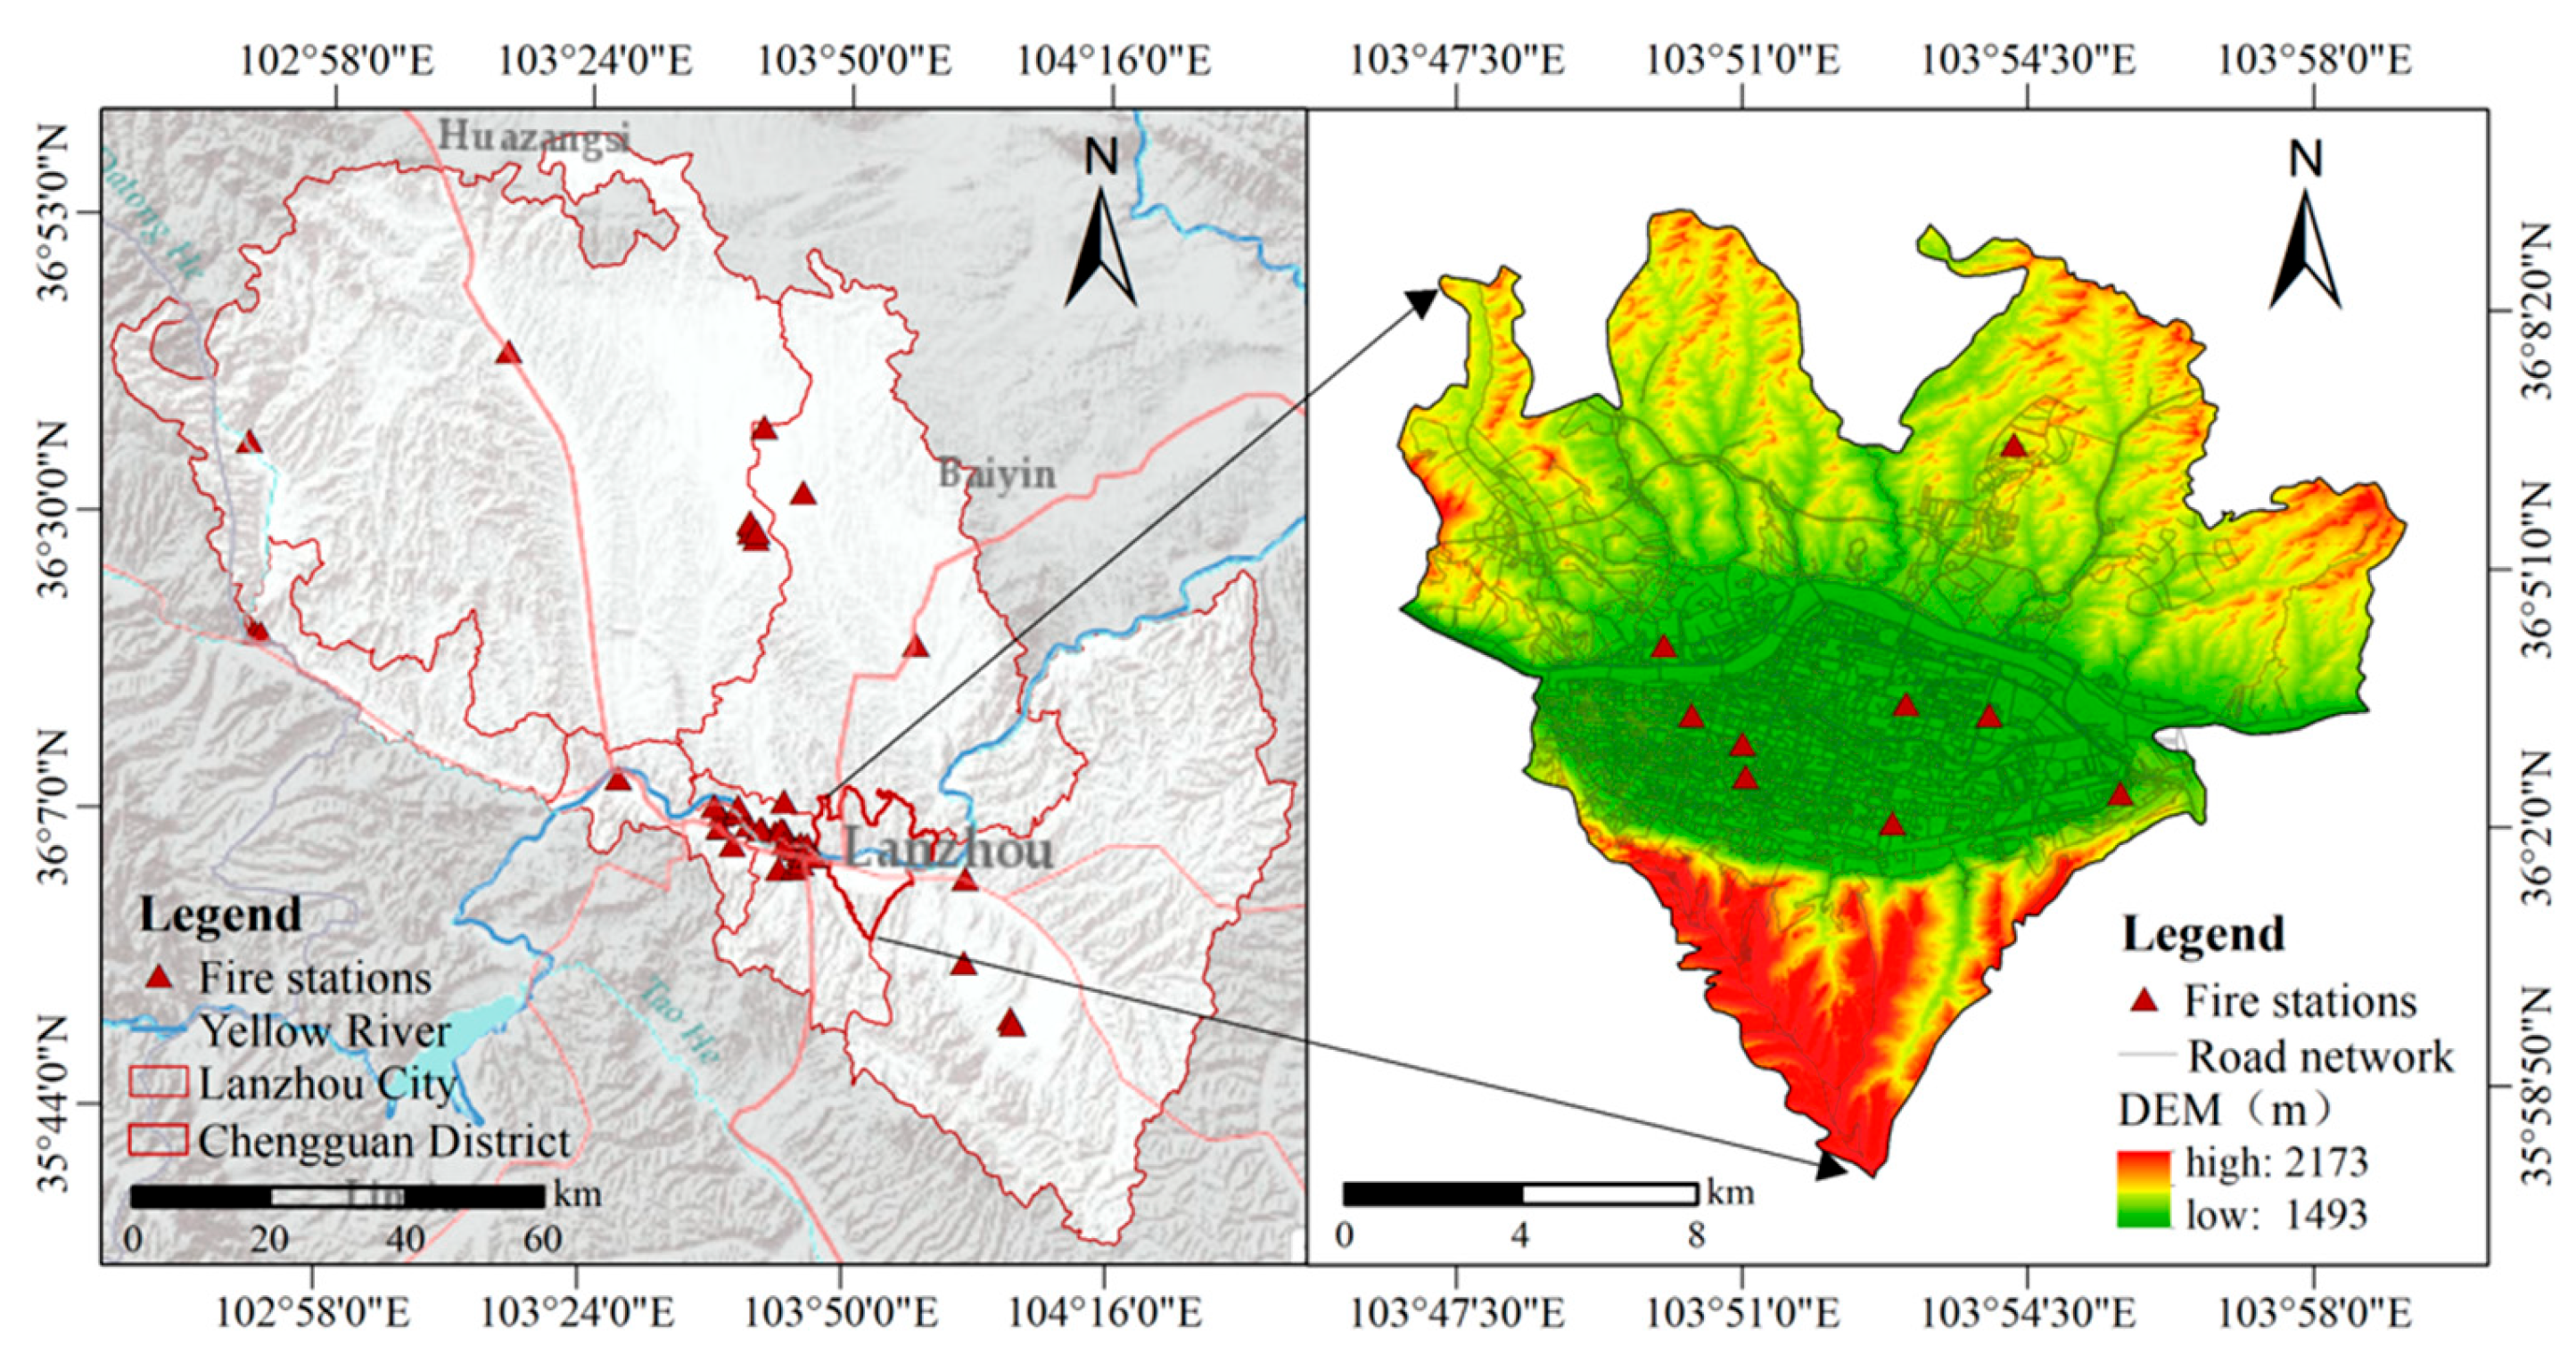
This paper selects Chengguan District in Lanzhou City as the main study area and the other districts and counties in Lanzhou City (excluding Chengguan District) as the secondary research area (see Figure 1). Chengguan District is located in the eastern part of the Lanzhou Basin. It is the political, economic, technological and cultural centre of Lanzhou City. It covers a total area of 207.83 square kilometres, 67.92 of which is built up. As of the end of 2022, the district comprised 25 streets and had a permanent population of approximately 1.5021 million. Fire risk has been a longstanding concern for the city; for example, as early as the first eleven months of 2005 alone, Lanzhou recorded 607 fires with direct economic losses of 809,200 yuan [23]. Chengguan District has experienced a high number of fire accidents in recent years. The terrain of Chengguan District is complex and diverse. The Yellow River runs through it, dividing the district into two parts: north and south. To the north of the Yellow River, the land is hilly and full of gullies, extending in a feather-like pattern from north to south and dividing the entire northern mountainous area into hills. Gaolan Mountain, located to the south of the Yellow River, is covered by a large area of loess and has a steep slope. The gentle zone at the top is partly farmland and partly used for afforestation projects. This diversity of terrain makes higher demands on the planning and implementation of fire services. For this study, the Chengguan District was chosen as the test area because of its complex urban structure and high demand for fire protection. Other districts and counties in Lanzhou City were used as the training and verification sets. These areas differ from Chengguan District in terms of terrain, population density, and level of urban development. Therefore, using them as the training set helps the model better capture the characteristics of different regions. This division method improves the model’s ability to generalize to different types of regions, thereby improving the reliability of the prediction results.
Figure 1.
Location map of the study area.
2.2. Data Sources
The data used in this paper fall into two main categories. One category comprises fire station location data, which was used to construct the positive sample of the model and verify the prediction results. The other category comprises regional feature data, which was used to construct feature factors covering points of interest (POI) distribution, road density, population density and economic activity level. The data sources and corresponding descriptions are summarized in Table 1.
Table 1.
Data sources of this paper.
The details are as follows: ① Fire station location data were acquired from multiple map service platforms… and cross-validated to ensure accuracy. The dataset was subsequently filtered to exclude low-level facilities, such as community fire studios, ensuring only standard fire stations were retained. A total of nine fire station locations in Chengguan District and 44 in other districts and counties (excluding Chengguan District) of Lanzhou City were obtained (Figure 1). These stations were built in accordance with the Urban Fire Station Construction Standard, and therefore represent practically compliant and representative siting examples within the context of fire safety planning in China. ② The POI location data, covering catering, residential areas, schools, hospitals, commercial areas, and other categories closely related to urban fire risk and fire protection needs, was obtained in August 2023. Each POI record contains attribute information such as name, latitude and longitude, type and administrative region. Spatial deduplication and classification of the POI data were carried out to provide data support for identifying fire risk areas, GMM clustering, and constructing a machine learning feature matrix in subsequent research. ③ The road data comes from the free and open road map database OpenStreetMap, which performs topology checking and processing on the data to ensure the integrity and accuracy of the road network. ④ The population density data is derived from the World Pop Global High-Resolution Population Project dataset. This dataset provides high-precision population distribution data at different spatial resolutions worldwide. It covers demographic information from various time periods and regions and has high spatial accuracy and a high frequency of time updates. Through data extraction and projection transformation, population density information for each district and county in Lanzhou is obtained to provide data support for subsequent fire station layout optimization. ⑤ The economic data comes from the Gansu Development Yearbook 2023. The regional GDP of each Lanzhou district and county is used to measure the level of economic activity in each region. This ensures that fire resources are reasonably matched to the level of regional economic development and are allocated efficiently.
3. Methods
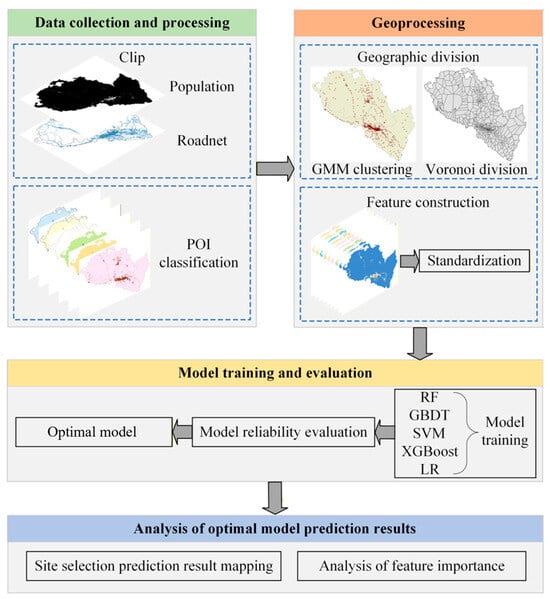
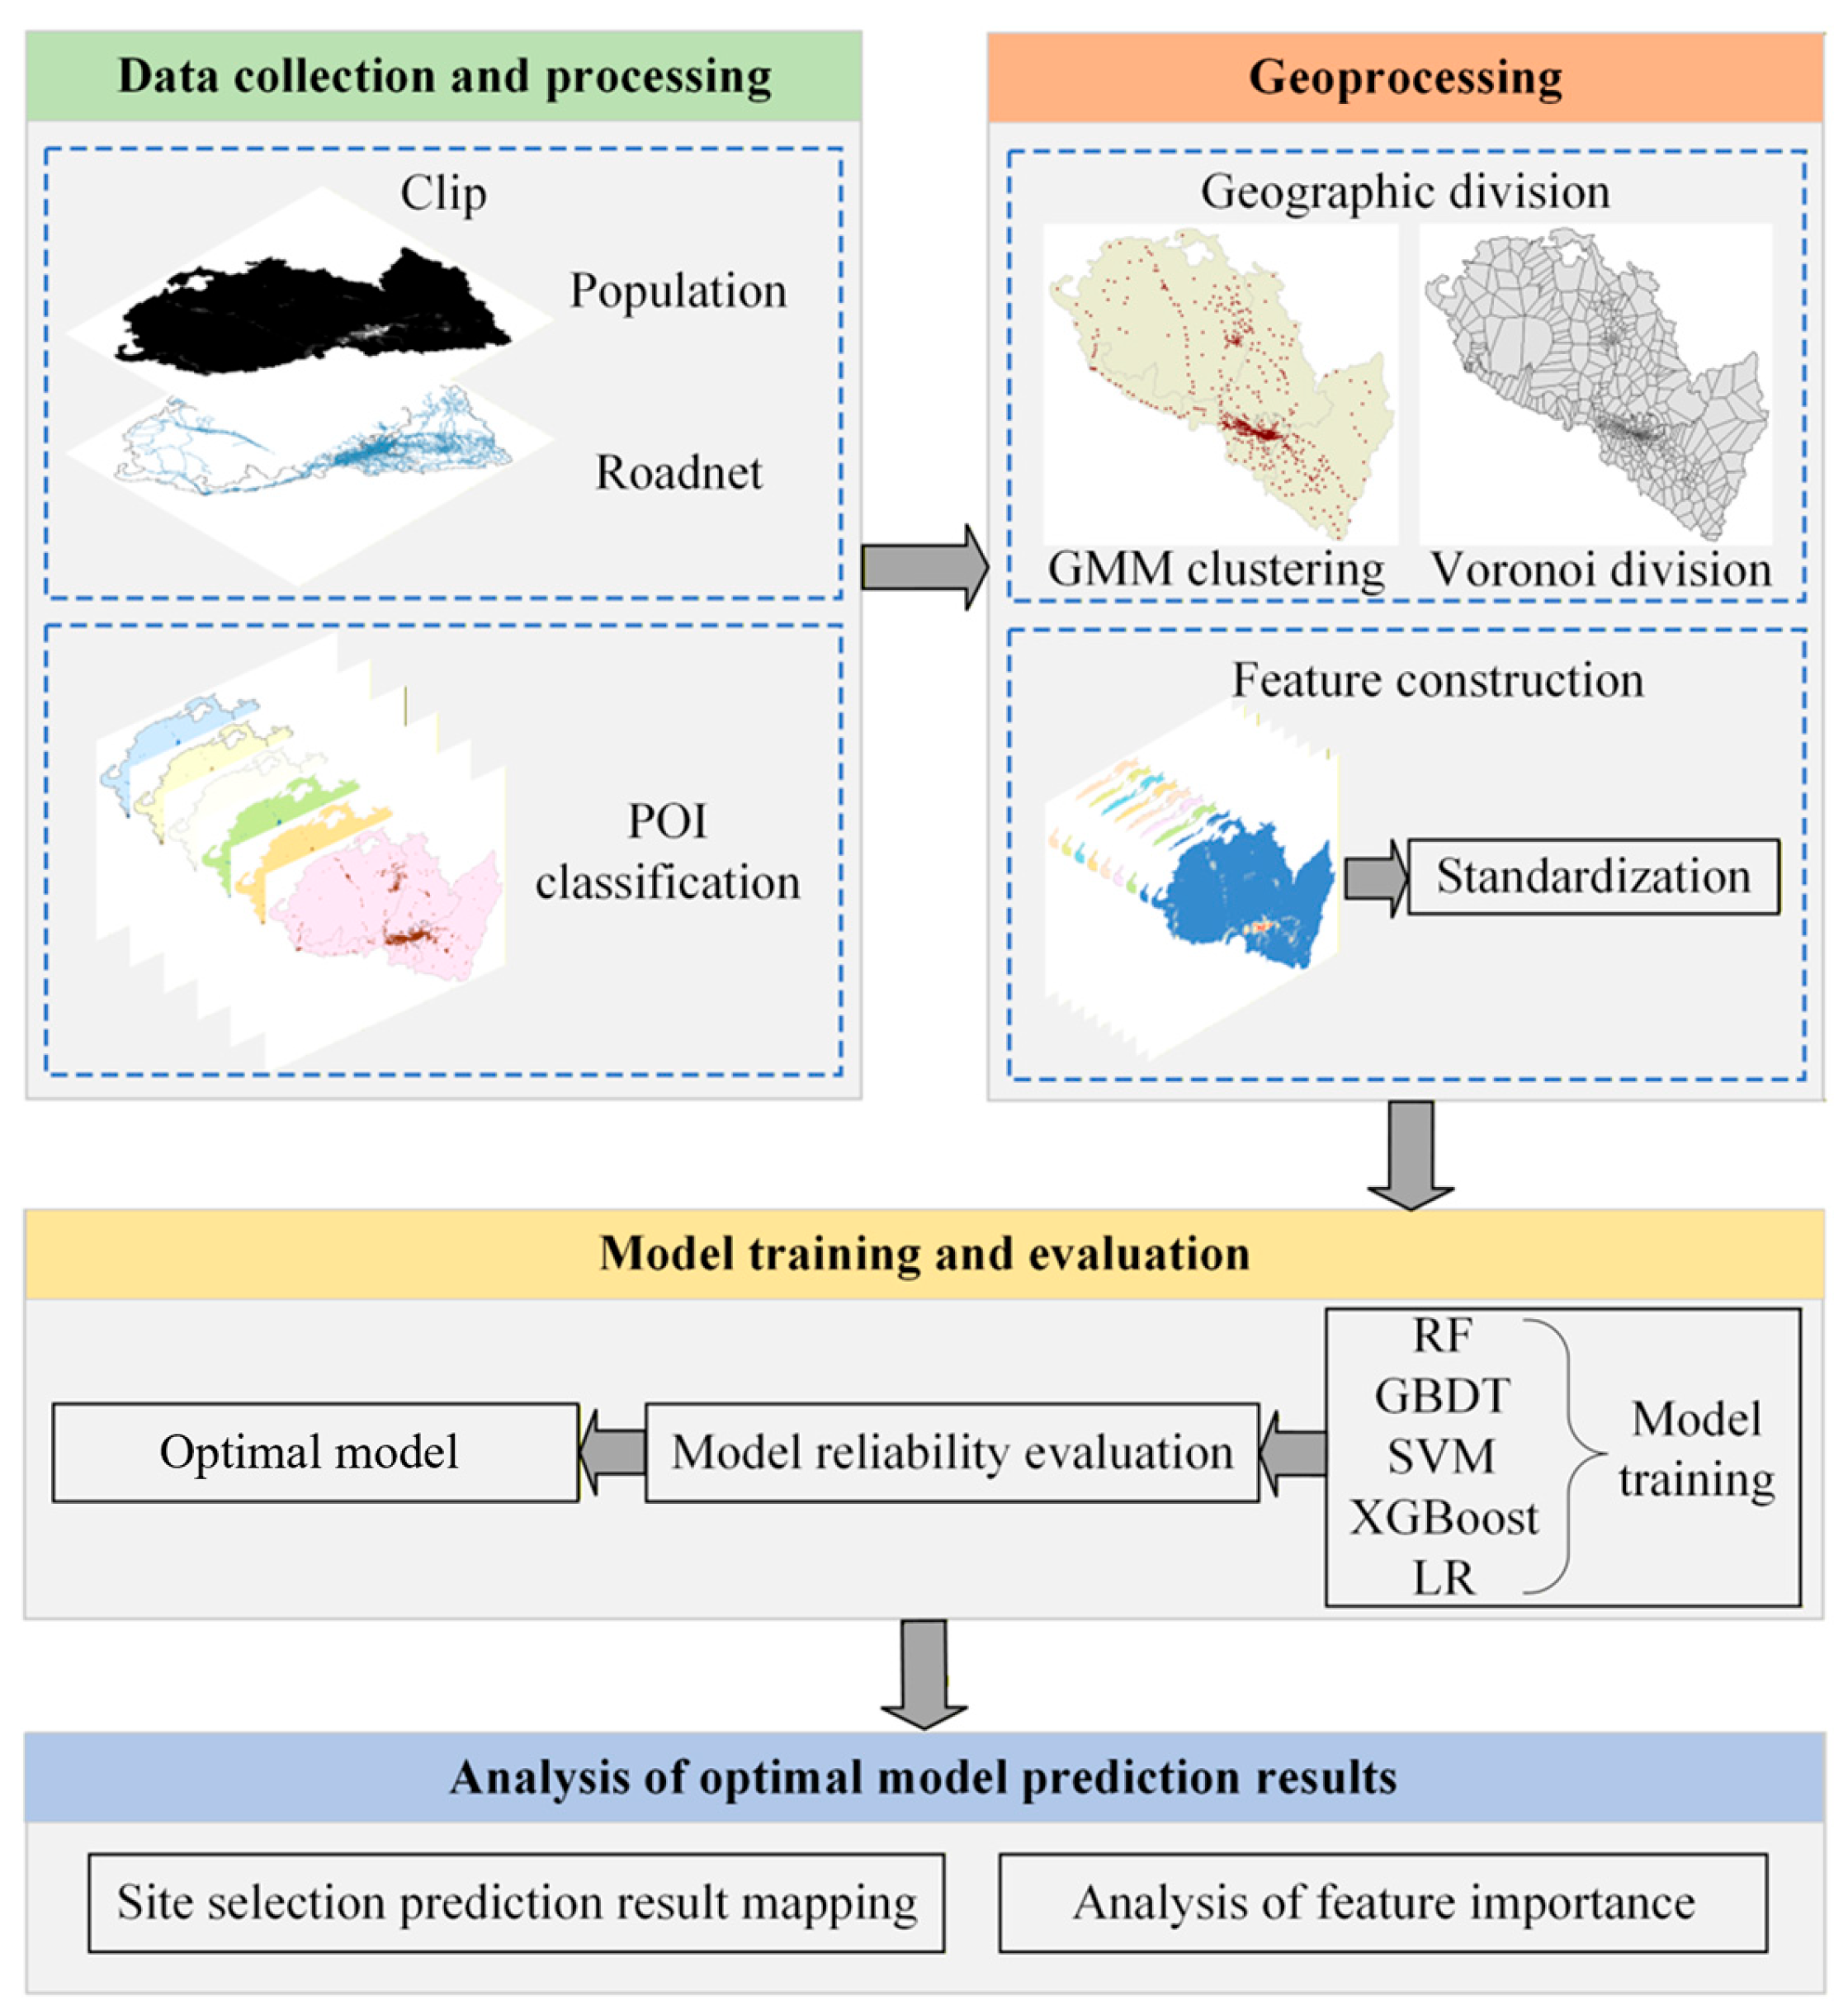
Existing research typically divides the study area into fixed-size grid cells [24,25], which ignores regional differences in population density, urban functions, and terrain. Fixed grid boundaries may also split key areas, reducing model accuracy and reliability. As a clustering method based on probability density estimation, GMM can effectively identify internal differences in urban areas through flexible soft division methods and make a more reasonable spatial division according to the characteristics of different regions. Unlike traditional hard clustering algorithms (such as K-means), GMM allows for soft clustering, where data points are assigned to clusters based on probabilities, which is particularly useful for handling overlapping data distributions. This flexibility makes GMM more suitable for capturing complex spatial patterns in urban areas [26]. This study therefore first uses GMM to cluster the study area, fully reflecting regional differences and improving the scientific basis for site selection decisions. Then, a feature matrix is constructed based on multi-source spatial data to provide rich input information for model training. Finally, various machine learning models are established to predict the optimal location of fire stations and their performance is evaluated and compared. The prediction results and driving factors are analyzed in depth to provide a scientific basis for optimizing the layout of urban fire stations. Figure 2 shows the technical route of the entire research method.
Figure 2.
Technical roadmap for location prediction of urban fire stations.
3.1. Region Partition Based on GMM
To overcome the limitations of the traditional regular grid division method, this paper proposes a regional division method based on GMM. By modelling the probability density of multidimensional data, GMM handles uncertainty and is not restricted by fixed grid boundaries [27]. Firstly, important functional points of the city are obtained from the Gaode map crawler in the form of POI data. These data cover areas where people frequently gather and areas with a high fire risk, providing a comprehensive description of fire demand characteristics in the study area. GMM is then used to cluster the POI data. This flexible allocation method is particularly effective in processing POI data with overlapping distributions and can more accurately identify areas in the city with similar fire demand characteristics. Fundamentally, GMM represents data as a weighted sum of finite Gaussian component densities. Model parameters are estimated via Maximum Likelihood Estimation (MLE). The probability density function is defined as:
In the formula: P(x) is the total probability density function; K is the number of Gaussian distribution; πi is the mixing coefficient of the i-th mixing component, reflecting the prior probability of each cluster; N(x|μi, Σi) is the probability density function of the i-th Gaussian distribution, where the mean value is μi and the covariance matrix is Σi, and is used to describe the spatial distribution characteristics of this cluster.
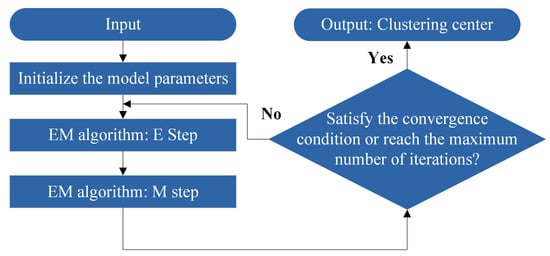
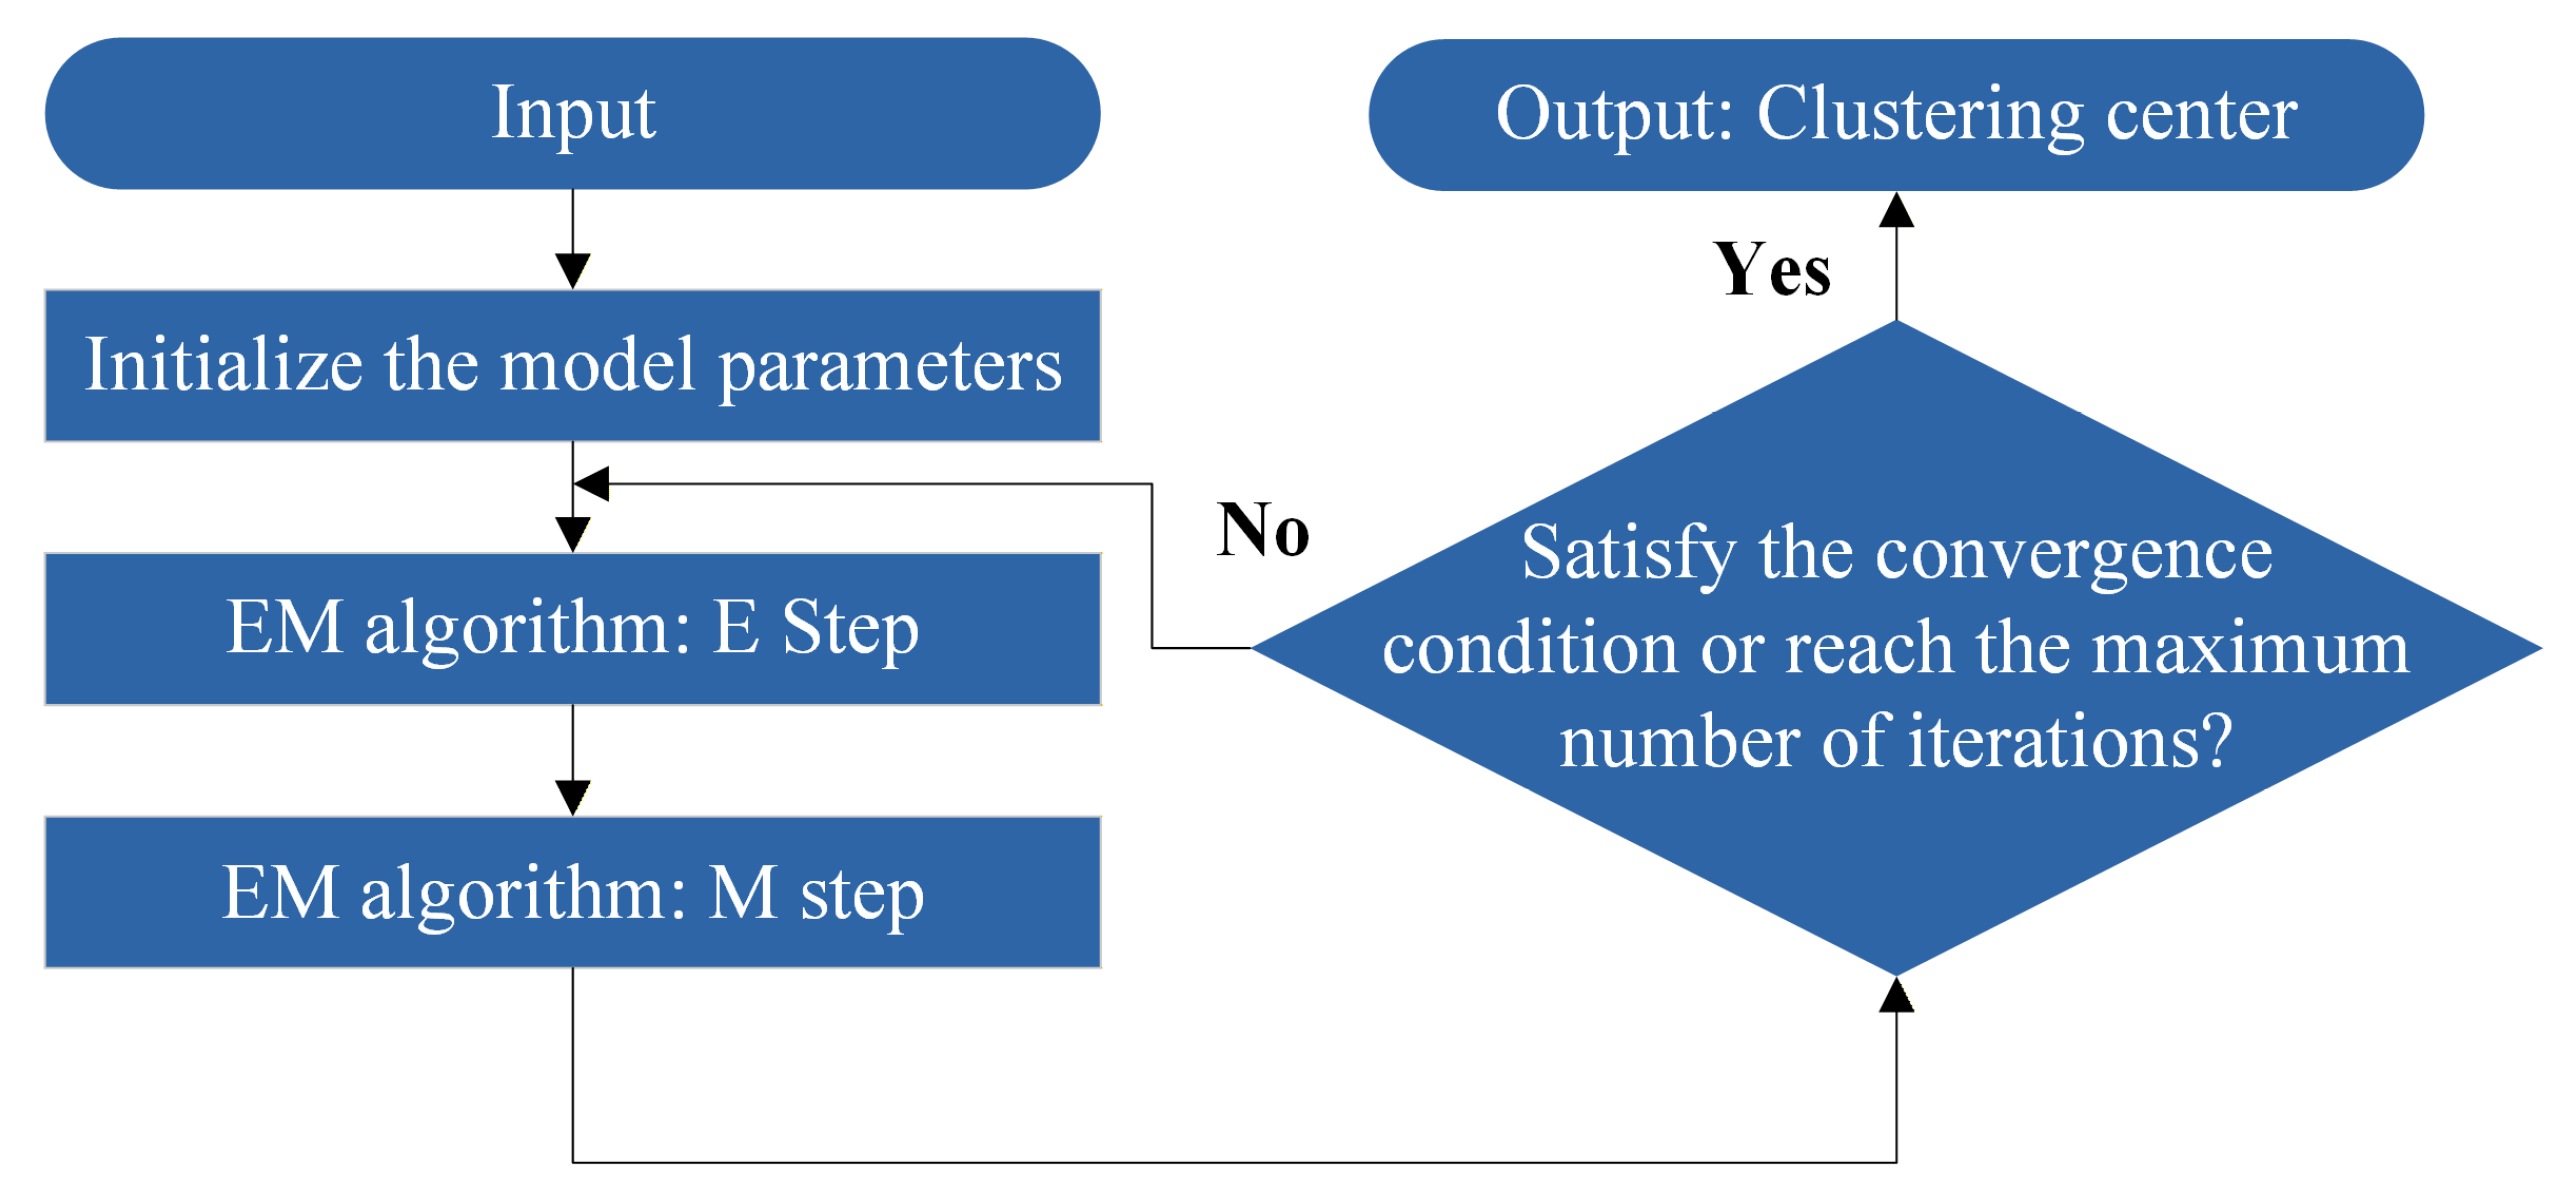
The GMM solution uses the Expectation Maximization (EM) algorithm to iteratively update model parameters and maximize the likelihood function. The EM algorithm consists of two steps: the E (Expectation) step, which estimates the posterior probabilities of the data points, and the M (Maximization) step, which re-estimates the Gaussian distribution parameters based on these probabilities. This process repeats until the change in parameters is below a threshold or the maximum number of iterations is reached, yielding a local optimal solution. Figure 3 illustrates this process, showing the initialization of model parameters, followed by the E and M steps, with a decision point checking convergence or iteration limits before outputting the clustering centers.
Figure 3.
GMM algorithm solving process.
The Bayesian Information Criterion (BIC) is used to select the number of clusters in the GMM algorithm. The BIC criterion balances model fitting accuracy and complexity to prevent overfitting, introducing a penalty term to avoid models becoming too complex. As the number of model parameters increases, the BIC increases the corresponding penalty term. When the number of training samples is large, this penalty term can effectively prevent the model from becoming overly complex [28]. The BIC calculation formula is as follows:
In the formula, k represents the number of parameters in the model, n represents the number of samples and L represents the model’s maximum likelihood estimation. A lower BIC value indicates that the model balances fitting accuracy and complexity better. This study employs this method to ensure the clustering results fit well and will not increase model complexity due to overfitting.
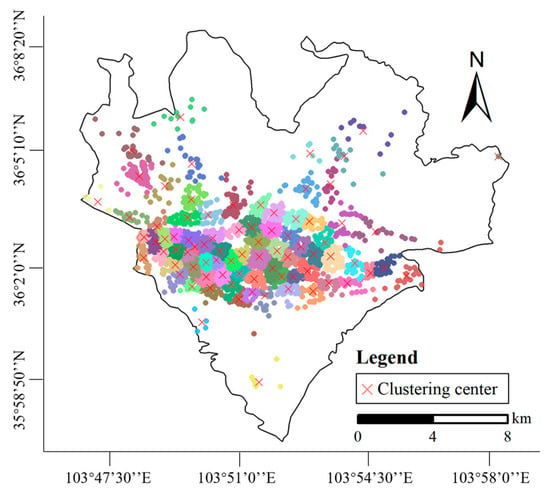
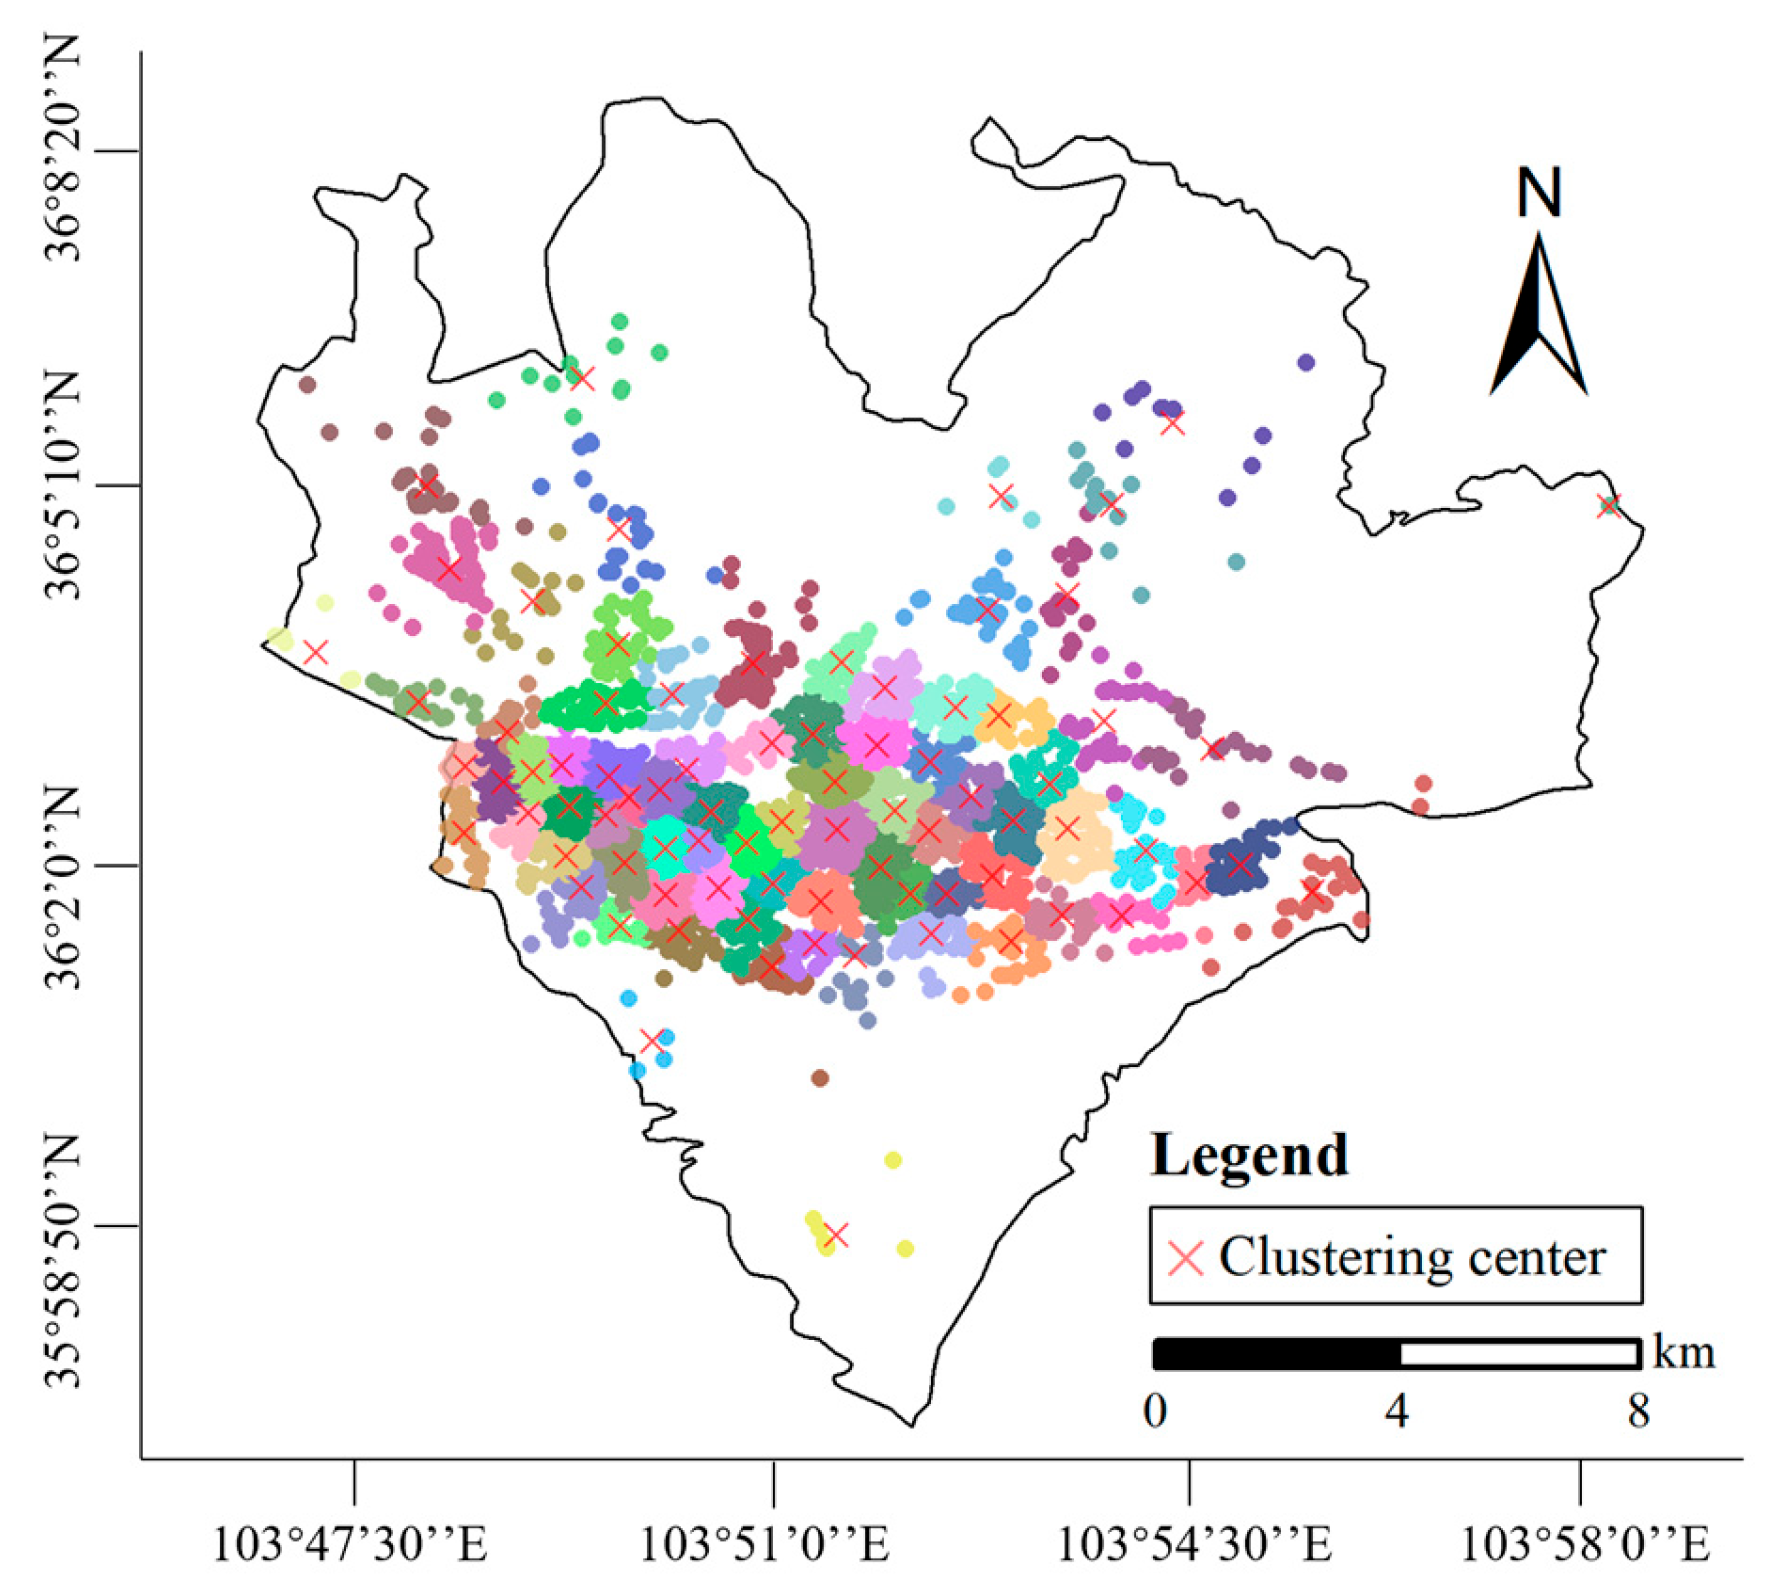
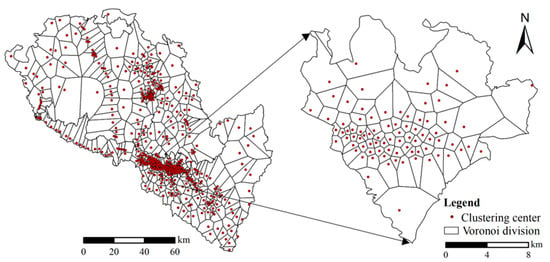
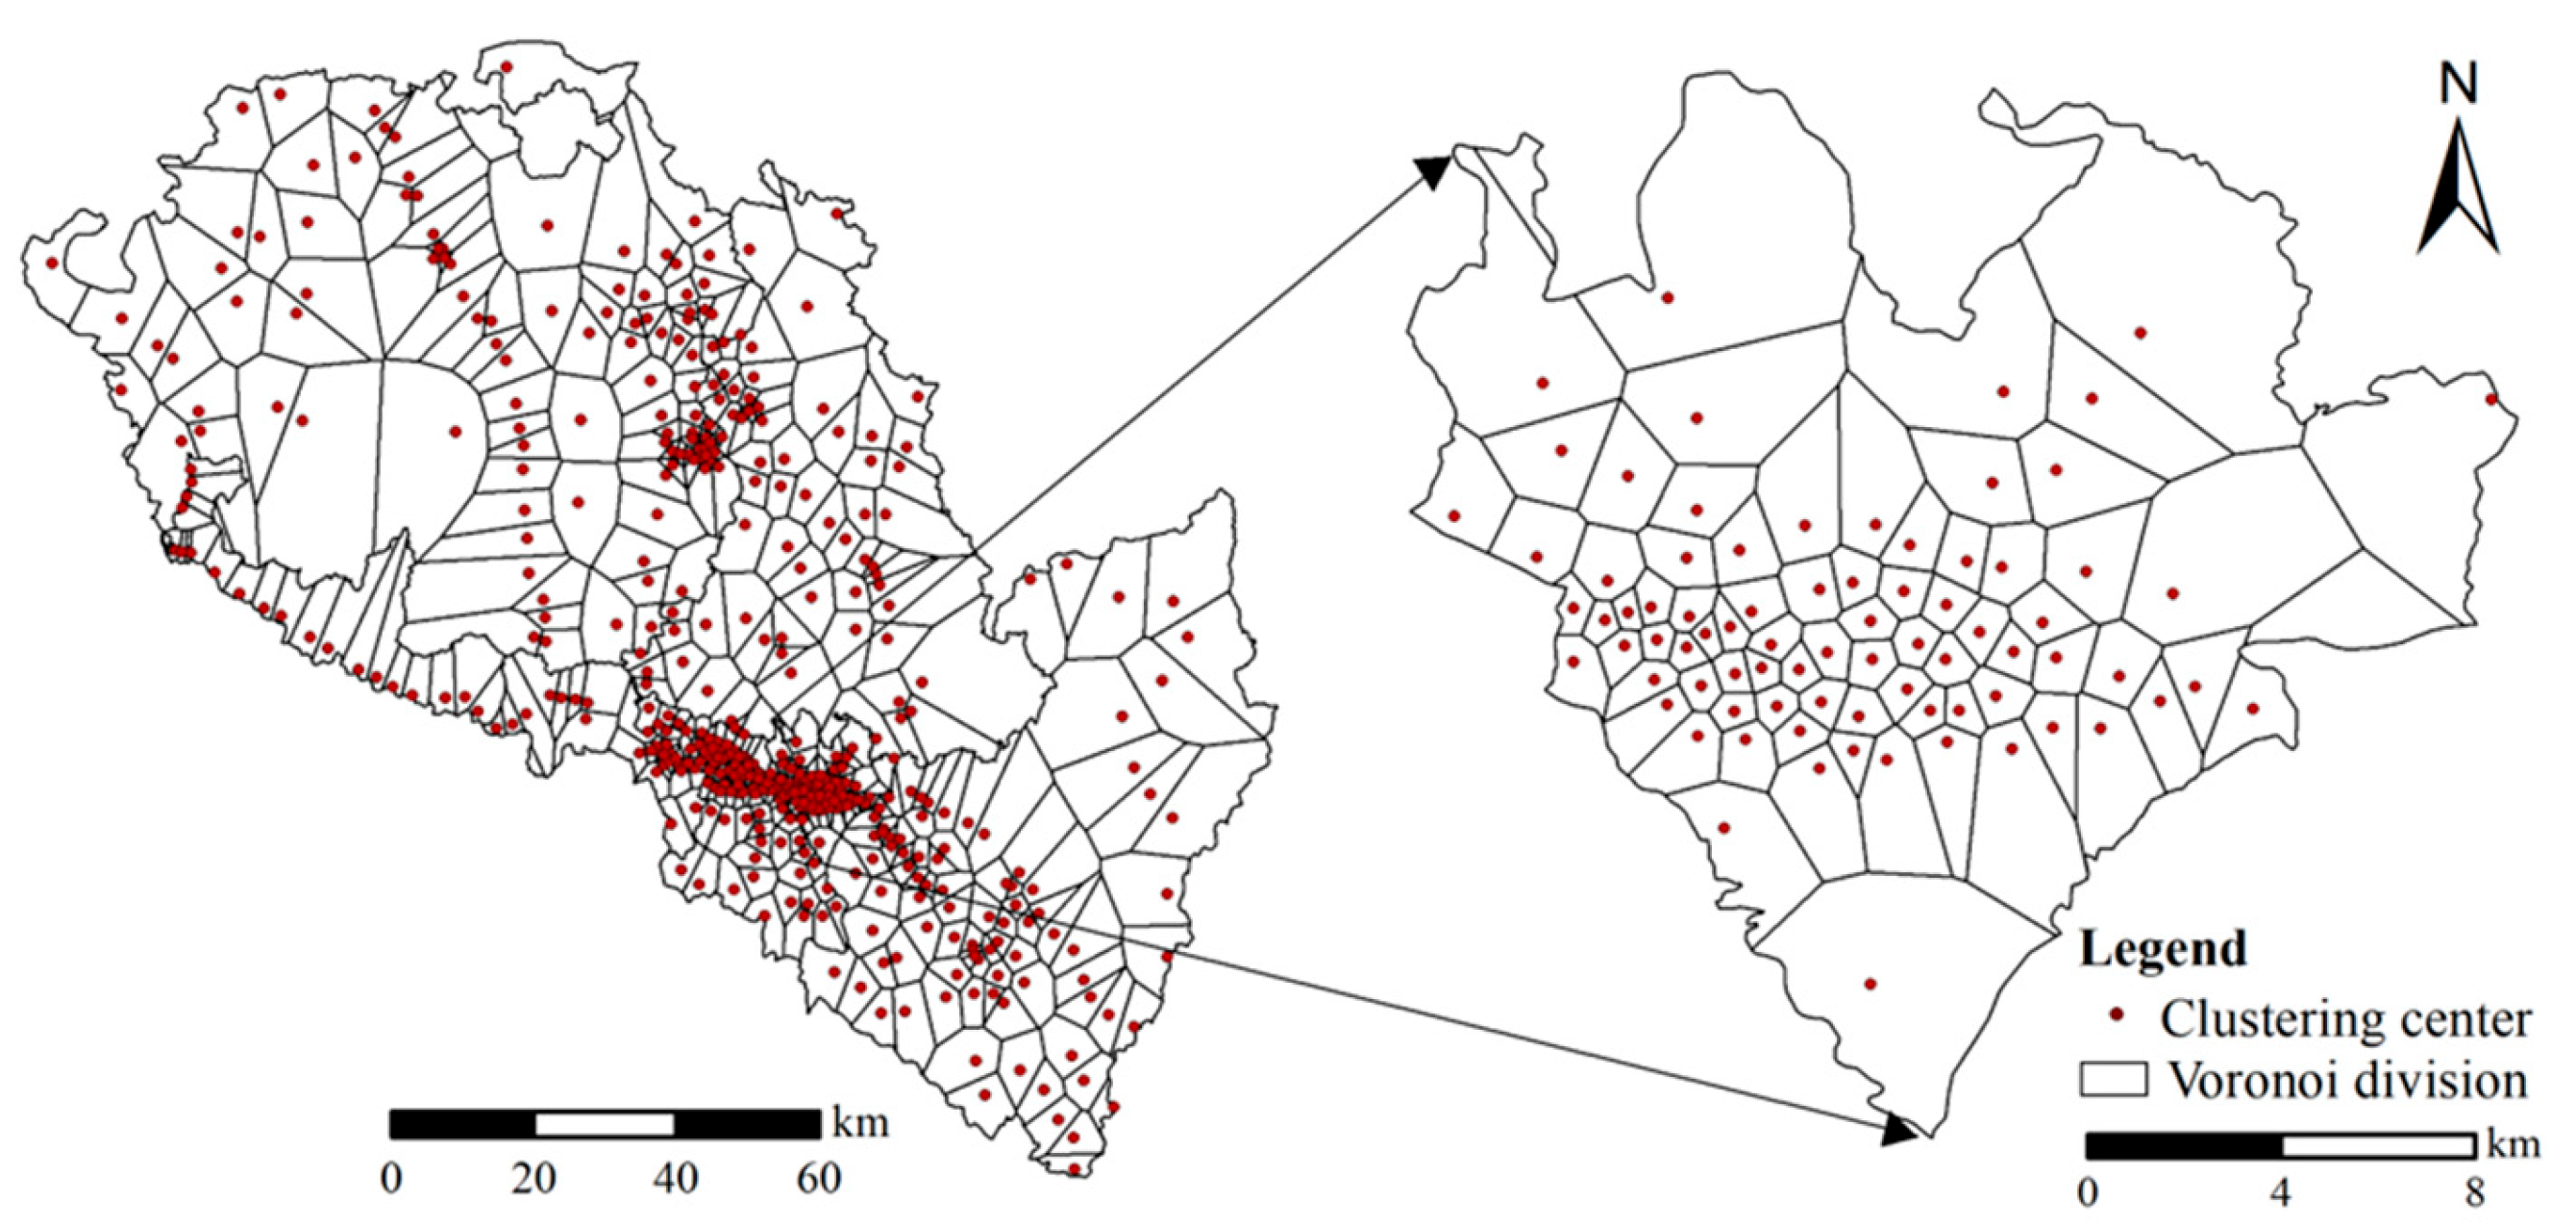
Figure 4 shows the final clustering results for points of interest (POIs) in Chengguan District based on GMM. In the figure, different colors represent distinct clusters, while the red “X” marks indicate the clustering centers. Once clustering is complete, a Voronoi diagram is constructed based on the clustering centres, dividing the research area into several irregular polygons. This provides a more accurate spatial division for subsequent analysis. Furthermore, the boundary characteristics of each district and county were taken into account when dividing the regions, Voronoi partitioning was performed separately within each district and county to ensure that the resulting regions did not cross administrative boundaries. The subdivided regions were then merged to form the complete study area, thus avoiding possible errors caused by the ambiguity of regional boundaries in traditional grid-based divisions. This method improves the accuracy and representativeness of regional division and can adapt flexibly to the city’s complex functional layout, providing a more accurate reference for the scientific location of fire stations. Figure 5 shows the regional division results of the study area based on GMM. The other districts and counties of Lanzhou City (excluding Chengguan District) are divided into 407 blocks in total, while Chengguan District is divided into 81 blocks in total. Finally, each block is labelled, with the block containing the existing fire station receiving a positive label to indicate that the fire service in this area is covered, while other blocks receive negative labels to provide strong support for subsequent fire station location prediction.
Figure 4.
POI clustering results based on GMM in Chengguan District.
Figure 5.
The results of regional division of Lanzhou city based on GMM.
3.2. Construction of Feature Matrix
A multi-dimensional feature matrix is constructed based on the relevant literature [29,30,31] and the characteristics of urban fires. The matrix’s feature selection is based on comprehensive consideration of fire demand, covering key factors such as point of interest (POI) distribution, road accessibility, population density and regional economic level. These features were proposed based on a comprehensive analysis of urban fire risks and the requirements for fire station site selection. Following the principles of scientific comprehensiveness, typicality and availability, the index system for the location of urban fire stations is constructed, as shown in Table 2.
Table 2.
Feature selection of urban fire station location prediction.
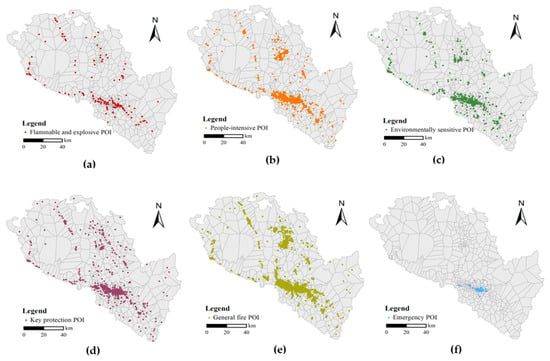
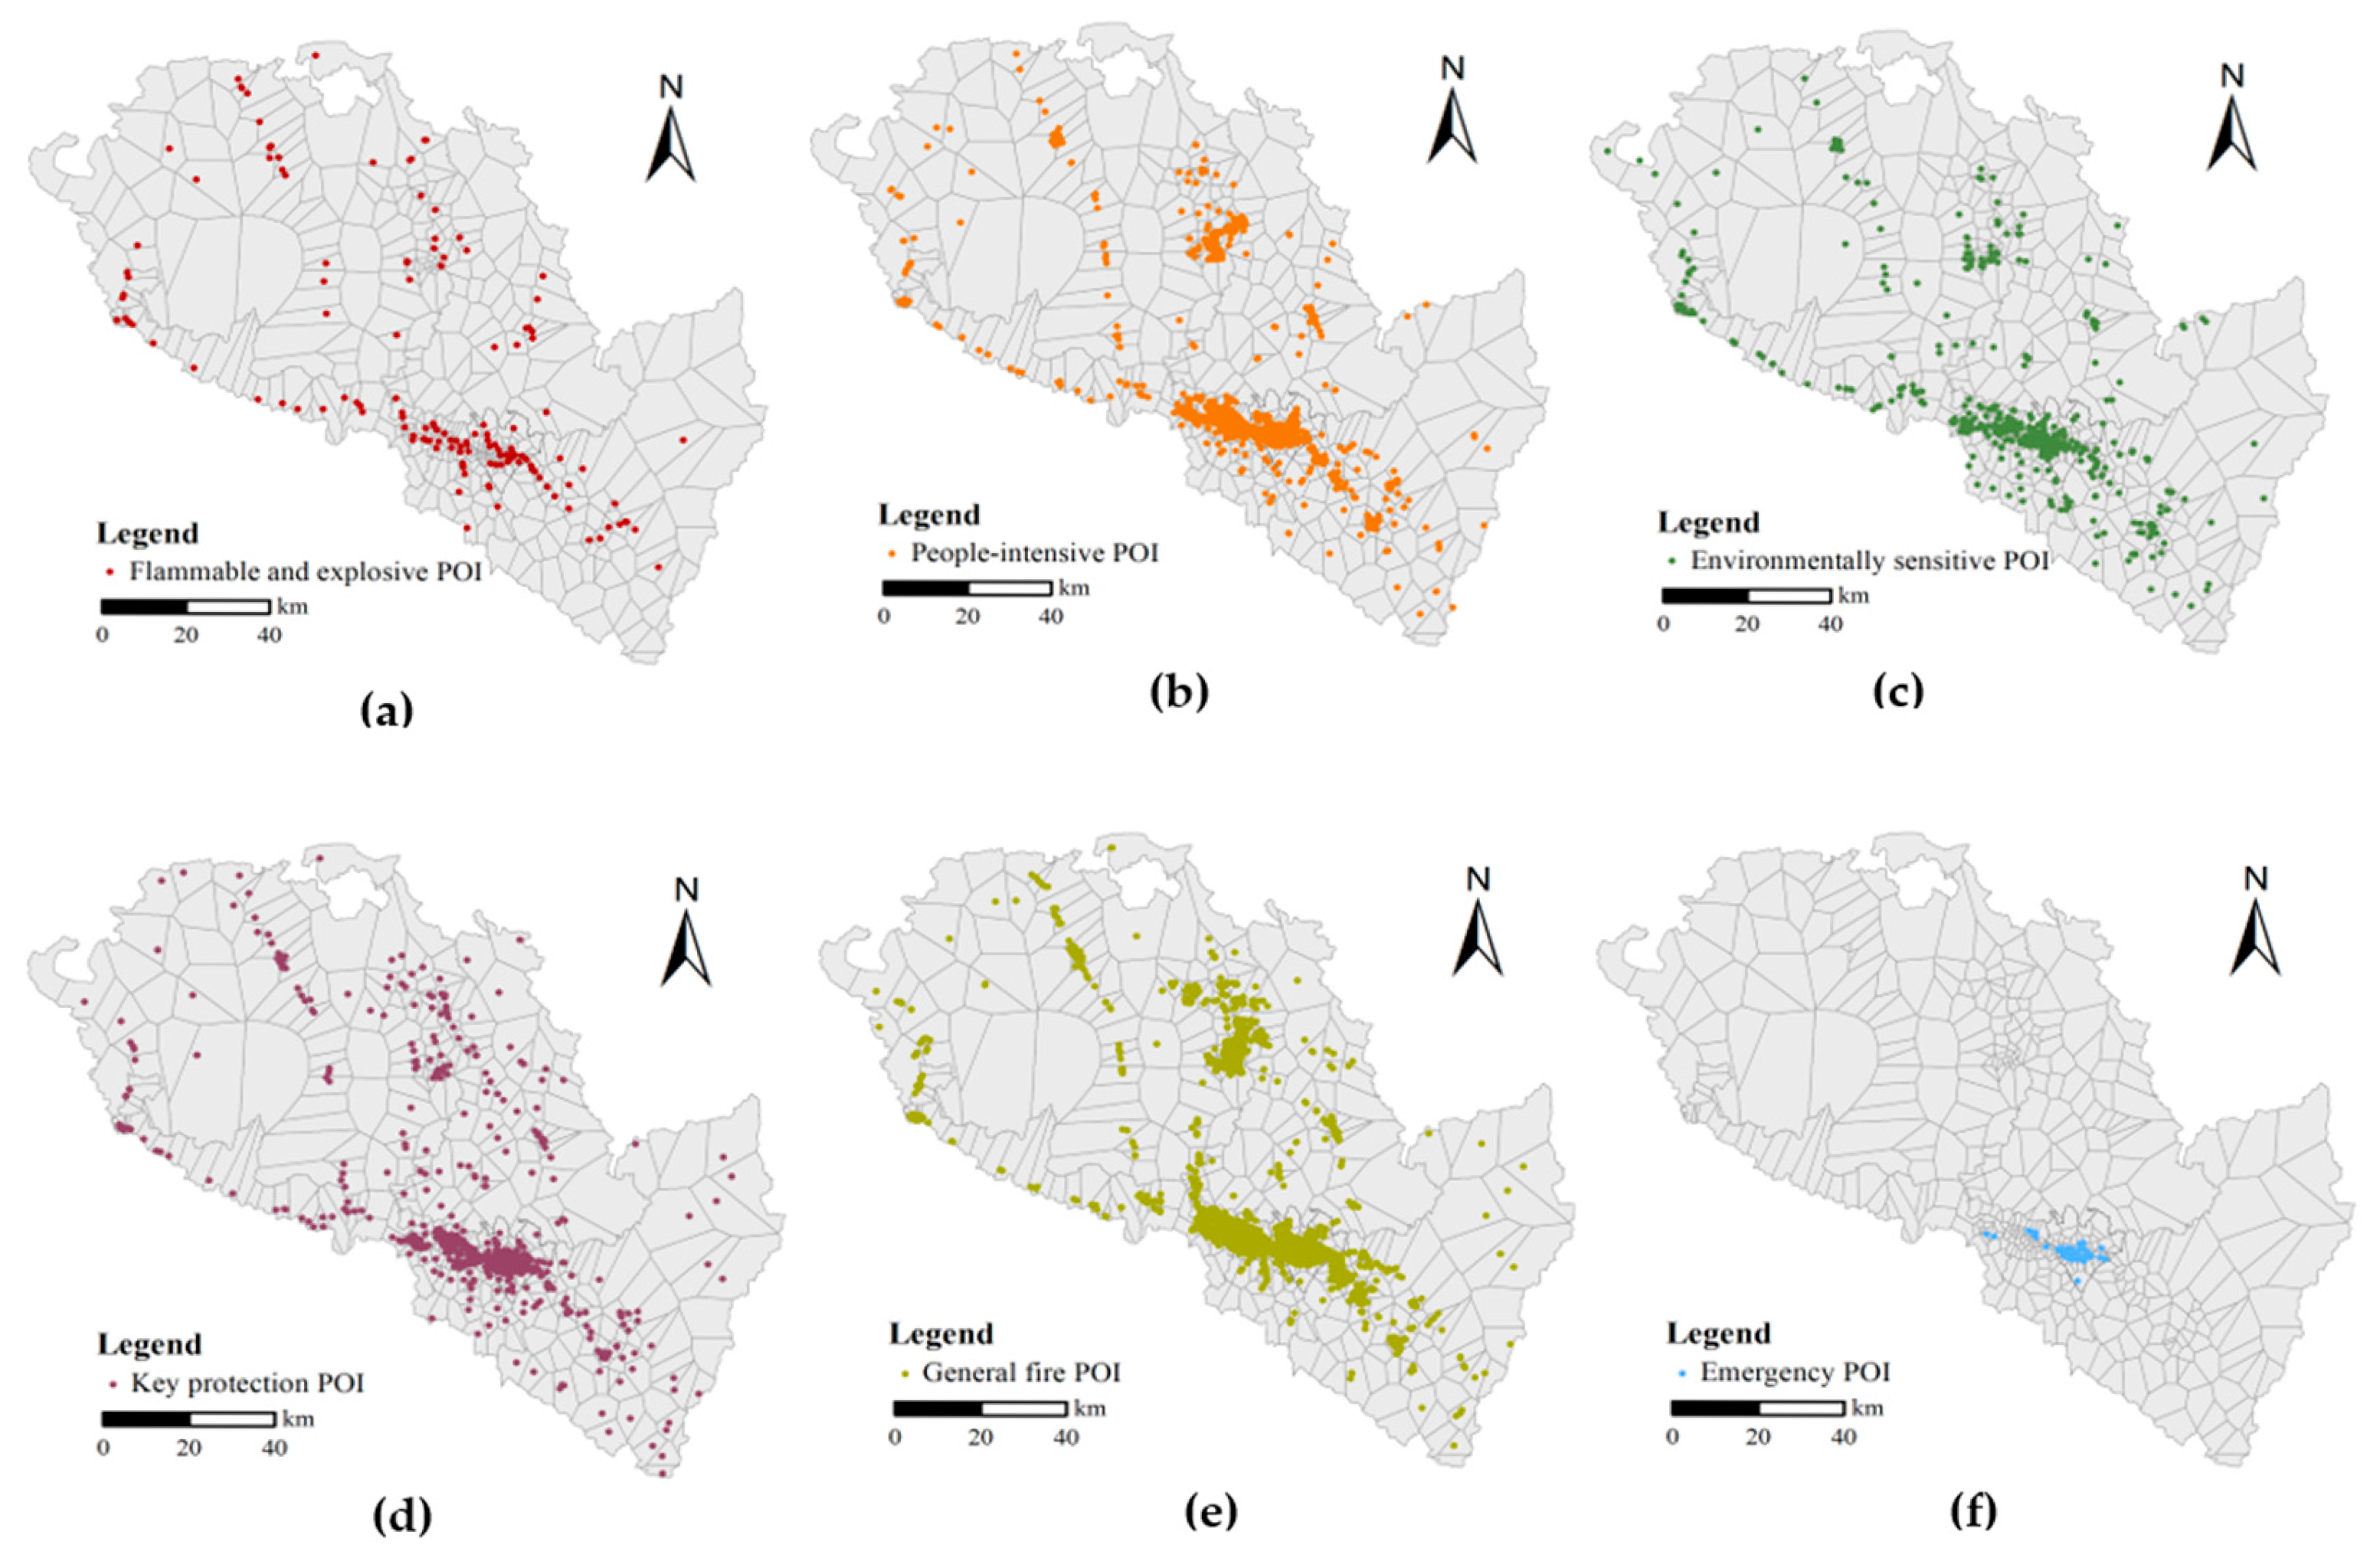
Among them, ‘flammable and explosive POI’ refers to places such as petrol stations and gas stations that are flammable or explosive. There are 280 such facilities in the study area. Fires in such places often spread rapidly and are difficult to control. People-intensive POIs cover a total of 2667 places, such as stations and shopping malls, highlighting the fire risk and evacuation problems that large crowds may cause. The environmentally sensitive POI category covers forest farms, parks, etc., totaling 888. Fires in these areas can cause serious damage to the environment, and the recovery process can be lengthy or even irreversible. The key protection POI includes 1805 places, such as scientific research institutions and museums. Fires may have a long-term impact on social, cultural, and scientific development. The general fire POI refers to 7403 places, such as residential areas and companies. Although fire loss in a single place may be relatively limited, the cumulative fire risk and potential loss cannot be ignored due to the large number of such places. The Emergency POI refers to 81 emergency shelters. These shelters are conducive to the evacuation and resettlement of personnel in the event of a fire, and are highly fire-resistant. The spatial distribution of these POI categories is shown in Figure 6.
Figure 6.
(a) Spatial distribution map of flammable and explosive POI; (b) Spatial distribution map of people-intensive POI; (c) Spatial distribution map of environmentally sensitive POI; (d) Spatial distribution map of key protection POI; (e) Spatial distribution map of general fire POI; (f) Spatial distribution map of emergency POI.
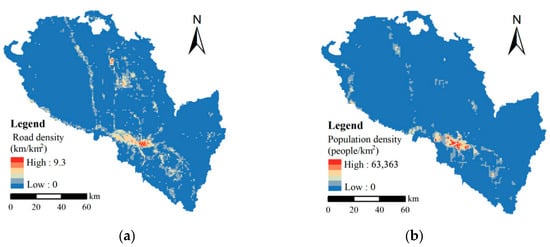
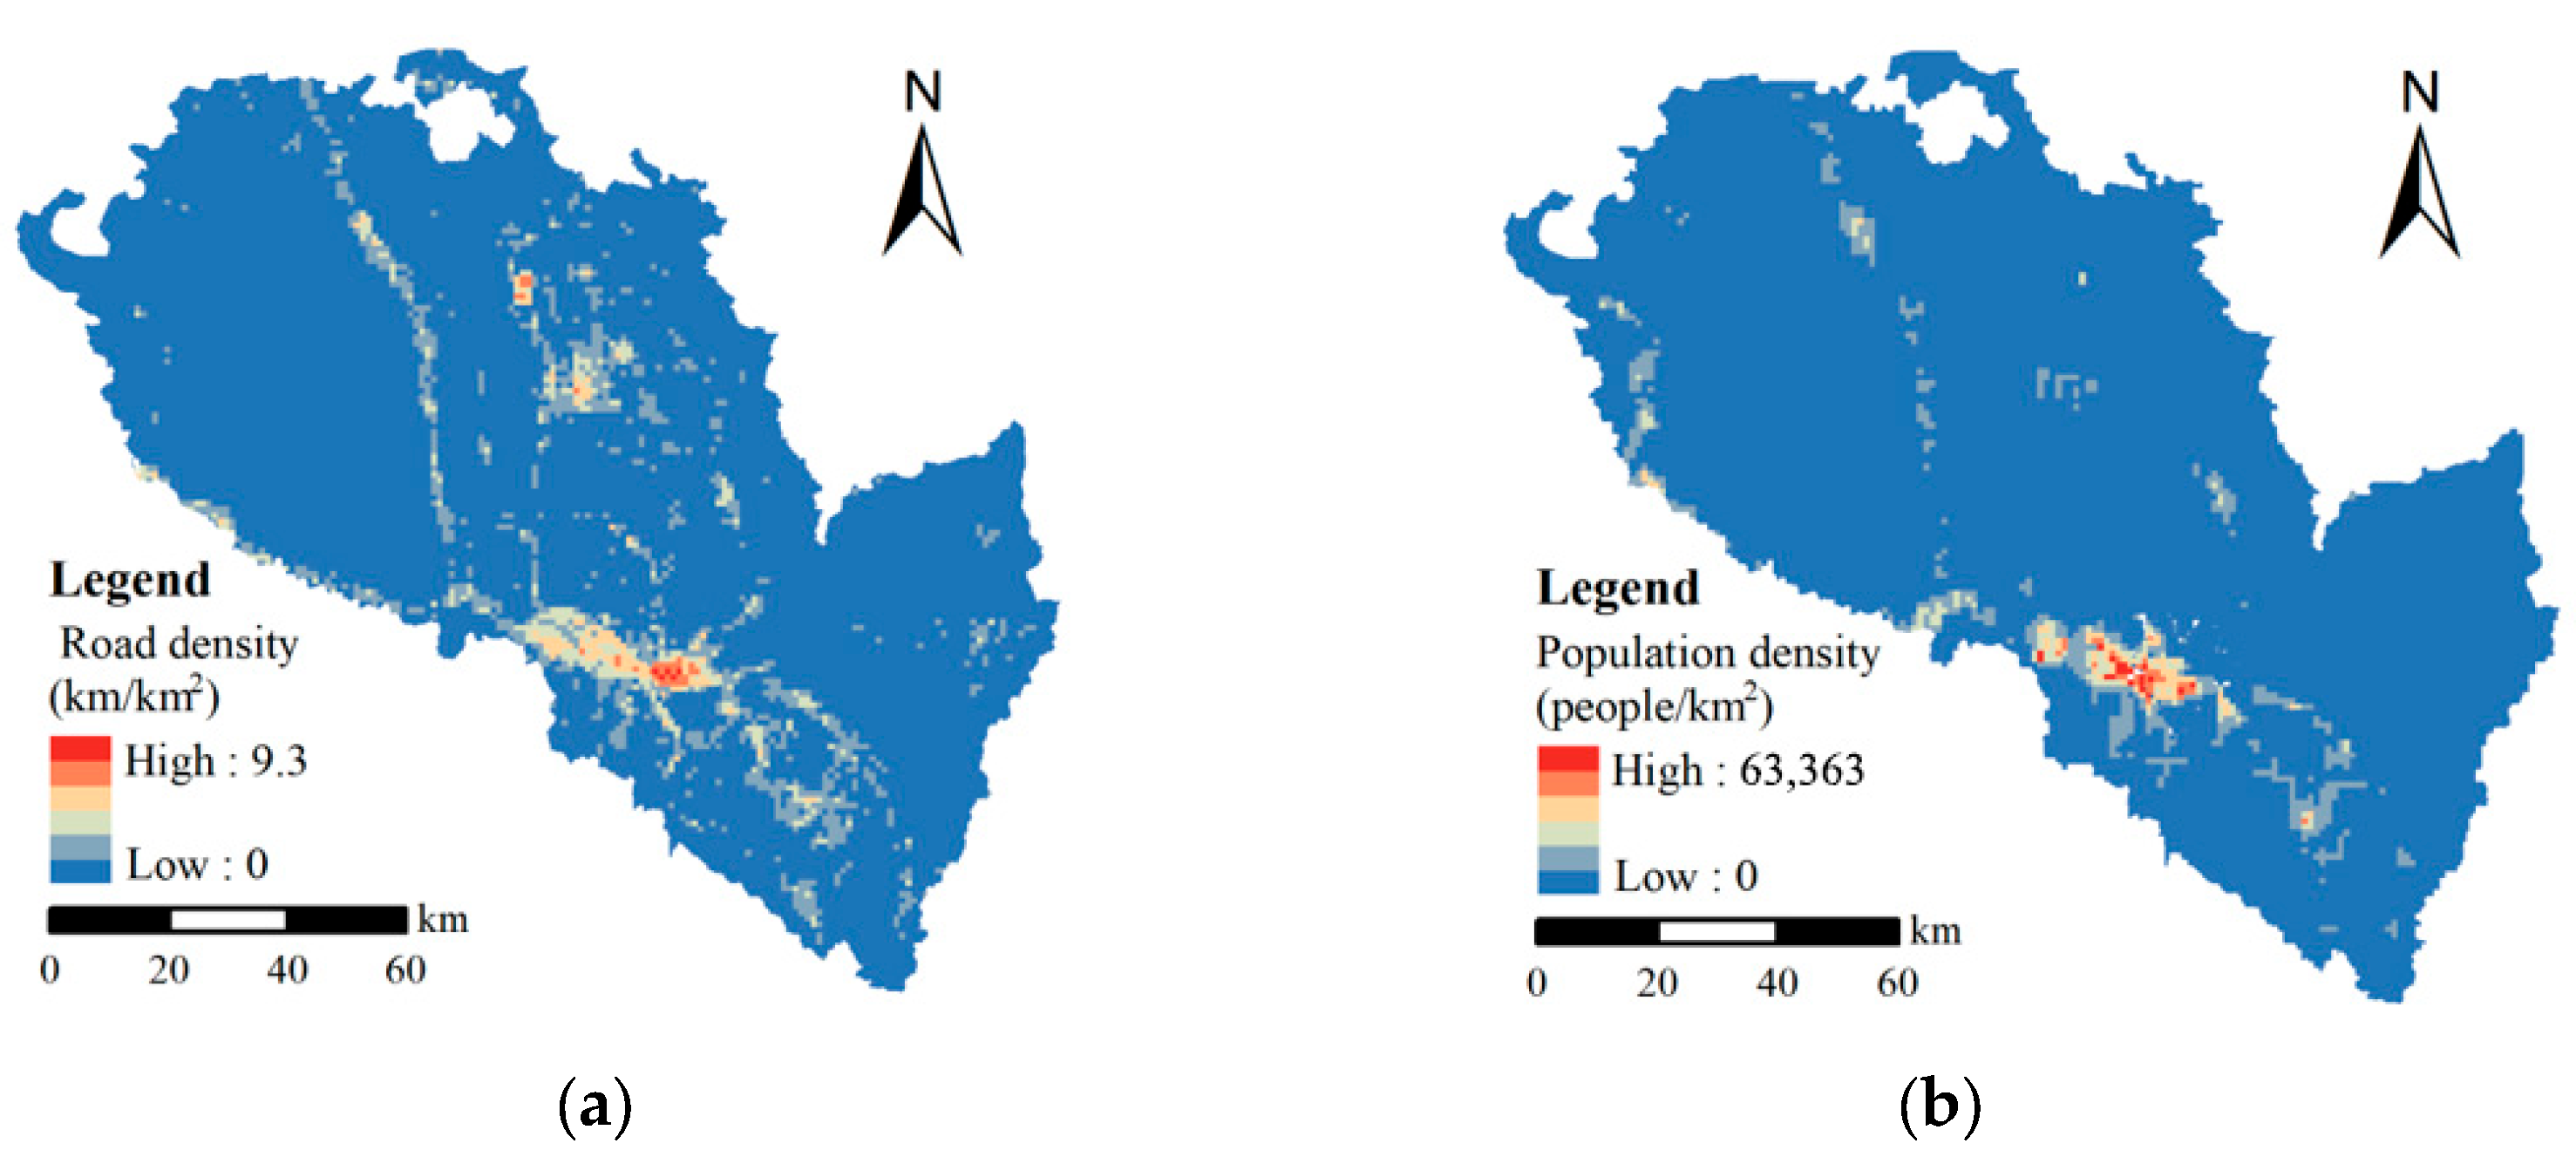
Furthermore, Figure 7 shows the road density and population density within the study area, respectively. The GDP values for Chengguan District, Qilihe District, Xigu District, Anning District, Honggu District, Yongdeng County, Gaolan County and Yuzhong County in Lanzhou City in 2023 were: 119,093,280,000 yuan, 60,037,620,000 yuan, 46,572,660,000 yuan, 30,581,250,000 yuan, 14,285,850,000 yuan, 14,439,790,000 yuan, 6,725,740,000 yuan and 19,557,080,000 yuan respectively. These features effectively describe the fire demand characteristics of each region, providing data support for subsequent machine learning model training.
Figure 7.
(a) Road density map of Lanzhou City; (b) Population density map of Lanzhou City.
Due to the significant differences in dimension and scale between the features, it is necessary to standardize the features further, eliminating proportional differences in the data while preserving its spatial distribution. This paper uses Z-score standardization (see Equation (3)), whereby the average value of each feature is subtracted and the result is divided by the standard deviation. This transforms the feature data into a standard normal distribution with a mean of 0 and a standard deviation of 1. This ensures that the model considers the influence of each feature more fairly during the prediction process.
In the formula: x is the eigenvalue; μ is the mean of eigenvalues; σ is the standard deviation of the eigenvalue; z is the standardized value.
3.3. Sample Balance and Model Training
Due to the imbalance of positive and negative samples, this paper uses the Synthetic Minority Over-sampling Technique (SMOTE) to balance the dataset. SMOTE is a technique for generating synthetic minority samples. It works by generating new synthetic samples through the interpolation of adjacent minority samples [32]. This method effectively increases the number of minority samples while ensuring data diversity. This enables the machine learning model to better learn the characteristics of minority samples during the training process and improves its ability to classify positive and negative samples. The operating steps are as follows:
- (1)
- Calculate the nearest neighbor: for each sample from the minority class, calculate its k nearest neighbors.
- (2)
- Determine the sampling rate: According to the proportion of positive and negative classes in the sample, a reasonable sampling rate(N) is determined. This determines how many synthetic samples each minority class sample needs to generate.
- (3)
- Randomly select neighbors: For each minority class sample a, randomly select a sample b from its k neighbors.
- (4)
- Generate synthetic samples: A point c is randomly selected on the line between samples a and b as a new synthetic minority sample, as follows:
When dealing with complex spatial data, different ML models have their own advantages and disadvantages. To accurately predict the location requirements of urban fire stations, this paper compares the performance of five widely used ML models to determine the optimal model for final location prediction. The selected models are: Random Forest (RF), Gradient Boosting Decision Tree (GBDT), Support Vector Machine (SVM), Extreme Gradient Boosting (XGBoost), and Logistic Regression (LR). These models are classical algorithms that are commonly used for classification tasks and can effectively handle complex data.
The model training process strictly adhered to the principle of dataset isolation. The training set consisted of data from Lanzhou’s districts excluding Chengguan District, which was divided into 407 blocks (samples). The test set consisted of data from Chengguan District, which was divided into 81 blocks (samples). For cross-validation, 20% of the training data (from the 407 blocks) was randomly selected as a validation set in each fold. This process was repeated 10 times using 10-fold cross-validation, where the model was trained on 9 subsets and validated on the remaining subset. The results were averaged to provide a robust performance metric. The 407 spatial units from the non-Chengguan districts were used for model training and 10-fold cross-validation to optimize hyperparameters. The 81 spatial units of Chengguan District were kept completely isolated during the training phase and were introduced only in the final stage to evaluate the model’s predictive performance and analyze site selection validity. This approach effectively prevents overfitting and demonstrates the model’s ability to transfer learned rules to new urban environments. Furthermore, SMOTE is only applied to the training data, and is independently applied within each training fold during cross-validation. To avoid distorting spatial patterns, spatial coordinates are excluded from the oversampling process, and only non-spatial features are used for generating synthetic samples. After applying SMOTE, the number of positive samples increased from 44 to 121, while the number of negative samples remained unchanged (n = 363). As a result, the total number of training samples increased to 484, improving class balance to a 1:3 ratio and enhancing the model’s ability to learn from the minority class without altering the majority class distribution. The following provides a brief introduction to each ML model, and Table 3 shows the specific parameter settings for each model.
- (1)
- RF model
RF is an ensemble algorithm based on a decision tree that classifies data by constructing multiple decision trees and using a voting mechanism [33]. When constructing each tree, the model randomly samples the data and introduces randomness when selecting the splitting features of each node. This reduces overfitting and enhances the model’s generalization ability. The model output is finally determined by majority voting [34].
- (2)
- GBDT model
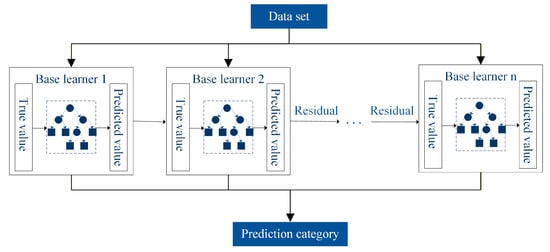
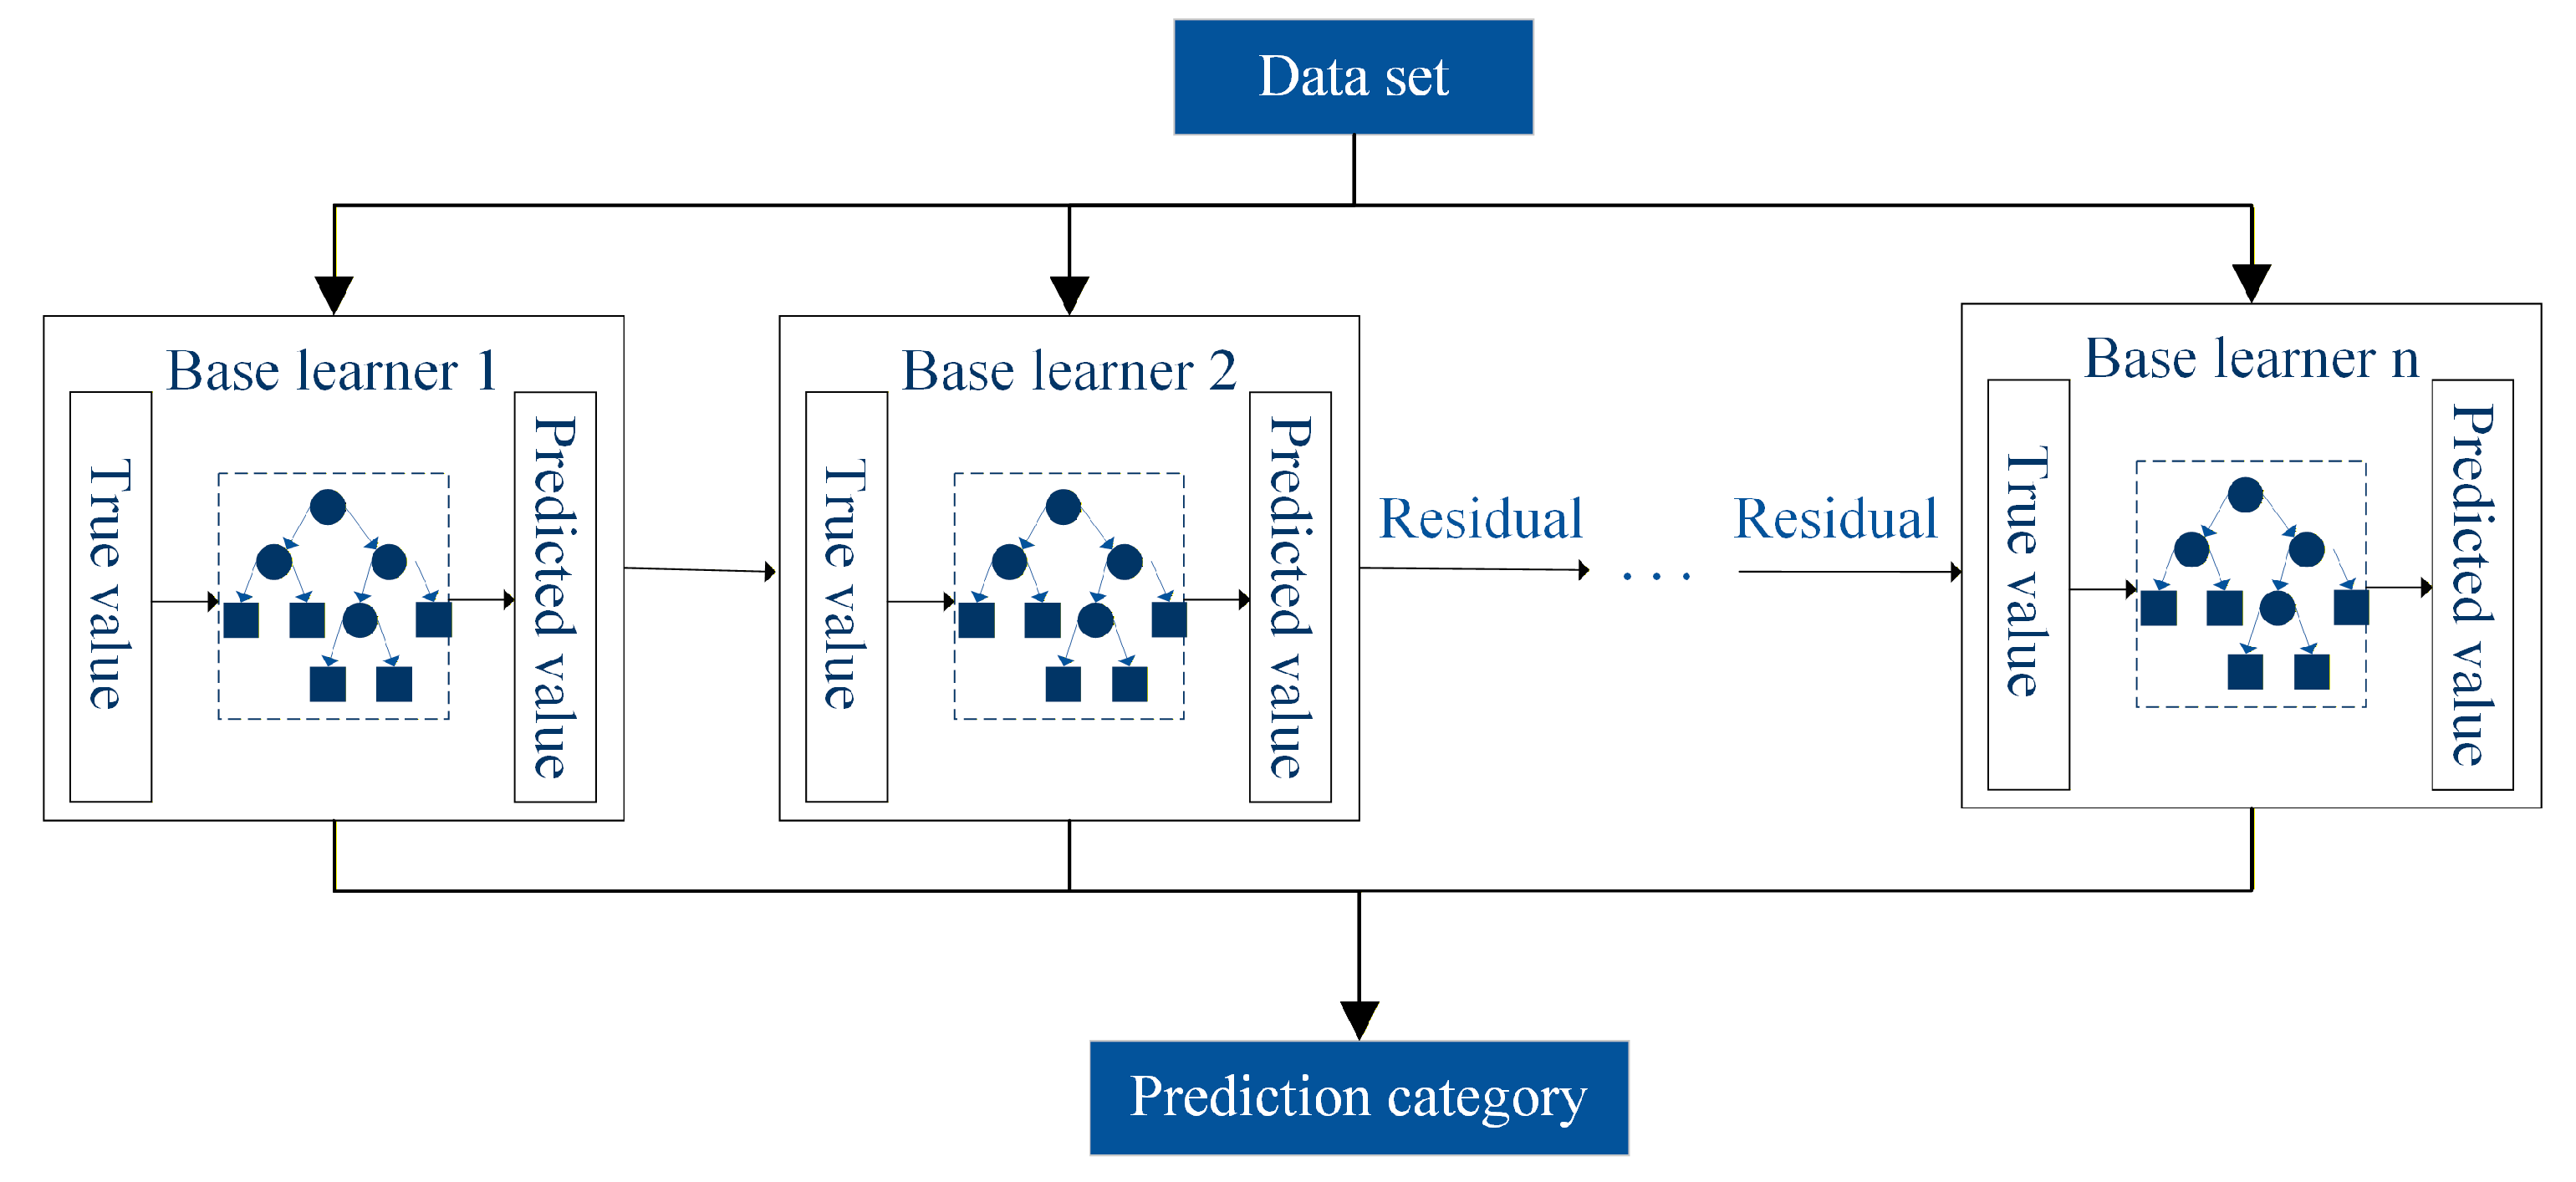
The GBDT model is a gradient boosting algorithm based on the CART regression tree [35]. The core idea is to iteratively construct a new decision tree to fit the residuals of the previous step—that is, the difference between the target and predicted values—so that the model gradually approaches the true value. GBDT improves prediction accuracy by continuously minimizing the loss function [36], and its training process is shown in Figure 8.
Figure 8.
Schematic diagram of GBDT model training principle.
- (3)
- SVM model
SVM is a commonly used pattern classification algorithm which aims to find the best hyperplane in high-dimensional space to distinguish between different types of data as accurately as possible while ensuring the maximum possible separation between categories [37]. To deal with nonlinear classification problems, SVM maps the original data to a higher-dimensional feature space using kernel functions to achieve more effective classification.
- (4)
- XGBoost model
XGBoost is an efficient, flexible machine learning algorithm based on the gradient boosting framework that is widely used for classification and regression tasks [38]. It optimizes the model by gradually constructing a decision tree and uses a weighted voting method to synthesize the output of each tree, thereby improving the model’s overall accuracy.
- (5)
- LR model
LR is a commonly used supervised learning method for binary classification problems. By introducing the sigmoid function, the logistic regression model can transform the output of linear regression into a probability value between 0 and 1 in order to perform the classification task [39].
Table 3.
Model hyperparameter settings.
4. Result Analysis
After training and verifying the model, this paper evaluates and compares the performance of various ML models. The aim is to verify the performance and effectiveness of each model in predicting the location of urban fire stations. Firstly, the classification performance of the model is analyzed using the standard evaluation index, and the optimal urban fire station location prediction model is obtained. Next, based on the optimal model’s prediction results, the location of fire stations in the study area is discussed in depth and the degree of alignment between the existing fire station layout and the prediction results is analyzed. Combined with feature importance analysis, key factors influencing fire station location decisions are explored further. Finally, feasible layout optimization suggestions are proposed based on the research results to improve the service coverage and response efficiency of fire stations, thereby ensuring an improvement in urban fire safety.
4.1. Model Reliability Assessment
Common metrics such as precision, recall and the F1 score are widely used in the analysis of classification problems when evaluating the performance of machine learning models. These indicators are calculated using a confusion matrix, which describes the model’s accuracy and coverage in predicting positive samples. However, these indicators may not fully reflect the actual performance of the model when faced with the problem of category imbalance. The area under the ROC curve (AUC) provides a more comprehensive evaluation method. By examining the model’s classification performance under various decision thresholds, it avoids the possible bias caused by focusing on a single indicator and intuitively demonstrates the model’s classification ability. It is also unaffected by category imbalance. Based on this, this paper combines the confusion matrix and the AUC under the ROC curve to evaluate model performance.
(1) Confusion matrix: Based on the confusion matrix, Precision, Recall, and F1 score are used to measure the classification performance of the model. The calculation formula is as follows:
In the formula: TP is the true number of classes; FP is a false positive class number; FN is a false negative class number. The precision rate measures the proportion of the model ‘s correct prediction of the positive class, while the recall rate measures the coverage of the model for all actual positive samples. The F1 score is the harmonic mean of the precision rate and the recall rate.
(2) AUC area: Calculating the area under the ROC curve provides a more comprehensive test of the model’s performance. The calculation formula is as follows:
In the formula: M is the number of positive samples; N is the number of negative samples; ranki is the ranking of positive sample i in all sample rankings. The closer the AUC value is to 1, the stronger the model classification performance is.
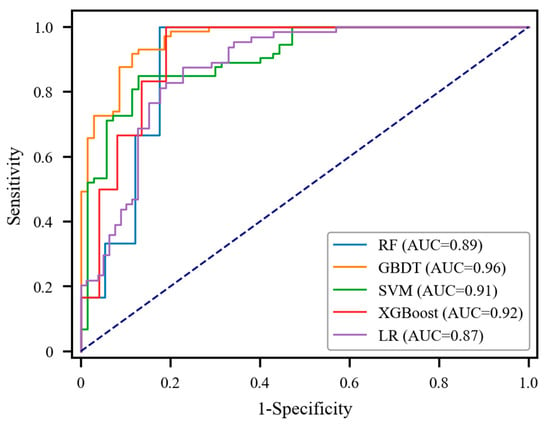
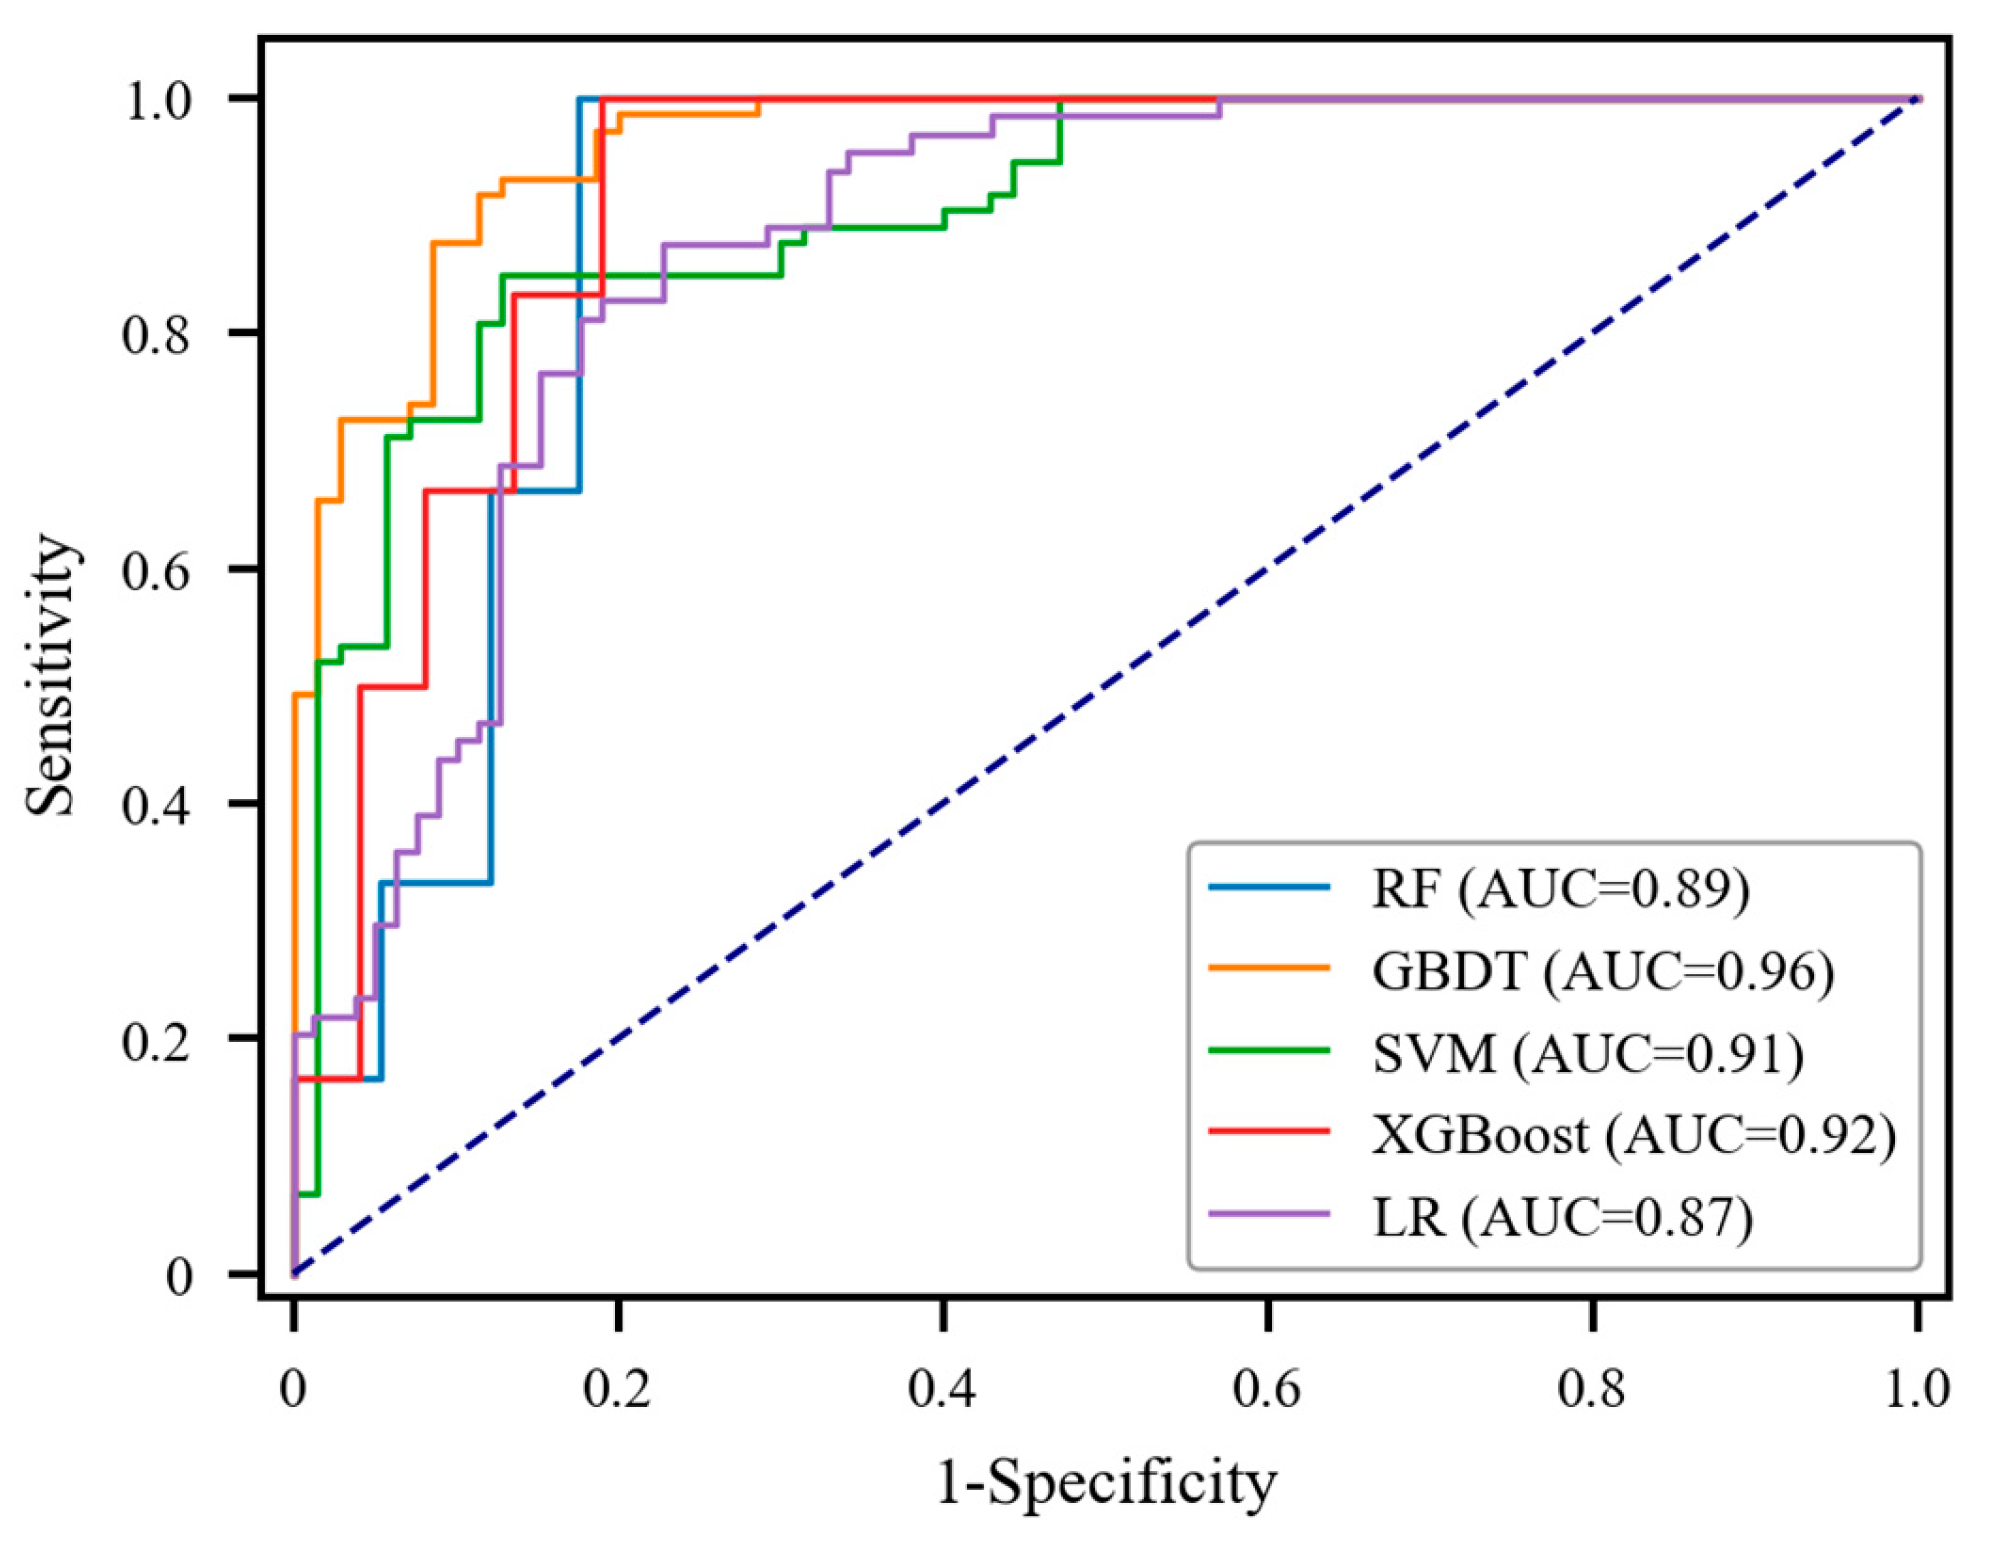
The classification performance of five machine learning models is evaluated based on the above indicators. The results are presented in Table 4 and Figure 9. The GBDT model performed best on all indicators, with an AUC value of 0.96, demonstrating strong classification ability and good generalization performance. The SVM and XGBoost models also performed well, with respective AUC values of 0.91 and 0.92. This indicates that they can make accurate classification judgements under most decision thresholds and have good application potential. In contrast, the RF and LR models performed slightly worse; the LR model performed particularly poorly in all indicators.
Table 4.
Performance evaluation results of five machine learning models.
Figure 9.
ROC curve and AUC area fitted by five machine learning models.
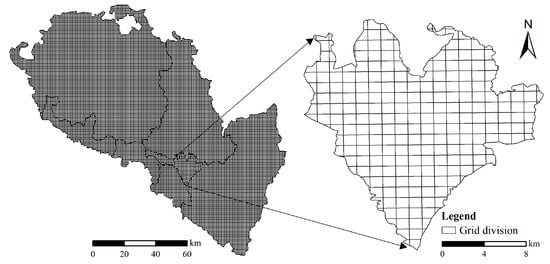
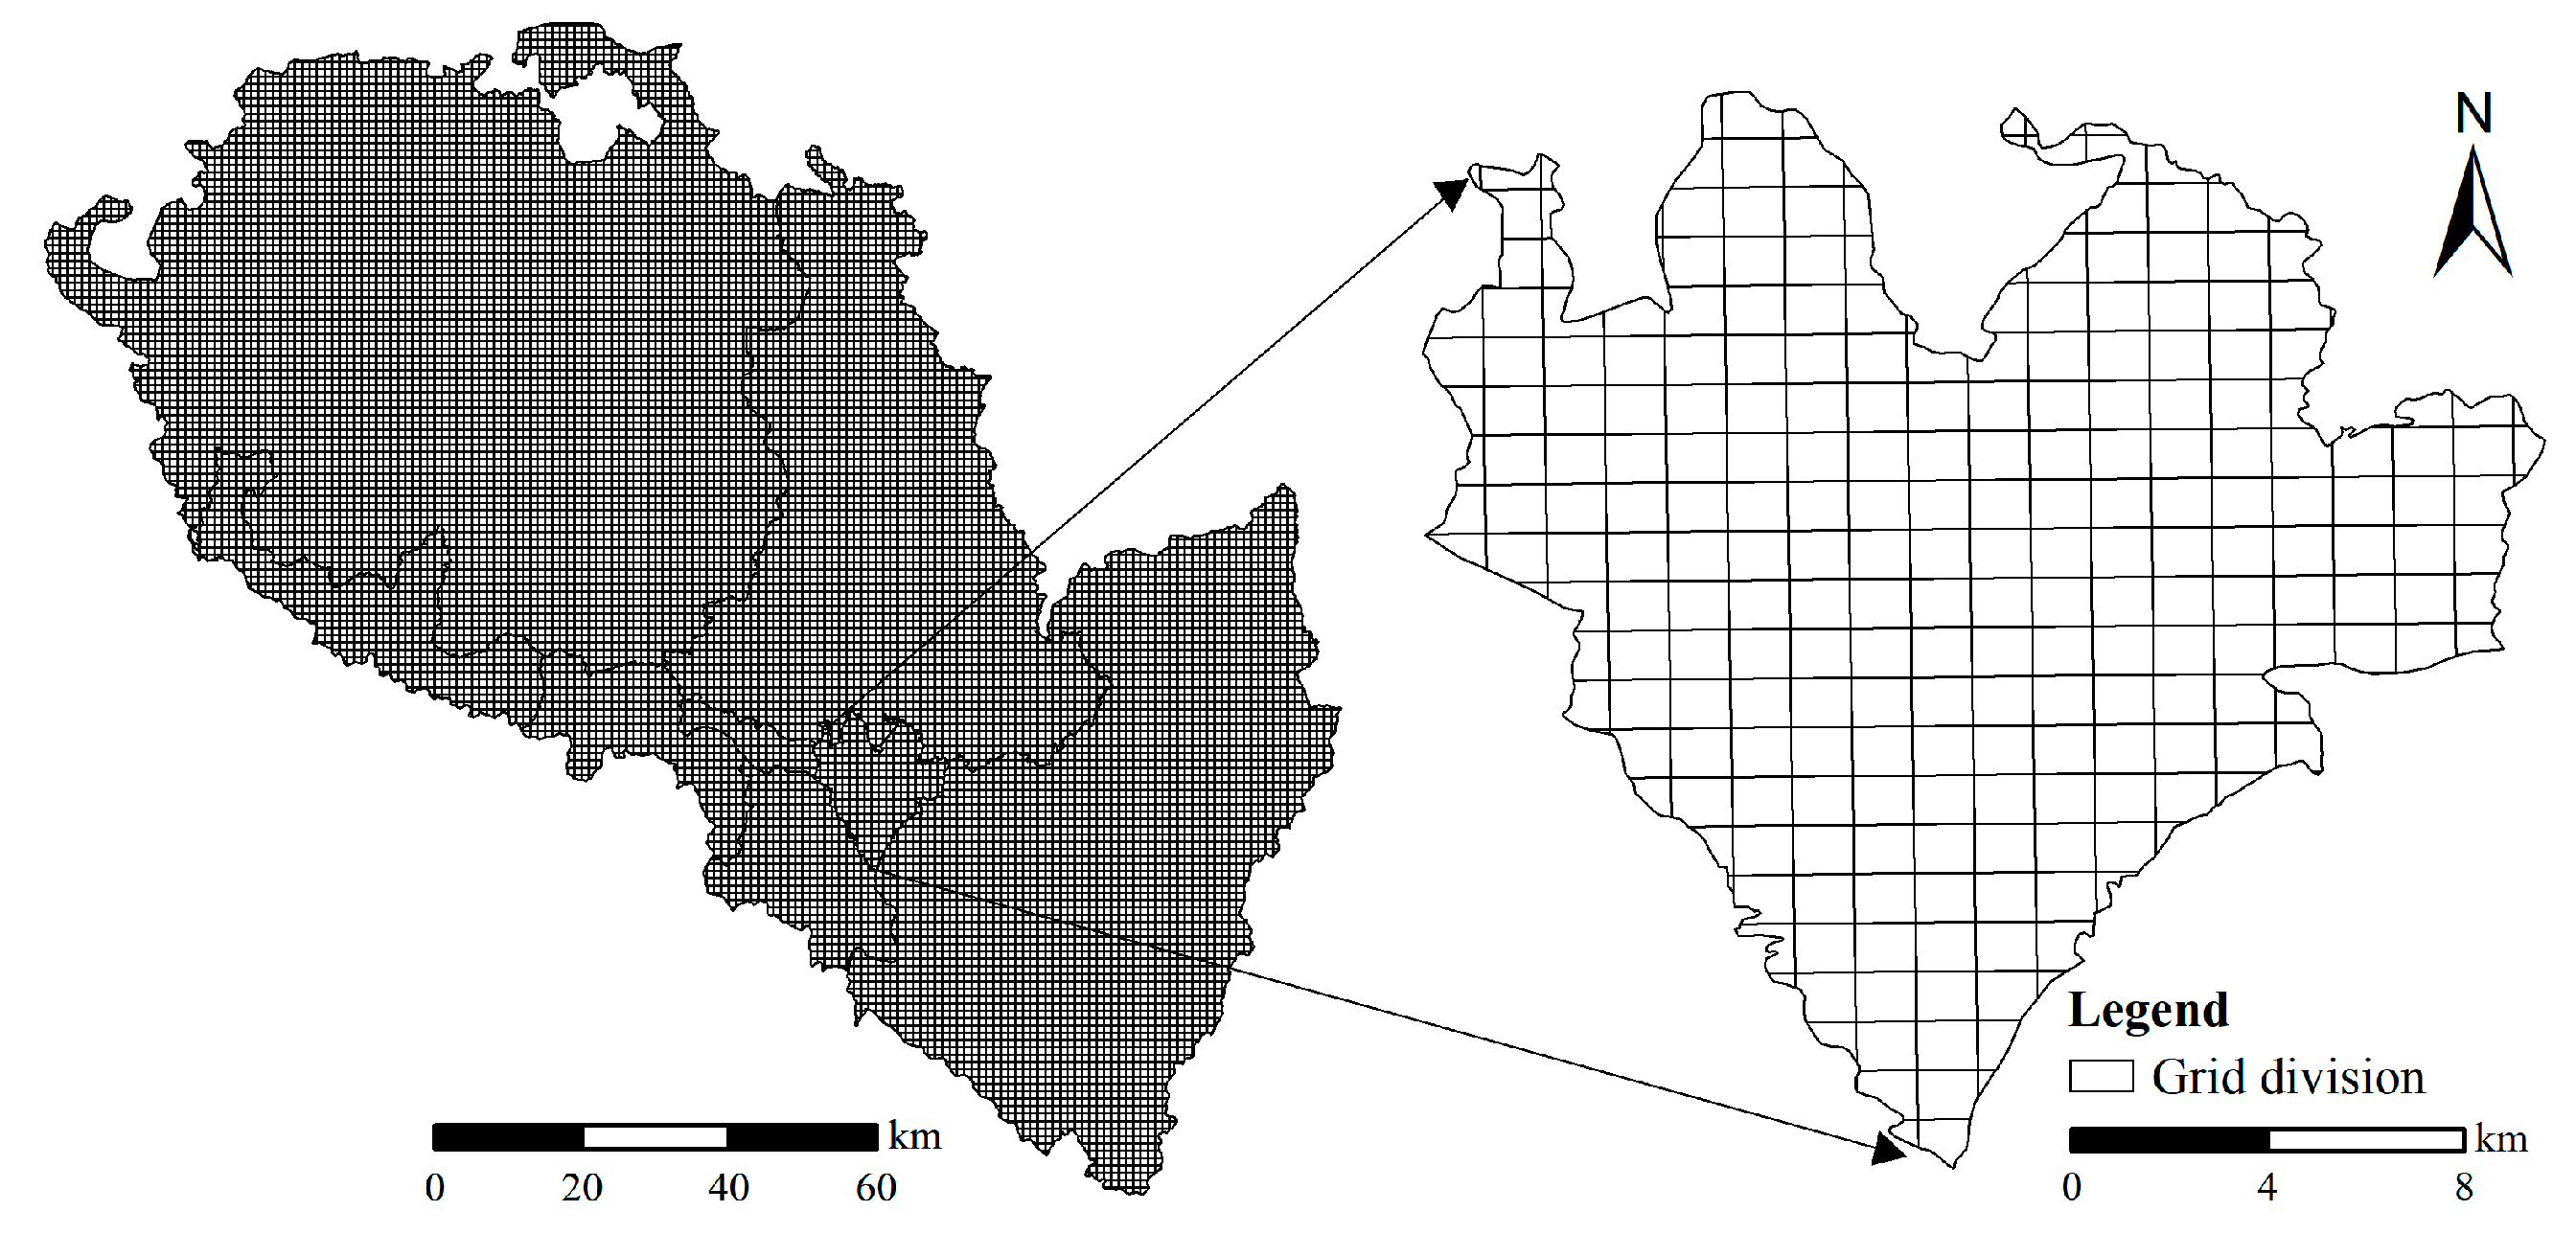
In addition, to verify the effectiveness of the regional division method used in this study, a regional gridding comparative experiment was carried out. The research area was partitioned into regular grids of 1 km × 1 km (see Figure 10) for the predictive analysis. The selection of this specific scale was informed by both the spatial distribution density of urban fire stations in Lanzhou and the scale effects observed in previous urban facility location studies [15,20]. A 1 km resolution effectively captures the local socio-economic heterogeneity and POI density gradients while maintaining a manageable computational complexity. Finer scales (e.g., 800 m) were found to result in excessive zero-value feature vectors due to data sparsity, while coarser scales (e.g., 1.2 km) tended to smooth out critical spatial variations required for precise fire station placement. Consequently, the 1 km grid was utilized as the fundamental unit for model training and evaluation.
Figure 10.
The results of grid-based regional division of Lanzhou urban area.
Data reconstruction and standardization processing were carried out based on the same feature variable system. Five ML models were then retrained and evaluated on this basis, yielding an average F1 score of 0.7981. The GBDT model still performed best. While regular grid division is straightforward, it fails to consider the functional heterogeneity of urban space adequately, resulting in the model’s insufficient spatial discrimination in identifying real fire demand. These results further prove the effectiveness of the regional division method based on GMM in improving the model’s overall performance, providing valuable reference for subsequent site selection prediction.
4.2. Location Prediction Analysis Based on GBDT Model
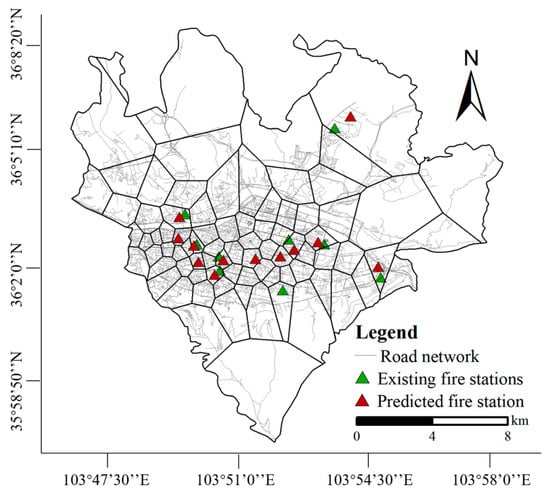
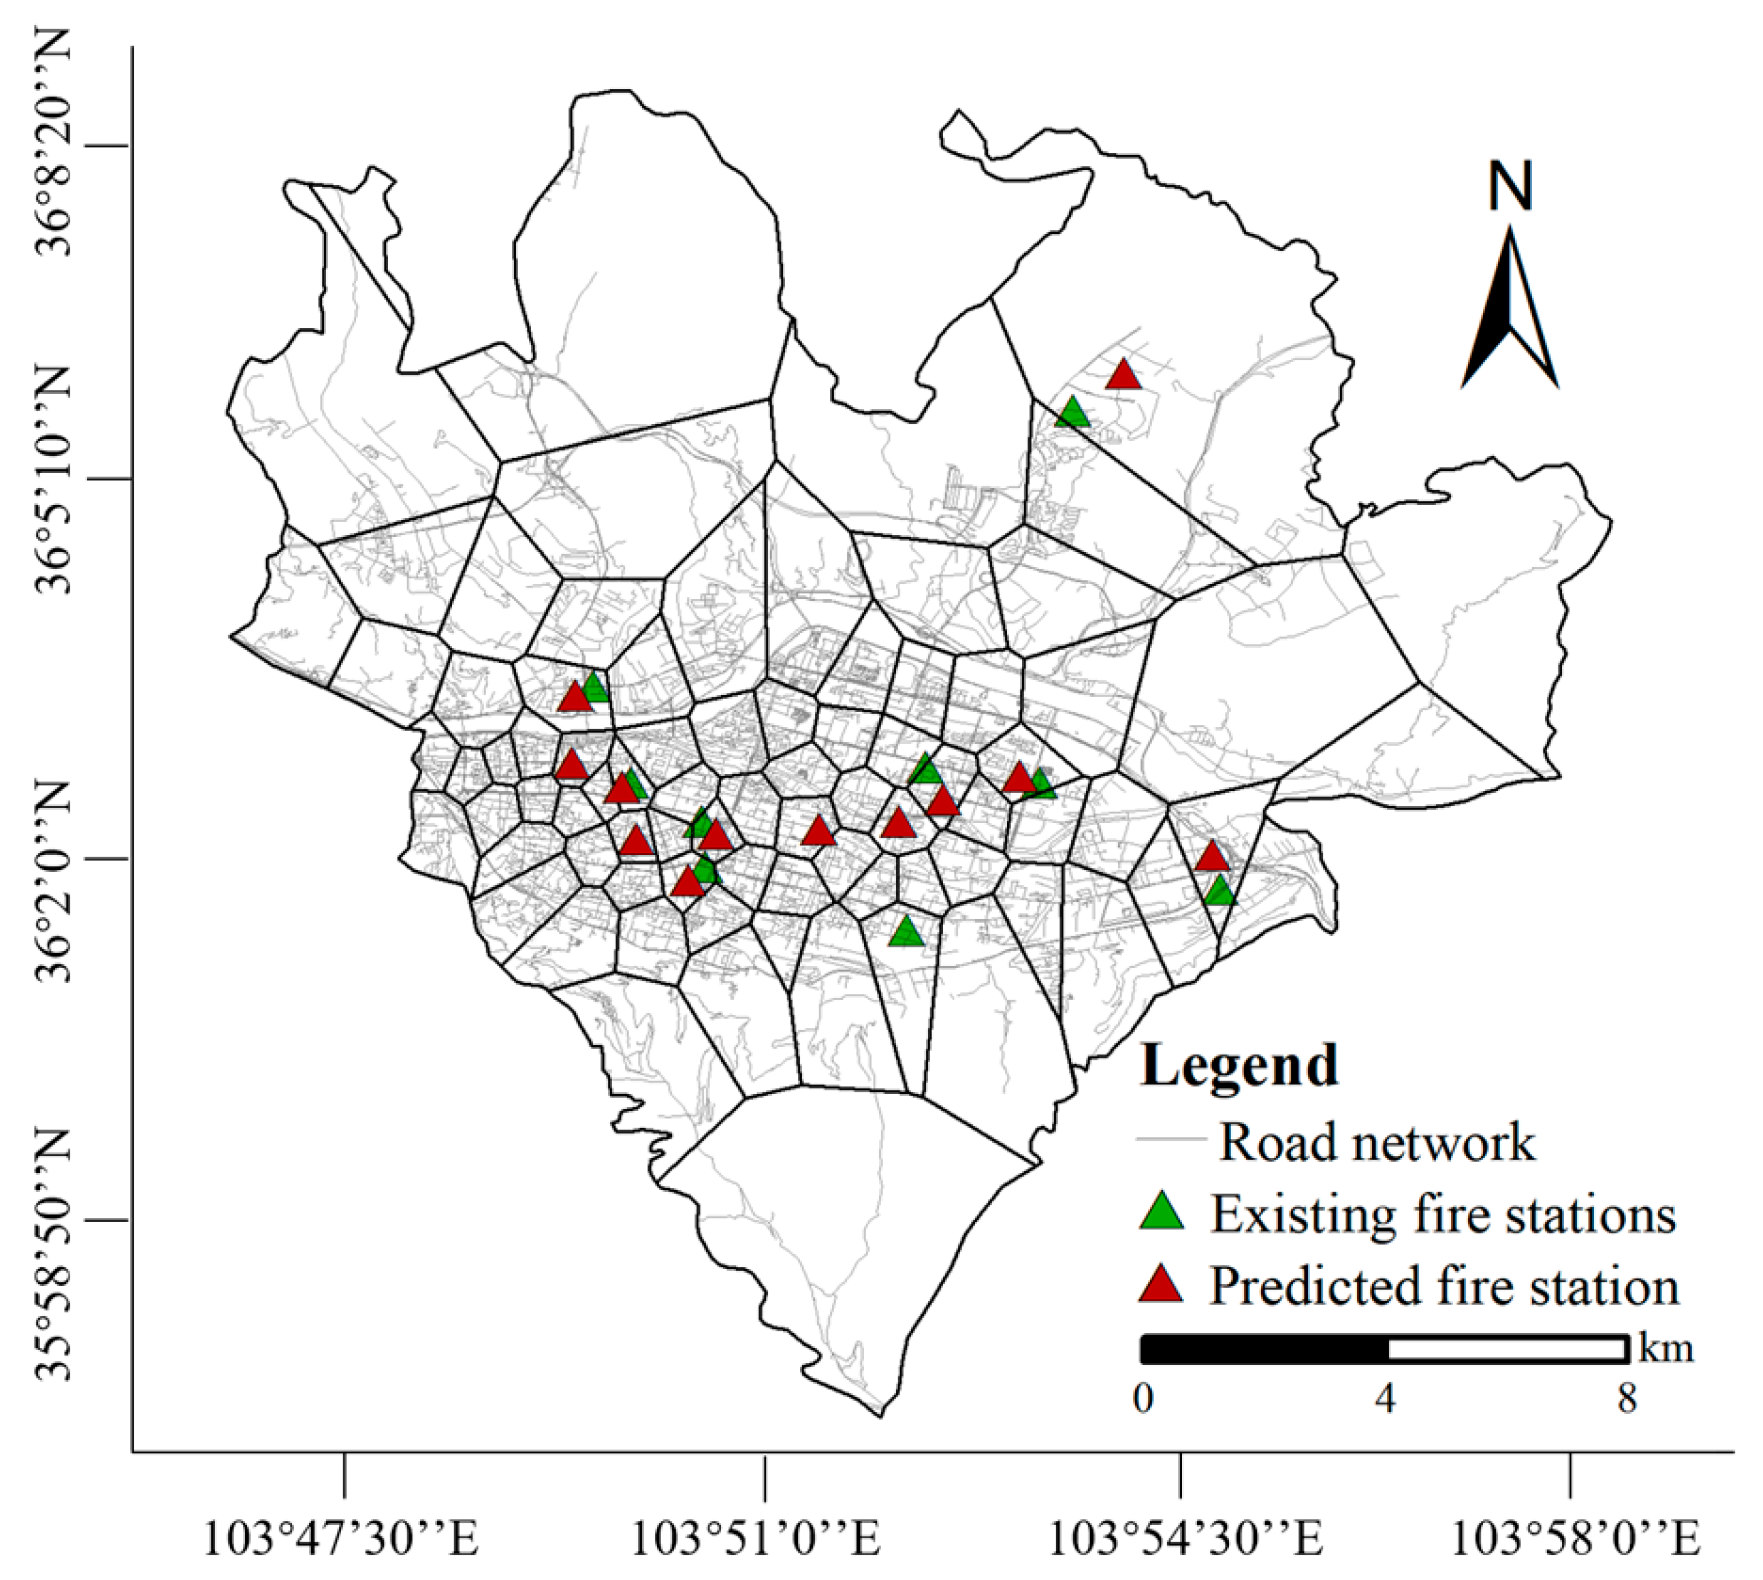
Following an evaluation of the performance of various ML models, the GBDT model was selected for predicting the location of fire stations in the Chengguan District of Lanzhou City. The model outputs a binary classification result for each spatial block, where ‘1’ indicates suitability for fire station placement and ‘0’ indicates non-suitability. These predictions are then visualized to support spatial interpretation and comparison with existing stations. The prediction results are shown in Figure 11. There are currently nine fire stations in Chengguan District. The model predicts a total of 12 suitable locations for new fire stations, 8 of which fall within the same block as the existing stations, yielding a block-level match rate of 66.7%. This indicates that the model successfully validates the spatial suitability of the existing fire stations and captures the underlying determinants of their placement. The GBDT model demonstrates strong spatial adaptability and prediction accuracy for site selection, accurately capturing the distribution characteristics of fire demand in the region. It successfully identifies almost all areas where existing fire stations are located, indicating that these areas have a high fire demand or large fire risk. The results also prove the feasibility and effectiveness of predicting fire station locations based on GMM clustering and the ML method at a data level.
Figure 11.
Location prediction results of Chengguan District of Lanzhou City.
According to the Urban Fire Station Construction Standard, the service area of a first-level ordinary fire station should not exceed 7 square kilometres. However, the built-up area of Chengguan District is 67.92 square kilometres. According to reference [40], our previous study applied a network-weighted Voronoi diagram—which accounts for road traffic flow and travel speed—and conducted a detailed fire risk assessment based on potential hazard points. The results confirmed that the nine existing fire stations in Chengguan District provide generally adequate coverage, especially in high-risk areas. Therefore, these stations serve as a reliable and validated test set for evaluating the model’s predictive capability. A 66.7% block-level match rate quantitatively supports the model’s predictive validity. These results further verify the applicability of the constructed model for locating fire stations and demonstrate the generalization of data-driven ML methods in spatial planning and public safety management. However, considering the complex terrain and diverse urban structure of Chengguan District, differences in local prediction may reflect nuances in the model’s ability to capture local fire demand.
In terms of spatial distribution, the model’s predicted locations for the new fire stations are mainly concentrated in areas with a dense population and frequent commercial activity. These areas are often at high risk of fire and have an urgent need for fire resources. When optimizing the layout of fire stations, these areas should be prioritized. Furthermore, integrating factors such as fire risk assessment, building density analysis, population mobility and traffic accessibility into more in-depth risk assessment and planning research will ensure the reasonableness of site selection and the scientific nature of resource allocation for new fire stations. This will effectively improve the service level of future fire station construction and further safeguard the lives and property of residents.
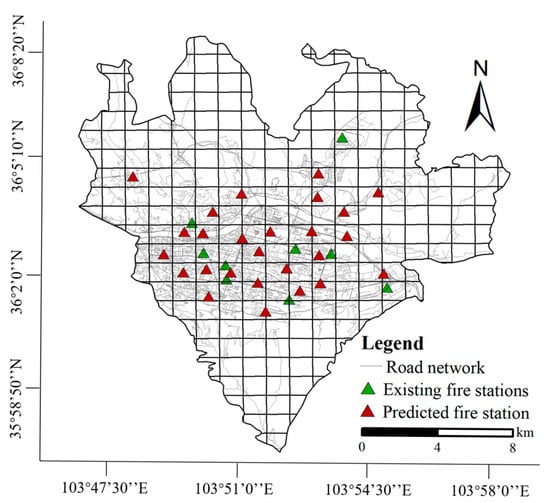
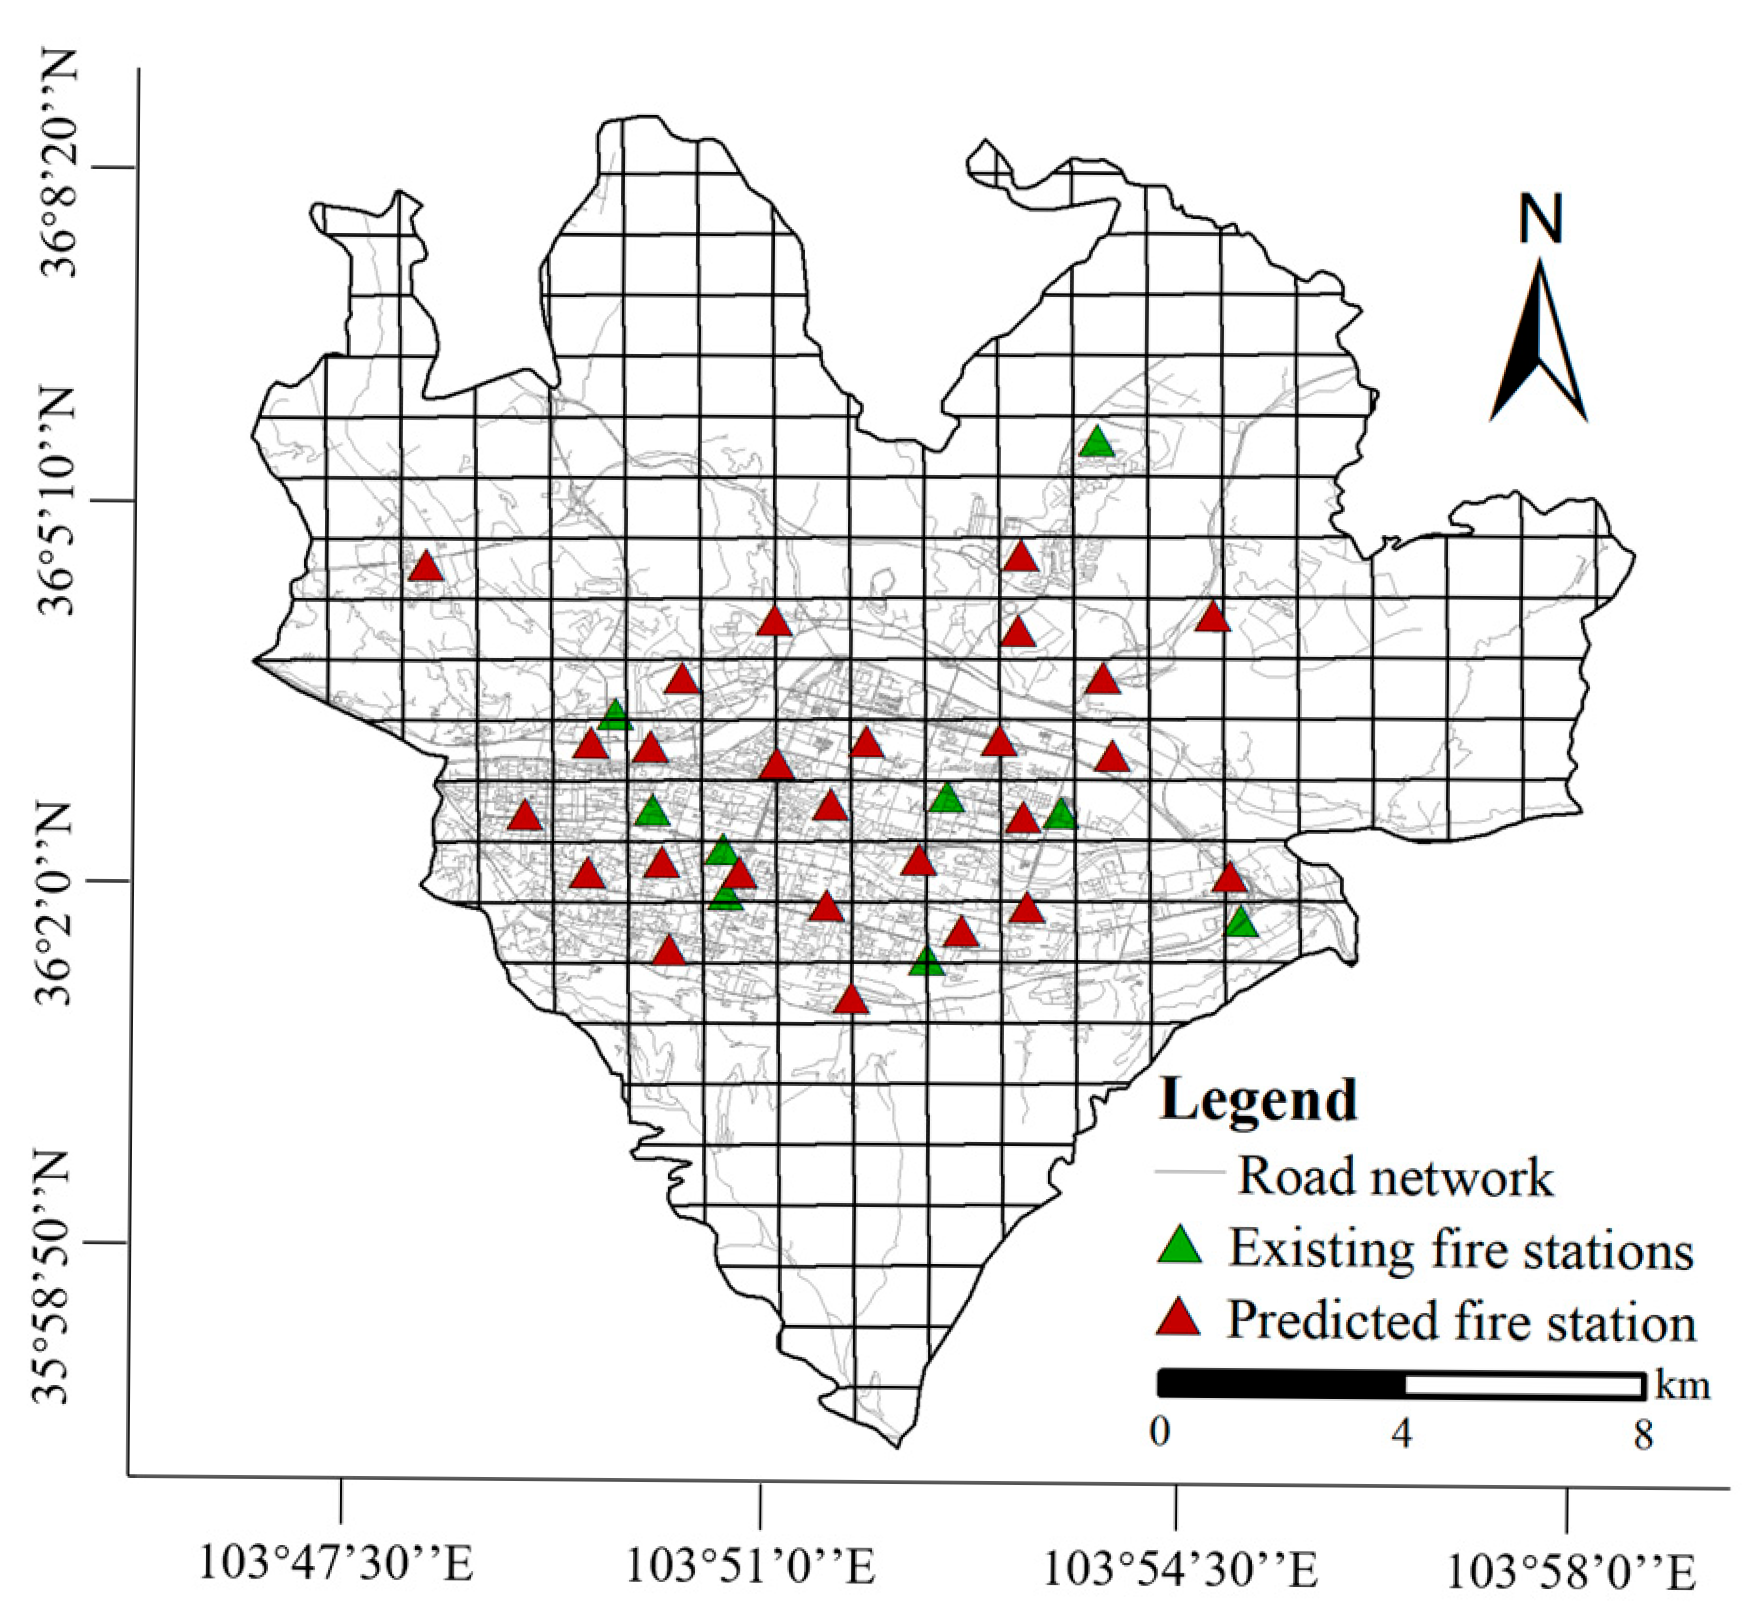
In addition, the results of the GBDT model for site selection prediction based on grid division area are shown in Figure 12. The model predicts 26 suitable locations for fire stations, 3 of which are located in the same grid cells as existing fire stations. Specifically, the GMM-Voronoi-based model achieved a block-level match rate of 66.7%, while the grid-based model achieved only 11.5%, highlighting the improved spatial alignment with actual fire station locations. The number of locations predicted by the location prediction model based on the grid division area is obviously too large. Most of the predicted sites have low spatial correspondence with the actual sites, which reflects the limitations of the regular grid division method in dealing with complex urban spatial structures. As the regular grid division method cannot effectively describe the heterogeneity of urban internal space or the differences in functional areas, it is easy for the predicted fire locations to deviate from actual demand, reducing the interpretability and practicability of the model. In contrast, this paper combines GMM clustering with the Voronoi diagram regional division method. This method can fully consider the functional attributes, spatial characteristics, and distribution rules within the region when dividing spatial units. Consequently, the model can more accurately identify areas with a high demand for fire services, thereby improving the validity and practical applicability of site selection prediction.
Figure 12.
Location prediction results based on grid division area.
4.3. Driving Factors Analysis
The GBDT model’s feature importance calculation is determined by evaluating each feature’s contribution to the decision-making process when constructing the tree model [41,42]. During training, GBDT constructs multiple decision trees iteratively, splitting each tree according to different features to minimize prediction error and continuously improve the model’s classification ability. In this paper, feature importance is calculated using the Average Impurity Decrease (AID) method. This involves accumulating and averaging the amount of impurity reduction brought by a feature when used for splitting in all split nodes of all trees to measure its contribution to the model’s overall decision-making process.
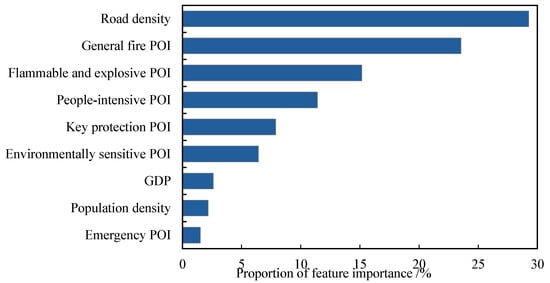
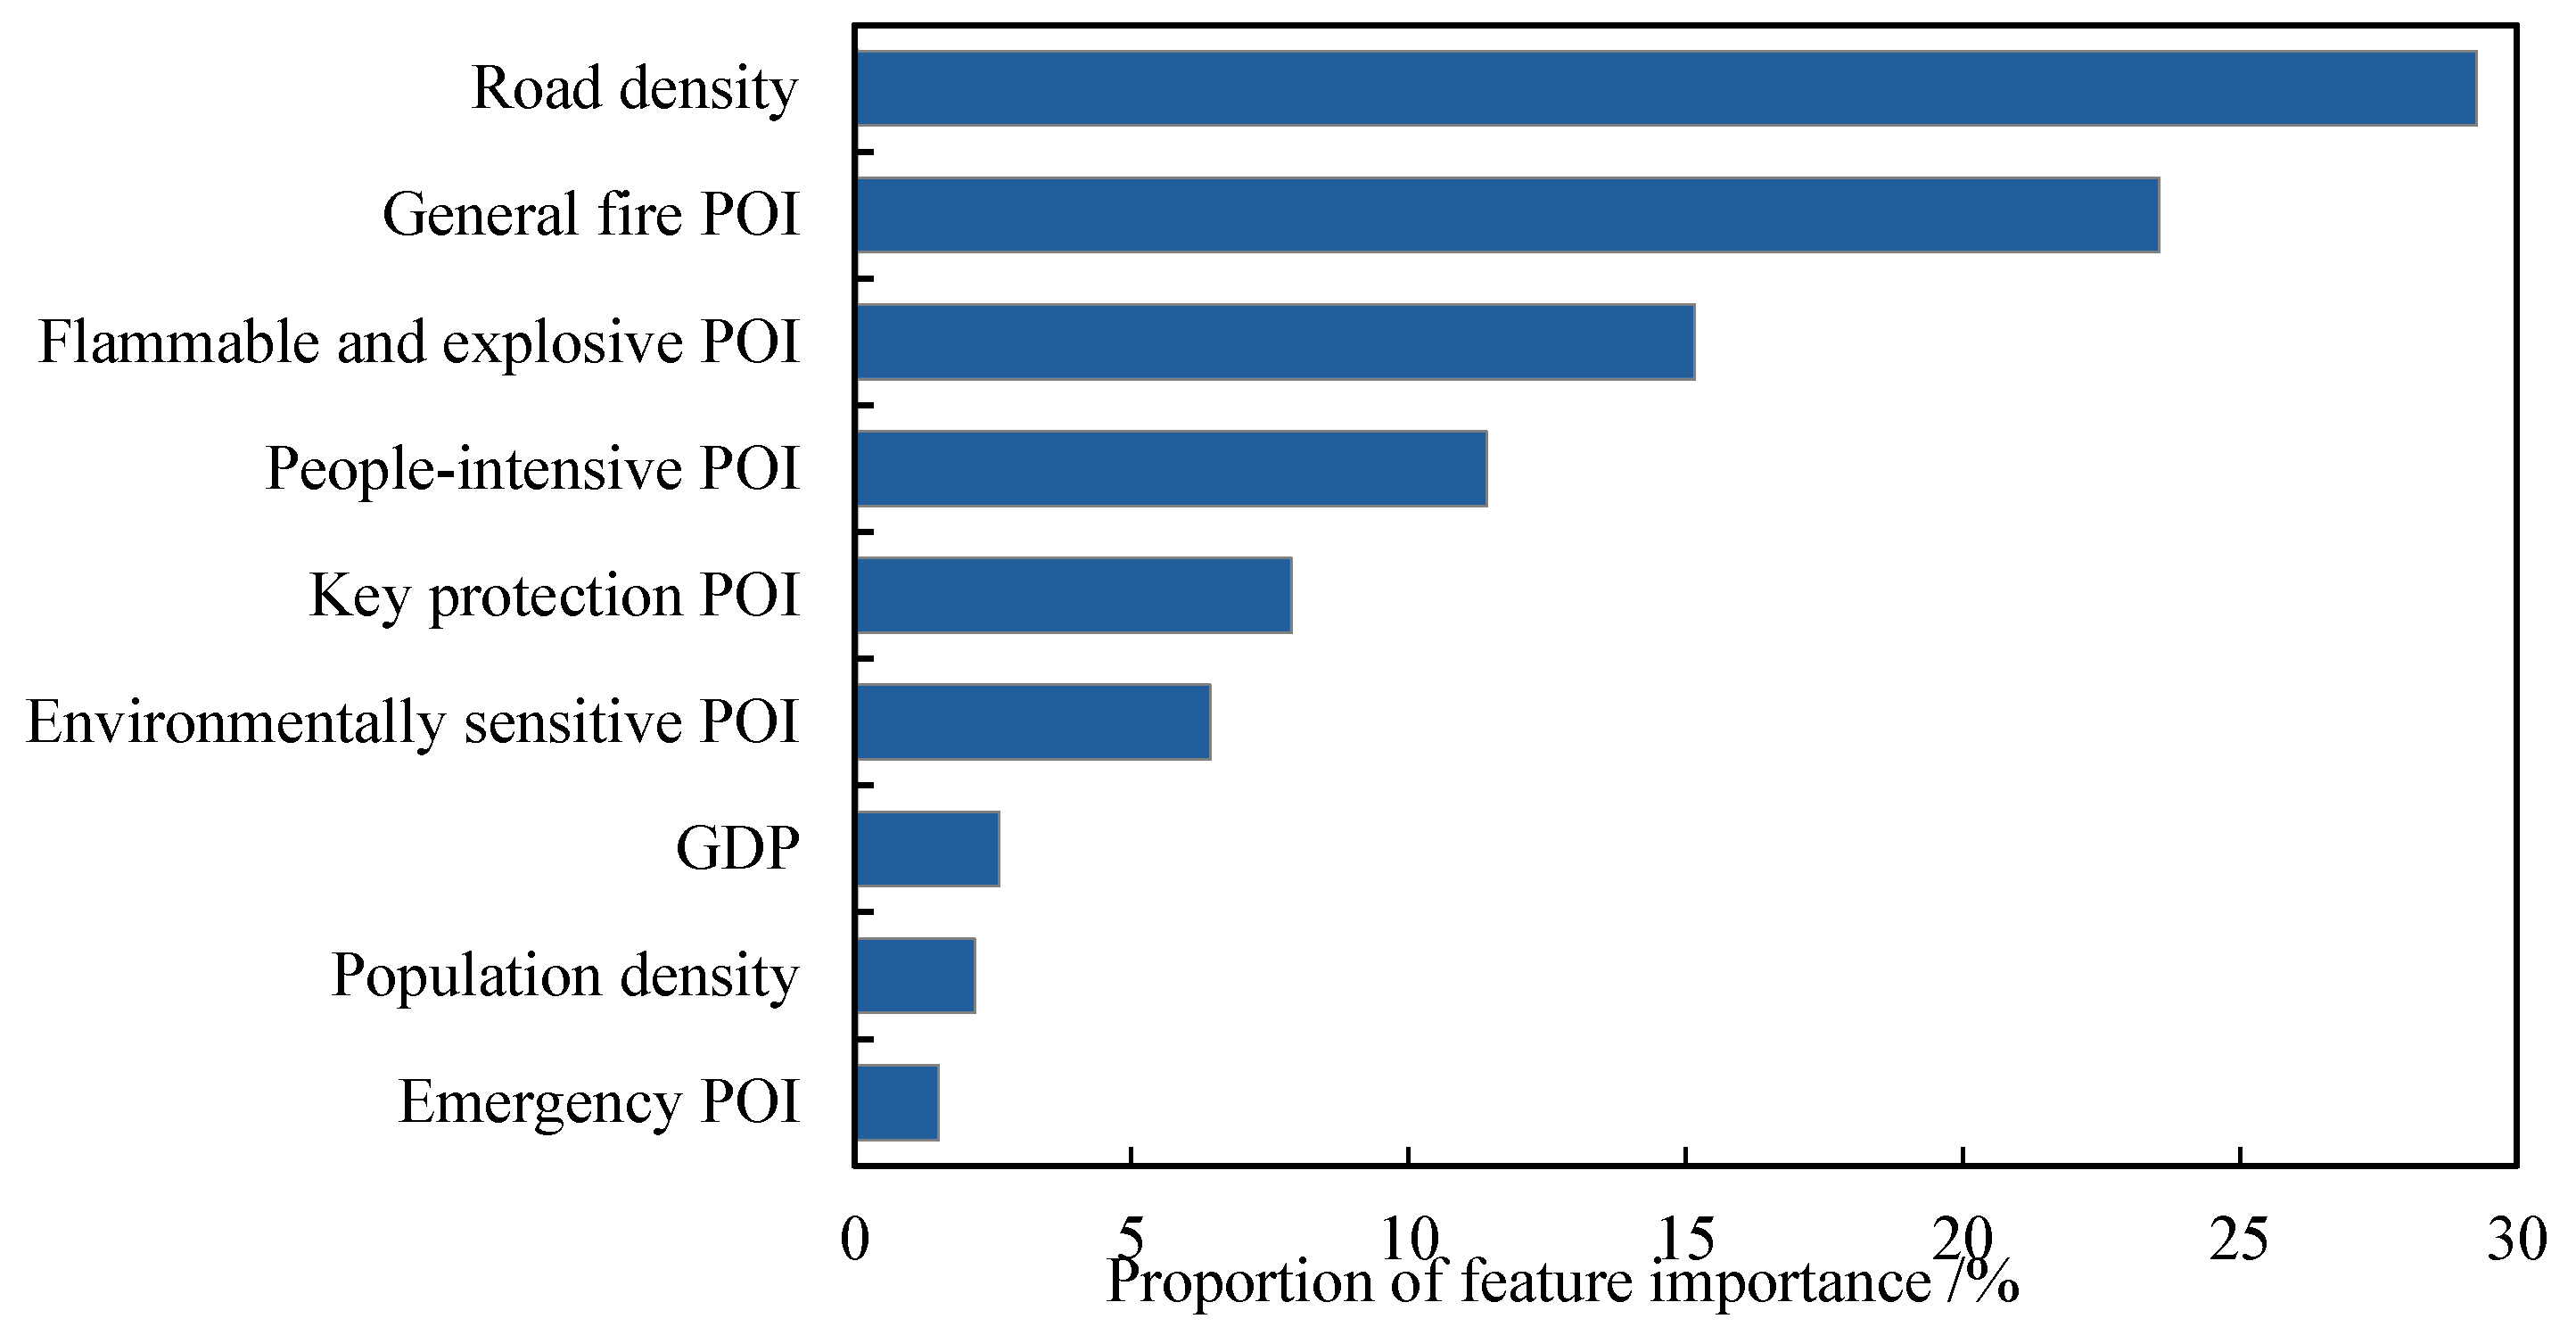
According to the feature importance ranking returned by the GBDT model (Figure 13), road density is the most important influencing factor, accounting for almost 30%. This indicates that accessibility to the urban transport network plays a significant role in determining the location of fire stations. In areas with high-density transportation networks in particular, a reasonable layout of fire stations can effectively shorten response times and thereby improve the efficiency of fire services. Secondly, there are general fire POIs. Although individual fire protection demands in these areas may be relatively low, the overall demand resulting from their large quantity still has a significant impact on fire station layout. The model also considers the importance of flammable and explosive POIs, as these high-risk areas are important for the location of fire stations. Additionally, people-intensive POIs, key protection POIs and environmentally sensitive POIs also carry more weight in the model, indicating that population mobility, the protection needs of key areas and environmental sensitivity cannot be ignored when locating fire stations. In contrast, the contributions of GDP, population density and emergency POIs are relatively small and have an indirect and insignificant impact on fire station location. A sensitivity analysis was performed by slightly varying individual feature values and observing the changes in prediction probabilities. It was found that GDP and population density had negligible effects on the model output, which supports their low importance rankings and reflects their limited influence in this urban fire station context. Overall, the location of fire stations is driven primarily by different types of POI, traffic conditions and regional fire demand, providing urban planners with a strong scientific basis for future decision-making.
Figure 13.
Measurement of the importance of each index characteristic.
4.4. Suggestions on Spatial Layout Optimization of Urban Fire Stations
Based on the analysis of the above experimental results and the GBDT model’s prediction of fire station locations, combined with an analysis of key driving factors, the following suggestions for optimizing the spatial layout of fire stations in Chengguan District are proposed: adding micro-fire stations, providing policy support, and ensuring financial security. The aim is to enhance the efficiency of fire station services, reduce emergency response times and improve the overall emergency response capability of the fire protection system.
4.4.1. Add Micro Fire Stations to Enhance Service Coverage
The locations of the existing fire stations in Chengguan District are mostly in areas with dense populations and frequent commercial activities. These stations have become deeply integrated into the urban functional structure through long-term planning and construction, making them difficult to move or reconfigure. Adjusting the locations of existing fire stations requires significant human, material and financial resources and may also have a significant impact on urban traffic, residents’ lives and commercial activities. The micro fire station is a flexible and efficient firefighting facility with significant advantages including high cost-effectiveness, a small size, a strong rapid response ability and high community participation. Micro fire stations can be flexibly deployed in areas where the service range of existing fire stations exceeds the standard or in areas with a high fire risk, filling the blind spots in fire service coverage.
The optimization suggestions for adding micro fire stations focus primarily on supplementing the service blind spots in the existing fire station layout. Based on the site selection prediction results of the GBDT model, the four new fire stations will be located around the Lanzhou Municipal People’s Government and the Gansu Institute of Civil Engineering, as well as near Gannan Road and Donggang West Road. As the administrative centre of Chengguan District, the Lanzhou Municipal People’s Government is surrounded by a number of government agencies and public service facilities with dense personnel and a complex building structure. Around the Gansu Civil Engineering Research Institute, there are places with a large flow of people, such as Duanjiatan Primary School and the Third People’s Hospital of Gansu Province. Gannan Road and Donggang West Road are surrounded by many residential areas and commercial blocks, with a high population density and frequent economic activity. The fire risk in these areas is generally high. The addition of micro fire stations can further improve the ability to respond quickly in the early stages of a fire.
Secondly, according to the analysis of driving factors, road accessibility greatly affects the response speed of fire stations. When fire engines drive on busy roads, traffic efficiency may be limited, especially during peak hours. Congestion will further increase emergency response times. Therefore, it is particularly important to establish micro fire stations in areas with high road density and heavy traffic. The small fire vehicles at these stations can manoeuvre flexibly through urban roads and reach the scene of a fire quickly.
4.4.2. Policy Support and Financial Guarantee Facilitate the Implementation of Layout Optimization
In implementing the layout optimization of fire stations in the Chengguan district, the construction and operation of micro fire stations require the cooperation of government, community and enterprise. Policy support and financial guarantees are key to promoting effective cooperation. The government should formulate a clear construction plan for micro fire stations, specifying construction goals, site selection criteria and financial guarantees, to ensure the orderly development of micro fire stations. Once relevant policies have been introduced, the construction of micro fire stations will become a key task in urban public security management. The responsibilities and implementation paths of governments at all levels will be clarified, and innovative fire service methods will be supported. At the same time, efforts should be made to publicize and promote micro fire stations to raise public awareness of them and encourage participation. Additionally, the government should strengthen training, supervision, and coordination to enhance the emergency response capabilities of micro fire stations. Regular drills and a linkage mechanism with standard stations can improve overall system efficiency and collaborative response.
The financial guarantee is the core issue in the construction and operation of micro fire stations. It is therefore recommended that the government increases its financial input by setting up special funds to support the construction of micro fire stations, while also encouraging the participation of social capital to create a diversified financial guarantee mechanism. For example, enterprises and social organisations could be encouraged to participate in the construction and operation of micro fire stations through government purchasing services. Alternatively, tax incentives could be offered to encourage enterprises and communities to participate in the construction and management of micro fire stations. Additionally, an operation subsidy mechanism could be explored to ensure the long-term stable operation of micro fire stations. Formulating clear construction plans, increasing financial input, introducing preferential policies, and strengthening community enterprise participation can effectively promote the construction and development of micro fire stations, providing solid institutional and economic guarantees for optimising fire services in Chengguan District.
5. Conclusions
This study proposes a novel integrated framework that combines GMM-based clustering, Voronoi-based spatial division, and ML classification for fire station location prediction—an approach that is rarely applied in existing research on emergency facility planning. The GMM clustering algorithm and Voronoi diagram construction are employed to achieve a reasonable division of the research block. A feature matrix is constructed by fusing multi-source spatial data in order to train and evaluate known samples, and the performance of the various models is then compared. Ultimately, the GBDT model is chosen to predict the location of fire stations in the Chengguan District of Lanzhou City. Combined with an analysis of feature importance, this provides suggestions for optimizing the layout. The results demonstrate the GBDT model’s effectiveness in identifying the reasonableness of existing fire station locations and predicting new fire station locations, with high F1 scores and AUC values. The model demonstrates good generalization ability and practical application value, providing reliable decision support for urban planners. The predicted locations of fire stations in Chengguan District coincide with the locations of existing fire stations and the predicted locations of new fire stations are concentrated in just four areas. These areas could benefit from the addition of micro fire stations to improve service efficiency and response speed.
In the future, this study’s location model for urban fire stations can also be applied to the layout planning of fire stations in new urban areas. Despite this, this study still has some limitations, including the lack of temporal dynamics, the potential risk of feature overfitting due to the limited number of positive samples, and the possibly incomplete consideration of relevant factors. To further improve the model’s accuracy and practicality, subsequent research will consider integrating advanced ML models, introducing time-dynamic factors and carrying out real-time dynamic location adjustments. In addition, future work may explore combining this approach with classic location optimization models such as p-median, MCLP, or coverage maximization to enhance overall performance and spatial efficiency. This may provide a more scientific and efficient decision-support tool for urban emergency management and public safety planning.
Author Contributions
Conceptualization, Xiaomin Lu and Haowen Yan; methodology, Xiaomin Lu; software, Xiaomin Lu; validation, Xiaomin Lu, Yan Wang and Zhiyi Zhang; formal analysis, Xiaomin Lu; investigation, Xiaomin Lu and Lijuan Wang; resources, Haowen Yan and Na He; data curation, Xiaomin Lu; writing—original draft preparation, Xiaomin Lu; writing—review and editing, Haowen Yan and Haoran Song; visualization, Xiaomin Lu; supervision, Haowen Yan; project administration, Xiaomin Lu; funding acquisition, Xiaomin Lu. All authors have read and agreed to the published version of the manuscript.
Funding
The National Natural Science Foundation of China (42161066, 42371463), Key Project of Natural Science Foundation of Gansu Province (24JRRA224).
Data Availability Statement
The data presented in this study are available on request from the corresponding author.
Conflicts of Interest
The authors declare no conflict of interest.
References
- Han, B.; Hu, M.; Zheng, J.; Tang, T. Site selection of fire stations in large cities based on actual spatiotemporal demands: A case study of Nanjing City. ISPRS Int. J. Geo-Inf. 2021, 10, 542. [Google Scholar] [CrossRef] [Scilit]
- National Fire and Rescue Administration. National Fire and Rescue Administration Held a Regular Press Conference. [EB/OL]. (24 January 2025) [2 March 2025]. Available online: https://mp.weixin.qq.com/s/R99uMjUoShaoQwvFL7qHWQ (accessed on 2 November 2025).
- Fei, W.; Yu, X. A Review of the Discrete Facility Location Problem. Int. J. Plant Eng. Manag. 2006, 11, 40–53. [Google Scholar]
- Wang, Y.; Zhao, H.; Zhou, W.; Cheng, Q. Practice of optimizing the layout of urban fire stations by integrating multiple factors. Fire Sci. Technol. 2024, 43, 551–556. [Google Scholar]
- Chen, Y.; Wu, G.; Chen, Y.; Xia, Z. Spatial location optimization of fire stations with traffic status and urban functional areas. Appl. Spat. Anal. Policy 2023, 16, 771–788. [Google Scholar] [CrossRef] [Scilit]
- Al-Sabbagh, T.A.; Almuqataf, M.M.; Elsaed, E.L.; El Kenawy, A.M.; Younes, A.; Elkadeem, M.R.; Kotb, K.M. Advanced GIS and fuzzy logic integration for strategic fire station placement in Yanbu Industrial City, Saudi Arabia. GeoJournal 2025, 90, 59. [Google Scholar] [CrossRef] [Scilit]
- Jia, T.; Tao, H.; Qin, K.; Wang, Y.; Liu, C.; Gao, Q. Selecting the optimal healthcare centers with a modified P-median model: A visual analytic perspective. Int. J. Health Geogr. 2014, 13, 42. [Google Scholar] [CrossRef] [Scilit]
- Lu, C.C.; Sheu, J.B. Robust vertex p-center model for locating urgent relief distribution centers. Comput. Oper. Res. 2013, 40, 2128–2137. [Google Scholar] [CrossRef] [Scilit]
- Liu, H.Z.; Liu, L.N. Multi-objective location model research and application in the city emergency logistics based on different product materials. Appl. Mech. Mater. 2011, 63, 277–280. [Google Scholar] [CrossRef] [Scilit]
- Church, R.L.; Roberts, K.L. Generalized coverage models and public facility location. Pap. Reg. Sci. 1983, 53, 117–135. [Google Scholar] [CrossRef] [Scilit]
- Hakimi, S.L. Optimum locations of switching centers and the absolute centers and medians of a graph. Oper. Res. 1964, 12, 450–459. [Google Scholar] [CrossRef] [Scilit]
- Shang, C.D. Research on Layout Optimization of Fire Rescue Station Based on Urban Fire Risk Assessment. Master’s Thesis, Hebei Normal University, Shijiazhuang, China, 2021. [Google Scholar]
- Xu, Q.; He, X. New fire station location problem based on AHP and set coverage model. Inf. Comput. 2019, 13, 26–28. [Google Scholar]
- Adesina, E.A.; Odumosu, J.O.; Morenikeji, O.O.; Umoru, E.; Ayokanmbi, A.O.; Ogunbode, E.B. Optimization of fire stations services in Minna metropolis using maximum covering location model (MCLM). J. Appl. Sci. Environ. Sustain. 2017, 3, 172–187. [Google Scholar]
- Wang, Z.; Cao, K. An intelligent site selection approach for public service facilities coupled with improved graph attention network and deep reinforcement learning. J. Geo-Inf. Sci. 2024, 26, 2452–2464. [Google Scholar]
- Vasilyev, I.L.; Ushakov, A.V. Discrete facility location in machine learning. J. Appl. Ind. Math. 2021, 15, 686–710. [Google Scholar] [CrossRef] [Scilit]
- Vargas-Santiago, M.; León-Velasco, D.A.; Jiménez, R.M.; Morales-Rosales, L.A. Complementing solutions for facility location optimization via video game crowdsourcing and machine learning approach. Appl. Sci. 2023, 13, 4884. [Google Scholar] [CrossRef] [Scilit]
- Guo, P.; Cheng, W.; Wang, Y. Hybrid evolutionary algorithm with extreme machine learning fitness function evaluation for two-stage capacitated facility location problems. Expert Syst. Appl. 2017, 71, 57–68. [Google Scholar] [CrossRef] [Scilit]
- Sharma, D.P.; Beigi-Mohammadi, N.; Geng, H.; Dixon, D.; Madro, R.; Emmenegger, P.; Tobar, C.; Li, J.; Leon-Garcia, A. Statistical and machine learning models for predicting fire and other emergency events. arXiv 2024, arXiv:2402.09553. [Google Scholar] [CrossRef] [Scilit]
- Wang, Y. Optimization on fire station location selection for fire emergency vehicles using K-means algorithm. In Proceedings of the 3rd International Conference on Advances in Materials, Mechatronics and Civil Engineering (ICAMMCE 2018), Hangzhou, China, 13–15 April 2018; Atlantis Press: Amsterdam, The Netherlands, 2018; pp. 323–333. [Google Scholar]
- Aydın, C. Classification of the fire station requirement using machine learning algorithms. Int. J. Inf. Technol. Comput. Sci. 2019, 11, 24–30. [Google Scholar] [CrossRef] [Scilit]
- Gao, J. Study on Fire Characteristics and Optimization of the Distribution of Urban Fire Station in Urban Area. Master’s Thesis, Xi’an University of Science and Technology, Xi’an, China, 2020. [Google Scholar]
- Benliu News. A Total of 607 Fires Occurred in Lanzhou City in the First 11 Months. Available online: https://news.sina.cn/sa/2005-12-07/detail-ikknscsi8439510.d.html (accessed on 2 November 2025).
- Yao, J.; Zhang, X.; Murray, A.T. Location optimization of urban fire stations: Access and service coverage. Comput. Environ. Urban Syst. 2019, 73, 184–190. [Google Scholar] [CrossRef] [Scilit]
- Liu, X.; Wang, X.J.; Wu, Z.; Dai, Z.X.; Sun, Z. Research on location selection of elderly care facilities based on random forest algorithm and supply-demand relationship. Eng. Surv. Mapp. 2023, 32, 49–55. [Google Scholar]
- Shang, J.; Wang, J.N.; Liu, X.; Li, Q.; Wang, J. Risk level classification method for railway network data based on GMM clustering. Railw. Comput. Appl. 2023, 32, 39–44. [Google Scholar]
- Guo, Z.G.; Yan, L.B.; Zhang, H.Q.; Shen, Z. Driving style identification based on typical working conditions and GMM algorithm. Intern. Combust. Eng. Powerpl. 2024, 41, 94–97. [Google Scholar]
- Yuan, X.F.; Ma, C.L.; Chen, S.H. Research on equipment parameter early warning based on GMM and NSET optimization algorithm. Control Eng. China 2022, 29, 1058–1064. [Google Scholar]
- Xu, Z.; Zhou, L.; Lan, T.; Wang, Z.H.; Sun, L.; Wu, R.W. Spatial optimization of mega-city fire station distribution based on point of interest data: A case study within the 5th Ring Road in Beijing. Prog. Geogr. 2018, 37, 535–546. [Google Scholar]
- Wang, A.; Zhang, Q.; Lu, L.; Yu, H.; Huang, C. Urban fire risk assessment and planning response based on multi-source data. China Saf. Sci. J. 2021, 31, 148–155. [Google Scholar]
- Zhu, M.; Luo, J.; Yu, W.; Zhou, Y.; Zhou, L. Urban fire risk evaluation and location optimization of fire station based on POI: A case study of main urban region in Wuhan. Areal Res. Dev. 2018, 37, 6. [Google Scholar]
- Elreedy, D.; Atiya, A.F.; Kamalov, F. A theoretical distribution analysis of synthetic minority oversampling technique (SMOTE) for imbalanced learning. Mach. Learn. 2024, 113, 4903–4923. [Google Scholar] [CrossRef] [Scilit]
- Chang, B.; Yang, R.; Guo, C.; Ge, S.; Li, L. A new application of optimized random forest algorithms in intelligent fault location of rudders. IEEE Access 2019, 7, 94276–94283. [Google Scholar] [CrossRef] [Scilit]
- Jiang, P.; Wu, H.; Wang, W.; Ma, W.; Sun, X.; Lu, Z. MiPred: Classification of real and pseudo microRNA precursors using random forest prediction model with combined features. Nucleic Acids Res. 2007, 35, W339–W344. [Google Scholar] [CrossRef] [Scilit]
- Guo, X.Q.; Wu, X.; Li, J.B.; Shen, K.; Hao, G.C. Research on intrusion foreign objects classification of contact networks based on GBDT model. Intell. Comput. Appl. 2024, 14, 41–49. [Google Scholar]
- Wu, W.; Wang, J.; Huang, Y.; Zhao, H.; Wang, X. A novel way to determine transient heat flux based on GBDT machine learning algorithm. Int. J. Heat Mass Transf. 2021, 179, 121746. [Google Scholar] [CrossRef] [Scilit]
- Cervantes, J.; Garcia-Lamont, F.; Rodríguez-Mazahua, L.; Lopez, A. A comprehensive survey on support vector machine classification: Applications, challenges and trends. Neurocomputing 2020, 408, 189–215. [Google Scholar] [CrossRef] [Scilit]
- Osman, A.I.; Ahmed, A.N.; Chow, M.F.; Huang, Y.F.; El-Shafie, A. Extreme gradient boosting (XGBoost) model to predict groundwater levels in Selangor, Malaysia. Ain Shams Eng. J. 2021, 12, 1545–1556. [Google Scholar] [CrossRef] [Scilit]
- Ravipati, R.D.; Abualkibash, M. Intrusion detection system classification using different machine learning algorithms on KDD-99 and NSL-KDD datasets—A review paper. Int. J. Comput. Sci. Inf. Technol. 2019, 11, 1–9. [Google Scholar] [CrossRef] [Scilit]
- Wang, L.J.; Lu, X.M.; Zhang, Z.Y.; Wu, M.Z. Assessment of fire station service coverage based on network weighted Voronoi diagram. Geogr. Geo-Inf. Sci. 2025, 41, 17–22. [Google Scholar]
- Zhang, Y.D.; Liao, L.; Yu, Q.; Ma, W.G.; Li, K.H. Using the gradient boosting decision tree (GBDT) algorithm for a train delay prediction model considering the delay propagation feature. Adv. Prod. Eng. Manag. 2021, 16, 285–296. [Google Scholar] [CrossRef] [Scilit]
- Yeboah, E.; Wang, G.; Cabral, P.; Sarfo, I.; Wei, X.; Liu, H.; Shao, Y.; Amankwah, S.O.; Shwe, M.M.; Iqbal, J.; et al. Urban Heat Island Response to Projected Land-Use Change and Surface Energy Balance Modifications in Chongqing City. China J. Geovis. Spat. Anal. 2025, 9, 37. [Google Scholar] [CrossRef] [Scilit]

Disclaimer/Publisher’s Note: The statements, opinions and data contained in all publications are solely those of the individual author(s) and contributor(s) and not of MDPI and/or the editor(s). MDPI and/or the editor(s) disclaim responsibility for any injury to people or property resulting from any ideas, methods, instructions or products referred to in the content. |
© 2026 by the authors. Published by MDPI on behalf of the International Society for Photogrammetry and Remote Sensing. Licensee MDPI, Basel, Switzerland. This article is an open access article distributed under the terms and conditions of the Creative Commons Attribution (CC BY) license.