


Abstract
This study proposes the innovative “GIS–Generalized Symmetric Structural Graph” Framework for Restaurant Differentiation (GGSF), integrating GIS spatial analysis with generalized symmetric structural graphs. Taking Changsha’s urban core as a case study, we analyze the spatial distribution and agglomeration patterns of catering establishments to reveal their underlying formation mechanisms. Results indicate a “one core with multiple sub-centers” and “dense in the east, sparse in the west” pattern. Specifically, Chinese catering concentrates in old urban areas, international dining concentrates in CBDs, snacks and fast food span the entire region, and desserts and drinks align with youth consumption spaces. Furthermore, 99% of outlets have a nearest-neighbor distance ≤500 m, demonstrating a negative correlation between outlet density and average neighbor distance. The GGSF uncovers a hidden static spatial order that is closely associated with natural geography, policy, and transportation. This study verifies the framework’s applicability, offering a replicable model for understanding urban commercial spatial laws, optimizing layouts, and promoting the sustainable development of urban functional spaces.
1. Introduction
The urban catering industry, serving as a vital link between residents’ daily lives and urban functions, plays a significant role in driving economic and social development while fulfilling people’s aspirations for a better life [1]. The spatial distribution patterns of catering establishments not only provide a direct reflection of urban morphology, consumer demand, and cultural characteristics, but also offer a key entry point for analyzing the evolution of urban spatial structures [2,3]. With accelerating urbanization and advancing consumption upgrades, the catering industry has shifted from a sole focus on “meeting basic nutritional needs” to undertaking diverse roles such as cultural experiences and “social settings” [4], and now exhibits complex characteristics where traditional and emerging formats intertwine, and core agglomeration coexists with peripheral diffusion [5,6,7]. Against this backdrop, precisely identifying the distribution patterns, agglomeration modes, and formation mechanisms of catering spaces holds significant theoretical and practical value for optimizing urban commercial layouts, preserving regional culinary cultures and enhancing residents’ quality of life.
In recent years, POI data has emerged as a data source for urban spatial research due to its extensive coverage and high timeliness [8]. Methodologically, kernel density estimation and multivariate density modeling of POIs address the limitations of traditional histograms in capturing contextual relationships [9], while a “divide and conquer strategy” is proposed for calculating small-scale population density [10]. Regarding influencing factors, studies have identified the impact of road networks and land cover on pollutant spatial distribution [11]. For hotspot identification, contour trees and locational entropy have pinpointed industrial cluster centers [12], enabling more precise delineation of the scope and morphology of POI hotspots for diverse facilities. This provides robust support for optimizing urban functional layouts and planning decisions [11,12,13]. However, existing POI research in the catering sector remains limited [14,15,16], and exhibits two key limitations: Firstly, it predominantly focuses on superficial characteristics such as density distribution, with insufficient exploration of the underlying spatial patterns (e.g., symmetrical relationships, hierarchical radiation), thereby failing to reveal the implicit order of catering spaces [17,18]. Secondly, it exhibits weak quantitative analysis of multi-factor coupling effects, particularly lacking in mechanisms explaining how natural geography, transport networks, and consumer demand synergistically shape catering patterns [19,20].
The development of geoscience information graph theory presents novel pathways to overcome these limitations [21,22,23]. As a significant branch of geospatial mapping, generalized symmetric structural graphs overcome the constraints of traditional geometric symmetry. By analyzing implicit relationships between geographical and environmental elements through patterns such as axial symmetry and central symmetry, they have been successfully applied in studies of urban development [23,24] and commercial centers [25,26,27]. Pioneering studies have applied spatial symmetry concepts to macro-scale commercial patterns [28,29]. Building upon these theoretical foundations, the GGSF further formalizes category-specific geometric transformations, explicit coordinate transformation equations, and quantitative matching of tolerance windows. Applying this methodology to food service spatial research holds promise for deepening our understanding of spatial patterns across the “form–function–mechanism” triad. Consequently, this study selects the urban core of Changsha—a central Chinese metropolis (encompassing Furong, Kaifu, Tianxin, Yuelu, Yuhua, and Wangcheng Districts)—as a representative case study, and innovatively constructs the “GIS–Generalized Symmetric Structural Graph” Framework for Restaurant Differentiation (GGSF), which integrates GIS spatial analysis methods (including kernel density estimation and nearest-neighbor analysis) with generalized symmetric structural graphs. This framework aims to achieve the following objectives: (1) systematically reveal the spatial distribution characteristics, agglomeration patterns, and spatial differentiation patterns and underlying mechanisms of catering Points of Interest (POIs) in Changsha’s main urban area (encompassing four business formats: Chinese cuisine, international cuisine, snacks and fast food, and desserts and drinks), clarifying the foundational basis for the formation of the “one core with multiple sub-centers” and “dense in the east and sparse in the west” patterns; (2) quantitatively analyze the distance correlation characteristics (distribution laws of nearest-neighbor distances) and aggregation gradient differences (hierarchies of kernel density hotspots) within catering spaces, elucidating the negative correlation between catering outlet density and average proximity distance, alongside the intrinsic logic underpinning sector-specific aggregation capacity disparities; (3) uncover the latent order of generalized symmetric structural graphs within catering spaces (including axial symmetry, central symmetry, translational symmetry, and other patterns across the whole area and by sector), examining the potential spatial associations between four dimensions—natural geography, transport networks, consumer demand, and policy planning—and catering spatial patterns. This provides scientific grounds for optimizing the layout of urban catering and similar commercial sectors, while offering a generalizable methodological paradigm for research into the differentiation of urban functional spaces.
2. Materials and Methods
2.1. Research Subject and Regional Overview
Changsha, located in northern Hunan Province in central China, functions as both a prefecture-level city under Hunan’s jurisdiction and the provincial capital of Hunan. As a core city within the central urban cluster, it harmoniously blends the historical heritage of the “Chu-Han Metropolis” with the contemporary dynamism of the “Mechanical Capital”. Its catering culture, rooted in Hunan cuisine, integrates Huxiang folk traditions with immigrant influences, yielding culinary characteristics defined by “emphasising authentic flavors, mastering pungency, and synthesising northern and southern culinary traditions”. Its commercial landscape centers around hubs such as the Wuyi Business District and the Yuelu Science and Innovation Corridor, showcasing the intertwined development of traditional commerce and emerging industries. The city’s main urban area encompasses six administrative districts, Furong, Kaifu, Tianxin, Yuelu, Yuhua, and Wangcheng, covering a total area of approximately 1800 square kilometers. Its permanent resident population exceeded 5 million in 2023. This area presents diverse scenarios, including old town renewal, new district development, and cultural-tourism integration. Its catering sector exhibits a distinct duality of “traditional clustering alongside emerging expansion”: within historic districts, traditional establishments like Hunan cuisine restaurants and street food stalls are densely concentrated, whereas commercial hubs such as the Wuyi Business District and Xiangjiang New District host emerging formats including international chains, creative eateries, and trendy tea bars, collectively forming a diverse and symbiotic spatial pattern. This area is selected as the study zone for its typicality and representativeness, as illustrated in Figure 1. The administrative district map is sourced from the National Geographic Information System (https://ngcc.cn/ (accessed on 13 January 2025)).
Figure 1.
Location map of the study area.
2.2. Data Collection and Preprocessing
Catering POI records across Changsha were retrieved via the Amap Open Platform (AutoNavi) Web Service API (https://lbs.amap.com/ (accessed on 15 January 2025)) in early 2025 using a spatial grid-search crawling script implemented in Python 3.8. The dataset represents a single-period cross-sectional snapshot reflecting the operational status of catering establishments at the time of retrieval. Initially, this yielded 68,489 raw entries. Coordinates were converted from the proprietary GCJ-02 system to the WGS-84 geographic coordinate system and subsequently projected to WGS 1984 UTM Zone 49 N for metric spatial distance calculations in ArcGIS 10.2. To ensure analytical precision and reproducibility, a multi-stage data screening funnel was executed, resulting in the exclusion of 19,829 invalid or redundant records. (1) Spatial boundary filtering: 9142 records situated outside the six core administrative districts were removed. (2) Spatial and attribute deduplication: 6215 duplicate entries sharing identical addresses, phone numbers, or coordinate proximities (<10 m) with name string similarity exceeding 90% were eliminated. (3) Entity validity screening: 4472 non-commercial or invalid entries representing closed storefronts, internal canteens (enterprises, government bodies, and schools) not open to the public, wholesale food suppliers, and virtual delivery kitchens lacking physical customer seating were excluded. This produced a final verified analytical sample of 48,660 catering POIs.
Guided by the National Economic Industry Classification (GB/T 4754-2017) [30] and cross-referencing multi-tier taxonomy from consumer platforms (Meituan and Dianping), the 48,660 entries were categorized into four mutually exclusive operational sectors: Chinese catering (18,789), snack and fast food (21,644), international catering (1028), and desserts and drinks (7199). To evaluate classification reliability, a stratified random validation sample of 500 POIs was manually cross-checked against active Meituan/Dianping storefront profiles, confirming an overall classification accuracy of 96.4%. As a cross-sectional snapshot, the dataset does not support longitudinal or temporal inferences. Furthermore, commercial POI databases inherently exhibit platform-specific coverage biases, presenting robust fidelity for registered brick-and-mortar businesses while potentially under-sampling informal, transient street vendors.
2.3. Research Methodology
This study proposes the “GIS–Generalized Symmetric Structural Graph” Framework for Restaurant Differentiation (GGSF) (Figure 2). The framework consists of three principal modules: the Data Processing Module, the GIS–Symmetry Graph Bidirectional Coupling Module, and the Interpretation and Application Output Module. The Data Processing Module integrates diverse datasets including catering POIs and urban spatial data, clarifies characteristics such as catering types and urban road networks, and preprocesses data to establish a robust foundation for subsequent analysis. Within the GIS–Symmetry Graph Bidirectional Coupling Module, the GIS spatial analysis submodule employs methods such as nearest-neighbor analysis and kernel density estimation to dissect restaurant spatial distribution and extract graph elements. The symmetry element deconstruction submodule then constructs central–peripheral symmetry and other forms of symmetry from these graph elements, guiding the GIS analysis direction to achieve bidirectional interaction and deepen the exploration of spatial symmetry patterns. The Interpretation and Application Output Module interprets the formation mechanisms of spatial differentiation in catering establishments and identifies spatial symmetry patterns, thereby providing practical references for urban catering industry layout and commercial planning. Collectively, this framework establishes a comprehensive closed-loop process spanning spatial analysis, mechanistic interpretation, and practical application. Conventional spatial analyses (e.g., KDE and nearest-neighbor analysis) are fundamentally constrained to evaluating isotropic, scalar density distributions and aggregate clustering intensities. While effective at demarcating “where” clustering occurs, they inherently treat spatial clusters as isolated entities, obscuring high-order spatial configurations, directional alignments, and bilateral morphological pairings among emerging sub-centers. The GGSF bridges this analytical gap by formalizing a transition from continuous scalar fields to discrete structural topologies. By integrating geometric transformation operators (reflection, translation, and rotation) with urban infrastructural skeletons (transit corridors and physical geographic barriers), the GGSF uncovers the latent, bilateral dualities and spatial periodicities that conventional surface density mapping cannot explicitly formalize.
Figure 2.
The “GIS–Generalized Symmetric Structural Graph” Framework for Restaurant Differentiation.
Unlike prior spatial graph applications that mainly used geometric symmetry as an interpretive metaphor for overall city-level density maps, the GGSF introduces three substantive analytical advancements: (1) Sector-Specific Deconstruction: It breaks down aggregate commercial density into four mutually exclusive operational formats, revealing format-specific symmetries (e.g., translational symmetry for fast food along rail transit vs. 120° rotational symmetry for youth-oriented drinks). (2) Quantitative Pairing Tolerance: It replaces subjective visual symmetry with mathematical transformation operators (reflection, inversion, rotation) bounded by strict spatial buffers (≤1.5 km/2.5 km). (3) Methodological Transferability and Sensitivity: It provides explicit sensitivity baselines (including KDE bandwidth perturbations and alternative natural breaks cutoffs) to validate the structural robustness of the captured patterns. The specific process of this analytical framework is illustrated in Figure 3.
Figure 3.
Computational workflow of the GIS–Generalized Symmetric Structural Graph Framework.
2.4. Kernel Density Analysis
Kernel density estimation constitutes a spatial analysis technique that calculates the density distribution of geographical features (such as catering Points of Interest) within unit areas. It presents the degree of feature clustering and hotspot regions through continuous heatmaps, revealing the “core–periphery” spatial gradient characteristics. This method effectively reflects the distance decay effect in the spatial distribution of geographical features [31]. This study employs kernel density estimation to identify density variations across different catering categories, locate agglomeration hotspots, and quantify spatial clustering demands of business formats. Its general expression is as follows:
Here, k() denotes the kernel function; h represents the bandwidth (controlling the spatial scope of density calculations); and ‖x − xi‖ indicates the spatial distance from the evaluation point x to the sample point xi.
Given the significant disparity in POI data volumes across different catering categories, a standard Quartic kernel function was implemented with a raster output resolution of 30 m × 30 m (output density unit: points/km2). Rather than relying purely on subjective visual inspection, the multi-scale bandwidths (1.0 km, 1.5 km, 2.0 km, and 3.0 km) were quantitatively calibrated against Changsha’s urban morphological texture. With an average road network density of 6.8 km/km2 in the urban core, the average arterial block grid spacing spans approximately 800–1200 m. Bandwidths of 1.0 km (international catering) and 1.5 km (desserts and drinks) capture localized footfall catchments across 1–1.5 block intervals; 2.0 km (Chinese catering and snacks/fast food) aligns with the mesoscale commercial corridor threshold; and 3.0 km (overall catering) delineates the macro-level polycentric structure across district boundaries. This differentiated configuration ensures the accuracy of density calculations for each sector while providing reliable foundational data for subsequent hotspot classification within the generalized symmetric structural graphs.
2.5. Nearest-Neighbor Analysis
Nearest-neighbor analysis systematically constructs spatial proximity relationships among catering Points of Interest (POIs), enabling quantitative analysis of spatial clustering characteristics, market competition mechanisms, and variations in business format distribution. In practice, spatial analysis tools first calculate the distance between each POI and its nearest neighboring points, generating a foundational dataset of spatial relationships. Subsequently, the proportion of points within different distance intervals is calculated by catering category to assess the clustering intensity of each business type. For instance, by analyzing the distribution frequency of POIs within key distance intervals (e.g., ≤200 m, ≤500 m), one can clearly observe the strong clustering characteristics of business types such as snack and fast food. Simultaneously, analyzing the correlation between POI quantity and average distance reveals how market spatial clustering is closely associated with proximity: higher numbers of a particular food category typically result in shorter average neighboring distances, reflecting denser spatial competition within that sector. Furthermore, comparing average neighboring distance differences across food categories clarifies each type’s spatial adaptation preferences, providing quantitative evidence for understanding the spatial selection mechanisms within the catering industry.
The Average Nearest-Neighbor ratio (R) is applied to evaluate the spatial aggregation of catering establishments:
where is the observed mean nearest-neighbor distance, and represents the expected mean distance under a theoretical Poisson random distribution (n = 48,660 denotes the POI count, and A = 1800 km2 is the study area). An R < 1 indicates spatial clustering, R > 1 indicates dispersion, and R = 1 reflects a random pattern. Standardized Z-scores were computed to evaluate inferential statistical significance, and boundary correction within the administrative mask was applied to mitigate spatial edge effects.
2.6. Generalized Symmetric Structural Graphs
Geographical diagrams serve as effective methods and tools for describing and understanding complex geographical phenomena and issues. Generalized symmetric structural graphs originate from the expansion and deepening of traditional geometric symmetry theory, employing abstract representations through geographical diagrams. Their construction requires multidisciplinary theoretical underpinnings to ensure the scientific rigor and precision of the methodology.
- (1)
- Generalized Symmetry Theory and Geoscience Information Spectrum Theory
Symmetry, as a universal law of nature, has long been a central theme in physicists’ explorations. With the advancement of theoretical physics, a novel concept of symmetry transcending traditional spatial and temporal symmetries has emerged—generalized symmetry. Generalized symmetry denotes a more abstract form of symmetry within physical theories, describing the properties of physical systems that remain unchanged under certain more general transformations. For instance, during rotations, translations, reflections, or similar transformations, the core structure or key attributes of the system remain stable. Within mathematics, generalized symmetry further expands into “symmetrical mapping relationships between set elements”, transcending the rigid formal constraints of traditional geometric symmetry. By quantifying mapping rules, it can describe the hidden ordered connections within non-regular systems.
Extending this theory to urban spatial analysis reveals that the distribution of dining establishments constitutes a “coupled natural–cultural system”. Their spatial patterns inevitably exhibit “functional–morphological” symmetries under the combined influence of natural constraints (e.g., topographical barriers like Yuelu Mountain, the course of the Xiang River), transport guidance (e.g., metro line layouts, accessibility of arterial roads), and consumer demand (e.g., dietary preferences and spending power differences among diverse demographics). These interrelationships constitute the concrete manifestation of generalized symmetry within human–geographical spaces, providing a critical theoretical foundation for deciphering the latent order of dining spaces and transcending the limitations of conventional research focused solely on surface density.
Geospatial information maps are defined as “tools centered on geospatial principles, achieving abstraction and visualization of geographical phenomena through the coupling of graphics, data, and mechanisms”. Their core characteristic lies in the integration of form, data, and principle: “form” refers to the visual representation of spatial patterns of geographical elements, such as hotspot distribution maps or density gradient maps of catering Points of Interest (POIs), which intuitively present spatial distribution patterns; “data” denotes characteristic metrics derived from quantitative analysis, such as kernel density estimation, symmetry indices, and hotspot grades, providing precise data support for morphological descriptions; “mechanism” refers to the intrinsic drivers shaping the formation and evolution of geographical phenomena, such as natural constraints or transport guidance mechanisms underlying spatial differentiation in catering establishments.
The generalized symmetric structural graph constructed in this study is methodologically underpinned by the theory of geospatial information graphs: First, GIS spatial analysis techniques are employed to extract the “form” and “data” of catering POIs—such as the five-tier spatial patterns of catering hotspots delineated through kernel density analysis, alongside core coordinates and density gradient data for each hotspot. Subsequently, leveraging the abstraction methods of geospatial graph theory, complex and dispersed spatial elements of catering are transformed into systematically analyzable graph patterns such as “axis symmetry”, “central symmetry” and “translation symmetry”. Finally, these graph patterns are deeply correlated with the “nature–transport–consumption” influencing mechanism, achieving an integrated process of “phenomenon visualization (form)–data quantification (quantity)–mechanism interpretation (principle)”. This provides robust support for the scientific validity and operational feasibility of the generalized symmetric structure graph.
To operationalize this coupling between GIS spatial analytics and the generalized symmetry theory, the GGSF formalizes concrete inputs, decision rules, and outputs across four sequential phases: First, in Phase I (Density Surface Generation), the input comprising 48,660 cleaned catering POIs is processed via multi-scale quartic KDE (bandwidths: 1.0–3.0 km, 30 m grid) to generate continuous density surfaces. Second, in Phase II (Hotspot and Centroid Extraction), focal statistics and natural breaks classification are applied to the continuous surfaces; contiguous raster patches within the top hierarchical tier are vectorized into discrete hotspot zones, from which geometric centroids are extracted as graph vertex candidates. Third, in Phase III (Symmetry Transformation and Pair Matching), geometric reflection, central inversion, and translation algorithms are performed on the centroid set under explicit macro-scale spatial tolerance windows. Centroid pairs satisfying these criteria are formally classified as empirical symmetric pairs. Finally, in Phase IV (Topological Graph Construction), these symmetric pairs and alignment vectors are synthesized into the structural graph G = (V, E, Φ), where vertices V represent hotspot centroids, edges E denote spatial connectivity vectors, and Φ designates the symmetry category (axial, central, or translational).
Compared to conventional KDE and nearest-neighbor workflows—which primarily produce static, planar density surfaces treating commercial clusters as isolated spatial entities—the GGSF provides substantial analytical added value. Specifically, it abstracts continuous density patches into rigorous mathematical graph topologies, quantitatively revealing inter-cluster equilibrium mechanisms (such as trans-river dual-core parity across the Xiangjiang River) and structural spatial corridors that remain entirely latent in traditional planar heatmaps.
- (2)
- Process for Constructing Generalized Symmetric Structural Graphs
Building upon the aforementioned theoretical foundations and incorporating the characteristics of catering POI data within Changsha’s urban core, the construction of generalized symmetric structural graphs primarily comprises three steps.
Step One: Kernel density analysis is used to categorize catering POIs into five tiers of hotspot—small, small-to-medium, medium, medium-to-large, and large—thereby establishing a hierarchical system of catering hotspots. Second, focal statistics are employed to quantify the symmetry correlation strength among distinct hotspot zones, ultimately forming a generalized symmetric structural map encompassing multiple symmetry patterns. This provides a visual analytical framework for subsequent spatial differentiation mechanism analysis within the catering sector. Third, spatial topology analysis tools are utilized to identify latent symmetric relationships between hotspots, thereby determining key reference elements such as axes of symmetry, centers of symmetry, and directions of translational symmetry.
Having established the three-step framework for constructing the generalized symmetry structure graph, to systematically and precisely analyze spatial symmetry in catering establishments whilst rendering it tangible and quantifiable, it is necessary to integrate key urban spatial elements with mathematical methodologies. This involves targeted identification and feature extraction for typical symmetry types—axial symmetry, central symmetry, and translational symmetry—thereby establishing a complete logical chain from pattern construction to quantitative symmetry analysis. This approach also provides robust technical and theoretical foundations for subsequent in-depth interpretation of the differentiation mechanisms within dining spaces. The specific identification processes and corresponding mathematical expressions are detailed below.
The GGSF operationalizes generalized spatial symmetry by introducing an explicit spatial tolerance buffer (δ) to relax strict geometric rules:
Let S = {i1, i2, …, in} denote the set of observed catering hotspot centroids in 2D Euclidean space. If a geometric transformation T maps hotspot i(xi,yi) to an ideal position i′(xi′,yi′), and an actual hotspot j(xj,yj) exists within the tolerance distance δ, i.e.,
then this group of hotspots exhibits generalized spatial symmetry. The four spatial symmetry types are formally defined as follows:
Axial Symmetry Identification: Using key linear urban elements (e.g., metro lines, the main channel of the Xiang River, the ridgeline of Yuelu Mountain) as a potential symmetry axis L (defined by the linear equation (Y = mx + b)), for any dining POI point i(xi,yi), calculate its mirror point i’(xi′,yi′) via the mirror transformation formula:
After obtaining the i’ coordinate, if a catering hotspot of the same tier exists within a 1.5 km buffer zone, the hotspot is deemed to form an “axial symmetric pair” with that hotspot (e.g., a large-sized catering hotspot corresponding to another large-sized catering hotspot).
Central Symmetry Identification: For the calculation of symmetric point coordinates, potential symmetric centers are set as urban catering core nodes (e.g., the center of Wuyi Square Business District, with coordinates denoted as O(x0,y0)). For any catering POI hotspot with coordinates i(xi,yi), its symmetric point i’(xi′,yi′) is calculated using the central symmetry transformation formula, which is shown as follows:
Upon obtaining the i’ coordinate, if a catering hotspot i of the same grade exists within a 2.5 km buffer zone around the symmetry point i’, it forms a “center-symmetric pair” with that hotspot.
Translational Symmetry Identification: For the calculation of translational point coordinates, potential translation directions are set as urban linear transportation elements (e.g., subway lines, urban arterial roads). Let the angle between the translation direction and the positive direction of the x-axis be θ, and take the average node spacing of the linear element (e.g., the average subway station spacing of 1.2 km) as the reference translation step d. For any catering hotspot i(xi,yi), its translational point i’(xi′,yi′) is calculated using the translation transformation formula, which is shown as follows:
Upon obtaining the i’ coordinate, if a catering hotspot of the same grade exists within a 500 m buffer zone around the translation point i’, then hotspot i is deemed to form a “translation-symmetric pair” with that hotspot.
Rotational Symmetry Identification: For the calculation of rotated point coordinates, an urban core node (e.g., the center of Wuyi Square Business District, with coordinates denoted as O(x0,y0)) is taken as the potential rotation center. Let the rotation angle be α (e.g., α = 120°). For any catering hotspot i(xi,yi), its rotated point i′(xi′,yi′) is calculated using the rotation transformation formula as follows:
After obtaining the coordinate of i′, if a same-tier catering hotspot exists within a 1.5 km buffer zone around the symmetric point i′, then hotspot i and that hotspot are deemed to form a “rotational symmetry pair.”
To ensure the rigor and operational feasibility of constructing the generalized symmetric structural graphs, key parameters in the research methodology must be further defined.
(1) Calibration of hotspot tier classification parameters: Referencing the aforementioned kernel density radius and the average road network density of Changsha’s main urban area (6.8 km/km2), bandwidths for focal point statistics were determined using radii of 1 km, 1.5 km, 2 km, and 3 km. By comparing the alignment of hotspot zones with actual commercial districts (e.g., Wuyi Square Commercial District, Meixi Lake Commercial District) across different bandwidths, the optimal bandwidths for overall catering, Chinese cuisine/snacks and fast food, international cuisine, and desserts/beverages were ultimately determined as 3 km, 2 km, 1 km, and 1.5 km respectively. This ensures the classification of hotspot tiers aligns with the actual spatial distribution of catering establishments. To evaluate the sensitivity of hotspot extraction to bandwidth parameterization, alternative bandwidths within a ±500 m perturbation range were systematically evaluated during methodological exploration. Comparative assessment revealed that varying the bandwidth primarily influenced the smooth contour envelopes of peripheral low-density transition zones, whereas the spatial peak positions and hierarchical presence of the dominant commercial hotspots (e.g., Wuyi Square, Meixi Lake, Pozi Street) remained highly invariant and structurally robust, exhibiting neither hotspot disappearance nor noticeable centroid displacement. This stability confirms that the backbone hotspot nodes extracted to construct the subsequent GGSF structural graphs are insensitive to moderate bandwidth fluctuations.
(2) Refined spatial filtering rules: To clarify, continuous KDE density surfaces were not artificially capped at 500 points/km2; prominent commercial centers legitimately display high densities on the final maps. Rather, filtering was applied at two specific stages: (i) eliminating point-level coordinate duplicates during data preprocessing where over 500 anomalous records piled onto identical coordinates due to batch geocoding errors, and (ii) excluding micro-hotspot raster patches with contiguous spatial areas below 0.2 km2 to remove fragmented statistical artifacts prior to centroid extraction, ensuring the structural validity of hotspot data for symmetry calculations.
(3) Selection and sensitivity of spatial tolerance buffers and step distance: The five-tier hotspot classification is objectively derived via the Jenks natural breaks algorithm. The selection of spatial tolerance buffers and translation steps is theoretically and empirically grounded in urban morphology, regional planning standards, and generalized symmetry theory. Specifically, the 1.5 km tolerance buffer applied to axial and rotational symmetries is adopted to capture macro-structural boundaries between urban functional districts, corresponding to the upper bound of the 15 min community life circle. The 2.5 km tolerance applied to central symmetry reflects the primary gravitational radius of a metropolitan commercial core within a motorized 15 min range. The 500 m tolerance buffer applied to translational symmetry reflects the TOD pedestrian catchment (5–10 min walk) around subway portals. It is strictly kept below half of the 1.2 km translation step (which reflects the empirical average station spacing of Changsha Metro Lines 1 and 2) to prevent search-area overlap and false-positive matching. To evaluate the stability of these thresholds, a parameter sensitivity assessment was conducted across macro-scale buffer intervals (1.0–2.0 km for axial symmetry and 1.5–3.0 km for central symmetry, whereas the 500 m translation tolerance is geometrically constrained by the 1.2 km step to prevent overlap, and the 1.5 km rotational tolerance remains structurally fixed). Sensitivity was evaluated by examining changes in the number and composition of matched hotspot pairs across different tolerance thresholds. The Jaccard similarity coefficient was used to quantify the consistency of the identified pairings relative to the baseline configurations (1.5 km for axial symmetry and 2.5 km for central symmetry), thereby identifying parameter intervals within which the symmetry relationships remained unchanged.
Concurrently, priority was given to selecting prominent spatial elements with “spatial guidance” within the city: for axis symmetry references, priority was given to linear landmarks such as metro lines, mountain ridges, and rivers; for central symmetry references, priority was given to nodes such as commercial district centers (determined by kernel density peak points) and urban geometric centers; for translational symmetry references, priority was given to metro stations, ensuring the statistical significance of symmetry relationship analyses.
3. Results and Analysis
3.1. Spatial Distribution Characteristics of Catering POIs
3.1.1. Overall Spatial Distribution of Catering POIs
Utilizing the kernel density estimation function within the GIS spatial analysis module of the “GIS–Generalized Symmetric Structural Graph” framework (GGSF), and in conjunction with the visualization results presented in Figure 4, it is evident that the macro-spatial pattern of the catering industry within Changsha’s main urban area exhibits a pronounced “one core, multiple centers” distribution characteristic. This phenomenon aligns with the regional development model proposed within the growth pole theory [32]. Specifically, catering outlets (POIs) in Changsha’s urban core exhibit a high concentration within the central districts (entire Furong District, northeast Yuelu District, northwest Yuhua District, and northern Tianxin District). Their distribution diminishes gradually along primary commercial axes towards peripheral areas, forming a hierarchical network system centered on traditional commercial hubs and anchored by multiple specialized sub-centers. This spatial distribution pattern not only reflects universal principles of commercial development but also showcases local characteristics, constituting a distinctive spatial reconfiguration model.
Figure 4.
Spatial distribution of catering Points of Interest in Changsha’s main urban core.
From an overall spatial perspective, Changsha’s main urban area exhibits an east-dense, west-sparse pattern in its catering industry. The area surrounding Wuyi Square in Furong District has formed the city’s highest-density catering hub, aligning with the theory of growth poles where innovation and diffusion drive surrounding regional development. The historical and cultural districts of Tianxin District constitute distinctive secondary catering hubs, while Yuelu District exhibits a unique dual-core configuration centered on the university town and Meixi Lake. These emerging areas, guided by planning and market selection, are evolving into new growth poles. The formation of Wuyi Square’s dining hub in Furong District and the secondary hub in Tianxin District’s historic cultural quarter stems from a dual-center influencing mechanism: Wuyi Square, as a traditional commercial core, leverages the accumulated heritage of its century-old commercial district (such as Huangxing Road Pedestrian Street) and high population density to form the primary nucleus of dining concentration. Tianxin District, benefiting from the stable footfall generated by government offices and the old town’s location, coupled with the consumer spillover effect from the nearby Pozi Street commercial district, has become a secondary growth pole within the region. Conversely, the western areas of Wangcheng District and the peripheral parts of Yuelu District, characteristic of transitioning suburban landscapes and lower population densities, exhibit relatively sparse catering establishments. This manifests as a macro-level “high density in the east, sparse in the west” configuration, reflecting the historical concentration of commercial agglomeration within the central core rather than directly indicating unmet local consumption demand.
3.1.2. Spatial Distribution of Catering POIs in Various Districts
Within the framework of the “GIS–Generalized Symmetric Structural Graph” (GGSF), the Data Processing Module first integrates and standardizes classified catering POI data. This is then combined with POI data visualization results (Figure 5) and the catering POI distribution statistics table for each county in the main urban area (Table 1). Utilizing the GIS spatial analysis module, an in-depth analysis of density variations across different business formats is conducted. This ultimately confirms that the spatial density of the four catering business formats in Changsha’s main urban area collectively exhibits the common characteristic of “high density in the old city center, with a gradual decrease towards the periphery”. However, due to differences in business format attributes, their distribution peculiarities and differentiation mechanisms each have distinct emphases.
Figure 5.
Spatial distribution of catering POIs in different categories in Changsha’s urban core.
Table 1.
Distribution table of catering POIs in districts of the main urban core.
(1) Chinese catering establishments exhibit high concentration in the historic districts (around Wuyi Square at the junction of Furong, Tianxin, and Yuelu Districts), fundamentally rooted in cultural embeddedness mechanisms. As physical embodiments of Huxiang culinary traditions, Hunan restaurants and time-honored eateries are deeply intertwined with the daily routines of residents in these older areas, fostering enduring consumer loyalty. Moreover, spatial compatibility mechanisms reinforce the spatial differentiation of Chinese dining establishments: the narrower streets and alleys of the old city, coupled with relatively lower rental costs, suit the survival of small and medium-sized eateries. While new urban areas also host Chinese dining options, these predominantly comprise chain brands that require adapting traditional flavors to better suit younger clientele, reflecting the dynamic equilibrium between cultural heritage and market demand.
(2) The international catering sector exhibits a pattern of “strong centralization coupled with weak dispersion”, being highly concentrated in central business districts (CBDs) (Furong District and the historic commercial hubs of Tianxin District). This concentration leverages the high-end consumption demands of urban CBDs, forming the sole area of significant density. From an administrative district perspective, the number of international catering establishments has notably decreased in Wangcheng District and Kaifu District. This reflects the sector’s dual dependence on “commercial district markets + high purchasing power,” indicating low adaptability to suburban areas.
(3) Snack and fast food outlets exhibit a trend towards “comprehensive coverage”, aligning with their characteristics of high cost-effectiveness, convenience, and regional cultural adaptability. This spatial pattern is closely associated with rigid demand-driven mechanisms on the development of snack and fast-food establishments. However, in the northwestern part of Wangcheng District, the southwestern part of Yuelu District, and the southeastern part of Yuhua District, distribution remains relatively sparse due to constraints on suburban population density and consumption scenarios. Concentrations are primarily found in old town centers, university clusters, and industrial parks, failing to achieve truly comprehensive penetration across the entire area.
(4) Desserts and drinks in Changsha’s main urban areas exhibit a pattern of “trendy clusters in old districts and scene innovation in new districts”. By leveraging specific settings and appealing to younger demographics, emerging hubs centered around shopping malls and university towns have developed rapidly. This phenomenon essentially combines consumption upgrade drivers with scene dependency mechanisms. Consequently, their coverage falls far short of that of Chinese catering and snack and fast-food establishments. Suburban residential areas still predominantly feature traditional cake shops, lacking a specialized industrial chain and thus failing to form a comprehensive coverage network.
3.2. Spatial Distance Characteristics of Catering POIs
By leveraging the nearest-neighbor table analysis function within the GIS spatial analysis module of the “GIS–Generalized Symmetric Structural Graph” (GGSF) framework, the spatial distance relationships between catering Points of Interest (POIs) in Changsha’s main urban area can be quantitatively analyzed through calculating their nearest distance matrix and the proportion of different distance intervals. This approach reveals the clustering intensity and competitive landscape within the catering sector. Spatial distance inherently describes the relative positioning, distribution, and influence strength between spatial entities. Results from the nearest-neighbor analysis indicate that Changsha’s urban core exhibits pronounced density and intense competition within its catering industry spatial distribution. As evidenced by Table 2, the distance intervals represent cumulative frequencies, meaning outlets falling within ≤200 m are also included in the ≤500 m bracket. Over 99% of all catering outlets are located within 500 m of their nearest neighbor. Specifically, the majority of Chinese catering, international catering, snack and fast-food, and dessert and drinks outlets are situated within 500 m of their nearest catering neighbor, reflecting a “clustered” market choice in catering consumption. Snack and fast-food outlets: There are 21,644 total POIs, with 21,274 (98.3%) within 200 m, indicating pronounced spatial clustering. Chinese cuisine: Leveraging cultural foundations for widespread clustering and adaptability across diverse settings, 95.2% are within 200 m, maintaining competitive advantage across spatial contexts. Dessert and drinks outlets numbered 7199, with 92.9% within 200 m. This high concentration stems from scenario limitations hindering suburban penetration, making competitiveness dependent on “scenario density”. In contrast, international dining establishments exhibit sparse distribution and lower market competition, potentially due to relatively lower demand or an underdeveloped market. Inferential ANN statistics further confirm extreme, statistically significant spatial clustering across all sectors. Because the vast majority of outlets (>92%) are clustered within 200 m, the empirical observed nearest-neighbor distances are significantly shorter than expected random distances under theoretical Poisson distribution (R < 1.0, Z < −2.58, p < 0.001). Specifically, the detailed empirical ANN statistics (Table 3) far exceed this theoretical threshold, confirming extreme and highly significant clustering across all categories (R < 0.4, Z < −42.9, p < 0.001). This definitively rejects the null hypothesis of spatial randomness (p < 0.001) and statistically confirms intense clustering across both the overall sector and individual formats. Furthermore, we qualify the behavioral interpretation of these micro-scale distances: rather than definitively indicating fierce economic rivalry or zero-sum market competition—which cannot be established without operational sales or footfall revenue data—these exceptionally low nearest-neighbor distances primarily signify spatial clustering intensity, shared consumer footfall, and spatial dependency on pedestrian thoroughfares and commercial complexes.
Table 2.
Nearest-neighbor table of various catering formats in the main urban area.
Table 3.
Average nearest-neighbor analysis of different catering types in the main urban area of Changsha.
Furthermore, catering categories with larger total numbers of outlets exhibit shorter average distances between establishments, and as quantified by the ANN results, this spatial pattern primarily indicates a higher physical density and tighter spatial clustering.
3.3. Spatial Agglomeration Characteristics of Catering POIs
3.3.1. Spatial Agglomeration Status of Overall Catering POIs
Employing the kernel density estimation function within the GIS spatial analysis module of the “GIS–Generalized Symmetric Structural Graph” (GGSF) framework, and analyzing the clustering characteristics of catering Points of Interest (POIs) in Changsha’s main urban area alongside the visualization results in Figure 6, it was found that the overall catering spatial distribution exhibits a pronounced “central concentration, peripheral sparsity” pattern. Spatially, this manifests as “one major core + multiple minor cores”, exhibiting a decreasing density pattern from the center to the periphery, indicating overall uneven development.
Figure 6.
Spatial agglomeration of catering POIs in Changsha’s urban core.
Within Changsha, the “major core” of the catering industry is primarily concentrated at the junction of Furong District, Tianxin District, and Yuhua District. These areas encompass large commercial centers such as Wuyi Square and Huangxing Road Pedestrian Street, serving as the city’s economic and cultural hubs that attract a significant number of catering businesses and consumers. These areas exhibit the highest catering density, appearing in red on the heatmap, with establishment densities ranging from 379.69 to 516.37, indicating exceptionally high concentration.
Changsha’s multiple “smaller hubs” are concentrated around Meixi Lake Park and Yuelu Mountain Scenic Area in Yuelu District, as well as Beichen Delta and Kaifu Temple in Kaifu District. Surrounded by large commercial districts and tourist attractions with well-developed infrastructure, these areas exhibit higher catering density. They appear orange and yellow on the heatmap, with catering point densities ranging from 237.31 to 332.23, forming relatively high concentrations.
Additionally, certain areas within Wangcheng District, Yuelu District, and Yuhua District exhibit relatively underdeveloped catering sectors due to urban planning sequencing. These zones predominantly display catering densities in green hues, with density values ranging from 0 to 94.92, presenting sparse catering establishment distribution across the entire main urban area.
3.3.2. Spatial Agglomeration Status of Catering POIs in Various Categories
As illustrated by the kernel density map in Figure 7, Changsha’s urban spatial structure and consumer demand have fostered distinctive spatial clustering patterns among four catering categories within the city center: Chinese cuisine, international dining, snacks and fast food, and desserts and beverages. Chinese catering, for instance, exhibits a “multi-nucleated” form deeply embedded within the urban fabric, achieving a kernel density peak of 214.93. This category demonstrates extensive geographical distribution coupled with high concentration levels. Its core clusters encompass areas such as Wuyi Square in Furong District (a traditional commercial hub), Huangxing Road Pedestrian Street in Tianxin District (another traditional commercial center), and Meixi Lake in Yuelu District (an emerging cultural zone). The formation of these “nuclei” stems both from the urban core’s capacity to absorb demand for traditional culinary culture and its connection to emerging commercial vitality and pedestrian density within these areas. International catering exhibits a “single-core” concentration pattern, with a core density peak of merely 62.42 and relatively dispersed distribution, primarily centered on Wuyi Square. This characteristic reflects the stringent demands of international catering’s consumer base for quality, experience, and an international ambience. Compared to other catering types, international dining faces constraints in customer scale and consumption thresholds, making widespread penetration difficult. Wuyi Square, as the city’s premier commercial district, thus serves as a suitable “single pole” for international catering. Snack and fast-food establishments exhibit a high core density peak (277.86) and pronounced “multi-core” characteristics, establishing a comprehensive distribution pattern across the entire area. Beyond core commercial districts like Wuyi Square and Huangxing Road Pedestrian Street, secondary commercial centers and residential areas in each district also constitute high-density zones. This stems from the essential nature of snacks and fast food: on the one hand, they align with contemporary fast-paced lifestyles, catering to diverse scenarios; on the other, their low consumption threshold and universally appealing flavors integrate them into various functional zones, meeting mass consumption demands. Dessert and drinks exhibit a core density peak of 185.7, with high-value points concentrated in areas like Wuyi Square, Huangxing Road Pedestrian Street, and Meixi Lake, presenting a “scattered-core” characteristic. This category is deeply intertwined with young consumers and leisure–social settings: core commercial districts attract youth traffic, catering to light dining during shopping and socializing; emerging areas like Meixi Lake draw fashion-conscious patrons through cultural and recreational offerings. Their distribution reflects the segmentation of urban consumption scenarios as emblematic of “experience-driven consumption”: sweet treats and beverages cluster around youthful, leisure-oriented spaces, mirroring emerging demand trends within the context of urban consumption upgrading.
Figure 7.
Spatial agglomeration of catering POIs by category in Changsha’s urban core.
3.4. Spatial Distribution Differences in Catering POIs
3.4.1. Spatial Distribution Differences in Overall Catering POIs
Based on street-level kernel density analysis, as illustrated in Figure 8, the overall spatial distribution of catering establishments within Changsha’s urban core exhibits a pronounced “core-radiation plus strip-like extension” pattern, deeply intertwined with the city’s developmental trajectory.
Figure 8.
Spatial distribution differences in catering POIs in Changsha’s urban core.
Observing the density gradient reveals a concentric decrease in catering kernel density centered on the urban core, though this diminishes not through regular concentric circles but through a tiered expansion. The core high-density zone (red legend, density 1141–1759 units/km2), concentrated in areas blending traditional urban districts with emerging commercial zones, covers the vicinity of Wuyi Square and extends southward along the commercial axis traversed by Metro Line 5 to Dongjing Subdistrict in Yuhua District. This transcends single administrative boundaries, forming cross-regional catering clusters. This area represents Changsha’s economic and cultural heart, serving as a must-visit dining destination for tourists. It hosts a diverse array of establishments, including traditional eateries and trendy, internet-famous restaurants, characterized by both high density and varied business formats.
Additionally, extremely high-density points exist along major urban thoroughfares and in policy-supported locations. For instance, the high catering density in Lugu Subdistrict (Yuelu District), Moon Island Subdistrict (Wangcheng District), and Muyun Town (Tianxin District) correlates closely with transport accessibility and policy incentives. The completion of Metro Line 6 has enhanced accessibility to Lugu Subdistrict, delivering increased footfall and stimulating catering development. Policy initiatives promoting the Xiangjiang New Area, including the construction of riverside park clusters and Hanwangling Park, have accelerated development in the Moon Island District, significantly boosting catering density. Muyun Town’s growth is linked to its role as a core area within the integrated development of the Changsha–Zhuzhou–Xiangtan metropolitan region.
The sub-high-density zone (orange and yellow legend, kernel density 256–1140 units/km2) primarily follows a ribbon-like distribution interconnected by metro lines. For instance, streets along Metro Lines 2 and 3 leverage their transport convenience to link multiple secondary commercial districts (such as the Yuhuatang and Riverside commercial areas) with catering outlets strategically positioned to follow pedestrian flow patterns. This creates a synergistic “transport corridor + consumption node” model, catering to the daily consumption needs of residents along these routes.
The peripheral green zone (core density 0–255 units/km2) exhibits functional catering distribution. Predominantly comprising residential suburbs, it focuses on community-based essential catering to meet daily consumption needs. The remaining areas include industrial parks and eco-cultural-tourism zones, where catering demand remains lower than in the city center.
3.4.2. Spatial Distribution Differences in Catering POIs in Various Categories
The spatial distribution characteristics of different categories of catering establishments within Changsha’s main urban area reflect the distinct positioning of each category towards varying consumer groups, consumption habits, and market demands. As illustrated in Figure 9, Chinese-style eateries exhibit relatively uniform distribution across Changsha’s main urban area, spanning from the city center to peripheral zones. High-density areas (378–666 units/km2)—primarily concentrated in the central districts of Furong and Tianxin—are complemented by sustained density in emerging commercial and residential neighborhoods, demonstrating balanced catering to diverse consumer demands. International dining establishments exhibit relatively lower core density in Changsha’s urban core, with high-density zones (52–97 units/km2) primarily distributed in central commercial districts, catering to patrons seeking exotic cultural experiences and premium dining. As Changsha’s internationalization advances, such establishments may gradually expand into broader areas. Snack and fast-food establishments maintain stable market demand across areas of varying economic levels due to their convenience and speed, hence their high distribution density in Changsha’s main urban districts. Dessert and beverage outlets require slightly higher regional consumption levels, such as in shopping centers and cinemas, leading to concentrated distribution in these areas. Simultaneously, dessert and beverage outlets are favored by younger consumers, resulting in concentrated distribution in areas with high youth populations, such as university neighborhoods.
Figure 9.
Spatial distribution differences in catering POIs by category.
3.5. Generalized Symmetric Structural Graphs of Catering POIs
3.5.1. Generalized Symmetric Structural Graphs of Overall Catering POIs
By leveraging the deconstruction module for symmetrical elements and the focal statistics function within the GIS spatial analysis module of the GGSF, one may transcend the limitations of prior research predominantly centered on “phenomenological description”. Given the complexity of geographical entities and phenomena, analyzing specific distribution patterns alone proves insufficient for unraveling underlying mechanisms. The generalized symmetric structural graphs effectively address this research gap by abstracting spatial order and uncovering latent correlations. Consequently, by integrating methods such as focal analysis, we obtained the generalized symmetric structural graphs for the overall catering sector in Changsha’s main urban area (Figure 10). The specific procedure was as follows: First, kernel density estimation (KDE) was performed to generate a continuous density surface. Second, focal statistics was applied to smooth the surface and extract local density peaks. The resulting surface was then classified into five tiers using the natural breaks (Jenks) method (Table 4).
Figure 10.
Generalized symmetric structural graphs of overall catering POIs.
Table 4.
Extracted catering hotspot tiers and their spatial locations.
To further elucidate the underlying spatial patterns of catering, this study selected one large catering service hotspot (Tier 5) that better reflects overall characteristics, alongside nine medium-to-large catering service hotspots (Tier 4) that embody local urban traits, as the core subjects for generalized symmetric structural analysis. As illustrated in Figure 10, among the large and medium–large catering hotspots numbered 1 to 10, two distinct generalized symmetric structural patterns emerge: an axial symmetry configuration encompassing hotspots 2, 4, 5, 7, 8, and 10, and a central symmetry pattern formed by hotspots 2 to 7 radiating from the central node 1.
Within the axial symmetry structure (hotspots 2, 4, 5, 7, 8, 10), the candidate reference axis is geometrically defined by connecting the center of the northeast hotspot cluster and the center of the southwest hotspot cluster. The axis represents not merely a geometric reference but aligns with the connection between Wuyi Square and the northeast and southwest catering hubs. Hotspots 2, 7, 8 and 4, 5, 10 respectively correspond to the “catering hubs of new urban development” and “catering hubs of old urban communities” on either side of the axis. Hotspots in the new urban areas, densely populated with office commercial districts, have spawned business-oriented amenities such as light meals, cafés, and coffee bars. Old-city hotspots, supported by resident populations, aggregate essential dining formats like traditional eateries and daily sustenance. This symmetrical structure mirrors the culinary landscapes of urban functional zones—both new and old—and reflects the spatial projection of the city’s functional zoning mechanism.
Within the centrally symmetrical pattern (centered at 1, with 2–7 forming the structure), the center point is explicitly defined as the geometric center of large catering hotspot 1 (Wuyi Square Commercial District). This layout clearly reflects the characteristic of lower-tier dining hotspots being orderly distributed around higher-tier dining hubs. Urban consumption poles, leveraging their formidable crowd-drawing power and commercial influence, serve as the “anchor points” of the dining ecosystem. High-tier central hotspot 1 establishes the city’s dining core through diverse catering formats, while symmetrically distributed medium-to-large hotspots 2–7 radiate outward like ripples. This indicates a spatial pattern where high-tier dining hubs align with the concentric zoning of lower-tier hotspots and the tiered absorption of consumer demand. Table 5 presents the quantitative results of these structural patterns.
Table 5.
Symmetry matching results for the core catering hotspots.
3.5.2. Generalized Symmetric Structural Graphs of Catering POIs in Various Categories
By leveraging the hotspot classification and spatial topology analysis capabilities within the Symmetry Element Deconstruction Module of the “GIS–Generalized Symmetric Structural Graph Framework” (GGSF), and integrating the characteristic POI data of various catering formats, one can further uncover generalized symmetry patterns across different dining categories. These symmetry patterns are deeply intertwined with the attributes of each format while also reflecting the differentiated influence of natural and cultural factors upon catering spaces.
- (1)
- Chinese catering
The core density of Chinese catering broadly parallels that of the overall catering sector, yet distinct differences emerge when examined through a broad-spectrum symmetric structural network analysis. As illustrated in Figure 11 depicting the structural network of Chinese-style catering, a pronounced dual-core axial symmetry is discernible. Two prominent red “large catering service hotspots” (points 1 and 2) radiate outward along metro lines, with medium-to-large catering hotspots (points 3, 4, 5, 6, 7, 8) distributed radially. This pattern reflects a multi-center synergy driven by radial symmetry logic.
Figure 11.
Generalized symmetric structural graphs of Chinese catering POIs.
Points 6, 7, 11, and 12 reveal an axisymmetric pattern, primarily due to Yuelu Mountain’s topography impeding bilateral coordination. This forces hotspot data to align axially along the mountain’s traverse, demonstrating nature’s foundational role in shaping urban catering symmetry and exerting significant influence on its development.
Points 9 and 10 also possess similar counterparts within the broader symmetrical structure of the overall catering sector. However, within the entire catering landscape, these points represent a medium-sized catering service hotspot, whereas within Chinese-style catering, they constitute a medium-to-large catering service hotspot. This further illustrates that spatial heterogeneity exists due to the differing distribution patterns and locations of Chinese-style catering compared to the overall catering sector. Collectively, these factors construct the complex yet orderly spatial configuration of the catering sector.
- (2)
- International Catering
The number of international catering establishments is relatively low, resulting in a sparse distribution. Within the broad symmetrical structure map, fewer hotspots are evident, as shown in Figure 12. There are five major catering service hotspots and medium-to-large catering service hotspots combined. Although the symmetrical structure is not as pronounced as that observed in the overall catering or Chinese catering distributions, characteristics such as axial symmetry are still present.
Figure 12.
Generalized symmetric structural graphs of international catering POIs.
Observing the first axial symmetry map (featuring points 1, 2, and 5), while no pronounced topographical interference is evident, international catering hotspots align along metro lines and predominantly cluster at intersections. This demonstrates significant influence from urban factors such as transport networks and commercial district functional zoning, a distinctive characteristic of international catering.
Furthermore, some hotspots exhibit differing rankings across the overall catering and international catering maps. This stems from the inherent operational characteristics and layout preferences of international catering establishments, which demand more distinctive consumption scenarios and customer segmentation. This also reflects the unique layout logic and developmental trajectory of international catering within the urban dining ecosystem.
- (3)
- Snack and Fast Food
Within the broad symmetrical structural map of snack and fast-food establishments (Figure 13), translational symmetry aligns with the metro network’s connectivity. Leveraging metro lines, snack and fast-food hotspots exhibit an equidistant distribution pattern along rail routes. This stems from their core attributes of convenience and affordability, making them particularly suited to commuters and other daily travelers, as well as fragmented lifestyle scenarios. As the urban artery for passenger flow, the subway’s station intervals form a natural metric. Snack and fast-food establishments precisely align with this cadence, repeating combinations of large and medium-sized outlets at similar distances along subway corridors. This ensures commuters and students across different districts can find familiar snack options within convenient proximity.
Figure 13.
Generalized symmetric structural graphs of snack and fast-food POIs.
Moreover, the metro network weaves a comprehensive service web for snack and fast-food consumption, optimizing the spatial distribution of urban vibrancy. This demonstrates the profound influence of urban transport on the socio-cultural dining landscape. By applying a symmetrical spatial logic of “equidistant accessibility”, it effectively preserves the warmth inherent in city life.
- (4)
- Desserts and Drinks
Within the broad symmetrical structure of dessert and drinks, axial and rotational symmetry features are pronounced, delineating a distinctive spatial order of consumption that reflects the interconnection between dessert/beverage establishments and urban functions.
As observed in Figure 14 below, dessert/drinks hotspots (points 4, 6, 7, 8) exhibit mirrored distribution along the dotted line, forming a symmetrically complementary axial layout. This axial symmetry reveals balanced consumption patterns for desserts and beverages within the city, with its central axis guiding consumer flows and business clustering.
Figure 14.
Generalized symmetric structural graphs of desserts and drinks POIs.
Furthermore, the rotational symmetry pattern centers on a large catering service hotspot (red marker), surrounded by medium-to-large catering hotspots (points 2, 3, 5) distributed at 120° intervals, creating a radial layout. This arrangement not only consolidates the developmental standing and consumer vitality of sweet treats and beverages across different locations, but also satisfies regional demand through rotational symmetry. The large red catering hotspot drives the radiation of surrounding businesses via transport infrastructure such as road networks and underground railways, enhancing the appeal and competitiveness of the desserts and drinks sector.
3.5.3. Quantitative Validation and Sensitivity Analysis
Quantitative examination of the extracted structural graphs indicates that the dominant commercial centroids form verified symmetric pairings within the established tolerance windows. To evaluate whether the observed pairings could arise from spatial coincidence, a Monte Carlo simulation (1000 permutations) based on a Bounding Box Complete Spatial Randomness (CSR) baseline was conducted. The baseline demonstrated that the likelihood of randomly generating the observed three pairs is exceptionally low (probability = 0.012 for axial symmetry and probability = 0.034 for central symmetry). These results suggest that the observed symmetry configurations are highly unlikely to be artifacts of random spatial coincidence, thereby supporting the structural validity of the identified spatial symmetry patterns. Furthermore, the spatial deviations of these matched centroids exhibit varying degrees of geometric offset, yet all securely fall within the revised 1.5 km and 2.5 km macro-structural thresholds. To evaluate the sensitivity of the framework, axial pairs were tested across a 1.0–2.0 km buffer and central pairs across 1.5–3.0 km, both at 0.1 km intervals. The number of axial symmetry pairs increased from one to three as the tolerance increased, with all three pairings remaining unchanged within the 1.4–2.0 km interval. Similarly, the number of central symmetry pairs increased from zero to three, with all three pairings remaining stable within the 2.3–3.0 km interval. The Jaccard similarity coefficient remained 1.000 within these stable intervals, indicating that both baseline thresholds (1.5 km for axial symmetry and 2.5 km for central symmetry) fall within ranges of consistent symmetry identification. Additionally, comparing the baseline five-tier Jenks natural breaks against alternative thresholding criteria (top 15% and top 20% kernel density cutoffs) revealed that the spatial topology of dominant commercial cores remained highly consistent, with the primary bilateral axis along the Xiangjiang River and the east–west translational corridors along Metro Line 2 retaining stable centroid locations (positional shift < 180 m). Variations primarily affected peripheral Tier 3 tertiary clusters, confirming that the primary generalized symmetric structures captured by the GGSF represent robust morphological properties rather than arbitrary threshold artifacts.
4. Discussions
This study, based on catering POI data and utilizing the “GIS–Generalized Symmetric Structural Graph Framework” (GGSF), reveals the spatial distribution, clustering, distance characteristics, and generalized symmetric structure of catering establishments in Changsha’s main urban area. It clarifies their relationship with urban space, consumer demand, and transport conditions, while analyzing the formation mechanisms of catering spatial patterns. This establishes an analytical closed loop linking “spatial differentiation mechanisms” with “generalized symmetric structural graphs”. The differentiation mechanism elucidates the formation logic of symmetric structures, while symmetric structures manifest the spatial morphology of differentiation mechanisms, thereby avoiding the limitations of a singular perspective. It should be prefaced that given the observational nature of cross-sectional POI data, the mechanisms discussed below represent plausible explanatory hypotheses grounded in classic urban location theory, reflecting robust spatial associations rather than definitive econometric causality. The discussion below unfolds across four dimensions: spatial differentiation influencing mechanisms, the value of the generalized symmetric structural graph, policy coordination and optimization pathways, and research limitations and future prospects.
4.1. Exploration of the Spatial Associations of Spatial Differentiation
The spatial differentiation of Changsha’s catering industry exhibits spatial associations with four potential factors: natural constraints, transport guidance, consumer segmentation, and policy planning. Natural geographical constraints: The natural barrier of Yuelu Mountain is closely associated with an axisymmetric distribution of Chinese catering Points of Interest (POIs) along the mountain’s orientation. Constraints imposed by the north–south flow of the Xiang River exhibits a spatial association with catering establishments lining the riverbanks in a north–south orientation, forming cross-river clusters. This creates a partial differentiation where the west bank exhibits dispersed development while the east bank shows dense concentration.
Transport network factors: The metro network is an important component of urban accessibility and exhibits a close spatial association with catering establishment distribution. Catering facilities exhibit a notably higher concentration within a 500 m radius of metro stations compared to peripheral areas. Snack and fast-food outlets exhibit symmetrical alignment along metro lines, suggesting a “rail–catering” linkage differentiation pattern.
Consumer demand differentiation factors: Areas with a higher proportion of young residents exhibit a higher density of dessert and beverage outlets, whereas aging communities predominantly feature Chinese cuisine. Differences in demographic composition and consumer preferences may help explain the observed spatial differentiation of catering formats.
Policy and planning factors: Wuyi Square, as a municipal commercial hub, exhibits a spatial correspondence with the formation of high-density catering clusters through planning directives and business format support policies. In Tianxin District, the spatial distribution of government-related catering establishments and traditional specialty restaurants corresponds with the concentration of government institutions and historic districts, suggesting a possible association with local planning and heritage conservation contexts. In contrast, Wangcheng District exhibits a relatively sparse distribution of catering establishments, which may be associated with its urban development conditions.
4.2. The Spatial Logic and Practical Value of the Generalized Symmetric Structural Graphs
The generalized symmetric structural graphs of Changsha’s catering Points of Interest (POIs) reveal the implicit connections between urban functions and spatial order, offering a unique perspective for understanding catering distribution patterns.
At the overall catering level, axial and central symmetry reflect distinct spatial organizational relationships. The axial configuration connects commercial hotspots in newer urban areas with those in older communities along the Wuyi Square–northeast/southwest axis, suggesting functional complementarity between emerging leisure-oriented and traditional dining activities. The central symmetry configuration around Wuyi Square highlights the spatial relationship between the principal commercial core and surrounding secondary catering hotspots, including Pozi Street and Yuhuating, reflecting a hierarchical organization of urban commercial activities.
Sector-specific symmetry patterns reveal further differentiation. Chinese catering exhibits dual-core axial symmetry spatially associated with Yuelu Mountain’s topography, with hotspots distributed along the mountain’s orientation. International catering hotspots are concentrated near metro intersections and established commercial districts, suggesting an association with highly accessible commercial environments. Snack and fast-food establishments display translational symmetry along metro corridors, with hotspots occurring at relatively regular intervals, consistent with convenience-oriented consumption patterns. Dessert and beverage establishments exhibit rotational symmetry around major commercial centers, potentially reflecting the spatial distribution of leisure-oriented consumption activities.
These findings highlight the value of the GGSF in identifying geometric relationships among commercial hotspots beyond conventional density descriptions. Rather than establishing definitive causal effects, the framework provides an interpretable spatial perspective on urban commercial organization, offering a reference for subsequent planning assessments.
4.3. Policy Synergy and Optimization Pathways for the Spatial Distribution of Catering Establishments
The analysis reveals a “one core, multiple centers” macro-structure centered on Wuyi Square, with secondary growth poles in emerging districts. Overall density declines towards the periphery, accompanied by distinct “functional adaptation differentiation” across catering formats. Furthermore, the generalized symmetric structural graphs uncover a latent spatial order—including “new city–old city” axial symmetry and “core–secondary” central symmetry—constituting a highly ordered spatial association.
These spatial patterns broadly align with the strategic objectives of the Changsha 14th Five-Year Plan for Modern Service Industry Development. Specifically, the “Core Commercial District Enhancement Project” corresponds spatially with Wuyi Square’s concentration, while the “multi-point support” strategy aligns with the development of secondary clusters in Yuelu’s university town and Tianxin’s historic quarters. Furthermore, the spatial integration of catering with metro lines highlights the relevance of transit accessibility. Regulatory frameworks like the Yuelu Mountain Scenic Area Protection Regulations also demonstrate how ecological boundaries and commercial growth can be coordinated.
Despite these alignments, spatial equilibrium and long-term sustainability require further consideration. First, peripheral areas (e.g., Wangcheng District and western Yuelu District) exhibit sparser configurations, suggesting that service accessibility in these regions may warrant further assessment. Second, emerging commercial districts exhibit spatial variation in high-end catering formats, suggesting a potential need for refined business format regulation. Third, the continuity of the “axis–network-aligned” policy warrants attention. For instance, the delayed extension of Metro Line 4 suggests that improving coordination between transit planning and catering layout could help maintain the overall spatial balance.
4.4. Limitations and Future Prospects of the Study
The proposed GGSF entails several methodological and empirical constraints. At the data level, commercial POI records from AutoNavi represent a static cross-sectional snapshot. The dataset inherently under-samples informal street vendors and lacks longitudinal tracking. Without dynamic consumer metrics (e.g., footfall intensity, spending frequencies), the framework cannot fully capture real-time market viability.
Regarding spatial scale, the analysis is anchored at the district and street levels and lacks refined modules for micro-spatial units (e.g., individual commercial blocks). Administrative boundary clipping also introduces potential edge-effect distortions into distance calculations near municipal borders. Furthermore, while the GGSF effectively visualizes spatial configurations, it lacks embedded econometric modules to weight drivers such as transit accessibility. Although sensitivity assessments confirmed the topological stability of core centroids, the delineations of peripheral low-density contours remain sensitive to KDE bandwidth selection. It is also crucial to reiterate that this study relies on static spatial co-location to establish robust spatial associations rather than to assert strict causality.
To address these constraints, future iterations should advance in three targeted dimensions:
(1) Data enrichment and causal inference: Integrating longitudinal datasets (e.g., mobile phone signaling, census data) with spatial econometric models (e.g., GWR) to quantify the relative weights of transit accessibility and purchasing power.
(2) Multi-scale hierarchical expansion: Introducing a “hotspot tree” architecture to capture fine-grained spatial interactions within localized street blocks and neighborhood catchments.
(3) Contextual recalibration: Distinguishing the universal transferability of the GGSF pipeline from the site-specific empirical realities of Changsha. While the multi-scale KDE extraction and tolerance buffers are transferable, the specific geometric layouts (e.g., the river-bisected valley topography) are contingent upon local geography. Applying this framework to contrasting urban layouts (e.g., gridiron cities) would require context-aware recalibration of thresholds to avoid spatial distortion.
5. Conclusions
This study employs catering POI data from Changsha’s urban core as its primary dataset, innovatively integrating GIS spatial analysis methods (including kernel density estimation and nearest-neighbor analysis) with the generalized symmetric structural graph methodology derived from geoinformation graph theory. This establishes a “GIS–Generalized Symmetric Structural Graph” framework for investigating catering sector differentiation. Through this framework, the spatial distribution patterns, agglomeration characteristics, and formation mechanisms of Changsha’s catering sector were systematically analyzed. This approach not only overcomes the limitations of traditional research focused solely on density appearances but also achieves a deepening from “phenomenological description” to “analysis of latent order”. Results indicate that the catering space in Changsha’s urban core exhibits a hierarchical network pattern characterized by “one core with multiple centers” and “eastern density with western sparseness”. Four categories of catering formats demonstrate significant spatial differentiation due to their differing attributes. Regarding spatial distance and agglomeration characteristics, catering formats exhibit pronounced “clusterized” distribution, with a negative correlation between outlet numbers and average proximity distance, reflecting spatial agglomeration economies and shared footfall dependency as density increases. Core density analysis indicates the highest overall density around Wuyi Square, decreasing in concentric zones from the core. Among formats, snack and fast-food outlets exhibit the highest core density values, while international dining shows the lowest, visually illustrating spatial agglomeration capacity disparities. Generalized symmetric structural graphs reveal the latent spatial order of catering establishments: the overall catering sector exhibits axial symmetry along the Wuyi Square–northeast/southwest axis (with new town commercial catering mirroring old town community catering) and radial symmetry centered on Wuyi Square. Symmetric patterns vary distinctly across sub-sectors, reflecting spatial associations with four dimensions: natural geography, transport networks, consumer demand, and policy planning.
Furthermore, the theoretical and practical value of this study lies in extending conventional spatial analysis beyond clustering patterns to the identification of generalized symmetric structures through the multidimensional “function–form–element” analytical framework. This approach can be adapted to other urban commercial activities, including retail, lifestyle services, and cultural entertainment, providing a robust method for understanding urban commercial spatial organization. From a practical perspective, the identified symmetry patterns provide spatial references to optimize the distribution of catering facilities relative to transport corridors, commercial centers, and consumer demand. Nevertheless, the GGSF remains an exploratory analytical framework rather than a fully validated tool for policy intervention, and its practical applicability requires further evaluation using longitudinal commercial data, consumer behavior records, and comparative studies across cities with different spatial morphologies.
Author Contributions
Conceptualization, Youliang Chen and Hongying Zhu; methodology, Youliang Chen and Aihua Chen; software, Hongying Zhu; validation, Zhaoru Wang; formal analysis, Aihua Chen; investigation, Aihua Chen and Hongying Zhu; resources, Youliang Chen and Zhaoru Wang; data curation, Aihua Chen and Hongying Zhu; writing—original draft preparation, Aihua Chen and Hongying Zhu; writing—review and editing, Youliang Chen; visualization, Hongying Zhu; supervision, Youliang Chen; project administration, Youliang Chen; funding acquisition, Youliang Chen. All authors have read and agreed to the published version of the manuscript.
Funding
The authors are thankful for the support from Jiangxi Province Key Laboratory of Water Ecological Conservation in Headwater Regions (2023SSY02031) and Ganzhou Social Science Research Project (2026-ZDZX03-1801).
Data Availability Statement
The raw catering POI dataset was collected from the AutoNavi Open Platform (Amap) and cannot be publicly redistributed under third-party commercial licensing terms. Aggregated spatial data matrices, cluster centroids, and Python processing scripts/ArcPy workflows generated during this study are available from the corresponding author upon reasonable academic request.
Conflicts of Interest
The authors declare no conflicts of interest.
References
- Shao, D.; Zoh, K.; Xie, Y. Impact of sudden public crises on spatial distribution patterns and driving factors of the urban catering industry: A case study of Shanghai’s catering POI data before and after COVID-19. J. Asian Archit. Build. Eng. 2025, 24, 3224–3247. [Google Scholar] [CrossRef] [Scilit]
- Lan, T.; Yu, M.; Xu, Z.; Wu, Y. Temporal and Spatial Variation Characteristics of Catering Facilities Based on POI Data: A Case Study within 5th Ring Road in Beijing. Procedia Comput. Sci. 2018, 131, 1260–1268. [Google Scholar] [CrossRef] [Scilit]
- Sebastian, C.C.M.; Enrique, J.H.C.; Segundo, M.O.G. Propuesta de Lean Manufacturing para la reducción de tiempos de entrega en una MYPE del sector de servicios de catering, Trujillo-2023. RISTI Rev. Ibérica Sist. Tecnol. Inform. 2024, E69, 379–391. Available online: https://dialnet.unirioja.es/servlet/articulo?codigo=9915904 (accessed on 20 April 2026).
- Wang, G.; Maghsoodi Tilaki, M.J.; Rahim, A.A. Exploring Spatial Dynamics: Analyzing Hotels’Recovery Performance Amid the COVID-19 Crisis. Appl. Spat. Anal. Policy 2025, 18, 67. [Google Scholar] [CrossRef] [Scilit]
- Jia, H.; Zheng, M.; Wang, P.; Li, T.; Zheng, X. Big data-driven spatio-temporal heterogeneity analysis of Beijing’s catering service industry during the COVID-19 pandemic. Sci. Rep. 2024, 14, 721. [Google Scholar] [CrossRef] [Scilit] [PubMed]
- Li, Y.; Liu, H.; Wang, L.E. Spatial Distribution Pattern of the Catering Industry in a Tourist City: Taking Lhasa City as a Case. J. Resour. Ecol. 2020, 11, 191. [Google Scholar] [CrossRef] [Scilit]
- Zhang, S.; Luan, H.; Zhen, F.; Kong, Y.; Xi, G. Does online food delivery improve the equity of food accessibility? A case study of Nanjing, China. J. Transp. Geogr. 2023, 107, 103516. [Google Scholar] [CrossRef] [Scilit]
- Benassi, F.; Tomassini, C.; Di Felice, G. Spatial Heterogeneities or Inequalities? Health Care Supply and Demand of the Older Population in Italy. Appl. Spat. Anal. Policy 2025, 18, 44. [Google Scholar] [CrossRef] [Scilit]
- Moreo, A.; González, P.; Del Coz, J.J. Kernel density estimation for multiclass quantification. Mach. Learn. 2025, 114, 92. [Google Scholar] [CrossRef] [Scilit]
- Yang, W.; Wang, F.; You, Y.; Wan, X.; Cheng, S.; Fang, Z. Evaluating Spatial Accessibility to COVID-19 Vaccination Sites based on Fine-Scale Population Distributions and Heterogeneous Travel Modes: A Case Study in Xiangtan, China. Appl. Spat. Anal. Policy 2024, 17, 867–890. [Google Scholar] [CrossRef] [Scilit]
- Briggs, D.J.; Collins, S.; Elliott, P.; Fischer, P.; Kingham, S.; Lebret, E.; Pryl, K.; Van Reeuwijk, H.; Smallbone, K.; Van Der Veen, A. Mapping urban air pollution using GIS: A regression-based approach. Int. J. Geogr. Inf. Sci. 1997, 11, 699–718. [Google Scholar] [CrossRef] [Scilit]
- Han, Z.; Song, W. Identification and Geographic Distribution of Accommodation and Catering Centers. ISPRS Int. J. Geo-Inf. 2020, 9, 546. [Google Scholar] [CrossRef] [Scilit]
- Tian, L.; Shen, X. Spatial patterns and their influencing factors for China’s catering industry. Humanit. Soc. Sci. Commun. 2024, 11, 1090. [Google Scholar] [CrossRef] [Scilit]
- Xu, F.; Zhen, F.; Qin, X.; Wang, X.; Wang, F. From central place to central flow theory: An exploration of urban catering. Tour. Geogr. 2019, 21, 121–142. [Google Scholar] [CrossRef] [Scilit]
- Chuang, T.; Weixin, L. Utilizing Multi-source Data Fusion to Identify the Layout Patterns of the Catering Industry and Urban Spatial Structure in Shanghai, China. Chin. Geogr. Sci. 2025, 35, 1045–1058. [Google Scholar] [CrossRef] [Scilit]
- Tan, L.; Bu, X. Study on Spatially Nonstationary Impact on Catering Distribution: A Multiscale Geographically Weighted Regression Analysis Using POI Data. ISPRS Int. J. Geo-Inf. 2025, 14, 119. [Google Scholar] [CrossRef] [Scilit]
- Hou, Y.; Chen, Y.; Zhang, X. How Urban Block Form Affects the Vitality of the Catering Industry: Evidence from Jinan, China. Sustainability 2024, 16, 5913. [Google Scholar] [CrossRef] [Scilit]
- Zhang, Y.; Li, X.; Jiang, Q.; Chen, M.; Liu, L. Quantify the Spatial Association between the Distribution of Catering Business and Urban Spaces in London Using Catering POI Data and Image Segmentation. Atmosphere 2022, 13, 2128. [Google Scholar] [CrossRef] [Scilit]
- Liu, Y.; Yao, J. Analysis of the Aggregation Characteristics and Influencing Elements of Urban Catering Points in Small Scale: Methods and Results. ISPRS Int. J. Geo-Inf. 2023, 12, 275. [Google Scholar] [CrossRef] [Scilit]
- Ma, D.; Liu, B.; Huang, Q.; Zhang, Q. Evolution Characteristics and Causes—An Analysis of Urban Catering Cluster Spatial Structure. ISPRS Int. J. Geo-Inf. 2023, 12, 302. [Google Scholar] [CrossRef] [Scilit]
- Tian, C.; Luan, W.; Wang, H.; Yang, D.; Su, M.; Zhang, Z.; Li, Z. Spatio-temporal agglomeration and morphological causes of Shanghai catering clusters. Appl. Geogr. 2023, 152, 102898. [Google Scholar] [CrossRef] [Scilit]
- Tian, Y.; Jiang, Y. Research on urban landscape accessibility assessment model based on gis and spatial analysis. GeoJournal 2025, 90, 67. [Google Scholar] [CrossRef] [Scilit]
- Jiang, Y.; Makkonen, T.; Mou, N.; Han, L. A Multi-Layer Approach to Assess Urban Innovation Districts. Appl. Spat. Anal. Policy 2025, 18, 84. [Google Scholar] [CrossRef] [Scilit]
- Chen, J.; Jiang, L.; Luo, J.; Tian, L.; Tian, Y.; Chen, G. Characteristics and Influencing Factors of Spatial Differentiation of Market Service Industries in Rural Areas around Metropolises—A Case Study of Wuhan City’s New Urban Districts. ISPRS Int. J. Geo-Inf. 2022, 11, 170. [Google Scholar] [CrossRef] [Scilit]
- Tian, Y.; Chen, P.; Lu, P.; Yang, H.; Yang, S.; Zhang, L.; Wei, Q.; Zhao, X.; Guo, L.; Wang, Z.; et al. Evolution of Influence Ranges of Neolithic-Bronze Age Cities in the Songshan Mountain Region of Central China Based on GIS Spatial Analysis. Remote Sens. 2022, 14, 5631. [Google Scholar] [CrossRef] [Scilit]
- Wen, Y.; Chen, S. Design and Implementation of a GIS-Based Historical Catering Culture Evolution System. In Advances in Transdisciplinary Engineering; Patnaik, S., Ed.; IOS Press: Amsterdam, The Netherlands, 2024. [Google Scholar] [CrossRef] [Scilit]
- Zhang, Z.; Xiao, Y.; Luo, X.; Zhou, M. Urban human activity density spatiotemporal variations and the relationship with geographical factors: An exploratory Baidu heatmaps-based analysis of Wuhan, China. Growth Change 2020, 51, 505–529. [Google Scholar] [CrossRef] [Scilit]
- Zhang, Y.; Min, J.; Liu, C.; Li, Y. Hotspot Detection and Spatiotemporal Evolution of Catering Service Grade in Mountainous Cities from the Perspective of Geo-Information Tupu. ISPRS Int. J. Geo-Inf. 2021, 10, 287. [Google Scholar] [CrossRef] [Scilit]
- Zhang, H.; Zhou, X.; Tang, G.; Zhou, L.; Ye, X. Hotspot discovery and its spatial pattern analysis for catering service in cities based on field model in GIS. Geogr. Res. 2020, 39, 354–369. [Google Scholar] [CrossRef]
- GB/T 4754-2017; Industrial Classification for National Economic Activities. Standardization Administration of China: Beijing, China, 2017. Available online: https://www.stats.gov.cn/xxgk/tjbz/gjtjbz/201710/t20171017_1758922.html (accessed on 10 November 2026).
- Zhao, W.; Tabak, E.G. Adaptive kernel conditional density estimation. Inf. Inference A J. IMA 2025, 14, iaae037. [Google Scholar] [CrossRef] [Scilit]
- Frick, S.A.; Rodríguez-Pose, A. Lessons-learnt from growth pole strategies in the developing world. Prog. Plan. 2025, 195, 100958. [Google Scholar] [CrossRef] [Scilit]
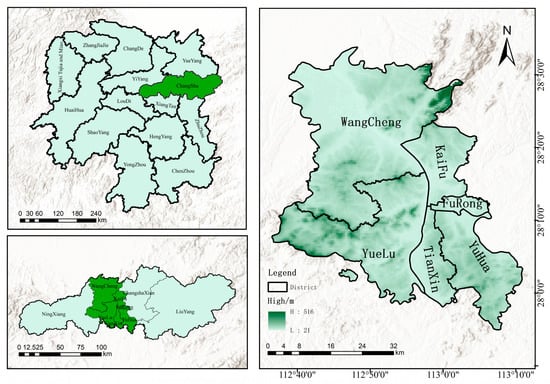
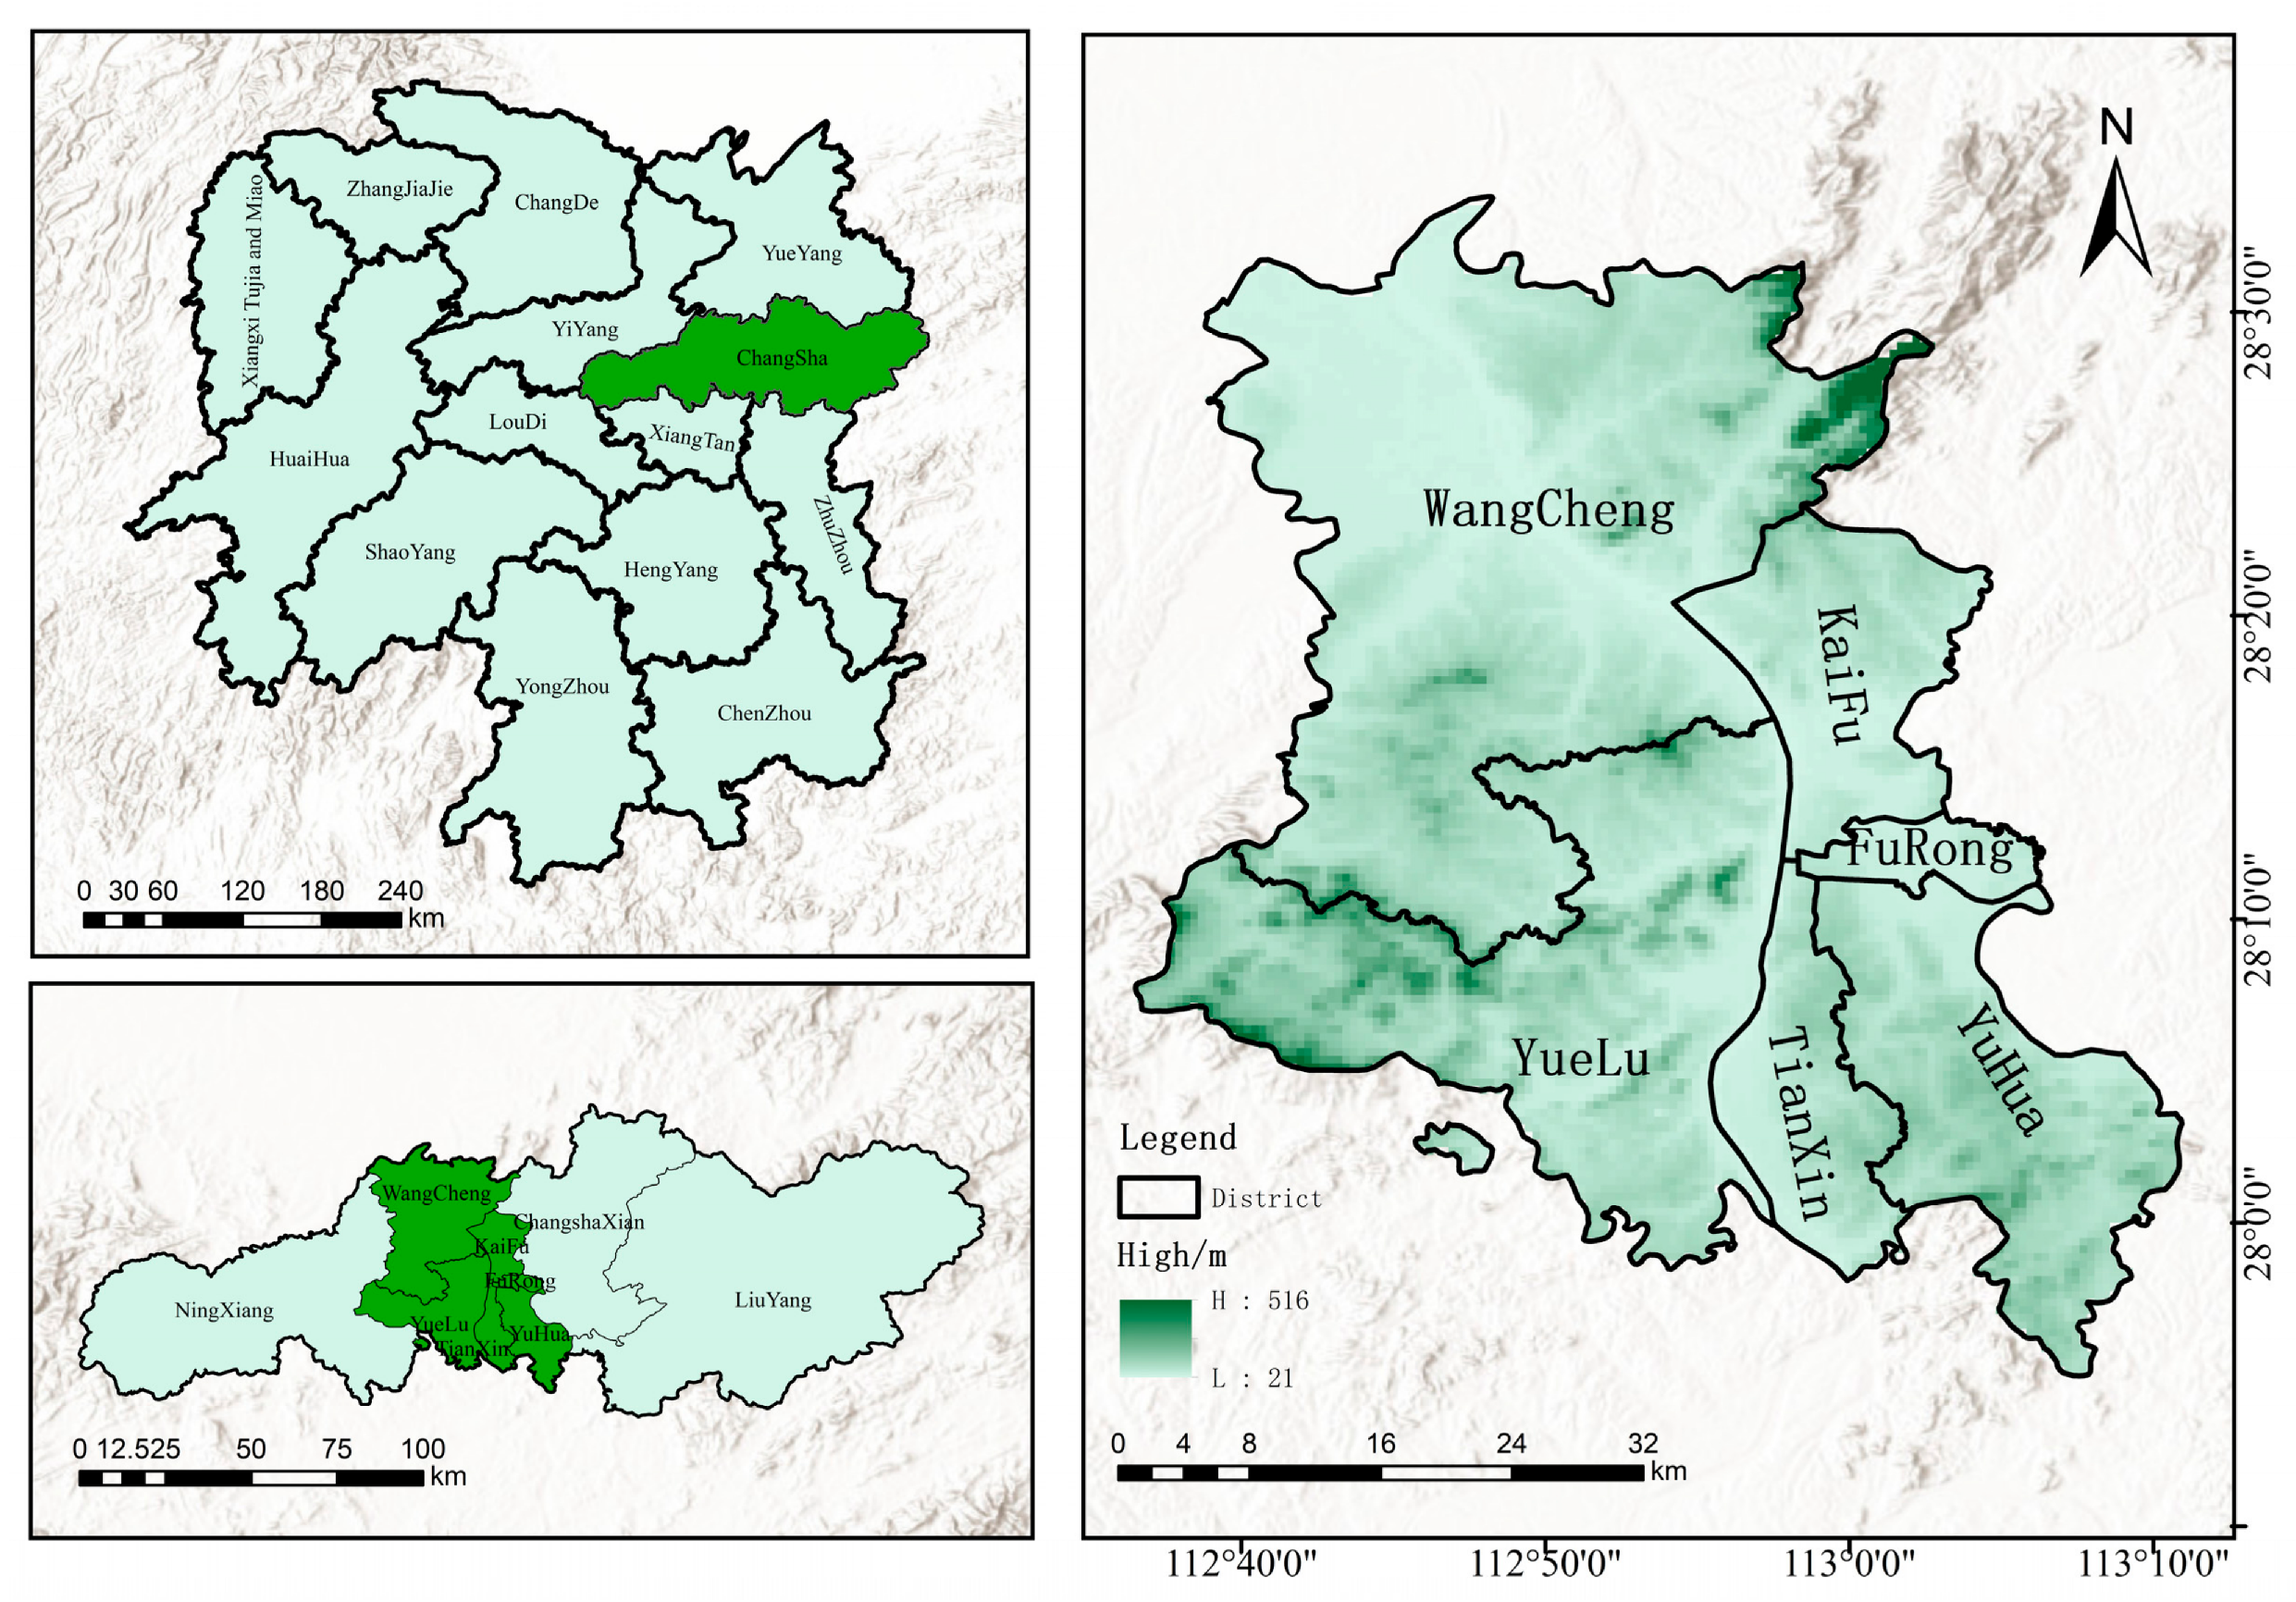
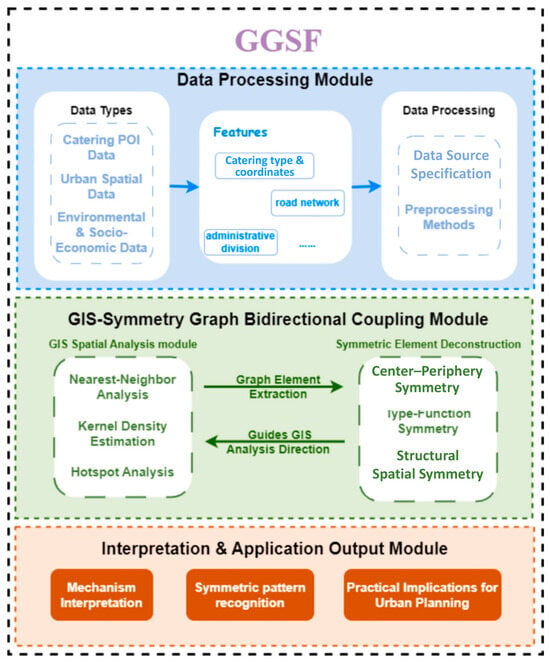
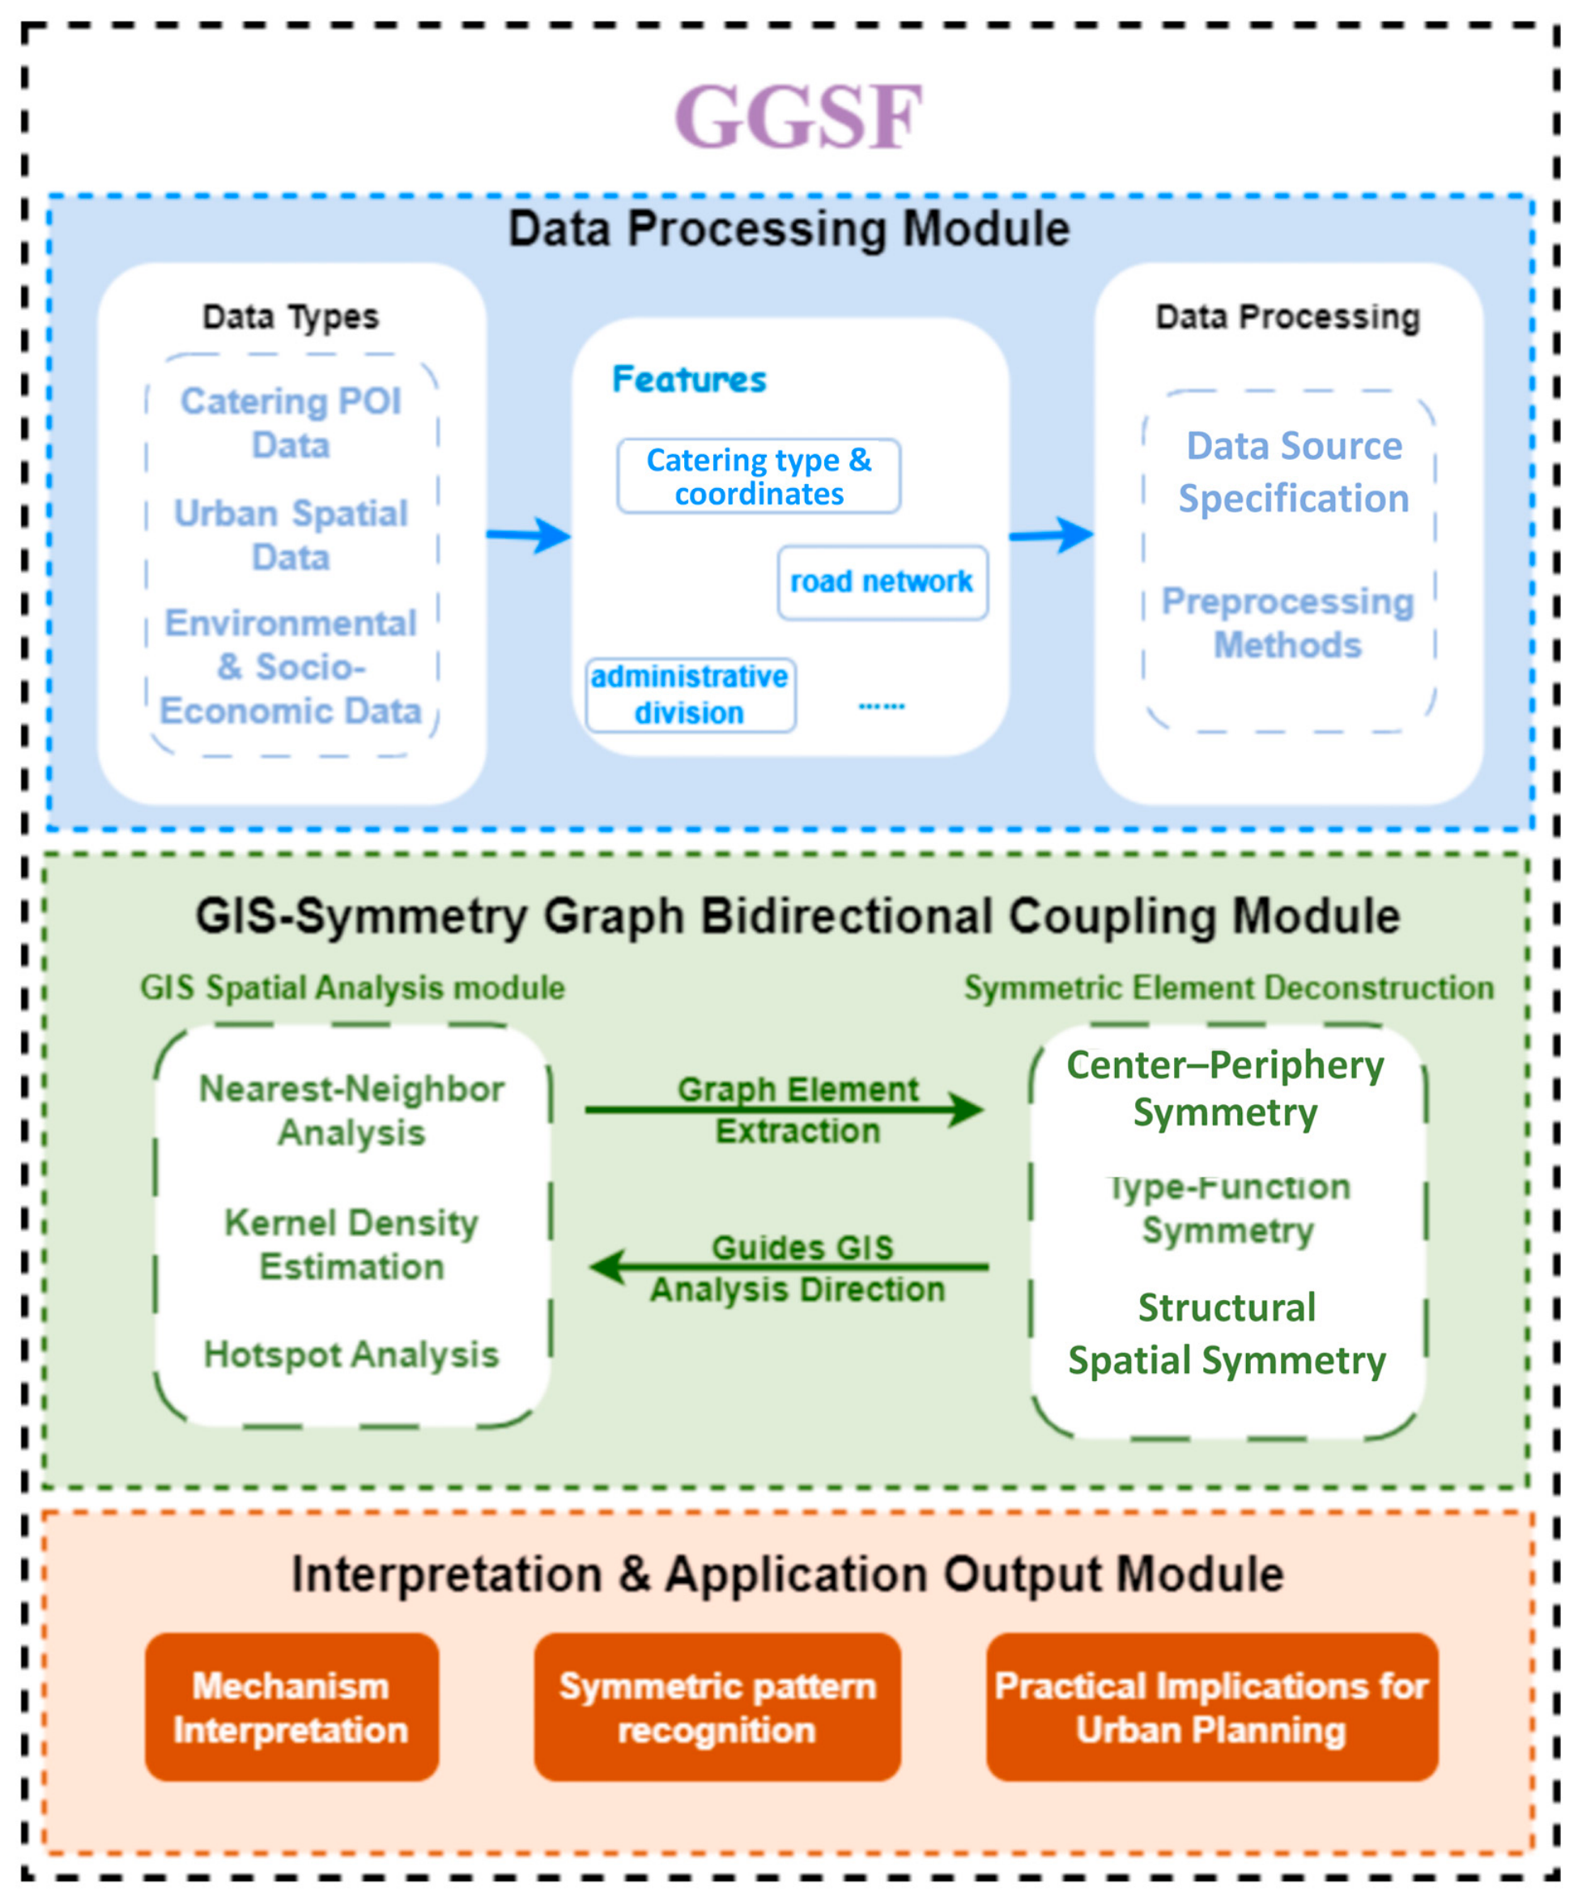
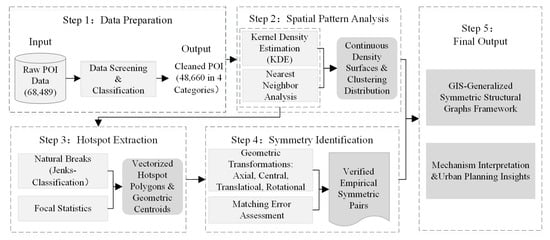
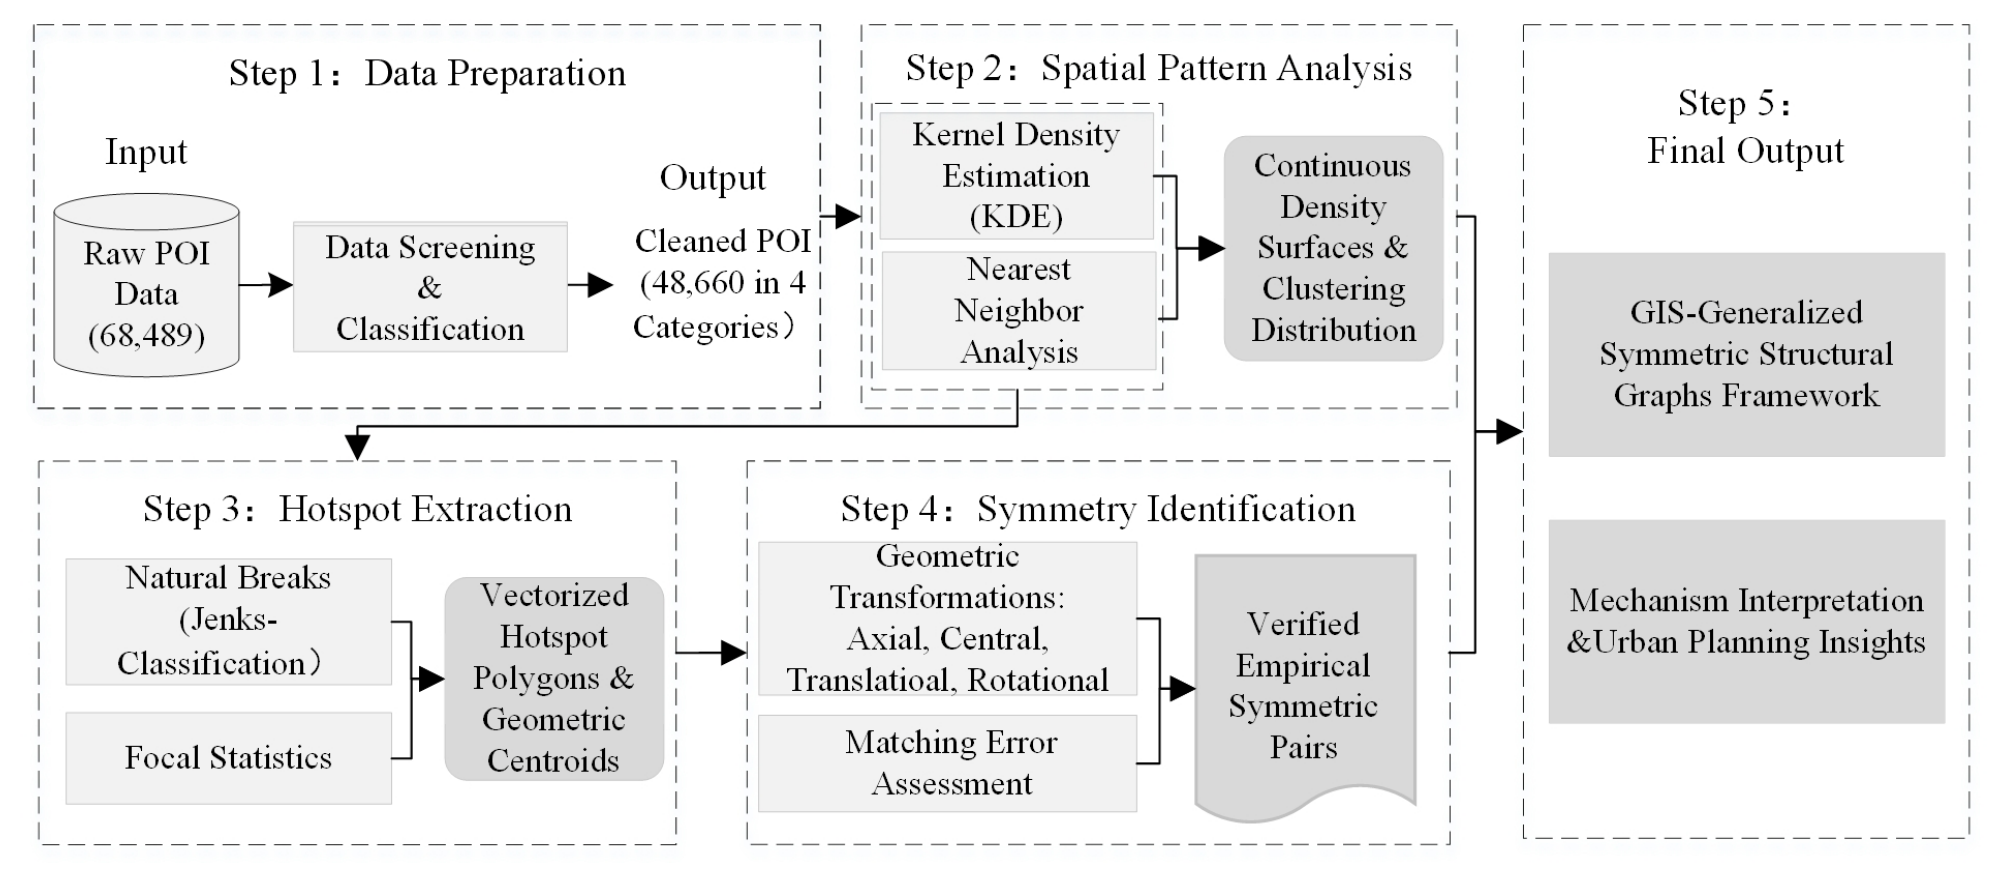
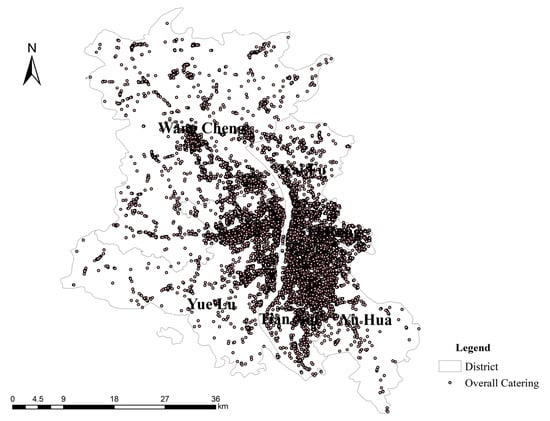
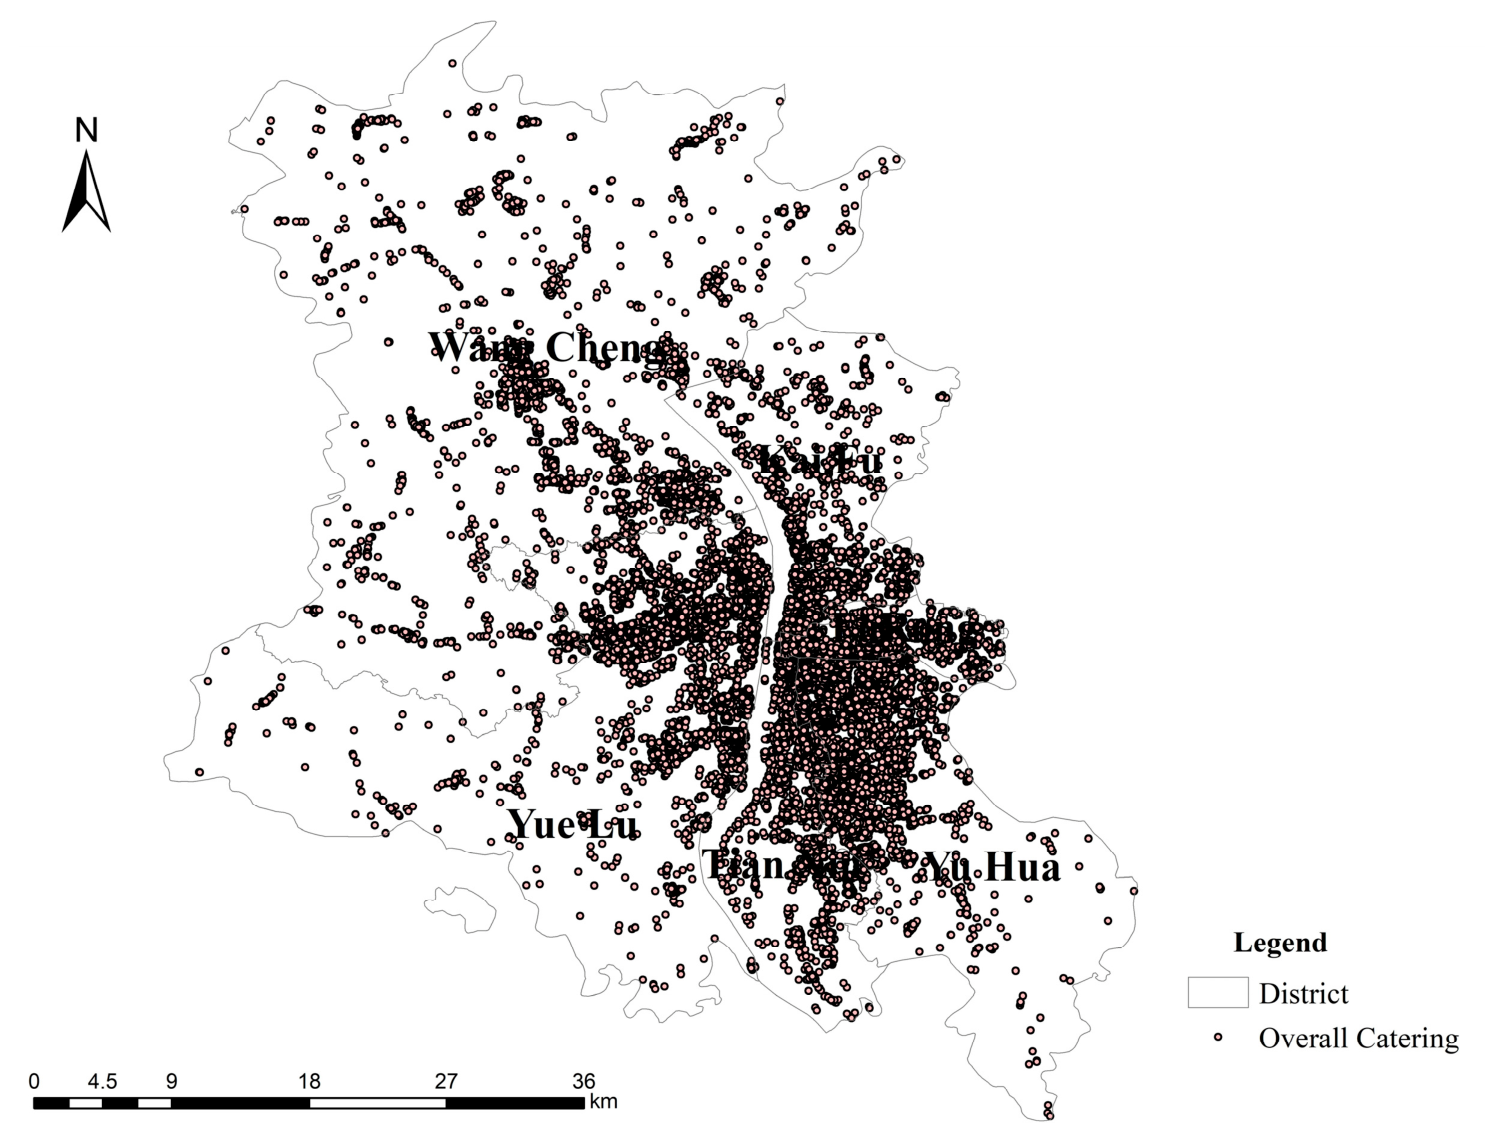
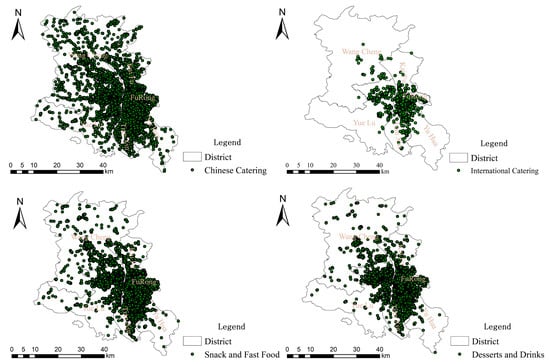
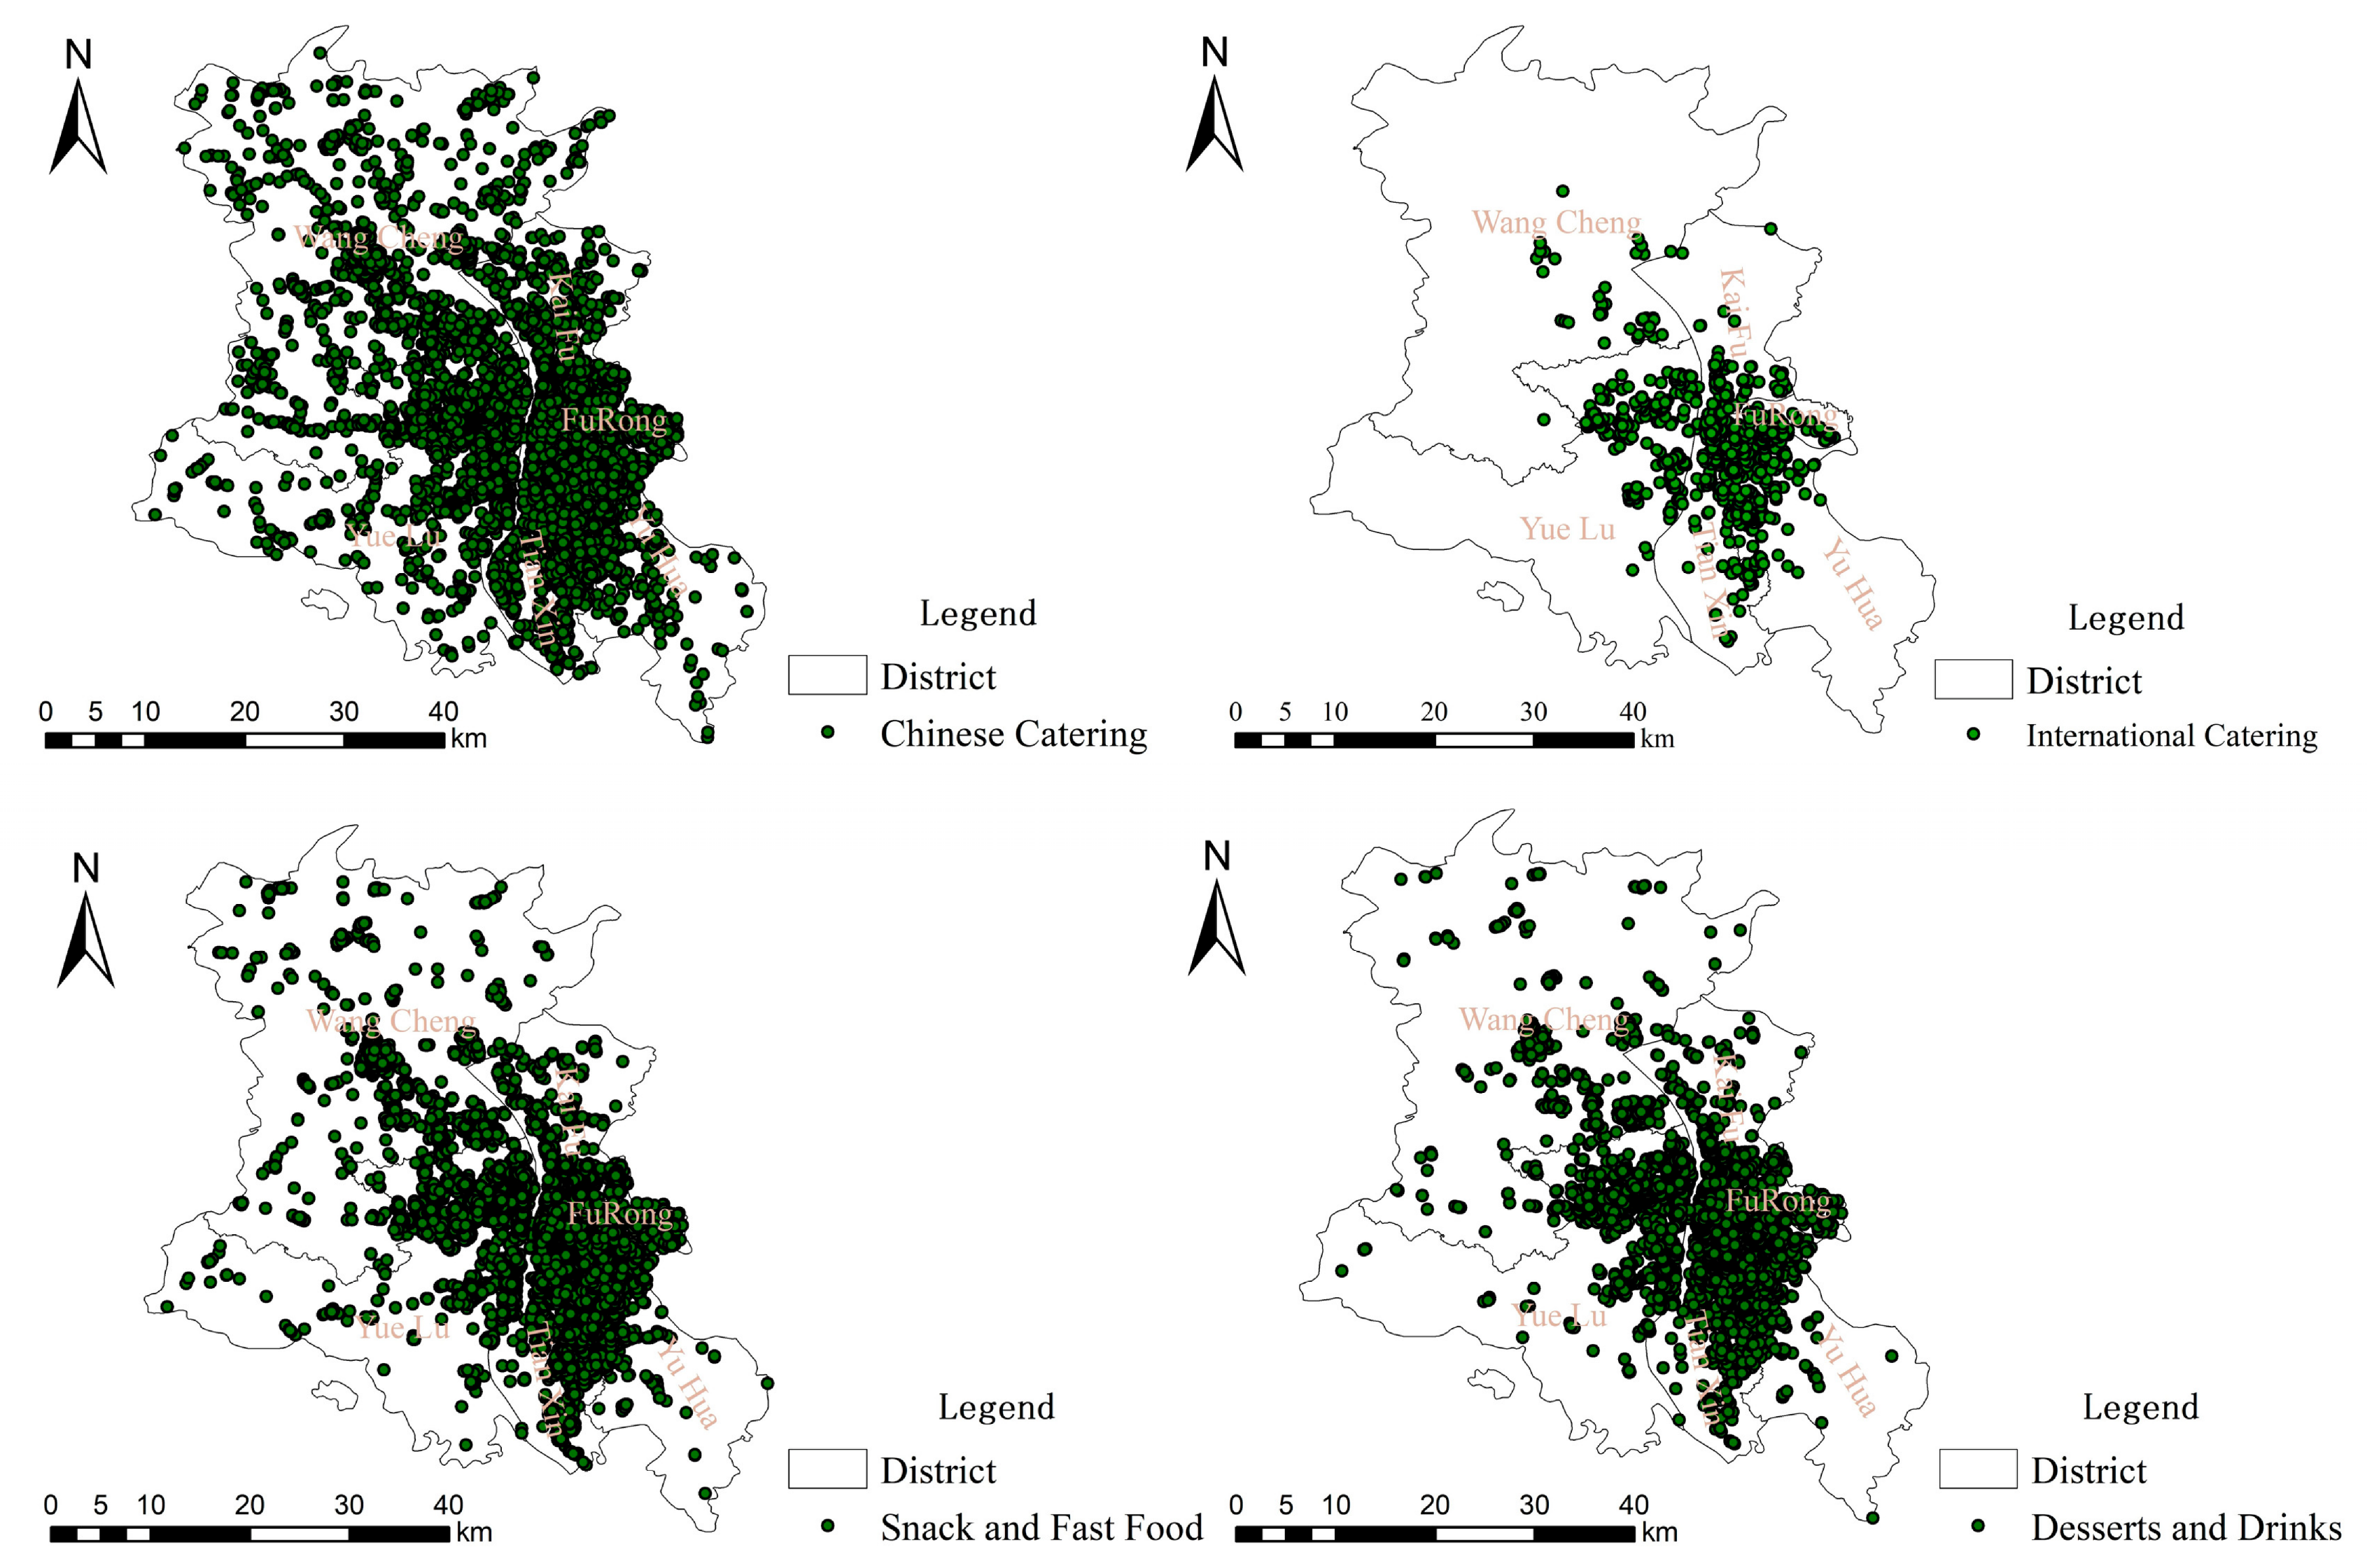
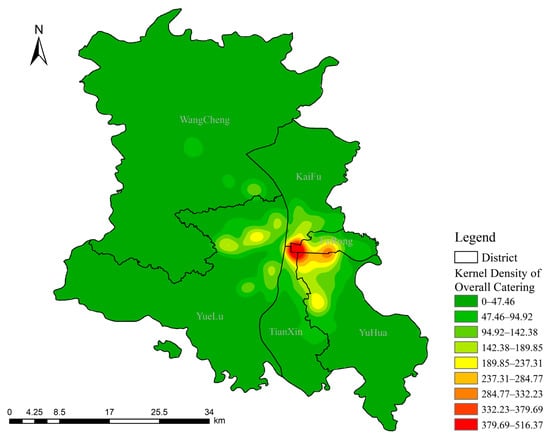
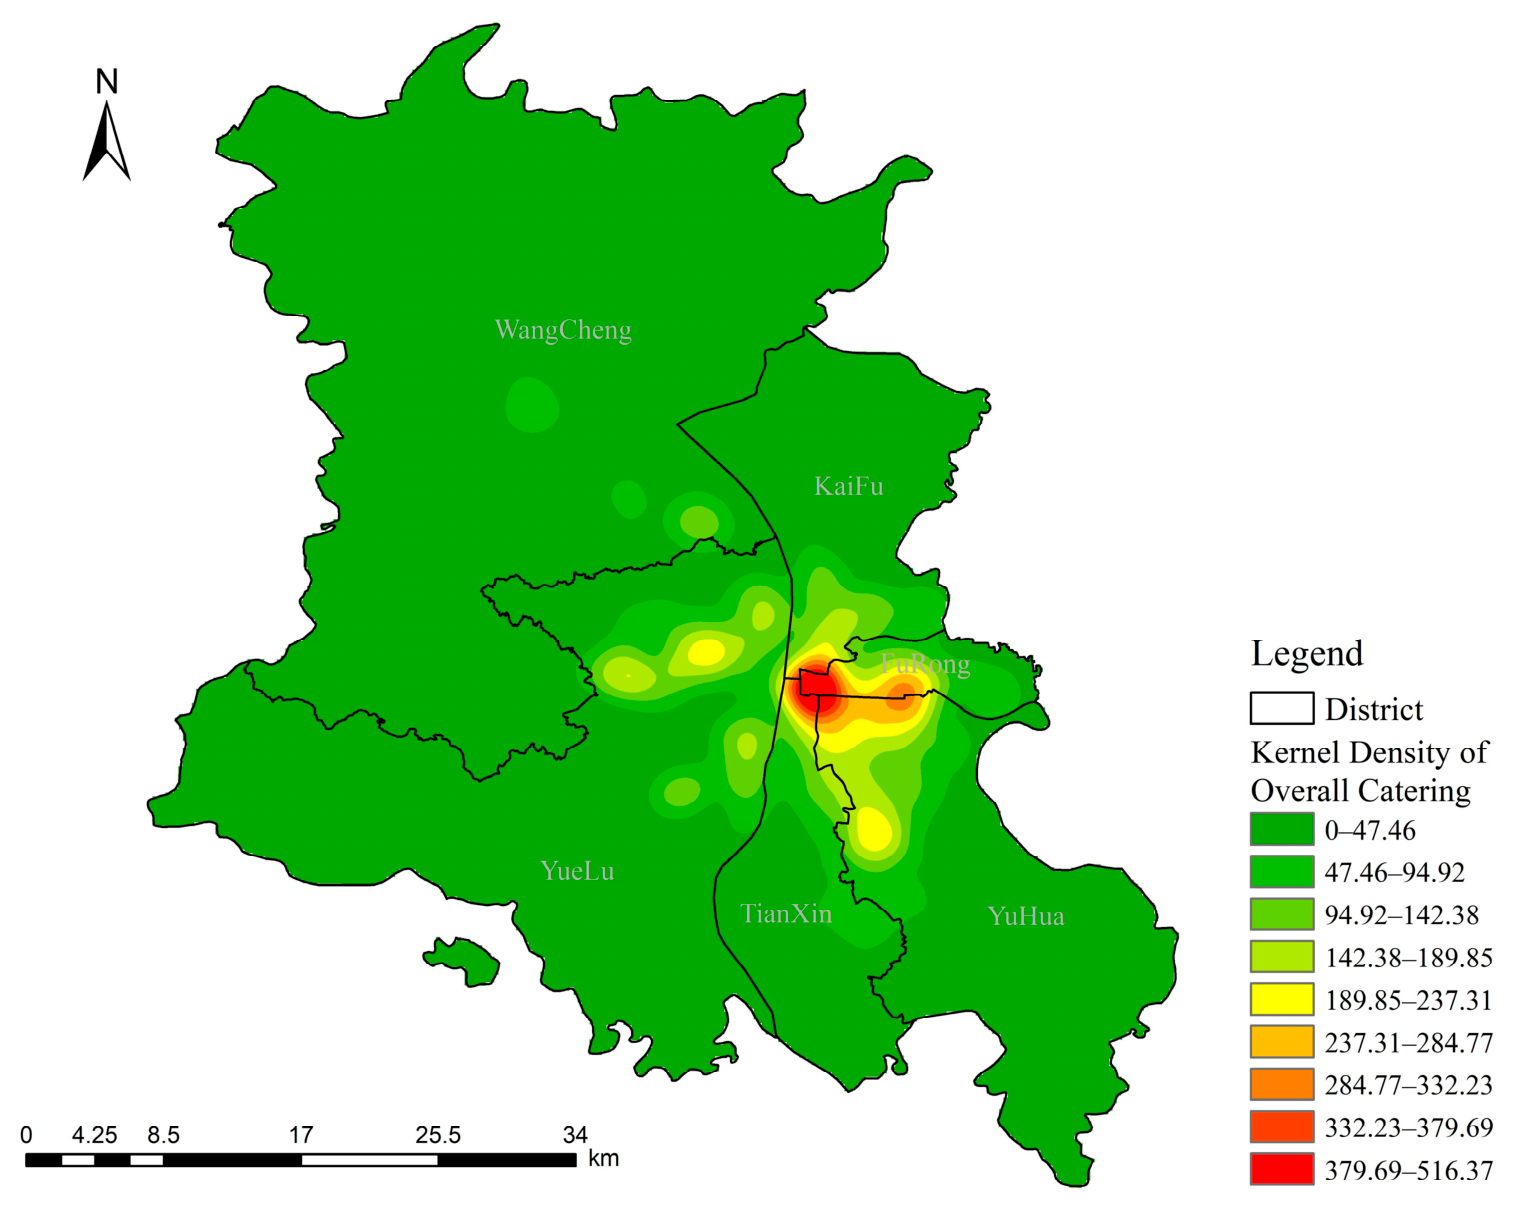
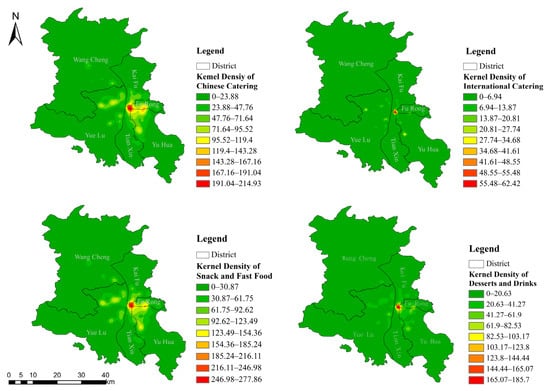
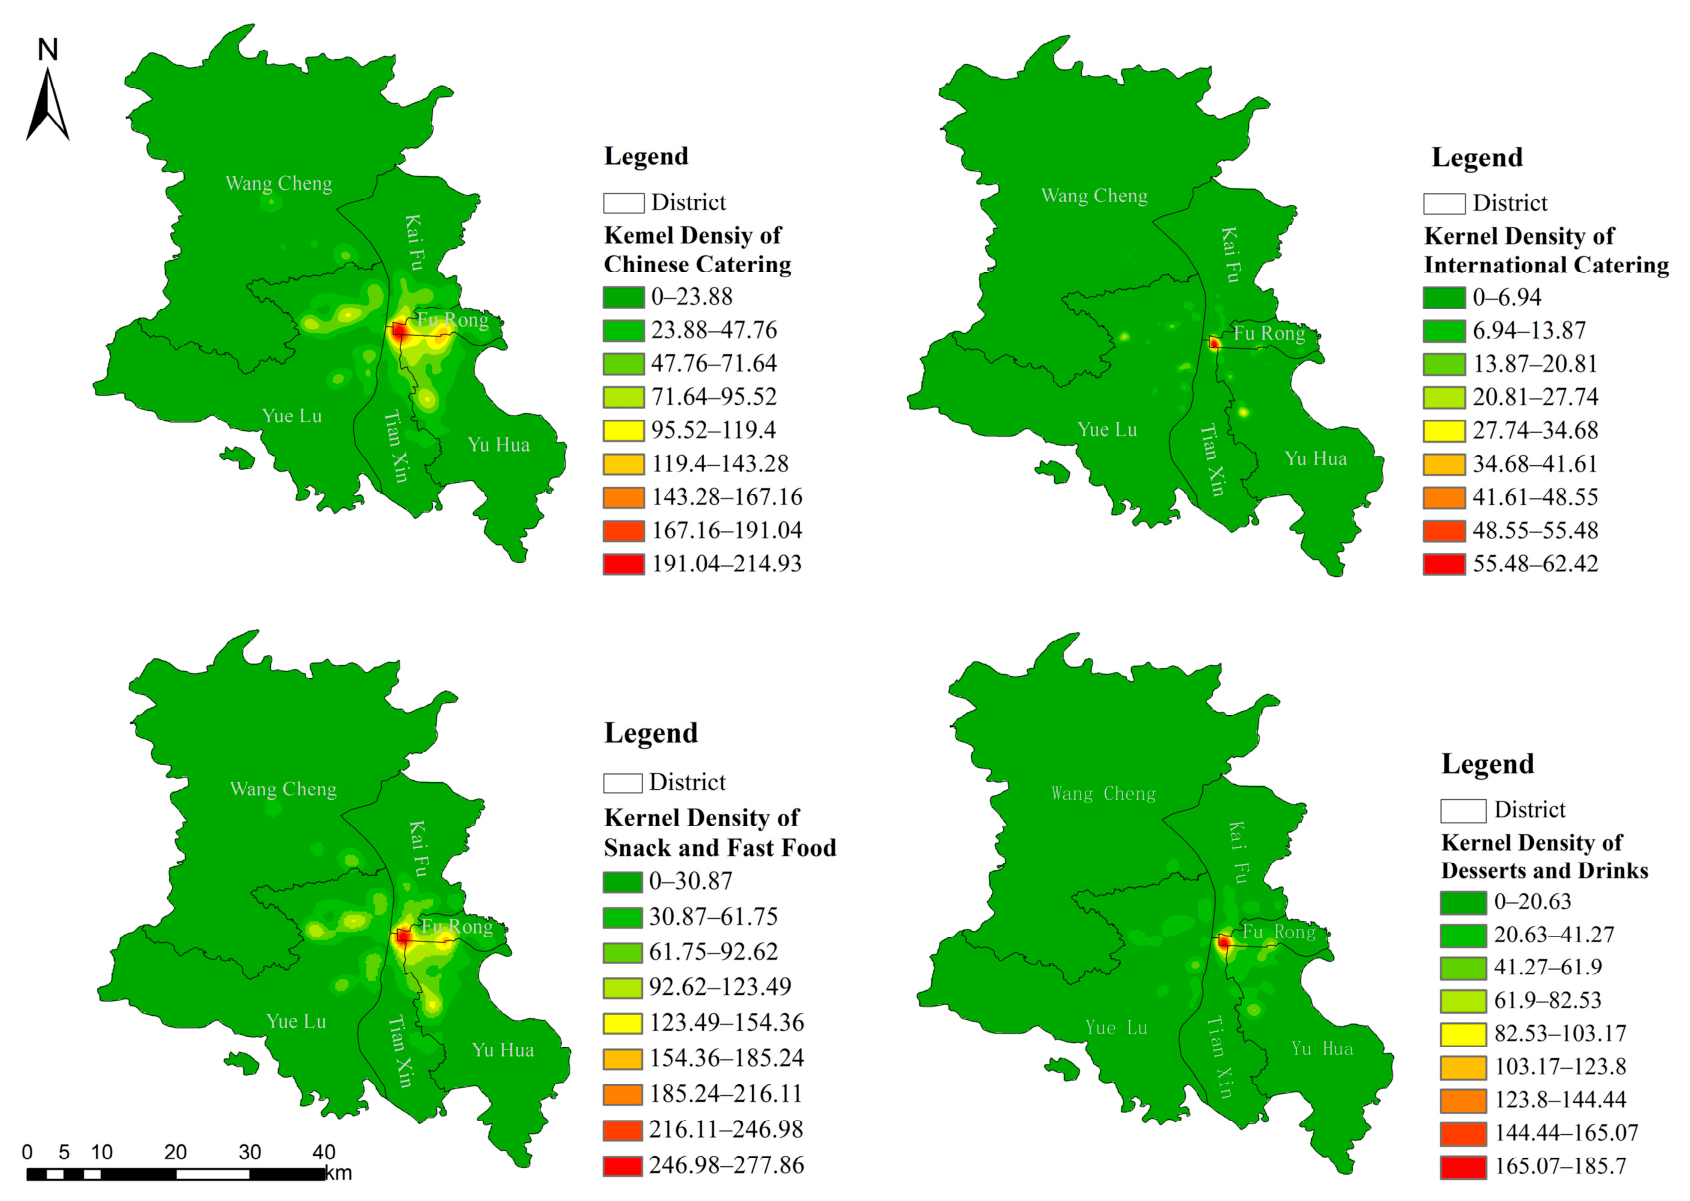
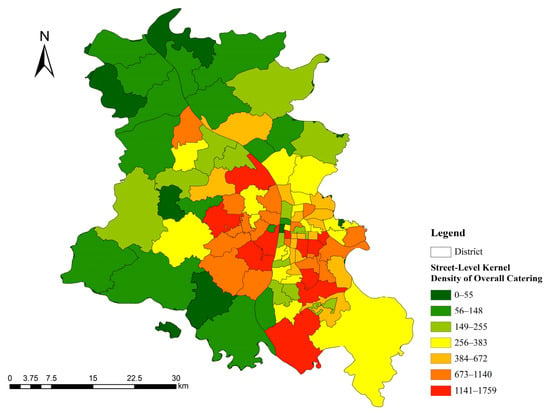
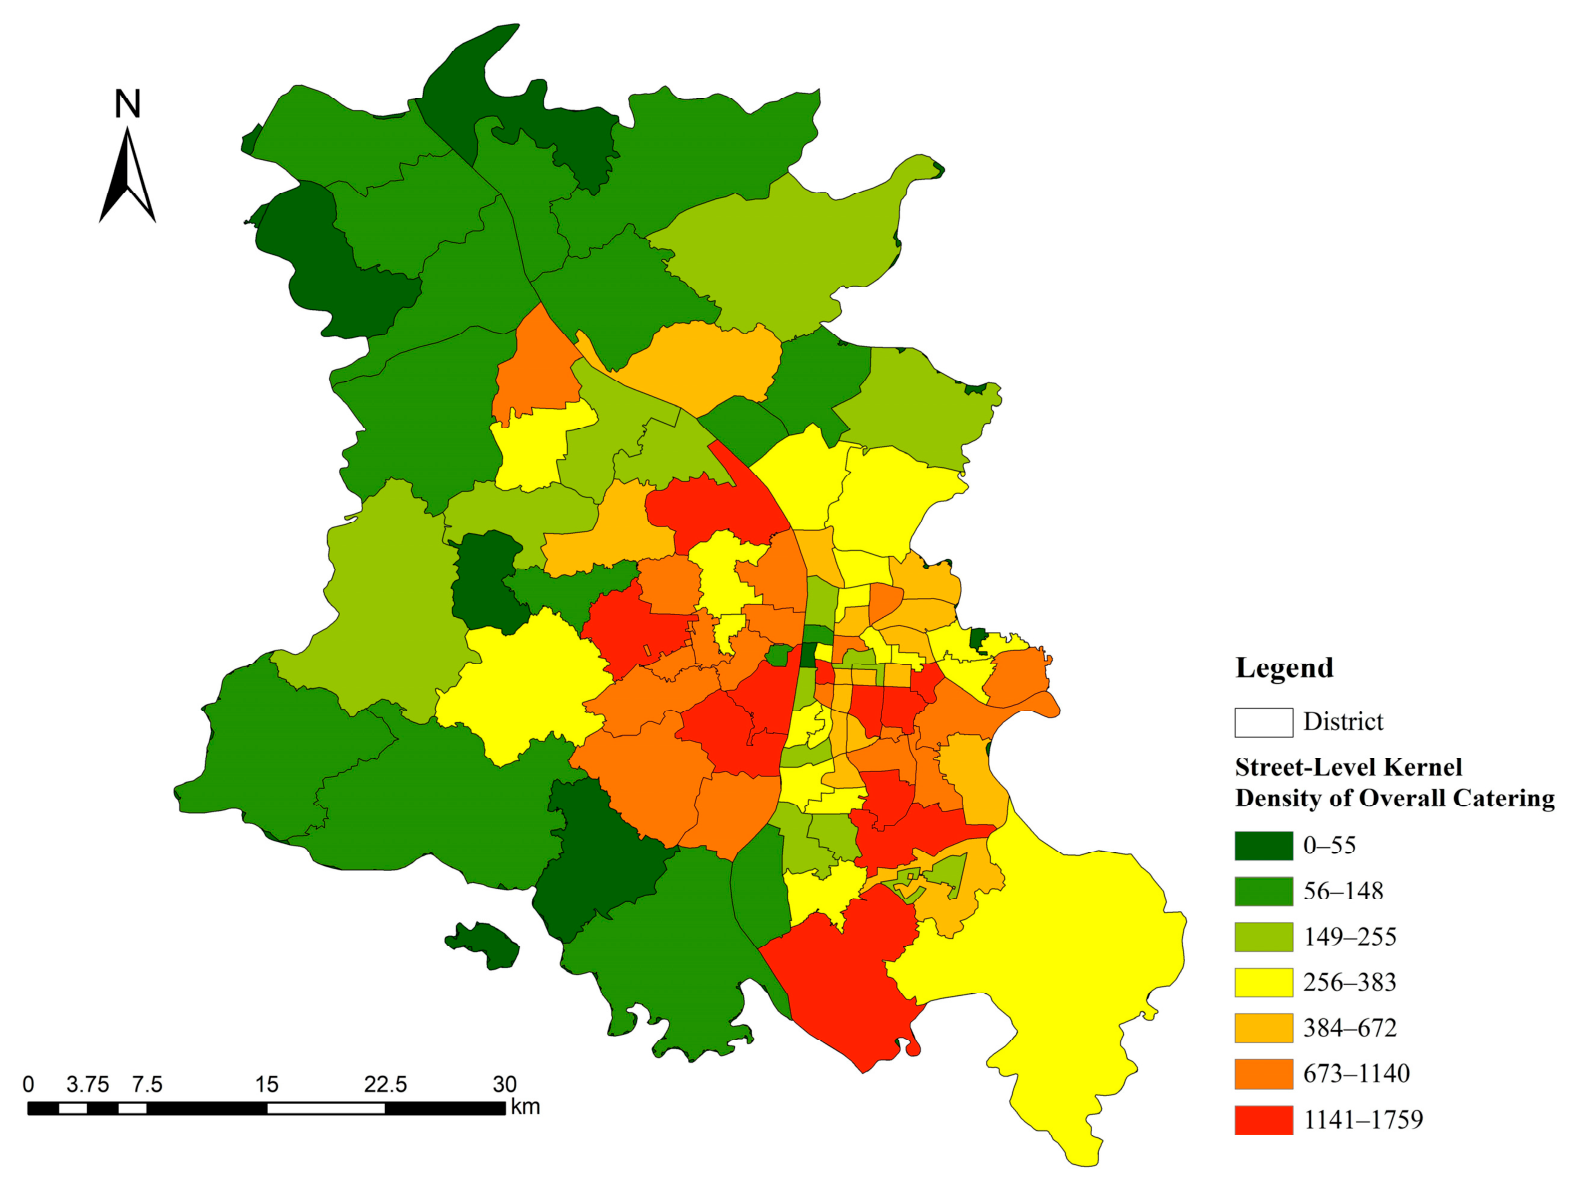
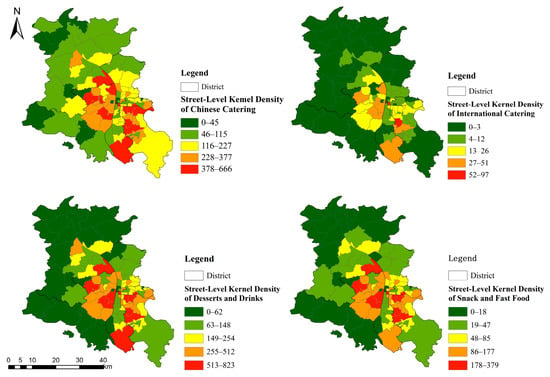
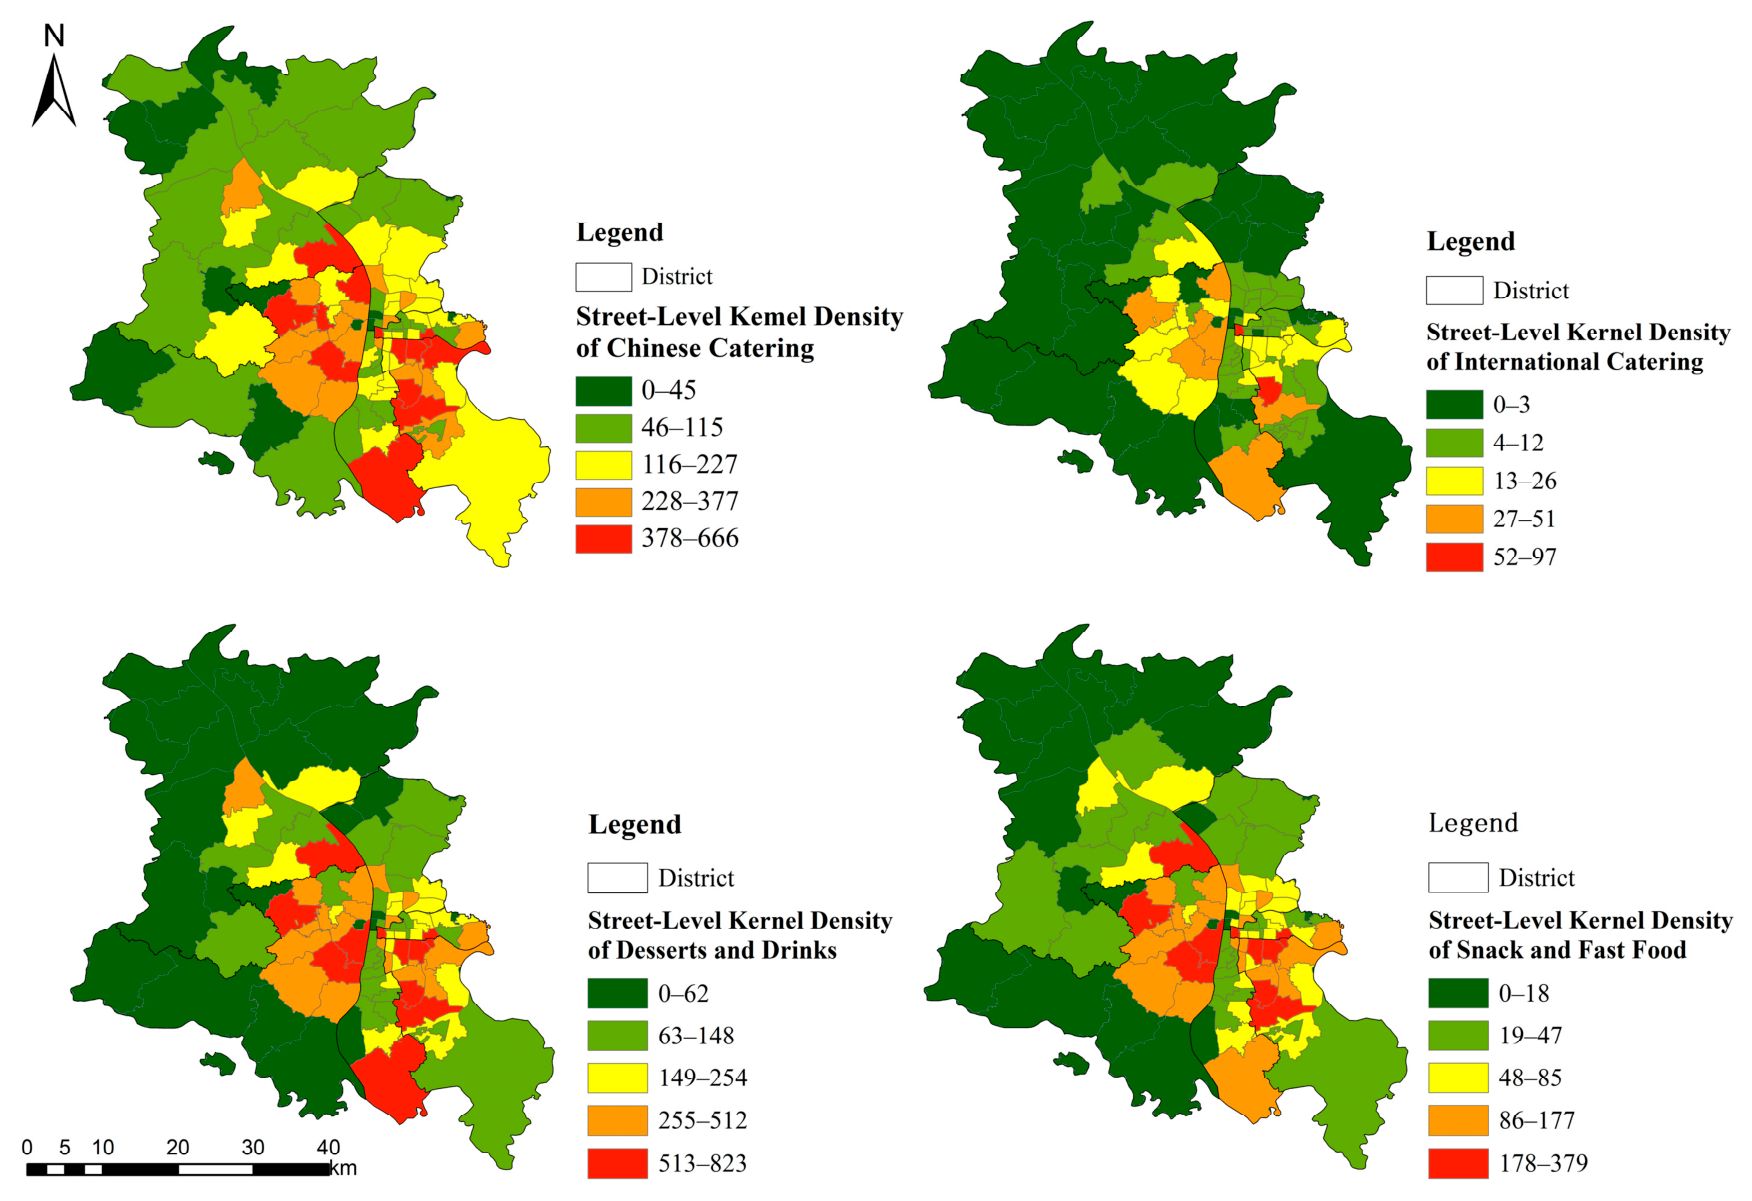
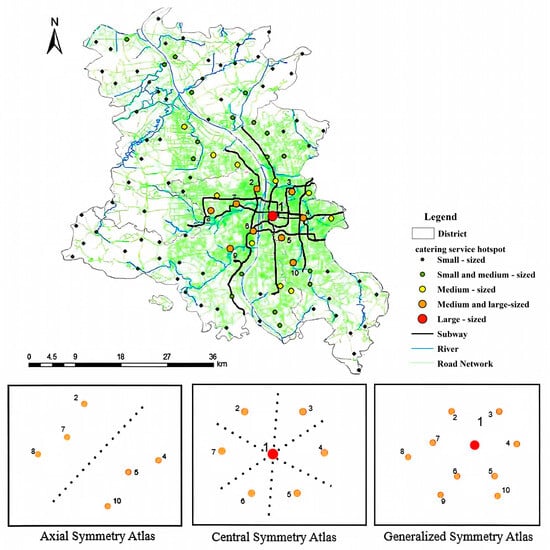
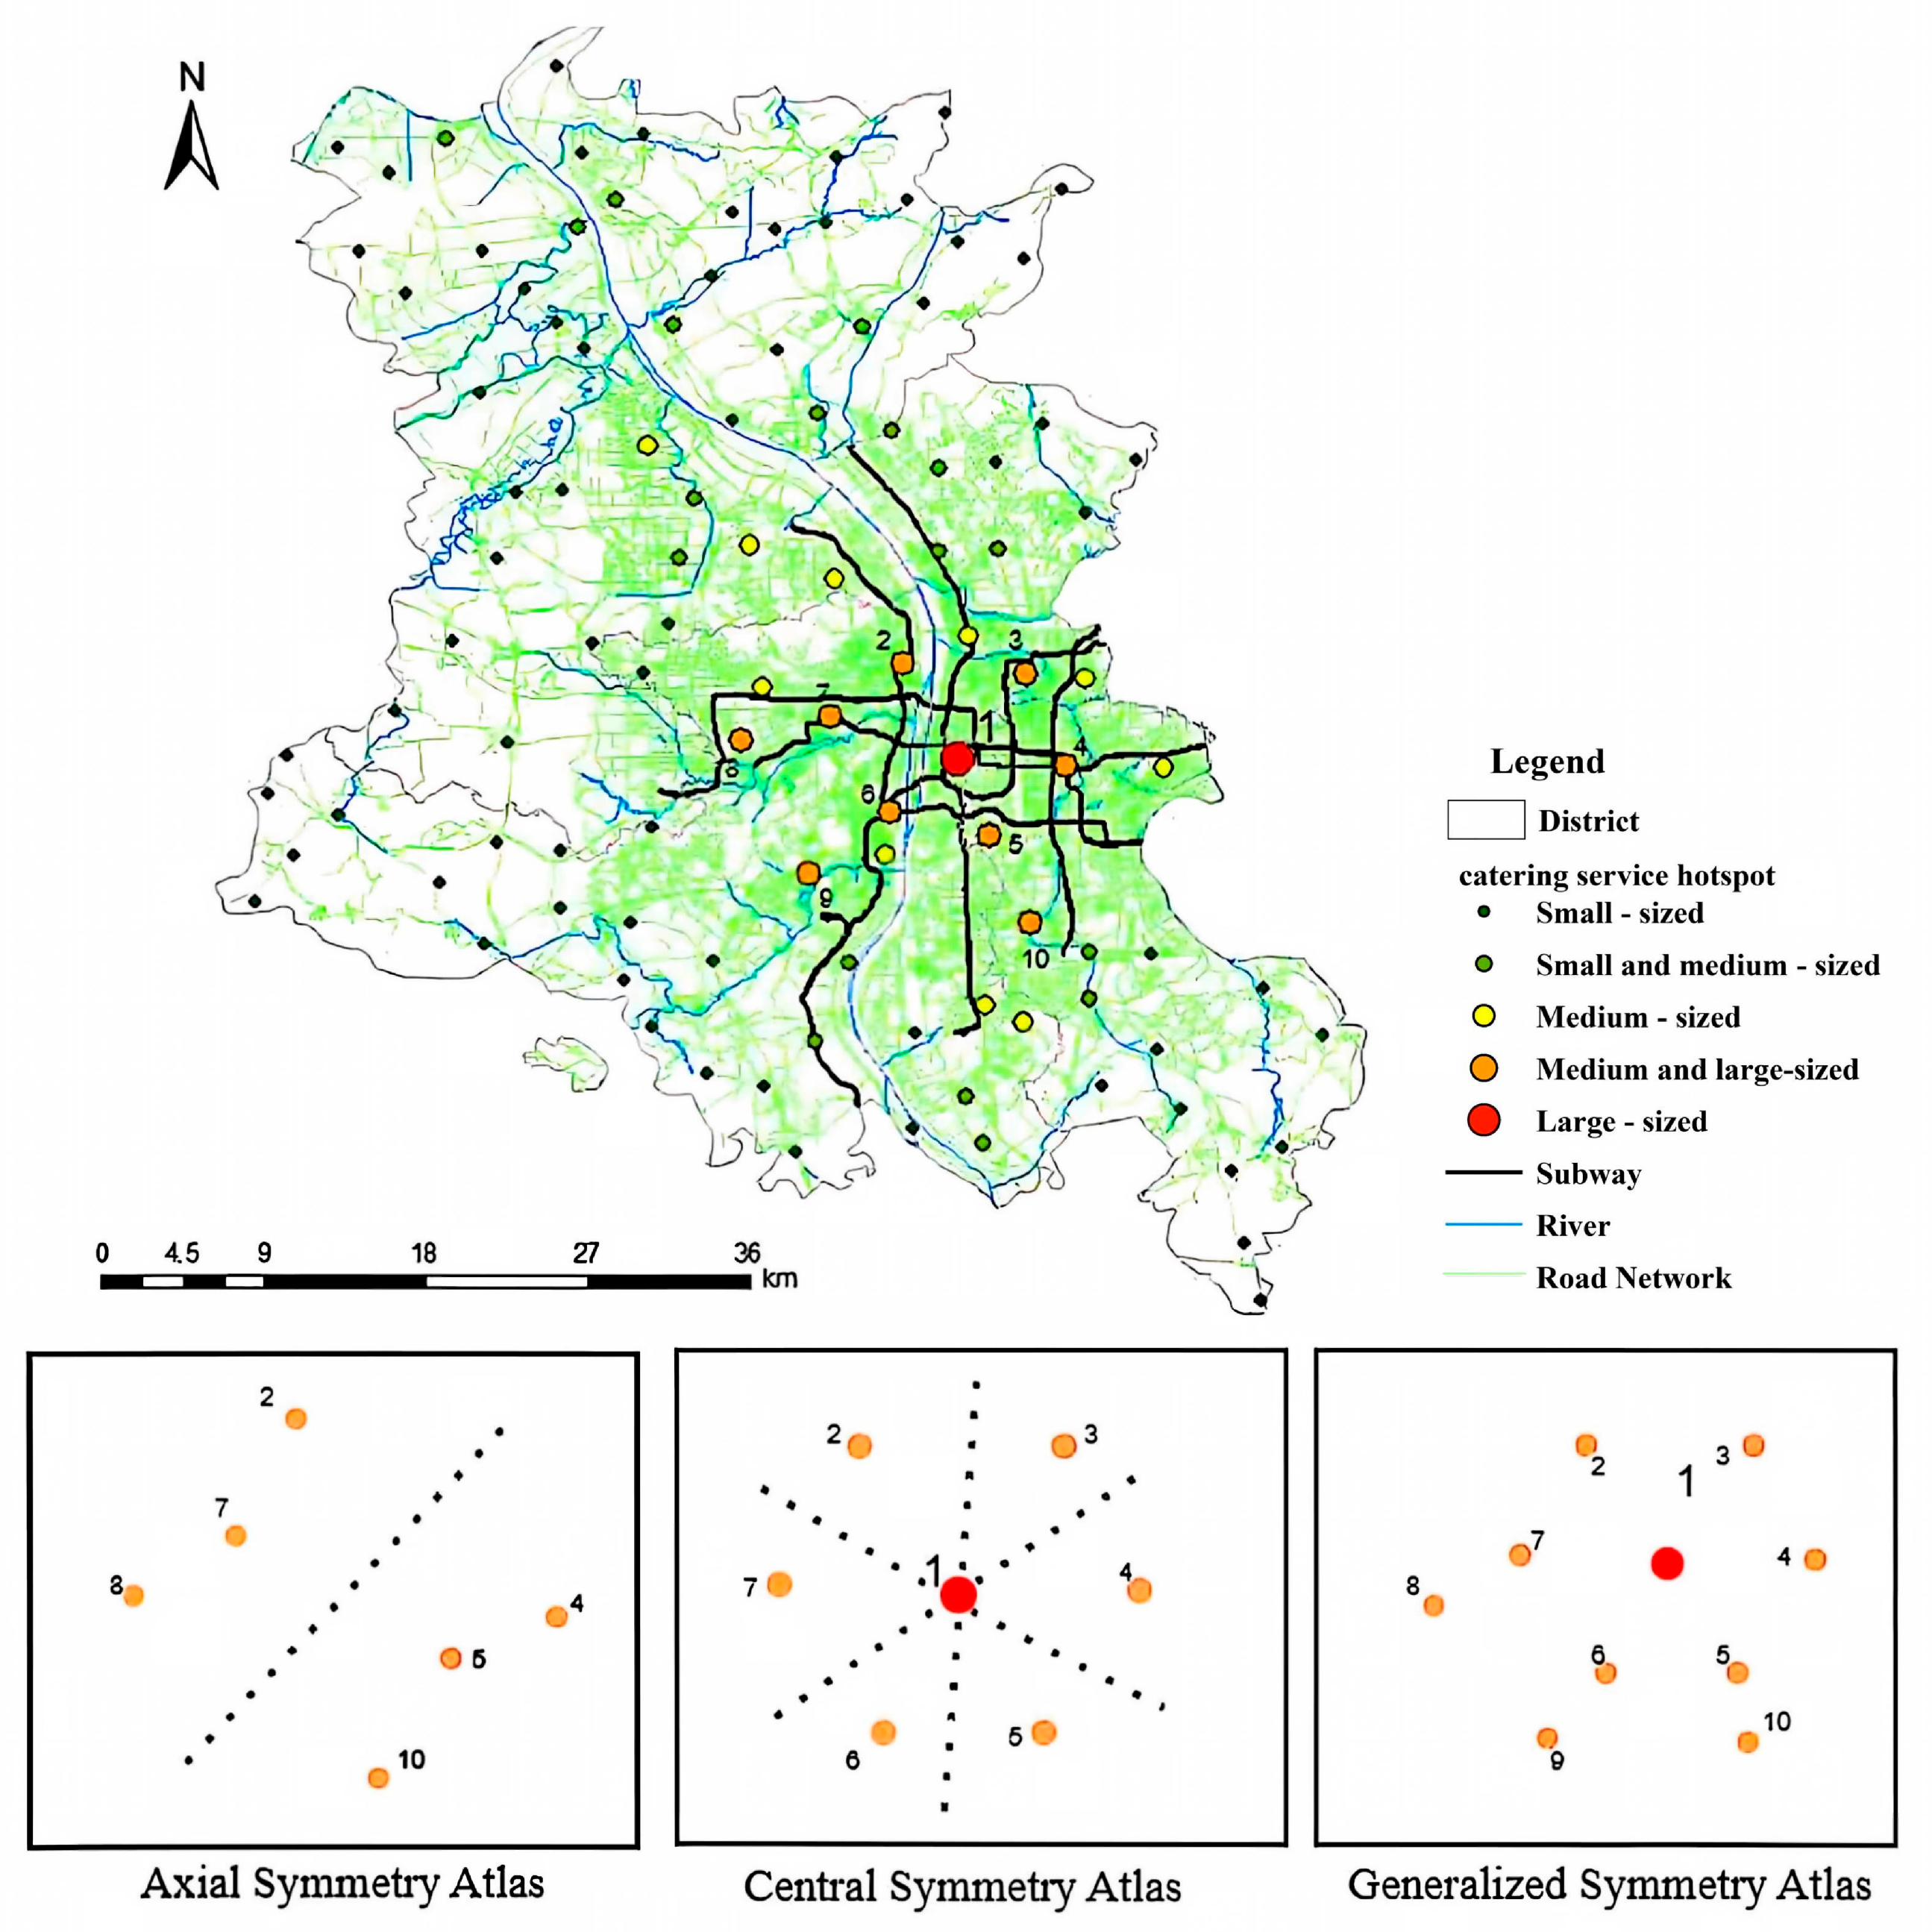
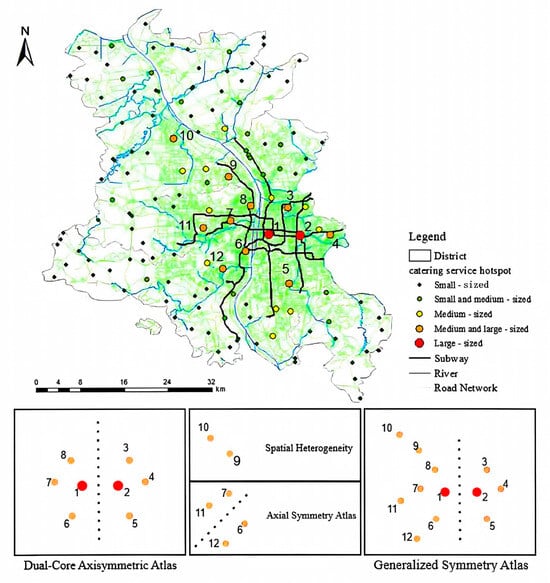
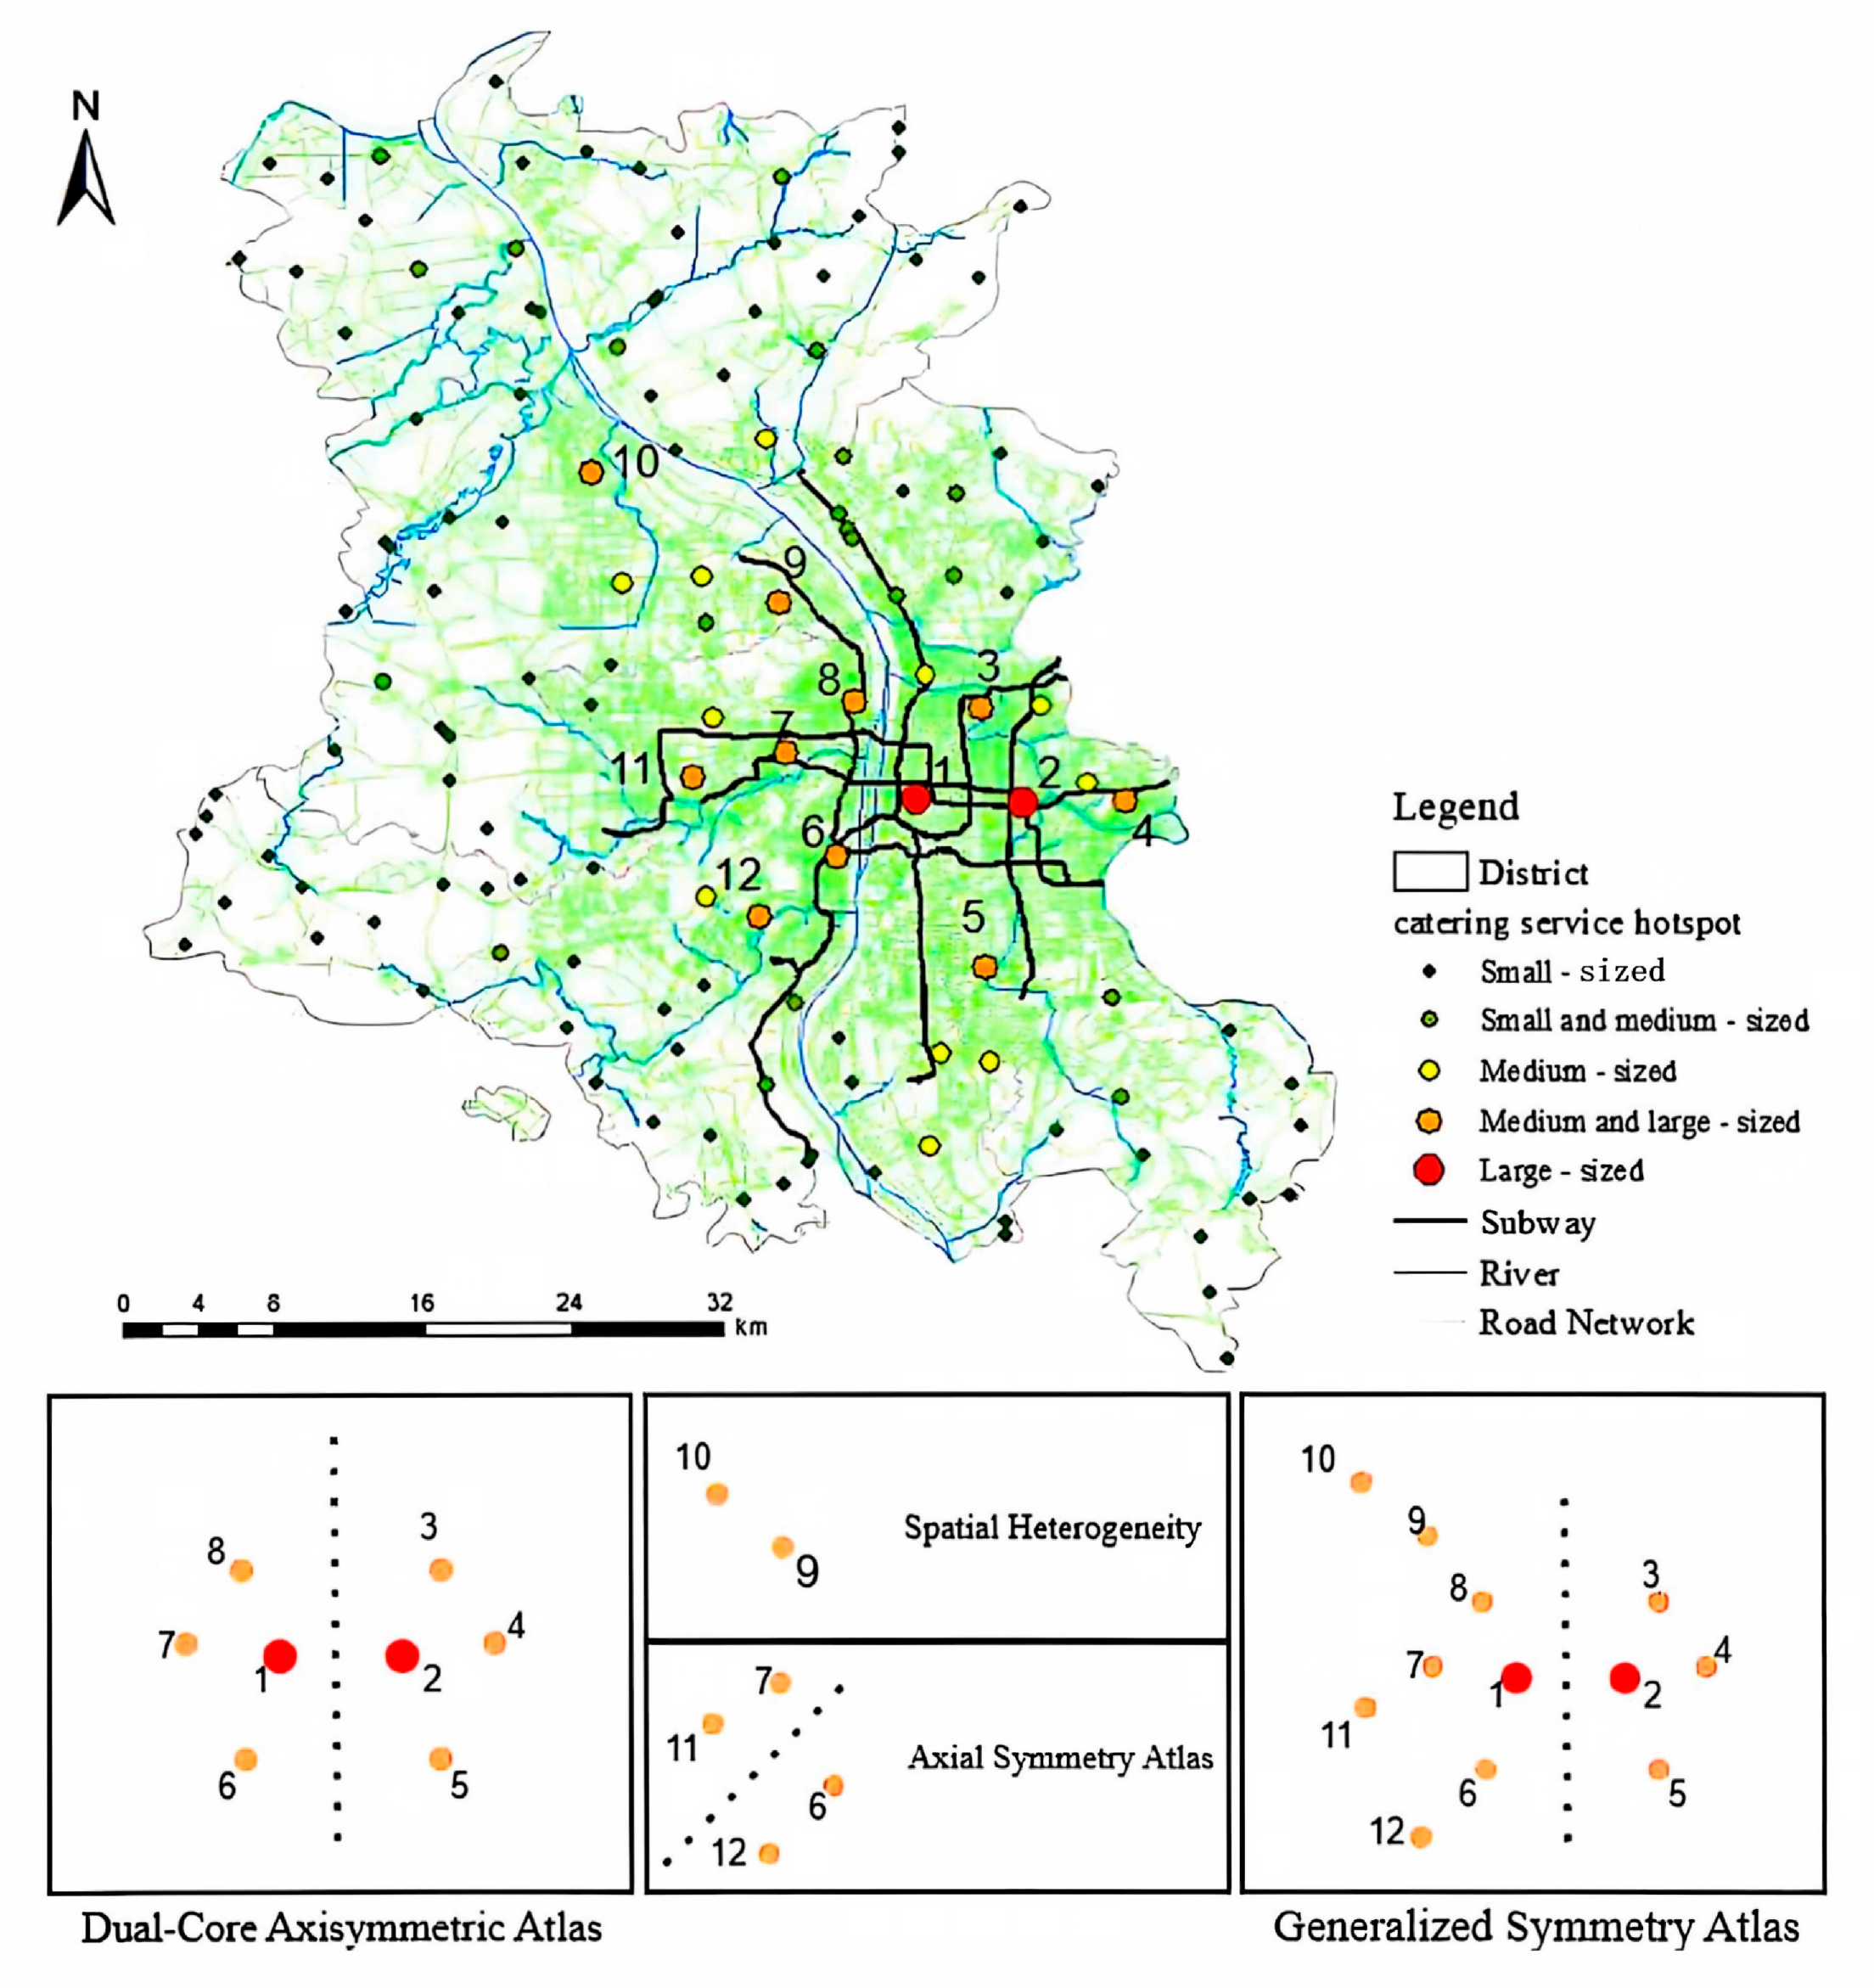
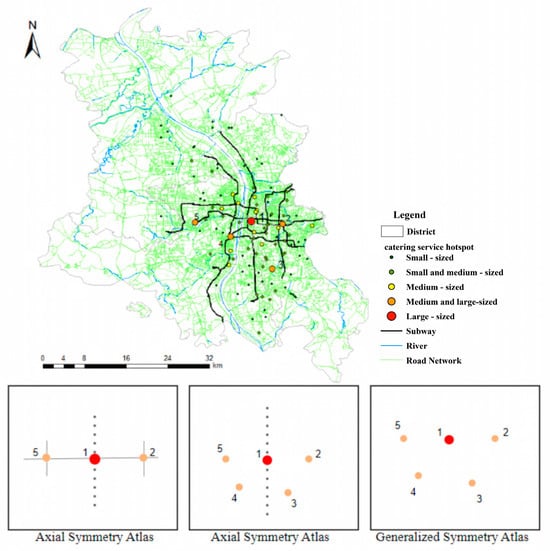
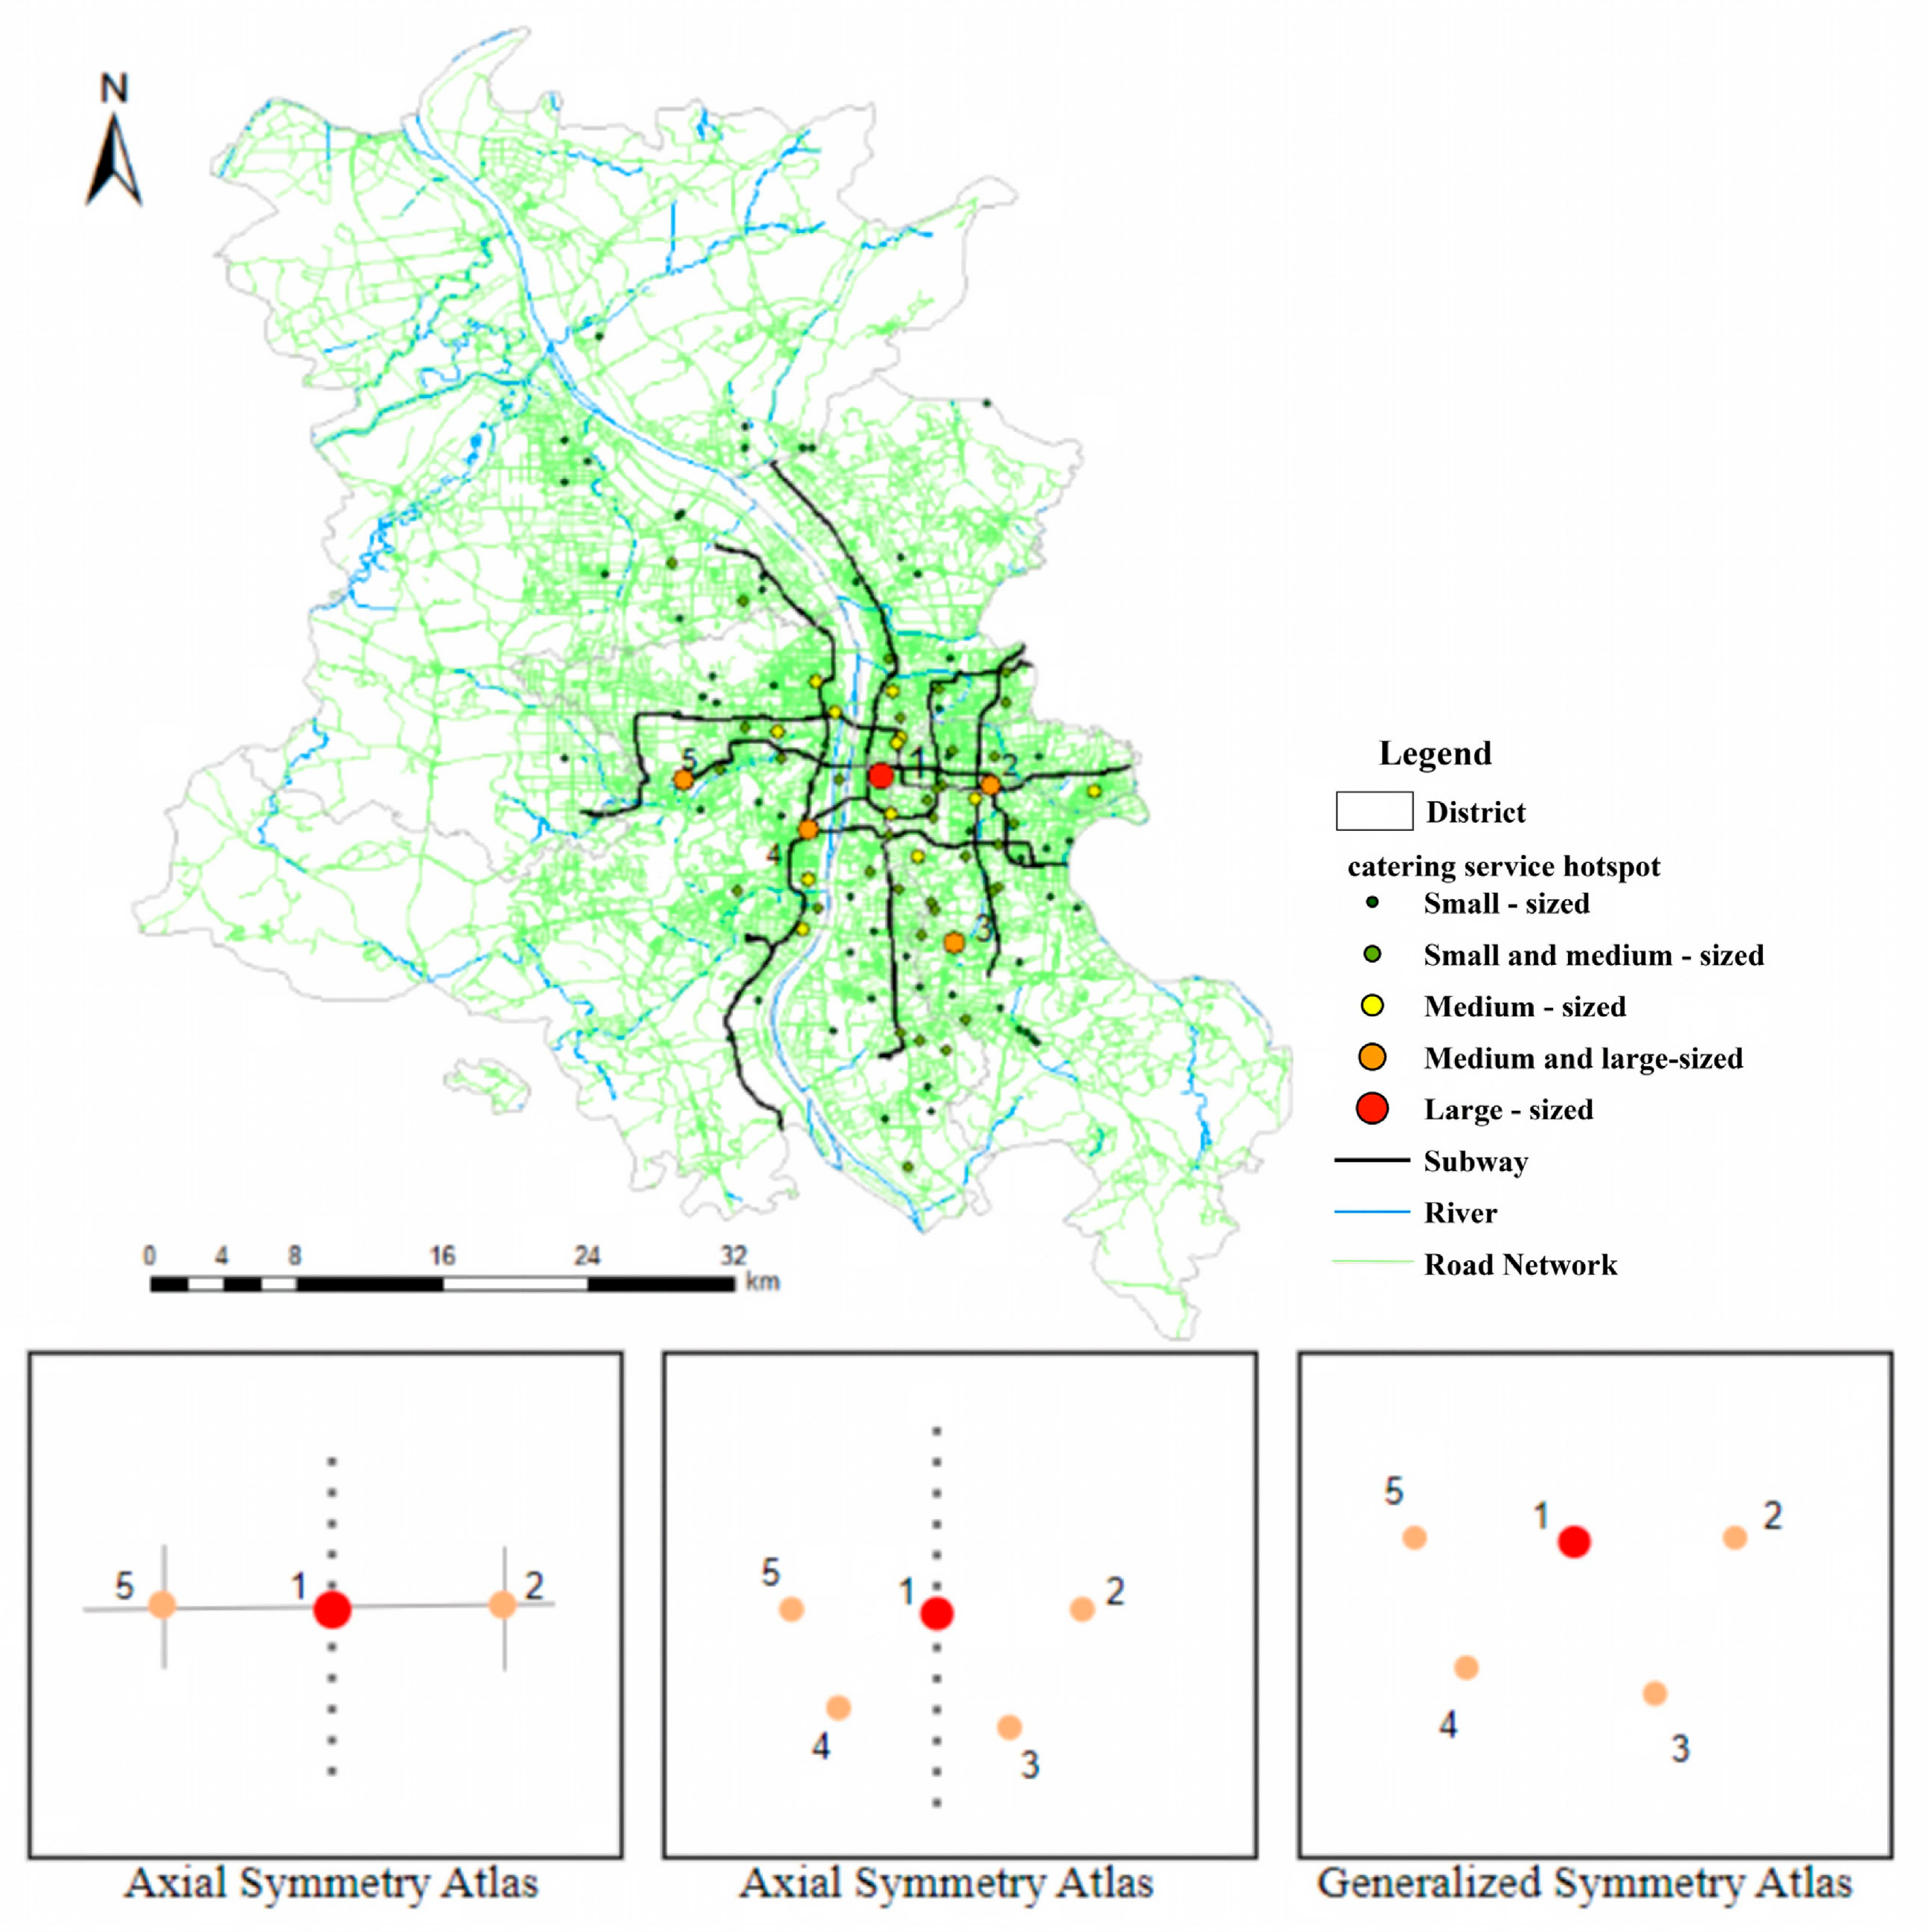
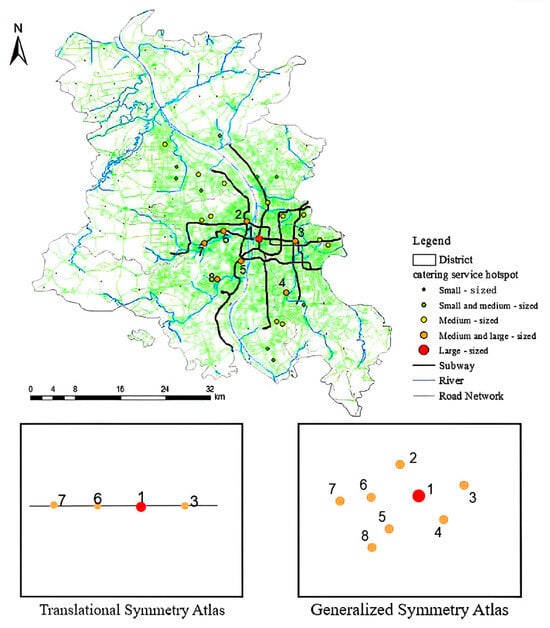
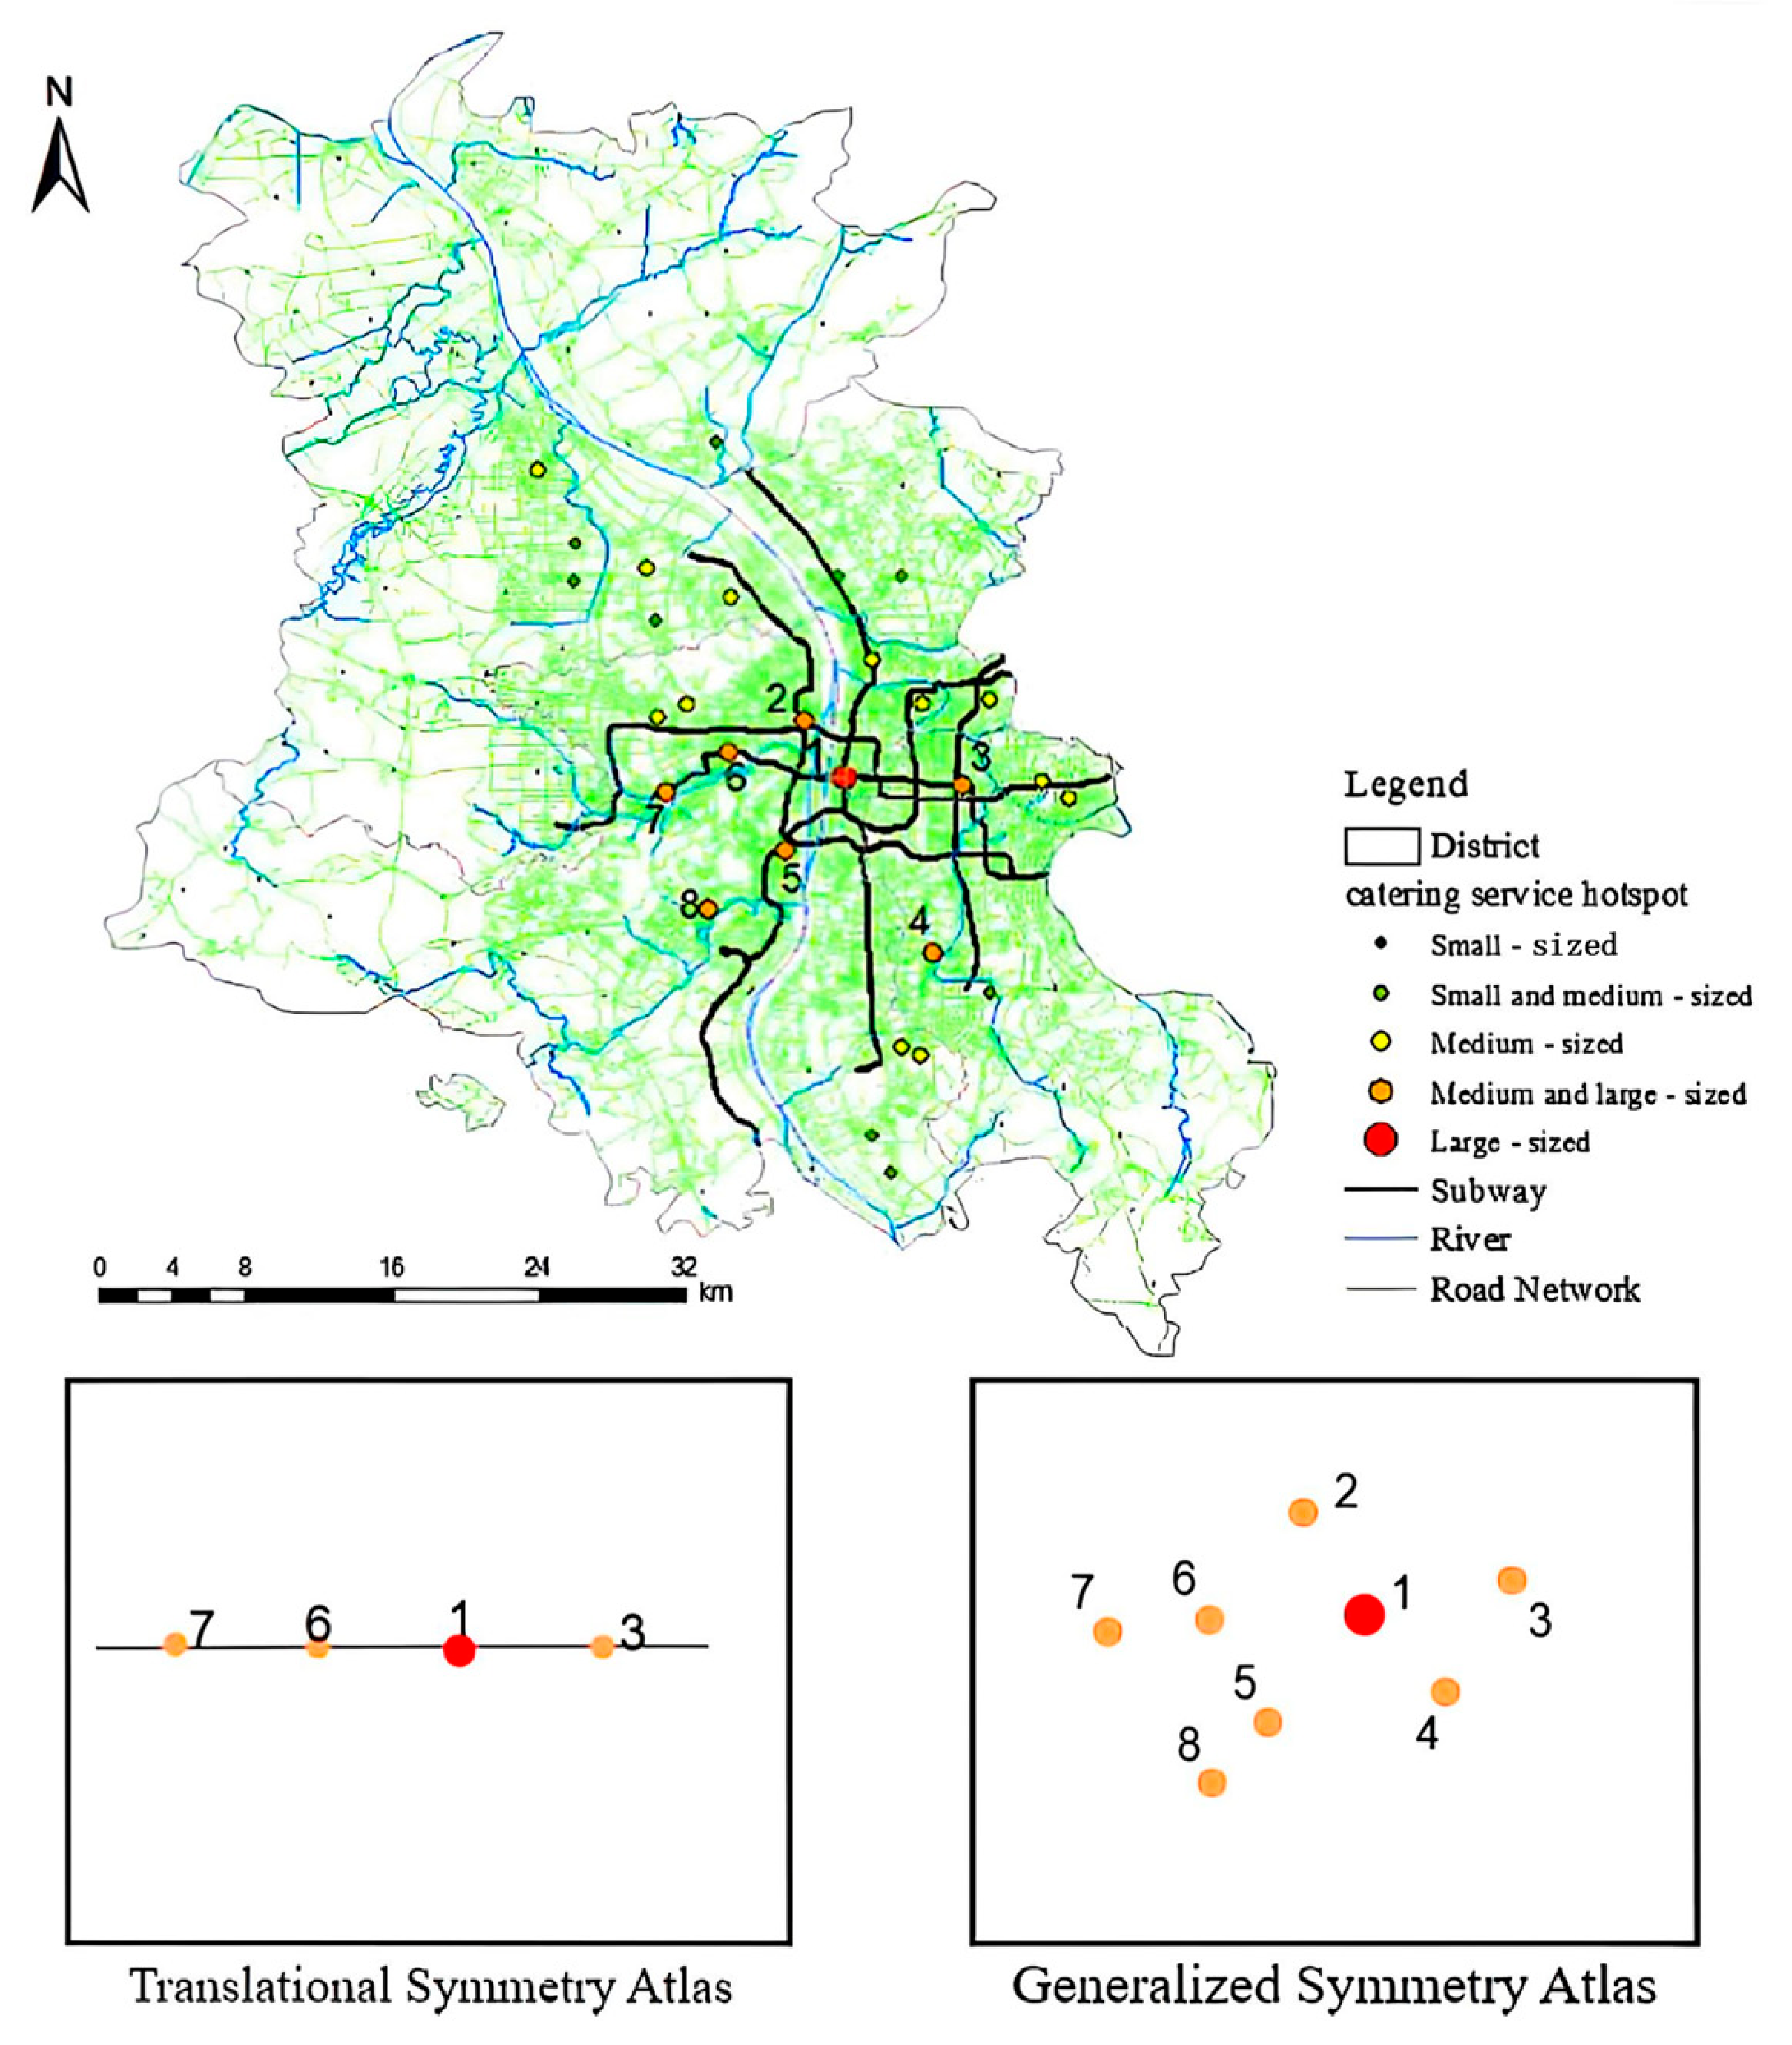
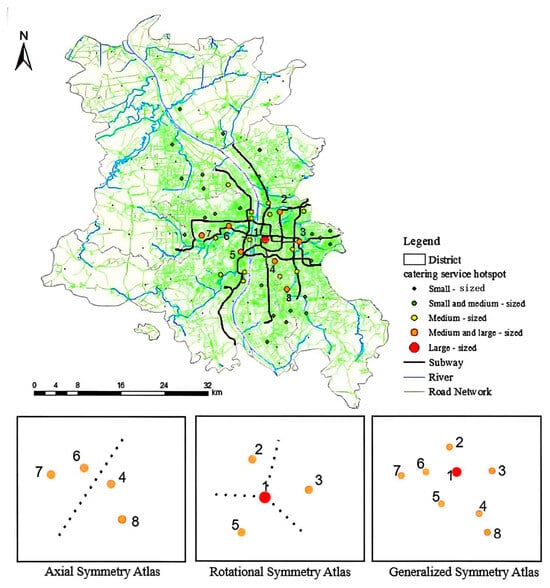
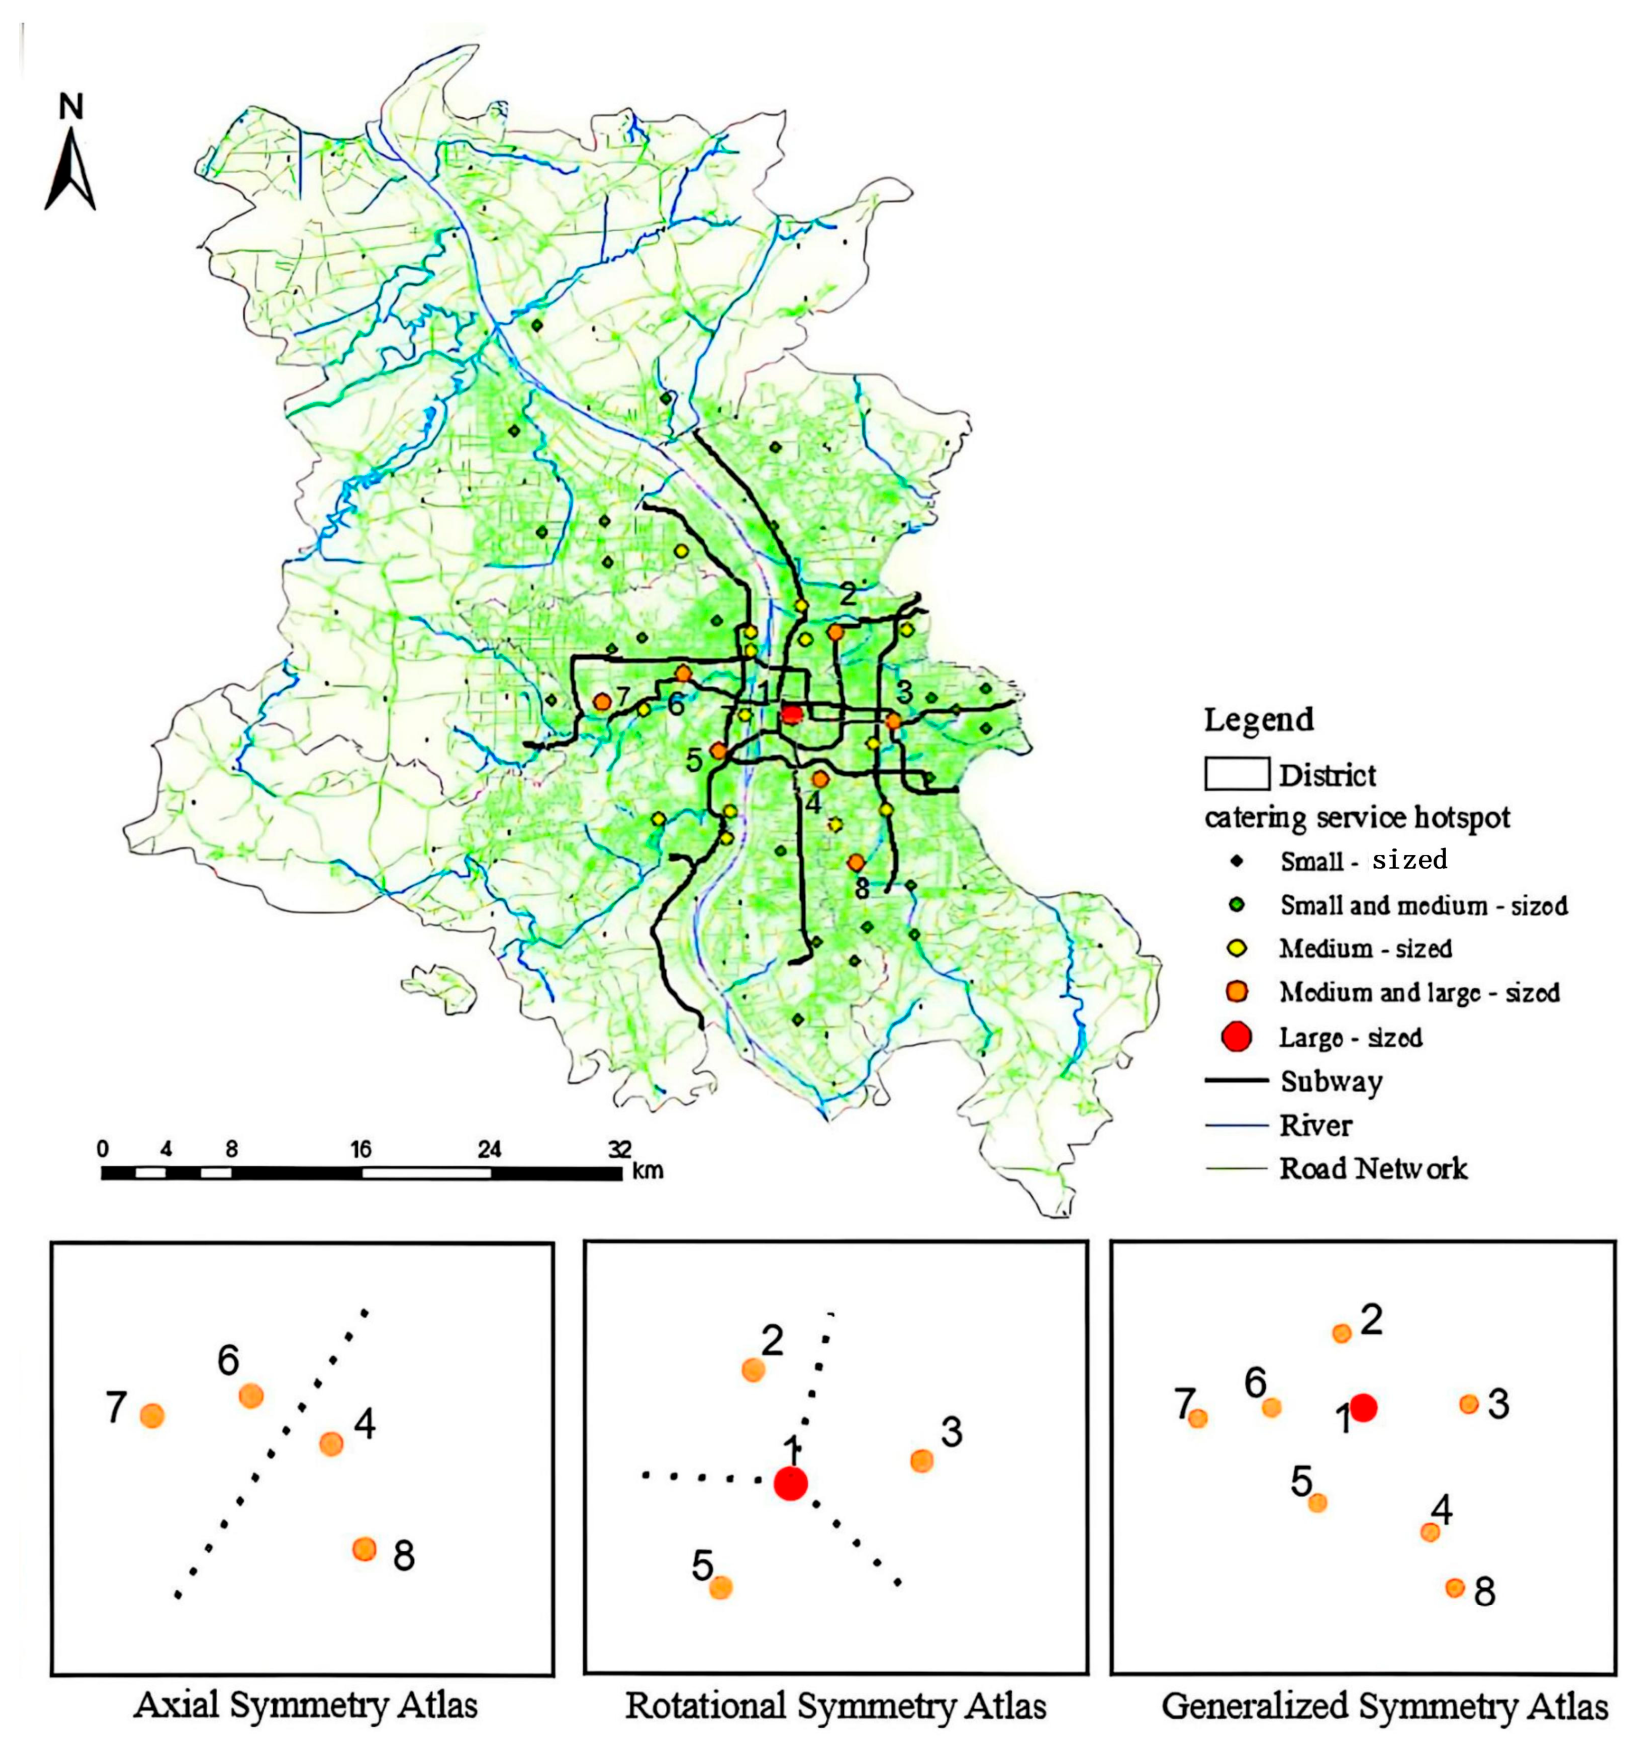

Disclaimer/Publisher’s Note: The statements, opinions and data contained in all publications are solely those of the individual author(s) and contributor(s) and not of MDPI and/or the editor(s). MDPI and/or the editor(s) disclaim responsibility for any injury to people or property resulting from any ideas, methods, instructions or products referred to in the content. |
© 2026 by the authors. Published by MDPI on behalf of the International Society for Photogrammetry and Remote Sensing. Licensee MDPI, Basel, Switzerland. This article is an open access article distributed under the terms and conditions of the Creative Commons Attribution (CC BY) license.