


Abstract
Urban functional area identification is fundamental to understanding urban spatial structure. Existing approaches typically assign a single category to each basic spatial unit, but are unable to fully represent variations in functional intensity. In this study, we introduced a refined urban functional area identification method that explicitly accounts for the heterogeneous spatial influence of points of interest (POIs) using Changzhou as a case study. The functional intensity of individual POIs was evaluated by integrating the entity scale, public recognition, and facility hierarchy, and an adaptive influence radius was constructed based on the functional intensity of individual POIs and their spatial clustering characteristics. A Gaussian distance-decay model was introduced to characterize the attenuation of the POI functional influence with increasing distance. The dominant functional areas, mixed-use functional areas, and functional transition areas were identified through functional structure analysis, function determination, and spatial aggregation. Comparison with land-use parcels showed that the method effectively identifies dominant functions. The identified functional categories, functional composition, and spatial variations in functional intensity within representative areas were highly consistent with the actual distribution of urban features. This study provides a new methodological framework for differentiated urban functional analysis and refined identification of urban functional areas.
1. Introduction
Urban functional areas are fundamental spatial units within a city that aggregate locally homogeneous socioeconomic characteristics [1,2]. They indicate variations in the urban biophysical environment as well as the spatial distribution and flow of socioeconomic activities [3] and constitute the basic units for urban planning, management, and resource allocation [4]. Consequently, accurate identification of urban functional areas is essential for revealing urban spatial structures, evaluating the distribution of urban functions, and supporting evidence-based planning and decision-making. However, most existing approaches use a discrete, mutually exclusive classification framework that assigns a single functional label to each spatial unit. Consequently, the identified functional areas are highly generalized [5], making it difficult to represent secondary functions and intra-unit functional heterogeneity. This oversimplification may result in mismatches between management objectives and actual land use as well as inefficient resource allocation. Therefore, improving the level of detail in urban functional area identification has emerged as a key research topic in urban geography and territorial spatial planning.
Existing approaches for refining urban functional area identification can generally be categorized from two perspectives: improvements in data sources and refinements of basic spatial units.
From a data perspective, refinement is achieved by extracting richer functional information from existing or emerging datasets to improve the accuracy and granularity of functional area identification. Commonly used data include thematic datasets, remote sensing imagery, volunteered geographic information (VGI), and other geospatial big data. Specialized agencies produce thematic datasets through field surveys and standardized processing, and provide well-structured attributes, comprehensive information, and high positional accuracy [6]. Early studies relied primarily on thematic maps such as urban land-use planning maps, current land-use maps, cadastral maps, and parcel maps [5], supplemented by statistical surveys and expert knowledge to delineate urban functional areas [7]. However, these datasets are expensive to acquire, difficult to access, and are outdated. With advances in imaging technology, remote sensing imagery has emerged as an accessible and cost-effective alternative for urban functional area identification. These methods infer urban functions from the spectral and textural characteristics of land cover features captured in remote sensing images [8,9]. They are effective in identifying land uses with distinctive morphological characteristics, such as large industrial complexes, educational campuses, and regularly planned residential areas. However, relying solely on spectral and textural information without incorporating socioeconomic factors makes it difficult to distinguish functionally complex areas such as commercial districts and cultural or entertainment zones, whose spatial forms are highly heterogeneous.
To overcome the limitations of thematic datasets and remote sensing imagery in representing human activities and socioeconomic characteristics, volunteer geographic information and other geospatial big data sources, including mobile phone signaling data, GPS trajectories, check-in records, and points of interest (POIs), have been increasingly applied for urban functional area identification [10,11]. These datasets can be used either independently or in combination. Various methods have been developed to extract richer functional information from these data, including word-frequency-based semantic analysis, probabilistic topic modeling, deep learning, and, more recently, pretrained vision-language models applied to street-view imagery [12,13,14]. For example, Gao et al. [15]. applied latent Dirichlet allocation (LDA) topic modeling to POI data and incorporated user check-in activities from location-based social networks to extract urban functional regions [15]. POI data inherently provide both geographic locations and functional categories, whereas check-in data mitigate the biases associated with relying solely on POI density, thereby improving classification accuracy. However, these approaches primarily enhance the accuracy of functional label assignment without fundamentally changing the one-unit-one-label representation.
From the perspective of spatial units, refinement strategies typically follow the following two approaches: the first is to reduce the size of the basic spatial units to improve the spatial resolution of the functional area identification. The second is to enrich the representation of functions within each unit by identifying the dominant function, as well as the composition of multiple coexisting functions. The former mainly includes regular- and irregular-grid approaches. Regular grid methods partition the study area into uniformly sized grid cells with a grid resolution typically determined using expert-driven interpretation [16,17]. Although relatively simple to implement, this approach is subjective. To reduce this subjectivity, Luo et al. [18] proposed the selection of an optimal grid size by comparing the mean POI density and its standard deviation across multiple grid resolutions [18]. However, regular grids are poorly suited to the irregular spatial clustering of urban functions; overly coarse grids may split naturally clustered or functionally mixed areas, whereas excessively fine grids substantially increase the computational complexity.
To address these limitations, numerous studies have used irregular spatial units obtained from road networks or remote-sensing imagery. Road-network-based methods use urban roads or other physical boundaries as natural geographic separators, with enclosed areas serving as basic spatial units [19,20]. These methods yield spatial units with well-defined boundaries. However, the subsequent aggregation of urban blocks is typically based on physical characteristics, such as adjacency, distance, and shape, which may overlook functional heterogeneity within individual blocks. Alternatively, remote-sensing-based approaches identify adjacent homogeneous regions according to their spectral, textural, and contextual semantic characteristics, thereby generating basic spatial units [21]. However, these methods only improve the spatial resolution of urban functional area identification and remain limited in terms of representing the functional distribution, relative intensity, and spatial heterogeneity within individual units.
Efforts to enrich the representation of functional characteristics within spatial units have evolved from single-label classification toward mixed-function classifications [22]. In the single-function classification, each spatial unit is assigned a dominant function based on its prevailing land use or socioeconomic activity, resulting in categories such as residential, commercial, and industrial. The level of functional classification is frequently influenced by the spatial scale of analysis. At larger scales, functional areas are typically classified into broad categories such as residential and commercial areas. As spatial units become smaller, more detailed functional types such as residential subcategories or commercial streets can be identified, provided that the data semantics and classification framework support finer distinctions [23]. However, reducing the spatial unit size primarily improves the spatial resolution, and the functional characterization itself remains constrained by the semantic richness of the input data and the predefined classification scheme. Mixed-use functional areas are spatial units in which two or more urban functions coexist with sufficient prominence to satisfy the classification criteria. For example, several studies generally characterize mixed-use areas using composite labels such as commercial–residential derived from the number, density, proportion, or relative dominance of different types of POIs [16]. Compared with single-label classification, mixed-function labels preserve more information about the functional composition. However, they still fundamentally rely on assigning discrete labels to entire spatial units, indicating that only the major functions are present. Consequently, they cannot capture the relative intensity of different functions, precise spatial distributions, zones of influence, or gradual transitions between adjacent functional areas. Consequently, the internal functional structure and spatial heterogeneity within individual spatial units remain only partially represented.
In summary, existing studies have improved the accuracy, spatial resolution, and thematic details of urban functional area identification by incorporating rich data sources and refining the spatial units. However, these approaches typically retain the fundamental paradigm of assigning discrete functional labels to entire spatial units. Multiple urban functions frequently coexist within a single unit. In addition to the dominant function, secondary functions may also play an important role in shaping unit characteristics. Furthermore, different facilities belonging to the same functional category frequently exert different levels and spatial extents of influence on their surroundings, which are referred to as spatial effects in this study. For example, although tertiary hospitals and pharmacies are classified as healthcare facilities, their differences in scale and service capacity result in substantially different functional intensities and spatial influence ranges. These observations highlight the need for a new identification and representation framework that can simultaneously capture the functional composition of spatial units and heterogeneous spatial effects of individual urban facilities.
To address this gap, this study advances beyond the conventional paradigm of assigning a single functional label to an entire spatial unit and proposes a refined urban function identification framework that can simultaneously represent multiple coexisting functions, their relative intensities, and their heterogeneous spatial effects. By characterizing the continuous variation and spatial interaction of urban functions, the proposed method provides methodological support for the identification of refined urban functional areas and informed urban planning applications.
2. Basic Framework
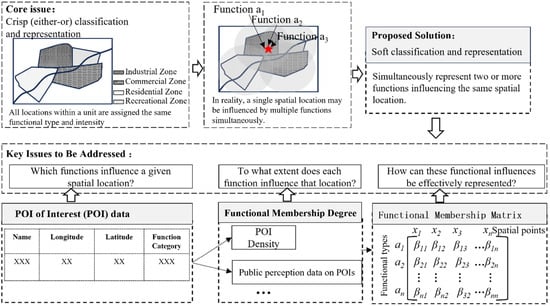
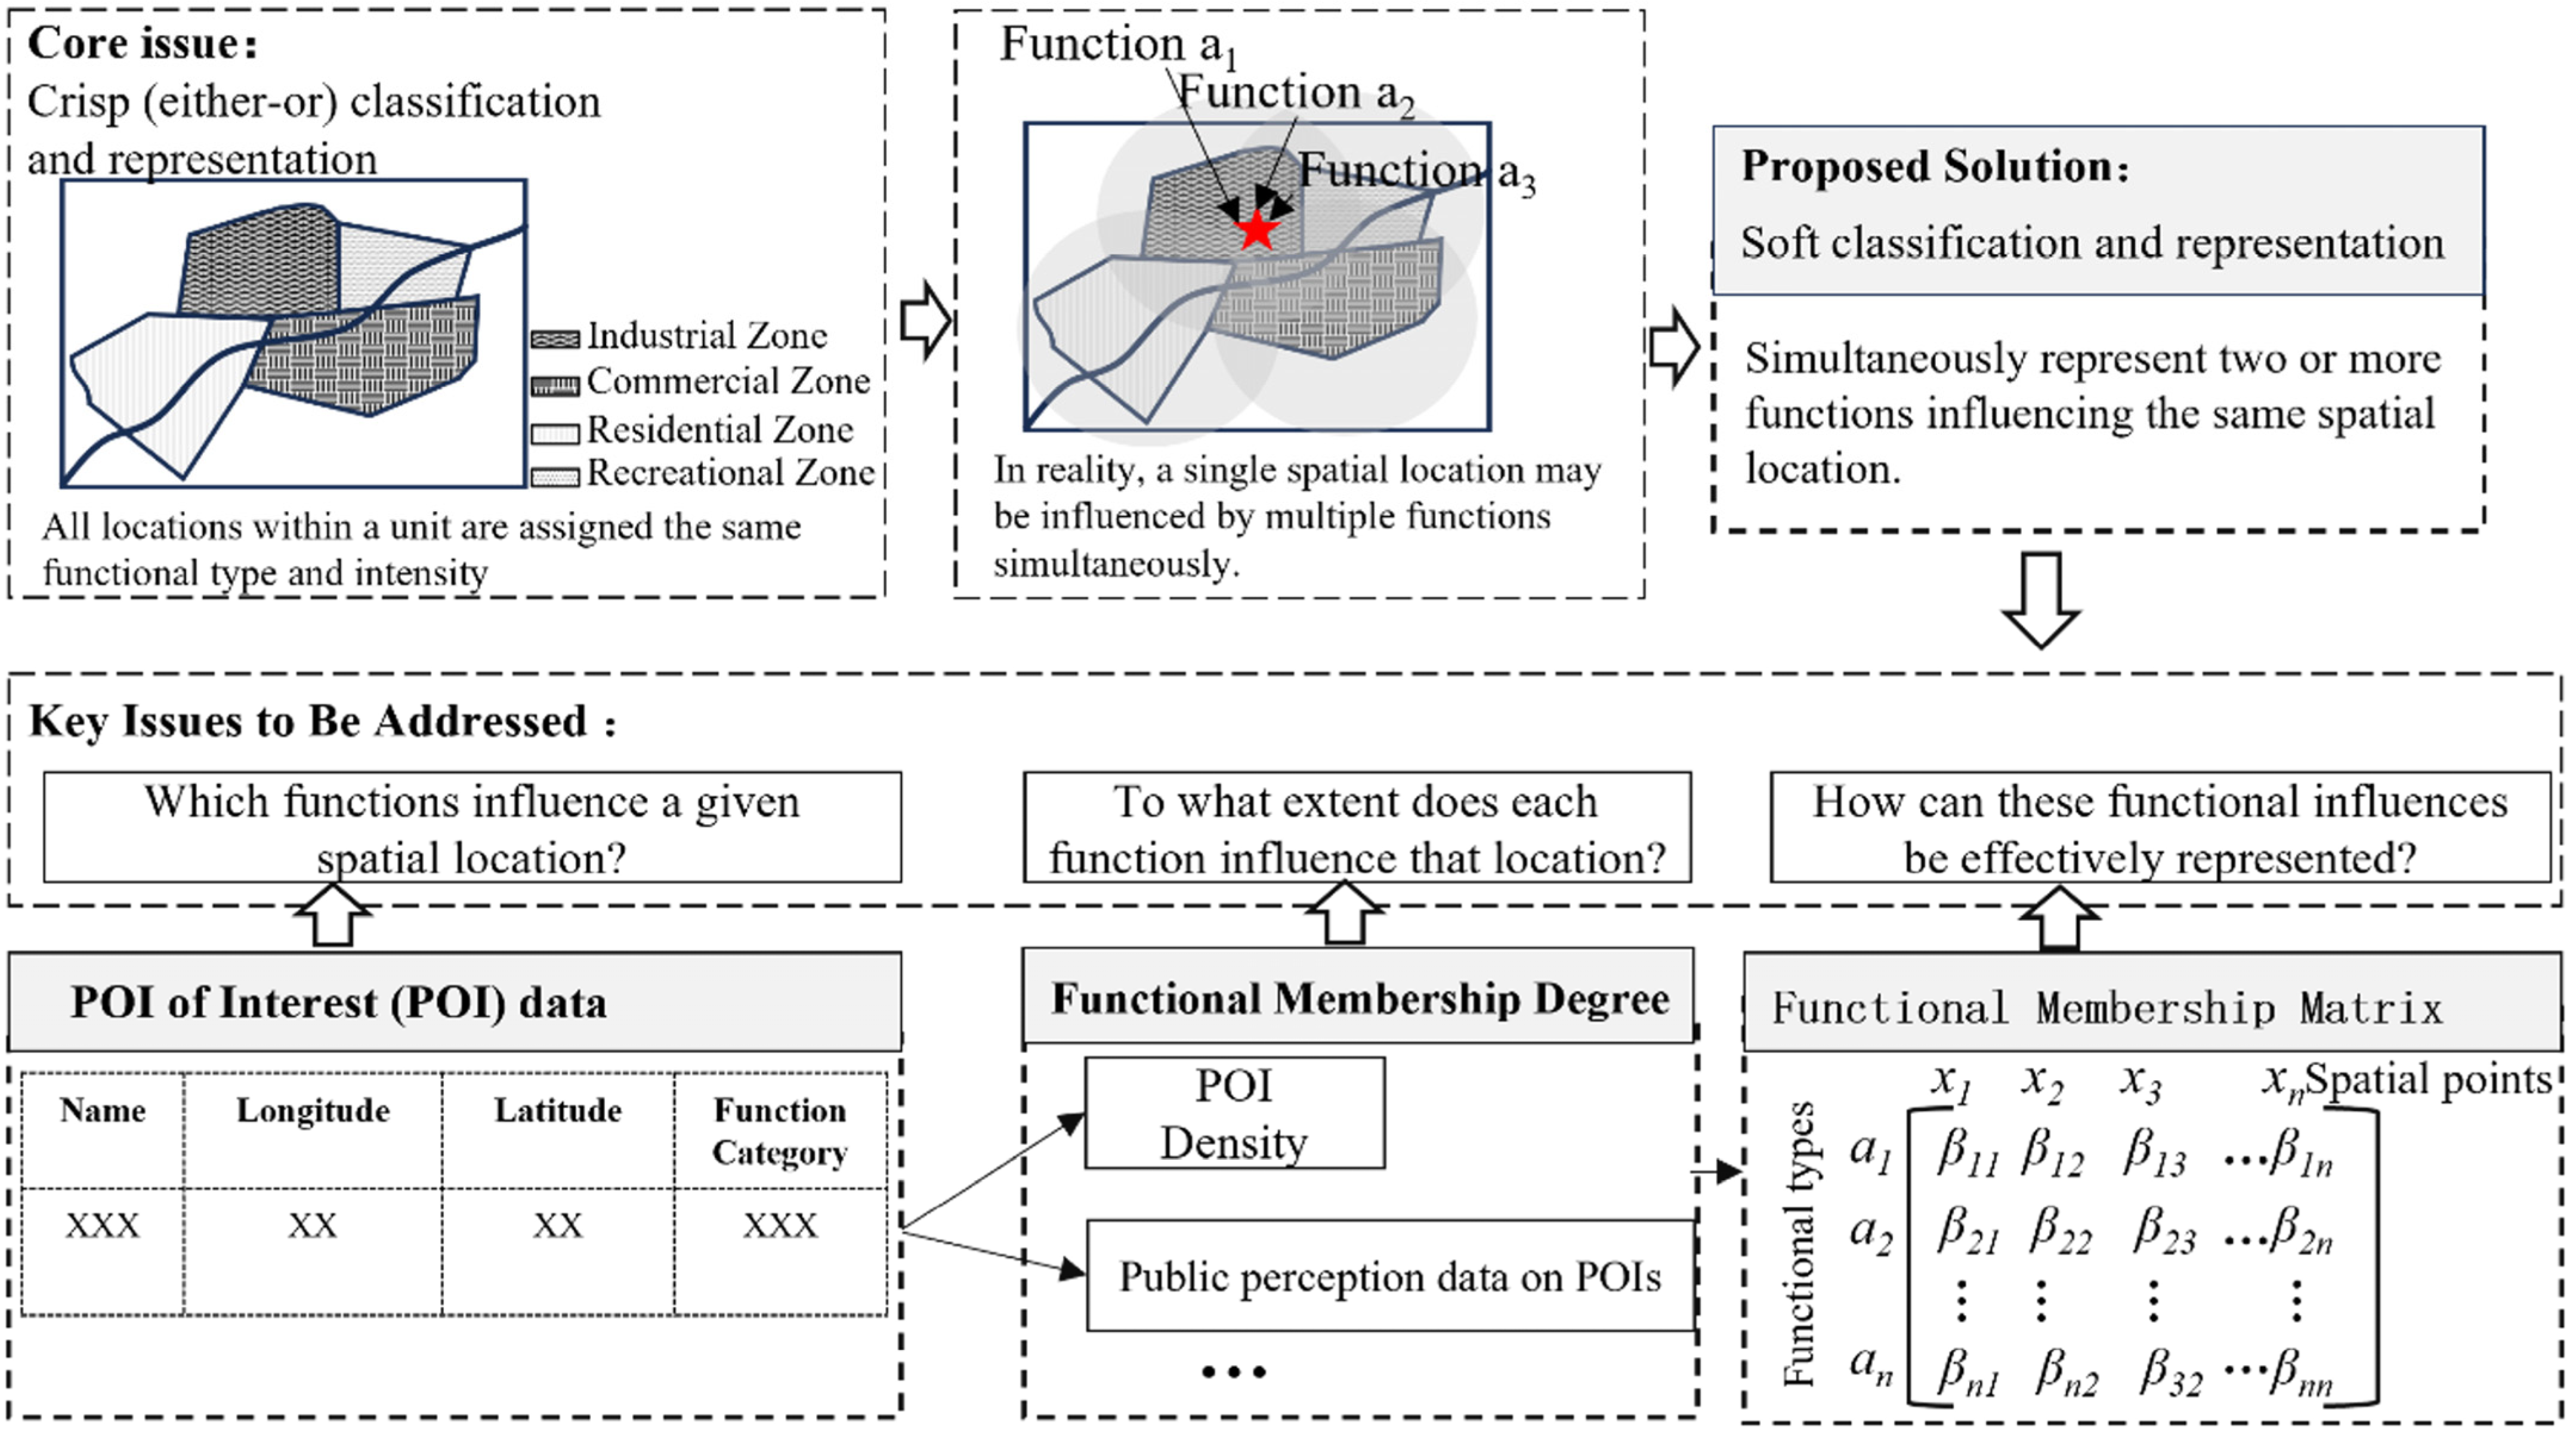
The spatial effects of urban functions indicate that any given spatial location may be simultaneously influenced by multiple functions, with varying degrees of influence (Figure 1). Therefore, this study proposes a new “soft” identification and representation framework that can simultaneously characterize the effects of multiple functions on a spatial location, thereby revealing the internal functional composition of a spatial unit and its spatial variations. Specifically, this framework addresses three key questions: Which functions influence a given spatial location? To what extent does each function influence that location? How can these functional influences be represented effectively? To answer these questions, this study first used POI data to determine the types of functions affecting each spatial location, because POI datasets contain both geographic coordinates and functional category information. Second, functional membership values were introduced to quantify the influence intensity of different functions at each location. These membership values were determined based on factors such as POI density, spatial influence range, and relevant social perception data. Finally, the membership values of the multiple functions at each spatial location were integrated into a point-based functional vector. By connecting all the spatial locations, these vectors were aggregated into a functional matrix (Figure 1). In this matrix, each column vector represents the membership values of a specific function (a1–an) across different spatial locations, while each row vector represents the spatial distribution of one function across locations x1–xn. Based on this representation, the framework can simultaneously characterize the functional composition and relative intensity of individual locations and the continuous spatial variation in specific functional types.
Figure 1.
Basic framework.
3. Study Area and Data
3.1. Study Area
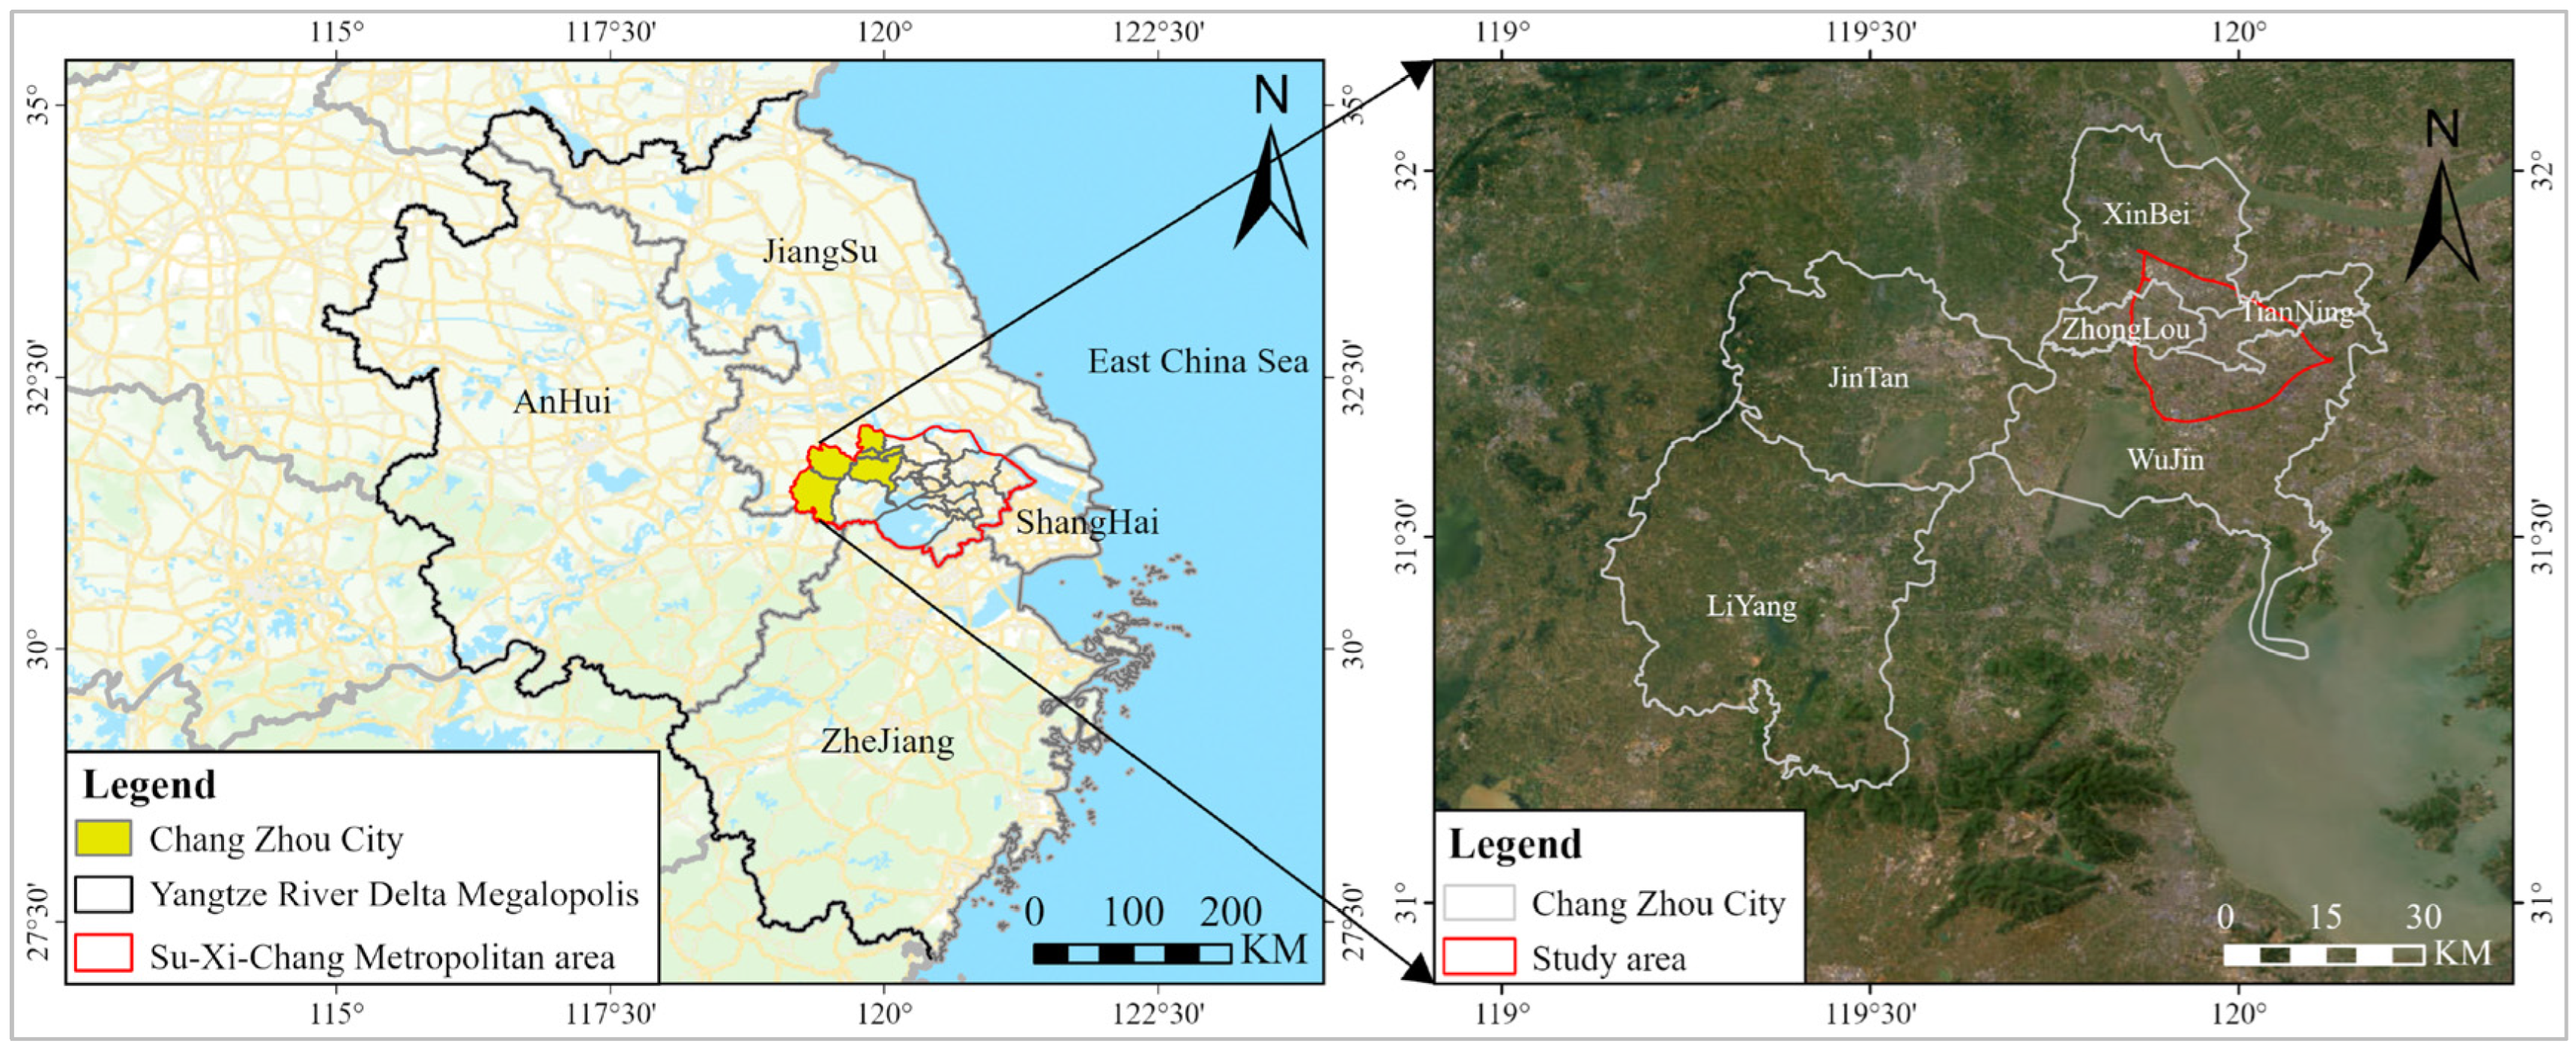
This study focused on the main urban area of Changzhou City, Jiangsu Province, China (119°08′–120°12′ E, 31°09′–32°04′ N) as the study area. Changzhou covers an area of approximately 79,919.92 hectares and has a population of approximately 5.39 million (Statistics, 2025) (Figure 2). Changzhou, which is located in the northwestern part of the Suzhou–Wuxi–Changzhou metropolitan area, within the Yangtze River Delta urban agglomeration, is an important national hub for advanced manufacturing and modern services. The city, benefiting from its favorable geographic location and well-developed transportation network, has a strong industrial foundation, densely distributed commercial clusters, and relatively comprehensive cultural, healthcare, and municipal service facilities. Consequently, Changzhou, particularly its main urban area, contains diverse and densely distributed POI types, providing an ideal research environment for a refined urban functional area identification based on POI data.
Figure 2.
Study area.
3.2. Data Types and Sources
3.2.1. POI Data
The POI data used in this study were obtained from the Amap platform (https://lbs.amap.com/) in December 2023, covering the main urban area of Changzhou. The dataset included 112,590 POI records, covering 12 POI categories, including residential, sports and leisure, education, culture, healthcare, and other categories (Table 1). The dataset contains spatial attributes, such as longitude and latitude, and descriptive attributes, including name, category, subcategory, administrative division, and business status. These attributes were used to determine the geographic locations of urban entities and to characterize their functional properties. This highly integrated “location–attribute” data structure provides strong data support for refined urban functional area identification. The 12 POI categories were aggregated into six functional types based on similarities in the urban functions they represent. This aggregation was designed to balance functional differentiation with consistency with the land use categories used for validation, rather than to assume identical service ranges among facilities within the same type. Such facility level differences are subsequently captured through POI specific functional intensity and adaptive influence radius.
Table 1.
Overview of POI data in the main urban area of Changzhou City.
3.2.2. Auxiliary Data
In addition to the POI data, this study incorporated auxiliary datasets, including area of interest (AOI) data, social perception data, questionnaire survey data, and other validation datasets (Table 2). AOI data were used to characterize the physical scale of the geographic entities associated with POIs. Public ratings, review counts, and facility ranking information, such as the grades of schools, hospitals, and hotels, were used to assist in evaluating the functional intensity of individual POIs. Questionnaire surveys were employed to validate the effectiveness of representing spatial functional effects. Current land-use parcel maps and Google Earth remote sensing imagery were used to evaluate the completeness of dominant function identification and the practical interpretability of the identified functional patterns in typical areas.
Table 2.
Overview of auxiliary data.
4. Methodology
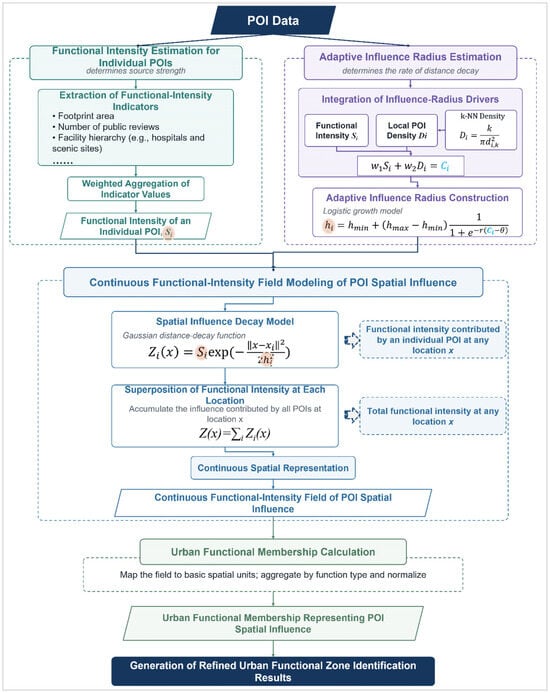
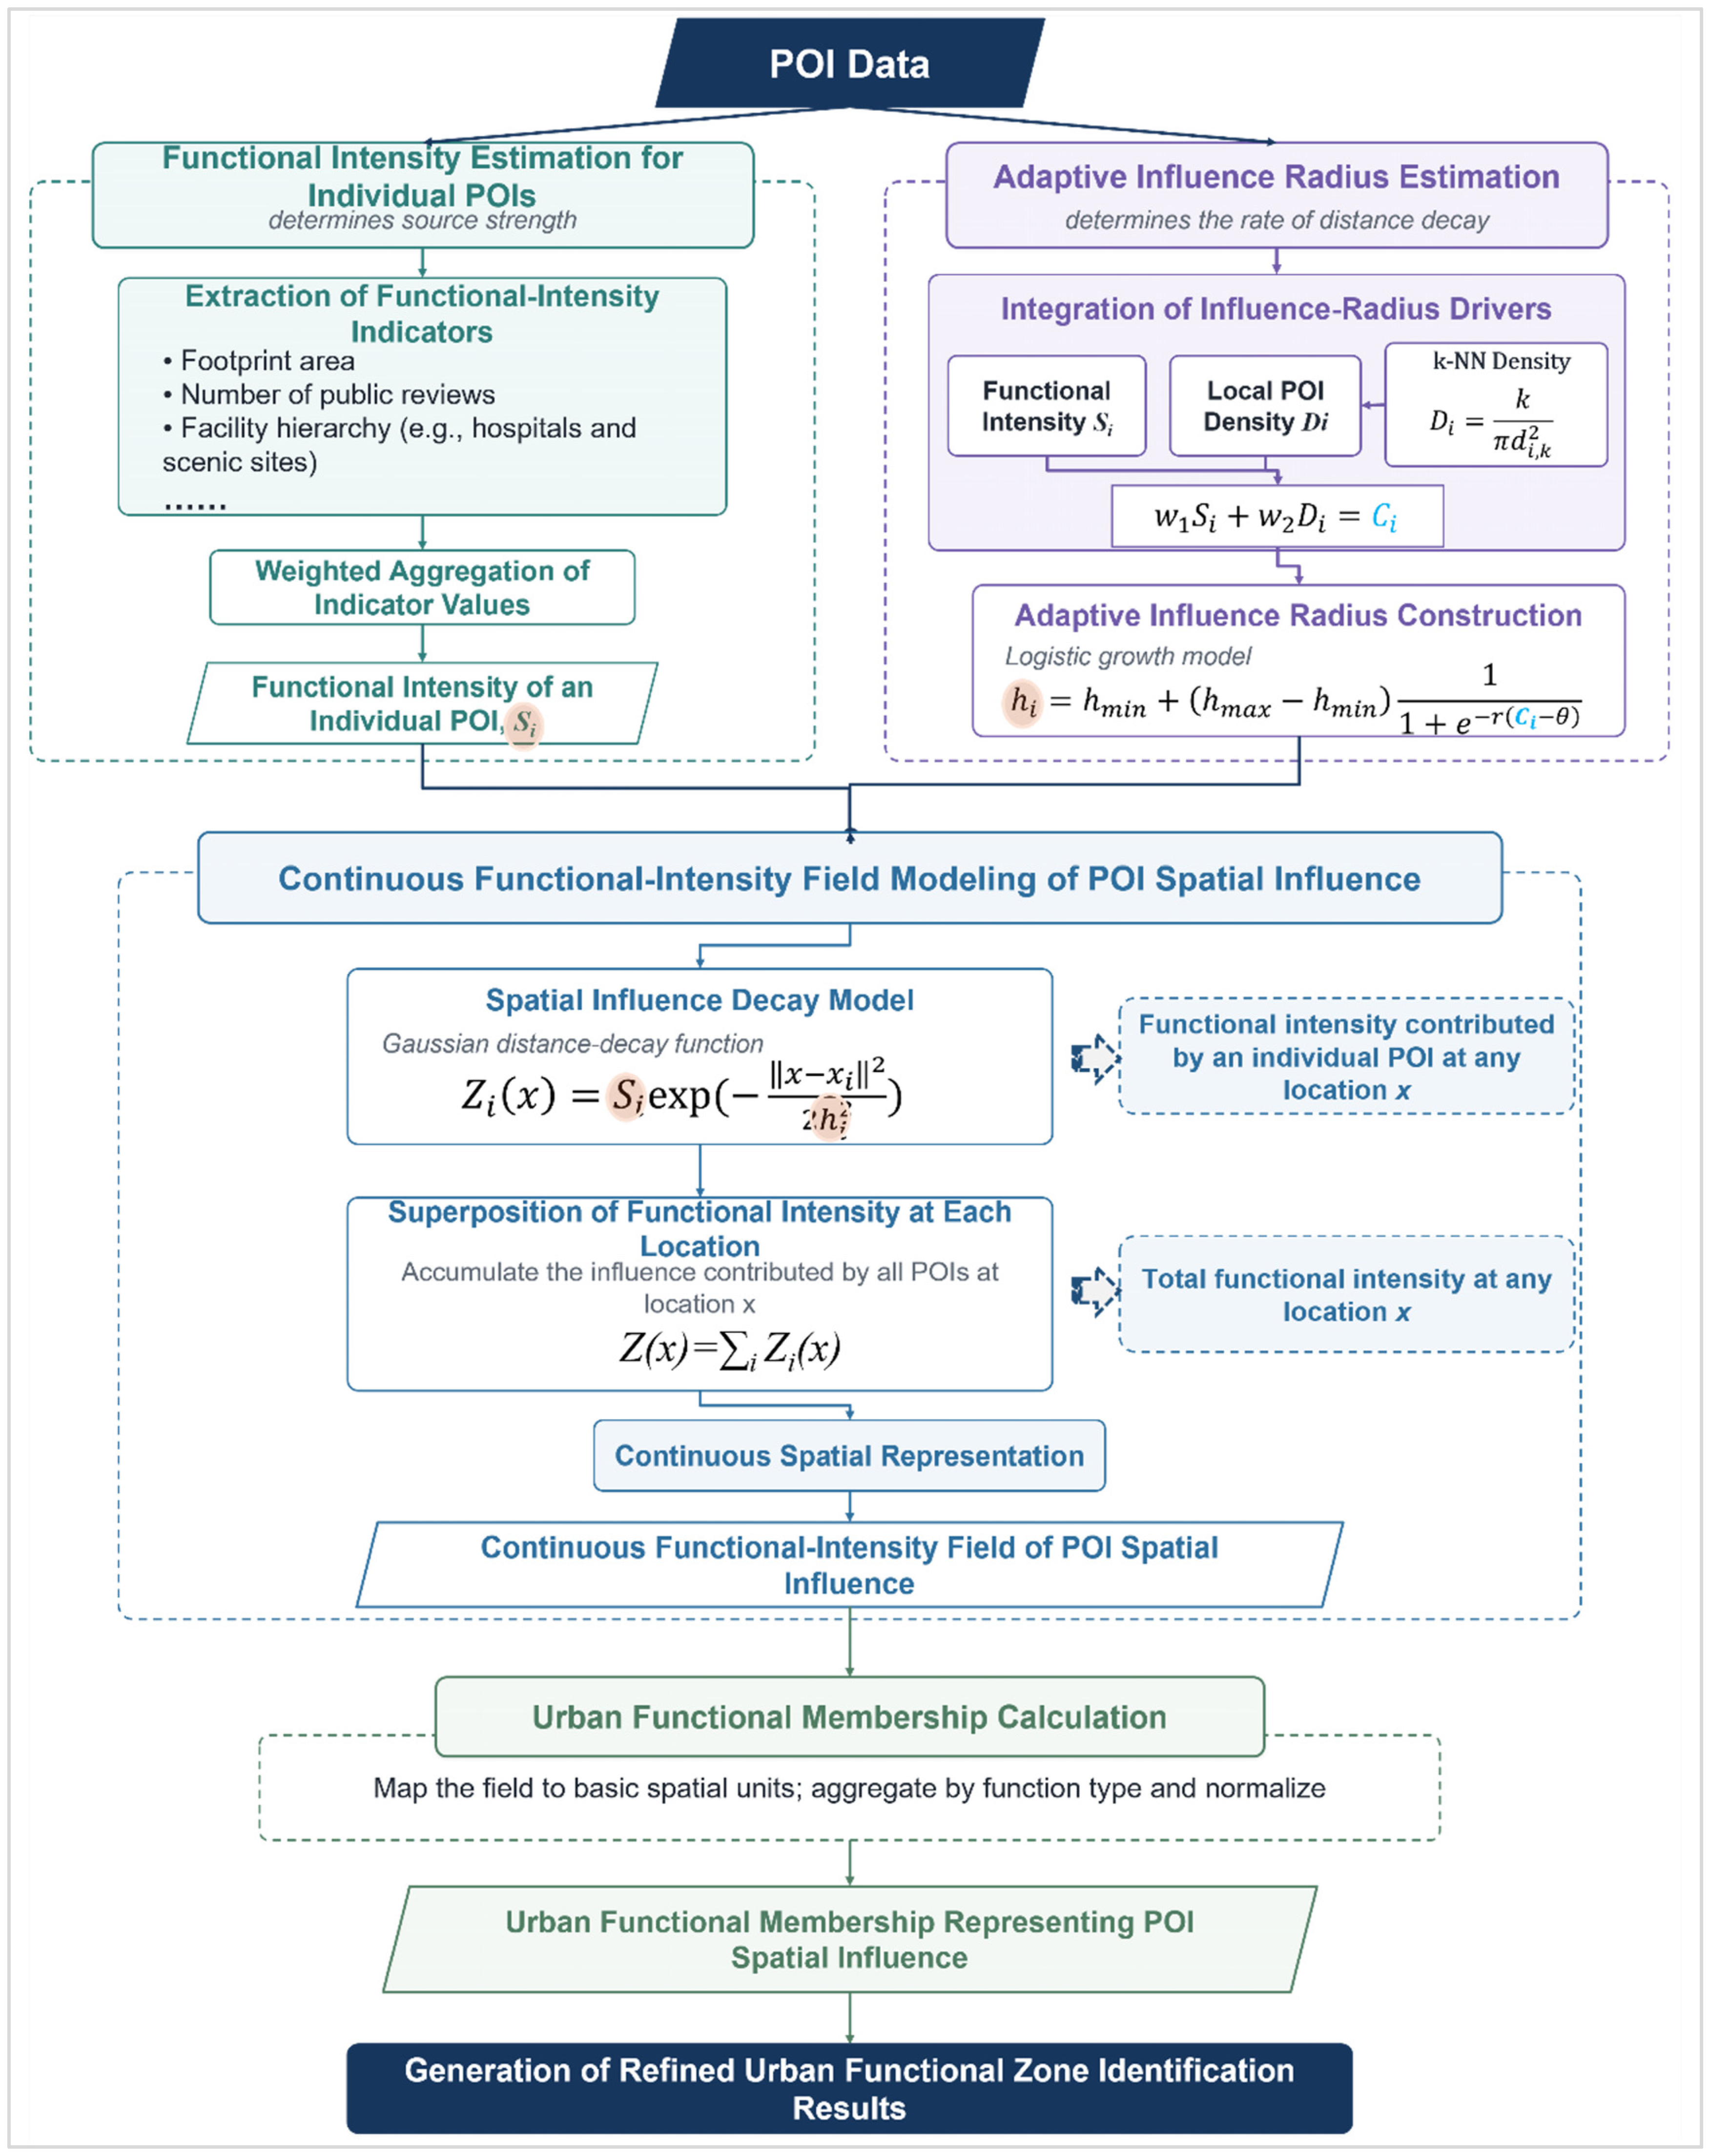
Based on the conceptual framework described above, the proposed methodology comprised five key components: the calculation of individual POI functional intensity, adaptive determination of functional influence ranges, construction of continuous functional intensity fields, calculation of functional membership values, and functional area delineation. Figure 3 summarizes the overall workflow and illustrates the roles and interconnections of the key equations across these components.
Figure 3.
Technical workflow for the refined identification of urban functional areas.
4.1. Calculation of Individual POI Functional Intensity
The calculation of individual POI functional intensity consisted of four steps: construction of a multi-indicator comprehensive evaluation system for POI functional intensity, indicator normalization, determination of indicator weights, and calculation of POI functional intensity.
4.1.1. Construction of a Multi-Indicator Comprehensive Evaluation System for POI Functional Intensity
The evaluation system considered three dimensions: entity, facility, and public recognition. The entity scale is represented by the physical area occupied by a facility and indicates the spatial extent and functional carrying capacity of a POI. Facility grades are applicable to facilities with well-defined administrative or industrial classification systems such as hospitals, scenic attractions, and schools. It is represented using official ranking systems (Grade III Class A hospitals, 5A-level scenic attractions, and key primary or secondary schools), representing differences in service capacity, industry status, and resource allocation. Public recognition is represented by indicators such as the number of user reviews and public ratings, indicating facility vitality and social awareness from the demand perspective. These three dimensions corresponded to physical foundation, authoritative qualification, and social perception, forming a comprehensive evaluation framework for POI functional intensity.
4.1.2. Indicator Normalization
For inverse indicators (specifically, indicators such as school rankings, where smaller numerical values indicate higher quality), a positive transformation was first performed. Subsequently, all indicators were normalized using min–max normalization, and the indicator values were mapped to the interval [0, 1]:
where Xijk and Xijk represent the original and normalized values of the k-th indicator of the i-th POI within the j-th POI category, respectively; min (Xjk) and max (Xjk) represent the minimum and maximum values of the k-th indicator within the j-th POI category, respectively.
4.1.3. Determination of Indicator Weight
This study applied the Analytic Hierarchy Process (AHP) combined with expert scoring [24] to determine the indicator weights. Based on the functional characteristics and service attributes of the different POI categories, five experts with background in urban planning, urban geography, and GIS/spatial analysis conducted pairwise comparisons of the evaluation indicators to construct the corresponding judgement matrices. All matrices passed the consistency test (CR < 0.10), and the detailed weighting schemes are listed in Table 3.
Table 3.
Indicator weight allocation by POI category.
4.1.4. Calculation of POI Functional Intensity
A multi-indicator weighted summation method was used to calculate the functional intensity of the individual POIs. This calculation is expressed as Formula (2):
where Sij represents the functional intensity value of the i-th POI within the j-th POI category, nj represents the total number of indicators for the j-th POI category, and wjk represents the weight of the k-th indicator satisfying .
4.2. Adaptive Delineation of POI Influence Range
The range of influence of POI functional effects is not a fixed empirical value; rather, it is jointly determined by the intrinsic functional intensity of the POI and its degree of spatial agglomeration. Therefore, this section first quantifies the degree of spatial agglomeration of individual POIs, integrates the two driving factors, and generates adaptive influence radii using a logistic model.
4.2.1. Calculation of POI Spatial Agglomeration
This study applied the KNN algorithm to calculate the degree of spatial agglomeration of individual POIs [25]. Let dij,k represents the Euclidean distance between the i-th POI in the j-th category and the k-th nearest POI in the same category. The spatial density is calculated as follows:
where Dij represents the number of POIs per unit area within the same category. A larger Dij value indicates a higher degree of spatial agglomeration in the corresponding POI. In this study, k was set to 5 based on preliminary sensitivity tests using k = 3, 5, 7 and 10. To eliminate differences in the measurement scale and category-specific density variations, Dij was further normalized within each POI category according to Equation (1), resulting in the standardized agglomeration index .
4.2.2. Construction of the Adaptive Influence Radius Model
Different POI categories exhibit fundamentally different characteristics in terms of functional positioning and spatial interaction mechanisms. Consequently, the contributions of intrinsic functional intensity and spatial agglomeration to the range of influence vary among the different POI categories. For example, high-level public service facilities such as government, healthcare, and educational institutions provide scarce, specialized, and relatively irreplaceable services. Residents are generally willing to travel longer distances with clear purposes to access these services; therefore, the functional intensity of such POIs plays a more important role in determining their influence range. By contrast, the range of influence of commercial service POIs is more strongly affected by spatial agglomeration because commercial clusters frequently enhance collective attractiveness and accessibility. Accordingly, category-specific weights were assigned to different POI types, and a comprehensive driving index was calculated:
In Equation (4), Sij and represent the intrinsic functional intensity and normalized clustering degree of the POI, respectively. The coefficients w1j and w2j represent the corresponding weights, satisfying the constraint w1j + w2j = 1. The category-specific setting of w1j and w2j are provided in Section S1 of the Supplementary Material (see Supplementary S1), and their downstream influence is further examined through perturbation of the resulting adaptive influence radius in Section 7.2.
Based on the composite driving index, the influence radius of each POI is modeled adaptively. The “influence radius” represents the spatial scale of a POI’s function influence, controlling its distance decay and effective extent rather than defining a strict cutoff. To prevent an excessively rapid linear expansion or instability resulting from extreme values as the composite driving index increases, a nonlinear logistic growth function was used to construct the adaptive influence radius [26].
where hij represent the adaptive influence radius of the POI. The lower and upper bounds, hmin,j and hmax,j, are defined as the 25th and 75th percentiles, respectively, of the k-nearest-neighbor distances among POIs of the same category. This data-driven parameterization minimizes the reliance on subjective assumptions. The parameter r controls the growth rate of the Logistic function and determines the sensitivity of the influence radius to changes in the composite driving index, while θ represents the threshold parameter. As Cij increases, the adaptive influence radius increases nonlinearly from hmin,j and asymptotically approaches hmax,j. The inflection-point parameter θ was set to 0.5, such that a moderate composite driving level corresponds to the midpoint between the lower and upper bounds of the influence radius. The growth-rate parameter r was set to 4 to ensure a sufficiently pronounced but smooth nonlinear change in the influence radius with the composite driving index, thereby preventing the response curve from being either overly flat or nearly abrupt. Because both θ and r affect subsequent calculations through hij, the robustness of the resulting adaptive influence radius was further evaluated through parameter perturbation analysis (Section 7.2).
4.3. Continuous Functional Intensity Field Modeling Based on the Spatial Effects of POIs
A continuous functional intensity field is fundamentally generated by the distance decay of the functional influence of individual POIs combined with the cumulative spatial effects of multiple POIs belonging to the same functional category. Therefore, this study employed a Gaussian distance-decay function as the spatial influence model to quantify the functional intensity contributed by the i-th POI at an arbitrary spatial location x [27]:
where Zij(x) represents the functional influence intensity of the POI at spatial location x; xij represents the geographic location of the POI; ∥x − xij∥ is the Euclidean distance between the arbitrary location x and the POI location xij; and hij is the adaptive influence radius of the POI. The overall intensity of the j-th functional category at location x is then obtained by linearly superimposing the spatial influences of all POIs belonging to the same category:
In Equation (6), nj represents the total number of POIs belonging to the j-th category. By calculating Zj(x) for all the spatial locations within the study area, a continuous functional intensity field for the j-th urban function can be generated.
4.4. Calculation of Urban Functional Membership
Urban functional membership was obtained by aggregating and normalizing the continuous functional intensity of each POI category within each spatial unit. A 100 m × 100 m regular grid was used as the basic spatial unit. This scale is used for regular sampling of the continuous functional field, balancing spatial detail and computational efficiency rather than defining functional boundaries. It also preserves continuous decay characteristics of urban functional intensity and gradual transition of functional boundaries, while ensuring the consistency and comparability of functional representations across different regions.
For each spatial unit, the functional intensity at the grid centroid was used to represent the overall functional intensity of the entire grid cell. The grid centroid serves as a standardized sampling location for the continuous functional field, ensuring consistency across cells rather than assuming within-cell functional homogeneity. Mixed functions are represented by multiple memberships, while transitional areas are identified using neighborhood relationships. Let the centroid coordinates of the p-th grid cell be (xp,yp). The intensity of the j-th function within this grid cell is expressed as Vpj = Zj(xp,yp), To eliminate differences in magnitude among different functional intensity fields, the intensity values were normalized according to Equation (1), yielding the standardized value . The membership of the p-th spatial unit to the j-th urban function was then calculated as follows:
where q represents the total number of functional urban categories. The resulting membership values satisfy the constraints 0 ≤ μpj ≤ 1 and . The membership values of all grid cells collectively form a two-dimensional spatial unit–function membership matrix. Each row of the matrix represents the membership of a grid cell to different urban functions, and each column describes the continuous spatial distribution of a particular function across the study area.
4.5. Functional Type Classification
Using the functional membership matrix and grid adjacency relationship as inputs, the functional dominance, functional mixing entropy, and neighborhood structural similarity of each grid cell were calculated. Each cell was then classified as a dominant, mixed, or transitional unit, according to the corresponding rules. If a unit had a distinctly dominant function, it was classified as a typical dominant functional area. If, in addition to the dominant function, there was still a secondary function with relatively high membership, it was classified as a mixed functional area. The remaining basic units, whose functional memberships were similar and were located at the boundaries between different functions, were classified as transitional functional areas. Adjacent units were then aggregated according to spatial adjacency and functional structural similarity, followed by boundary refinement and small-patch processing to form typical dominant functional areas, mixed functional areas, and functional boundary transition areas. Calculations of functional dominance and functional mixing entropy, spatial adjacency relationships, their associated thresholds, and the detailed classification rules are provided in Supplementary S2.
5. Experimental Design
To verify the method’s ability to identify dominant functions and represent the spatial influence of POIs and the refined structure of urban functions, two experiments were designed.
Experiment 1: Validation of the effectiveness of dominant urban function identification. This experiment used two indicators, completeness and consistency, to comprehensively evaluate the ability of the method to identify dominant urban functions. Completeness measures the extent to which the functional distribution represented by the reference data is successfully identified by the proposed method. Consistency measures the extent to which the identified results are consistent with the spatial distribution of the urban functions represented by the reference data. Therefore, this study applied the maximum membership principle to determine the dominant function of each grid cell, forming a discrete dominant functional zoning map. Land use parcels from the Third National Land Survey were used as external references, and the completeness and consistency of the identification results were calculated separately through a spatial overlay:
where Fj is the dominant functional area identified in the jth category. Lj represents the corresponding existing land use area. R0j represents the proportion of the reference area that was successfully identified. A higher value indicates greater completeness of identification.
represents the proportion of the identified area that is consistent with the reference area. A higher value indicates a higher degree of spatial agreement between the two.
Experiment 2: Validation of the representation capability of spatial functional influence and refined expression. This experiment included a public perception correlation test and the validation of practical rationality in typical areas.
First, a public perception index Pj(x) was constructed using questionnaire data from 50 survey locations and was analyzed using Spearman rank correlation with the functional membership μj(x) calculated by the proposed model at the corresponding locations. A significant positive correlation between the two indicates that the method can effectively represent spatial variation in functional intensity. The public perception index was calculated as follows:
where n is the total number of valid questionnaires collected at survey location x. If respondent k identifies the j-th functional category, then Mjk = 1; otherwise, Mjk = 0. If the respondent further identified the corresponding geographic entity, then Njk = 1; otherwise, Njk = 0.
Second, to validate the capability of the refined representation, representative case areas were selected from the identification results. A comprehensive interpretation was conducted by combining remote sensing images, street-view photographs, mapped facilities, and the surrounding functional distribution, with particular attention focused on verifying whether the identified typical dominant functional areas, mixed functional areas, transitional functional areas, and characteristics of functional intensity variation were supported by real-world evidence.
6. Results and Analysis
6.1. Results of Refined Identification of Urban Functional Areas
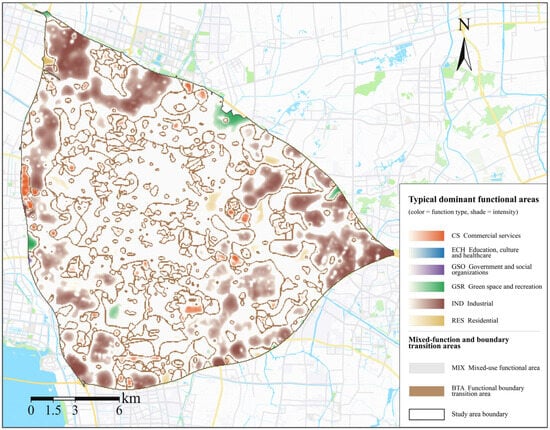
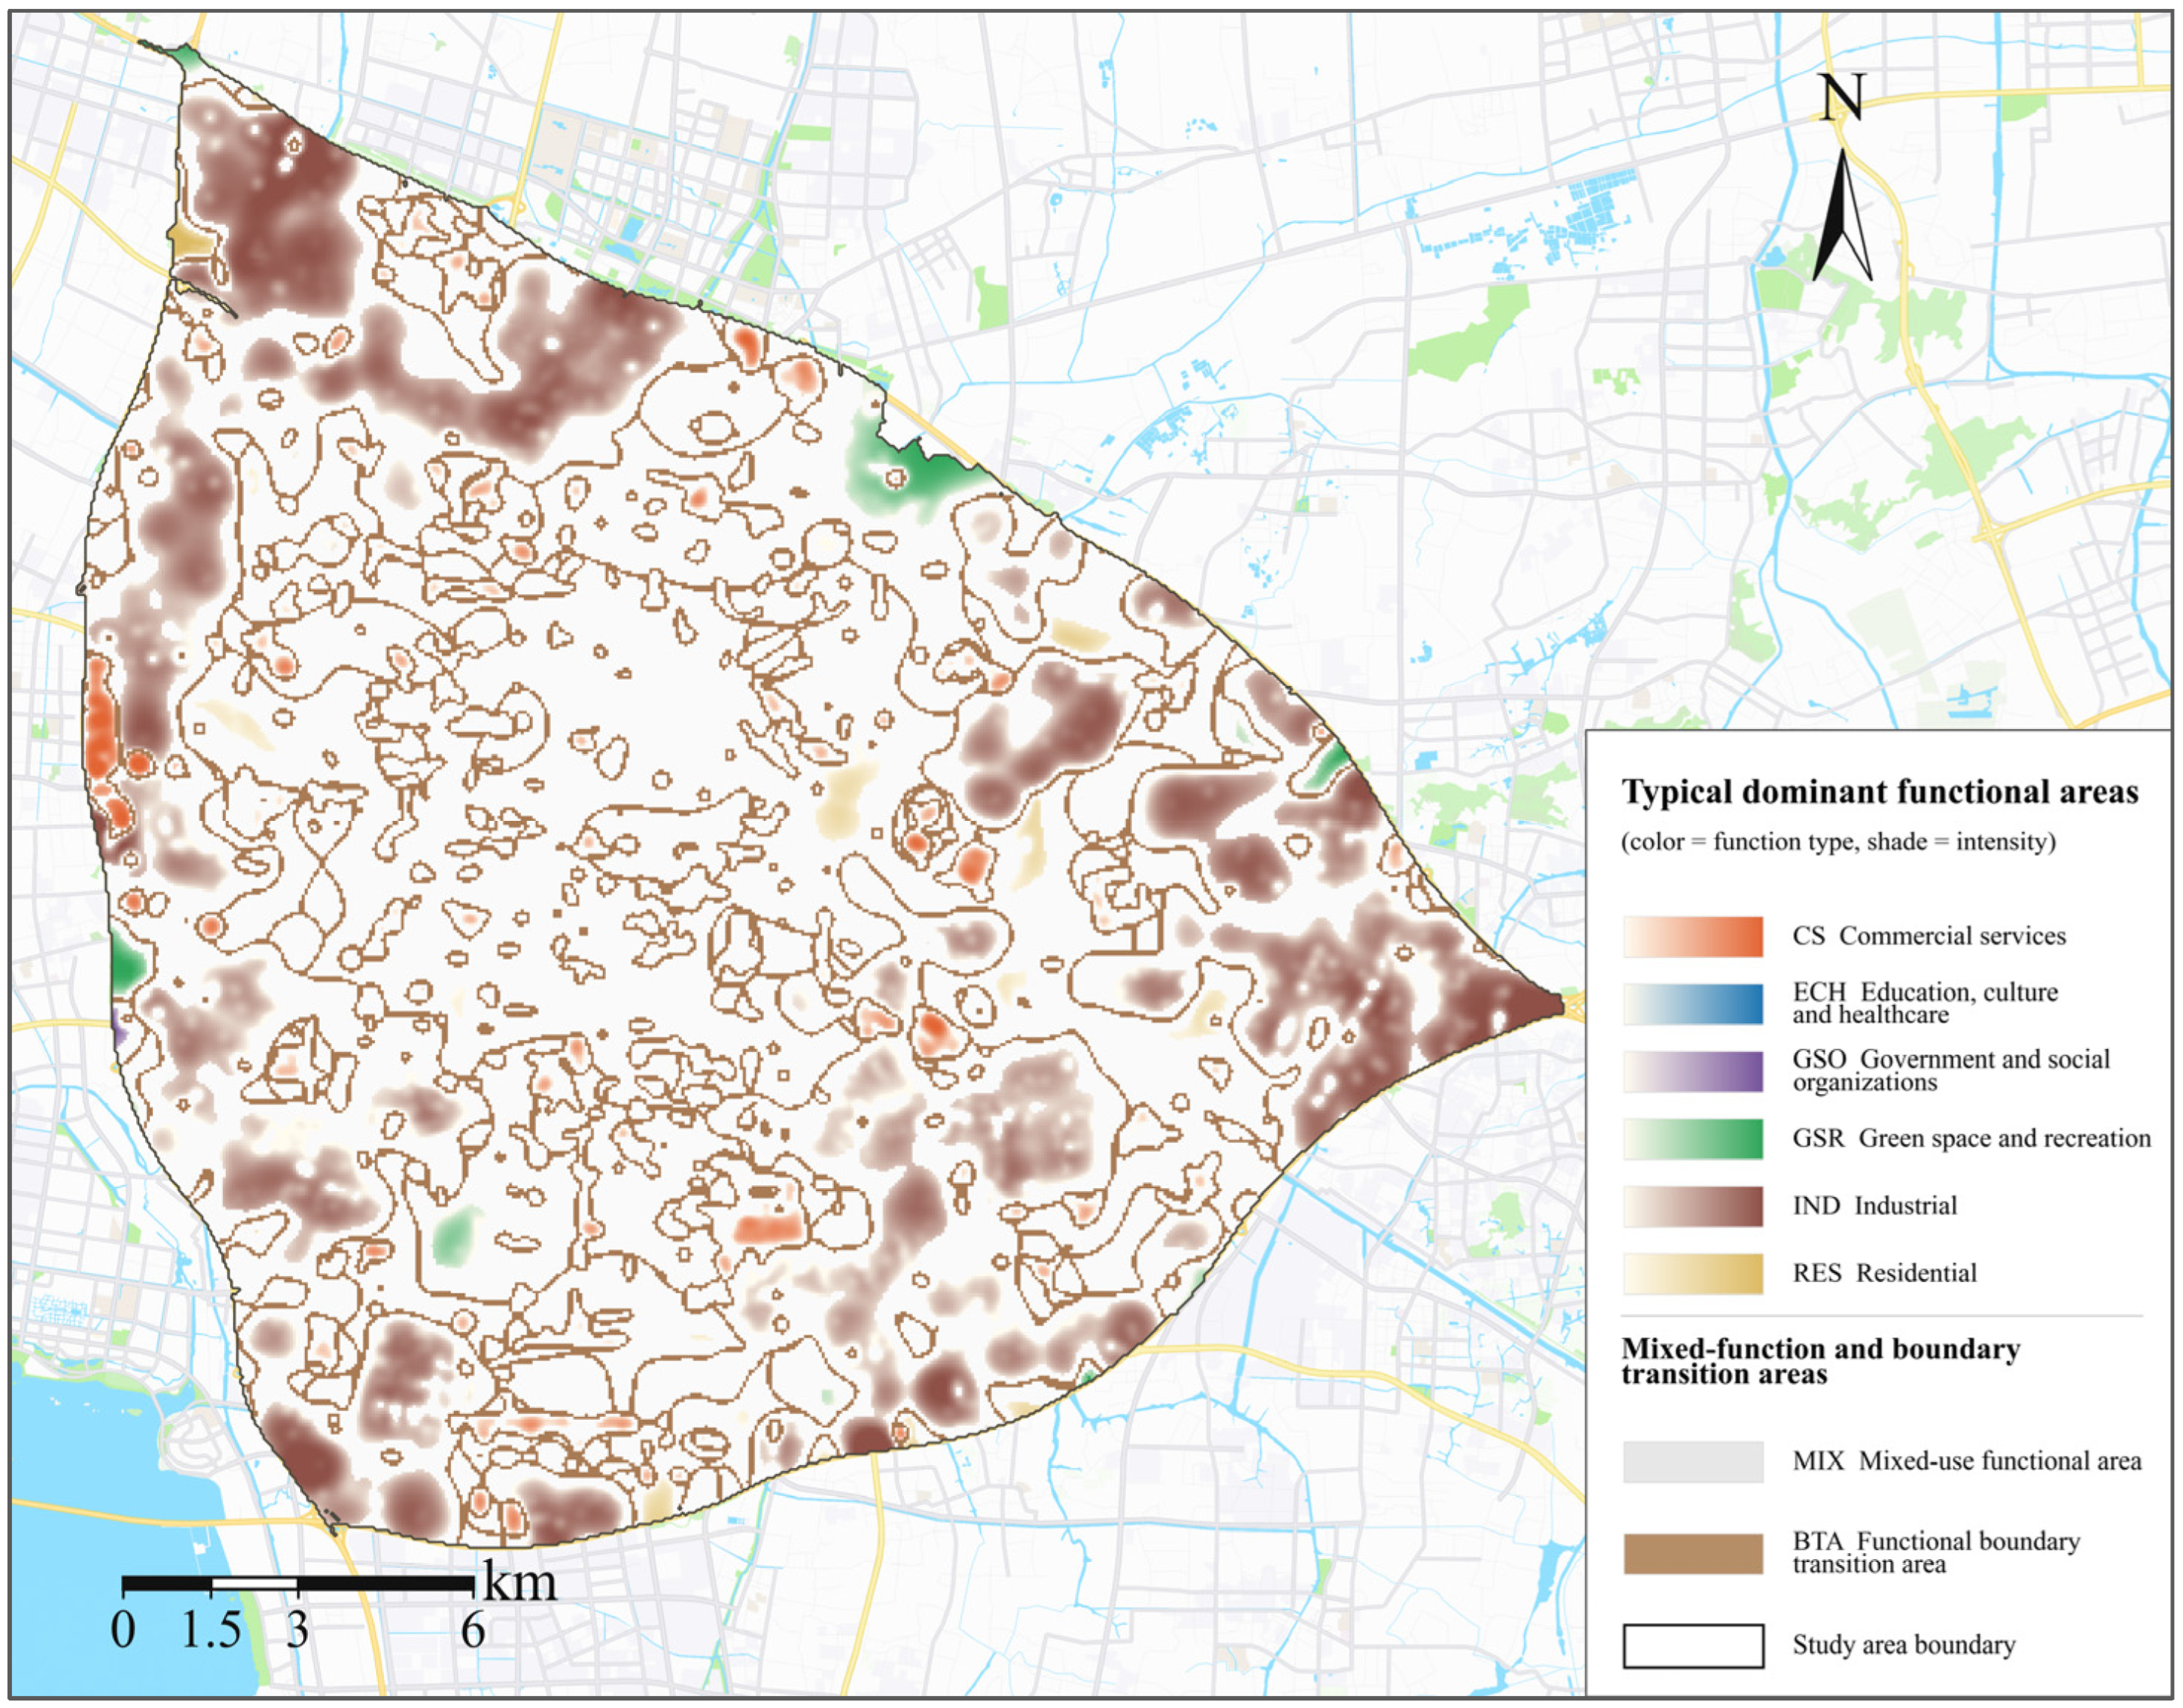
Typical dominant functional areas and their functional intensity distribution: As shown in Figure 4, the study area exhibited an overall spatial structure characterized by ‘industrial concentration on the periphery, mixed functions in the interior, and scattered local dominant functional clusters,’ together with a pattern of ‘high-value core–gradient decay–boundary transition.’ This indicates the overall characteristics of the relatively concentrated production functions on the urban fringe and a high degree of integration between residential and service functions within the urban core.
Figure 4.
Distribution of typical dominant functional areas and their functional intensity.
In terms of the functional layout, mixed-function areas covered a large proportion of the study area and formed the main background of the internal functional distribution, indicating significant spatial overlap and interaction among different functions within the built-up area. The industrially dominant functional areas were relatively large and exhibited distinct peripheral clustering characteristics. In contrast, commercial and service-dominant functional areas were mainly distributed as isolated points or small patches, whereas typically dominant functional areas such as residential areas, green spaces and recreation, science, education, culture, and healthcare, and government and social organizations were mostly embedded within mixed functional areas as dispersed patches.
In terms of functional intensity, all dominant functions decreased from high-value cores toward the surrounding areas and connected with the transitional areas. High-intensity industrial areas were generally distributed as continuous blocks or belts with relatively wide spheres of influence, whereas high-intensity commercial and service cores were more point-like, decayed more rapidly, and exhibited weaker continuity, indicating the differences among functional types in terms of clustering intensity, influence range, and spatial continuity.
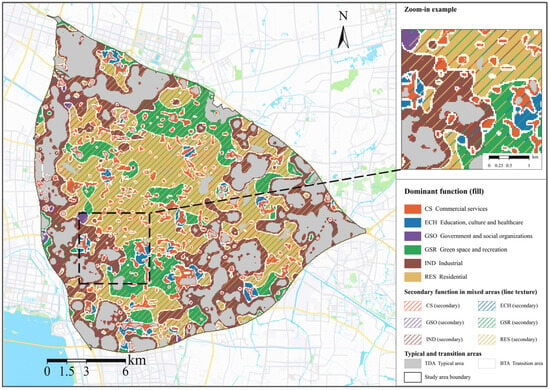
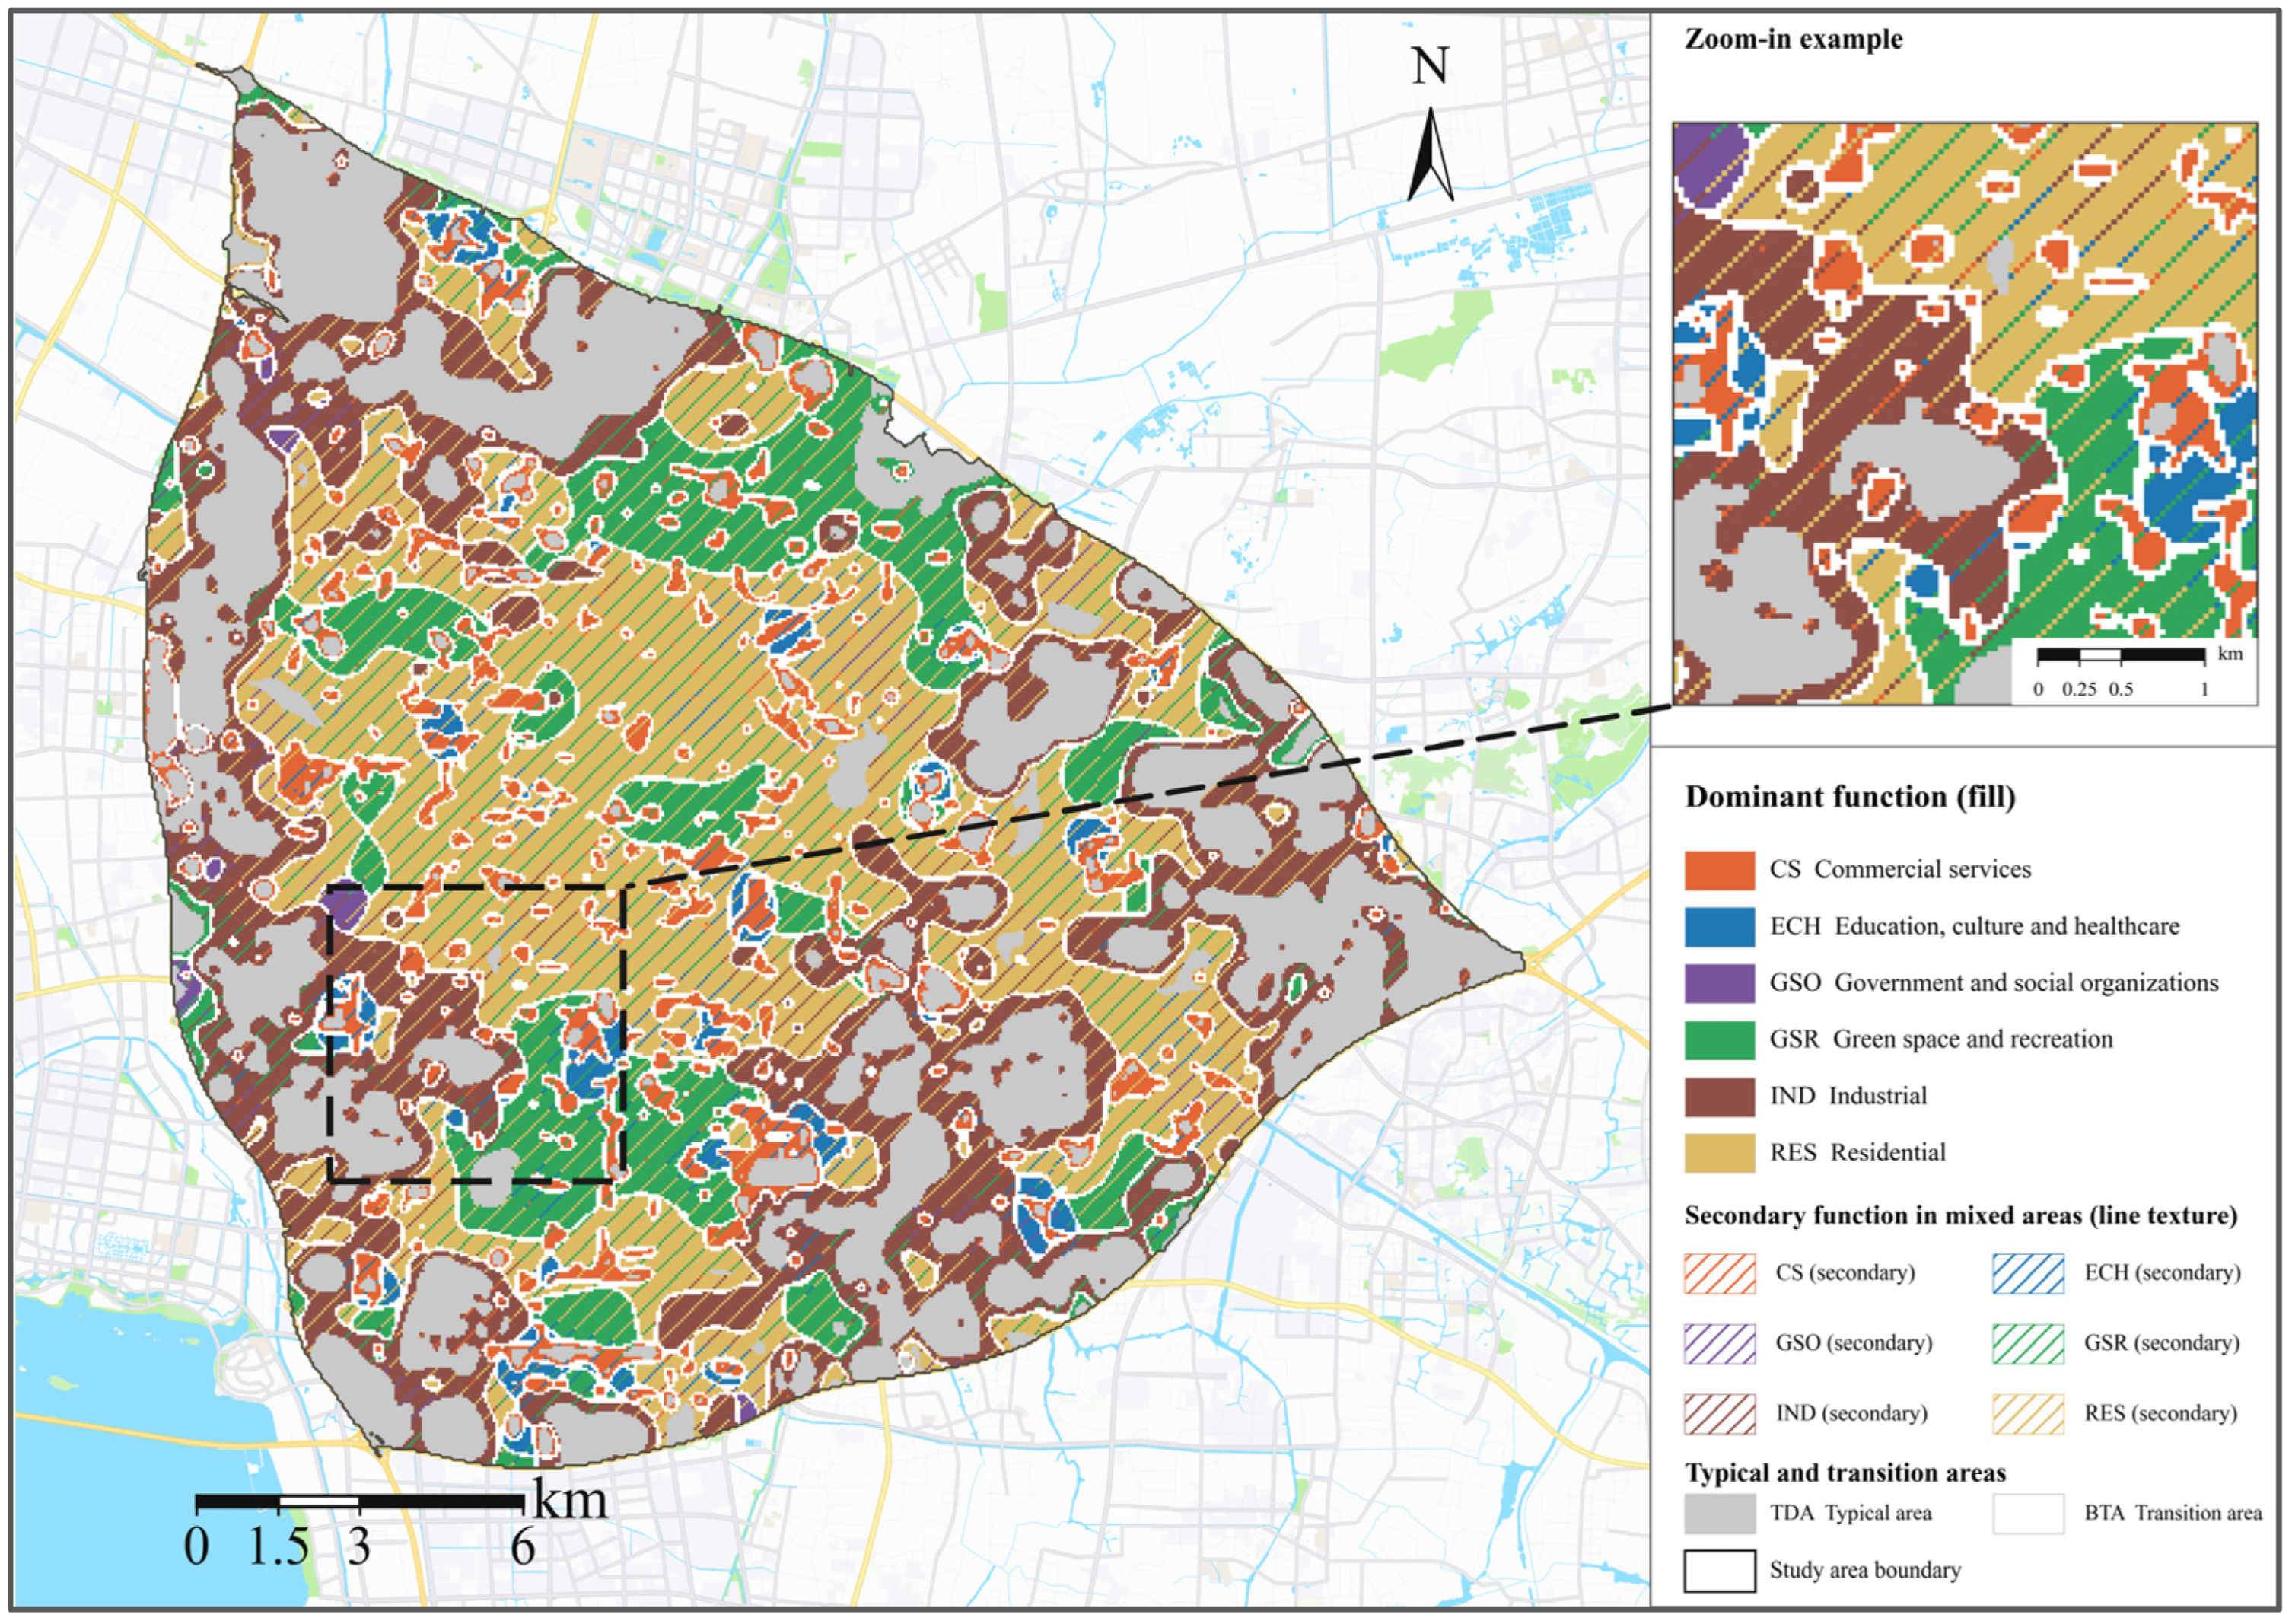
Mixed functional areas and functional boundary transitional areas: As shown in Figure 5, the mixed functional areas are important components of the study area. Mixed relationships among residential, commercial and service, and green space and recreational functions were common. In contrast, science, education, culture, and healthcare, together with government and social organization functions, were mostly embedded within these areas as small and scattered patches. This indicates that residential, consumption, public service, and recreational activities within the city are not spatially separated but overlap at relatively fine spatial scales and jointly constitute residents’ daily activity spaces.
Figure 5.
Mixed functional areas and functional boundary transitional areas (block textures represent the dominant function, while line textures represent the secondary function). Note: TDA, typical dominant functional area.
In terms of the hierarchy among functions, the combination of residential and green spaces and recreational functions was the most prominent, with their dominant and secondary roles changing according to spatial location, indicating their strong spatial relationship. Mixed functional areas dominated by industry commonly included secondary functions, such as residential use, and were mainly located in the transition areas between peripheral industrial clusters and inner built-up areas, demonstrating the spatial linkage between production and living functions. Although commercial and service, science, education, culture, healthcare, and government and social organization functions rarely form large continuous dominant functional areas, they can still be embedded within background functional areas such as residential and green spaces and recreation as locally dominant or secondary functions, indicating that these functions are not weak but primarily exert their influence at the local spatial scale.
Functional boundary transitional areas were mainly distributed in belt-shaped, ring-shaped, or network-shaped patterns along the edges of the typical dominant and mixed functional areas. They were particularly concentrated in areas where functional patches were fragmented, and different functional types were interwoven, and were rarely observed within large industrial patches with relatively concentrated functions. Notably, functional boundary transitional areas do not represent unidentified or functionless areas. Rather, they are spaces where the membership degrees of adjacent functions are similar, and the dominant functional relationship changes gradually. Their formation indicates the spatial continuity of the urban functional influence.
6.2. Method Performance in Identifying Dominant Functions
Table 4 shows that the completeness of the identified dominant functional areas was generally high. Except for the green space and recreation function, all functional categories exceeded 77%, with government and social organizations, residential, and science, education, culture and healthcare reaching 90.6%, 85.5% and 81.2%, respectively. This indicates that the proposed method can comprehensively cover the corresponding land-use areas and has a strong ability to identify the basic spatial pattern of major urban functions. In contrast, consistency varied considerably among different functional categories. Industrial and residential functions achieved 38.1% and 34.1%, respectively, which were significantly higher than those of commercial and service, green space and recreation, science, education, culture and healthcare, and government and social organization functions. Overall, the results exhibited the characteristic of ‘high completeness but relatively low consistency’.
Table 4.
Completeness and consistency of the method in identifying the functional distribution represented by land-use parcels.
This relatively low consistency should not be attributed to identification errors. However, it indicates the difference between the functional identification results and land use parcel data in terms of the spatial objects they represent. Land use data primarily record the land use type of each parcel and its physical boundaries, whereas the results of this study considered the functional influence of facilities on the surrounding space. Therefore, the functional extent identified may extend beyond the corresponding land use parcels. On the one hand, such differences may partly reflect genuine functional spillover, but they also indicate some overestimation of the modeled influence range. This is particularly relevant for commercial and services; education, culture and healthcare; and green space and recreation functions, whose influence may extend beyond the parcels in which the facilities are located. At the same time, because the model propagates facility influence through an adaptive radius, an excessively large radius may lead to over expansion of the identified function extent, especially for categories characterized by high completeness but low consistency, such as government and social organization functions.
6.3. Analysis of the Practical Validity of Spatial Influence and Refined Representation
6.3.1. Ability to Represent Spatial Influence
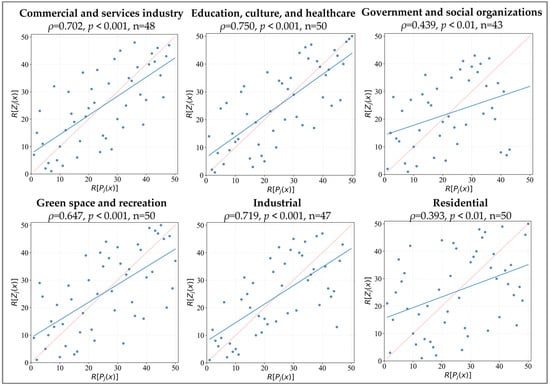
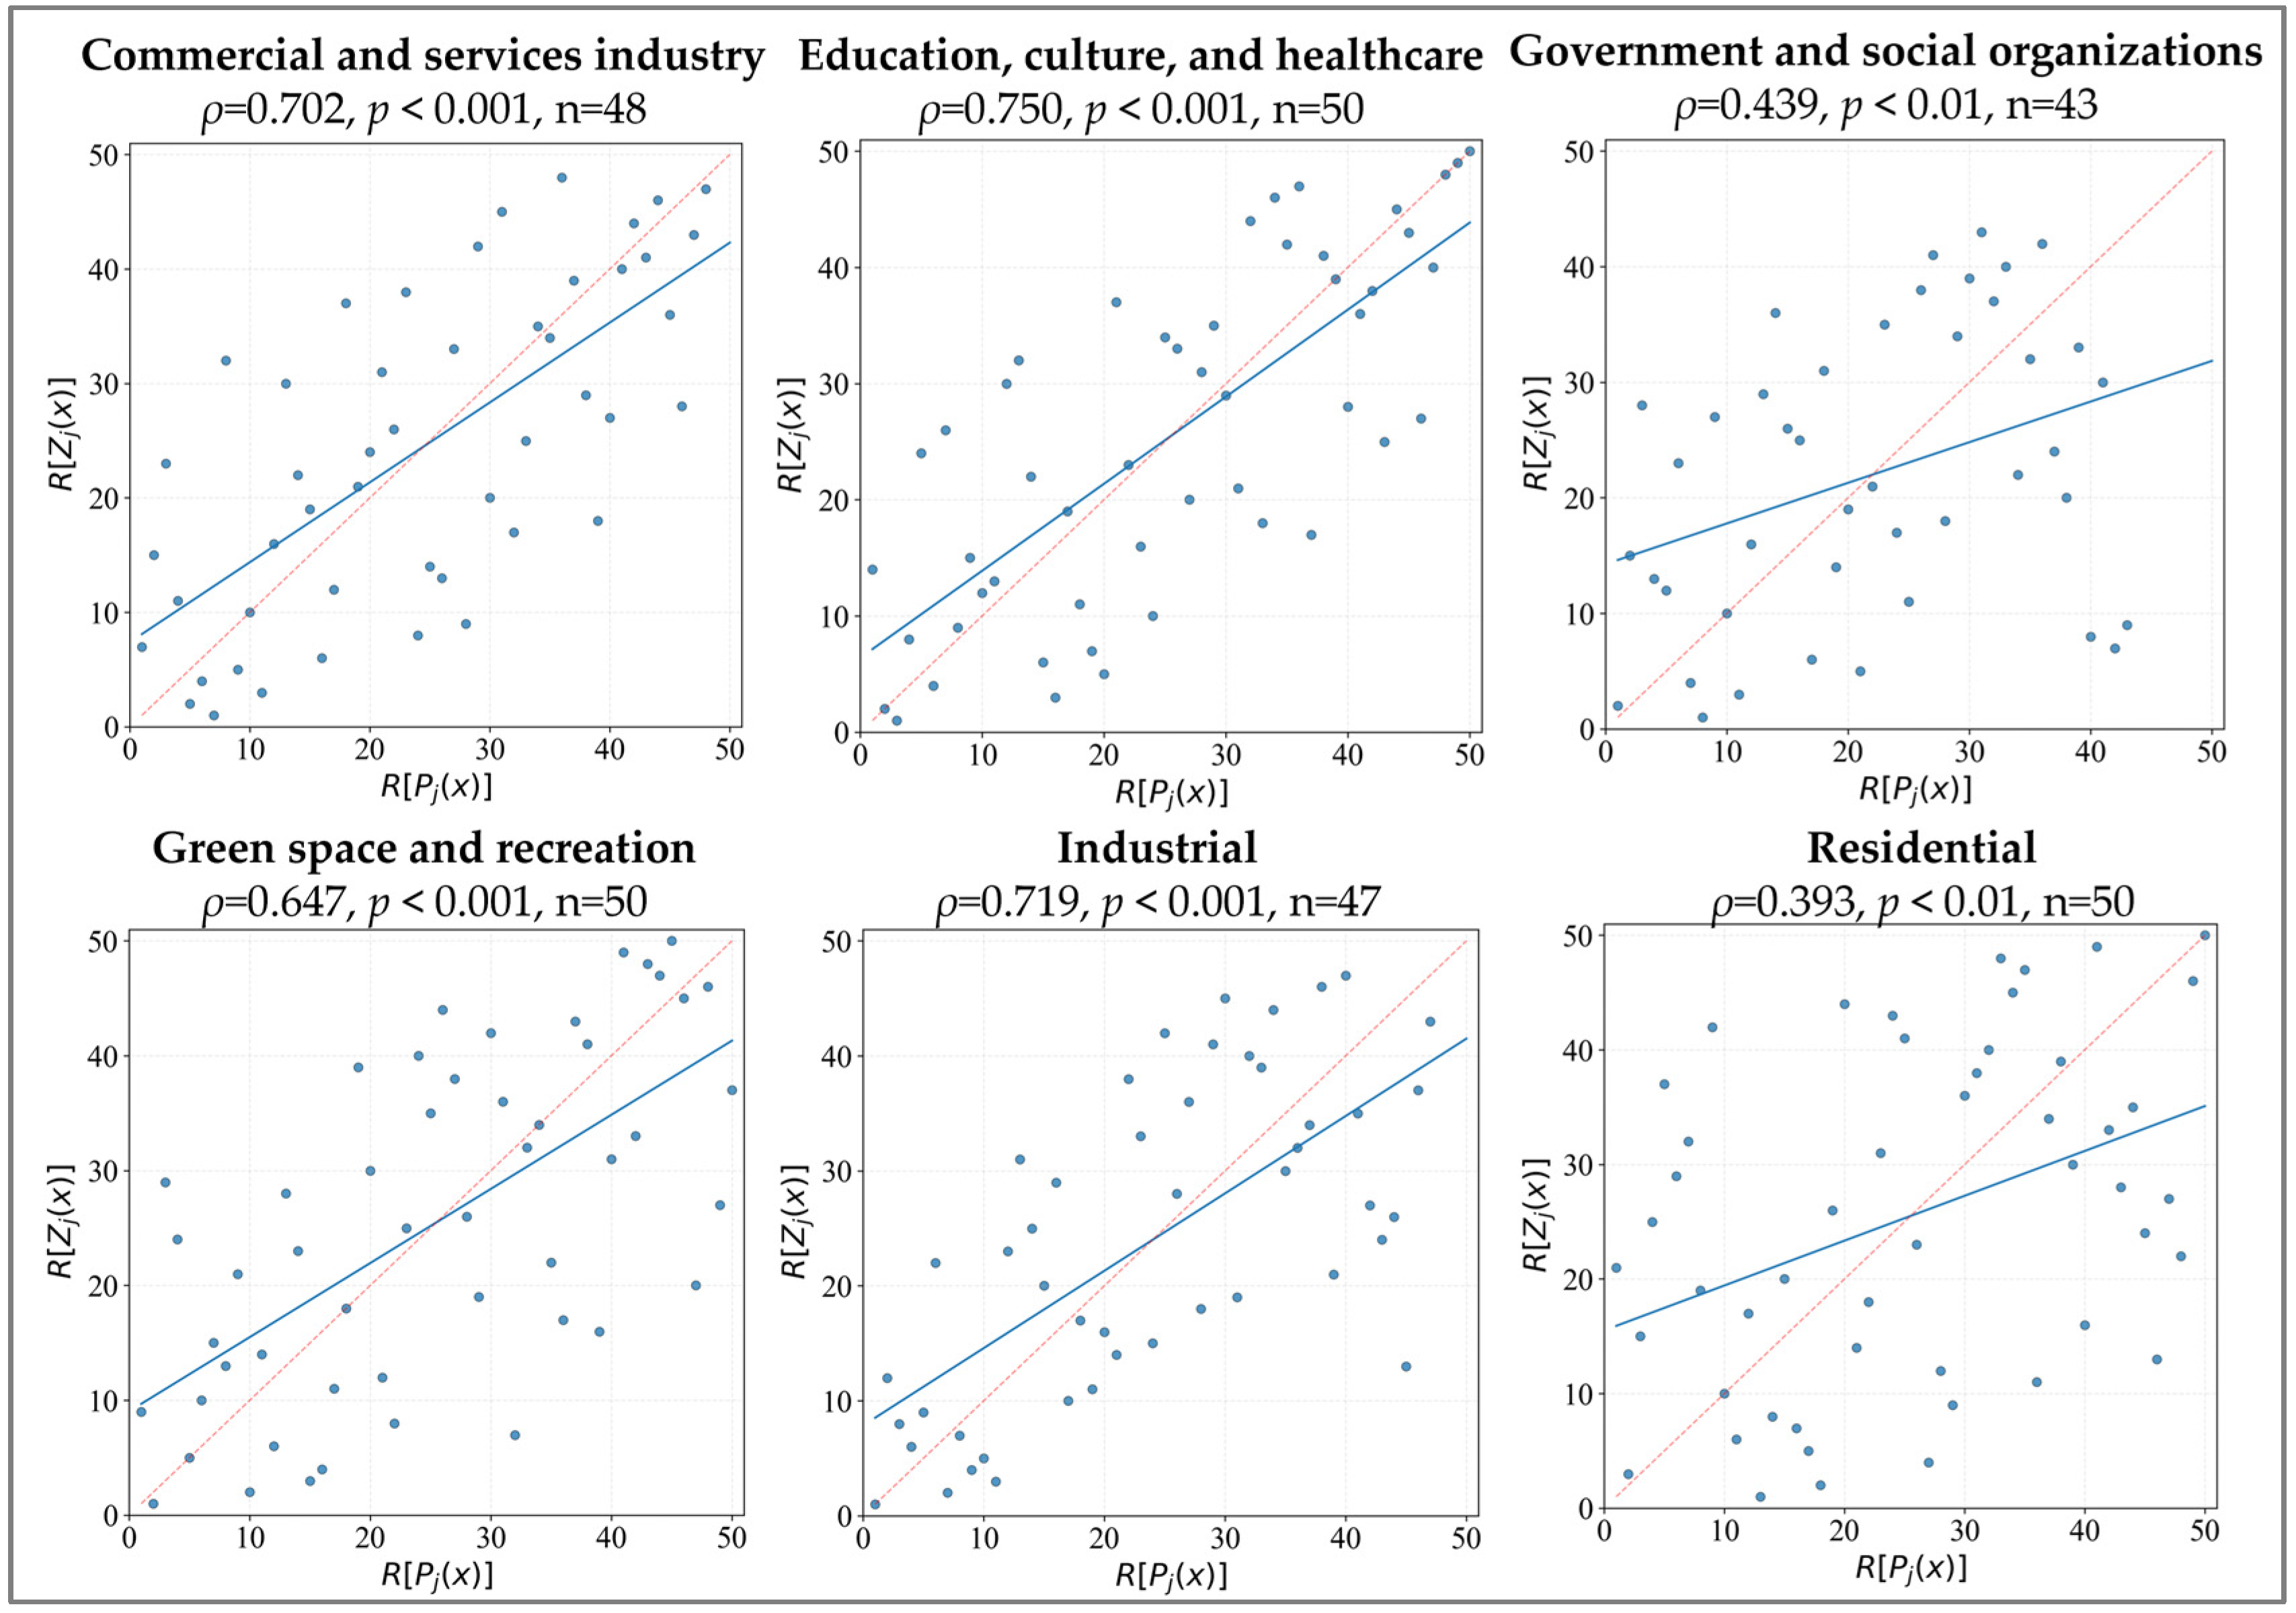
The results shown in Figure 6 indicate that the proposed method can capture continuous variation in urban functional identification to a certain extent. Commercial and services industry, education, culture, and healthcare, green space and recreation, and industrial functions showed relatively strong correlations, with Spearman coefficients of 0.702, 0.750, 0.647, and 0.719, respectively, all statistically significant. This suggests that locations with higher public perception generally also exhibit higher model-derived functional membership, indicating good agreement in spatial distribution trend.
Figure 6.
Spearman rank correlation analysis between functional membership and the public perception index. Note: The horizontal and vertical axes represent the ranks of the public perception index Pj(x) and the functional membership Zj(x), respectively. ρ, p, and n represent the Spearman rank correlation coefficient, significance level, and effective sample size, respectively. Effective sample sizes n vary across functions because some respondents did not provide valid identification for all functions, and only valid paired observations were included.
The weaker correlations for government and social organizations and residential functions do not necessarily imply limited model performance, but may reflect differences in public perceptibility among functional types. Commercial and service, education, culture and healthcare, and green space and recreation functions are generally more salient because facilities such as shopping malls, schools, hospitals are physically visible, frequently used, and associated with clear service targets. In contrast, government and social organization functions are more task-oriented and less frequently experienced, while residential functions are widely embedded in everyday living environments and are less spatially distinctive. These differences may explain their weaker consistency with the public perception index. Therefore, this does not imply limited overall effectiveness of the proposed method; rather, it indicates that public perception reflects only one aspect of functional spatial influence and does not represent its full extent and intensity.
6.3.2. Practical Validity of Refined Representation
To validate the three identification types, representative cases were selected from dominant, mixed, and boundary-transition areas, prioritizing locations with clearly identifiable real-world features and functional patterns for comparison with the model results.
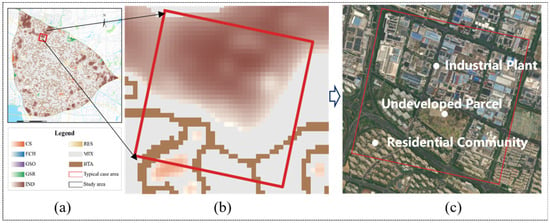
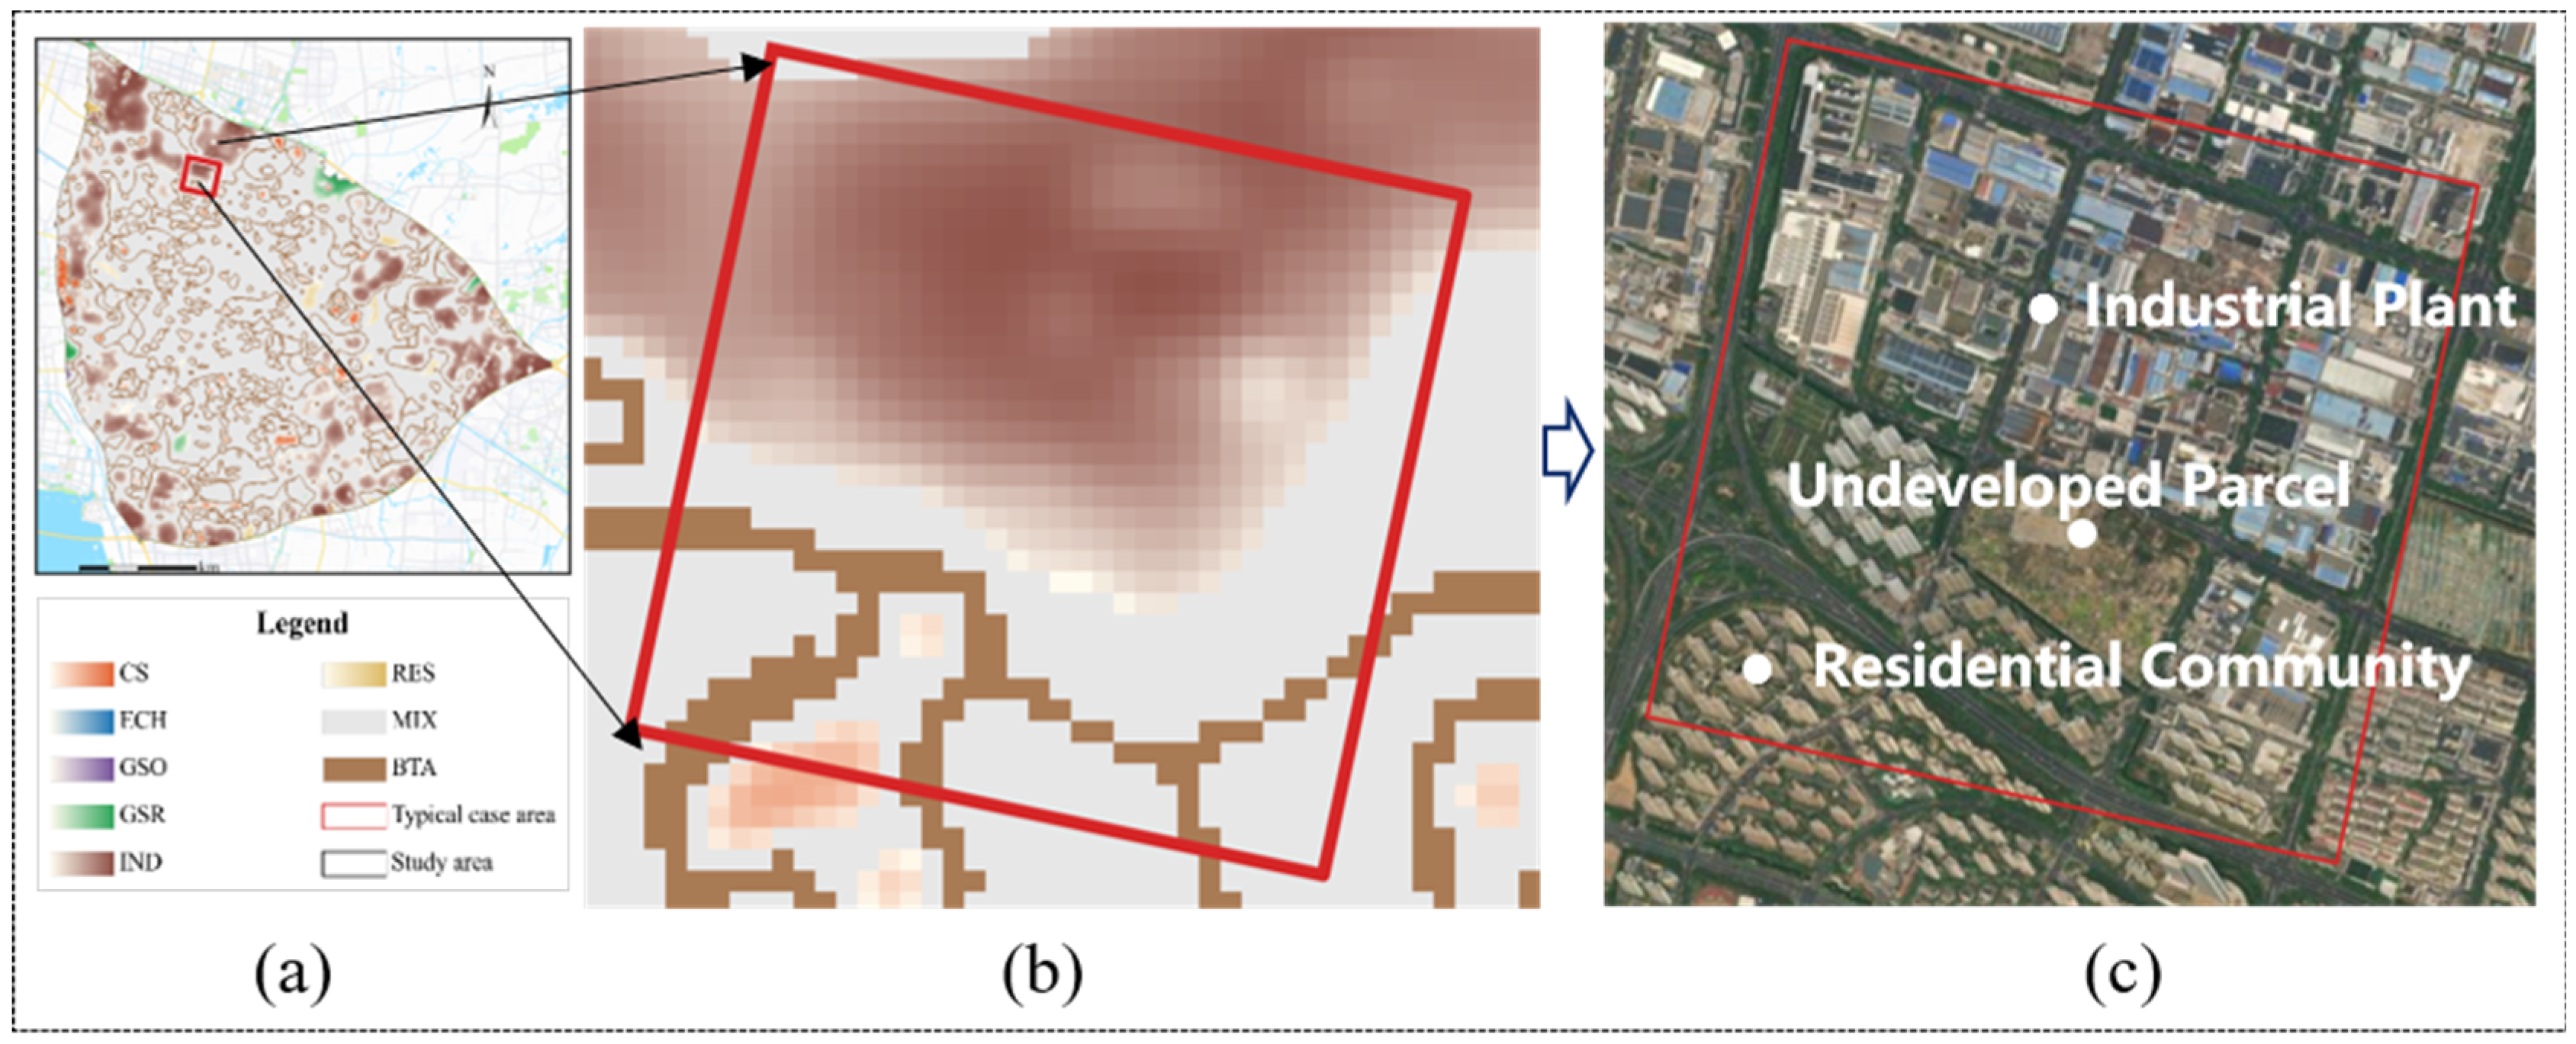
Validation results for typical dominant functional areas: An industrial dominant area was selected for validation (Figure 7). In terms of functional spatial distribution, the northern and central parts of the case study area formed relatively continuous industrially dominant functional areas, which generally corresponded to the dense factory areas shown in the remote sensing images. In the southern and southwestern regions, as the number of factories decreased and residential functions increased, industrial dominance gradually weakened and transitioned to mixed functional areas dominated by industry. In terms of changes in functional intensity, industrial functional intensity also decreased from the dense factory core toward the surrounding areas. The extent of high-intensity areas, direction of decay, and spatial gradient were generally consistent with the actual distribution of physical features, indicating that the identification results can reasonably represent the spatial patterns of typical dominant functions, internal variations in intensity, and their transitional relationships with other functions.
Figure 7.
Validation results for the typical dominant functional area case study: (a) Location of the case area; (b) Functional identification and intensity distribution; (c) Remote sensing image.
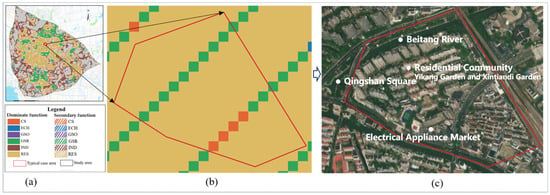
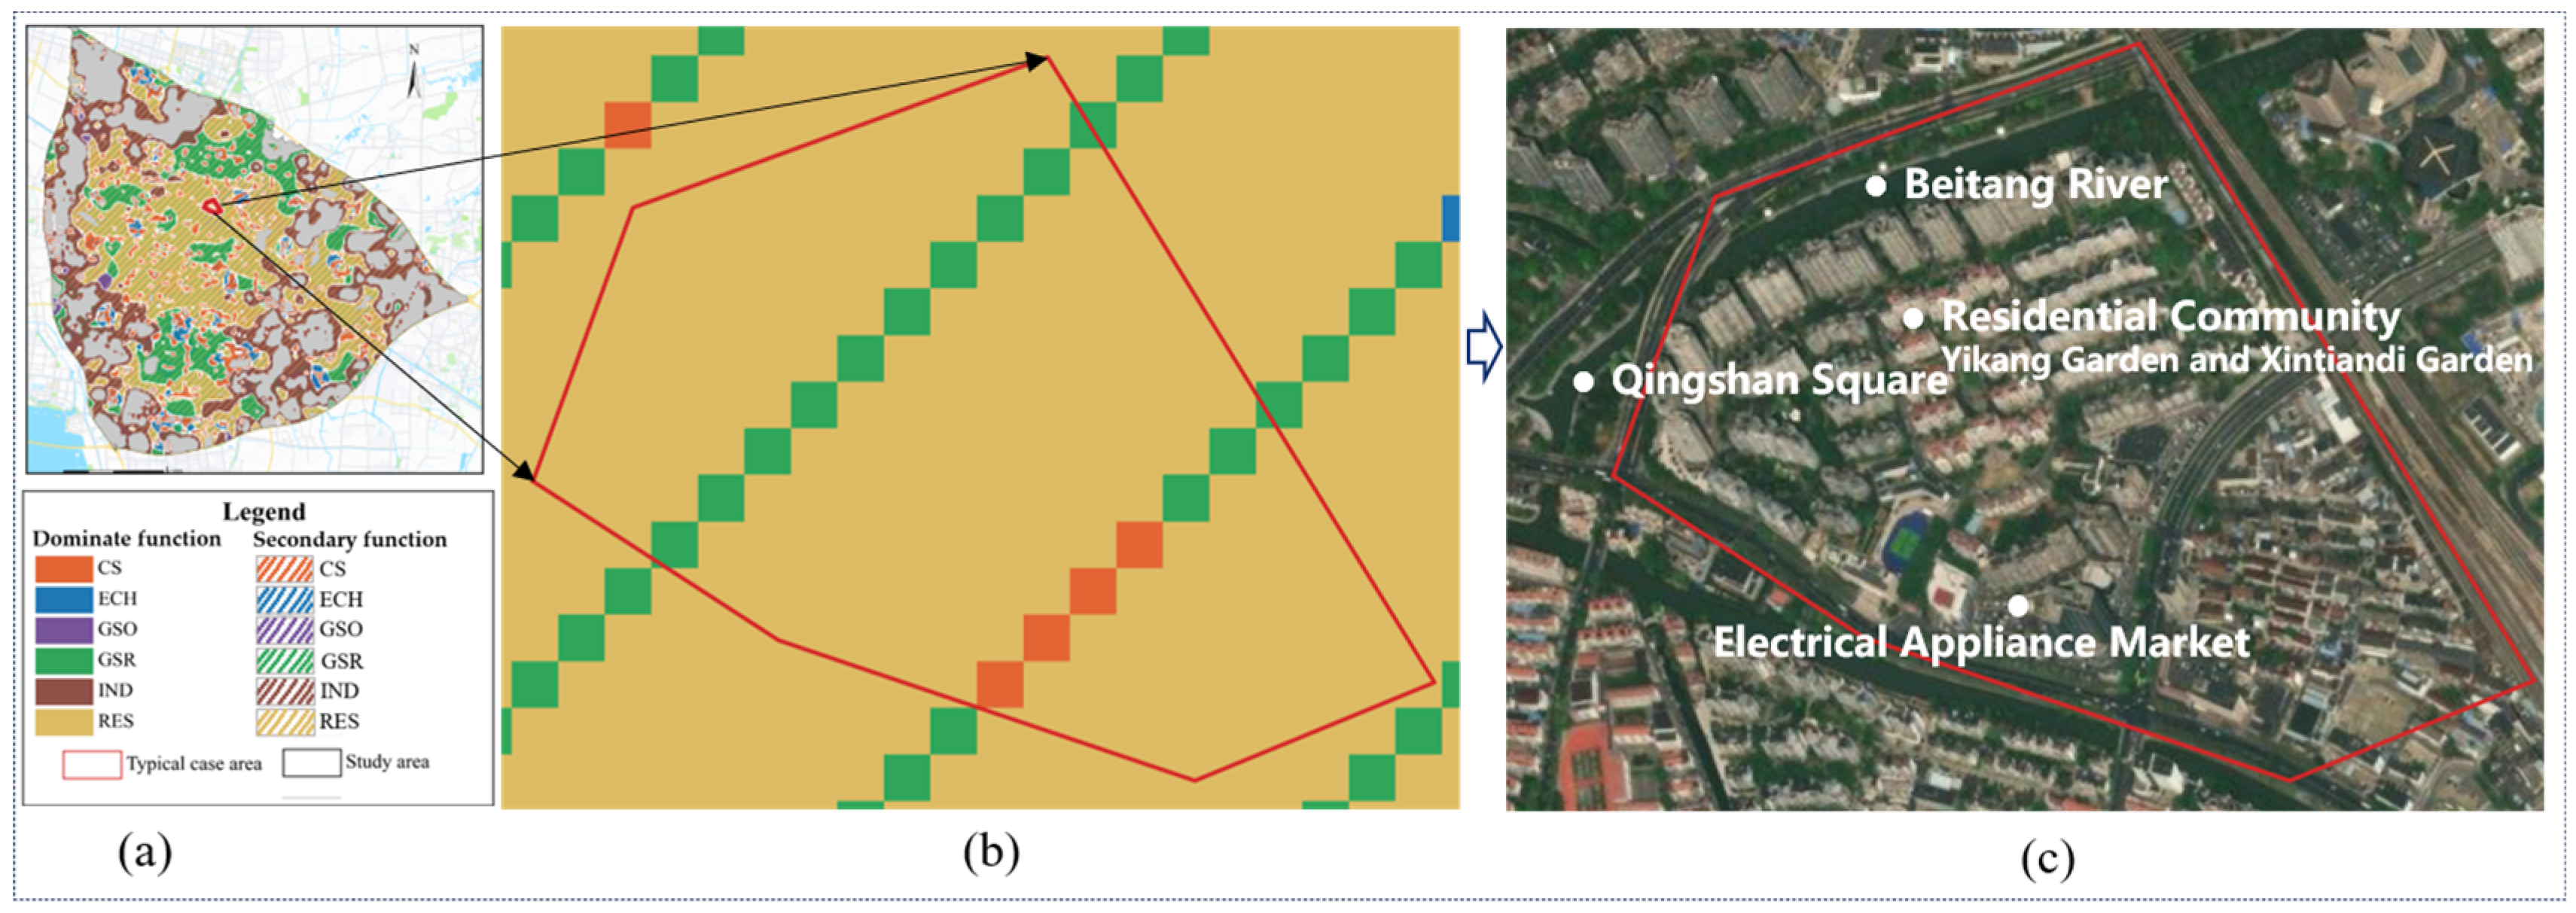
Validation results for mixed functional areas: As shown in Figure 8, the identification results indicated that the case area was dominated by residential functions, which was consistent with the actual composition of physical features, as residential communities such as Yikang and Xintiandi Gardens were densely and continuously distributed within the case area. Thus, different locations exhibited secondary functions corresponding to surrounding facilities. Areas adjacent to Qingshan Square on the west side and waterfront green space on the north side were overlaid with green space and recreational functions, forming a mixed residential–green space and recreational area. The southeastern and peripheral areas were influenced by the electrical appliance market and roadside commercial facilities, resulting in the addition of commercial and service functions, and the formation of a mixed residential, commercial, and service type. These secondary functions do not alter the dominant role of the residential function; however, they demonstrate the differentiated influence of different facilities in local spaces. The results indicate that the proposed method can effectively identify the primary attributes of mixed functional areas while characterizing the composition of secondary functions and their spatial variation.
Figure 8.
Validation results for the mixed functional area case study: (a) Location of the case area; (b) Functional identification results; (c) Remote sensing image.
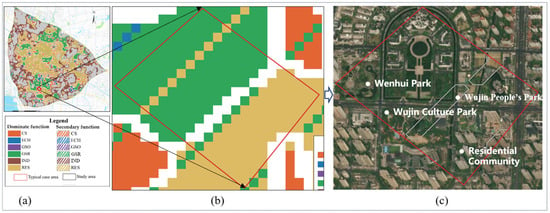
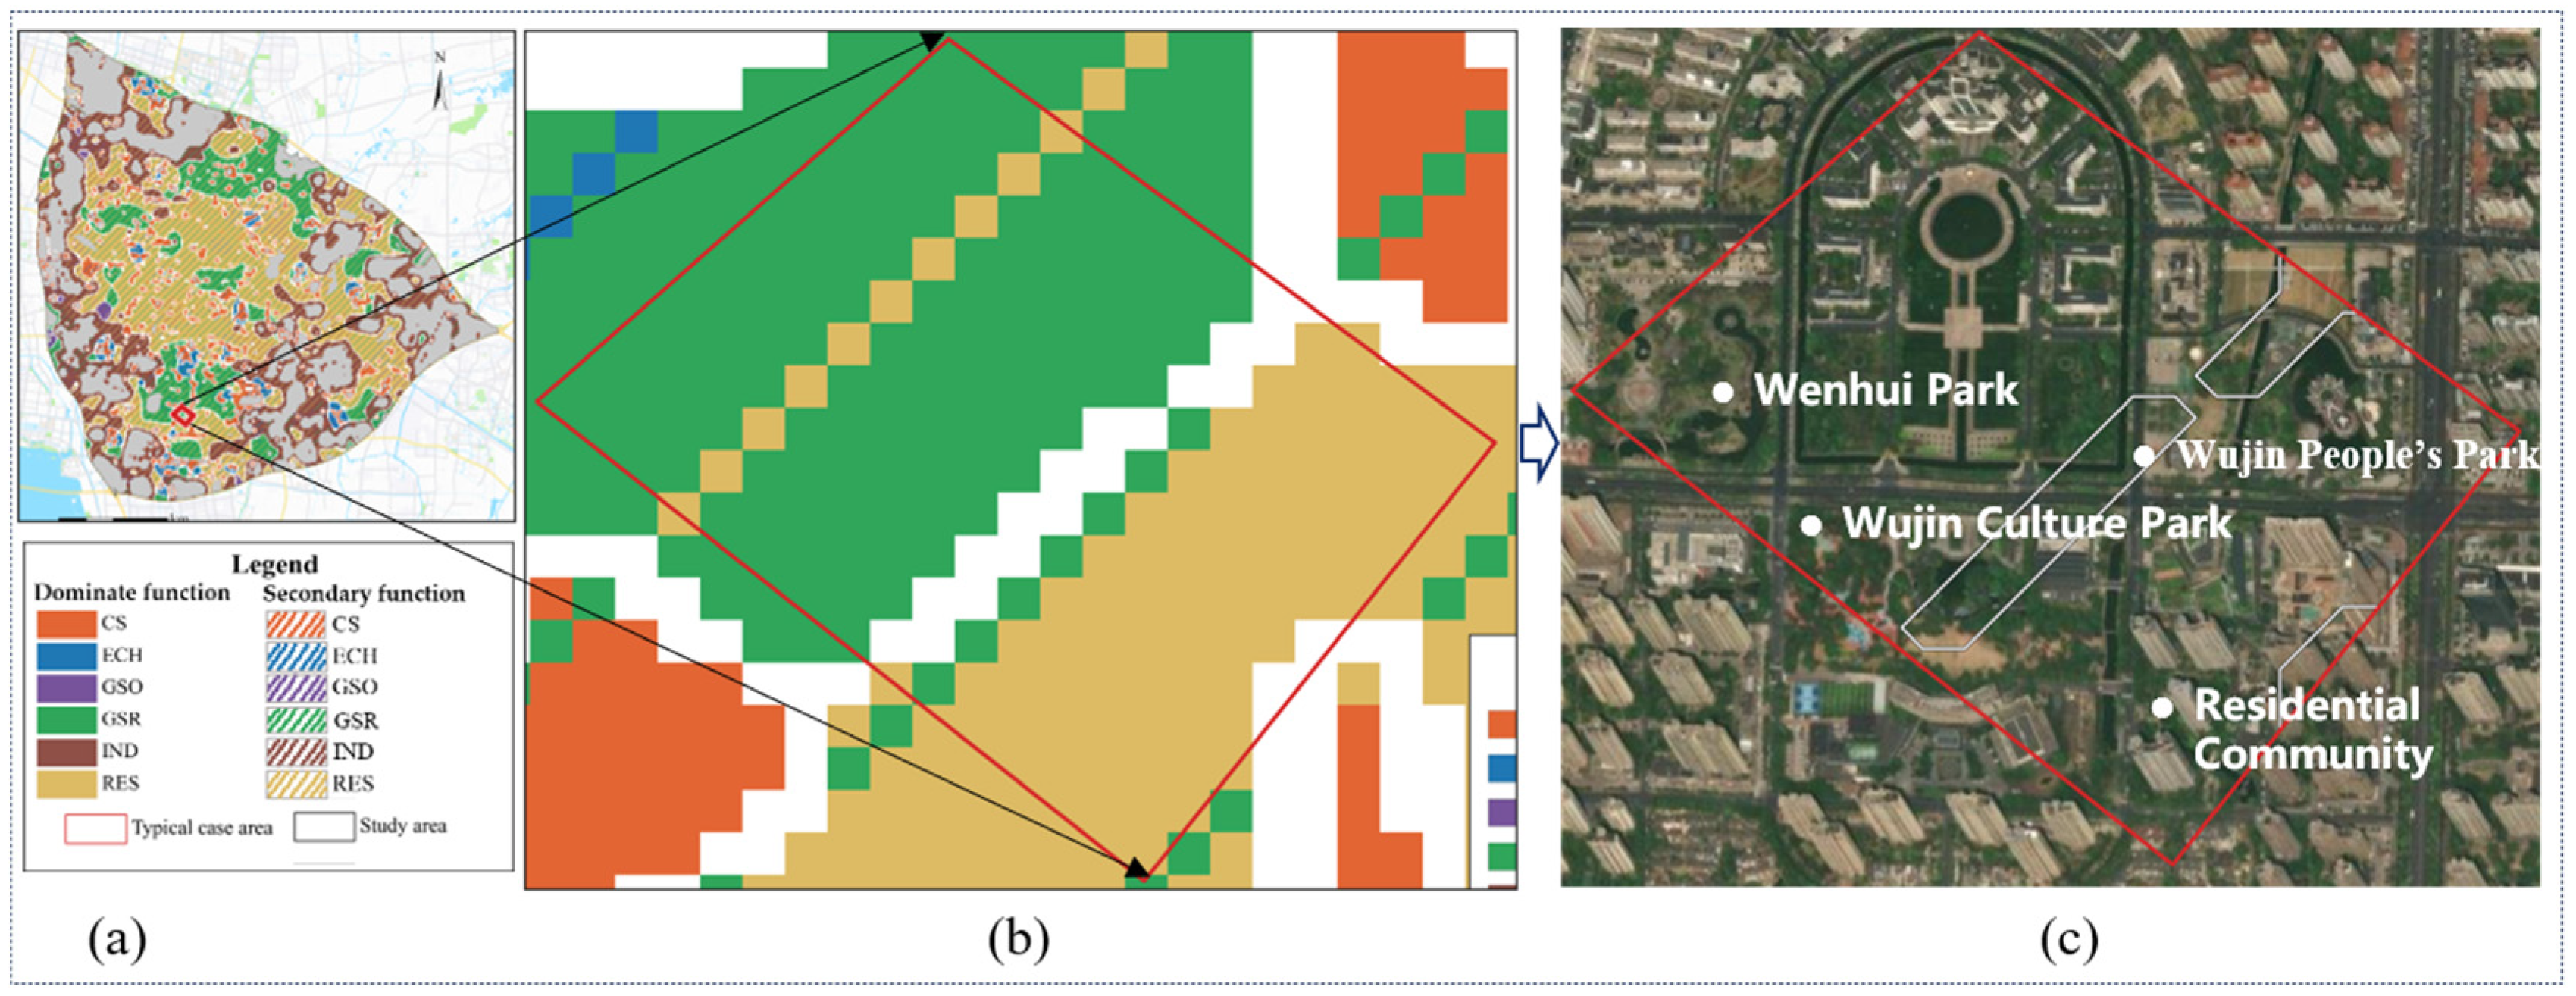
Validation results for functional boundary transitional areas: This study selected the boundary area between green spaces, recreational, and residential functions for validation (Figure 9). Continuous open spaces, including Wenti Park, People’s Square, and the Rule of Law Cultural Park, were concentrated on the western side of the case study area, whereas residential communities, such as Jindu Mingyuan and Hongjian Yipin, were located on the eastern and southeastern sides. Overall, the area exhibited a real spatial pattern, transitioning from green space and recreation to residential use. Accordingly, the identification results showed that green spaces and recreational functions dominated the western side, residential functions dominated the eastern side, and a transitional area was formed between them, which was generally consistent with the actual distribution of the physical features.
Figure 9.
Validation results for the functional boundary transitional area case study: (a) location of the case area; (b) functional identification results; (c) remote sensing image.
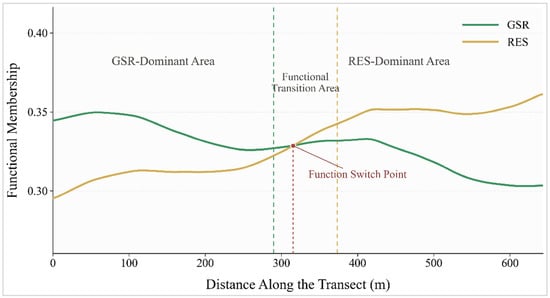
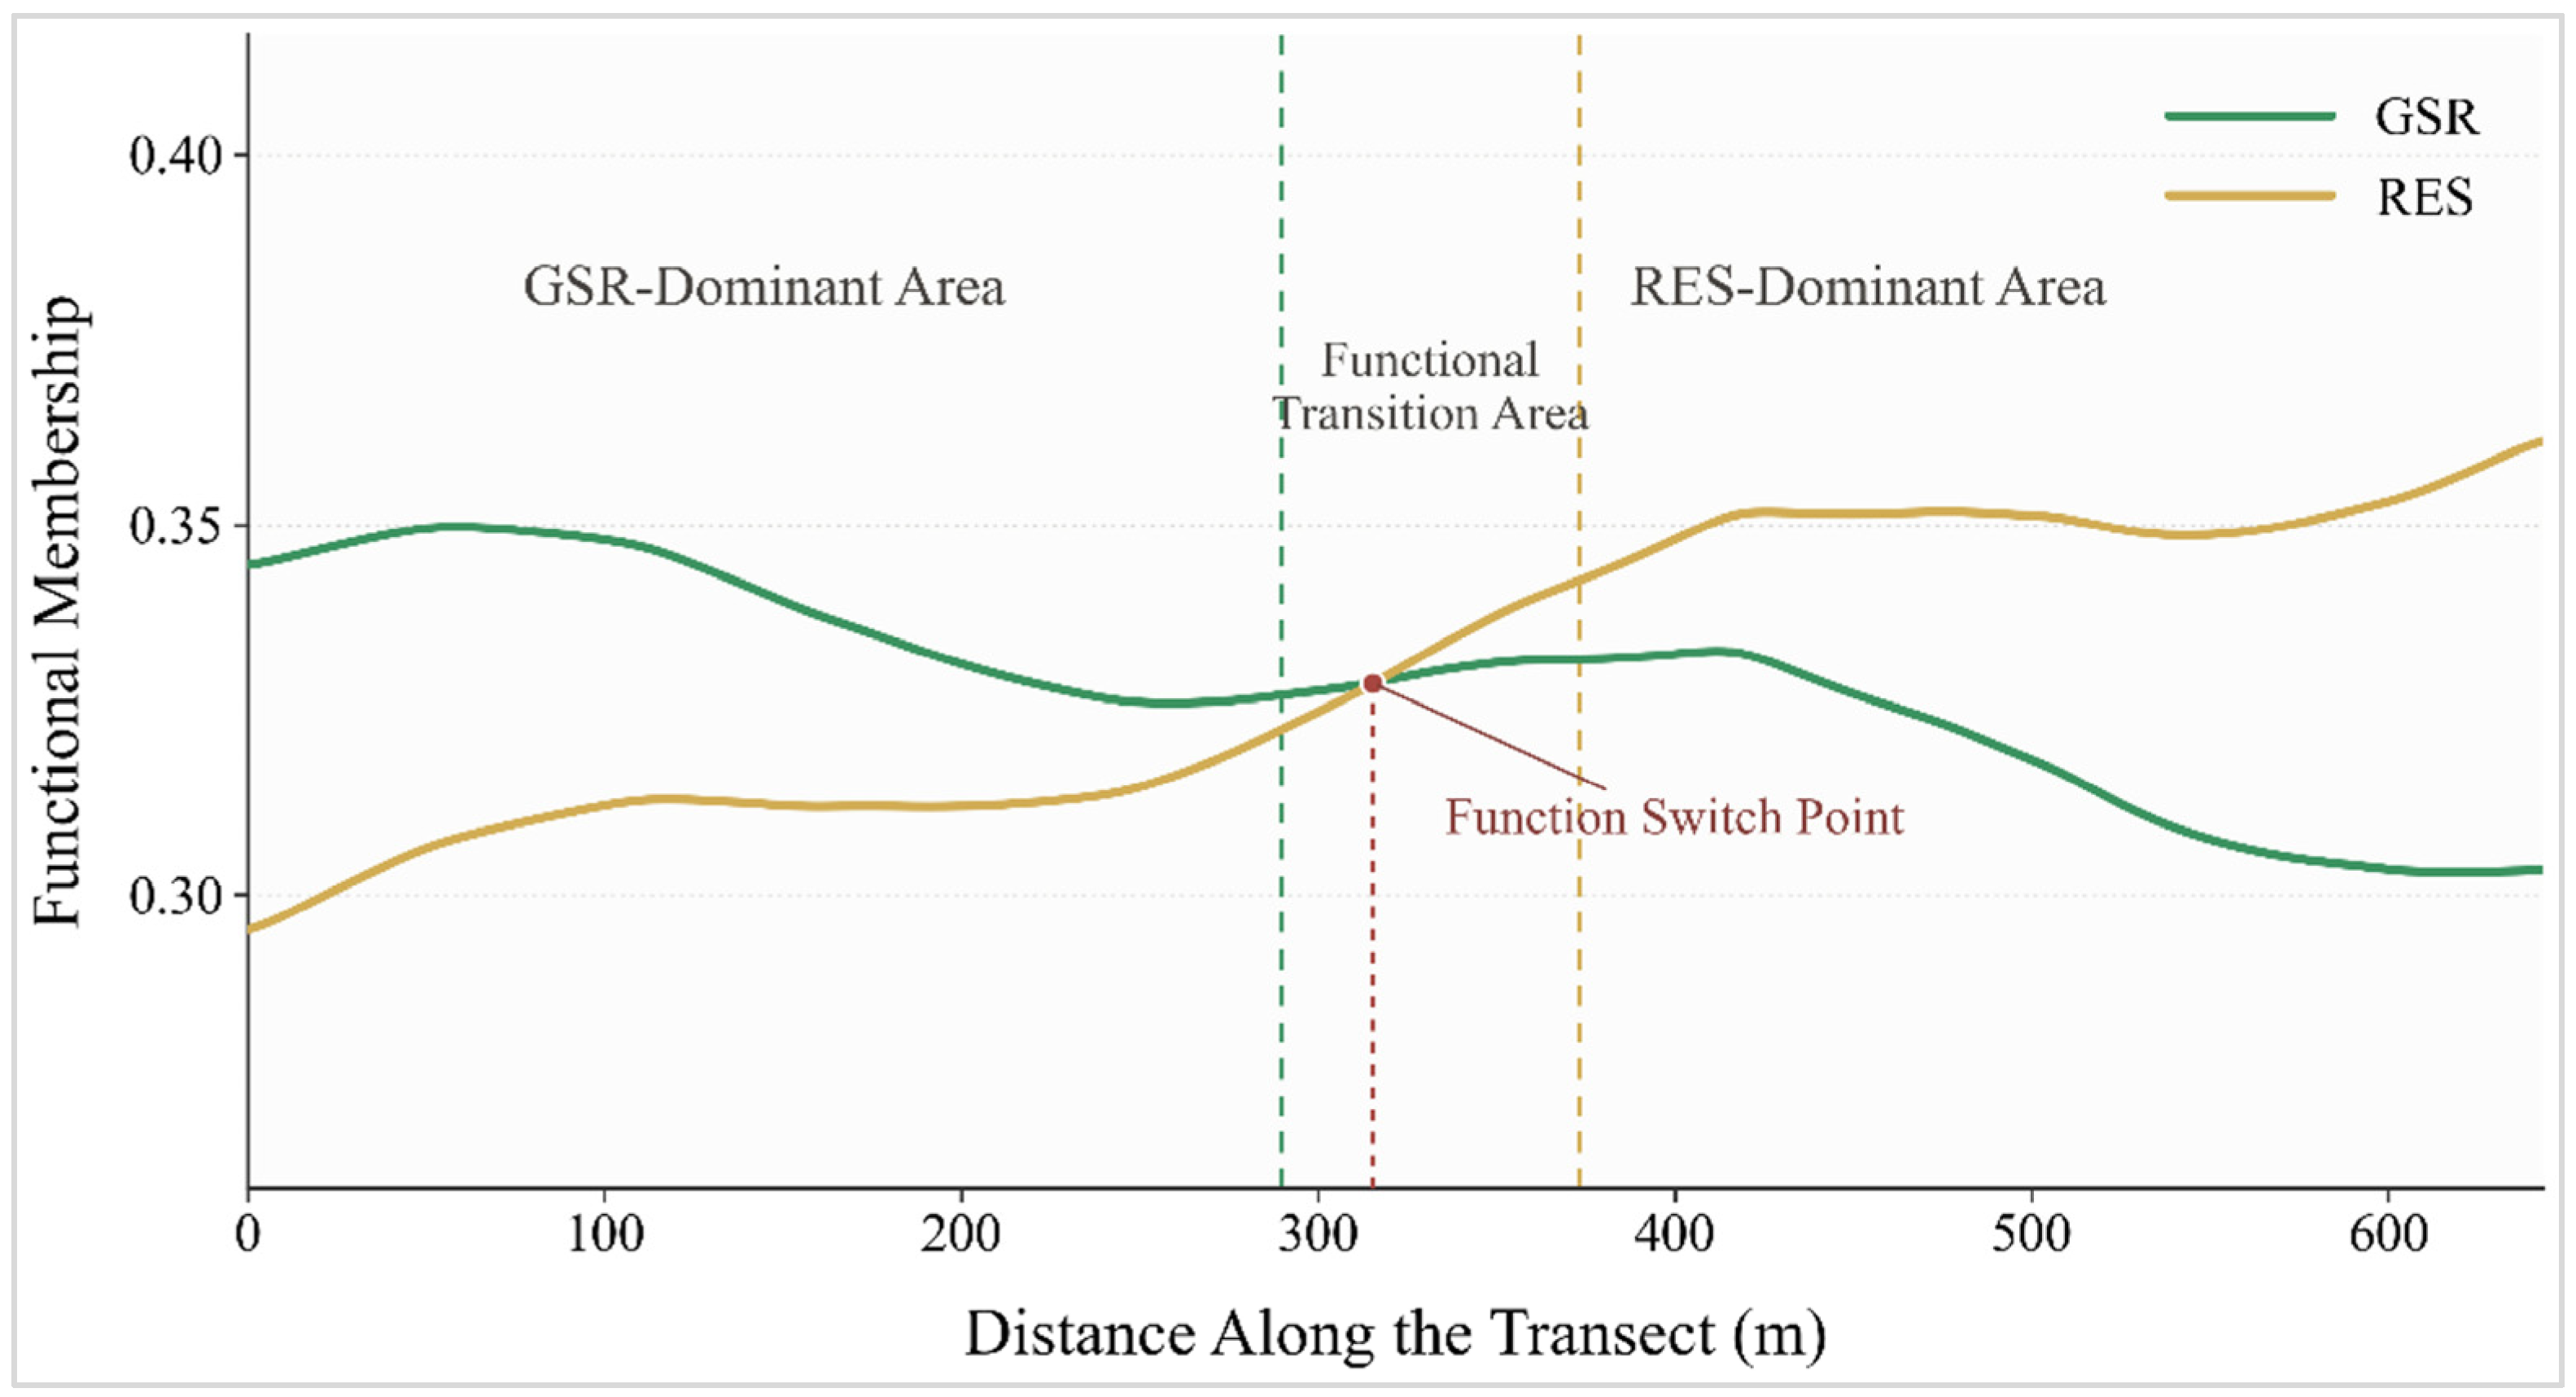
A profile line was drawn perpendicular to the transitional area, and the results further showed (Figure 10) that, from the green space and recreational area towards the residential area, the membership of the green space and recreational function generally decreased, while the residential membership gradually increased. Within the range of approximately 290–380 m, the difference between the two was relatively small, and the dominant function changed at approximately 320 m. The memberships of the two functional categories varied continuously, indicating that the proposed method can characterize the gradual boundary formed by the increase in one adjacent function and the decline of the other, rather than considering it as an abrupt boundary.
Figure 10.
Membership profile across the green space and recreation–residential functional transitional area.
7. Discussion
7.1. Contributions of the Proposed Method
Theoretical contribution: In contrast to existing methods that discretize urban functions and assign either a single or mixed label, this study interprets urban function as a process characterized by differences in intensity, spatial extension, and continuous decay. By integrating the individual functional intensity of POIs, the adaptive influence radius, and spatial decay, the spatial influence of POIs was incorporated into the calculation of functional membership, addressing the limitations of existing studies in representing individual differences and functional influence across spatial units. Accordingly, the method distinguishes between functional entity and functional influence boundaries, and establishes a hierarchical framework of ‘dominant function–secondary function–functional transition.’ This extends the identification results from simple functional classification to a comprehensive representation of functional composition, influence intensity, and spatial variation, thereby providing a new approach for the identification and representation of urban functional areas.
Practical significance: The proposed method can identify dominant functions based on the logic of dominant functional determination, while preserving the membership values of all functional categories, thereby revealing the functional composition, relative strength, mixed characteristics, and continuous variation at any spatial location. Consequently, the method meets the requirements of conventional urban functional area identification, as well as provides a more comprehensive information foundation for analyzing complex urban spaces. In addition, this method addresses the limitations of using physical land-use boundaries to represent urban functions. It can characterize the spatial extent and intensity variation in the influence of large commercial and public service facilities on surrounding communities, road intersections, and supporting spaces, thereby providing a basis for evaluating functional service areas, optimizing functional area boundaries, and supporting refined urban spatial governance.
7.2. Robustness Analysis of the Adaptive Influence Radius
The adaptive influence radius determines the spatial extent of POI influence and thus directly affects functional membership. Therefore, this study evaluates method robustness by examining the effects of radius perturbations on functional membership and dominant-function identification.
For this purpose, hij (Equation (5)) was used as the baseline value, and four perturbation scenarios, 0.6hij, 0.8hij, 1.2hij, and 1.4hij, were established while all other computational settings were kept unchanged. Functional membership and dominant function identification were recalculated under each scenario and compared with the baseline results in terms of the stability of functional membership distributions, dominant function identification, and the representation of functional spatial influence.
The stability of functional membership was assessed using the Spearman rank correlation coefficient and numerical error between each perturbation scenario and the baseline results. The stability of dominant function identification was evaluated based on the agreement rate between the corresponding spatial distributions. The stability of functional spatial influence representation was examined by comparing changes in the Spearman rank correlation coefficient between Zj(x), the estimated membership of function j, and Pj(x), the corresponding public perceived intensity, across different scenarios. If functional membership remains highly consistent with the baseline, numerical errors are small, dominant function identification changes only marginally, and the correlation with the public perception index remains stable, the method can be considered robust to perturbations in the influence radius. The results are presented in Table 5.
Table 5.
Robustness analysis under different parameter perturbation scenarios.
As shown in Table 5, within a reasonable range of perturbations in the POI adaptive influence radius, the spatial distribution of functional membership, dominant function identification, and their relationships with the public perception index remain relatively stable. Compared with the baseline, the Spearman correlation coefficients of functional membership exceed 0.94 in all four scenarios, accompanied by relatively small mean absolute errors, indicating that the overall spatial ranking and distribution pattern of functional membership are largely preserved. The agreement rates of dominant function distributions are also consistently above 0.80, suggesting that radius perturbations do not substantially alter the basic spatial pattern of dominant urban functions. In addition, the correlation with the public perception index changes only slightly, with a maximum variation of 0.027, indicating that the representation of functional spatial effects is likewise stable. Overall, the proposed method exhibits good robustness to perturbations in the adaptive influence radius, providing a stable basis for functional membership calculation and subsequent refined urban functional area identification.
7.3. Reliability Analysis of Public Perception Data
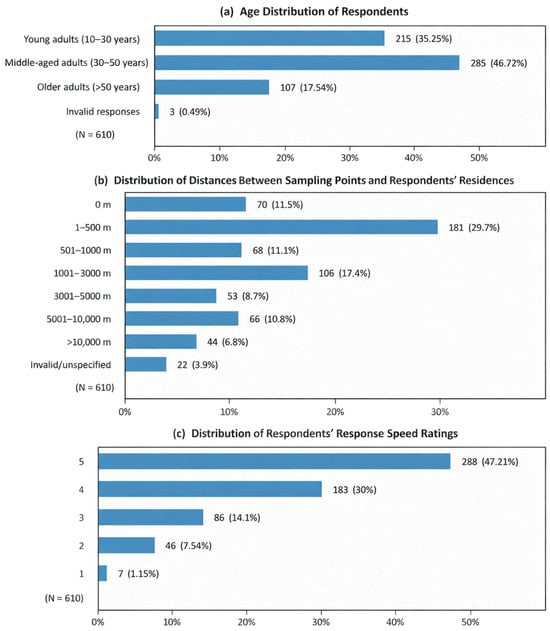
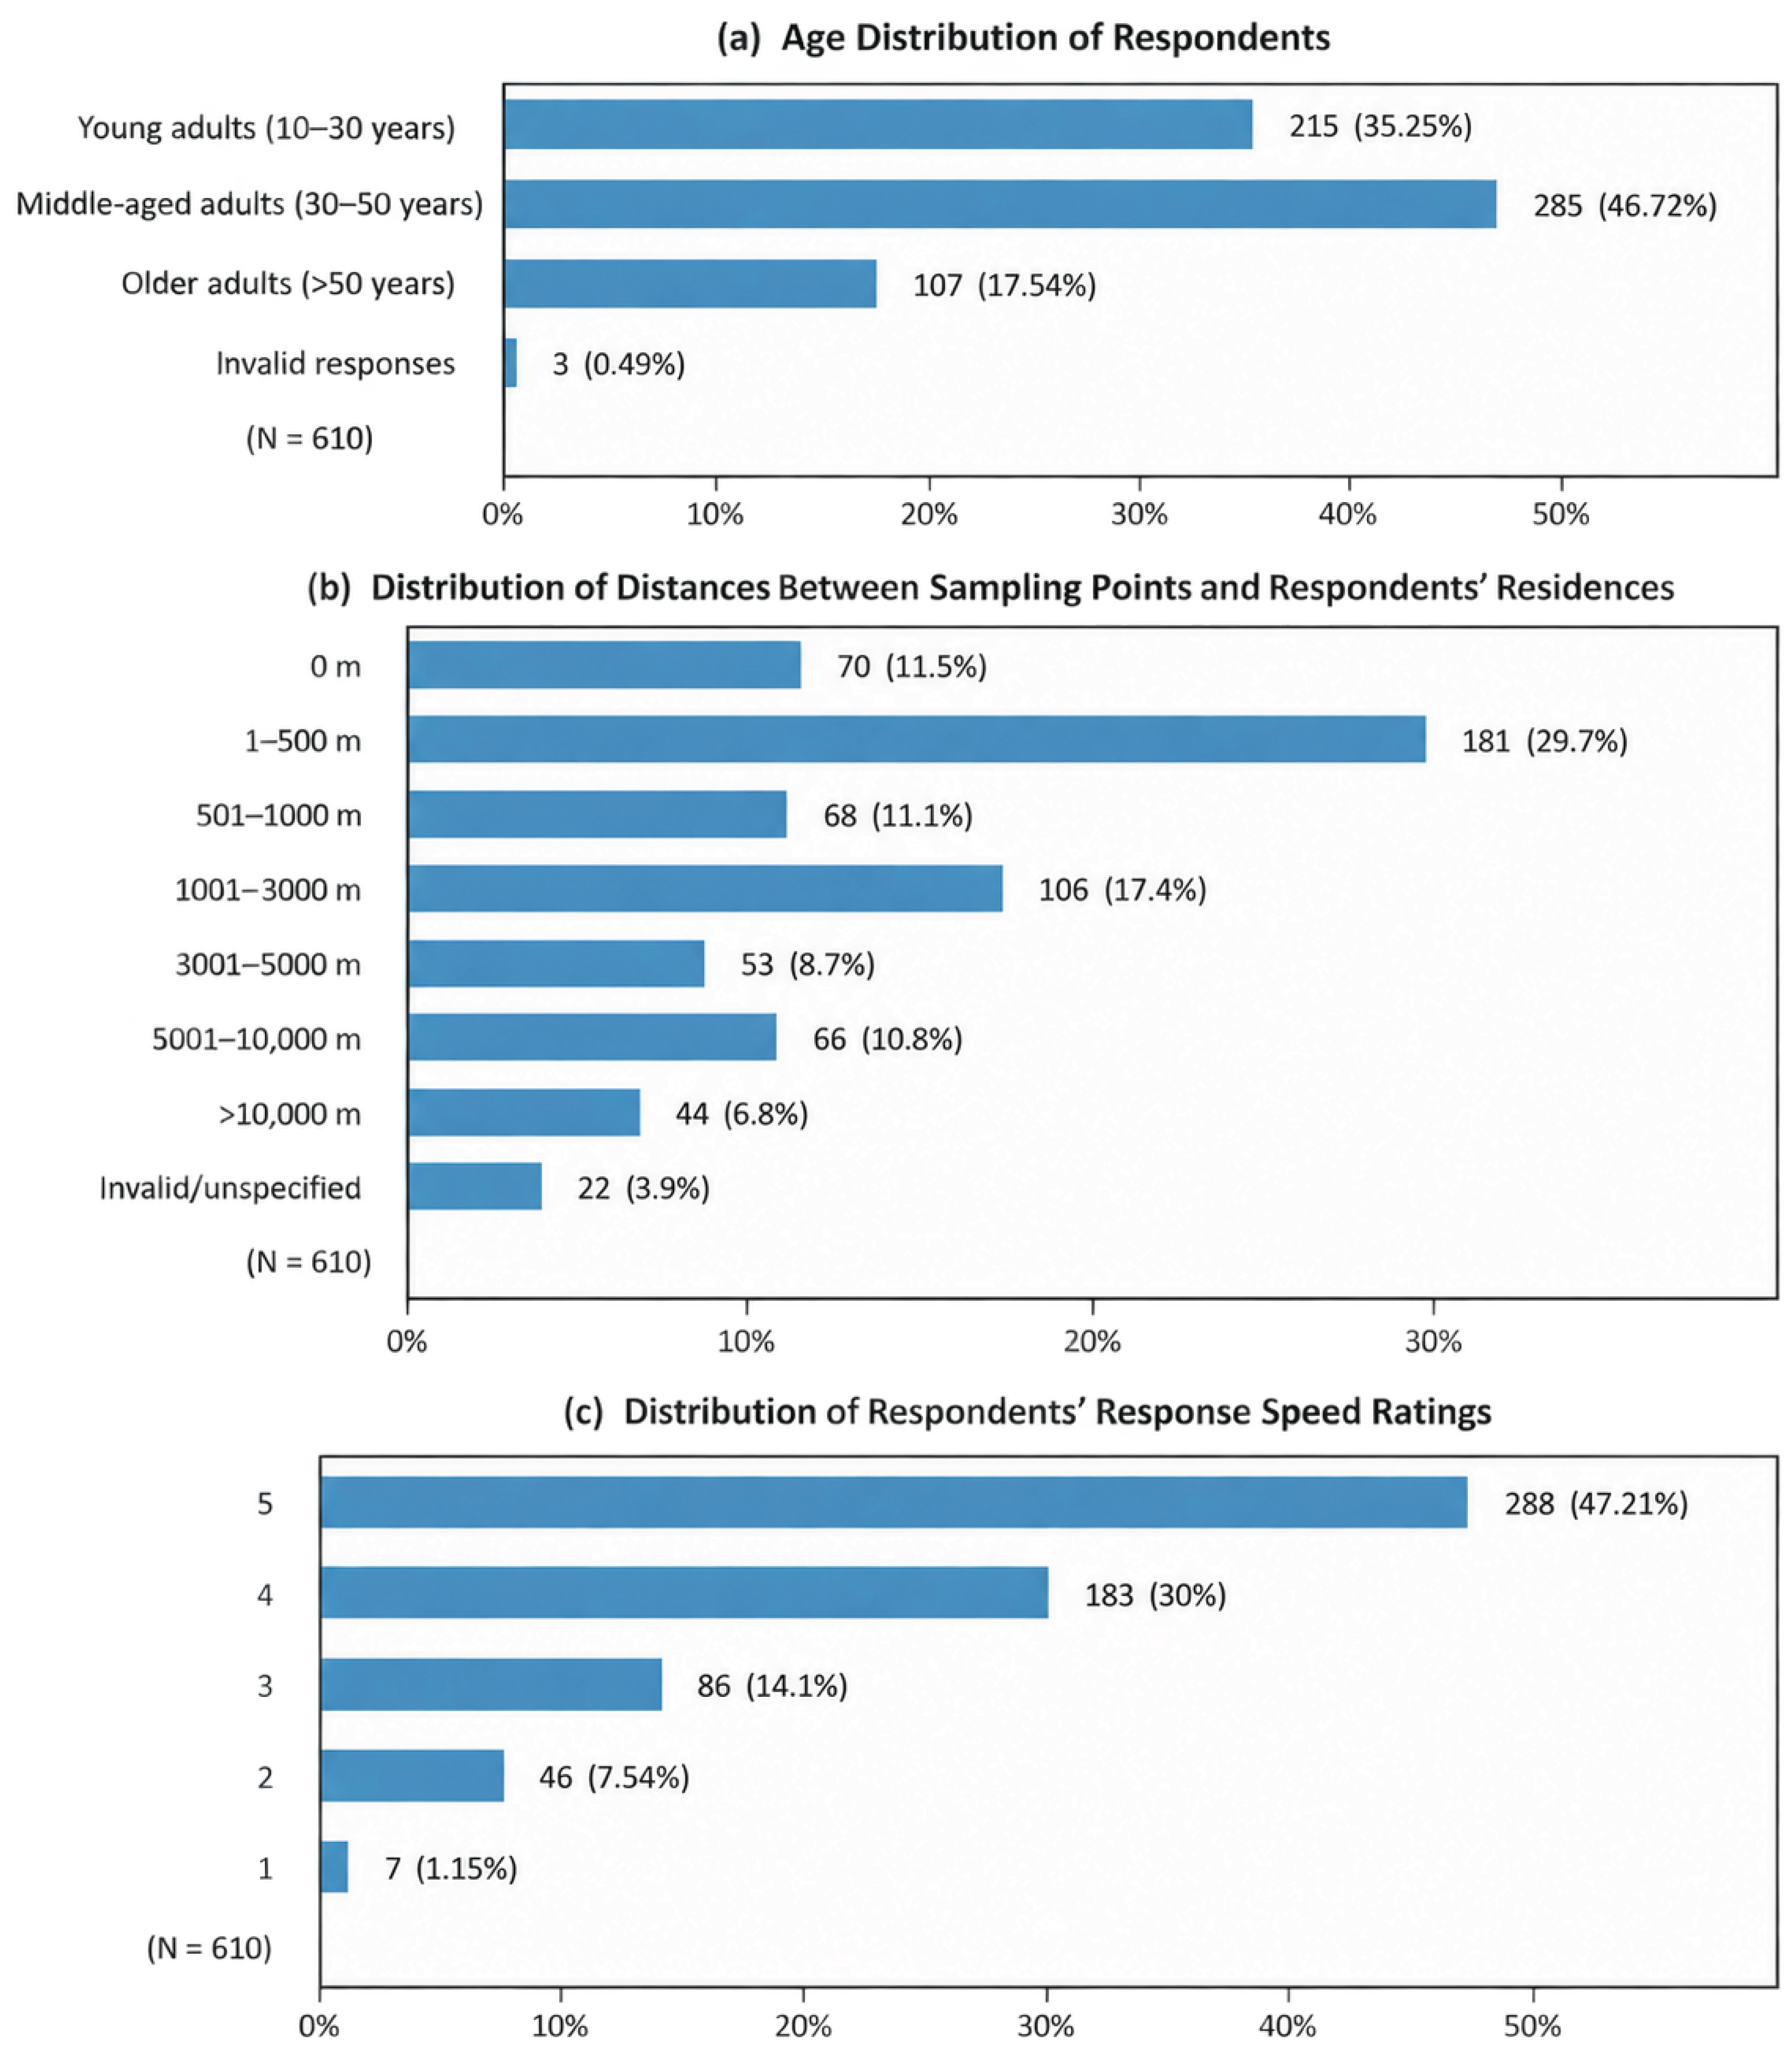
The public perception data used in this study were not based on a single subjective judgement, but on comprehensive resident questionnaire data with a certain degree of reliability (Figure 11). A total of 610 valid questionnaires were collected. Respondents covered different age groups, including young, middle-aged, and older people, giving the sample a certain level of diversity and representativeness in terms of age structure, and providing a relatively diverse basis for constructing the public perception index. Second, 52.3% of the respondents resided within 1000 m of the sampling locations, indicating that their assessment of surrounding urban functions was based not on momentary observation, but on continuous perception through daily life. Furthermore, more than 70% of respondents answered quickly and clearly, indicating that the overall quality of the questionnaire responses was good. The age structure of the sample, residential distance, and response speed together support the reliability of the public perception data.
Figure 11.
Statistics of the basic characteristics of the questionnaire survey. Note: Response speed scores range from 5 to 1, representing answers ranging from ‘without hesitation’ to ‘after prolonged thinking and indecision.
Public perceptions vary among functional categories. Functions such as commerce and service, science, education, culture and healthcare, and green space and recreation generally have strong physical visibility, high frequency of use, and distinctly defined service targets, making it easier for them to show spatial variation trends consistent with the model results. In contrast, industrial, governmental, social organization, and residential functions may show relatively weaker correlations with the model results because of spatial separation, infrequent use, or widespread distribution. These differences mainly indicate the degree of coupling between the objective spatial influence of different functions and subjective public perception and do not necessarily indicate that the model results are unreasonable. Therefore, the public perception index can serve as an important reference for validating the spatial influence of urban functions, particularly for highly perceptible functions, such as commercial and service, science, education, culture and healthcare, and green space and recreation; however, it should not be used as the sole criterion for evaluating the actual intensity of urban functions. Future studies should combine multiple data sources, such as behavioral trajectories, for cross-validation to further improve the overall reliability of the validation results.
8. Conclusions
To address the limitations of existing urban functional area identification methods, which assign discrete labels to entire basic spatial units and cannot adequately represent individual POI differences or functional influences across spatial units, this study proposed a refined identification method that considers the differentiated spatial influence of POIs. This method integrates the individual functional intensity and spatial aggregation of POIs to determine an adaptive influence range, constructs a continuous functional intensity field through spatial decay, and superposes functions of the same type, thereby identifying dominant functional areas, mixed functional areas, and functional boundary transitional areas while preserving multifunctional membership.
Using the main urban area of Changzhou as a case study, the main conclusions are as follows: (1) A comparison with current land-use parcels showed that the identification of dominant functions exhibited high completeness and effectively represented the basic spatial pattern of major urban functions, indicating that this method can meet the needs of general urban planning projects. (2) The functional intensity of most functional categories was significantly and positively correlated with the public perception index, indicating that the identification results can indicate the spatial influence range and transition characteristics of different functions to a certain extent. (3) The proposed method provides strong practical interpretability for refined information such as variations in functional intensity, combinations of mixed functions and their dominant-secondary relationships, and functional boundary transitions. The validation results from the typical case areas showed that the identification results were generally consistent with the actual functional extent, spatial distribution, and functional transition relationships. (4) The proposed method established a multilevel identification framework composed of dominant functions, secondary functions, intensity gradients, and boundary transitions, enabling a comprehensive representation of the functional types, internal composition, relative intensity, and their spatial variation.
Overall, this study extends urban functional area identification from discrete functional classification to the continuous representation of ‘functional type–relative intensity–boundary transition,’ providing a new methodological framework for analyzing urban functional structures, evaluating functional influence ranges, and supporting refined urban planning. Currently, the proposed method is mainly applicable to relatively stable functional patterns in planar spaces of built-up areas. In the future, this can be further validated and extended by incorporating three-dimensional building information, dynamic activity data, and additional urban case studies.
It should be noted that the applicability of the proposed method is constrained by the data foundation and characteristics of the study object. The overall framework, including POI-specific functional intensity, adaptive influence range modeling, continuous function fields, and function membership, can be transferred to other cities, while specific indicators, data sources, and weights should be adjusted to local conditions. In addition, Euclidean distance is used to model the spatial decay of POI functional influence, without explicitly accounting for street networks, physical barriers such as rivers or pedestrian connectivity, which may simplify actual urban accessibility. Future research could conduct multi-scale grid sensitivity analysis to assess the effects of grid resolution on functional membership values and classification results, and introduce network-based distance measures and human-centered activity information to better characterize functional spatial influence.
Supplementary Materials
The following supporting information can be downloaded at: https://www.mdpi.com/article/10.3390/ijgi15110482/s1, S1. Weight Settings for the Comprehensive Driving Index of the Adaptive Influence Radius; S2. Functional Type Classification [8,28].
Author Contributions
Conceptualization, Xiaoqian Qiu and Zhenjie Chen; methodology, Xiaoqian Qiu; software, Xiaoqian Qiu and Manchun Li; validation, Xiaoqian Qiu; formal analysis, Xiaoqian Qiu; resources, Xiaoqian Qiu and Zhenjie Chen; data curation, Xiaoqian Qiu and Samuel Zhu; writing—original draft preparation, Xiaoqian Qiu; writing—review and editing, Xiaoqian Qiu; visualization, Xiaoqian Qiu and Samuel Zhu; supervision, Zhenjie Chen and A-Xing Zhu; project administration, Zhenjie Chen and Manchun Li; funding acquisition, Manchun Li. All authors have read and agreed to the published version of the manuscript.
Funding
This research was funded by the National Natural Science Foundation of China, grant numbers 42171396 and 42230113.
Data Availability Statement
The POI datasets used in this study are publicly accessible and can be obtained from Amap (https://lbs.amap.com/). The current land use parcel data from the Third National Land Survey used for validation are not publicly available due to data access restrictions. Other auxiliary datasets, including the remote sensing imagery and OpenStreetMap data, are available from publicly accessible sources. Further information regarding the datasets and data processing procedures can be obtained from the corresponding author upon reasonable request.
Acknowledgments
We thank Samuel Jiarong Zhu for his contribution in polishing this paper. Comments from the editor and anonymous reviewers were highly appreciated.
Conflicts of Interest
The authors declare no conflicts of interest. The funders had no role in the design of the study; in the collection, analyses, or interpretation of data; in the writing of the manuscript; or in the decision to publish the results.
Abbreviations
The following abbreviations are used in this manuscript:
| AHP | Analytic hierarchy process |
| BTA | Functional boundary transition area |
| CS | Commercial and services |
| ECH | Education, culture, and healthcare |
| GSO | Government and social organizations |
| GSR | Green space and recreation |
| IND | Industrial |
| MIX | Mixed-used functional area |
| RES | Residential |
| VGI | Volunteered geographic information |
References
- Qin, Q.; Xu, S.; Du, M.; Li, S. Identifying urban functional areas by capturing multi-spatial distribution patterns of points of interest. Int. J. Digit. Earth 2022, 15, 2468–2494. [Google Scholar] [CrossRef] [Scilit]
- Yang, Y. Research on Urban Functional Area Identification and Spatial Structure Evolution. Doctoral Thesis, Jilin University, Changchun, China, 2023. [Google Scholar]
- Huang, C.; Xiao, C.; Rong, L. Integrating point-of-interest density and spatial heterogeneity to identify urban functional areas. Remote Sens. 2022, 14, 4201. [Google Scholar] [CrossRef] [Scilit]
- Wang, Z.; Ma, D.; Sun, D.; Zhang, J. Identification and analysis of urban functional area in Hangzhou based on OSM and POI data. PLoS ONE 2021, 16, e0251988. [Google Scholar] [CrossRef] [Scilit]
- Peng, W.; Zhang, S.; Li, H.; Dale, P.; Lu, Y. Urban Parcel Grouping Method Based on Urban Form and Functional Connectivity Characterisation. ISPRS Int. J. Geo-Inf. 2019, 8, 282. [Google Scholar] [CrossRef] [Scilit]
- Yang, M.; Lei, Y.; Peng, L. Organisation of planning thematic data. In Proceedings of the 30th Academic Information Exchange Conference of the Central South Branch of the National Surveying and Mapping Science and Technology Information Network, Guilin, China, 20–21 October 2016. [Google Scholar]
- Liu, B.; Deng, Y.; Li, M.; Yang, J.; Liu, T. Classification schemes and identification methods for urban functional zone: A review of Recent Papers. Appl. Sci. 2021, 11, 9968. [Google Scholar] [CrossRef] [Scilit]
- Du, S.; Du, S.; Liu, B.; Zhang, X. Context-enabled extraction of large-scale urban functional zones from very-high-resolution images: A multiscale segmentation approach. Remote Sens. 2019, 11, 1902. [Google Scholar] [CrossRef] [Scilit]
- Wenhui, K.; Shuwen, Z.; Jiyuan, L.I.U.; Quanqin, S. Methodology for classifying and detecting intra-urban land use change: A case study of Changchun city during the last 100 years. J. Remote Sens. 2010, 14, 345–355. [Google Scholar] [CrossRef] [Scilit]
- Yang, M.; Cao, S.; Zhang, H.; Wu, S.; Zhang, D. Using point of interest data and satellite observation for urban functional zone mapping. Sens. Mater. 2023, 35, 269–284. [Google Scholar] [CrossRef] [Scilit]
- Zhang, X.; Du, S.; Wang, Q. Hierarchical semantic cognition for urban functional areas with VHR satellite images and POI data. ISPRS J. Photogramm. 2017, 132, 170–184. [Google Scholar] [CrossRef] [Scilit]
- Cai, Z.; Karvonen, A.; Cong, C.; Huang, W. Fine-grained urban land use simulation: Integrating spatial dynamic modeling with a pre-trained vision-language model. Comput. Environ. Urban Syst. 2026, 126, 102416. [Google Scholar] [CrossRef] [Scilit]
- Zhang, X.; Li, W.; Zhang, F.; Liu, R.; Du, Z. Identifying urban functional areas using public bicycle rental records and point-of-interest data. Int. J. Geo-Inf. 2018, 7, 459. [Google Scholar] [CrossRef] [Scilit]
- Lu, W.; Tao, C.; Li, H.; Qi, J.; Li, Y. A unified deep learning framework for urban functional zone extraction based on multi-source heterogeneous data. Remote Sens. Environ. 2022, 270, 112830. [Google Scholar] [CrossRef] [Scilit]
- Gao, S.; Janowicz, K.; Couclelis, H. Extracting urban functional regions from points of interest and human activities on location-based social networks. Trans. GIS 2017, 21, 446–467. [Google Scholar] [CrossRef] [Scilit]
- Chi, J.; Jiao, L.; Dong, T.; Gu, Y.; Ma, Y. Quantitative identification and visualization of urban functional area based on POI data. J. Geomat. 2016, 41. [Google Scholar] [CrossRef]
- Hu, Y.; Han, Y. Identification of urban functional areas based on POI data: A case study of the Guangzhou economic and technological development zone. Sustainability 2019, 11, 1385. [Google Scholar] [CrossRef] [Scilit]
- Luo, S.; Liu, Y.; Du, M.; Gao, S.; Wang, P.; Liu, X. The influence of spatial grid division on the layout analysis of urban functional areas. ISPRS Int. J. Geo-Inf. 2021, 10, 189. [Google Scholar] [CrossRef] [Scilit]
- Long, Y.; Shen, Z. Discovering functional areas using bus smart card data and points of interest in Beijing. In Geospatial Analysis to Support Urban Planning in Beijing; Springer International Publishing: Cham, Switzerland, 2015; pp. 193–217. [Google Scholar] [CrossRef] [Scilit]
- Yu, B.; Wang, Z.; Mu, H.; Sun, L.; Hu, F. Identification of urban functional regions based on floating car track data and POI data. Sustainability 2019, 11, 6541. [Google Scholar] [CrossRef] [Scilit]
- Zhang, X.; Du, S.; Wang, Q.; Zhou, W. Multiscale geoscene segmentation for extracting urban functional areas from VHR satellite images. Remote Sens. 2018, 10, 281. [Google Scholar] [CrossRef] [Scilit]
- Yuan, G.; Chen, Y.; Sun, L.; Lai, J.; Li, T.; Liu, Z. Recognition of functional areas based on call detail records and point of interest data. J. Adv. Transp. 2020, 2020, 1–16. [Google Scholar] [CrossRef] [Scilit]
- Wang, J.; Ye, Y.; Fang, F. A study of urban functional zoning based on kernel density estimation and fusion data. Geogr. Geo-Inf. Sci. 2019, 35, 66–71. [Google Scholar]
- Saaty, T.L. Homogeneity and clustering in AHP ensures the validity of the scale. Eur. J. Oper. Res. 1994, 72, 598–601. [Google Scholar] [CrossRef] [Scilit]
- Loftsgaarden, D.O.; Quesenberry, C.P. A nonparametric estimate of a multivariate density function. Ann. Math. Stat. 1965, 36, 1049–1051. [Google Scholar] [CrossRef] [Scilit]
- Cao, K.; Guo, H.; Zhang, Y. Comparison of approaches for urban functional areas classification based on multi-source geospatial data: A case study in Yuzhong District, Chongqing, China. Sustainability 2019, 11, 660. [Google Scholar] [CrossRef] [Scilit]
- Brunsdon, C.; Fotheringham, A.S.; Charlton, M.E. Geographically weighted regression: A method for exploring spatial nonstationarity. Geogr. Anal. 1996, 28, 281–298. [Google Scholar] [CrossRef] [Scilit]
- Fleischmann, M.; Arribas-Bel, D. Geographical characterisation of British urban form and function using the spatial signatures framework. Sci. Data 2022, 9, 546. [Google Scholar] [CrossRef] [Scilit]

Disclaimer/Publisher’s Note: The statements, opinions and data contained in all publications are solely those of the individual author(s) and contributor(s) and not of MDPI and/or the editor(s). MDPI and/or the editor(s) disclaim responsibility for any injury to people or property resulting from any ideas, methods, instructions or products referred to in the content. |
© 2026 by the authors. Published by MDPI on behalf of the International Society for Photogrammetry and Remote Sensing. Licensee MDPI, Basel, Switzerland. This article is an open access article distributed under the terms and conditions of the Creative Commons Attribution (CC BY) license.