


Abstract
Approaches for assessing the environmental outcomes of green development using quantitative indicators remain limited. This study integrates socioeconomic indicators with geospatial environmental information to assess green development level (GDL) and eco-environmental quality (EEQ) in a cross-provincial demonstration zone within China’s Yangtze River Delta (YRD) urban agglomeration covering three administrative districts and 28 townships from 2000 to 2020. GDL index was established using 38 indicators aligned with 13 Sustainable Development Goals (SDGs) across five sub-dimensions, while EEQ was measured using the Comprehensive Evaluation Index (CEI), a remotely sensed environmental index integrating PM2.5, land surface temperature, and vegetation coverage. The CEI represents environmental change relative to the year 2000 baseline rather than absolute environmental quality. Spatial and temporal analyses were conducted at the administrative district and township scales to examine the relationship between green development and environmental quality. The results showed that GDL increased consistently in all three districts from 2000 to 2020 in the study area, while EEQ followed a non-monotonic three-stage pattern, indicating a temporal mismatch between green development and environmental improvement. Moreover, this dual-index approach allows policymakers to distinguish regional development and environmental status within the administrative districts: (1) synergistic townships with high GDL and improved EEQ; (2) mismatched townships; and (3) underdeveloped townships with low GDL and degraded EEQ. Although uncertainties remain due to cross-scale data integration and dependence on baselines, this study offers a useful approach to support targeted green development and environmental management in urban agglomerations.
1. Introduction
China’s rapid urbanization over the past three decades has driven economic growth but also created many environmental challenges [1,2,3,4], including climate change [5,6], ecological fragmentation [7], biodiversity loss [8,9], and air pollution [10]. These challenges have drawn public attention to environmental sustainability, especially in urban agglomerations, as China aims to achieve carbon peaking by 2030 and carbon neutrality by 2060. Sustainable development in urban agglomerations requires not only sustained economic growth but also ecological preservation. The concept of green development has become common sense for addressing environmental challenges since the 1990s [4,11]. In 2015, the fifth Plenary Session of the 18th Central Committee of the Communist Party of China (CPC) identified “green development” as one of five major development principles [12,13,14]. Green development emphasizes the harmonious coexistence of human beings and nature, maximizing economic and social benefits at the lowest cost to resources and the environment [14,15,16]. In other words, green development is important for China to achieve economic growth and environmental sustainability together [17,18,19].
Scholars have developed many approaches to measure green development level (GDL) at the country, regional, and city scales [14,20,21,22,23]. Against this background, researchers have developed various index systems to evaluate GDL across multiple dimensions, including economic, environmental, resource, and social dimensions [24]. In general, existing studies have employed two main categories of methods to measure GDL. One category is the qualitative evaluation approach, which adopted the entropy method and the analytic hierarchy process (AHP) model to assign weights to each indicator. Wang et al. [21] used a multi-level evaluation and entropy method to build a green development index system covering five aspects: living environment, pollutant treatment, ecological efficiency improvement, economic growth, and innovation potential in nine cities in the Pearl River Delta (PRD), China. Long et al. [24] constructed an evaluation index system to calculate GDL in coal-resource-based cities by considering four dimensions: economic, social, resource, and environmental green development. Using a dynamic evaluation method, the Technique for Order of Preference by Similarity to Ideal Solutions (TOPSIS) with panel data, the GDL of 30 cities was assessed. Wang et al. [25] applied the Entropy TOPSIS model and the Theil index analysis to examine differences in industrial green development in China’s three major urban agglomerations. The AHP model was also used to assess and compare industrial green competitiveness across these agglomerations. The other category is the quantitative model-based approach, which calculates GDL through a comprehensive evaluation index system [4,26,27,28,29]. Feng et al. [27] developed a green development performance index (GDPI) based on a data envelopment analysis (DEA) model using panel data from 165 counties and sub-regions to estimate GDL at the global scale. Hou et al. [29] used the Super-SBM model to synthetically evaluate the sustainable development ability for four typical coal cities (growing, declining, mature, and regenerating) in China. Moreover, they used a Malmquist index to decompose changes in sustainable development ability. Han et al. [28] assessed the GDL of the Association of Southeast Asian Nations (ASEAN) countries through the entropy weight method using a comprehensive evaluation index system that included three sub-dimensions (development of economy and society, performance of resources and utilization, and competitiveness of environment and health) and incorporated a variety of indicators. Zhao et al. [4] explored the factors affecting green development in the alpine meadow region, using the DPSIR (Driver, Pressure, State, Impact, and Response) model.
Without a standardized definition, previous studies have developed diverse GDL evaluation indicator systems, and most of them include economic development [26,28,30], environmental protection [14,24,31], and resource use conditions of the study area [19,24,32]. Since researchers often assemble GDL indicator systems at their discretion and based on data availability, these systems often exhibit heterogeneity in dimensions and weights across studies. This issue is more pronounced in urban agglomerations, where socioeconomic development patterns can vary across subregions. For example, existing GDL evaluation systems for urban agglomerations mostly emphasize economic performance, resource efficiency, and environmental quality, whereas residents’ lifestyle, urban innovation potential, and the explicit linkages between green development and ecological sustainability are less frequently incorporated [14,33].
A second challenge is that most GDL assessments currently reflect only development capacity and local government input but rarely verify environmental outcomes. Eco-environment quality (EEQ) reflects the state of the natural environment under human influence. It complements GDL well in quantifying regional eco-green development status. Compared with statistical data sources, remote sensing overcomes constraints imposed by administrative divisions by enabling monitoring and measurement of EEQ metrics at high spatial and temporal resolution. In recent years, many researchers have used remote sensing-based ecological indices to assess the EEQ [34,35,36,37,38,39]. Xu [40] introduced the remote sensing ecological index (RSEI), which integrates four sub-indicators (vegetation, moisture, temperature, and soil) via principal component analysis (PCA) to represent greenness, humidity, heat, and dryness ecological elements [40]. It quickly became the most widely used index for estimating environmental quality because it works across various spatial and temporal scales [35]. Researchers have modified and combined the RSEI with other indices to assess EEQ across diverse ecosystems, such as forests [41], mountains [42], plateaus [43], mining areas [44], and wetlands [45]. He et al. [46] developed a comprehensive evaluation index (CEI) to quantify EEQ across major urban agglomerations in China. The CEI combines three indicators: PM2.5 concentration, land surface temperature (LST), and vegetation coverage (VC), corresponding to the United Nations Commission on Sustainable Development (UNCSD) themes of atmosphere, land, and biodiversity, respectively [46]. However, assessing EEQ alone cannot determine whether good urban environmental conditions in a given city result from effective green development management or simply from lower levels of human activity.
In summary, the existing literature reveals three research gaps. Firstly, most existing studies rely on a single composite index that assesses either GDL or EEQ to represent urban sustainability and is insufficient to interpret the interaction between development and the environment in urban agglomerations. A high GDL in a given area can only suggest strong socioeconomic development and greater investment in environmental protection, but it does not verify whether such efforts have actually translated into measurable environmental improvement outcomes. On the other hand, EEQ primarily captures the results of environmental monitoring rather than the drivers of environmental changes. For example, a favorable EEQ does not imply that environmental improvement is driven by green development, by less industrialization, or by experiencing counter-urbanization. Secondly, the existing GDL studies were conducted mostly at broader spatial scales, such as national [27,28], regional [4,25], and city scales [21,24,29,47]. Even dual-index studies have started to integrate development and environmental perspectives in urban agglomerations [47], a city is still often treated as the smallest unit. This limits the ability to reflect the within-city heterogeneity in urban agglomerations, where differences in socio-demographic patterns can generate strong intra-urban contrasts. In other words, policies that are appropriate at the city level may be ineffective when applied at administrative districts or township levels. In addition, existing GDL assessments often rely on subjective indicator selection, which hinders standardization and comparability among different studies. In April 2016, China released the Position Paper on the Implementation of the 2030 Agenda for Sustainable Development, adopted by all United Nations Member States, outlining its principles and policies regarding the 17 Sustainable Development Goals (SDGs) and elevating sustainable development to the level of national strategy in the 13th Five-Year Plan [48]. However, a systematic approach that combines a dual index with the SDGs at finer scales (such as the township scale) is still lacking in urban agglomerations.
In order to fill these gaps, this study proposes an innovative evaluation method to assess the eco-green development quality, defined as the combined performance of GDL and EEQ. This method can examine the degree of synergy between socioeconomic development and environmental protection in the Yangtze River Delta (YRD), one of the largest urban agglomerations in China. Specifically, the objectives of this study are to make the following contributions: (1) to develop an SDGs-aligned GDL indicator system with comparability and suitability for use in urban agglomeration assessments; (2) to integrate EEQ as an environmental outcome proxy to jointly assess GDL and environmental change; and (3) to downscale the assessment at administrative district and township levels using remotely sensed satellite datasets, which is consistent with policy implementation units in China. In this study, eco-green development quality is conceptualized as a representation of cleaner development pathways at the regional scale, as it captures how improvements in economic structure, resource use efficiency, and environmental governance have been translated into development outcomes with lower environmental costs. The results provide a joint diagnosis of relationships between development and environment across districts and townships: synergistic (high level of GDL and improved EEQ), mismatched, or underdeveloped (low level of GDL and degraded EEQ). Therefore, by assessing eco-green development quality in this way, local governments and policymakers can identify cleaner development pathways in urban agglomerations, where cleaner production and resource use can be reflected in measurable environmental improvements.
2. Study Area
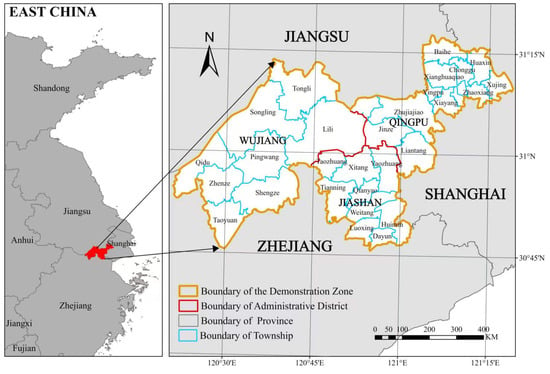
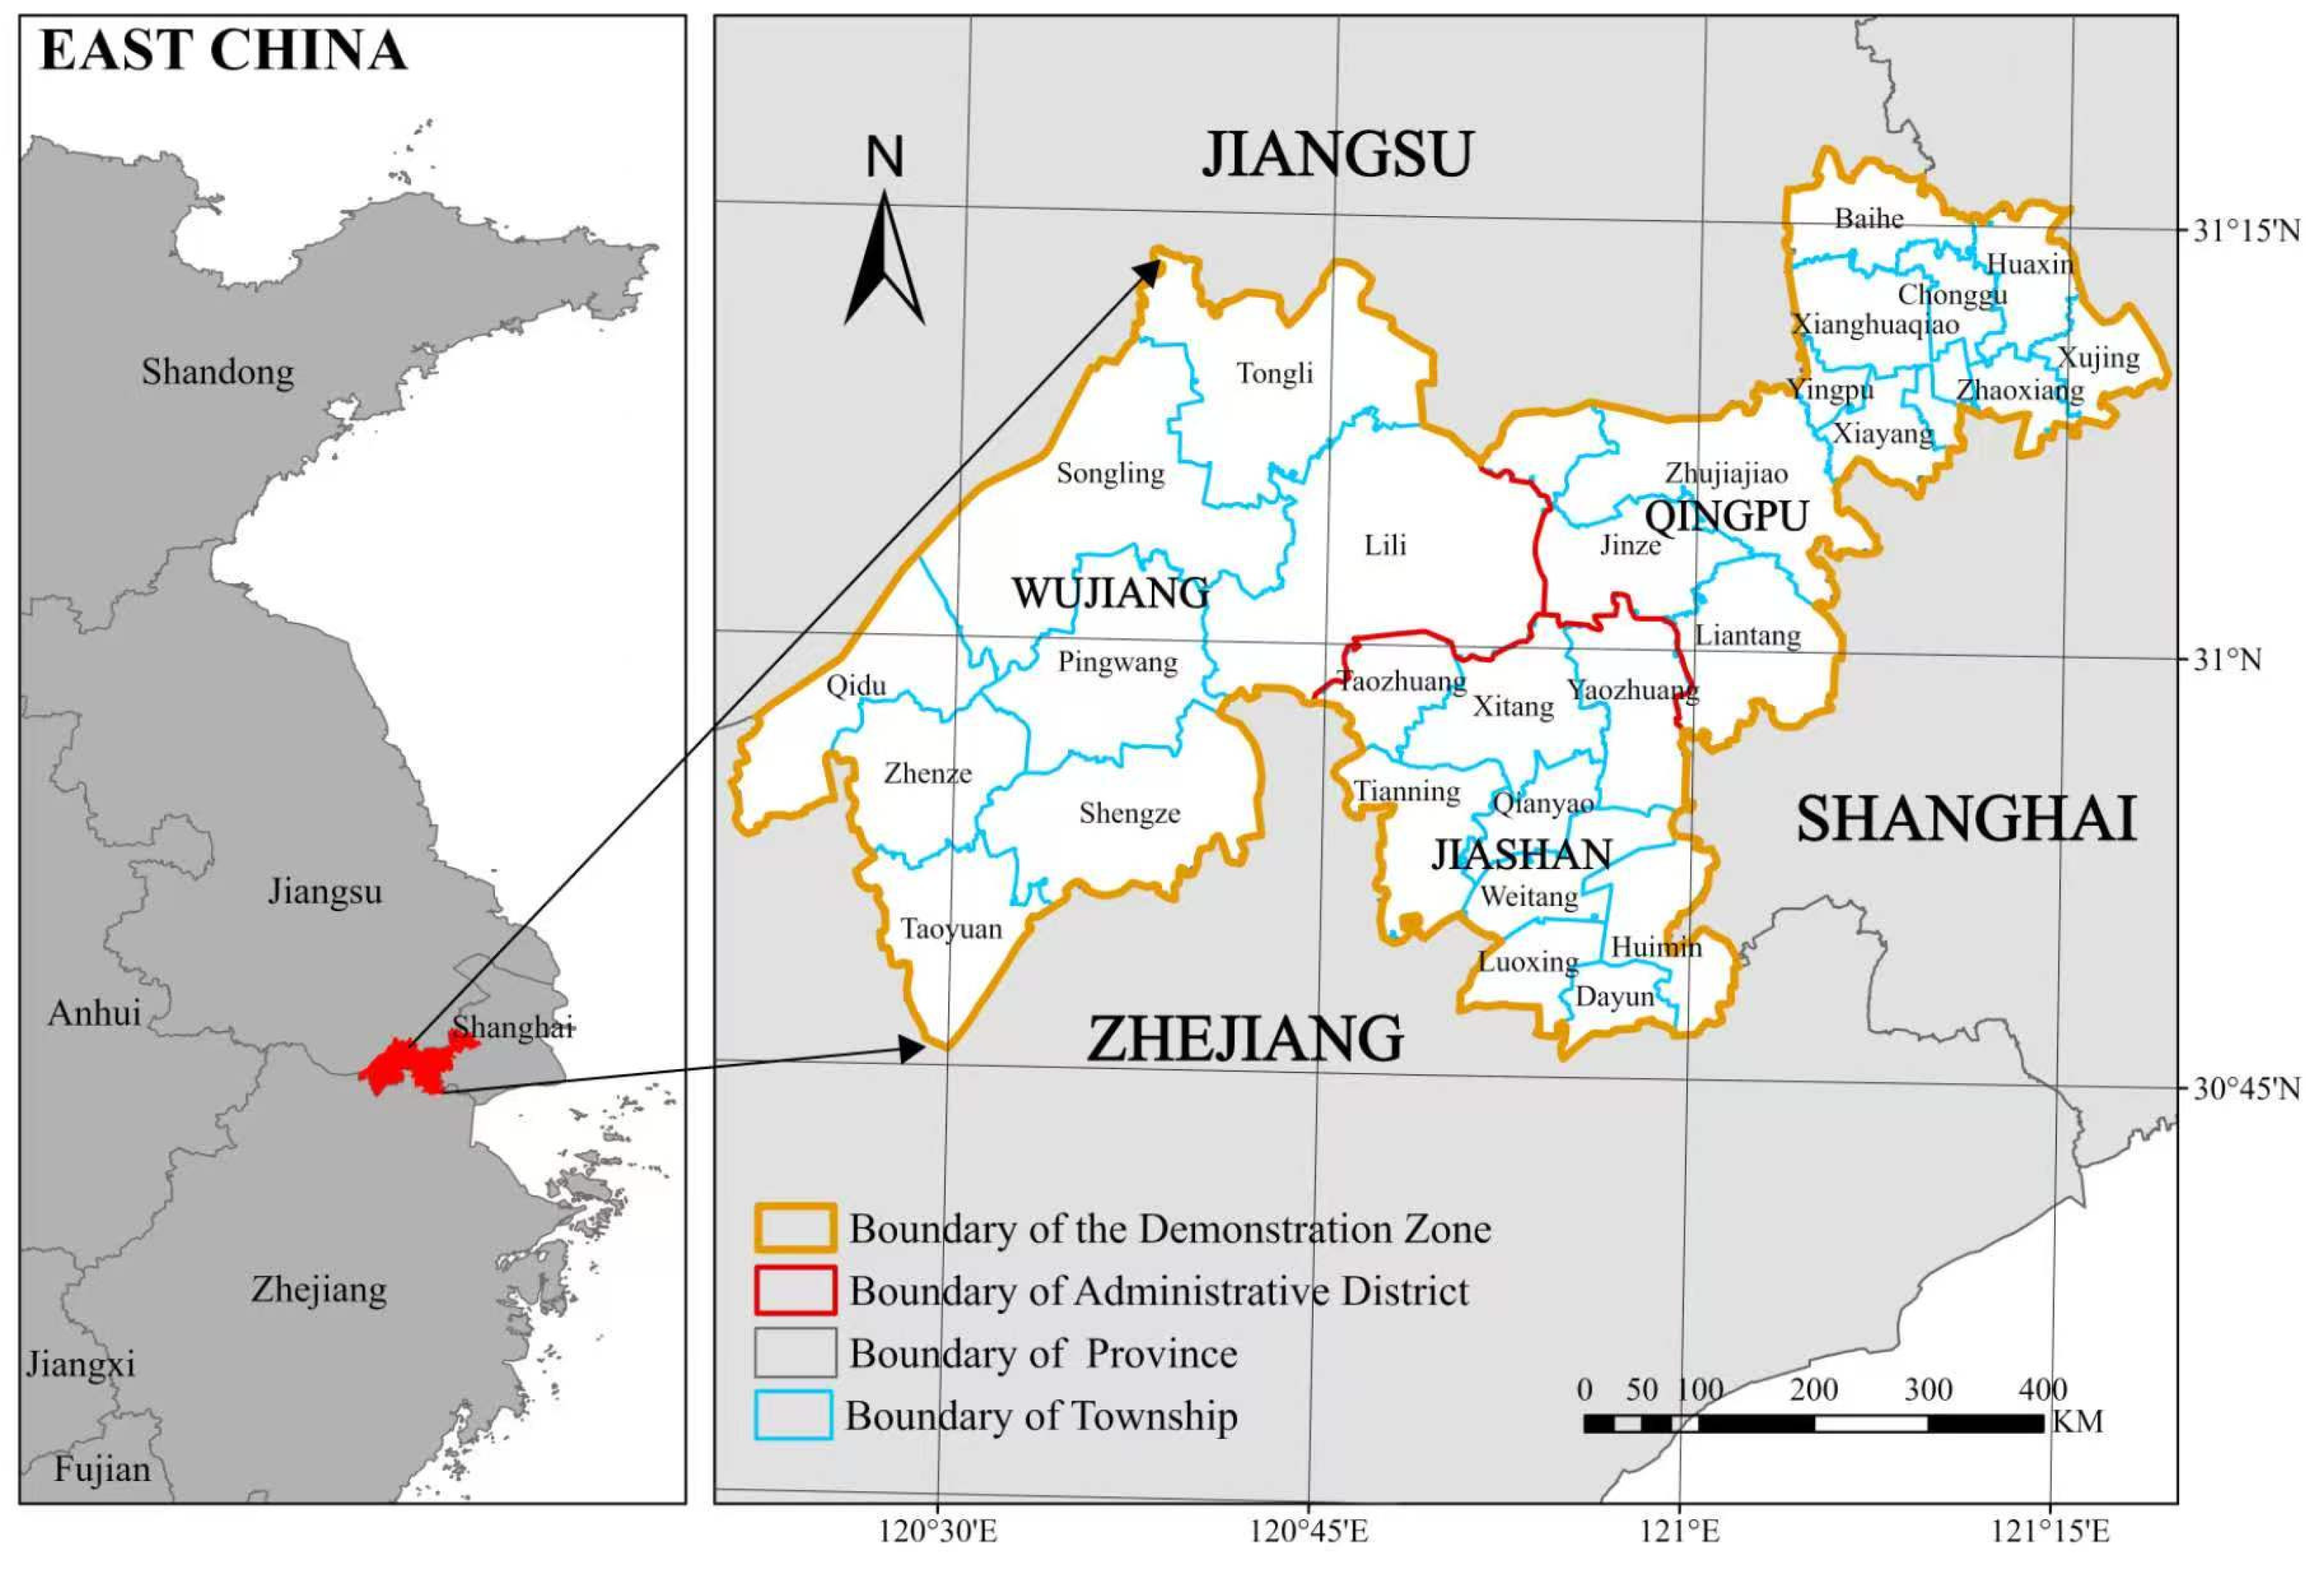
This study selected the Demonstration Zone of Green and Integrated Ecological Development of the Yangtze River Delta (hereafter referred to as “the demonstration zone”), located at the junction of Shanghai, Jiangsu Province, and Zhejiang Province in eastern China (Figure 1). The demonstration zone includes Qingpu District of Shanghai, Wujiang District of Jiangsu, and Jiashan County of Zhejiang, extending from 120.349 to 121.319° E and from 30.760 to 31.294° N. It covers a total area of 2360 km2 and has a population of 2.56 million in 2020. Administrative changes during the study period were limited. Qingpu County was converted to Qingpu District in 1999, while Wujiang was converted from a county-level city to Wujiang District in 2012. To maintain temporal comparability, socioeconomic data were taken from official statistical yearbooks using continuous historical series. Accordingly, Qingpu and Wujiang are referred to consistently as Qingpu District and Wujiang District throughout the study. The demonstration zone comprises diverse land cover types, including wetlands, forests, croplands, grasslands, and built-up areas. As an essential part of China’s Yangtze River Delta regional integration strategy, it has experienced significant economic growth over the last 30 years and has become one of the most developed urban agglomeration areas in China [41]. However, during the process of industrial transformation and rapid urbanization, it also faces significant challenges in balancing economic growth with ecological and environmental protection.
Figure 1.
Study area: Demonstration zone of green and integrated ecological development of the Yangtze River Delta (the demonstration zone).
3. Materials and Methods
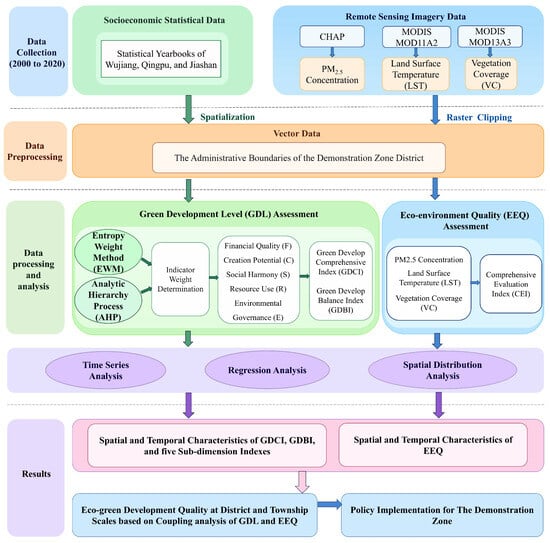
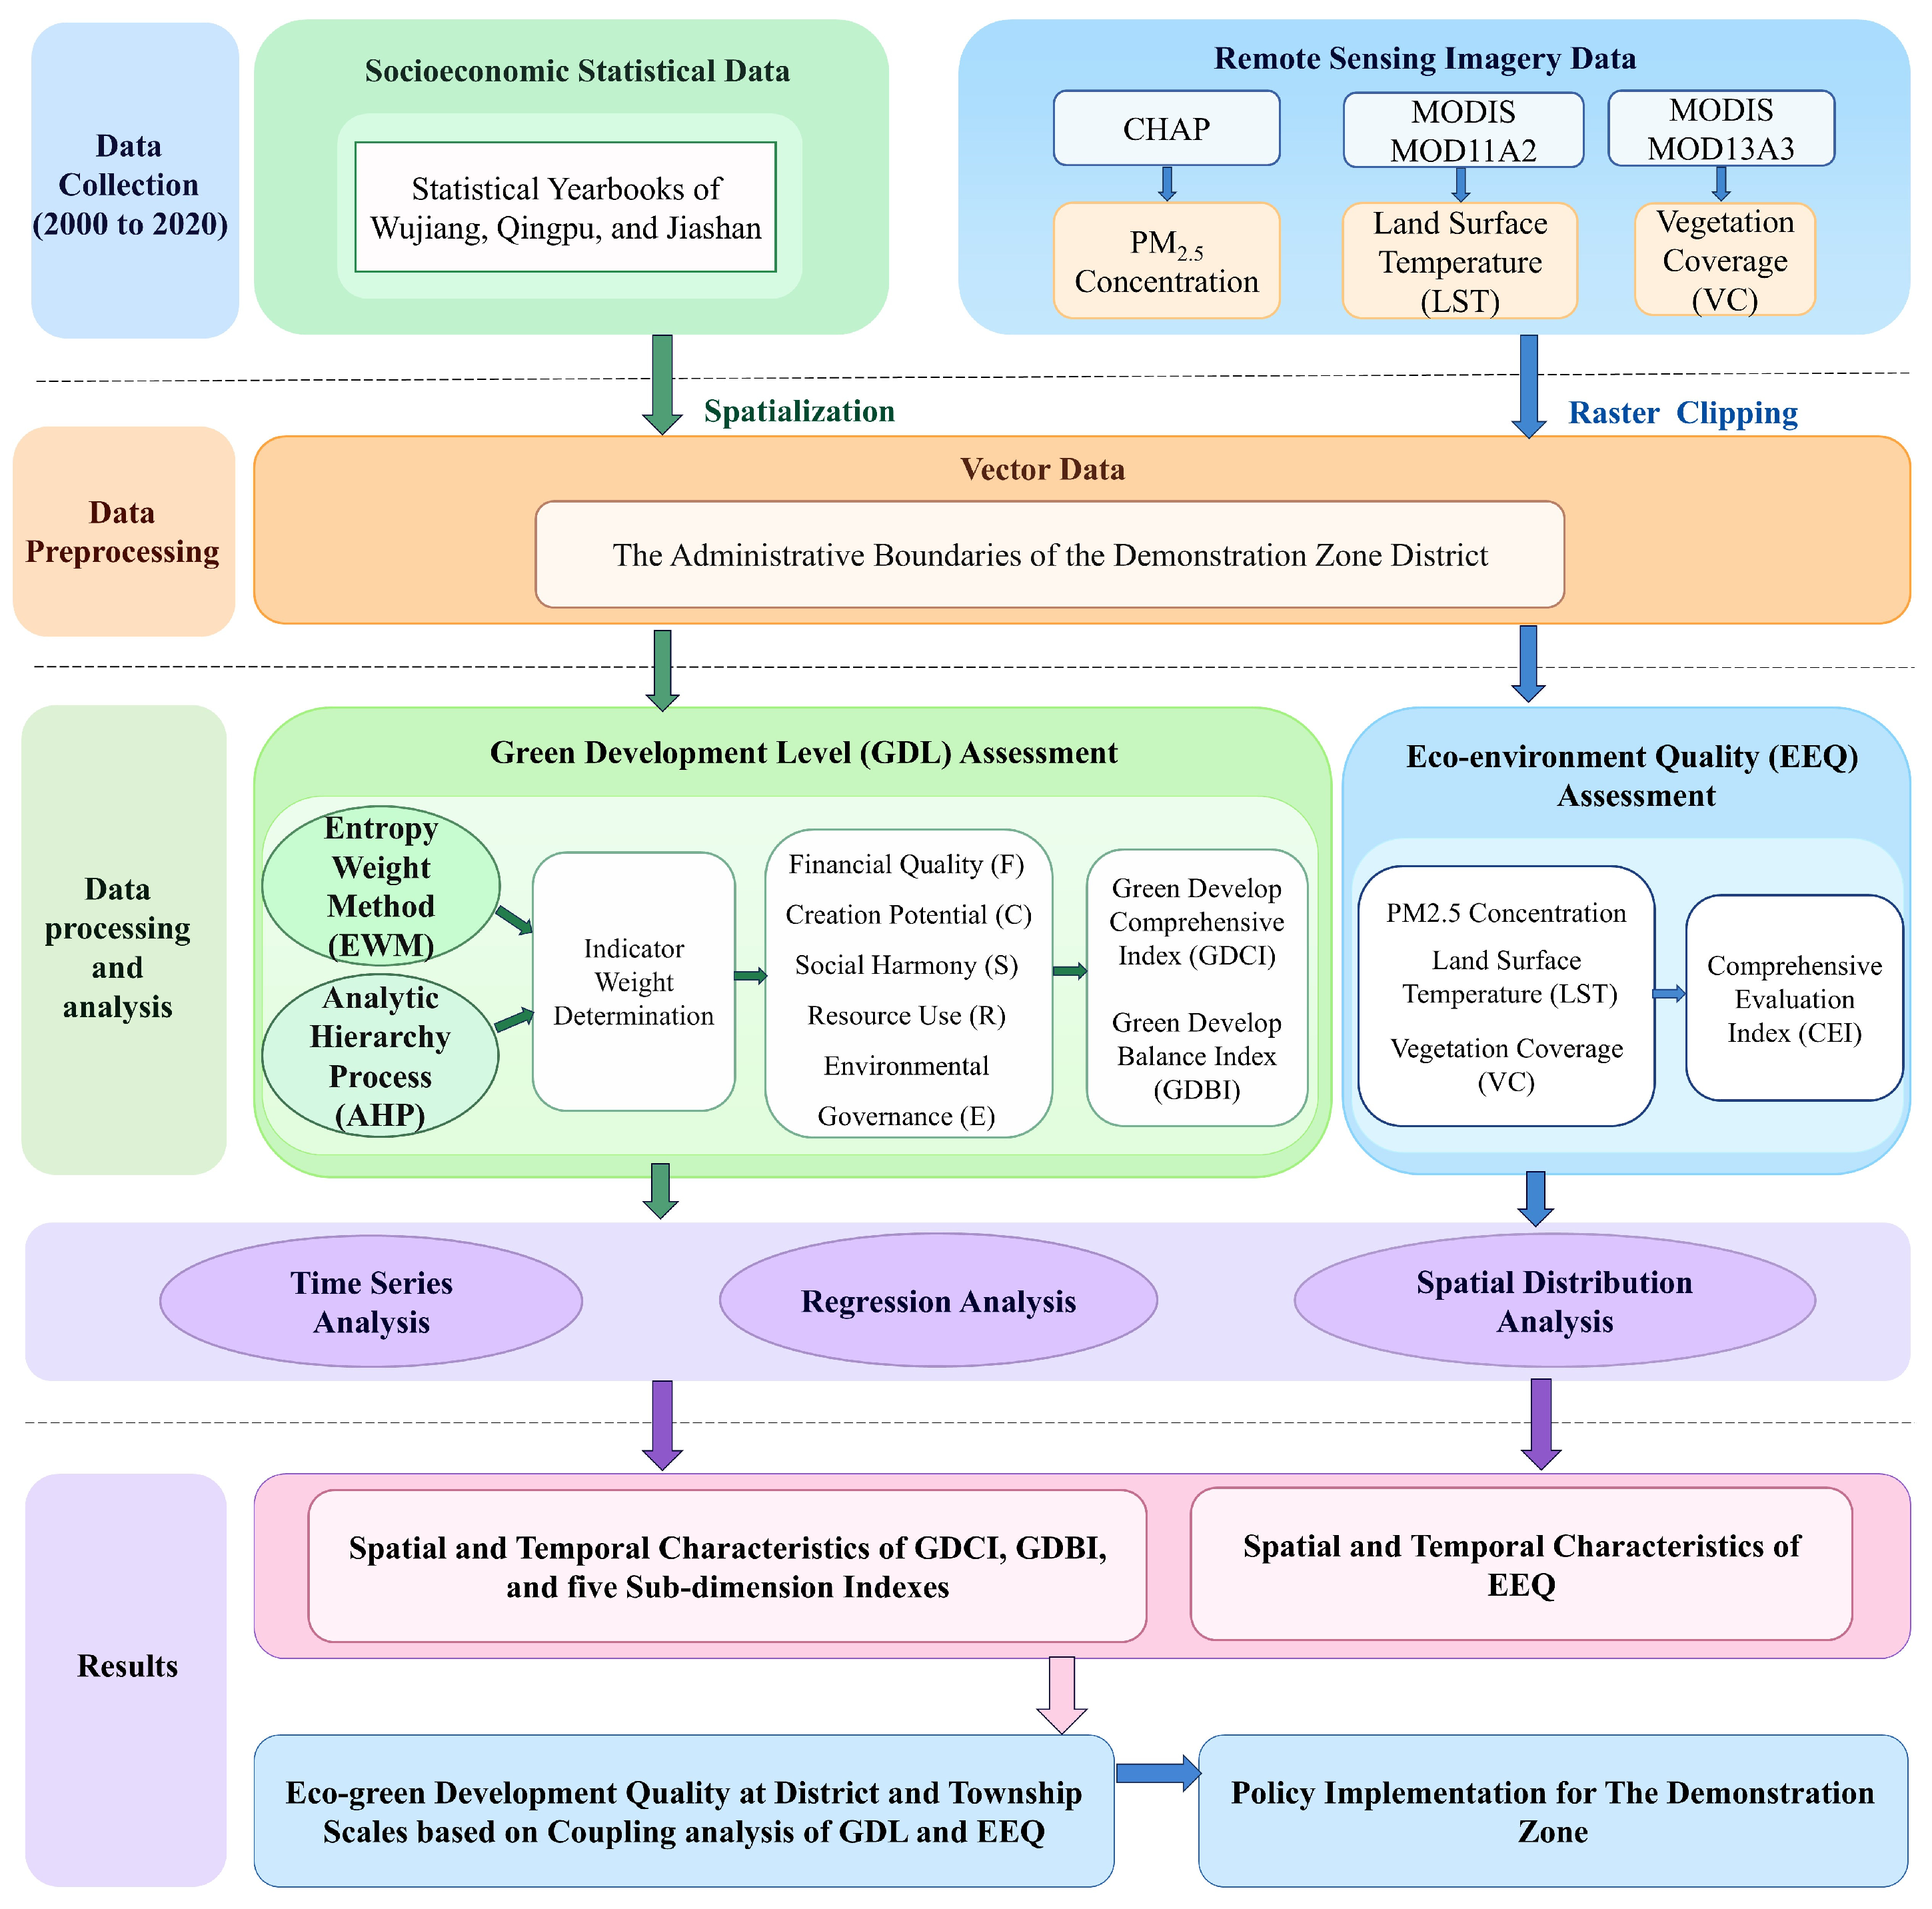
The methodology framework of this study is presented in Figure 2. The core parts of the methodology are assessing GDL and EEQ, and both require long-term time-series data to capture dynamic changes over time. The relevant Datasets from 2000 to 2020 were obtained in Wujiang District, Qingpu District, and Jiashan County. Considering the complexity of land cover patterns in the demonstration zone, the assessment of GDL and EEQ was conducted at the district and county levels. Two indices, the green development comprehensive index (GDCI) and green development balance index (GDBI), were used to assess GDL. Both indices were constructed by indicators aligned with the SDGs across five sub-dimensions: financial quality (F), creation potential (C), social harmony (S), resource use (R), and environmental governance (E). Although RSEI has become one of the most popular EEQ indices in the last decade, it is not the best fit to evaluate EEQ in urban agglomeration areas due to its overlooking the effect of air pollution. This study selected CEI for EEQ assessment because it incorporates PM2.5 concentration [46], a key indicator of air pollution in urban agglomerations, providing a more appropriate measure of ecological and environmental conditions [46]. This study assessed the eco-green development quality across all districts and townships in the demonstration zone.
Figure 2.
Framework of methodology for assessing the eco-green development quality in the demonstration zone.
3.1. Data Preparation
The datasets used in this study contained three main types: the remote sensing data in raster format, the administrative boundaries of the districts and townships in the demonstration zone in vector format, and socioeconomic statistical data. Three sets of Remote Sensing datasets spanning 2000 to 2020 were used to calculate the CEI, which reflects the quality of regional ecological and environmental changes. The PM2.5 concentration dataset at a 1 km spatial resolution was obtained from the ‘ChinaHighAirPollutants’ (CHAP) Dataset developed by Wei et al. [49] (https://weijing-rs.github.io/product.html, accessed on 18 November 2025), which integrates ground-based monitoring observations, satellite remote sensing, atmospheric reanalysis, and model simulations while accounting for the spatiotemporal heterogeneity of air pollution. The dataset achieved a daily cross-validation R2 of 0.92 and an RMSE of 10.76 μg/m3. Its annual PM2.5 dataset was used for interannual analysis, with a three-year moving average applied to the annual series to reduce short-term fluctuations. The MODIS Terra MOD11A2 LST product with a spatial resolution of 1 km was retrieved from the official website of the National Aeronautics and Space Administration (NASA) (https://ladsweb.modaps.eosdis.nasa.gov/search/order/, accessed on 20 November 2025). The indicator of VC was derived from the Normalized Difference Vegetation Index (NDVI), which was obtained from NASA’s 1 km MODIS Terra MOD13A3 product. For the MOD11A2 and MOD13A3 products, annual mean composites were generated from observations within each year after excluding low-quality observations based on the quality-control information provided with the products. In addition, the LUCC data at 1 km resolution from the years 2000, 2005, 2010, 2015, and 2020 were obtained from the Resource and Environmental Science Data Platform (https://www.resdc.cn/DOI/DOI.aspx?DOIID=54, assessed on 25 November 2025) [50] and the National Tibetan Plateau/Third Pole Environment Data Center (https://data.tpdc.ac.cn/en/data/a75843b4-6591-4a69-a5e4-6f94099ddc2d/, assessed on 25 November 2025) [51]. The MODIS data were preprocessed following the method described by Zhu et al. [52]. Batch mosaicking and geometric correction were performed using the MODIS Reprojection Tool (MRT) provided by the National Aeronautics and Space Administration (NASA). All remote sensing datasets were unified to the WGS84 geodetic coordinate system and the UTM Zone 51N projection and resampled accordingly. Moreover, the boundaries of the study area in all remote sensing datasets were extracted using the administrative boundary of the demonstration zone in ArcGIS 10.7. Although the demonstration zone was formally established in 2019, its current boundary was applied to the entire 2000–2020 period as a fixed analytical boundary. Data before 2019 are therefore interpreted as the historical evolution of the same territory rather than as effects of the demonstration zone policy. However, aggregating raster-based EEQ to administrative units may introduce a modifiable areal unit problem (MAUP) and scale effects, because township-level values and class proportions can vary with boundary definition and aggregation scale.
The socioeconomic datasets were collected from the annual Statistical Yearbook of three administrative districts from 2000 to 2021 to calculate the GDL. Since socioeconomic statistics were only available at the administrative district level, GDL was calculated for the three administrative districts. When extending the dual-index framework to the township scale, each township inherited the GDL classification of its corresponding administrative district, whereas EEQ was evaluated individually for each township using remote sensing data.
3.2. The Assessment of the GDL
The evaluation of GDL requires systematic integration of economic, social, resource, and environmental dimensions. An indicator system should be constructed in line with the principles of green development and requirements of the SDGs, while also reflecting the specific conditions of the demonstration zone. A total of 425 representative indicators used to evaluate GDL were identified from the existing literature [4,14,53,54,55,56,57]. This indicator system was developed through a multi-stage screening process based on four principles: comprehensiveness, scientific validity, policy relevance, and data availability. Indicators with duplicated or highly similar meanings were then removed. The remaining indicators were evaluated for their relevance to the characteristics of the demonstration zone and their representativeness of the five sub-dimensions of green development: financial quality (F), creation potential (C), social harmony (S), resource use (R), and environmental governance (E). Moreover, this study also considered measurability, reliability of data sources, temporal continuity, and comparability across three districts. Finally, 38 indicators were selected, and each of them was mapped to the most relevant SDG goal and target according to its conceptual meaning, as shown in Table 1. These indicators were categorized into five sub-dimensions, covering 13 goals of the SDGs. SDG 13 (Climate Action) was not included because consistent long-term district-level carbon data was unavailable for the study period (2000 to 2020). SDGs 5, 14, and 16 were excluded because they have limited relevance to our study area. Although the study area is within the Taihu Basin region, our research focuses more on inland urban agglomeration areas rather than aquatic ecosystems. Table 2 presents the aggregated indicator weights for each SDG. SDG 8 received the highest total weight of 22.5%, and SDG 17 received the lowest (1.52%). Although the distribution is unbalanced, it remains useful for application.
Table 1.
Indicator system for green development level evaluation.
Table 2.
Aggregated indicator weights by Sustainable Development Goals (SDGs).
3.2.1. Indicator Normalization
Since the indicators retrieved from socioeconomic datasets have different units and value ranges, normalization was applied to eliminate the differences [4] and standardize the range of each indicator between 0 and 1:
Positive indicators:
Negative indicators:
where xij denotes the original value of indicator j for region-year observation i. The three administrative units (Qingpu, Jiashan, and Wujiang) over the 21-year period from 2000 to 2020 were pooled into a panel dataset, yielding 63 region-year observations. Therefore, i = 1, 2, …, 63 and m = 63. For each indicator j, the maximum () and minimum () values used for normalization were determined across all 63 region-year observations.
3.2.2. Indicator Weight Determination
The weight of the 38 indicators was determined by combining the entropy weighting method (EWM) and the analytic hierarchy process (AHP). The EMW and AHP were used to calculate objective and subjective weights, respectively. The average of the two results was used as the comprehensive weight for each indicator [54]. After indicator normalization, the weights were computed using the EWM according to the following formulas, following the procedure described in [58]:
where pij is the percentage of indicator j for region i; yij is the value of indicator j in the i region; ej is the entropy value of indicator j; gj is the redundancy of the information entropy of indicator j; wj is the weight of indicator j, respectively. n is the number of indicators, which equals 38. The AHP applies hierarchical thinking by decomposing a problem into multiple levels and developing a mathematical model to determine the relative weight of influencing factors. In this study, the IBM SPSS Statistics 20 software was used to construct the AHP hierarchical structure model and to build pairwise comparison matrices. A 1–9 scale was adopted to compare the factors, followed by the calculation of weight vectors and a consistency test. Finally, the weights from different levels were combined to derive the overall weights determined by the AHP method.
gj = 1 − ej
3.2.3. Calculation of the GDCI
After calculating the weights obtained from EWM and AHP, a linear weighting method was applied to compute the comprehensive weights of the indicators as follows:
where is the weight of indicator j determined by the AHP method; Cj is the comprehensive weight of indicator j, respectively. The evaluation results for indicator j in district i during year y can then be calculated as follows:
vijy = Cj × yijy
The annual value of each sub-dimension to evaluate the GDCI can be calculated by adding the evaluation results of all its indicators:
where Vixy is the annual value of sub-dimension x (F, C, S, R, and E) in district i (Wujiang District, Jiashan County, and Qingpu District) during year y, and n is the number of indicators belonging to sub-dimension x. The annual GDCI value during year y from 2000 to 2020 for district i can be calculated by adding the results of all sub-dimensions together:
GDLiy = Fiy + Ciy + Siy + Riy + Eiy
3.2.4. Calculation of the GDBI
This study further introduces the GDBI, as described in Zhang [58], to evaluate the equilibrium among the sub-dimensions of GDL in the demonstration zone and to examine its changes from 2000 to 2020. GDBI can assess the coordination of multiple benefits by using their product, helping to ensure that the increase in benefit in one sub-dimension does not come at the expense of others, and it can be calculated as follows:
where BIiy and Aiy are the balanced index and average value of GDL in five sub-dimensions in district i during year y, respectively; b is the adjustment coefficient and is usually set to 8 [58].
Aiy = GDLiy/5
3.3. The Evaluation of the EEQ Through the CEI
This study uses the CEI as a remote-sensing proxy for EEQ, which serves as a component of the eco-green development framework and will subsequently be linked with GDL for analysis. It accounts for three eco-environmental indicators: PM2.5 concentration, LST, and VC, which represent atmospheric pollution, surface thermal conditions, and vegetation status, respectively. Since these three indicators have different value ranges, a normalization process was applied to rescale them to the same range (0 to 1) before calculating the annual CEI. It is derived by calculating the geometric mean of the normalized changes in these three factors over a given period (2000 to 2020) [46,59].
where denotes the value of EEQ change in pixel i in the year k from 2001 to 2020. , represent the normalized changes in PM2.5 concentration, VC, and LST of pixel i in year k (k = 2001, …, 2020) compared with the baseline year 2000, respectively. can be calculated as follows:
where and represent the value of PM2.5 concentration of pixel i in the year 2000 and the year k (k = 2001, …, 2020), respectively; and denote the maximum and minimum values of PM2.5 concentration changes across all pixels in the demonstration zone from 2000 to 2020. can be calculated as follows:
where and represent the LST of pixel i in the year k (k = 2001, …, 2020) and year 2000, respectively; and max∆LST and min∆LST denote the maximum and minimum values of LST changes across all pixels in the demonstration zone during 2000 to 2020.
The VC values of pixels in the demonstration zone were calculated from the NDVI values of the corresponding pixels, following the method proposed by Sellers et al. [60]:
where represents the vegetation coverage condition at pixel i during the kth year; denotes the NDVI value of pixel i in the kth year; and refer to the maximum and minimum NDVI values of all pixels in the demonstration zone during the same year, respectively. Since higher VC indicates better eco-environment conditions, which is the opposite of the other two indices, can be calculated as follows:
where and represent the VC of pixel i in the year k and year 2000, respectively. max∆VC and min∆VC denote the maximum and minimum values of VC changes across all pixels in the demonstration zone during 2000 to 2020. Based on the calculated annual CEI indices for the years 2001 to 2020, the mean value of the annual CEI within the 20 years was then derived by using the following formula:
In general, a relatively larger CEI indicates that eco-environment conditions are changing toward degradation, reflecting poorer quality [46]. In comparison, a smaller CEI value suggests the eco-environment is improving, reflecting better quality.
The annual CEI value for each pixel from 2001 to 2020 was calculated using the methods described above. The ecological and environmental conditions during this period were further classified into three levels: “improved”, “stable”, and “degraded” based on the thresholds introduced in He et al. [61] and He et al. [46] (Table 3) through time series analysis at the pixel level. Based on the vector boundary of administrative units, the proportion of pixels belonging to each level within the demonstration zone, three administrative districts, and 28 townships can be further calculated to analyze the spatial distribution differences:
where represents the area of the i th level of eco-environment quality change in target region k (can be demonstration zone, administrative district, or township), while represents the total area of the corresponding region k.
Table 3.
Classification criteria of eco-environment quality (EEQ) change levels in the demonstration zone at pixel scale.
3.4. Regression Analysis
Linear regression was applied to evaluate the temporal dynamics of the annual time-series values of GDL and CEI. In addition, the dynamics of five sub-dimensions of GDL and three components of CEI were also analyzed. The least squares method was employed to fit a straight line to the annual data series, thereby representing their long-term trends. The slope of the fitted line was calculated using the following formula:
where a denotes the trend slope, n is the number of years in the monitoring period, and xi represents the value of year i. A negative slope indicates a decreasing trend in the annual data over time, while a positive slope indicates an increasing trend. The larger the absolute value of the slope, the faster the rate of change. To assess the statistical significance of the interannual trend, the correlation coefficient between the annual data series and the corresponding time series of years was calculated [62]. The significance reflects only the trend’s confidence level, not the rate of change. The formula for the correlation coefficient is given as follows:
where rxy denotes the correlation coefficient between the two variables x and y, xi is the annual value in year i, yi is the year number corresponding to i, is the mean of the data value from multiple years; is the mean of the years during the monitoring period; and n is the number of years in the monitoring period, respectively.
Based on the statistical test results, the trends were classified into five levels: significantly decrease (a < 0, p < 0.01); decrease (a < 0, 0.01 < p < 0.05); not significant (p > 0.5); increase (a > 0, 0.01 < p < 0.05); and significantly increase (a > 0, p < 0.01) [63].
4. Results
4.1. Assessment of GDL in the Demonstration Zone
4.1.1. Temporal Variation Trends of the GDCI in the Demonstration Zone
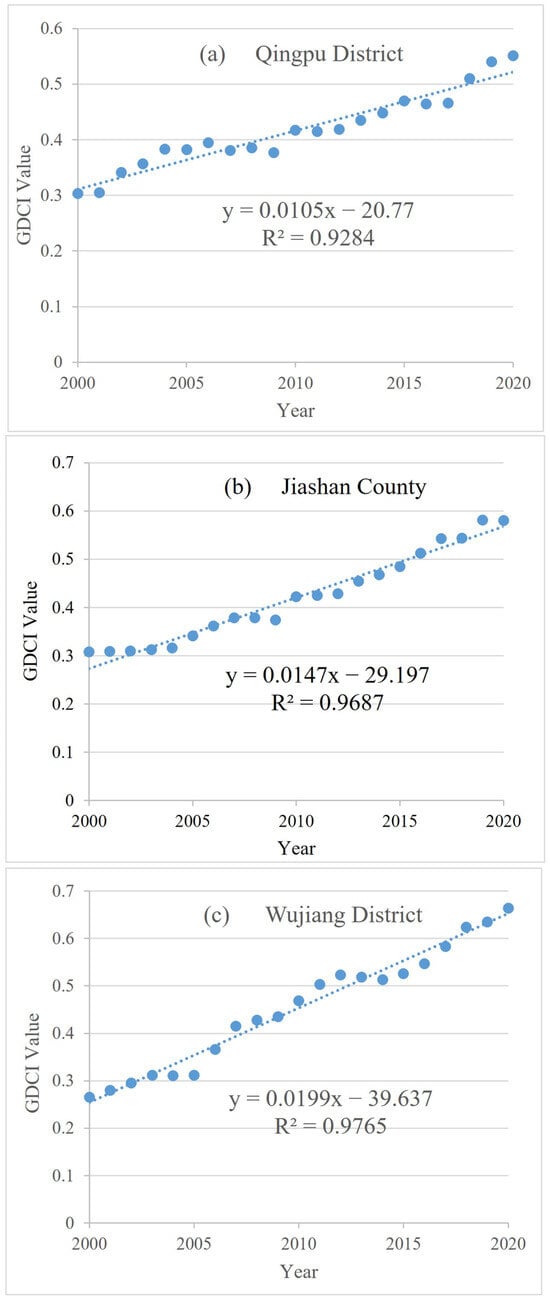
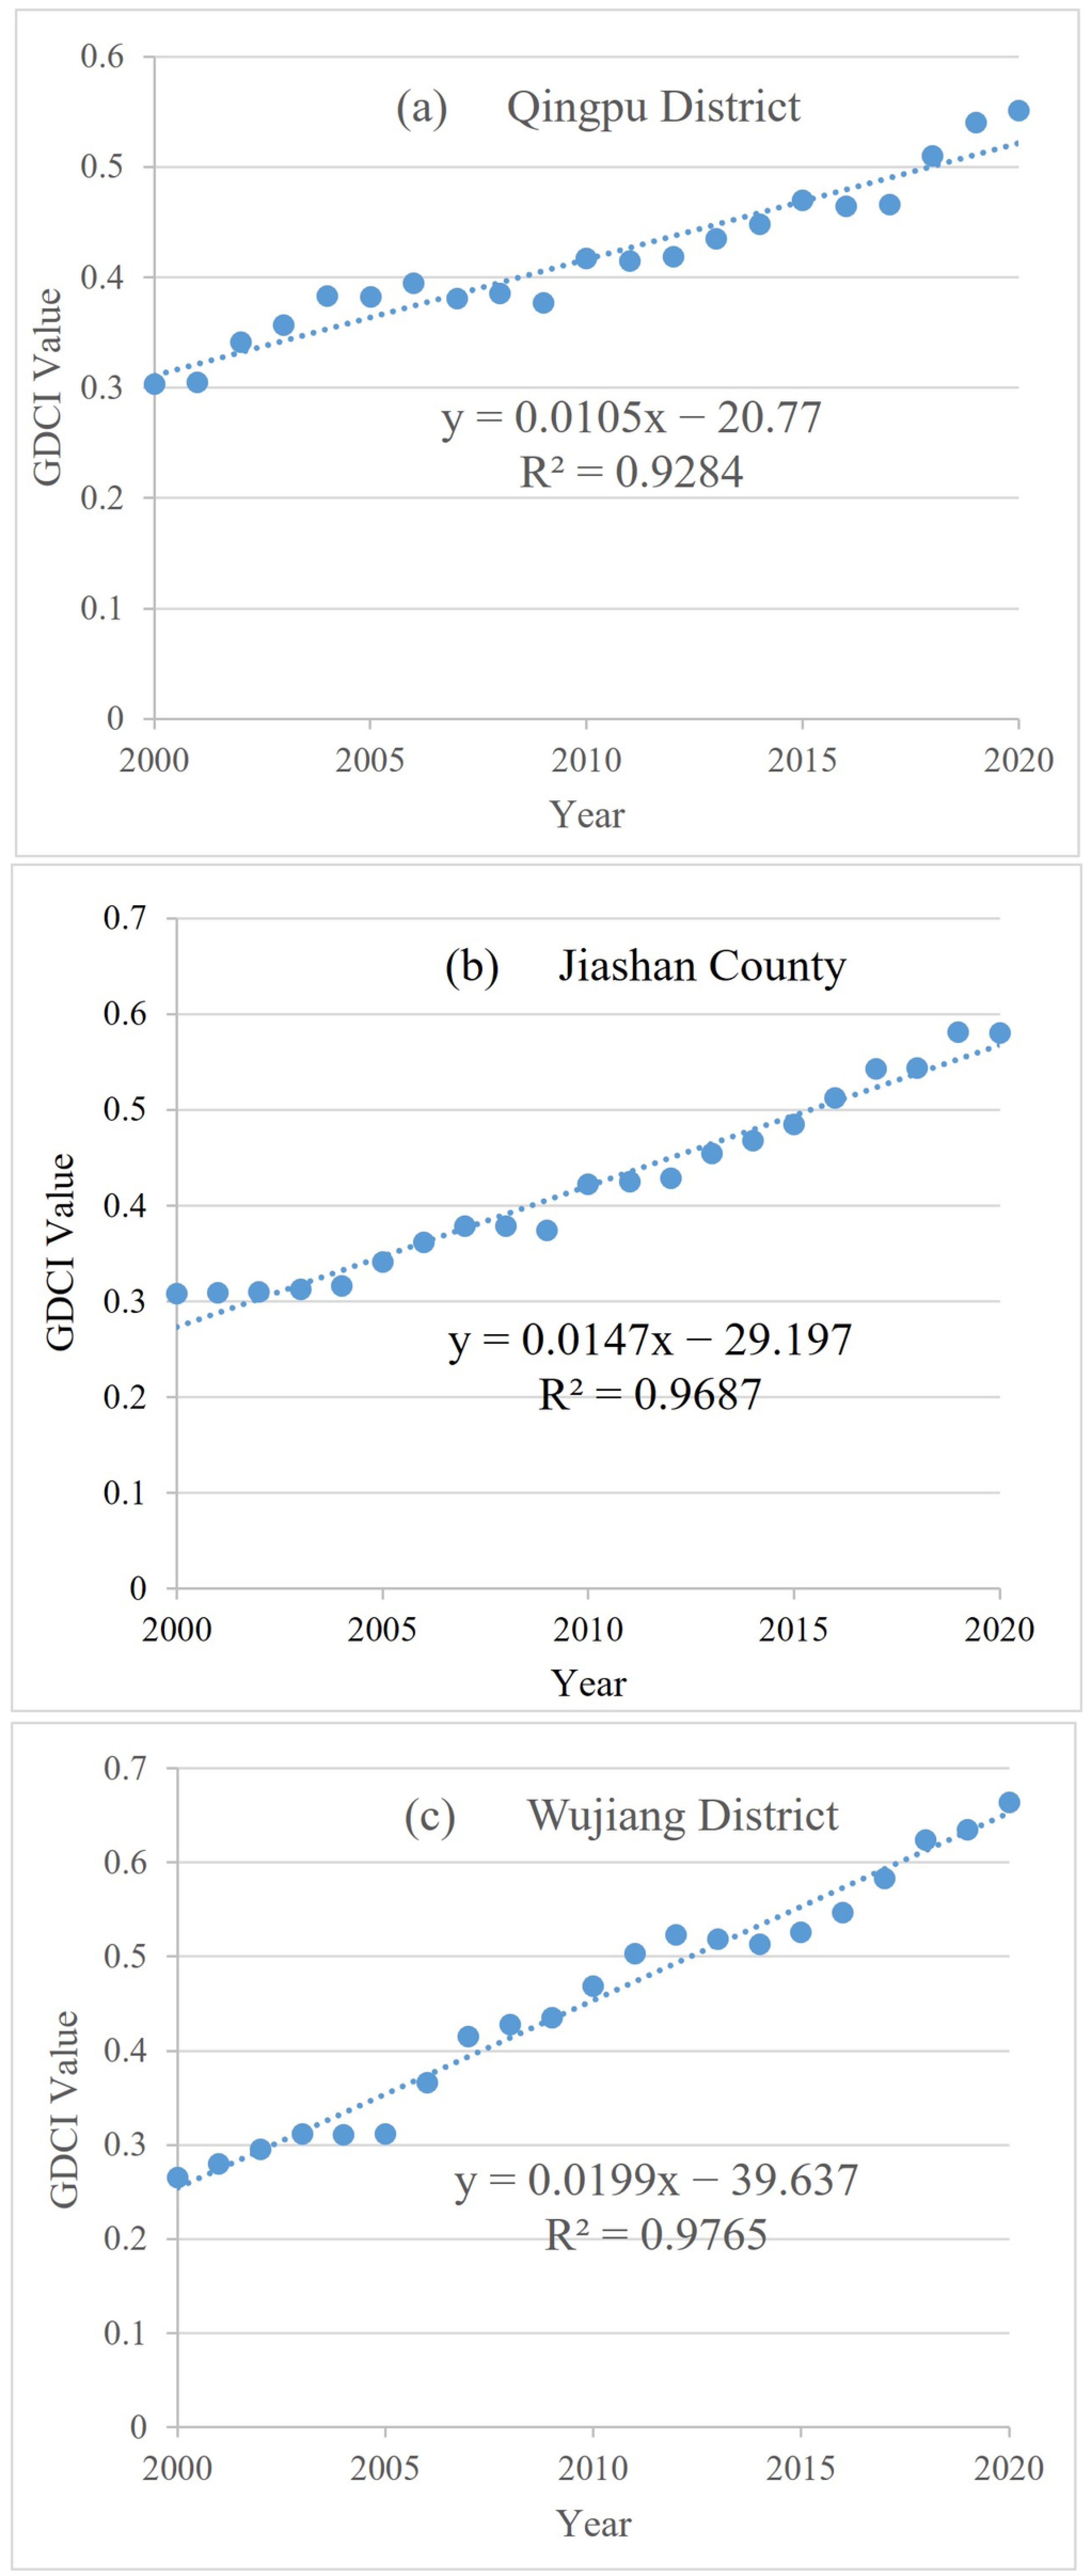
An analysis was conducted on the GDCI of the three districts within the demonstration zone from 2000 to 2020. During this period, the average GDCI values for Qingpu District, Jiashan County, and Wujiang District were 0.416, 0.421, and 0.454, respectively (Figure 3 and Table 4). All three districts exhibited a significantly increasing trend during this period, with fitted slopes of 0.011, 0.015, and 0.02 for Qingpu, Jiashan, and Wujiang, respectively (Table 4). Among the annual GDCI values from 2000 to 2020 in the three districts and counties, the maximum and minimum values were observed in Wujiang District (maximum in 2020 and minimum in 2000), indicating that it experienced faster growth than the other two. Qingpu District and Jiashan County showed similar patterns in terms of initial and final years, average value, and growth rate, with Jiashan County showing slightly better (higher) GDCI.
Figure 3.
Time series of annual green development comprehensive index (GDCI) of three districts: (a) Qingpu; (b) Jiashan; and (c) Wujiang, from 2000 to 2020.
Table 4.
Evaluation of green development levels across the three districts within the demonstration zone.
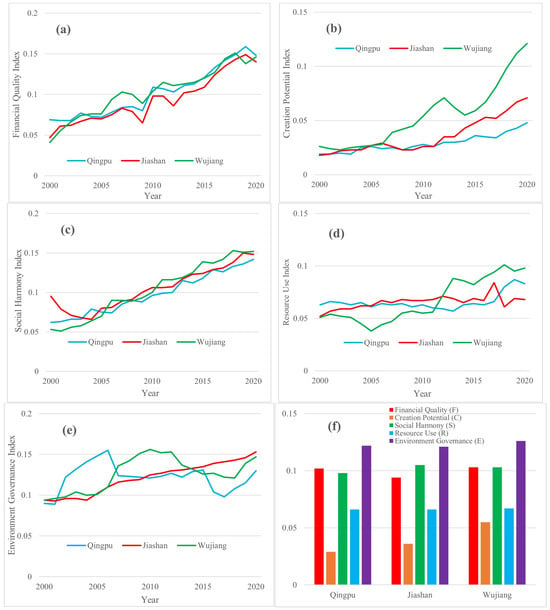
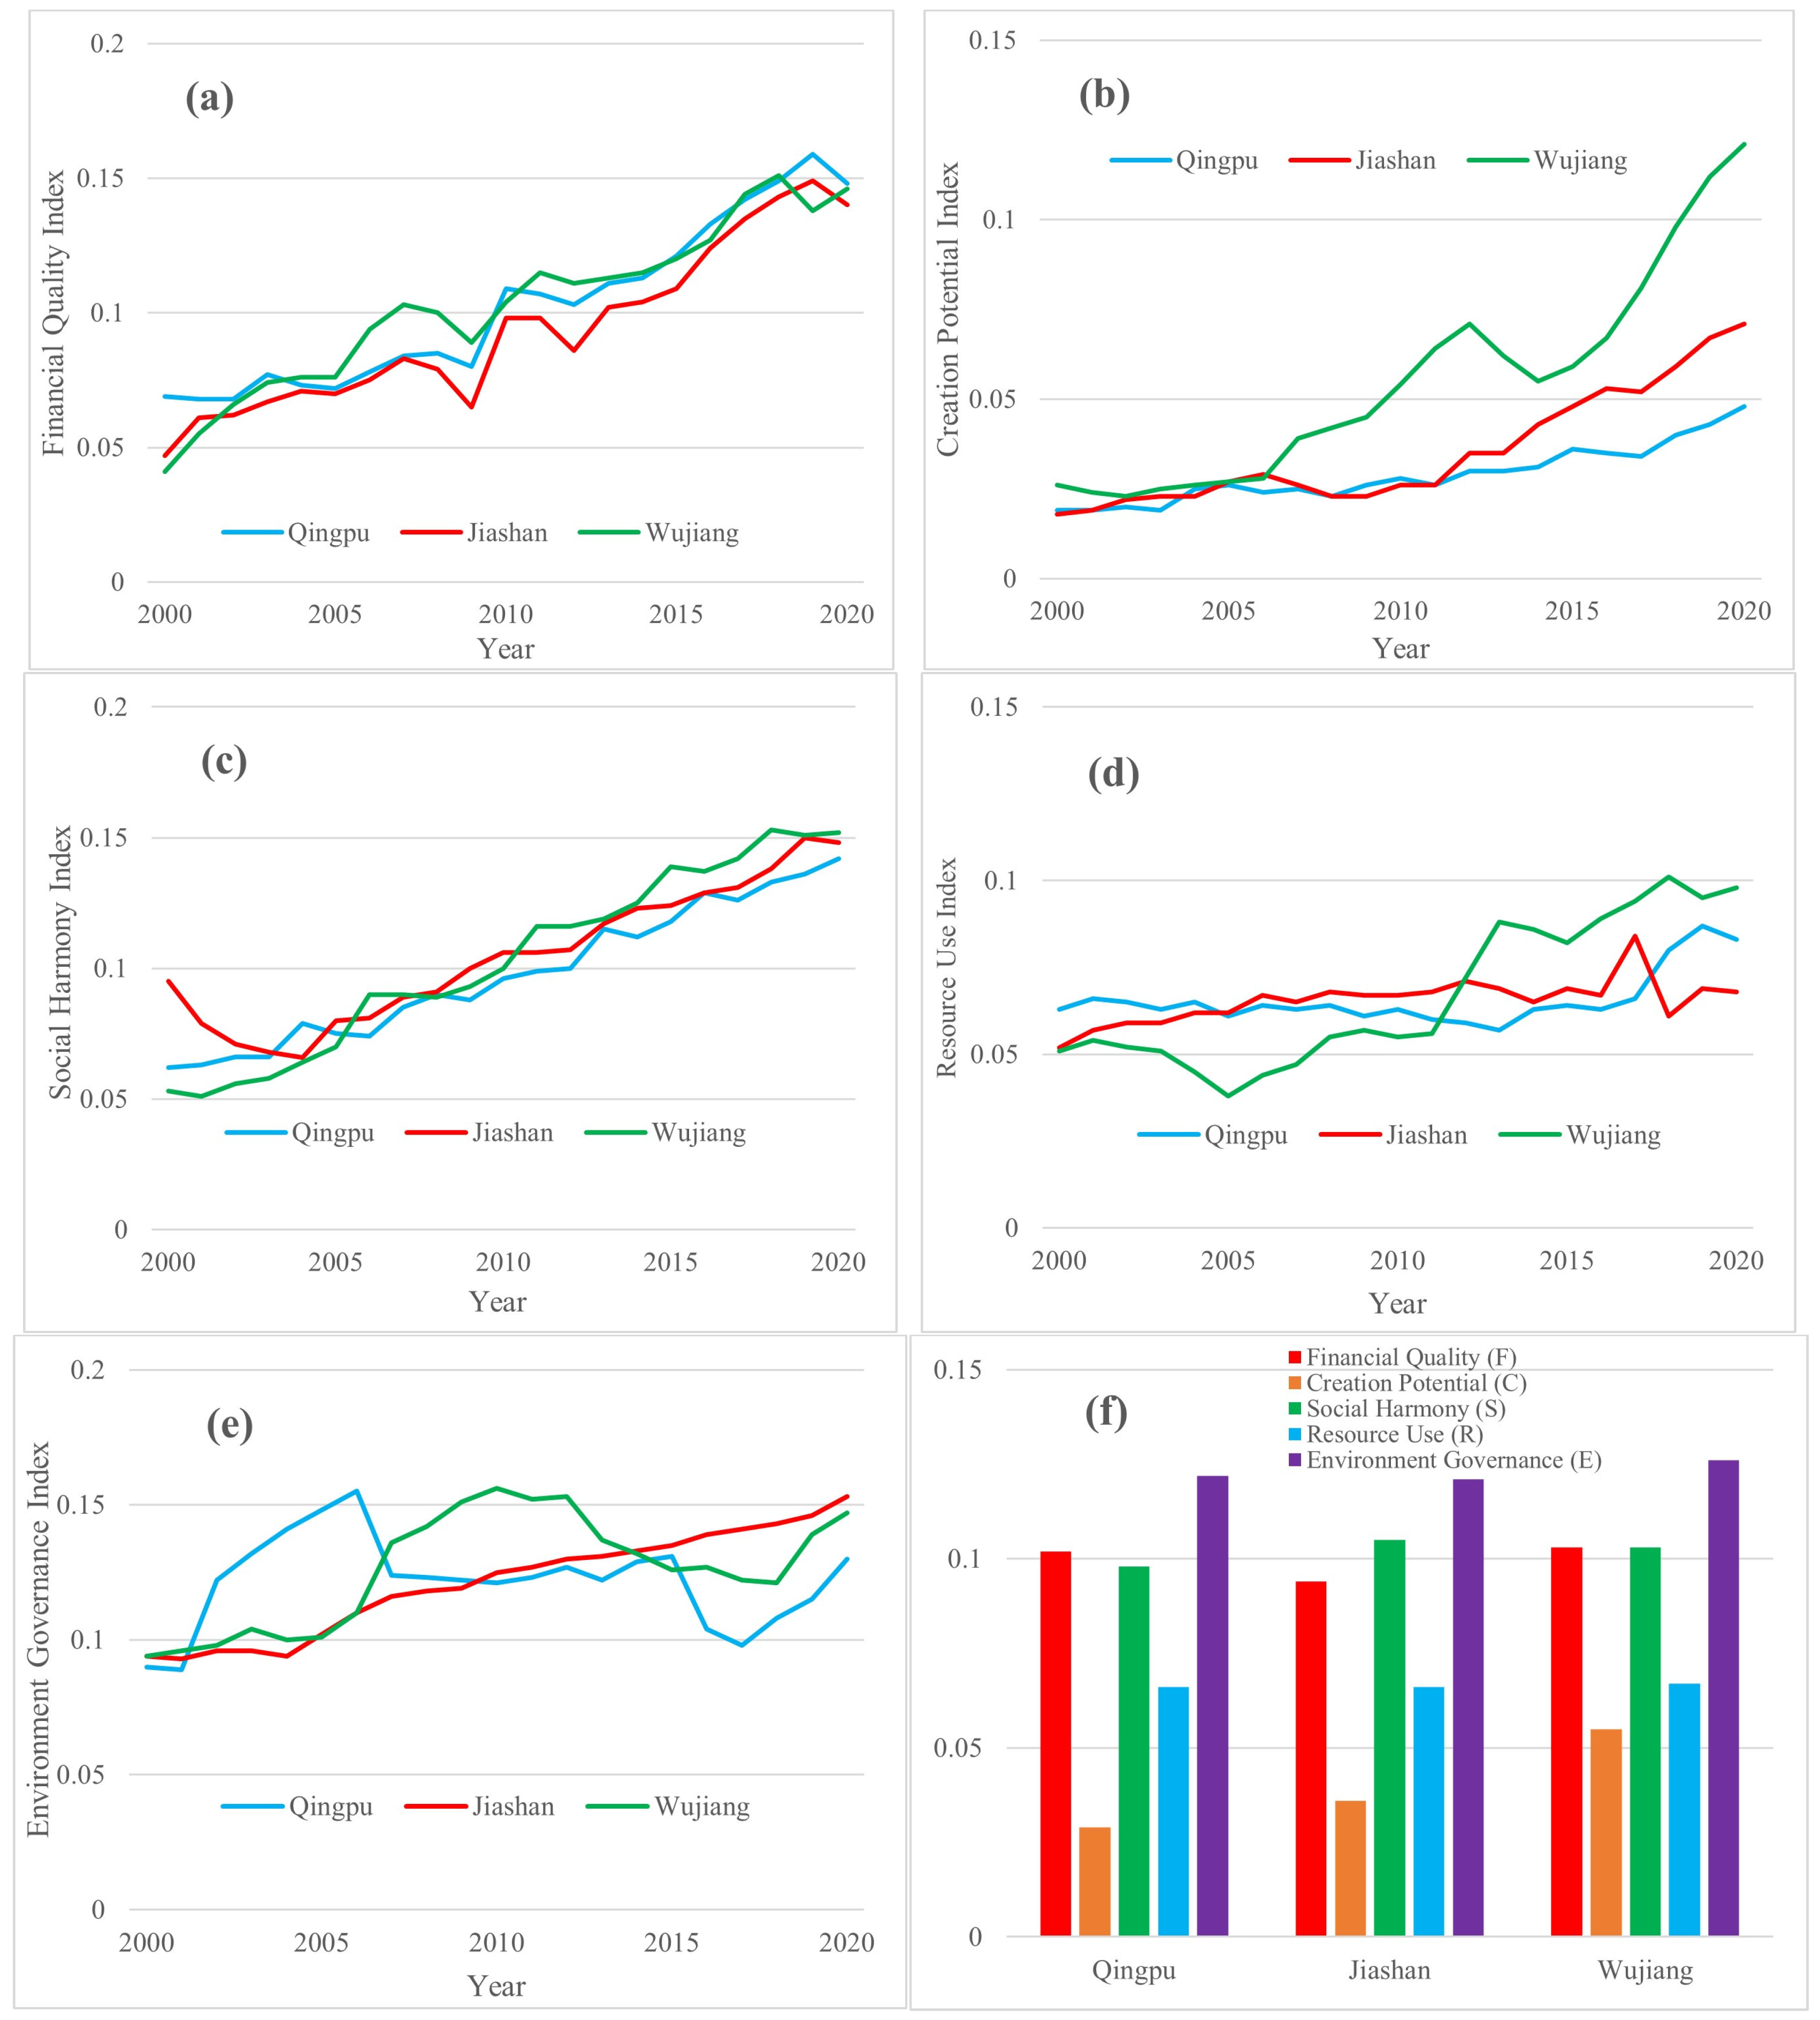
This study further analyzed the trends of five sub-dimensions of GDL. From 2000 to 2020, the average financial quality sub-dimension of Qingpu District, Jiashan County, and Wujiang District was 0.102, 0.094, and 0.103, respectively (Table 4). A time-series regression analysis of the annual financial quality index revealed that all three districts showed a significantly increasing trend, with fitted slopes of 0.005 for each (Figure 4a and Table 4). This suggests the economic quality development of the three districts was generally comparable, with Wujiang and Qingpu performing slightly better than Jiashan. As Figure 4b shows, all three districts demonstrated significant upward trends in the creation potential index, but the growth rates differ. Wujiang displayed both the highest level (0.055) of average value and the fastest growth (0.004) (Table 4). This suggests that Wujiang’s innovation potential and its growth rate were obviously higher than those of the other two. Figure 4c shows that social harmony improved steadily in all three districts over the study period, with fitted slopes ranging from 0.004 to 0.006 (Table 4). The average social harmony sub-dimension index suggests that the overall development of a harmonious society in the three districts was generally comparable, with Jiashan (0.105) and Wujiang (0.103) performing slightly better than Qingpu (0.098) (Table 4). Time-series regression analysis of the annual resource use index showed that the three districts and counties all exhibited increasing or significantly increasing trends (Figure 4d). Although Wujiang had a lower resource use index than Qingpu and Jiashan before 2011, it experienced a faster growth from 2011 to 2014 and eventually surpassed the other two in later years. Consequently, the 2000–2020 mean values of the three districts were very similar. The average value of environmental governance for Qingpu District, Jiashan County, and Wujiang District was 0.122, 0.121, and 0.126, respectively (Table 4). In comparison, Wujiang consistently maintained a high level of environmental governance throughout the study period (Figure 4e). Jiashan exhibited a continuous upward trend in environmental governance, which was reflected by the largest fitted slope (0.003). In comparison, Qingpu experienced obvious fluctuations, with an increase in the early years but followed by a decline after 2005, resulting in an overall stagnant trend (Figure 4e). Overall, Wujiang had the highest average values in four of the five sub-dimensions among the three districts from 2000 to 2020, except for social harmony (Figure 4f).
Figure 4.
Time series of annual values of sub-dimensions: (a) financial quality index; (b) creation potential index; (c) social harmony index; (d) resource use index; (e) environmental governance index, and (f) average value of sub-dimensions from 2000 to 2020 in three districts.
4.1.2. Temporal Variation Trends of GDBI in the Demonstration Zone
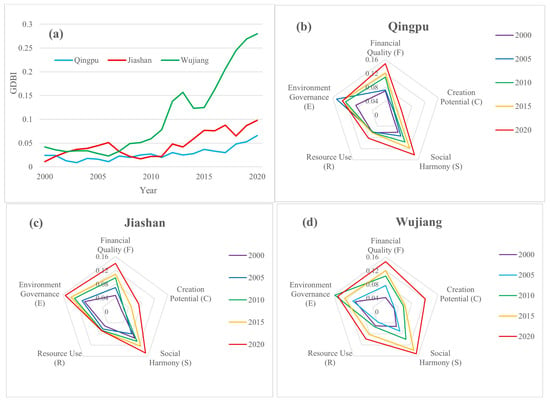
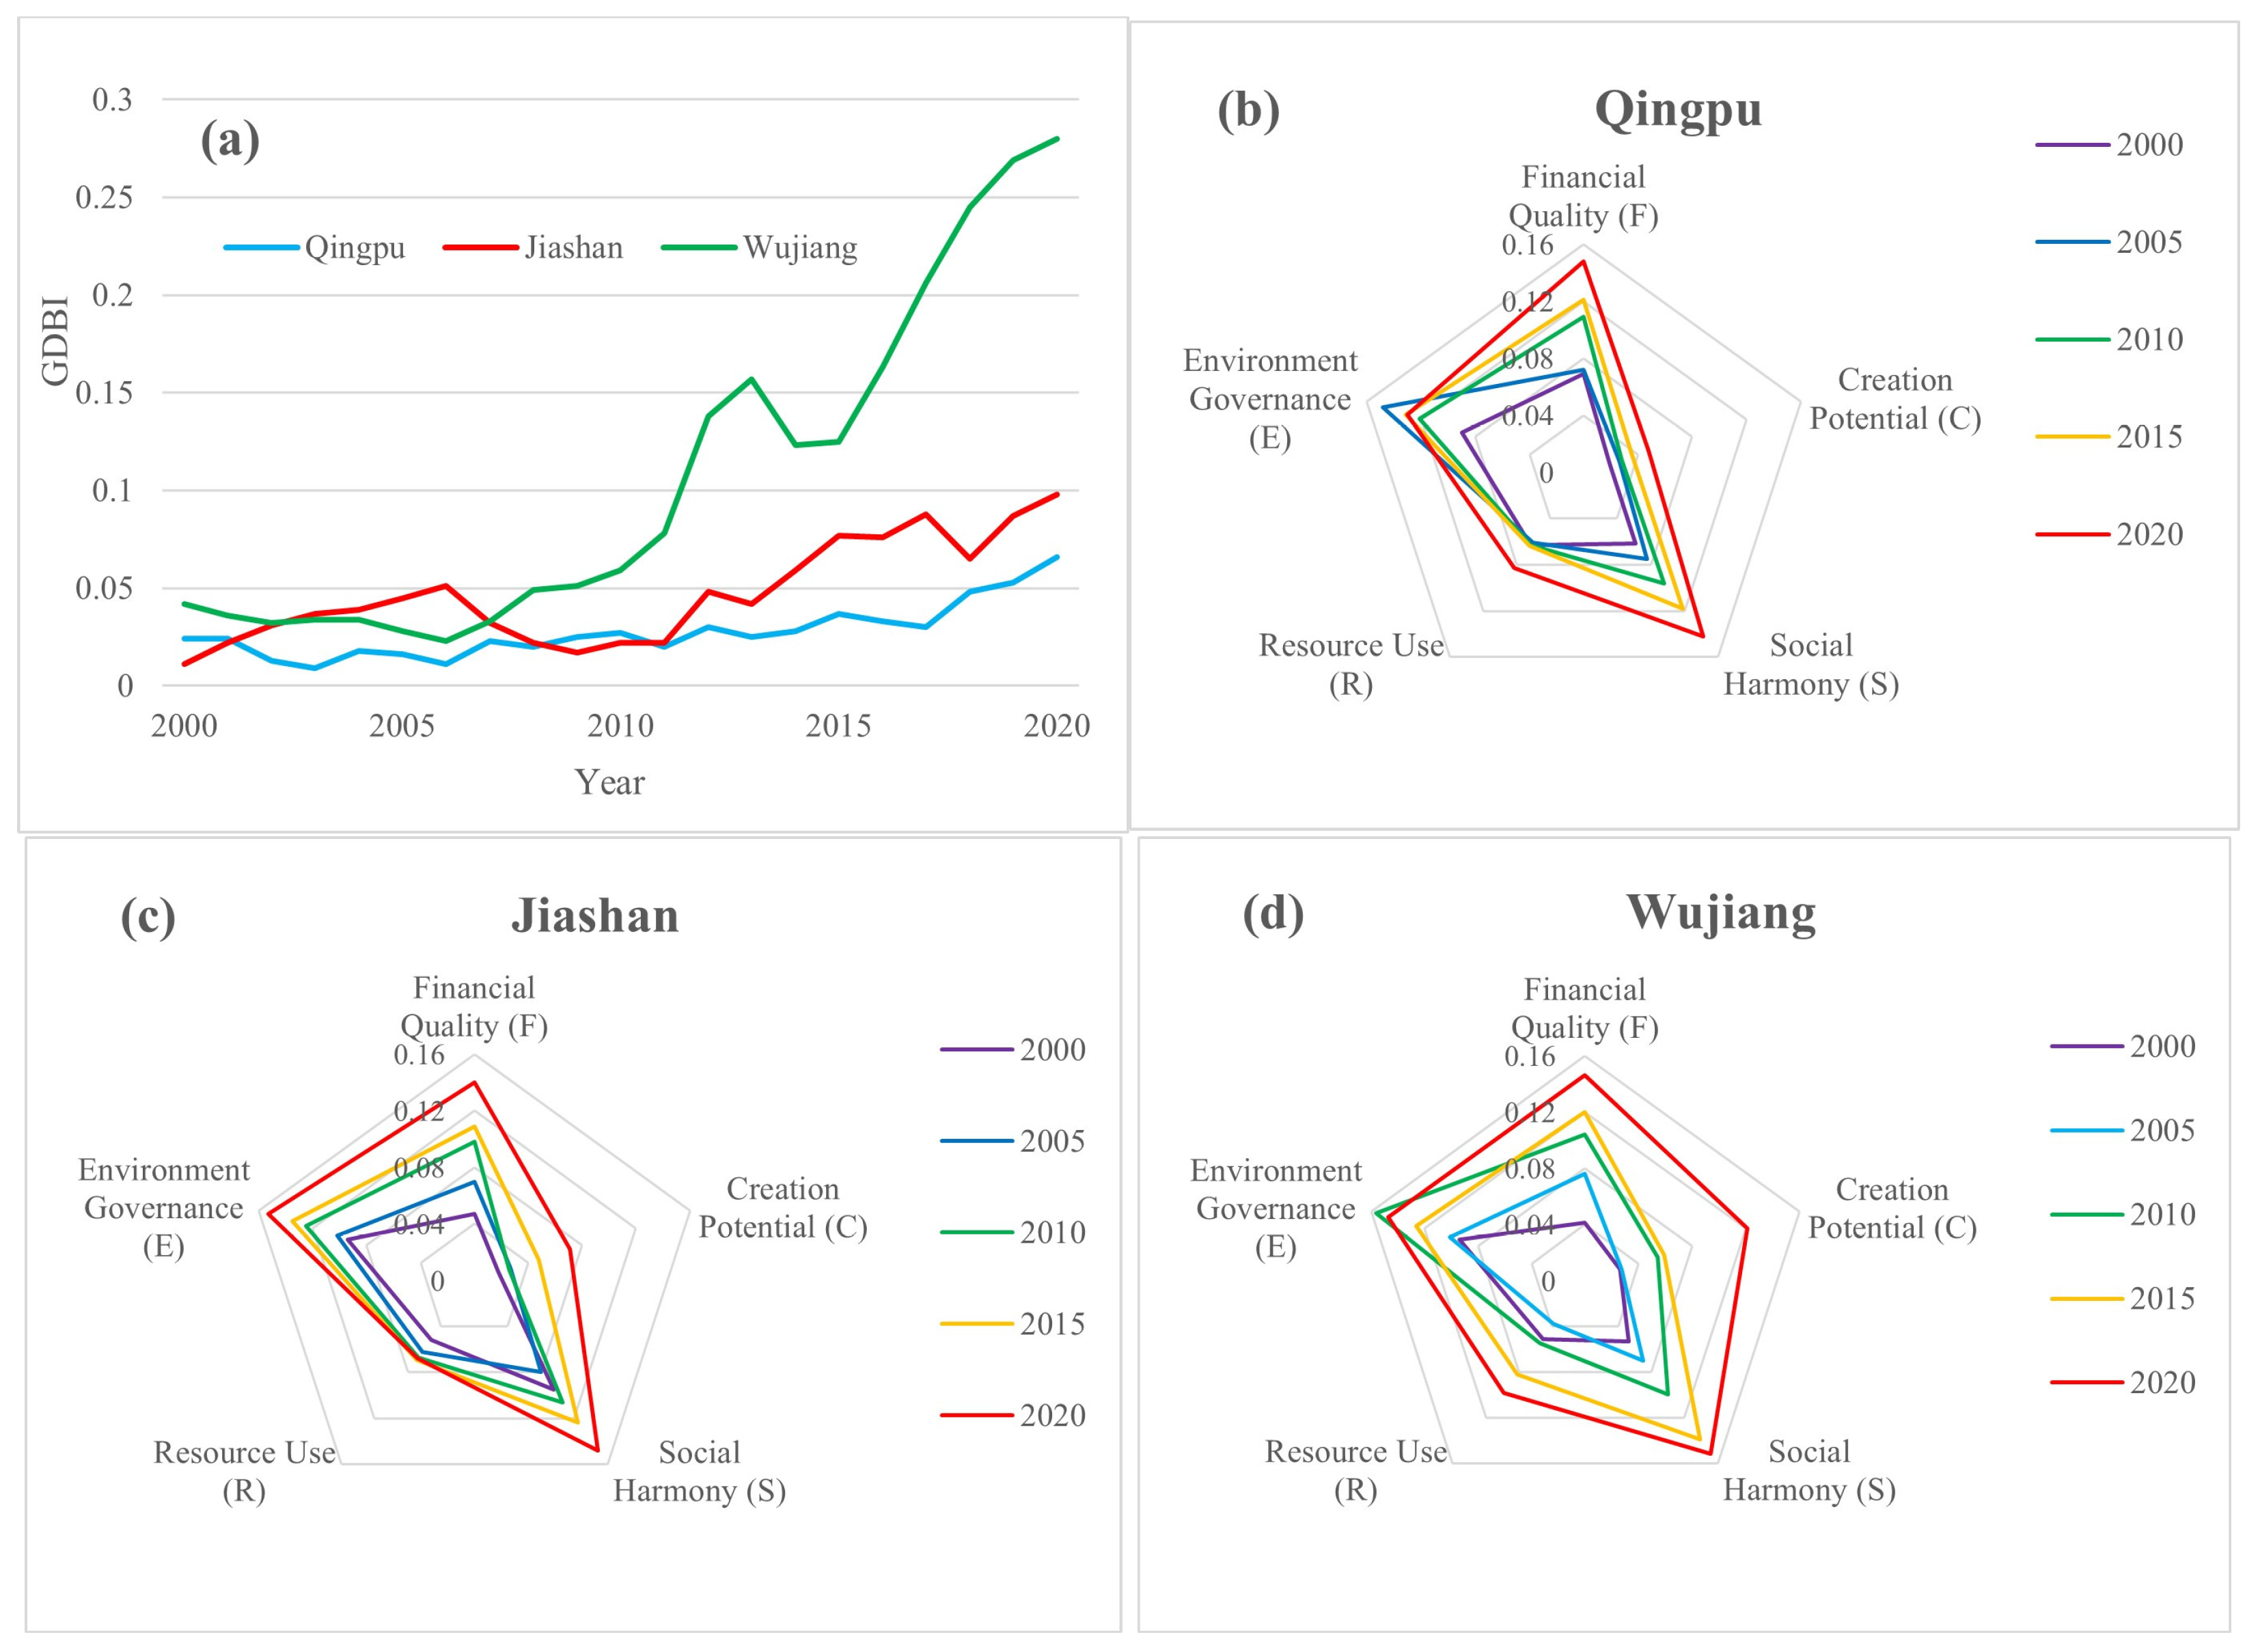
This study conducted an analysis of the GDBI of the three districts within the demonstration zone from 2000 to 2020. Wujiang experienced the most rapid GDBI increase, leading to a sharp divergence from the other two districts (Figure 5a) after 2011. The five-dimensional radar charts (Figure 5b–d) also revealed that Wujiang achieved a much higher level of GDL development balance across the five dimensions compared with the other two districts, especially in the year 2020 (Figure 5d). Jiashan and Qingpu only showed slight increasing trends in annual GDBI, with the fitted slopes of 0.003 and 0.002, respectively (Figure 5a). As shown in Figure 5b,c, both Qingpu and Jiashan exhibited weaker performance in the dimensions of creation potential and resource use compared with the other dimensions, indicating their structural shortcomings in innovation capacity and resource utilization. Moreover, Qingpu District showed decreasing environmental governance after the year 2005 (Figure 5b).
Figure 5.
Trends of the (a) green development balance index (GDBI), and radar charts of five sub-dimensions for three districts: (b) Qingpu District; (c) Jiashan County; and (d) Wujiang District, from 2000 to 2020, respectively.
4.2. Assessment of EEQ in the Demonstration Zone
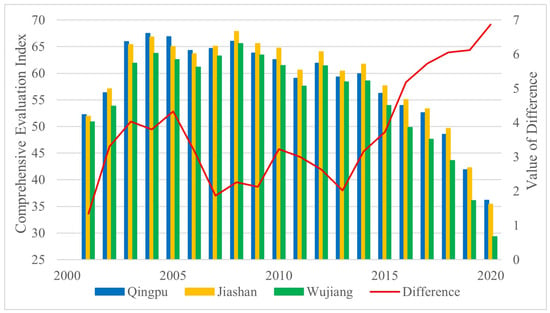
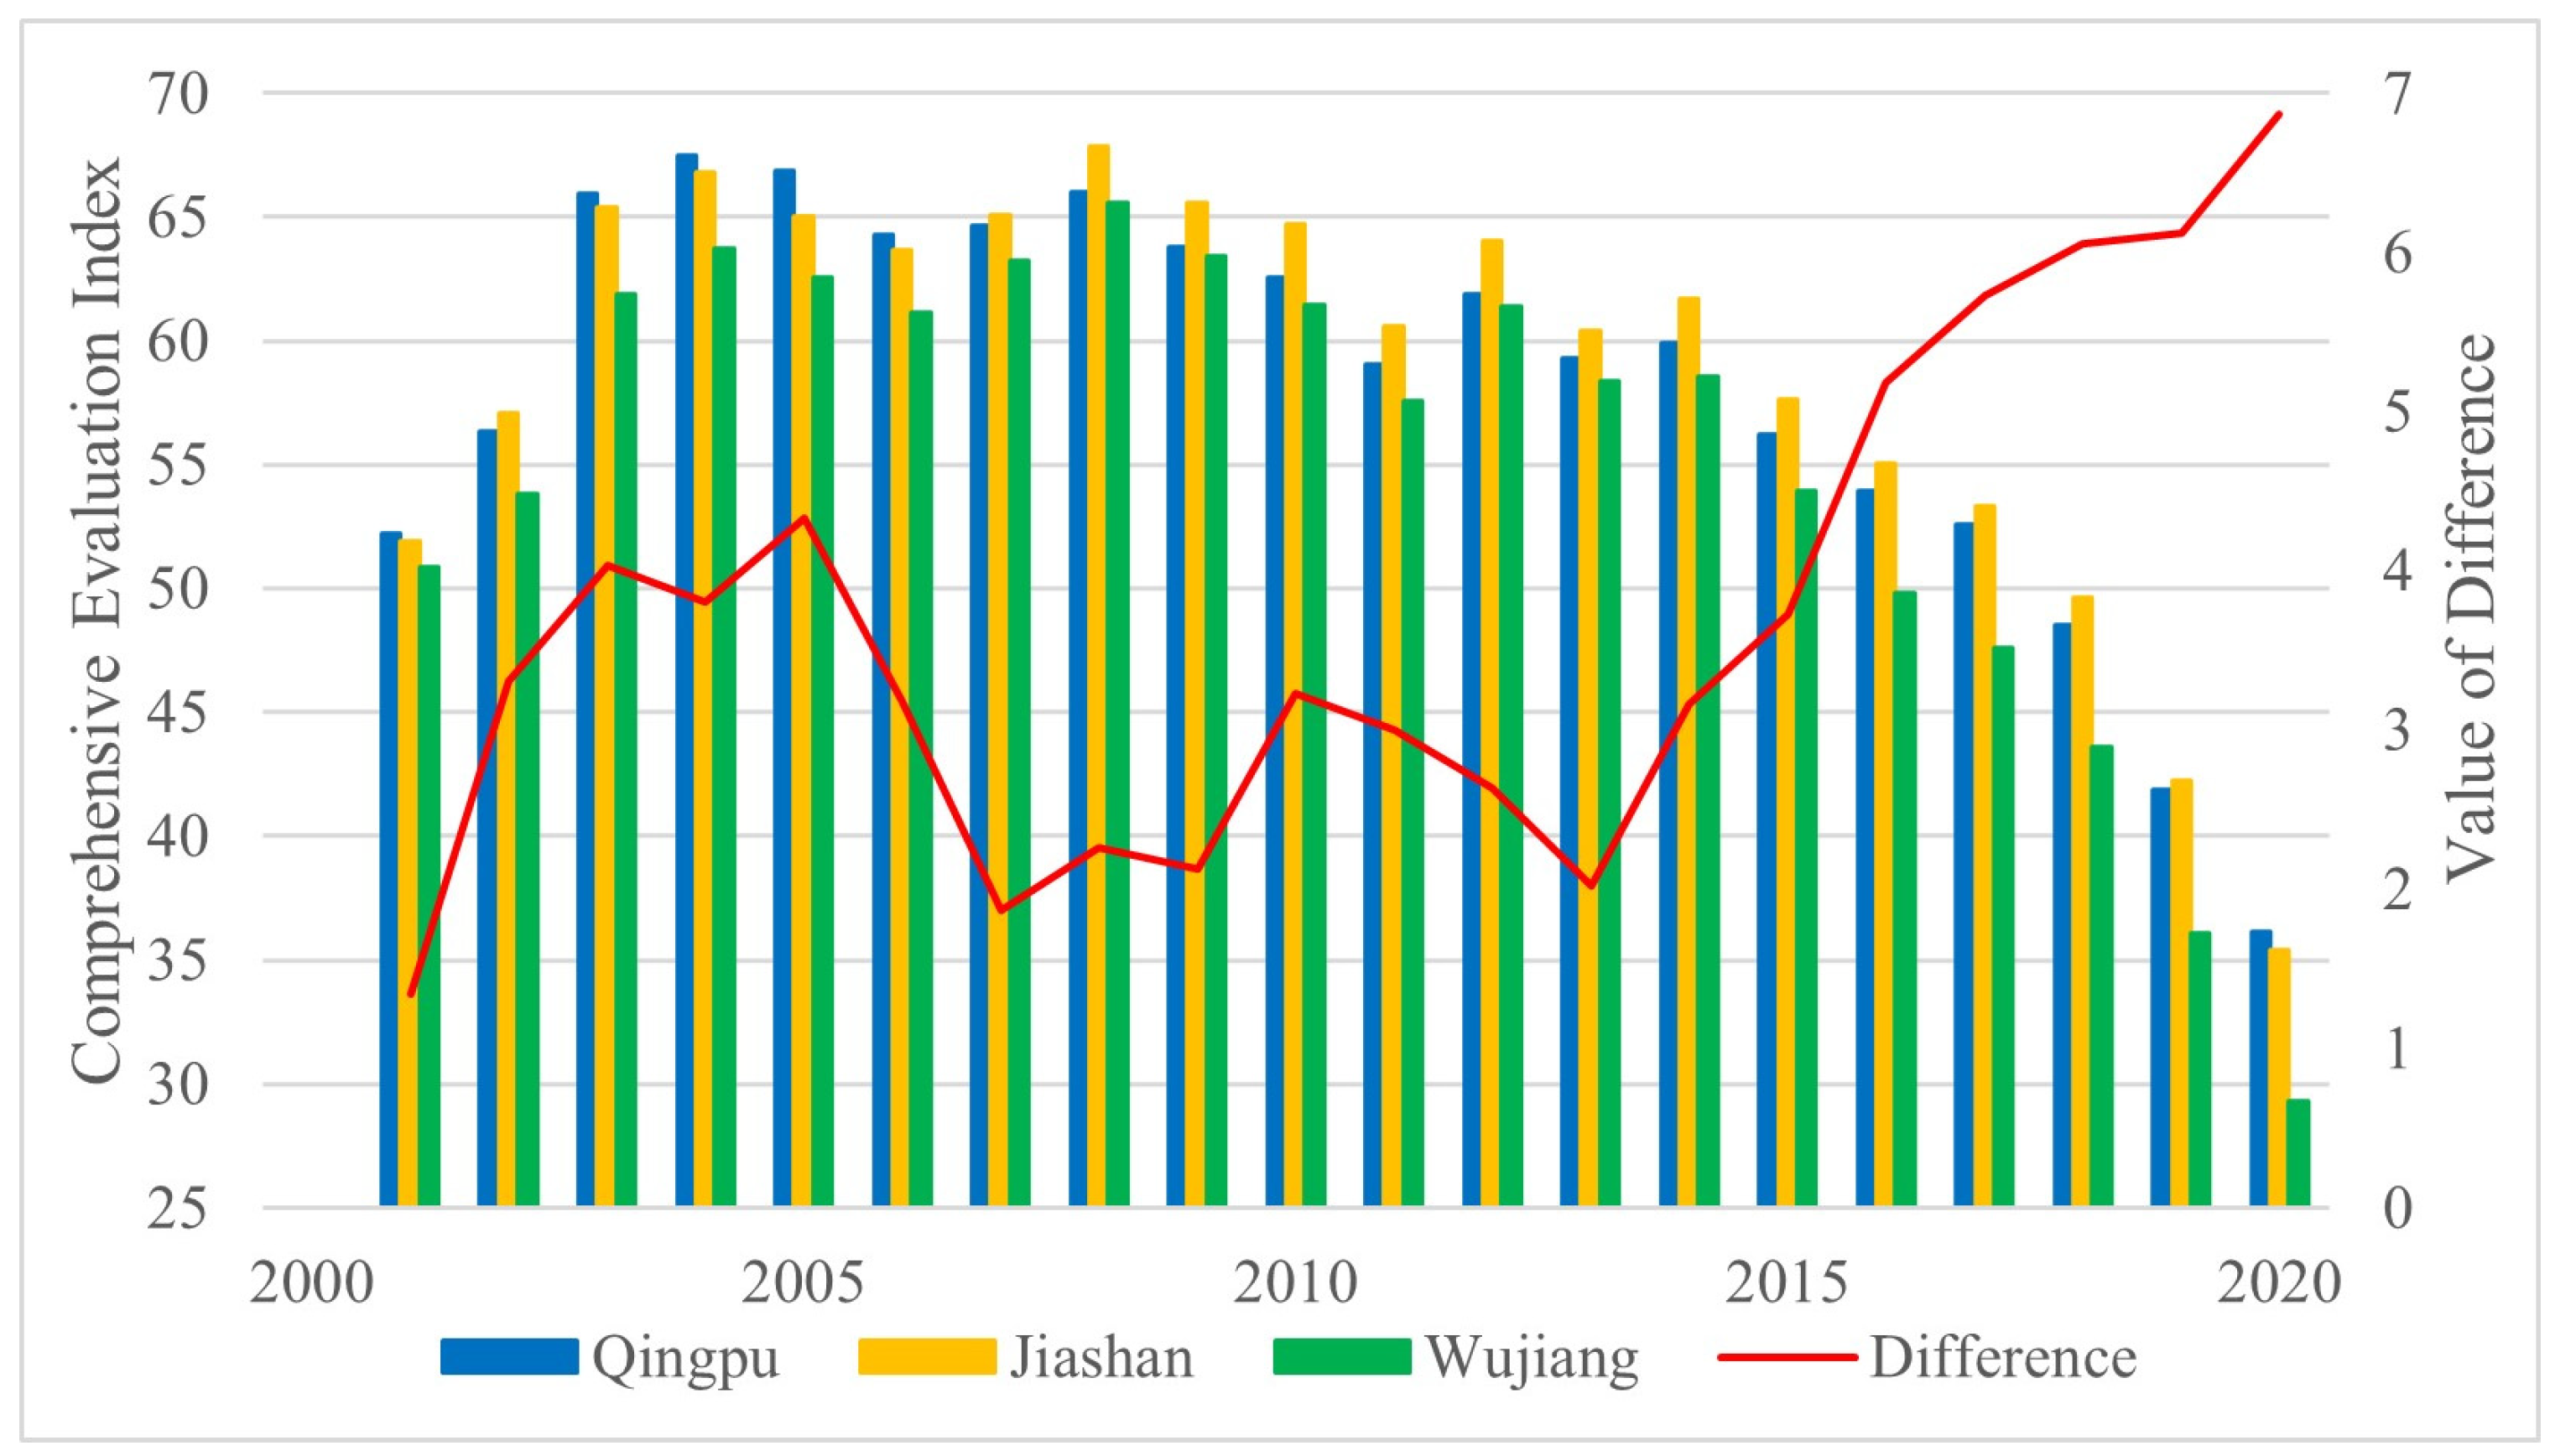
This study assessed EEQ of the study area at the demonstration zone, administrative district, and township scales using the CEI, and the results provide an ecological baseline for the subsequent GDL-EEQ coupling analysis. Temporally, the annual CEI values across all three districts overall exhibited a similar three-phase pattern: a rise during 2001–2005, relatively stable during 2005–2013, and a sustained decline after 2014 (Figure 6). Since lower CEI indicates higher EEQ, the results suggested an overall improvement in EEQ after 2014. Meanwhile, it was found that the inter-district CEI gaps widened after 2014. Jiashan had the highest annual CEI from 2014 to 2019, while Qingpu had the highest value in 2020; Wujiang consistently had the lowest values. Consequently, the gap between the highest and lowest CEI increased from 3.16 in 2014 to 6.87 in 2020 (Figure 6). This result implies increasing spatial disparities in EEQ within the demonstration zone, with Wujiang showing the fastest improvement in EEQ.
Figure 6.
Trends of annual comprehensive evaluation index (CEI) and the difference between the maximum and minimum values in three administrative districts from 2001 to 2020.
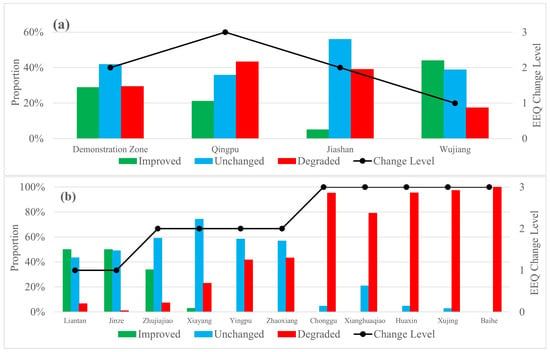
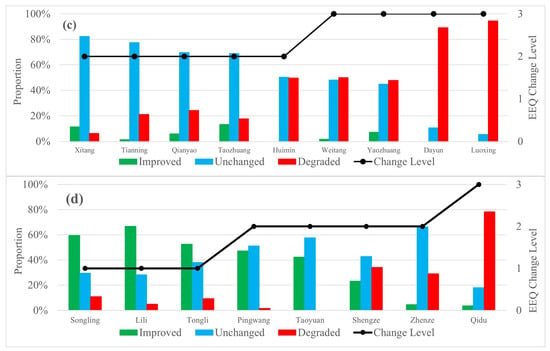
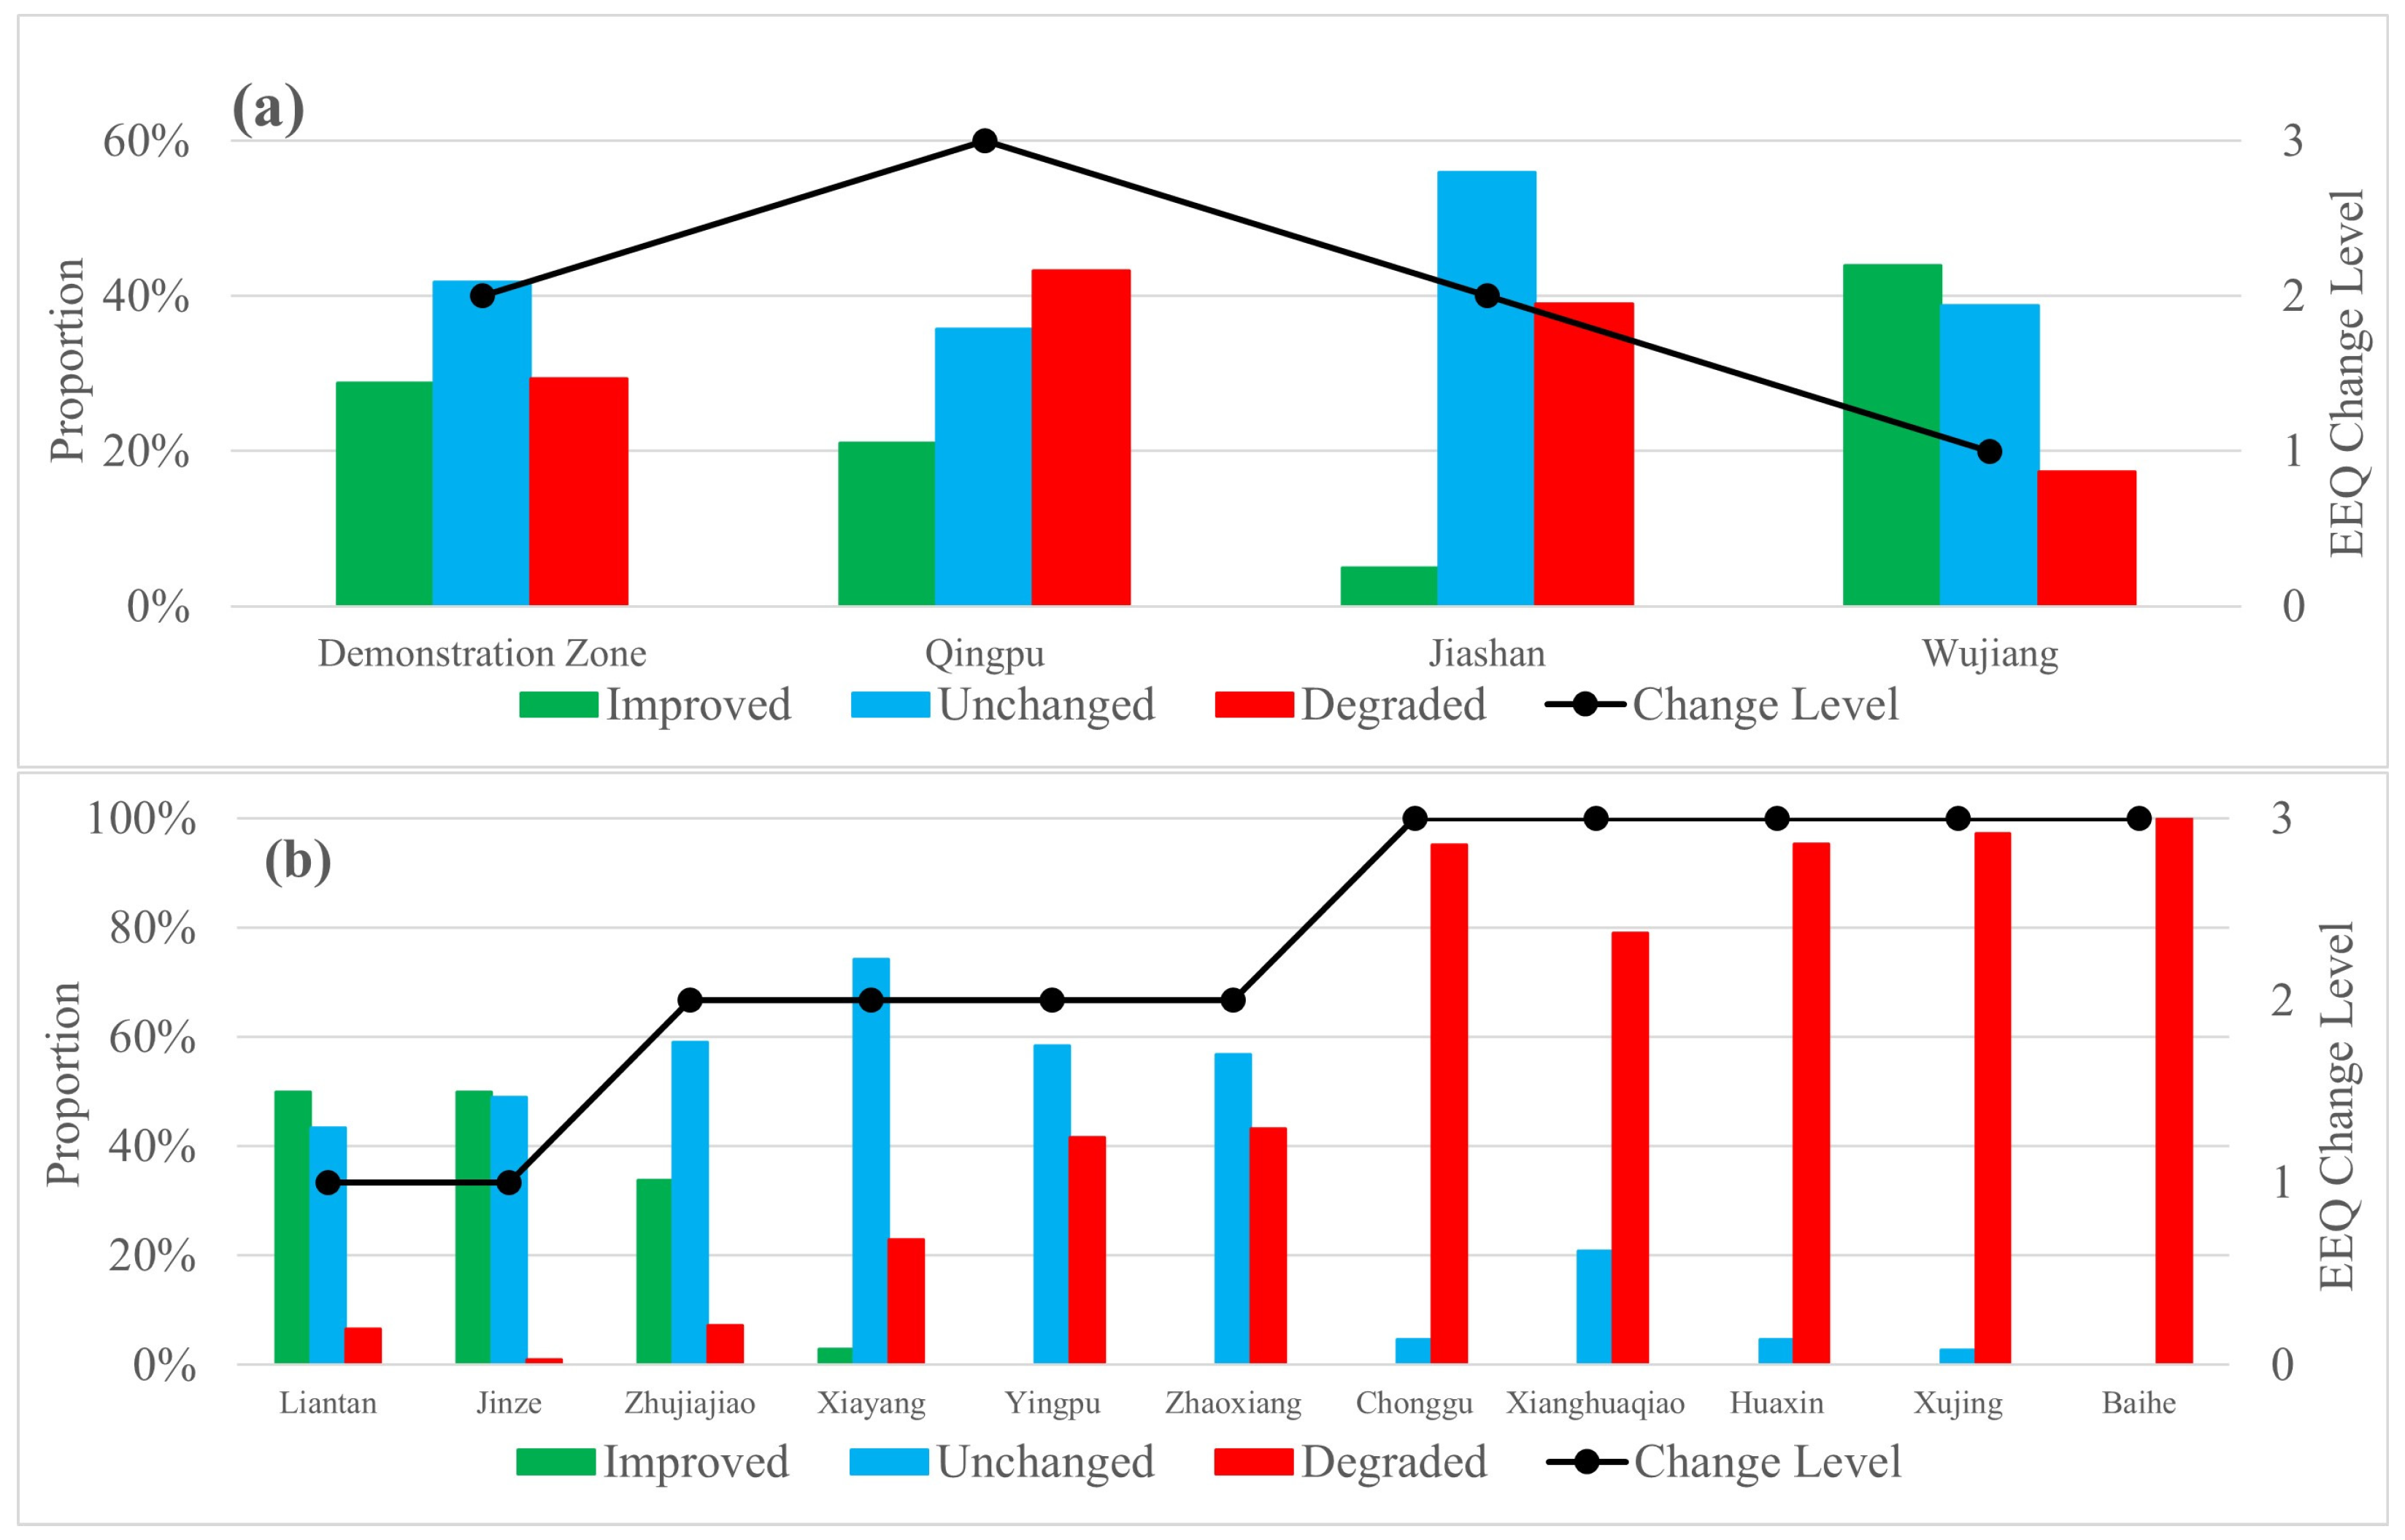
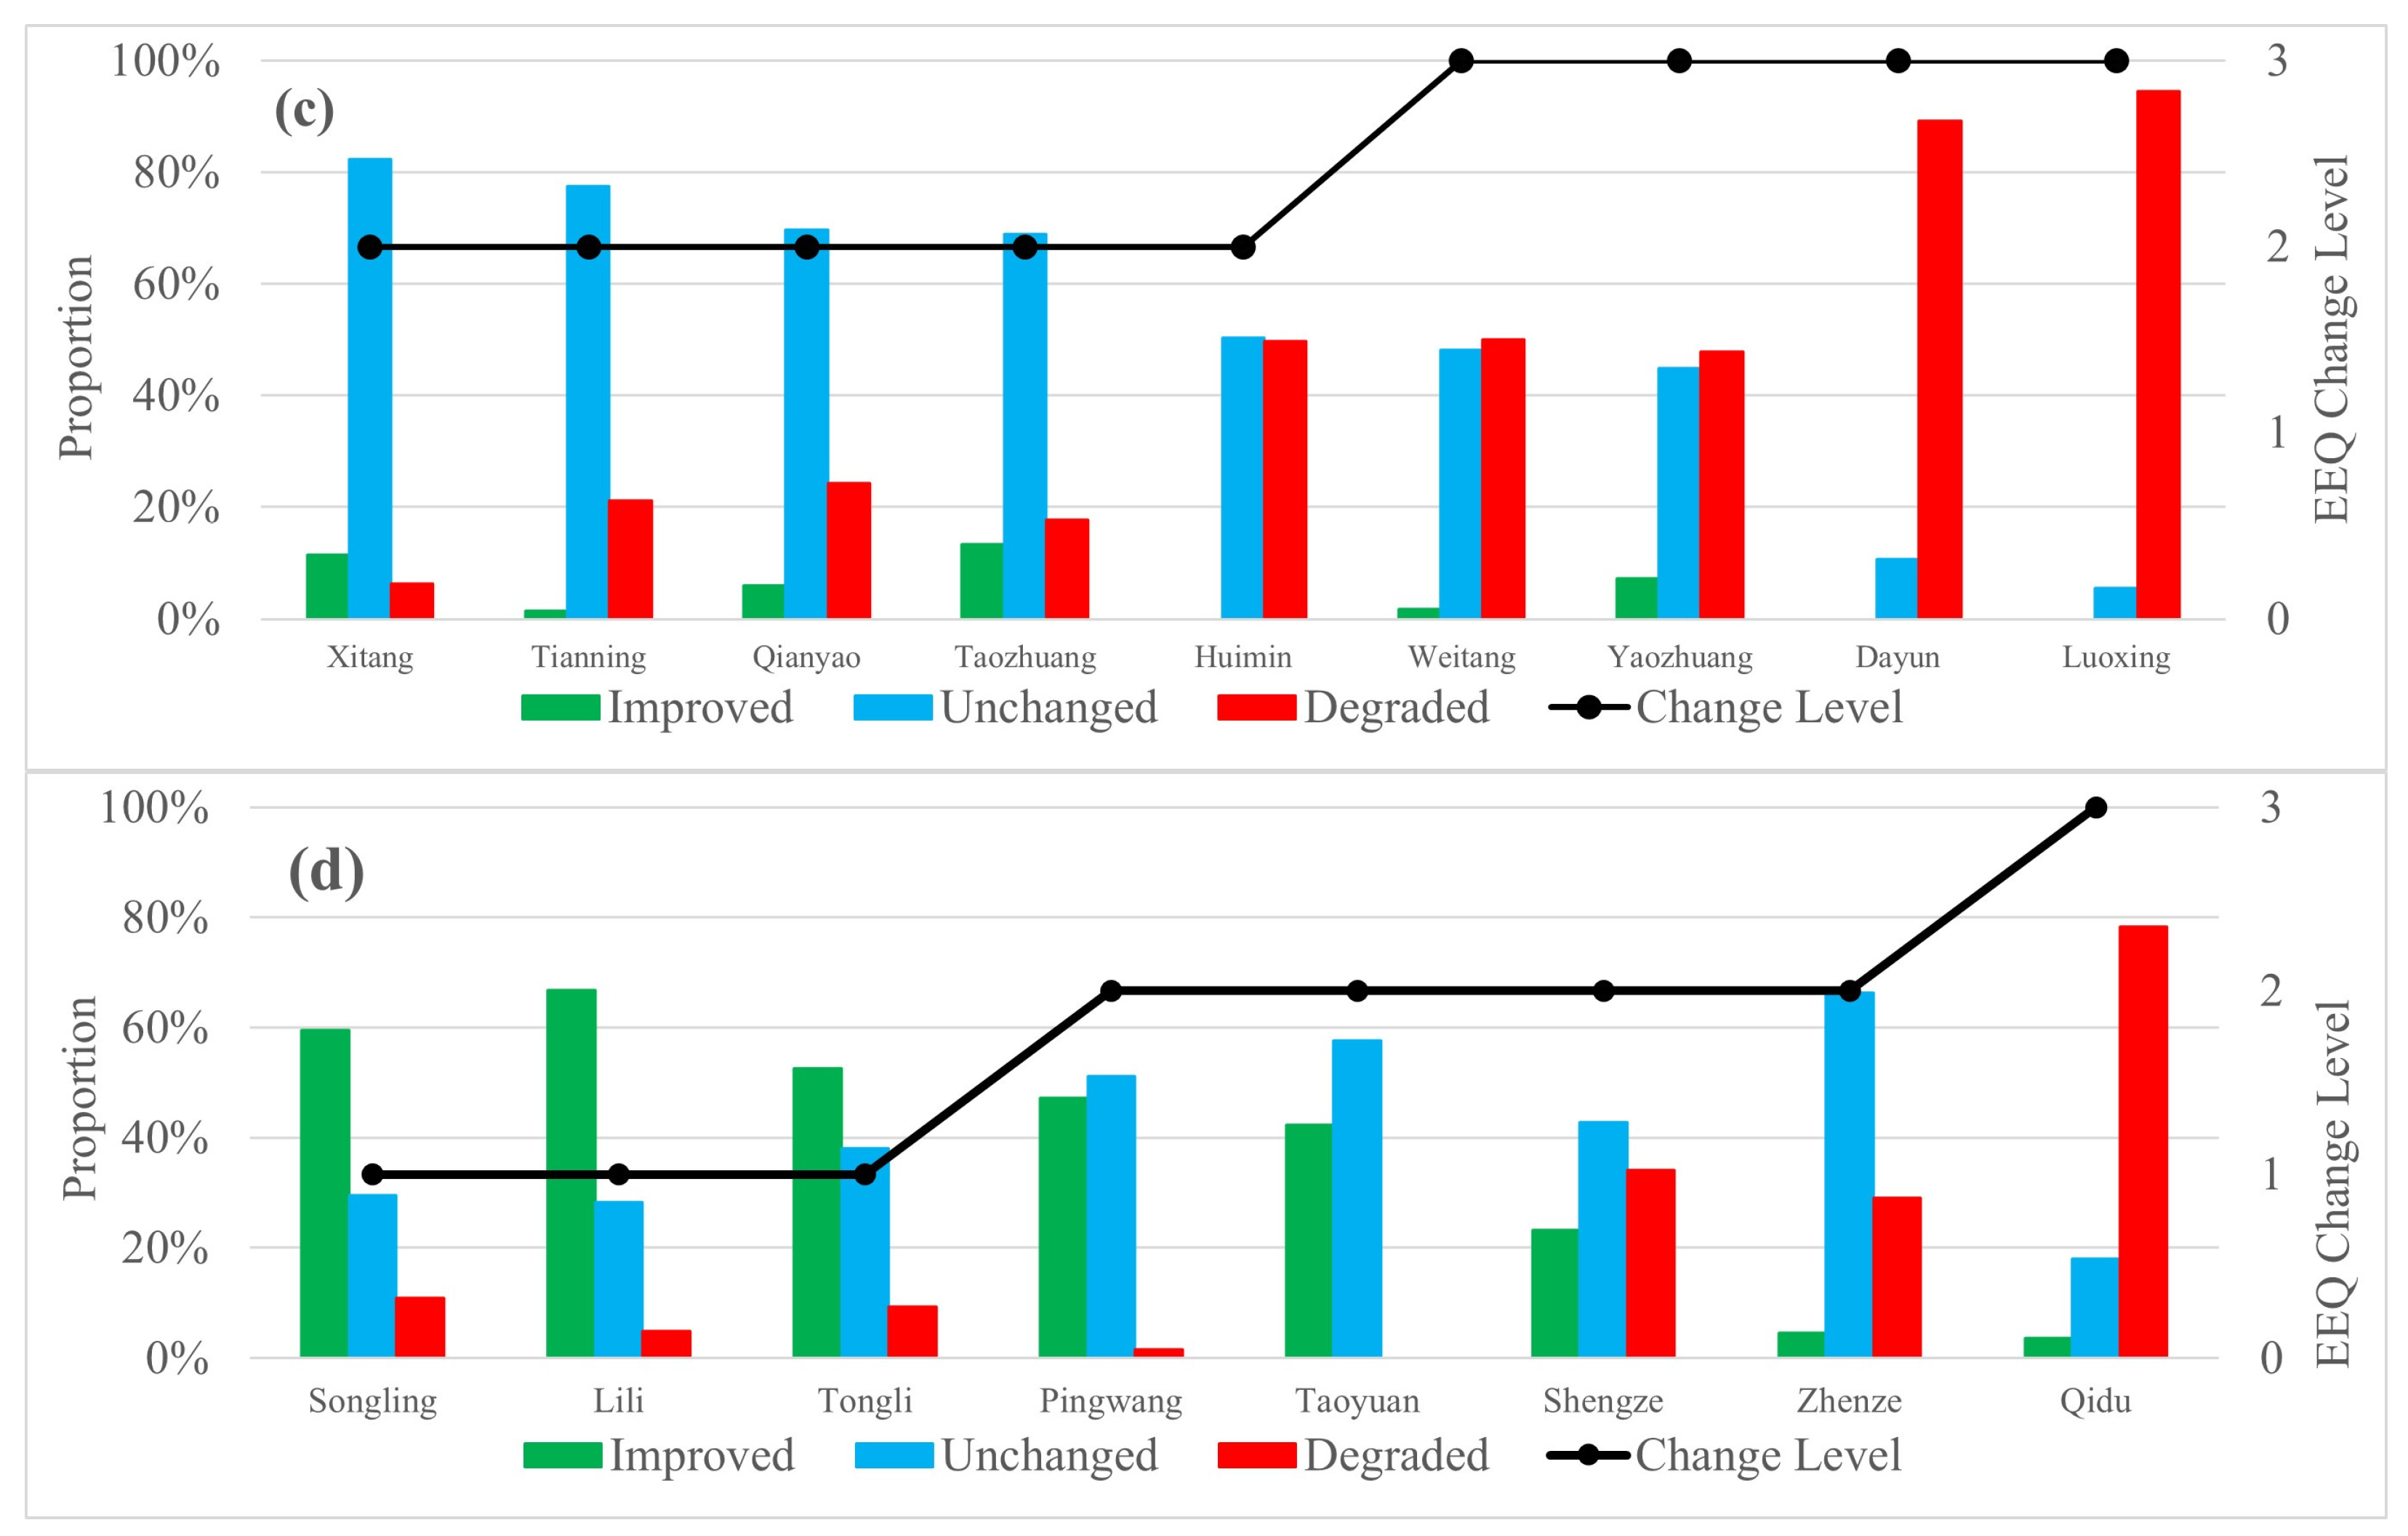
The EEQ variation trends from 2000 to 2020 for all pixels within the study area were classified into three levels (improved, stable, and degraded) according to the criteria in Table 3, considering two key parameters: the mean (56.8) and standard deviation (4.6) of the CEI. At the demonstration zone scale, the proportions of pixels classified into three categories indicate that overall ecological conditions were mainly stable, with the majority of pixels grouped at the “stable” level, and comparable proportions experiencing degradation and improvement (Figure 7a). For each administrative district and township, the overall EEQ change level was determined using a dominant-category rule, in which the category occupying the largest proportion of pixels within the unit was assigned (Figure 7a–d). For example, the EEQ change level of Wujiang District was classified as “improved” because 43.9% of its pixels were classified as “improved”, which is larger than pixels classified as “stable” (38.8%) and “degraded” (17.3%). On the other hand, the EEQ status of Qingpu District and Jiashan County was classified as “degraded” and “stable”, respectively (Figure 7a). At the township scale, only two townships (Liantan and Jinze) in Qingpu District have an “improved” EEQ change level, which are located in its western part. In comparison, there are five townships (Chonggu, Xianghuaqiao, Huaxin, Xujing, and Baihe) in the eastern part of Qingpu that have a “degraded” EEQ change level (Figure 7b). This polarization pattern suggests that there may be regional heterogeneity in environmental conditions and variation trends within Qingpu District. On the other hand, Wujiang District has three townships (Songling, Lili, and Tongli) that showed “improved” and only one township (Qidu) showed “degraded” EEQ status, as Figure 7d suggests.
Figure 7.
Comparison of the proportion of eco-environment quality (EEQ) changes in each level in the demonstration zone and townships at different scales: (a) demonstration zone and three administrative districts, (b) eleven townships in Qingpu District, (c) nine townships in Jiashan County, and (d) eight townships in Wujiang District, respectively; the numbers representing EEQ status are 1: improved, 2: stable, and 3: degraded.
4.3. Coupling Analysis of GDL and EEQ
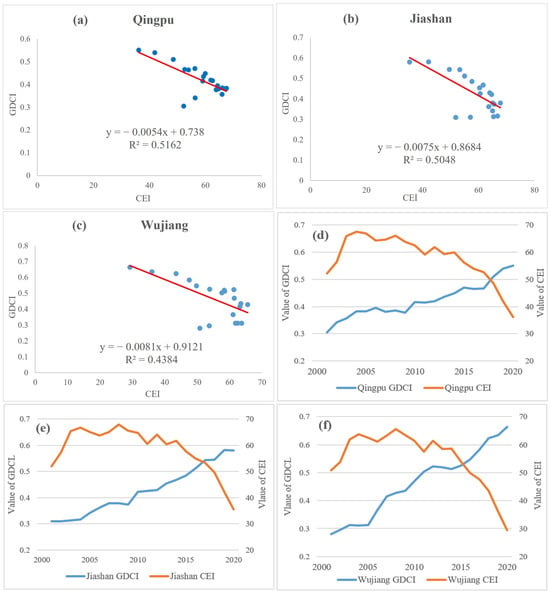
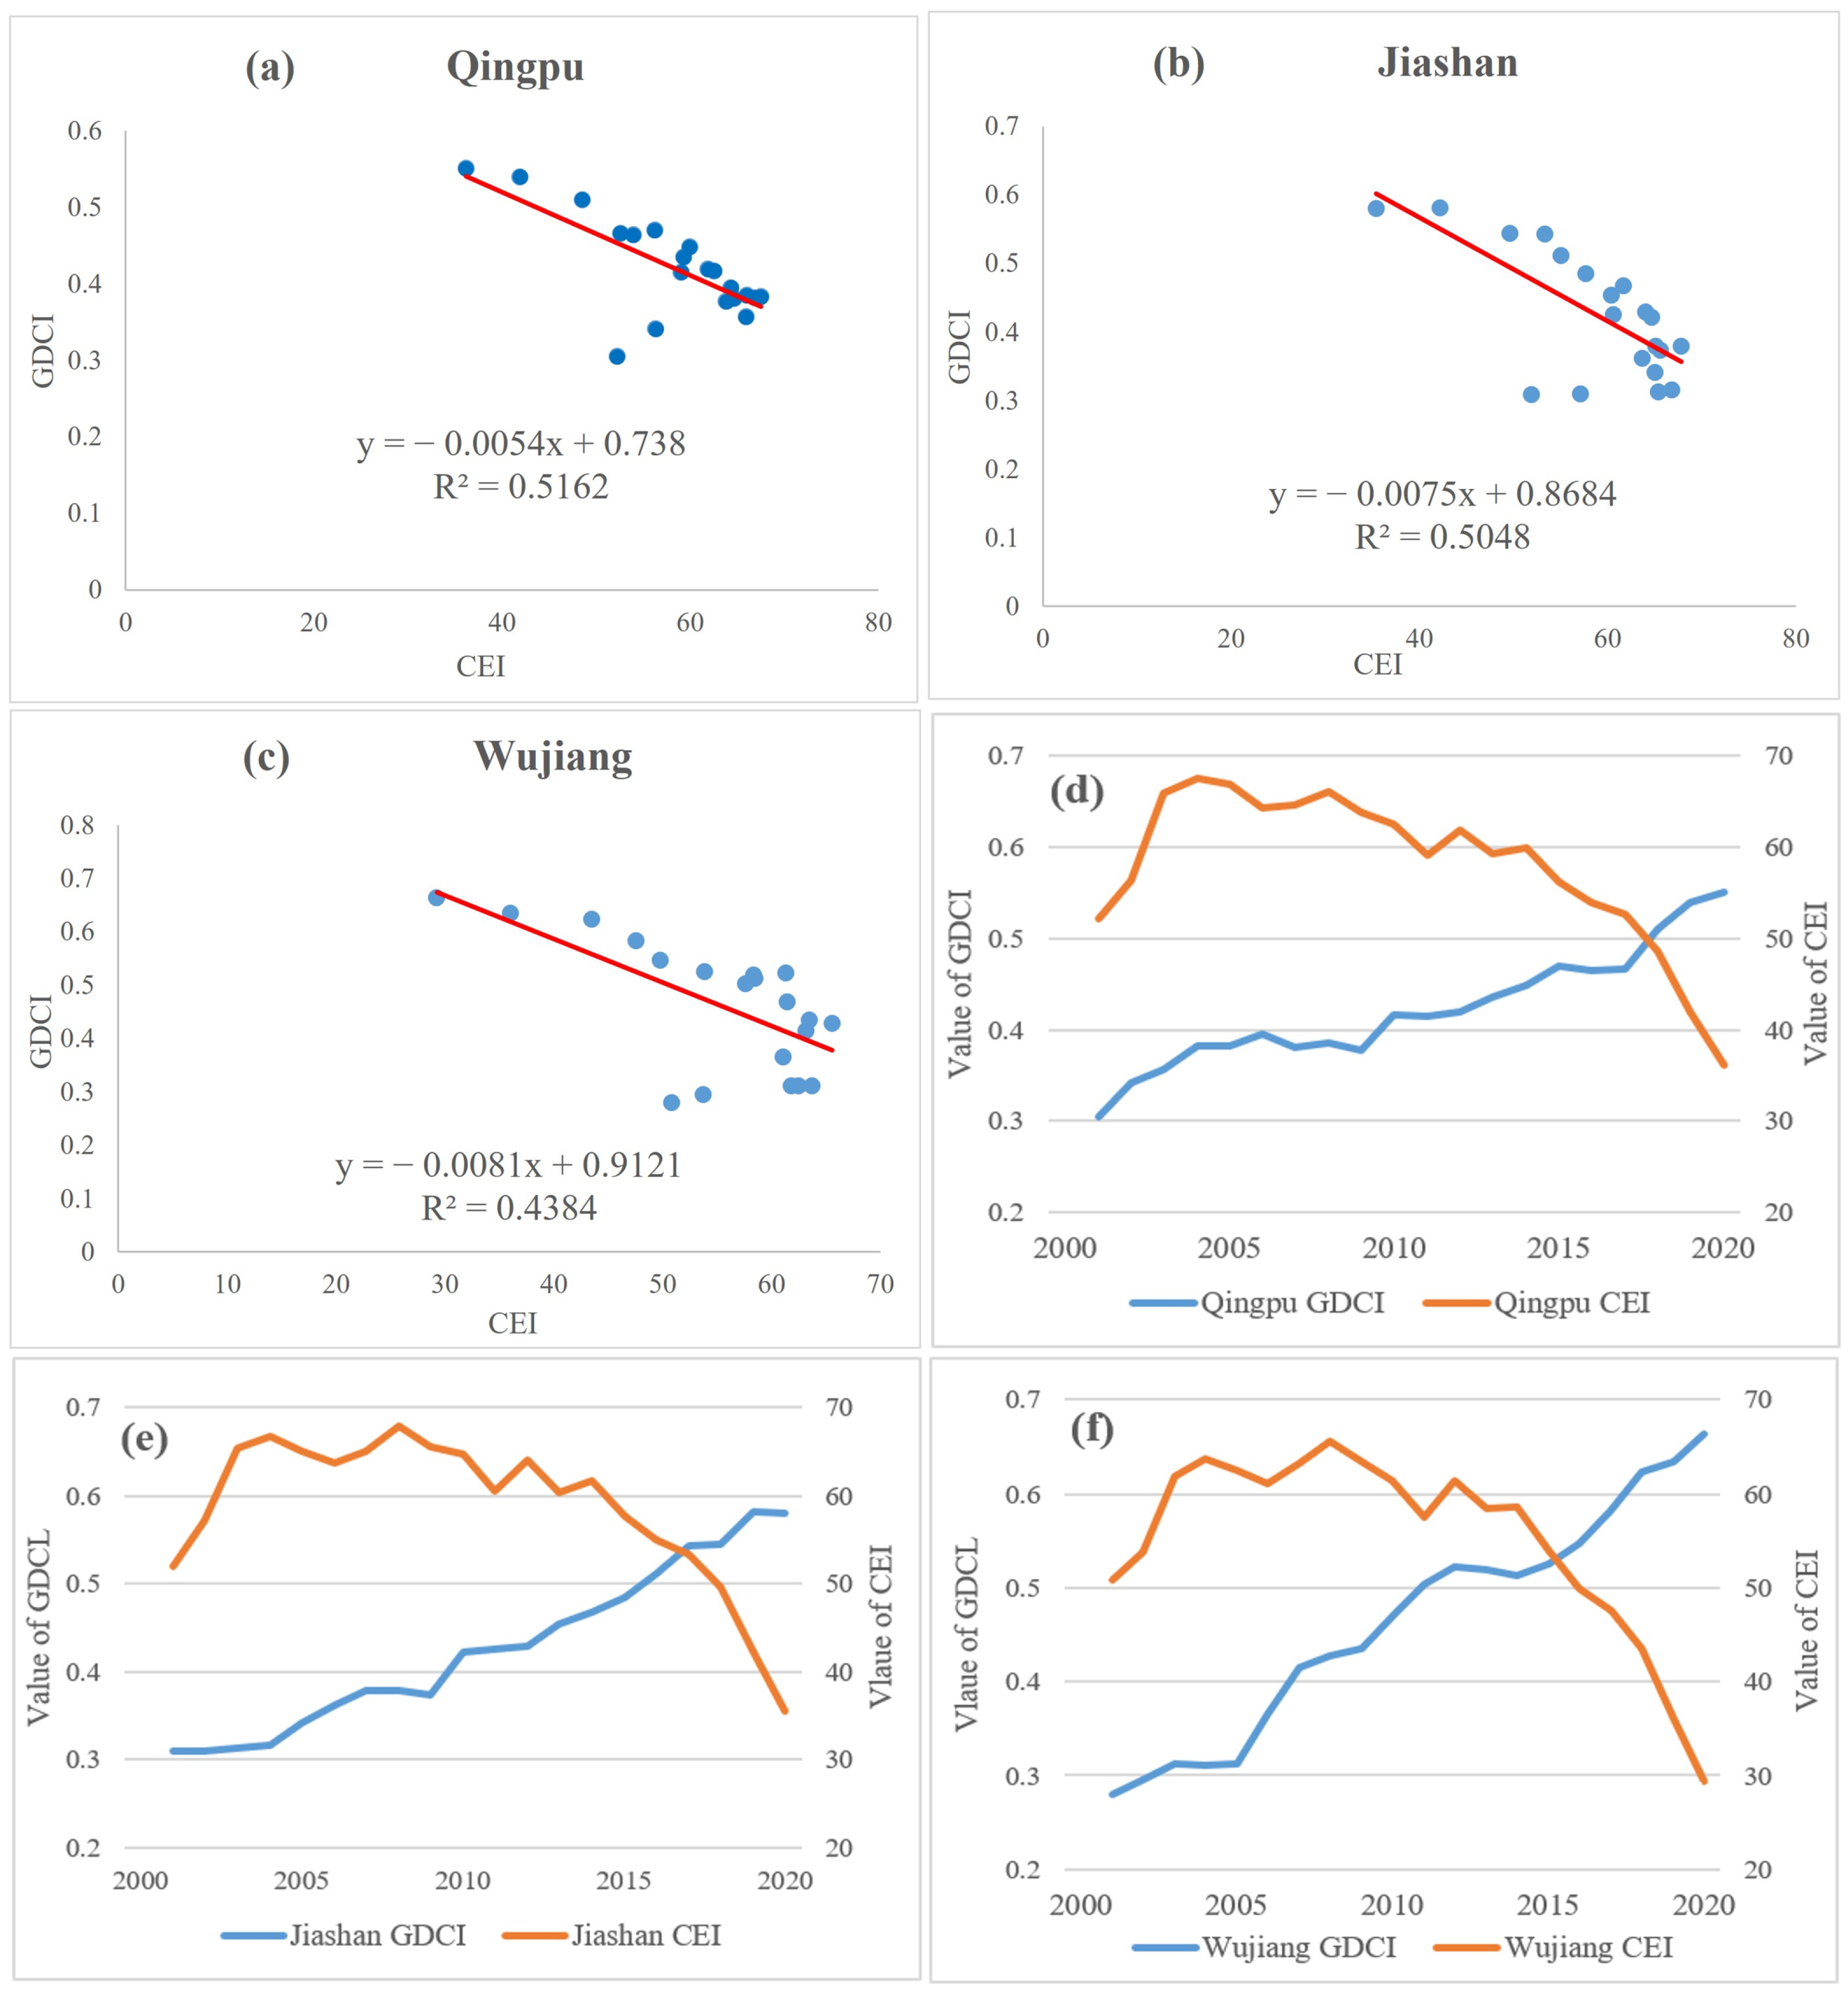
This study analyzed the relationship between green development level and the quality of the eco-environment in the demonstration zone through correlation analysis, using the annual CEI and GDCI from 2001 to 2020 in three administrative districts. The regression results reveal a moderately strong negative correlation between these two indices, with p-values of 0.000, 0.000, and 0.002 for Qingpu District, Jiashan County, and Wujiang District, respectively, and R2 ranging from 0.44 (Wujiang) to 0.52 (Qingpu) (Figure 8a–c). Given that a higher GDCI suggests a better green development level, while a lower CEI suggests better EEQ, the negative correlations suggest that improvements in EEQ (reflected by CEI) are linked to a higher level of green development. The interannual comparison of GDCI and CEI further explains the regression results. During the earlier stage (2001 to 2013), GDCI increased gradually while CEI remained stable, indicating a weaker response (Figure 8d–f). But in the later stage (2014 to 2020), GDCI continued to rise steadily. In contrast, CEI exhibited an overall declining trend (better EEQ), suggesting that improvement in GDL can eventually be translated into enhanced EEQ, but this process was not immediate. This result indicates that changes in GDL and EEQ were not synchronized across stages.
Figure 8.
Interannual correlations between GDCI and CEI in (a) Qingpu District; (b) Jiashan County; and (c) Wujiang District, and interannual comparison of GDCI and CEI in (d) Qingpu District; (e) Jiashan County; and (f) Wujiang District from 2001 to 2020.
Two indicators were integrated to conduct a comprehensive assessment of eco-green development quality across the demonstration zone. First, the GDCI values of the three districts were ranked into three levels according to their relative rankings: Wujiang District (GDCI = 0.454) as “high GDL” (HG), Jiashan County (GDCI = 0.421) as “moderate GDL” (MG), and Qingpu District (GDCI = 0.416) as “low GDL” (LG). Second, the EEQ status of the 28 townships was also classified into three grades: improved EEQ (HE), stable EEQ (ME), and degraded EEQ (LE), based on EEQ status evaluation results at pixel scale shown in Figure 7b–d. By combining GDLs with corresponding EEQ status, eight eco-green development quality categories were identified at the township level. The integrated classification results are summarized in Table 5, which presents the differences between green development and eco-environmental change within the demonstration zone at the township scale. For example, the “HG-ME” category represents townships with a high level of GDL and a stable status of EEQ.
Table 5.
Comprehensive assessment of eco-green development quality at the township level.
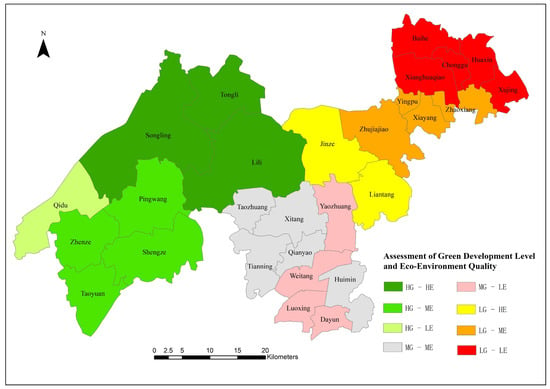
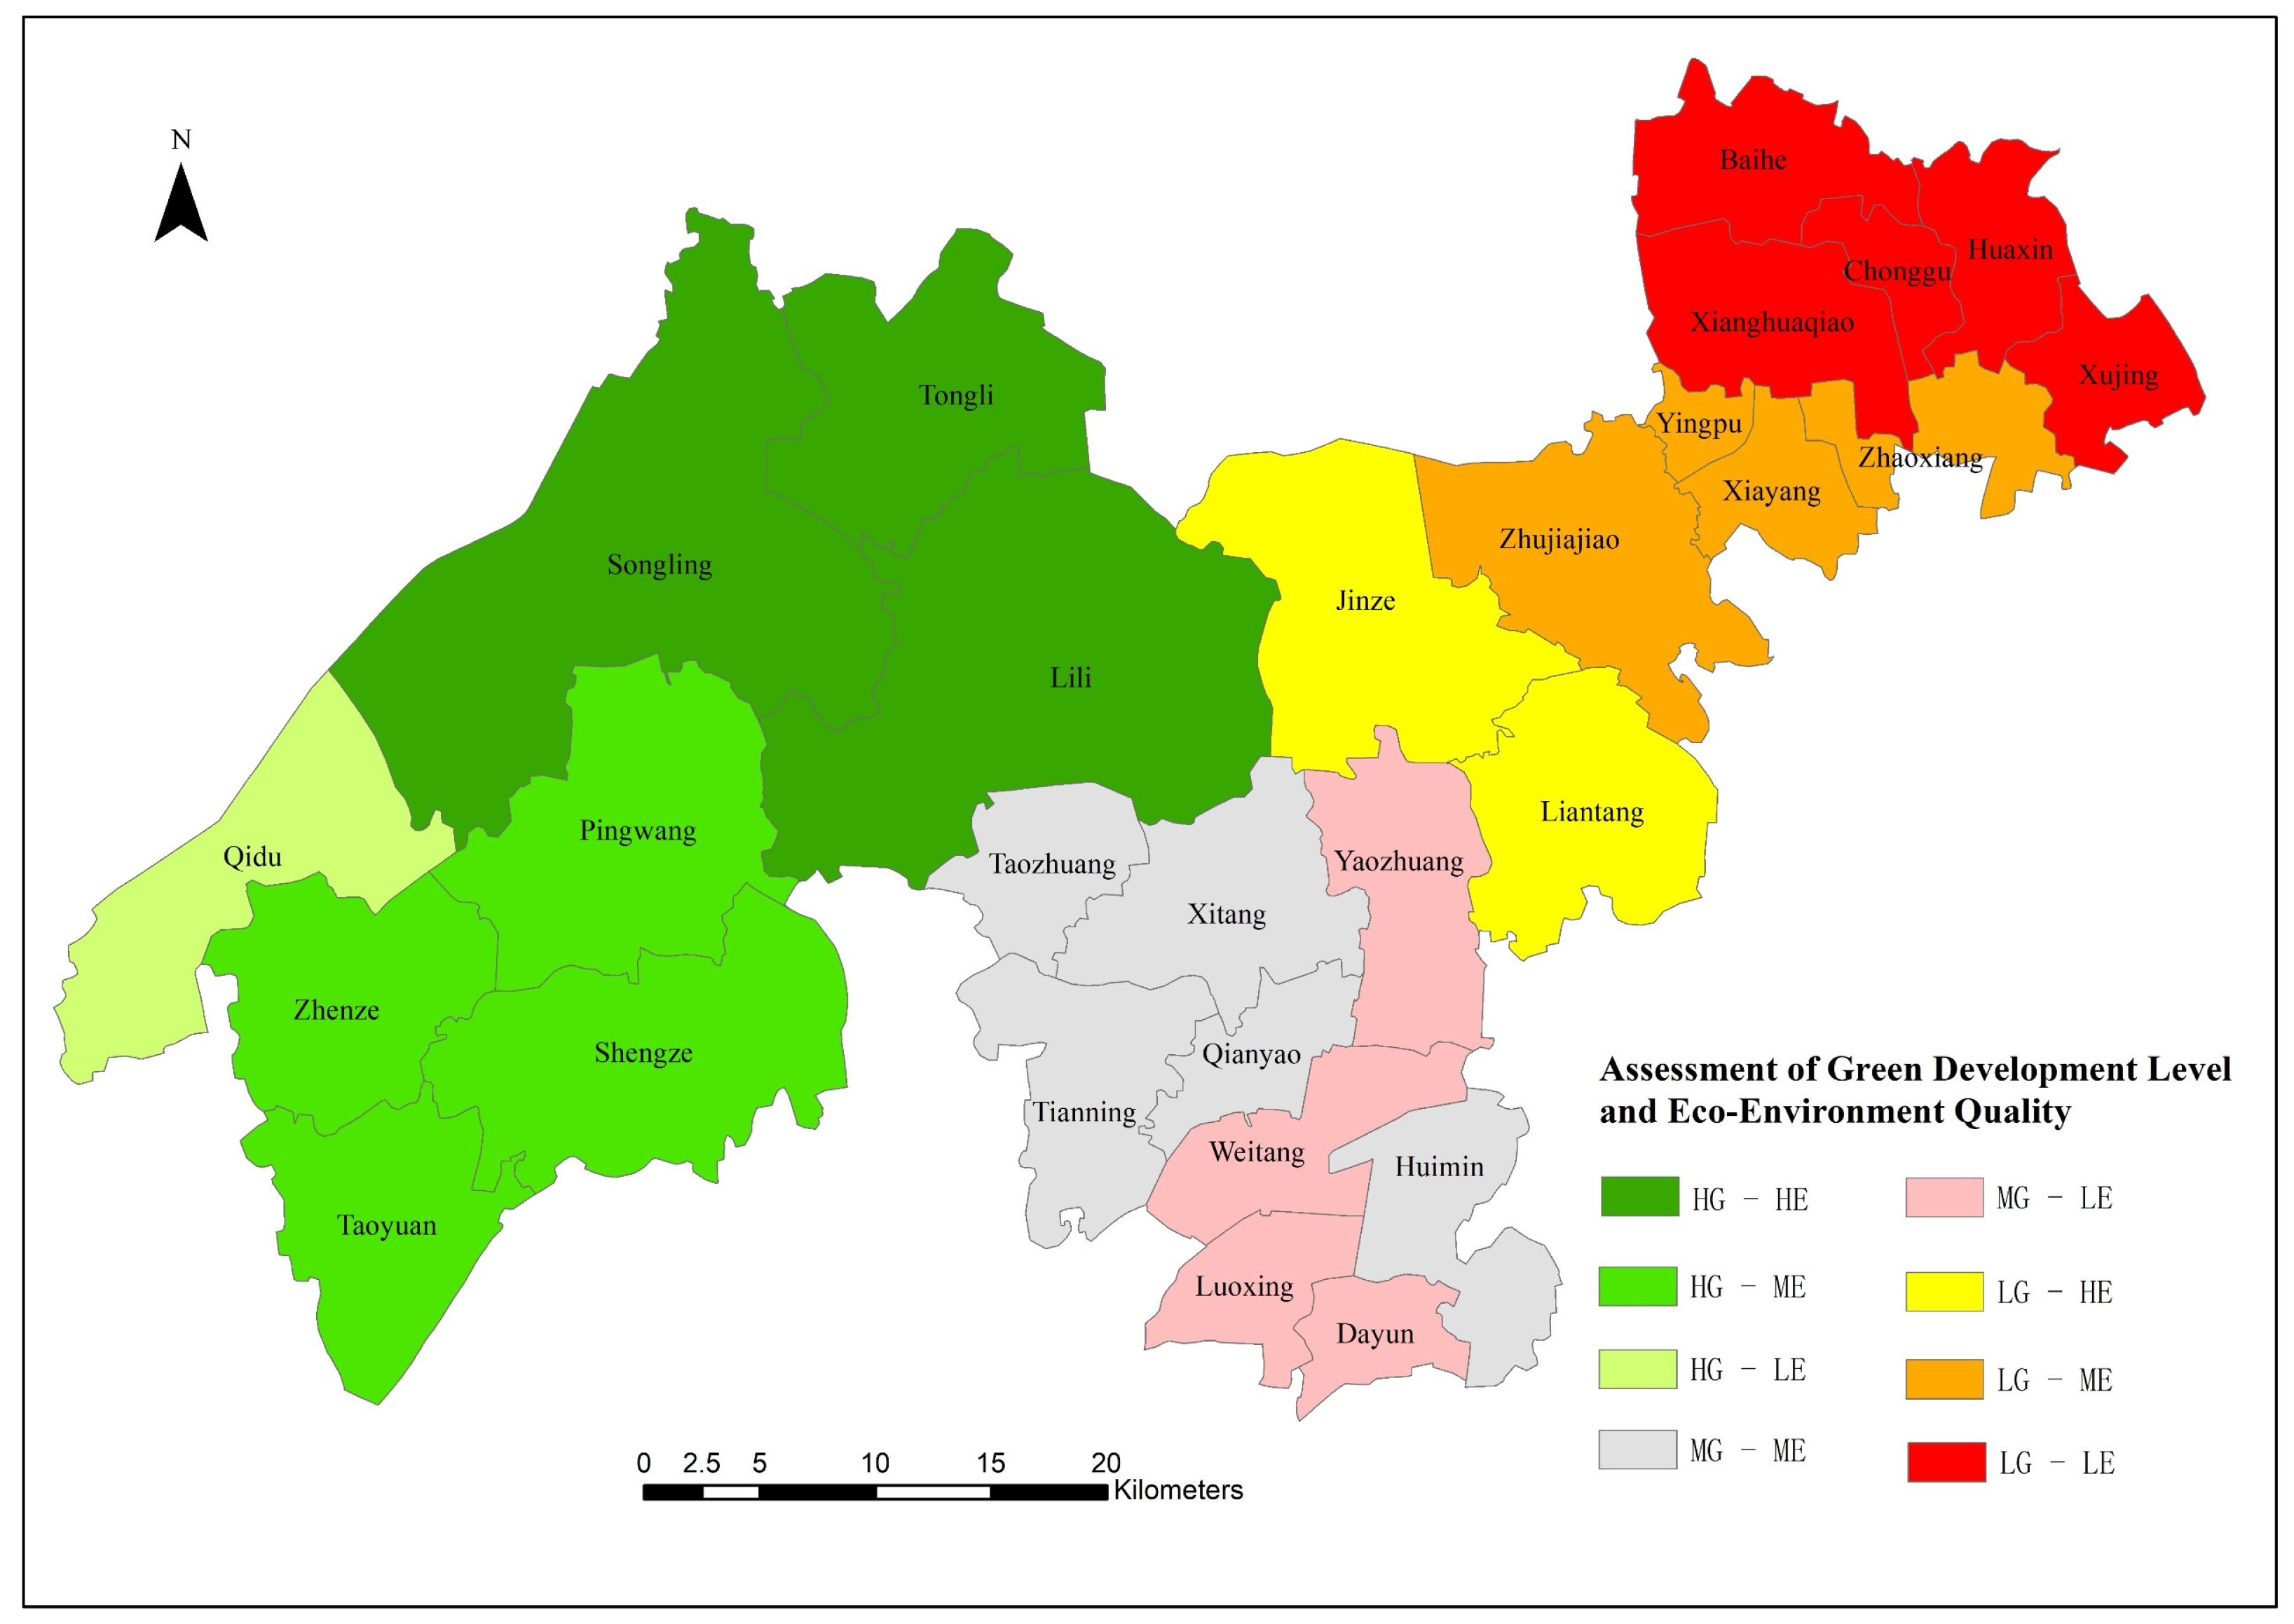
Figure 9 illustrates the spatial distribution of these eight eco-green development quality categories at the township scale. In general, an obvious pattern of spatial clustering can be observed across the demonstration zone. The “HG-HE” and “HG-ME” categories were mainly located in the central and eastern parts of Wujiang District. These townships demonstrated stable or gradual ecological improvement from 2000 to 2020, accompanied by relatively high and rapidly increasing green development levels, indicating a favorable development trend. In comparison, the “HG-LE” category (Qidu) was found in western Wujiang District, which had favorable green development but a degraded EEQ. The “MG-ME” and “LG-ME” categories were located in Jiashan County, where these townships achieved a moderate level of green development but also showed unsatisfactory environmental performance. Although Qingpu District exhibited both lower GDL and degraded EEQ, notable spatial heterogeneity within the administrative district can be observed at the township scale. The “LG-HE” category was found in western Qingpu District, suggesting rapid EEQ improvements despite a low level of green development. However, the “LG-LE” category, which is characterized by low levels of green development and ecological degradation, was concentrated in five townships in eastern Qingpu District.
Figure 9.
Comprehensive assessment of eco-green development quality at the township scale in the demonstration zone (HG-HE: high GDL and improved EEQ; HG-ME: high GDL and stable EEQ; HG-LE: high GDL and degraded EEQ; MG-ME: moderate GDL and stable EEQ; MG-LE: moderate GDL and degraded EEQ; LG-HE: low GDL and improved EEQ; LG-ME: low GDL and stable EEQ; LG-LE: low GDL and degraded EEQ).
5. Discussion
5.1. Discussion of Theoretical and Practical Contributions
A key innovation of this study is that it offers a way to assess the eco-green development quality in the urban agglomeration (the demonstration zone) through the integration of two perspectives: the GDL and EEQ, which provides a more comprehensive perspective. Compared with studies that used a single index [14,19,26,64], the dual-index approach in this study distinguishes the green development capacity estimated based on socioeconomic variables and environmental improvement observed through the remote sensing technique. In other words, it avoids the limitations of focusing solely on development performance or only on ecological conditions. The overall upward trend in GDL identified in this study is broadly consistent with previous assessments of green development in the YRD [14,47,65]. Fang et al. [65] reported a general improvement of green development in YRD from 2003 to 2017. Lan et al. [14] found that GDL increased across cities in the Yangtze River Economic Belt from 2000 to 2020, with relatively high values concentrated in the YRD. Wang et al. [47] suggested that coupling relationship between the regional urban development index (RUDI) and RSEI increased in almost all YRD cities from 2014 to 2022. Results of the above studies further supported our findings. Our results revealed important issues that would have been hidden if only a single-index assessment had been used. First of all, this study revealed stage-specific temporal mismatches between GDL advancement and changes in EEQ, even though the underlying mechanism remains untested. Moreover, the results of this study provided a joint diagnosis for developing paths for districts and townships regarding GDL and EEQ: synergistic or mismatched. Despite there being synergistic areas with high GDL and improved EEQ at the same time (townships in the “HG-HE” category), there were still many townships that exhibited mismatched patterns, including high or moderate GDL but degraded EEQ townships (“HG-LE” and “MG-LE” categories), as well as low GDL but improved EEQ townships (“LG-HE” category). These patterns indicated that the increase in GDL, including increased input into environmental governance, has not translated into measurable environmental improvement in these townships. Also, the improved EEQ does not necessarily indicate good green development at the township scale (“LG-HE” category). In addition, this study further found that five townships in eastern Qingpu District showed an underdeveloped path with low GDL and degraded EEQ.
The other innovation is that this study proposed an approach to analyze the eco-green development quality at finer scales (administrative district and township) to capture the spatial variability within the cities, which validates the need for adaptive policy implementation at these scales. Compared with the other study [47] using a dual-index approach, which concluded that most cities in the Yangtze River Delta urban agglomeration showed positive interaction between urban development and the ecological quality at the city scale, our study further revealed that there can be obvious spatial heterogeneity in eco-green development quality within the city. This difference may partly reflect scale effects, as urbanization-ecosystem relationships in the YRD appeared more coordinated at broader scales but more heterogeneous at finer scales [66]. In addition, our results further suggested clear intra-district variation in EEQ among townships assigned the same district-level GDL category. Given that district and township units closely correspond to actual governance and policy implementation levels in China, the scale refinement not only represents technical improvement, but also the potential to target policy for more specific areas.
This study constructed a GDL evaluation framework that aligns with the SDGs, providing a reference that helps to reduce subjective bias in the selection of dimensions and indicators. Although this framework does not guarantee absolute completeness or perfect design for GDL assessment, it enhances the systematic coverage of the indicator system. Also, this SDGs-aligned dimensional design allows the identification of governance weaknesses. For example, the results of GDBI suggested that financial quality and social harmony improved steadily across regions, but differences in creation potential, resource use efficiency, and environmental governance coincided with the observed divergence in the coupling of GDL and EEQ outcomes across different townships. Wujiang showed a faster increase in creation potential than Qingpu and Jiashan. This pattern may be related to its stronger manufacturing base, closer integration with the industrial system of Suzhou, continued inflows of investment, and the development of industrial and development zones. These factors might have supported technological upgrading, research investment, and innovation-related activities. These findings suggest that eco-environment improvement should not only consider the intensity of governance inputs, but also the balance of development.
5.2. Policy Recommendations
This study conducted a comprehensive analysis of eco-green development quality at the district and township levels, providing suggestions for differentiated policy implementation at finer administrative levels. Rather than applying uniform development or environmental policies, our results suggest that strategies should be tailored to the specific eco-green development profiles of three districts and their townships.
The current development plan should be maintained for Wujiang District, as most of its townships have been identified as having synergistic GDL-EEQ paths (HG-HE and HG-ME types). Only Qidu Township has a GDL-EEQ mismatched path, which is characterized by high GDL but lagging EEQ. Policy makers should consider adjusting resource consumption patterns and reducing environmental pressure. Given that it is located along the Taihu Lake shoreline, Qidu Township has favorable conditions for renewable energy deployment, and the local government has already planned a township-wide photovoltaic power generation project. This action will provide a practical pathway to translating green development capacity into tangible environmental benefits, and it is also aligned with SDG 7 (Affordable and Clean Energy).
Jiashan County displays overall constrained and unbalanced GDL, as its creation potential and resource use levels lag behind (Figure 5c). Moreover, none of its townships showed improved eco-environmental status. In this case, policy implementation should focus on enhancing endogenous development drivers rather than only relying on environmental regulation. Since many townships in Jiashan are major tourism destinations, such as Xitang Township, tourism can be viewed not only as a source of environmental pressure but also as a potential for innovation and the promotion of resource use. For example, townships can integrate their tourism resources with creative industries, such as smart tourism services, digital cultural content, and intelligent parking systems, to increase the efficiency of resource consumption and support industrial upgrading. These efforts can align with multiple SDGs, particularly SDG 9 (Industry, Innovation and Infrastructure).
Qingpu District not only lags behind in creation potential and resource use but also showed decreased environmental governance level after 2005 (Figure 5b). It exhibits a high level of internal heterogeneity in GDL and EEQ, indicating that a uniform policy framework at the administrative district level is unlikely to be effective. Townships in the western part of Qingpu District (LG-HE type) have obviously better EEQ than those in the central and eastern part (LG-ME and LG-LE). This is a result of differences in development orientations: the western Qingpu townships focused on ecological promotion, while the eastern townships focused more on industry. Although western Qingpu townships (Jinze and Liantang) experienced improvements in eco-environment quality from 2000 to 2020, they are still moving slowly in promoting green development. Development should prioritize livability by improving public services, living conditions, and cultural amenities, thereby enhancing residents’ well-being. On the other hand, eastern Qingpu townships showed both low GDL and degraded EEQ due to rapid urbanization and lower VC, with a greater increase in built-up land than in other townships in the demonstration zone [59], which explained why Qingpu showed a decreased environmental governance index after 2005. The impact of industrial relocation, as these townships are located closer to the urban area of Shanghai, still has resource-intensive development patterns. In the future, these townships should focus on improving resource use and environmental governance by increasing resource efficiency and controlling pollutant emissions. The policy implementation in Qingpu District can align with SDG 11 (Sustainable Cities And Communities).
6. Conclusions
This study provides an assessment of the eco-green development quality in the demonstration zone of the YRD urban agglomeration by integrating GDL with EEQ across three administrative districts and 28 townships over the period 2000 to 2020. The GDL was assessed using two indexes, GDCI and GDBI, constructed from 38 indicators categorized into five sub-dimensions: financial quality, creation potential, social harmony, resource use, and environmental governance, aligned with 13 SDGs. The results show that GDL values across the three districts increased significantly, indicating a positive development trend. Wujiang District outperformed the other two with the highest average GDCI values and the fastest annual growth rate, as well as better-developed balance. The regression results revealed a moderately strong correlation between GDCI and CEI, suggesting that improvements in EEQ (reflected in CEI) are linked to a higher level of green development at the administrative district scale. But time-series comparisons indicated a potential temporal mismatch between improvements in GDL and their environmental outcomes. Finally, two indicators were integrated to assess eco-green development quality across the demonstration zone, and 28 townships were classified into eight categories with different combinations of GDL and EEQ levels. The above findings suggested that strategies should be tailored to the specific eco-green development profiles at administrative district and township scales in urban agglomerations, where temporal divergence and spatial heterogeneity in development-environment interactions exist.
Several limitations should be noted regarding data, model, and extrapolation boundaries. First, the published socioeconomic datasets are available only at the administrative district scale, which prevents this research from assessing GDL at the township scale. Therefore, township-level differences mainly reflect EEQ variation. Although entropy weights were derived from 63 region-year observations, these observations came from only three district/county-level units, which may limit the spatial representativeness of the resulting weights. Second, the model is subject to uncertainty from the use of relative CEI thresholds, which may affect class assignment. Partial conceptual overlap between the environmental governance sub-dimension of GDL and PM2.5 in CEI may also influence the observed GDL-EEQ relationship. The CEI may be sensitive to the choice of the 2000 baseline year and to interannual meteorological variability. Finally, the framework is transferable in structure rather than in fixed parameters. Although the indicators were retained to preserve conceptual coverage, collinearity may exist among some variables. The uneven distribution of indicator weights across SDGs means that some goals are more strongly represented than others. Indicator weights, normalization ranges, and classification thresholds should be recalculated for applications to other regions to avoid context-dependent bias. In future studies, alternative data sources such as mobile signaling data or applied check-in data may also be explored to reduce data discrepancies within the demonstration zone.
Author Contributions
Conceptualization, Wenpeng Lin; methodology, Wenpeng Lin and Linxuan Zhao; software, Linxuan Zhao; validation, Wenpeng Lin, Linxuan Zhao and Yuanfan Zheng; formal analysis, Wenpeng Lin, Linxuan Zhao and Yuanfan Zheng; investigation, Wenpeng Lin and Linxuan Zhao; resources, Wenpeng Lin; data curation, Linxuan Zhao; writing—original draft preparation, Linxuan Zhao and Yuanfan Zheng; writing—review and editing, Wenpeng Lin Linxuan Zhao and Yuanfan Zheng; visualization, Linxuan Zhao and Yuanfan Zheng; supervision, Wenpeng Lin; project administration, Wenpeng Lin; funding acquisition, Wenpeng Lin and Yuanfan Zheng All authors have read and agreed to the published version of the manuscript.
Funding
This research was funded by National Natural Science Foundation of China (grant number 42671597 and 42101314) and Shanghai Pujiang Program (grant number 21PJ1411600).
Data Availability Statement
The data that support the findings of this study are available from the corresponding author on reasonable request.
Conflicts of Interest
The authors declare no conflict of interest.
References
- Hao, X.; Wen, S.; Sun, Q.; Irfan, M.; Wu, H.; Hao, Y. How does the target of green innovation for cleaner production change in management process? Quality targeting and link targeting. J. Environ. Manag. 2023, 345, 118832. [Google Scholar] [CrossRef] [Scilit] [PubMed]
- Song, Y.; Huang, J.; Zhang, Y.; Wang, P. Drivers of metal consumption in China: An input-output structural decomposition analysis. Resour. Policy 2019, 63, 101421. [Google Scholar] [CrossRef] [Scilit]
- Yang, M.; Magazzino, C.; Awosusi, A.A.; Abdulloev, N. Determinants of load capacity factor in BRICS countries: A panel data analysis. Nat. Resour. Forum 2024, 48, 525–548. [Google Scholar] [CrossRef] [Scilit]
- Zhao, Y.; Zhang, Q.; Zhang, H.; Hang, S. Spatio-temporal patterns and driving factors of green development level in alpine meadow regions: A case study in Gannan Tibetan Autonomous Prefecture. Ecol. Indic. 2024, 168, 112751. [Google Scholar] [CrossRef] [Scilit]
- Accolla, C.; Forbes, V.E. Temperature dependence of population responses to competition and metabolic stress: An agent-based model to inform ecological risk assessment in a changing climate. Sci. Total Environ. 2021, 763, 144096. [Google Scholar] [CrossRef] [Scilit] [PubMed]
- Blimpo, M.P.; Dato, P.; Mukhaya, B.; Odarno, L. Climate change and economic development in Africa: A systematic review of energy transition modeling research. Energy Policy 2024, 187, 114044. [Google Scholar] [CrossRef] [Scilit]
- Pu, J.; Shen, A.; Liu, C.; Wen, B. Impacts of ecological land fragmentation on habitat quality in the Taihu Lake basin in Jiangsu Province, China. Ecol. Indic. 2024, 158, 111611. [Google Scholar] [CrossRef] [Scilit]
- Bull, J.W.; Sonter, L.J.; Gordon, A.; Maron, M.; Narain, D.; Reside, A.E.; Sánchez, L.E.; Shumway, N.; von Hase, A.; Quétier, F. Quantifying the “avoided” biodiversity impacts associated with economic development. Front. Ecol. Environ. 2022, 20, 370–378. [Google Scholar] [CrossRef] [Scilit]
- Croeser, T.; Bekessy, S.A.; Garrard, G.E.; Kirk, H. Nature-based solutions for urban biodiversity: Spatial targeting of retrofits can multiply ecological connectivity benefits. Landsc. Urban Plan. 2024, 251, 105169. [Google Scholar] [CrossRef] [Scilit]
- Wang, J.; Wang, L. Study on the efficiency of air pollution control and responsibility allocation in the Yangtze River Delta region in China from the perspective of ecological compensation. J. Clean. Prod. 2023, 423, 138700. [Google Scholar] [CrossRef] [Scilit]
- Chaudhry, N.I.; Hussain, M. Nexus of Renewable Energy, Green Financing, and Sustainable Development Goals: An Empirical Investigation. Environ. Sci. Pollut. Res. Int. 2023, 30, 58480–58492. [Google Scholar] [CrossRef] [Scilit]
- Chen, X.; Chen, Z.G. Can Green Finance Development Reduce Carbon Emissions? Empirical Evidence from 30 Chinese Provinces. Sustainability 2021, 13, 12137. [Google Scholar] [CrossRef] [Scilit]
- Lu, Z.R.; Shao, C.F.; Wang, F.; Dong, R.Y. Evaluation of Green and Low-Carbon Development Level of Chinese Provinces Based on Sustainable Development Goals. Sustainability 2023, 15, 15449. [Google Scholar] [CrossRef] [Scilit]
- Lan, G.; Xiao, Y.; Ci, X.; Zhang, Y.; Xia, J. Spatial and temporal differentiation characteristics of green development levels in urban agglomerations within the Yangtze River economic Belt and analysis of influencing factors. Ecol. Indic. 2024, 166, 112552. [Google Scholar] [CrossRef] [Scilit]
- Cervero, R.; Sullivan, C. Green TODs: Marrying transit-oriented development and green urbanism. Int. J. Sustain. Dev. World Ecol. 2011, 18, 210–218. [Google Scholar] [CrossRef] [Scilit]
- Guo, M.; Nowakowska-Grunt, J.; Gorbanyov, V.; Egorova, M. Green Technology and Sustainable Development: Assessment and Green Growth Frameworks. Sustainability 2020, 12, 6571. [Google Scholar] [CrossRef] [Scilit]
- Lin, B.Q.; Benjamin, N.I. Green development determinants in China: A non-radial quantile outlook. J. Clean. Prod. 2017, 162, 764. [Google Scholar] [CrossRef] [Scilit]
- Lin, Y.; Wang, Q.J.; Zheng, M.Q. Nexus among digital economy, green innovation, and green development: Evidence from China. Emerg. Mark. Financ. Trade 2024, 60, 704–723. [Google Scholar] [CrossRef] [Scilit]
- Chen, Y.; Tang, J. The impact of economic growth targets on the level of green development-A perspective on officials’ promotion incentives and environmental regulations. J. Environ. Manag. 2024, 368, 122056. [Google Scholar] [CrossRef] [Scilit] [PubMed]
- Liang, Y.X.; Zhang, L.P.; Leng, M.S.; Xiao, Y.; Xia, J. System Simulation and Prediction of the Green Development Level of the Chengdu-Chongqing City Group. Water 2022, 14, 3947. [Google Scholar] [CrossRef] [Scilit]
- Wang, M.; Zhao, H.; Cui, J.; Fan, D.; Lv, B.; Wang, G.; Li, Z.; Zhou, G. Evaluating green development level of nine cities within the Pearl River Delta, China. J. Clean. Prod. 2018, 174, 315–323. [Google Scholar] [CrossRef] [Scilit]
- Yu, X. An assessment of the green development efficiency of industrial parks in China: Based on non-desired output and non-radial DEA model. Struct. Change Econ. Dyn. 2023, 66, 81–88. [Google Scholar] [CrossRef] [Scilit]
- Xiao, Y.T.; Chen, J.; Wang, X.L.; Lu, X.Y. Regional green development level and its spatial spillover effects: Empirical evidence from Hubei Province. China. Ecol. Indic. 2022, 143, 109312. [Google Scholar] [CrossRef] [Scilit]
- Long, R.; Li, H.; Wu, M.; Li, W. Dynamic evaluation of the green development level of China’s coal-resource-based cities using the TOPSIS method. Resour. Policy 2021, 74, 102415. [Google Scholar] [CrossRef] [Scilit]
- Wang, Y.; Hu, H.; Dai, W.; Burns, K. Evaluation of industrial green development and industrial green competitiveness: Evidence from Chinese urban agglomerations. Ecol. Indic. 2021, 124, 107371. [Google Scholar] [CrossRef] [Scilit]
- Bergougui, B. Investigating the relationships among green technologies, financial development and ecological footprint levels in Algeria: Evidence from a novel Fourier ARDL approach. Sustain. Cities Soc. 2024, 112, 105621. [Google Scholar] [CrossRef] [Scilit]
- Feng, C.; Wang, M.; Liu, G.C.; Huang, J.B. Green development performance and its influencing factors: A global perspective. J. Clean. Prod. 2017, 144, 323–333. [Google Scholar] [CrossRef] [Scilit]
- Han, M.S.; Yuan, Q.; Fahad, S.; Ma, T. Dynamic evaluation of green development level of ASEAN region and its spatio-temporal patterns. J. Clean. Prod. 2022, 362, 132402. [Google Scholar] [CrossRef] [Scilit]
- Hou, Y.; Long, R.; Zhang, L.; Wu, M. Dynamic analysis of the sustainable development capability of coal cities. Resour. Policy 2020, 66, 101607. [Google Scholar] [CrossRef] [Scilit]
- Wei, X.; Zeng, C.; Wang, J.; Chen, Y. The road to green development for national-level poverty-stricken counties: Does poverty alleviation help reduce carbon emissions? Energy Econ. 2024, 138, 107817. [Google Scholar] [CrossRef] [Scilit]
- Xu, G.; Chang, H.; Meng, L.; Marma, K.J.S. Green development level, resource utilization, and ecological protection across China from 2006 to 2017: Based on the national standard indicator system. Environ. Dev. 2022, 44, 100776. [Google Scholar] [CrossRef] [Scilit]
- Guan, X.; Zhang, W. Impact assessment of ecological environment governance on the green development efficiency. Sustain. Futur. 2025, 10, 100944. [Google Scholar] [CrossRef] [Scilit]
- Tang, Y.; Yuan, Y.; Tian, B. Assessment of spatio-temporal evolution trends and driving factors of green development in Harbin-Changchun urban agglomeration. Sci. Rep. 2023, 13, 16785. [Google Scholar] [CrossRef] [Scilit] [PubMed]
- Guo, H.; Bao, A.; Liu, T.; Ndayisaba, F.; Jiang, L.; Zheng, G.; Chen, T.; De Maeyer, P. Determining variable weights for an optimal scaled drought condition index (OSDCI): Evaluation in central Asia. Remote Sens. Environ. 2019, 231, 111220. [Google Scholar] [CrossRef] [Scilit]
- Kou, L.; Wang, X.; Wang, H.; Wang, X.; Hou, Y. Spatiotemporal analysis of ecological benefits coupling remote sensing ecological index and ecosystem service index. Ecol. Indic. 2024, 166, 112420. [Google Scholar] [CrossRef] [Scilit]
- Xiong, Y.; Xu, W.; Lu, N.; Huang, S.; Wu, C.; Wang, L.; Dai, F.; Kou, W. Assessment of spatial–temporal changes of ecological environment quality based on RSEI and GEE: A case study in Erhai Lake Basin, Yunnan province, China. Ecol. Indic. 2021, 125, 107518. [Google Scholar] [CrossRef] [Scilit]
- Yang, W.; Li, D. Spatio-temporal evolution of ecological environment quality in China from a concept of strong sustainability. Environ. Sci. Pollut. Res. 2022, 29, 28769–28787. [Google Scholar] [CrossRef] [Scilit]
- Zhang, X.; Fan, H.; Sun, L.; Liu, W.; Wang, C.; Wu, Z.; Lv, T. Identifying regional eco-environment quality and its influencing factors: A case study of an ecological civilization pilot zone in China. J. Clean. Prod. 2024, 435, 140308. [Google Scholar] [CrossRef] [Scilit]
- Zhuang, Q.; Wu, S.; Yan, Y.; Niu, Y.; Yang, F.; Xie, C. Monitoring land surface thermal environments under the background of landscape patterns in arid regions: A case study in Aksuriver basin. Sci. Total Environ. 2020, 710, 136336. [Google Scholar] [CrossRef] [Scilit] [PubMed]
- Xu, H.Q. A remote sensing index for assessment of regional ecological changes. China Environ. Sci. 2013, 33, 889–897. (In Chinese) [Google Scholar] [CrossRef]
- Liu, Y.; Xu, W.; Hong, Z.; Wang, L.; Ou, G.; Lu, N.; Dai, Q. Integrating three-dimensional greenness into RSEI improved the scientificity of ecological environment quality assessment for forest. Ecol. Indic. 2023, 156, 111092. [Google Scholar] [CrossRef] [Scilit]
- Aizizi, Y.; Kasimu, A.; Liang, H.; Zhang, X.; Zhao, Y.; Wei, B. Evaluation of ecological space and ecological quality changes in urban agglomeration on the northern slope of the Tianshan mountains. Ecol. Indic. 2023, 146, 109896. [Google Scholar] [CrossRef] [Scilit]
- Cao, J.; Wu, E.; Wu, S.; Fan, R.; Xu, L.; Ning, K.; Li, Y.; Lu, R.; Xu, X.; Zhang, J.; et al. Spatiotemporal dynamics of ecological condition in Qinghai-Tibet Plateau based on remotely sensed ecological index. Remote Sens. 2022, 14, 4234. [Google Scholar] [CrossRef] [Scilit]
- Zhang, P.; Chen, X.; Ren, Y.; Lu, S.; Song, D.; Wang, Y. A novel mine-specific eco-environment index (MSEEI) for mine ecological environment monitoring using landsat imagery. Remote Sens. 2023, 15, 933. [Google Scholar] [CrossRef] [Scilit]
- Jiang, M.; Liu, J.; Hou, W.; Sang, H.; Qu, L. An improved remote sensing-based ecological index and its application in wetland environment monitoring. Sci. Surv. Mapp. 2022, 47, 85–92. [Google Scholar] [CrossRef]
- He, C.; Gao, B.; Huang, Q.; Ma, Q.; Dou, Y. Environmental degradation in the urban areas of China: Evidence from multi-source remote sensing data. Remote Sens. Environ. 2017, 193, 65–75. [Google Scholar] [CrossRef] [Scilit]
- Wang, Z.; Yu, Y.; Zhou, R. A longitudinal exploration of the spatiotemporal coupling relationship and driving factors between regional urban development and ecological quality of green space. Ecol. Indic. 2024, 164, 112134. [Google Scholar] [CrossRef] [Scilit]
- Wei, Y.; Li, X.; Gao, F.; Huang, C.; Song, X.; Wang, B.; Ma, H.; Wang, P. The United Nations Sustainable Development Goals (SDG) and the Response Strategies of China. Adv. Earth Sci. 2018, 10, 1084–1093. (In Chinese) [Google Scholar] [CrossRef]
- Wei, J.; Huang, W.; Li, Z.; Xue, W.; Peng, Y.; Sun, L.; Cribb, M. Estimating 1-km-resolution PM2.5 concentrations across China using the space-time random forest approach. Remote Sens. Environ. 2019, 231, 111221. [Google Scholar] [CrossRef] [Scilit]
- Xu, X.; Liu, J.; Zhang, S.; Li, R.; Yan, C.; Wu, S. Data from: China Multi-Period Land Use Remote Sensing Monitoring Dataset (CNLUCC) [Dataset]. Resource and Environmental Science Data Platform. 2018. Available online: https://www.resdc.cn/DOI/DOI.aspx?DOIID=54 (accessed on 13 May 2025).
- Chinese Academy of Science. Data from: Landuse Dataset in China (1980–2015) [Dataset]. National Tibetan Plateau/Third Pole Environment Data Center. 2019. Available online: https://data.tpdc.ac.cn/en/data/a75843b4-6591-4a69-a5e4-6f94099ddc2d/ (accessed on 15 May 2025).
- Zhu, L.; Xie, S.; Yang, H.; Ma, M.; Xia, J. Topographic Distribution Characteristics of Fractional Vegetation Coverage Based on MODIS-EVI in Sichuan. J. Southwest Univ. (Nat. Sci. Ed.) 2022, 44, 122–132. (In Chinese) [Google Scholar] [CrossRef]
- Huang, Y.; Zhang, X.; Cui, S.; Huang, W.; Xu, S.; Wang, L. Indicator construction and weight of green city evaluation index system. Acta Sci. Circumstantiae 2020, 40, 4603–4612. (In Chinese) [Google Scholar] [CrossRef]
- Li, Y.; Pan, W.; Wang, J.; Liu, Y. Spatial pattern and influencing factors of high-quality development of China at the prefecture level. Acta Ecol. Sin. 2022, 42, 2306–2320. (In Chinese) [Google Scholar] [CrossRef] [Scilit]
- Xiong, W.; Guo, X.; Sun, Y.; Ou, J. Green standard and green development: Theory and empirical evidence. J. Clean. Prod. 2023, 414, 137768. [Google Scholar] [CrossRef] [Scilit]
- Zhong, Z.; Chen, Z. Urbanization, green development and residents’ happiness: The moderating role of environmental regulation. Environ. Impact Assess. Rev. 2022, 97, 106900. [Google Scholar] [CrossRef] [Scilit]
- Zhu, K.; Song, D.; Zhang, L.; He, Y.; Zhang, S.; Liu, Y.; Tian, X. Evolving Trends and Influencing Factors of the Rural Green Development Level in Chongqing. Land 2023, 12, 1333. [Google Scholar] [CrossRef] [Scilit]
- Zhang, C. The Coordination Analysis for the Sustainable Development of Sichuan Province—Based on the Requirements of the Sustainable Communities. Master’s Thesis, Sichuan Normal University, Chengdu, China, 2013. (In Chinese) [Google Scholar]
- Zheng, Y.; Zhao, L.; Lin, W.; Ma, Q. Assessment of eco-environment quality using multi-source remote sensing data. Int. J. Sustain. Dev. World Ecol. 2025, 32, 160–176. [Google Scholar] [CrossRef] [Scilit]
- Sellers, P.J.; Tucker, C.J.; Collatz, G.J.; Los, S.O.; Justice, C.O.; Dazlich, D.A.; Randall, D.A. A revised land surface parameterization (SiB2) for atmospheric GCMS. Part II: The generation of global fields of terrestrial biophysical parameters from satellite data. J. Clim. 1996, 9, 706–737. [Google Scholar] [CrossRef] [Scilit]
- He, C.; Ma, Q.; Li, T.; Yang, Y.; Liu, Z. Spatiotemporal dynamics of electric power consumption in Chinese Mainland from 1995 to 2008 modeled using DMSP/OLS stable nighttime lights data. J. Geogr. Sci. 2012, 22, 125–136. [Google Scholar] [CrossRef] [Scilit]
- Mu, S.; Li, J.; Chen, Y.; Gang, C.; Zhou, W.; Ju, W. Spatial differences of variations of vegetation coverage in Inner Mongolia during 2001–2010. Acta Geogr. Sin. 2012, 67, 1255–1268. (In Chinese) [Google Scholar] [CrossRef]
- Zhu, L.; Yuan, J. Spatiotemporal Distribution of Vegetation Net Primary Productivity and Its Relationship with Topographic Factors in Beijing-Tianjin-Hebei Region. Bull. Sci. Technol. 2019, 35, 197–203. [Google Scholar] [CrossRef]
- Kang, X.; Chen, L.; Zhao, Y.; Jiang, L. Green development level on provincial-level air logistics: Evidence for spatial network evolution and impact mechanisms from China. J. Environ. Manag. 2025, 386, 125657. [Google Scholar] [CrossRef] [Scilit] [PubMed]
- Fang, G.; Wang, Q.; Tian, L. Green development of Yangtze River Delta in China under Population-Resources-Environment-Development-Satisfaction perspective. Sci. Total Environ. 2020, 727, 138710. [Google Scholar] [CrossRef] [Scilit] [PubMed]
- Li, R.; Xu, Q.; Yu, J.; Chen, L.; Peng, Y. Multiscale assessment of the spatiotemporal coupling relationship between urbanization and ecosystem service value along an urban–rural gradient: A case study of the Yangtze River Delta urban agglomeration, China. Ecol. Indic. 2024, 160, 111864. [Google Scholar] [CrossRef] [Scilit]

Disclaimer/Publisher’s Note: The statements, opinions and data contained in all publications are solely those of the individual author(s) and contributor(s) and not of MDPI and/or the editor(s). MDPI and/or the editor(s) disclaim responsibility for any injury to people or property resulting from any ideas, methods, instructions or products referred to in the content. |
© 2026 by the authors. Published by MDPI on behalf of the International Society for Photogrammetry and Remote Sensing. Licensee MDPI, Basel, Switzerland. This article is an open access article distributed under the terms and conditions of the Creative Commons Attribution (CC BY) license.