Next Issue
Volume 13, March
Previous Issue
Volume 13, January


ISPRS Int. J. Geo-Inf., Volume 13, Issue 2 (February 2024) – 29 articles

Cover Story (view full-size image): 
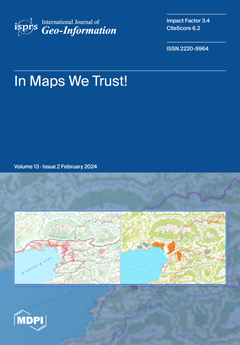
The advent of user-friendly map-making software and data manipulation tools has placed map making in the hands of the general populace. This mirrors other forms of communication and has given rise to a growing discourse on “fake news”, “fake media”, and “fake maps”, ultimately prompting us to question how we can trust the information being conveyed and how we can differentiate between “fake” and “trustworthy” maps. This paper highlights the fundamental aspects determined by the pure nature of cartographic modeling, which influences every attempt to understand, analyze, and express the context and trustworthiness of maps. View this paper
  • Issues are regarded as officially published after their release is announced to the table of contents alert mailing list.
  • You may sign up for e-mail alerts to receive table of contents of newly released issues.
  • PDF is the official format for papers published in both, html and pdf forms. To view the papers in pdf format, click on the "PDF Full-text" link, and use the free Adobe Reader to open them.
Order results
Result details
Select all
Export citation of selected articles as:
15 pages, 12194 KiB  
Article
Comparing Characteristics of the Urban Thermal Environment Based on the Local Climate Zone in Three Chinese Metropolises
by Riguga Su, Chaobin Yang, Zhibo Xu, Tingwen Luo, Lilong Yang, Lifeng Liu and Chao Wang
ISPRS Int. J. Geo-Inf. 2024, 13(2), 61; https://doi.org/10.3390/ijgi13020061 - 19 Feb 2024
Viewed by 1229
Abstract
Urban landscape has important effects on urban climate, and the local climate zone (LCZ) framework has been widely applied in related studies. However, few studies have compared the relative contributions of LCZ on the urban thermal environment across different cities. Therefore, Beijing, Shanghai, [...] Read more.
Urban landscape has important effects on urban climate, and the local climate zone (LCZ) framework has been widely applied in related studies. However, few studies have compared the relative contributions of LCZ on the urban thermal environment across different cities. Therefore, Beijing, Shanghai, and Shenzhen in China were selected to conduct a comparative study to explore the relationship between LCZ and land surface temperature (LST). The results showed that (1) both the composition and spatial configuration of LCZ had obvious differences among the three cities. Beijing had a higher area proportion of compact mid-rise and low-rise LCZ types. The spatial pattern of LCZ in Shenzhen was especially quite different from those of Beijing and Shanghai. (2) Shenzhen had the strongest summer surface urban heat island (UHI) intensity and the largest UHI region area. However, the proportion of urban cooling island areas was still the highest in Shenzhen. (3) Different LCZs showed significant LST differences. The largest LST difference between the LCZs reached 5.57 °C, 4.50 °C, and 12.08 °C in Beijing, Shanghai, and Shenzhen, respectively. Built-up LCZs had higher LSTs than other LCZ types. (4) The dominant driving LCZs on LST were different among these cities. The LST in Beijing was easily influenced by built-up LCZ types, while the cooling effects generated by LCZ G(water) were much stronger than built-up LCZs’ warming effects in Shanghai. These results indicated that the effect of the LCZ on LST had significant differences among LCZ types and across cities, and the dominant LCZs should be given more priority in future urban planning. Full article
Show Figures

Figure 1

21 pages, 7169 KiB  
Article
Measuring Villagers’ Perceptions of Changes in the Landscape Values of Traditional Villages
by Mingxuan Li, Yu Yan, Ziyi Ying and Long Zhou
ISPRS Int. J. Geo-Inf. 2024, 13(2), 60; https://doi.org/10.3390/ijgi13020060 - 18 Feb 2024
Viewed by 1342
Abstract
This study aims to analyze the perceptions and driving factors behind villagers’ changing perceptions of landscape values in the context of drastic landscape changes in traditional Chinese villages. Empirical evidence emphasizes the interplay between local residents’ values and the local policy framework. This [...] Read more.
This study aims to analyze the perceptions and driving factors behind villagers’ changing perceptions of landscape values in the context of drastic landscape changes in traditional Chinese villages. Empirical evidence emphasizes the interplay between local residents’ values and the local policy framework. This study establishes a method to capture the landscape values and preferences of rural community residents by combining participatory mapping with questionnaire interviews. We identified the evaluation of changing landscape values by rural residents and extracted four categories of rural development orientations, namely, economic benefits, emotional culture, public participation, and environmental protection. Furthermore, we delved into the significant heterogeneity in landscape value changes among different social groups. This study highlights the role of villagers’ value judgments in guiding the scientific formulation of traditional village conservation and development policies and promoting the socially sustainable development planning of traditional villages. The research contributes to a more comprehensive understanding of the rural community’s needs and preferences for the local landscape as well as the convergence and divergence between these needs and the government-led rural development trajectory. Full article
Show Figures

Figure 1

23 pages, 19627 KiB  
Article
A Spatiotemporal Hierarchical Analysis Method for Urban Traffic Congestion Optimization Based on Calculation of Road Carrying Capacity in Spatial Grids
by Dong Jiang, Wenji Zhao, Yanhui Wang and Biyu Wan
ISPRS Int. J. Geo-Inf. 2024, 13(2), 59; https://doi.org/10.3390/ijgi13020059 - 15 Feb 2024
Viewed by 1381
Abstract
Traffic congestion is a globally widespread problem that causes significant economic losses, delays, and environmental impacts. Monitoring traffic conditions and analyzing congestion factors are the first, challenging steps in optimizing traffic congestion, one of the main causes of which is regional spatiotemporal imbalance. [...] Read more.
Traffic congestion is a globally widespread problem that causes significant economic losses, delays, and environmental impacts. Monitoring traffic conditions and analyzing congestion factors are the first, challenging steps in optimizing traffic congestion, one of the main causes of which is regional spatiotemporal imbalance. In this article, we propose an improved spatiotemporal hierarchical analysis method whose steps include calculating road carrying capacity based on geospatial data, extracting vehicle information from remote sensing images to reflect instantaneous traffic demand, and analyzing the spatiotemporal matching degree between roads and vehicles in theory and in practice. First, we defined and calculated the ratio of carrying capacity in a regional road network using a nine-cell-grid model composed of nested grids of different sizes. By the conservation law of flow, we determined unbalanced areas in the road network configuration using the ratio of the carrying capacity of the central cell to that of the nine grid cells. Then, we designed a spatiotemporal analysis method for traffic congestion using real-time traffic data as the dependent variables and five selected spatial indicators relative to the spatial grids as the independent variables. The proposed spatiotemporal analysis method was applied to Chengdu, a typical provincial capital city in China. The relationships among regional traffic, impact factors, and spatial heterogeneity were analyzed. The proposed method effectively integrates GIS, remote sensing, and deep learning technologies. It was further demonstrated that our method is reliable and effective and enhances the coordination of congested areas by virtue of a fast calculation speed and an efficient local balance adjustment. Full article
Show Figures

Figure 1

27 pages, 72343 KiB  
Article
Study on LOS to Vertical Deformation Conversion Model on Embankment Slopes Using Multi-Satellite SAR Interferometry
by Jie Liu, Tao Li, Sijie Ma, Qiang Shan and Weiping Jiang
ISPRS Int. J. Geo-Inf. 2024, 13(2), 58; https://doi.org/10.3390/ijgi13020058 - 14 Feb 2024
Viewed by 1418
Abstract
Slant range geometry plays a crucial role in interpreting synthetic aperture radar (SAR) observations, especially in converting line-of-sight (LOS) surface deformations to actual vertical subsidence. This paper proposes a new conversion model to retrieve vertical settlements of the embankment slopes using the geometrical [...] Read more.
Slant range geometry plays a crucial role in interpreting synthetic aperture radar (SAR) observations, especially in converting line-of-sight (LOS) surface deformations to actual vertical subsidence. This paper proposes a new conversion model to retrieve vertical settlements of the embankment slopes using the geometrical parameters of the dam and the SAR sensor. The simulation results highlight the impact of slope foreshortening and heading direction of the satellite on deformation retrieval. Various SAR data with different resolutions and bands are used to analyze the model’s performance, revealing a high conformity of the model with practical conversion parameters exceeding 80% for TerraSAR-X and Cosmo-SkyMed data. Full article
(This article belongs to the Topic Advances in Earth Observation and Geosciences)
Show Figures

Figure 1

12 pages, 24549 KiB  
Article
Methodological Innovations for Establishing Cemetery Spatial Databases—A UAV-Based Workflow Helping Small Communities
by Márton Pál and Edina Hajdú
ISPRS Int. J. Geo-Inf. 2024, 13(2), 57; https://doi.org/10.3390/ijgi13020057 - 14 Feb 2024
Viewed by 1225
Abstract
Various modern large-scale mapping techniques have already been introduced in earth sciences, cadastral mapping, and the agricultural sector. These methodologies often use remotely sensed data to compile various analogue or digital cartographic products as well as spatial databases. However, the mapping of cemeteries [...] Read more.
Various modern large-scale mapping techniques have already been introduced in earth sciences, cadastral mapping, and the agricultural sector. These methodologies often use remotely sensed data to compile various analogue or digital cartographic products as well as spatial databases. However, the mapping of cemeteries and standards for establishing a spatial database for them have rarely been published, and there is no definite method for this purpose in Hungary yet. We have compiled a methodology based on mapping experiences in three sample areas in the Roman Catholic Archdiocese of Eger in Hungary that are church properties. The initial UAV-based fieldwork orthomosaics were processed with a CV (computer vision)-based script that vectorised grave contours. After fieldwork, which included the recording of the deceased people’s names and their dates of birth and death in the case of all graves, a spatial database was created pairing each polygon with the corresponding personal data. A map was also generated from the results of the survey. The cartographic product and the database fulfil legal requirements and give hints for cemeteries regarding further planning. The developed method is capable of making mapping and database building easier—not just in the case of graves, but with other rectangular objects, too. Full article
Show Figures

Figure 1

11 pages, 527 KiB  
Article
Secant Cylinders Are Evil—A Case Study on the Standard Lines of the Universal Transverse Mercator and Universal Polar Stereographic Projections
by Krisztián Kerkovits
ISPRS Int. J. Geo-Inf. 2024, 13(2), 56; https://doi.org/10.3390/ijgi13020056 - 13 Feb 2024
Cited by 1 | Viewed by 1149
Abstract
The literature usually calls downscaled versions of basic conformal map projections “secant”, referring to conceptual developable map surfaces that intersect the reference frame. However, recent studies pointed out on the examples of various mappings of the sphere that this model may lead to [...] Read more.
The literature usually calls downscaled versions of basic conformal map projections “secant”, referring to conceptual developable map surfaces that intersect the reference frame. However, recent studies pointed out on the examples of various mappings of the sphere that this model may lead to incorrect conclusions. In this study, we examine the paradigm of secant surfaces for two popular map projections of the ellipsoid, the UTM (Universal Transverse Mercator) and the UPS (Universal Polar Stereographic) projections. Results will show that ellipsoidal map projections can exhibit further anomalies. To support the shift to a paradigm avoiding developable map surfaces, this study recommends the new term reduced map projection with a proper and simple definition to be used instead of secant map projections. Full article
Show Figures

Figure 1

14 pages, 1799 KiB  
Article
Evaluation of the Accessibility of Children’s Spaces at the Community Scale: The Case Study of Hangzhou
by Yuanzheng Cui, Qiuting Wang, Guixiang Zha, Yunxiao Dang, Xuejun Duan, Lei Wang and Ming Luo
ISPRS Int. J. Geo-Inf. 2024, 13(2), 55; https://doi.org/10.3390/ijgi13020055 - 12 Feb 2024
Viewed by 1409
Abstract
The safety, inclusivity, accessibility, and green communities emphasized in the United Nations’ Sustainable Development Goals (SDGs) play a vital role in the establishment of child-friendly cities. The governments are actively promoting the development of sustainable, child-friendly cities that prioritize people’s needs and aim [...] Read more.
The safety, inclusivity, accessibility, and green communities emphasized in the United Nations’ Sustainable Development Goals (SDGs) play a vital role in the establishment of child-friendly cities. The governments are actively promoting the development of sustainable, child-friendly cities that prioritize people’s needs and aim to enhance the well-being of residents, from children to families. However, there is limited research utilizing GIS analysis techniques and internet big data to analyze spatial equity in children’s spatial accessibility. Therefore, this study introduces an innovative approach focusing on the community level. Drawing on data from the popular social networking platform mobile application “Xiaohongshu” and employing network analysis methods based on walking and driving modes, this study analyzed and investigated the accessibility of children’s spaces in the city of Hangzhou, China. Regarding spatial characteristics, the distribution of children’s space resources in the main urban area of Hangzhou exhibited a “peripheral low and central high” trend, which was closely linked to the distribution of population space. This pattern indicates potential significant disparities in the allocation of children’s space resources. Notably, the core area of Hangzhou demonstrated the highest level of accessibility to children’s spaces, with Gongshu District exhibiting the best accessibility. Conversely, non-core urban areas generally had relatively poor accessibility. Furthermore, different types of children’s spaces, such as indoor cultural spaces, indoor entertainment spaces, outdoor parks, and outdoor nature areas, all exhibited the highest accessibility in the city center, which gradually decreased towards the periphery. Additionally, this study evaluated the convenience of children’s spaces in various communities by combining population size and accessibility levels. The findings revealed that communities in the core area had higher accessibility levels in the northwest–southeast direction, while accessibility decreased towards the northeast–southwest direction. Consequently, the relative convenience of these communities tended to be lower. By examining spatial equity, this study provides valuable insights into the promotion of sustainable, child-friendly cities that prioritize people’s needs and contribute to the well-being of residents, from children to families. Full article
Show Figures

Figure 1

24 pages, 11737 KiB  
Article
Historical Heritage Maintenance via Scan-to-BIM Approaches: A Case Study of the Lisbon Agricultural Exhibition Pavilion
by Gustavo Rocha, Luís Mateus and Victor Ferreira
ISPRS Int. J. Geo-Inf. 2024, 13(2), 54; https://doi.org/10.3390/ijgi13020054 - 11 Feb 2024
Viewed by 1334
Abstract
Building Information Modeling (BIM) has emerged as a revolutionary tool in the domain of architectural conservation and documentation. When combined with terrestrial 3D laser scanning, it presents a powerful method to capture and represent the intricate details and nuances of historic structures. Such [...] Read more.
Building Information Modeling (BIM) has emerged as a revolutionary tool in the domain of architectural conservation and documentation. When combined with terrestrial 3D laser scanning, it presents a powerful method to capture and represent the intricate details and nuances of historic structures. Such buildings, with their unique architectural lineage, often exude a geometric complexity unparalleled by standard designs. Consequently, the transition from scan data to a BIM framework, or the scan-to-BIM process, becomes intricate and time-intensive. Beyond the challenge of digital translation, the true essence of these historic buildings lies not only in their geometric form but also in understanding and preserving their design logic, formal composition rules, and primitive geometry. It then becomes imperative that the resulting model maintains fidelity in terms of proportion, shape, symmetry, and spatial rationale. Considering these challenges and potentials, this article delves into the process of digitalizing and BIM modeling of the Lisbon Agricultural Exhibition Pavilion located in Portugal. Our study proceeds in a tripartite structure: initiating with an in-depth terrestrial 3D laser scanning of the pavilion, followed by a comprehensive registration, processing, and alignment of the acquired scans, and culminating in a detailed BIM model using the industry-standard Revit 2020 software. Full article
Show Figures

Figure 1

19 pages, 719 KiB  
Article
Online Decision Support Infrastructures for Integrating Spatial Planning and Flood Risk Management Policies
by Jing Ran and Zorica Nedovic-Budic
ISPRS Int. J. Geo-Inf. 2024, 13(2), 53; https://doi.org/10.3390/ijgi13020053 - 11 Feb 2024
Viewed by 1230
Abstract
Accessible geospatial data are crucial for informed decision making and policy development in urban planning, environmental governance, and hazard mitigation. Spatial data infrastructures (SDIs) have been implemented to facilitate such data access. However, with the rapid advancements in geospatial software and modelling tools, [...] Read more.
Accessible geospatial data are crucial for informed decision making and policy development in urban planning, environmental governance, and hazard mitigation. Spatial data infrastructures (SDIs) have been implemented to facilitate such data access. However, with the rapid advancements in geospatial software and modelling tools, it is important to re-visit the theoretical discussion about the different roles of data-focused SDIs and decision support and modelling tools, particularly in relation to their different impacts on policy making and policy integration. This research focuses on addressing this issue within the specific context of policy integration in spatial planning and flood risk management. To investigate this, an experiment was conducted comparing a data-focused SDI, the Myplan Viewer, with a prototype Internet-based Spatially Integrated Policy Infrastructure (SIPI). The findings reveal that the SIPI, which provides access to both data and decision support and modelling tools, significantly enhances policy integration compared to the Myplan Viewer. Moreover, drawing upon communicative action theory, this study underscores that while data-focused SDIs support instrumental goals, they possess limitations in facilitating trade-offs and balancing diverse interests in the policy-making process, particularly in supporting strategic and communicative actions. Full article
Show Figures

Figure 1

17 pages, 5862 KiB  
Article
Generating Spatial Knowledge Graphs with 2D Indoor Floorplan Data: A Case Study on the Jeonju Express Bus Terminal
by Hanme Jang, Kiyun Yu and Jiyoung Kim
ISPRS Int. J. Geo-Inf. 2024, 13(2), 52; https://doi.org/10.3390/ijgi13020052 - 9 Feb 2024
Viewed by 1321
Abstract
With the boom in online information, knowledge graphs like Freebase, Wikidata, and YAGO have emerged, thanks to the introduction of the RDF (Resource Description Framework). As RDF data grew, more and more spatial data was incorporated into it. While we have a lot [...] Read more.
With the boom in online information, knowledge graphs like Freebase, Wikidata, and YAGO have emerged, thanks to the introduction of the RDF (Resource Description Framework). As RDF data grew, more and more spatial data was incorporated into it. While we have a lot of 2D data for outdoor spaces, mapping indoor spaces in 3D is challenging because it is expensive and time-consuming. In our research, we turned 2D blueprints into detailed 3D maps and then translated this into RDF format. We used the Jeonju Express Bus Terminal in South Korea as our test case. We made an automated tool that can turn 2D spatial data into 3D data that fits the IndoorGML standard. We also introduced terms like ‘loc’, ‘indoorgml-lite’, and ‘bloc’ to describe indoor spaces in the RDF format. Once we put our data into a GraphDB database, we could easily search for specific details and routes inside buildings. This work fills a significant gap in knowledge graphs concerning indoor spaces. However, the production of large-scale data across varied areas remains a challenge, pointing towards future research directions for more comprehensive indoor spatial information systems. Full article
(This article belongs to the Topic Geospatial Knowledge Graph)
Show Figures

Figure 1

25 pages, 5031 KiB  
Article
A Spatial Optimization Model for Delineating Metropolitan Areas
by Gusiyuan Wang and Wangshu Mu
ISPRS Int. J. Geo-Inf. 2024, 13(2), 51; https://doi.org/10.3390/ijgi13020051 - 6 Feb 2024
Viewed by 1229
Abstract
A metropolitan area comprises a collection of cities and counties bound by strong socioeconomic ties. Despite the pivotal role that metropolitan areas play in regional economics, their delineation remains a challenging task for researchers and urban planners. Current threshold-based delineation methods select counties [...] Read more.
A metropolitan area comprises a collection of cities and counties bound by strong socioeconomic ties. Despite the pivotal role that metropolitan areas play in regional economics, their delineation remains a challenging task for researchers and urban planners. Current threshold-based delineation methods select counties based on their connection strength with prespecified core counties. Such an approach often neglects potential interactions among outlying counties and fails to identify polycentric urban structures. The delineation of a metropolitan area is fundamentally a spatial optimization problem, whose objective is to identify a set of counties with high interconnectivity while also meeting specific constraints, such as area, contiguity, and shape. In this study, we present a novel spatial optimization model designed for metropolitan area delineation. This model aims to maximize intercounty connection strength in terms of both industry and daily life. This approach ensures a more accurate representation of the multicore structure that is commonly seen in developed metropolitan areas. Additionally, our model avoids the possibility of holes in metropolitan area delineation, leading to more coherent and logical metropolitan boundaries. We provide a mixed-integer programming formulation for the proposed model. Its efficacy is demonstrated by delineating the boundaries of the Nanjing and Lhasa metropolitan areas. This study also delves into discussions and policy implications pertinent to both of these metropolitan areas. Full article
Show Figures

Figure 1

19 pages, 8396 KiB  
Article
Study on Spatio-Temporal Patterns of Commuting under Adverse Weather Events: Case Study of Typhoon In-Fa
by Tao Ji, Xian Huang, Jinliang Shao, Yunqiang Zhu, Shejun Deng, Shijun Yu and Huajun Liao
ISPRS Int. J. Geo-Inf. 2024, 13(2), 50; https://doi.org/10.3390/ijgi13020050 - 5 Feb 2024
Viewed by 1345
Abstract
This study focuses on the main urban area of Yangzhou City and conducts a quantitative comparative analysis of traffic accessibility during normal weather and extreme precipitation conditions (typhoon) based on GPS trajectories of buses. From both temporal and spatial dimensions, it comprehensively examines [...] Read more.
This study focuses on the main urban area of Yangzhou City and conducts a quantitative comparative analysis of traffic accessibility during normal weather and extreme precipitation conditions (typhoon) based on GPS trajectories of buses. From both temporal and spatial dimensions, it comprehensively examines the impact of extreme precipitation on bus travel speed, travel time, and the commuting range of residents in the main urban area of Yangzhou City. (1) Through the mining and analysis of multi-source heterogeneous big data (bus GPS trajectory data, bus network data, rainfall remote sensing data, and road network data), it is found that the rainstorm weather greatly affects the average speed and travel time of buses. In addition, when the intensity of heavy rainfall increases (decreases), the average bus speed and travel time exhibit varying degrees of spatio-temporal change. During the morning and evening rush hour commuting period of rainstorm weather, there are obvious differences in the accessibility change in each typical traffic community in the main urban area of Yangzhou city. In total, 90% of the overall accessibility change value is concentrated around −5 min~5 min, and the change range is concentrated around −25~10%. (2) To extract the four primary traffic districts (Lotus Pond, Slender West Lake, Jinghua City, and Wanda Plaza), we collected Points of Interest (POI) data from Amap and Baidu heat map, and a combination analysis of the employment–residence ratio model and proximity methods was employed. The result show that the rainstorm weather superimposed on the morning peak hour has different degrees of impact on the average speed of the above-mentioned traffic zones, with the most obvious impact on the Lotus Pond and the smallest impact on Wanda Plaza. Under the rainstorm weather, the traffic commute in the main urban area of Yangzhou in the morning and evening peak hour is basically normal. The results of this paper can help to quantify the impact of typhoon-rainstorm weather events on traffic commuting in order to provide a scientific basis for the traffic management department to effectively prevent traffic jams, ensure the reliability of the road network, and allow the traffic management department to more effectively manage urban traffic. Full article
Show Figures

Figure 1

18 pages, 1585 KiB  
Article
A Time-Identified R-Tree: A Workload-Controllable Dynamic Spatio-Temporal Index Scheme for Streaming Processing
by Weichen Peng, Luo Chen, Xue Ouyang and Wei Xiong
ISPRS Int. J. Geo-Inf. 2024, 13(2), 49; https://doi.org/10.3390/ijgi13020049 - 4 Feb 2024
Viewed by 1313
Abstract
Many kinds of spatio-temporal data in our daily lives, such as the trajectory data of moving objects, stream natively. Streaming systems exhibit significant advantages in processing streaming data due to their distributed architecture, high throughput, and real-time performance. The use of streaming processing [...] Read more.
Many kinds of spatio-temporal data in our daily lives, such as the trajectory data of moving objects, stream natively. Streaming systems exhibit significant advantages in processing streaming data due to their distributed architecture, high throughput, and real-time performance. The use of streaming processing techniques for spatio-temporal data applications is a promising research direction. However, due to the strong dynamic nature of data in streaming processing systems, traditional spatio-temporal indexing techniques based on relatively static data cannot be used directly in stream-processing environments. It is necessary to study and design new spatio-temporal indexing strategies. Hence, we propose a workload-controllable dynamic spatio-temporal index based on the R-tree. In order to restrict memory usage, we formulate an INSERT and batch-REMOVE (I&BR) method and append a collection mechanism to the traditional R-tree. To improve the updating performance, we propose a time-identified R-tree (TIR). Moreover, we propose a distributed system prototype called a time-identified R-tree farm (TIRF). Experiments show that the TIR could work in a scenario with a controllable usage of memory and a stable response time. The throughput of the TIRF could reach 1 million points per second. The performance of a range search in the TIRF is many times better than in PostgreSQL, which is a widely used database system for spatio-temporal applications. Full article
Show Figures

Figure 1

24 pages, 21585 KiB  
Article
Multidimensional Spatial Vitality Automated Monitoring Method for Public Open Spaces Based on Computer Vision Technology: Case Study of Nanjing’s Daxing Palace Square
by Xinyu Hu, Ximing Shen, Yi Shi, Chen Li and Wei Zhu
ISPRS Int. J. Geo-Inf. 2024, 13(2), 48; https://doi.org/10.3390/ijgi13020048 - 3 Feb 2024
Cited by 2 | Viewed by 1349
Abstract
Assessing the vitality of public open spaces is critical in urban planning and provides insights for optimizing residents’ lives. However, prior research has fragmented study scopes and lacks fine-grained behavioral data segmentation capabilities and diverse vitality dimension assessments. We utilized computer vision technology [...] Read more.
Assessing the vitality of public open spaces is critical in urban planning and provides insights for optimizing residents’ lives. However, prior research has fragmented study scopes and lacks fine-grained behavioral data segmentation capabilities and diverse vitality dimension assessments. We utilized computer vision technology to collect fine-grained behavioral data and proposed an automated spatial vitality monitoring framework based on discrete trajectory feature points. The framework supported the transformation of trajectory data into four multidimensional vitality indicators: crowd heat, resident behavior ratio, movement speed, and spatial participation. Subsequently, we designed manual validation mechanisms to demonstrate the monitoring framework’s efficacy and utilized the results to explore the changes in vitality, and the influencing factors, in a small public space. Discrete trajectory feature points effectively addressed the literature’s fragmented study scope and limited sample size issues. Spatial boundaries had a significantly positive impact on spatial vitality, confirming the “boundary effect” theory. The peak spatial vitality periods were from 08:30 to 09:30 and from 17:30 to 18:30. A higher enclosure degree and better rest facilities positively impacted spatial vitality, while a lower enclosure degree did not consistently suppress spatial vitality in all situations. Overall, spatial features and spatial vitality have a complex nonlinear relationship. Full article
Show Figures

Figure 1

21 pages, 4351 KiB  
Article
Cultural Itineraries Generated by Smart Data on the Web
by Cosmo Capodiferro, Massimo De Maria, Mauro Mazzei, Matteo Spreafico, Oleg V. Bik, Armando L. Palma and Anna V. Solovyeva
ISPRS Int. J. Geo-Inf. 2024, 13(2), 47; https://doi.org/10.3390/ijgi13020047 - 3 Feb 2024
Viewed by 1305
Abstract
The development of storage standards for databases of different natures and origins makes it possible to aggregate and interact with different data sources in order to obtain and show complex and thematic information to the end user. This article aims to analyze some [...] Read more.
The development of storage standards for databases of different natures and origins makes it possible to aggregate and interact with different data sources in order to obtain and show complex and thematic information to the end user. This article aims to analyze some possibilities opened up by new applications and hypothesize their possible developments. With this work, using the currently available Web technologies, we would like to verify the potential for the use of Linked Open Data in the world of WebGIS and illustrate an application that allows the user to interact with Linked Open Data through their representation on a map. Italy has an artistic and cultural heritage unique in the world and the Italian Ministry of Cultural Heritage and Activities and Tourism has created and made freely available a dataset in Linked Open Data format that represents it. With the aim of enhancing and making this heritage more usable, the National Research Council (CNR) has created an application that presents this heritage via WebGIS on a map. Following criteria definable by the user, such as the duration, the subject of interest and the style of the trip, tourist itineraries are created through the places that host this heritage. New possibilities open up where the tools made available by the Web can be used together, according to pre-established sequences, to create completely new applications. This can be compared to the use of words, all known in themselves, which, according to pre-established sequences, allow us to create ever new texts. Full article
(This article belongs to the Topic Geospatial Knowledge Graph)
Show Figures

Figure 1

19 pages, 6100 KiB  
Article
EventGeoScout: Fostering Citizen Empowerment and Augmenting Data Quality through Collaborative Geographic Information Governance and Optimization
by Jose A. Montenegro and Antonio Muñoz
ISPRS Int. J. Geo-Inf. 2024, 13(2), 46; https://doi.org/10.3390/ijgi13020046 - 2 Feb 2024
Viewed by 1169
Abstract
In this manuscript, we present EventGeoScout, an innovative framework for collaborative geographic information management, tailored to meet the needs of the dynamically changing landscape of geographic data integration and quality enhancement. EventGeoScout enables the seamless fusion of open data from different sources and [...] Read more.
In this manuscript, we present EventGeoScout, an innovative framework for collaborative geographic information management, tailored to meet the needs of the dynamically changing landscape of geographic data integration and quality enhancement. EventGeoScout enables the seamless fusion of open data from different sources and provides users with the tools to refine and improve data quality. A distinctive feature of our framework is its commitment to platform-agnostic data management, ensuring that processed datasets are accessible via standard Geographic Information System (GIS) tools, reducing the maintenance burden on organizations while ensuring the continued relevance of the data. Our approach goes beyond the boundaries of traditional data integration, enabling users to fully harness the power of geospatial information by simplifying the data creation process and providing a versatile solution to the complex challenges posed by layered geospatial data. To demonstrate the versatility and robustness of EventGeoScout as an optimization tool, we present a case study centered on the Uncapacitated Facility Location Problem (UFLP), where a genetic algorithm was used to achieve outstanding performance on both traditional computing platforms and smartphone devices. As a concrete case study, we applied our solution in the context of the Málaga City Marathon, using the latest data from the last edition of the marathon. Full article
Show Figures

Figure 1

13 pages, 5814 KiB  
Article
A Novel Visual Narrative Framework for Tourist Map Design Based on Local Chronicles: A Case Study of the Songshan Scenic Area
by Wenjie Zhen, Shifang Huang, Zhihui Tian and Xiaoyue Yang
ISPRS Int. J. Geo-Inf. 2024, 13(2), 45; https://doi.org/10.3390/ijgi13020045 - 2 Feb 2024
Viewed by 1210
Abstract
Tourist maps provide tourists with destination information that reflects their unique characteristics and cultural connotations and play an important role in attracting tourists and serving marketing purposes. However, existing designs of tourist maps often ignore the importance of cultural resource selection and the [...] Read more.
Tourist maps provide tourists with destination information that reflects their unique characteristics and cultural connotations and play an important role in attracting tourists and serving marketing purposes. However, existing designs of tourist maps often ignore the importance of cultural resource selection and the relationship between maps and structural linguistics, thereby affecting the narrative function and representativeness of tourist maps. This study utilizes the local chronicle as a data source and proposes a novel visual narrative framework (VNF) for tourist maps. The VNF combines Todorov’s narrative hierarchy and Roth’s visual storytelling tropes to establish a mapping between map elements and narrative elements. To demonstrate the effectiveness of the VNF, the Songshan Scenic Area was selected as a case study. By applying the VNF, highly characteristic and meaningful colors, figurative hand-painted symbols, and scene symbols are selected and integrated into the map design to enhance the artistic value and narrative of the map. This framework reveals the potential cultural value of local chronicles and can serve as a reference for other historical tourist cities, contributing to the preservation of local cultural heritage. Full article
Show Figures

Figure 1

24 pages, 6010 KiB  
Article
How Information and Communications Technology Affects the Micro-Location Choices of Stores on On-Demand Food Delivery Platforms: Evidence from Xinjiekou’s Central Business District in Nanjing
by Xinyu Hu, Gutao Zhang, Yi Shi and Peng Yu
ISPRS Int. J. Geo-Inf. 2024, 13(2), 44; https://doi.org/10.3390/ijgi13020044 - 2 Feb 2024
Cited by 1 | Viewed by 1537
Abstract
The digitization of consumption, led by information and communications technology (ICT), has reshaped the urban commercial spatial structure (UCSS) of restaurants and retailers. However, the impacts of ICT on UCSS and location selection remain unclear. In this study, based on on-demand food delivery [...] Read more.
The digitization of consumption, led by information and communications technology (ICT), has reshaped the urban commercial spatial structure (UCSS) of restaurants and retailers. However, the impacts of ICT on UCSS and location selection remain unclear. In this study, based on on-demand food delivery data and real-time traffic data, we used two types of machine learning algorithms, random forest regression (RFR) and the density-based spatial clustering of applications with noise (DBSCAN), to study the spatial distribution patterns, driving factors, and new geographical location phenomena of ‘brick-and-click’ (B&C) stores in Xinjiekou’s central business district (CBD) in Nanjing, China. The results show that the UCSS in the CBD is being decentralized, but the degree of influence is related to the business type. Additionally, the scale of demand and the distance from core commercial nodes greatly affect the scales of B&C stores. Moreover, the agglomeration of high-sales B&C stores seems to indicate a micro-location advantage, characterized by the concentration of delivery riders, which is usually located in the commercial hinterland with dense traffic. This makes stores situated in traditionally advantageous locations more attractive for online sales. Thus, ICT enhances the Matthew effect in business competition. These findings deepen our understanding of urban digital planning management and business systems. Full article
Show Figures

Figure 1

17 pages, 4581 KiB  
Article
Measuring the Potential and Realized (or Revealed) Spatial Access from Places of Residence and Work to Food Outlets in Rural Communities of Québec, Canada
by Eric Robitaille, Gabrielle Durette, Marianne Dubé, Olivier Arbour and Marie-Claude Paquette
ISPRS Int. J. Geo-Inf. 2024, 13(2), 43; https://doi.org/10.3390/ijgi13020043 - 1 Feb 2024
Viewed by 1379
Abstract
This study aims to bridge the gap between the potential and realized spatial access to food outlets in rural areas of Québec, Canada. By assessing both aspects, this research aims to provide a comprehensive understanding of the challenges faced by rural communities in [...] Read more.
This study aims to bridge the gap between the potential and realized spatial access to food outlets in rural areas of Québec, Canada. By assessing both aspects, this research aims to provide a comprehensive understanding of the challenges faced by rural communities in accessing food resources and the effectiveness of existing interventions in addressing these challenges. A mixed methods approach was adopted to collect and analyze data, combining GIS-based spatial analysis with community-based surveys. The spatial analysis allowed for the quantification of the potential access metrics, while the community surveys provided valuable information on travel behaviors, preferences, and barriers experienced by residents when accessing food outlets. The results of the distance measurement calculations showed that for both the potential and realized distance measurements, convenience stores are more easily accessible than grocery stores and supermarkets. Thus, workers seem to have a strategy for minimizing the impact of long distances by combining work and grocery shopping. These results are measured for the realized accessibility to grocery stores and supermarkets and the principal retailer used. Finally, the results of the analyses show that there is a socio-economic gradient in the potential geographical accessibility from home to the food outlets. The importance of developing and strengthening the local food environment to make it favourable to healthy eating and supportive of food security is discussed. Full article
(This article belongs to the Topic Spatial Epidemiology and GeoInformatics)
Show Figures

Figure 1

17 pages, 3383 KiB  
Article
Measuring Efficiency and Accuracy in Locating Symbols on Mobile Maps Using Eye Tracking
by Wojciech Rymarkiewicz, Paweł Cybulski and Tymoteusz Horbiński
ISPRS Int. J. Geo-Inf. 2024, 13(2), 42; https://doi.org/10.3390/ijgi13020042 - 30 Jan 2024
Viewed by 1425
Abstract
This study investigated the impact of smartphone usage frequency on the effectiveness and accuracy of symbol location in a variety of spatial contexts on mobile maps using eye-tracking technology while utilizing the example of Mapy.cz. The scanning speed and symbol detection were also [...] Read more.
This study investigated the impact of smartphone usage frequency on the effectiveness and accuracy of symbol location in a variety of spatial contexts on mobile maps using eye-tracking technology while utilizing the example of Mapy.cz. The scanning speed and symbol detection were also considered. The use of mobile applications for navigation is discussed, emphasizing their popularity and convenience of use. The importance of eye tracking as a valuable tool for testing the usability of cartographic products, enabling the assessment of users’ visual strategies and their ability to memorize information, was highlighted. The frequency of smartphone use has been shown to be an important factor in users’ ability to locate symbols in different spatial contexts. Everyday smartphone users have shown higher accuracy and efficiency in image processing, suggesting a potential link between habitual smartphone use and increased efficiency in mapping tasks. Participants who were dissatisfied with the legibility of a map looked longer at the symbols, suggesting that they put extra cognitive effort into decoding the symbols. In the present study, gender differences in pupil size were also observed during the study. Women consistently showed a larger pupil diameter, potentially indicating greater cognitive load on the participants. Full article
Show Figures

Figure 1

18 pages, 19401 KiB  
Article
A Semantic Partition Algorithm Based on Improved K-Means Clustering for Large-Scale Indoor Areas
by Kegong Shi, Jinjin Yan and Jinquan Yang
ISPRS Int. J. Geo-Inf. 2024, 13(2), 41; https://doi.org/10.3390/ijgi13020041 - 27 Jan 2024
Viewed by 1332
Abstract
Reasonable semantic partition of indoor areas can improve space utilization, optimize property management, and enhance safety and convenience. Existing algorithms for such partitions have drawbacks, such as the inability to consider semantics, slow convergence, and sensitivity to outliers. These limitations make it difficult [...] Read more.
Reasonable semantic partition of indoor areas can improve space utilization, optimize property management, and enhance safety and convenience. Existing algorithms for such partitions have drawbacks, such as the inability to consider semantics, slow convergence, and sensitivity to outliers. These limitations make it difficult to have partition schemes that can match the real-world observations. To obtain proper partitions, this paper proposes an improved K-means clustering algorithm (IK-means), which differs from traditional K-means in three respects, including the distance measurement method, iterations, and stop conditions of iteration. The first aspect considers the semantics of the spaces, thereby enhancing the rationality of the space partition. The last two increase the convergence speed. The proposed algorithm is validated in a large-scale indoor scene, and the results show that it has outperformance in both accuracy and efficiency. The proposed IK-means algorithm offers a promising solution to overcome existing limitations and advance the effectiveness of indoor space partitioning algorithms. This research has significant implications for the semantic area partition of large-scale and complex indoor areas, such as shopping malls and hospitals. Full article
Show Figures

Figure 1

18 pages, 2787 KiB  
Article
Enhancing the K-Means Algorithm through a Genetic Algorithm Based on Survey and Social Media Tourism Objectives for Tourism Path Recommendations
by Mohamed A. Damos, Jun Zhu, Weilian Li, Elhadi Khalifa, Abubakr Hassan, Rashad Elhabob, Alaa Hm and Esra Ei
ISPRS Int. J. Geo-Inf. 2024, 13(2), 40; https://doi.org/10.3390/ijgi13020040 - 27 Jan 2024
Viewed by 1389
Abstract
Social media platforms play a vital role in determining valuable tourist objectives, which greatly aids in optimizing tourist path planning. As data classification and analysis methods have advanced, machine learning (ML) algorithms such as the k-means algorithm have emerged as powerful tools for [...] Read more.
Social media platforms play a vital role in determining valuable tourist objectives, which greatly aids in optimizing tourist path planning. As data classification and analysis methods have advanced, machine learning (ML) algorithms such as the k-means algorithm have emerged as powerful tools for sorting through data collected from social media platforms. However, traditional k-means algorithms have drawbacks, including challenges in determining initial seed values. This paper presents a novel approach to enhance the k-means algorithm based on survey and social media tourism data for tourism path recommendations. The main contribution of this paper is enhancing the traditional k-means algorithm by employing the genetic algorithm (GA) to determine the number of clusters (k), select the initial seeds, and recommend the best tourism path based on social media tourism data. The GA enhances the k-means algorithm by using a binary string to represent initial centers and to apply GA operators. To assess its effectiveness, we applied this approach to recommend the optimal tourism path in the Red Sea State, Sudan. The results clearly indicate the superiority of our approach, with an algorithm optimization time of 0.01 s. In contrast, traditional k-means and hierarchical cluster algorithms required 0.27 and 0.7 s, respectively. Full article
(This article belongs to the Topic Geocomputation and Artificial Intelligence for Mapping)
Show Figures

Figure 1

10 pages, 3608 KiB  
Article
Conceptualizing and Validating the Trustworthiness of Maps through an Empirical Study on the Influence of Cultural Background on Map Design Perception
by Georg Gartner, Olesia Ignateva, Bibigul Zhunis and Johanna Pühringer
ISPRS Int. J. Geo-Inf. 2024, 13(2), 39; https://doi.org/10.3390/ijgi13020039 - 26 Jan 2024
Viewed by 1473
Abstract
Maps are the culmination of numerous choices, with many offering multiple alternatives. Not all of these choices are inherently guided by default, clarity, or universally accepted best practices, guidelines, or recommendations. In the realm of cartography, it is a distinct feature that individual [...] Read more.
Maps are the culmination of numerous choices, with many offering multiple alternatives. Not all of these choices are inherently guided by default, clarity, or universally accepted best practices, guidelines, or recommendations. In the realm of cartography, it is a distinct feature that individual decisions can be made, particularly regarding data preparation and selection and design aspects. As each map is a product of a multitude of decisions, the confidence we place in maps hinges on the reasonableness of these decisions. The trustworthiness of maps depends on whether these decisions are sound, unquestioned, readily accessible, and supported by dependable groups of decision makers whose reliability can be assessed based on their track record as an institution, reputation, and competence. The advent of user-friendly map-making software and data manipulation tools has placed some of these decisions in the hands of the general populace and those interested in using maps to convey specific agendas. This mirrors other forms of communication and has given rise to a growing discourse on “fake news”, “fake media”, and “fake maps”, ultimately prompting us to question how we can trust the information being conveyed and how we can differentiate between “fake” and “trustworthy” maps. This paper highlights the fundamental aspects determined by the pure nature of cartographic modeling, which influences every attempt to understand, analyze, and express the context and trustworthiness of maps. It then identifies fundamental aspects of trustworthiness with respect to maps. Combining these two fundamental considerations represents an epistemological attempt to identify a research portfolio. An example of an empirical study on identifying selected aspects of this portfolio demonstrates the potential of gaining a better understanding of the context given. Full article
(This article belongs to the Special Issue Trustful and Ethical Use of Geospatial Data)
Show Figures

Figure 1

16 pages, 7392 KiB  
Article
Assessing the Suitability of Fractal Dimension for Measuring Graphic Complexity Change in Schematic Metro Networks
by Tian Lan, Zhiwei Wu, Chenzhen Sun, Donglin Cheng, Xing Shi, Guangjun Zeng, Hong Zhang and Qian Peng
ISPRS Int. J. Geo-Inf. 2024, 13(2), 38; https://doi.org/10.3390/ijgi13020038 - 25 Jan 2024
Viewed by 1298
Abstract
Schematization is a process of generating schematic network maps (e.g., metro network maps), where the graphic complexity of networks is usually reduced. In the past two decades, various automated schematization methods have been developed. A quantitative and accurate description of the complexity variation [...] Read more.
Schematization is a process of generating schematic network maps (e.g., metro network maps), where the graphic complexity of networks is usually reduced. In the past two decades, various automated schematization methods have been developed. A quantitative and accurate description of the complexity variation in the schematization is critical to evaluate the usability of schematization methods. It is noticed that fractal dimension (F) has been widely used to analyze the complexity of geographic objects, and this indicator may be appropriate for this purpose. In some existing studies, although F has been employed to describe the complexity variation, the theoretical and experimental basis for adopting this approach is inadequate. In this study, experiments based on 26 Chinese cities’ metro networks showed that the F of all these metro networks have decreased in schematization, and a significant positive correlation exists between the F of original networks and the reduction of F after schematization. The above results were verified to have similar trends with the subjective opinions of participants in a psychological questionnaire. Therefore, it can be concluded that F can quantitatively measure the complexity change of networks in schematization. These discoveries provide the basis for using F to evaluate the usability of schematization methods. Full article
Show Figures

Figure 1

21 pages, 23832 KiB  
Article
Analysis of Spatiotemporal Characteristics and Influencing Factors of Electric Vehicle Charging Based on Multisource Data
by Chenxi Liu, Zhenghong Peng, Lingbo Liu and Hao Wu
ISPRS Int. J. Geo-Inf. 2024, 13(2), 37; https://doi.org/10.3390/ijgi13020037 - 24 Jan 2024
Cited by 1 | Viewed by 1383
Abstract
Amid the global shift towards sustainable development, this study addresses the burgeoning electric vehicle (EV) market and its infrastructure challenges, particularly the lag in public charging facility development. Focusing on Wuhan, it utilizes big data to analyze EV charging behavior’s spatiotemporal aspects and [...] Read more.
Amid the global shift towards sustainable development, this study addresses the burgeoning electric vehicle (EV) market and its infrastructure challenges, particularly the lag in public charging facility development. Focusing on Wuhan, it utilizes big data to analyze EV charging behavior’s spatiotemporal aspects and the urban environment’s influence on charging efficiency. Employing a random forest regression and multiscale geographically weighted regression (MGWR), the research elucidates the nonlinear interaction between urban infrastructure and charging station usage. Key findings include (1) a direct correlation between EV charging patterns and urban temporal factors, with notable price elasticity; (2) the predominant influence of commuting distance, supplemented by the availability of fast-charging options; and (3) a strategic proposal for increasing slow-charging facilities at key urban locations to balance operational costs and user demand. The study combines spatial analysis and charging behavior to recommend enhancements in public EV charging infrastructure layouts. Full article
Show Figures

Figure 1

41 pages, 7235 KiB  
Article
Temporal Paths in Real-World Sensor Networks
by Erik Bollen, Bart Kuijpers, Valeria Soliani and Alejandro Vaisman
ISPRS Int. J. Geo-Inf. 2024, 13(2), 36; https://doi.org/10.3390/ijgi13020036 - 24 Jan 2024
Viewed by 1332
Abstract
Sensor networks are used in an increasing number and variety of application areas, like traffic control or river monitoring. Sensors in these networks measure parameters of interest defined by domain experts and send these measurements to a central location for storage, viewing and [...] Read more.
Sensor networks are used in an increasing number and variety of application areas, like traffic control or river monitoring. Sensors in these networks measure parameters of interest defined by domain experts and send these measurements to a central location for storage, viewing and analysis. Temporal graph data models, whose nodes contain time-series data reported by the sensors, have been proposed to model and analyze these networks in order to take informed and timely decisions on their operation. Temporal paths are first-class citizens in this model and some classes of them have been identified in the literature. Queries aimed at finding these paths are denoted as (temporal) path queries. In spite of these efforts, many interesting problems remain open and, in this work, we aim at answering some of them. More concretely, we characterize the classes of temporal paths that can be defined in a sensor network in terms of the well-known Allen’s temporal algebra. We also show that, out of the 8192 possible interval relations in this algebra, only 11 satisfy two desirable properties that we define: transitivity and robustness. We show how these properties and the paths that satisfy them are relevant in practice by means of a real-world use case consisting of an analysis of salinity that appears close to the Scheldt river in Flanders, Belgium, during high tides occurring in the North Sea. Full article
Show Figures

Figure 1

23 pages, 13368 KiB  
Article
Learning Daily Human Mobility with a Transformer-Based Model
by Weiying Wang and Toshihiro Osaragi
ISPRS Int. J. Geo-Inf. 2024, 13(2), 35; https://doi.org/10.3390/ijgi13020035 - 24 Jan 2024
Viewed by 1470
Abstract
The generation and prediction of daily human mobility patterns have raised significant interest in many scientific disciplines. Using various data sources, previous studies have examined several deep learning frameworks, such as the RNN and GAN, to synthesize human movements. Transformer models have been [...] Read more.
The generation and prediction of daily human mobility patterns have raised significant interest in many scientific disciplines. Using various data sources, previous studies have examined several deep learning frameworks, such as the RNN and GAN, to synthesize human movements. Transformer models have been used frequently for image analysis and language processing, while the applications of these models on human mobility are limited. In this study, we construct a transformer model, including a self-attention-based embedding component and a Generative Pre-trained Transformer component, to learn daily movements. The embedding component takes regional attributes as input and learns regional relationships to output vector representations for locations, enabling the second component to generate different mobility patterns for various scenarios. The proposed model shows satisfactory performance for generating and predicting human mobilities, superior to a Long Short-Term Memory model in terms of several aggregated statistics and sequential characteristics. Further examination indicates that the proposed model learned the spatial structure and the temporal relationship of human mobility, which generally agrees with our empirical analysis. This observation suggests that the transformer framework can be a promising model for learning and understanding human movements. Full article
(This article belongs to the Special Issue Advances in AI-Driven Geospatial Analysis and Data Generation)
Show Figures

Figure 1

21 pages, 4101 KiB  
Article
Dynamic Graph Convolutional Network-Based Prediction of the Urban Grid-Level Taxi Demand–Supply Imbalance Using GPS Trajectories
by Haiqiang Yang and Zihan Li
ISPRS Int. J. Geo-Inf. 2024, 13(2), 34; https://doi.org/10.3390/ijgi13020034 - 24 Jan 2024
Cited by 1 | Viewed by 1360
Abstract
The objective imbalance between the taxi supply and demand exists in various areas of the city. Accurately predicting this imbalance helps taxi companies with dispatching, thereby increasing their profits and meeting the travel needs of residents. The application of Graph Convolutional Networks (GCNs) [...] Read more.
The objective imbalance between the taxi supply and demand exists in various areas of the city. Accurately predicting this imbalance helps taxi companies with dispatching, thereby increasing their profits and meeting the travel needs of residents. The application of Graph Convolutional Networks (GCNs) in traffic forecasting has inspired the development of a spatial–temporal model for grid-level prediction of the taxi demand–supply imbalance. However, spatial–temporal GCN prediction models conventionally capture only static inter-grid correlation features. This research aims to address the dynamic influences caused by taxi mobility and the variations of other transportation modes on the demand–supply dynamics between grids. To achieve this, we employ taxi trajectory data and develop a model that incorporates dynamic GCN and Gated Recurrent Units (GRUs) to predict grid-level imbalances. This model captures the dynamic inter-grid influences between neighboring grids in the spatial dimension. It also identifies trends and periodic changes in the temporal dimension. The validation of this model, using taxi trajectory data from Shenzhen city, indicates superior performance compared to classical time-series models and spatial–temporal GCN models. An ablation study is conducted to analyze the impact of various factors on the predictive accuracy. This study demonstrates the precision and applicability of the proposed model. Full article
Show Figures

Figure 1

28 pages, 8899 KiB  
Article
Evaluating Geospatial Data Adequacy for Integrated Risk Assessments: A Malaria Risk Use Case
by Linda Petutschnig, Thomas Clemen, E. Sophia Klaußner, Ulfia Clemen and Stefan Lang
ISPRS Int. J. Geo-Inf. 2024, 13(2), 33; https://doi.org/10.3390/ijgi13020033 - 23 Jan 2024
Viewed by 1454
Abstract
International policy and humanitarian guidance emphasize the need for precise, subnational malaria risk assessments with cross-regional comparability. Spatially explicit indicator-based assessments can support humanitarian aid organizations in identifying and localizing vulnerable populations for scaling resources and prioritizing aid delivery. However, the reliability of [...] Read more.
International policy and humanitarian guidance emphasize the need for precise, subnational malaria risk assessments with cross-regional comparability. Spatially explicit indicator-based assessments can support humanitarian aid organizations in identifying and localizing vulnerable populations for scaling resources and prioritizing aid delivery. However, the reliability of these assessments is often uncertain due to data quality issues. This article introduces a data evaluation framework to assist risk modelers in evaluating data adequacy. We operationalize the concept of “data adequacy” by considering “quality by design” (suitability) and “quality of conformance” (reliability). Based on a use case we developed in collaboration with Médecins Sans Frontières, we assessed data sources popular in spatial malaria risk assessments and related domains, including data from the Malaria Atlas Project, a healthcare facility database, WorldPop population counts, Climate Hazards group Infrared Precipitation with Stations (CHIRPS) precipitation estimates, European Centre for Medium-Range Weather Forecasts (ECMWF) precipitation forecast, and Armed Conflict Location and Event Data Project (ACLED) conflict events data. Our findings indicate that data availability is generally not a bottleneck, and data producers effectively communicate contextual information pertaining to sources, methodology, limitations and uncertainties. However, determining such data’s adequacy definitively for supporting humanitarian intervention planning remains challenging due to potential inaccuracies, incompleteness or outdatedness that are difficult to quantify. Nevertheless, the data hold value for awareness raising, advocacy and recognizing trends and patterns valuable for humanitarian contexts. We contribute a domain-agnostic, systematic approach to geodata adequacy evaluation, with the aim of enhancing geospatial risk assessments, facilitating evidence-based decisions. Full article
Show Figures

Figure 1

Previous Issue
Next Issue
Back to TopTop