Abstract
Maps are the culmination of numerous choices, with many offering multiple alternatives. Not all of these choices are inherently guided by default, clarity, or universally accepted best practices, guidelines, or recommendations. In the realm of cartography, it is a distinct feature that individual decisions can be made, particularly regarding data preparation and selection and design aspects. As each map is a product of a multitude of decisions, the confidence we place in maps hinges on the reasonableness of these decisions. The trustworthiness of maps depends on whether these decisions are sound, unquestioned, readily accessible, and supported by dependable groups of decision makers whose reliability can be assessed based on their track record as an institution, reputation, and competence. The advent of user-friendly map-making software and data manipulation tools has placed some of these decisions in the hands of the general populace and those interested in using maps to convey specific agendas. This mirrors other forms of communication and has given rise to a growing discourse on “fake news”, “fake media”, and “fake maps”, ultimately prompting us to question how we can trust the information being conveyed and how we can differentiate between “fake” and “trustworthy” maps. This paper highlights the fundamental aspects determined by the pure nature of cartographic modeling, which influences every attempt to understand, analyze, and express the context and trustworthiness of maps. It then identifies fundamental aspects of trustworthiness with respect to maps. Combining these two fundamental considerations represents an epistemological attempt to identify a research portfolio. An example of an empirical study on identifying selected aspects of this portfolio demonstrates the potential of gaining a better understanding of the context given.
1. Introduction
Map trustworthiness is a critical concern in the age of digital cartography, where the proliferation of maps raises the risk of misinformation and the spread of deceptive or “fake” maps [1]. To address this challenge, we must consider trustworthiness from several perspectives, including computational, cartographic, and interaction dimensions [2].
With respect to the computational and cartographic dimensions, the “pure nature of cartographic modelling” determines the trustworthiness of maps instrumentally, as cartography is the science and art of map-making, which bridges our world’s intricate, three-dimensional reality and the simplified, two-dimensional representations we use for navigation, communication, and decision making [3]. Maps are powerful tools capable of efficiently conveying vast amounts of spatial information. Creating these maps involves cartographic modeling, a multifaceted process that demands careful consideration of various factors [2,4]. Furthermore, the trustworthiness of maps is paramount, as they often influence critical decisions and public perception. Thus, any aspect of trustworthiness in maps has to be seen in the context of cartographic modeling decisions. The main dimensions of the influence of those decision dimensions on the trustworthiness of maps include user-oriented design, data sources and standardization, generalization, and the use of visual variables [5,6,7]:
- User-Oriented Design: The heart of cartographic modeling lies in its user-centric approach. Each map is created with a specific purpose and audience in mind. Whether it is an overview map of a country, a detailed city map, or a thematic map displaying election results, the cartographer must make design choices that cater to the needs of the intended users [8]. Consequently, depending on the user’s requirements, the same geographical data can yield vastly different maps.
- Data Sources and Standardization: The trustworthiness of a map starts with the quality and reliability of its data sources. Government agencies are often primary contributors of spatial data. Additionally, crowdsourced platforms, like OpenStreetMap, have gained prominence, as have commercial data providers such as Google, Here, and ESRI. However, information about data collection methods as well as methods of verification and standardization is needed to allow for understanding consistency and adherence to a standardized schema [9].
- Generalization: Generalization is an essential process in cartographic modeling. It involves the selective simplification of complex geographic features based on the map’s scale and purpose. Cartographers must make informed decisions about which details to include and which to omit to maintain map clarity. The generalization techniques encompass conceptual aspects, such as attributive selection, and graphic elements, which revolve around geometric selection. Examples include simplification, enlargement, displacement, merging, and selection [10].
- Visual Variables: Visual variables are integral to the art of cartography. Jacques Bertin [11] introduced these variables in the form of characteristics like color, size, texture, orientation, and shape. They emphasize specific elements on a map, making them readily recognizable. Visual variables play a pivotal role in thematic maps, where they facilitate the visual representation of statistical information in an accessible manner. For instance, color might be used to convey electoral results, with red and blue representing different political parties, simplifying comprehension for the map’s users.
Thus, we reason that based on the pure nature of the constraints of cartographic modeling, the trustworthiness of maps is dependent on the methods applied and determined by the decisions taken. Understanding this context allows us to develop strategies to enhance the trustworthiness of maps on a conceptual level by conceptualizing a research agenda on the context of trustworthiness and maps. To demonstrate the feasibility of this approach, a selected agenda item is validated through an empirical experiment.
2. Conceptualizing a Research Agenda on the Trustworthiness of Maps
In order to allow cartographers to ensure and/or enhance the trustworthiness of maps, despite the pure nature of cartographic modeling constraints, the two concepts of “going deep”, which allows for the transparency of cartographic decisions, and “going wide”, which allows for contextualizing a given map by being able to access alternative maps of the same topic, have been proposed [11]. With respect to “going deep” verification through transparency is aimed at every map object and literally “every pixel” goes through many decisions which it is based upon. These decisions determine the appearance, the position, the design, and the look of every single element of a map, but are often unknown, untransparent, or not explained at all to users [2]. To allow users to look “behind” the pixel would basically allow us to make underpinning decisions transparent, chosen options visible, and eventual alternative paths available. However, as discussed, these decisions can have many options and can include subjective elements. Challenges for cartography exist, therefore, with respect to how to visualize/communicate what is “behind the map” in a manner, such that it can be easily followed and understood. The method of reverse engineering can be applied as a method to describe and define the underpinning decisions of map production, but may need to be accompanied by a comprehensive cartographic ontology [9]. Once cartographic decisions can be noted and are described, they can be communicated to users in order to allow them to judge the decision making process themselves. The “going broad” concept aims for verification through contextualization. Humans tend to try to find additional or alternative information sources if they are suspicious or unsure about a particular communication means. Applying this principle in cartography would mean that we allow or even proactively offer map users further and/or alternative map presentations, visualization, or information sources. By being exposed to several data representations of a given context, the value of the original map can be judged more easily, and the “power of comparison” can be used. But which further maps and other representations are really related, depicting the same or somehow related data and aspects, and can therefore help with this comparison? In this context, standardized meta data descriptions can be used to select related maps and presentations, as offered through linked data techniques [12]. The underpinning agenda is based on the context that the increasing digitization of map production leads to increased risk for the misuse and spreading of fake maps, which may lead to an undesirable negative impact on trust in maps in society [13]. It might be useful to consider, therefore, adding to existing attempts at contributing to an ethical framework for map making, such as the Locus Charter or the Code of Ethics of the BCS [14].
Thus, we refer to the agenda proposed by [4], which includes the following agenda items:
- Contextualization through transparencyThe “going deep” aspect of our proposal aims to improve the transparency and explainability of map production processes to instill public trust in maps and the underlying data. It involves a dive into the intricate decisions that underlie every map object, down to the smallest pixel. These decisions encompass factors such as appearance, position, design, and overall aesthetics, yet they often remain unknown, untransparent, or unexplained to users. This proposal raises several critical challenges:
- o
- Visualization and Communication: How can we effectively visualize and communicate the intricacies “behind the map” in an easily comprehensible manner to users?
- o
- Reverse Engineering: Can reverse engineering, and thus, the detection of the underpinning processes and cartographic modeling procedures of a map, serve as a method to describe and define the underpinning decisions of map production?
- o
- Cartographic Ontology: Is it possible to define a comprehensive cartographic ontology that enables the description of the main decisions and default options in map production?
- o
- Trust Improvement: To what extent can trust in maps be enhanced by enhancing transparency and explainability in map production decisions?
- o
- Algorithmic Precision: Can rigorous quality guarantees and precise explanations of algorithmic map production empower users to discern the uncertainty in data, the methodology applied, and various shape deformations?
- o
- Quantifying Subjectivity: Since cartographic encodings influence the information map users perceive, can we quantify subjective approaches to map trustworthiness?
- o
- Interaction Paradigms: What interaction paradigms, ranging from simple to more engaging models, facilitate users in accessing transparent maps and inspecting alternative representations effectively?
- o
- Social Impact: What social impact can be achieved by forming a trustworthy consortium dedicated to map trustworthiness?
- Contextualization through alternativesIn the “going broad” dimension of our proposal, we acknowledge that people tend to seek additional or alternative sources of information when uncertain or suspicious about a particular communication medium. Applying this principle to cartography means proactively offering map users further and alternative map presentations, visualizations, or information sources [15]. By exposing users to various data representations of a given context, the “power of comparison” comes into play, making it easier to assess the value and trustworthiness of the original map. However, determining which further maps and alternative representations are genuinely related and relevant, depicting the same or related data and aspects, necessitates the comparison of their metadata [16]. Key research challenges in this context include [4]:
- o
- Communicative Interface: Can we develop a communicative interface to assist users in actively validating the trustworthiness of one or more maps showing the same data?
- o
- Raising Public Awareness: Can we raise public awareness about trust in map information by providing transparent alternatives for better information judgment?
- o
- Generalization to Data Visualization: Can this idea be successfully extended to map-like visualizations and data visualization in general?
- o
- Social Impact of Trustworthiness Consortium: What social impact can be achieved by forming a consortium dedicated to ensuring the trustworthiness of information presented through maps?
Although we are now able to identify the determining factor of the nature of cartographic modeling itself, as well as to propose an associated research agenda, the question remains regarding whether aspects of the described context can be verified by empirical studies. Related to the first item of the proposed research agenda above (Visualization and Communication), an empirical study on the eventual influences of cultural background on the perceived map design was performed at TU Vienna [17], and the experiment was cross-checked in a second study [18]. Both experiments offer results on the impact of the cultural background of map users on map design perception in respect to qualitative measures, and thus, trustworthiness. This can be seen as a contribution to understanding the intricacies “behind the map” which might influence the perception of trust, and thus, the trustworthiness of maps.
3. Validating Selected Aspects of the Research Agenda on the Trustworthiness of Maps: The Context of Cultural Background and Map Design Perception
In two related experiments [17,18] the question of the influence of cultural background on map design perception was analyzed. In this respect, the question was central, and investigated in which way map expression and map use correlate. As a part of map use, the trustworthiness of the used maps was investigated as well.
3.1. Cross-Cultural Map Design Perception
3.1.1. Research Questions and Background
An experiment on detecting cross-cultural differences in map design perception by replicating the topographic map design style of various national mapping agencies (the Federal Office of Metrology and Surveying of the Federal Ministry of Digital and Economic Affairs of the Republic of Austria and the Committee of Geodesy and Cartography of the Ministry of Digital Development, Innovation and Aerospace Industry of the Republic of Kazakhstan) was conducted in [17]. The different map styles on the same map content and data were then tested against experiment participants of different cultural backgrounds. Thus, Austrian and Kazakh users were exposed to both Austrian and Kazakh map styles resp. Austrian and Bulgarian users to Austrian and Bulgarian Map styles.
Our research objectives are to investigate to what extent cultural background influences the process of interaction (perception, attention, learning, and interpretation of the cartographic information) with a specific topographic map design. With this in mind, this study aims to address the following research questions:
- Do people perceive and process this information differently? Is there a presence of cross-cultural diversity? If yes, how and to what extent does cultural background influence cognitive abilities and style?
- What role does topographic map design have in the process of map reading and information extraction?
In this research, topographic maps were chosen for the analysis. This is because topographic maps are a ubiquitous form of cartographic communication, renowned for their richness in detail and wide-ranging utility. These maps are typically overseen and regulated by state authorities, rendering them authoritative sources of geographical information. One of the distinctive features of topographic maps is their tailored design, specific to individual countries, showcasing the unique geographic landscapes and points of interest within each nation. The meticulous organization of content and the map’s design are of paramount importance, as they are pivotal in ensuring a seamless, efficient, and effective user–map interaction.
The significance of map design cannot be overstated, as it profoundly influences how we engage with maps. Ongoing dialogues within cartography revolve around the pursuit of visually appealing maps that maximize the accuracy and efficiency of information delivery. It is widely believed that our cognitive abilities significantly shape our initial impression of a map [3]. This perception, in turn, is molded by a myriad of factors, including linguistic diversity, historical context, societal trends, individual experiences and knowledge, socio-economic and political systems, and, most importantly, the level of interaction with the surrounding world, collectively contributing to the formation of one’s cultural identity, leading to familiarity with certain designs.
Previous research in cross-cultural and cognitive psychology has postulated that culture serves as a bridge connecting cognition and the perception of visual information. Lev Vygotsky’s sociocultural and cultural–historical theory underscores the pivotal role of linguistic and sociocultural context in shaping cognitive styles. According to this theory, mental faculties such as attention, sensation, perception, and memory are modulated by the expansive concept of “culture”, encompassing socially accepted behaviors, beliefs, values, language, and the tools of intellectual adaptation that characterize a group of individuals as a collective entity [19].
In cartography, the earliest strides towards uniting psychology and cartography were made by Montello [20], who championed the notion that the synergy between these fields could enhance the perception of geovisualization mediums. This collaboration between psychology and cartography to improve the understanding and usability of geospatial information has laid the foundation for future investigations [21]. The exploration of this interdisciplinary alliance inevitably sparks discussions due to the pressing demand for producing maps that seamlessly encompass the “art-science-technology” facets of cartography. Nevertheless, only a handful of studies have taken on the challenge of intertwining cross-cultural backgrounds, cognitive processes, and cartographic outputs [22].
3.1.2. Methodology
In order to be able to achieve results in the interplay between cultural backgrounds, cognitive processes, and the design of topographic maps, the following methodology was applied to be able to answer the research questions on how culture influences the perception of and interaction with cartographic information. Ultimately, these results can then contribute to the ongoing discourse surrounding cartography’s evolving role in trust in maps. Therefore, a hybrid (both qualitative and quantitative) approach was applied to address the research objectives and questions. Quantitative measurements were intended to examine the following:
- -
- The state of cognitive abilities, such as attention, perception, and learning, between two user groups by recording the time needed to solve the task;
- -
- The trend of variation in the perception of the map content with different design styles within a cross-cultural context;
- -
- The role of topographic map design style in serving its main purposes (effective “map-user” communication, proper information visualization, and knowledge extraction);
- -
- Variations in self-orientation on a map, the ranking of map elements, and the reasoning for this ranking among participants from two user groups.
Furthermore, a qualitative method was used to convey participants’ opinions, associations, logical strategies, and feedback during the whole session, thus also allowing us to analyze the perceived trustworthiness of the presented maps.
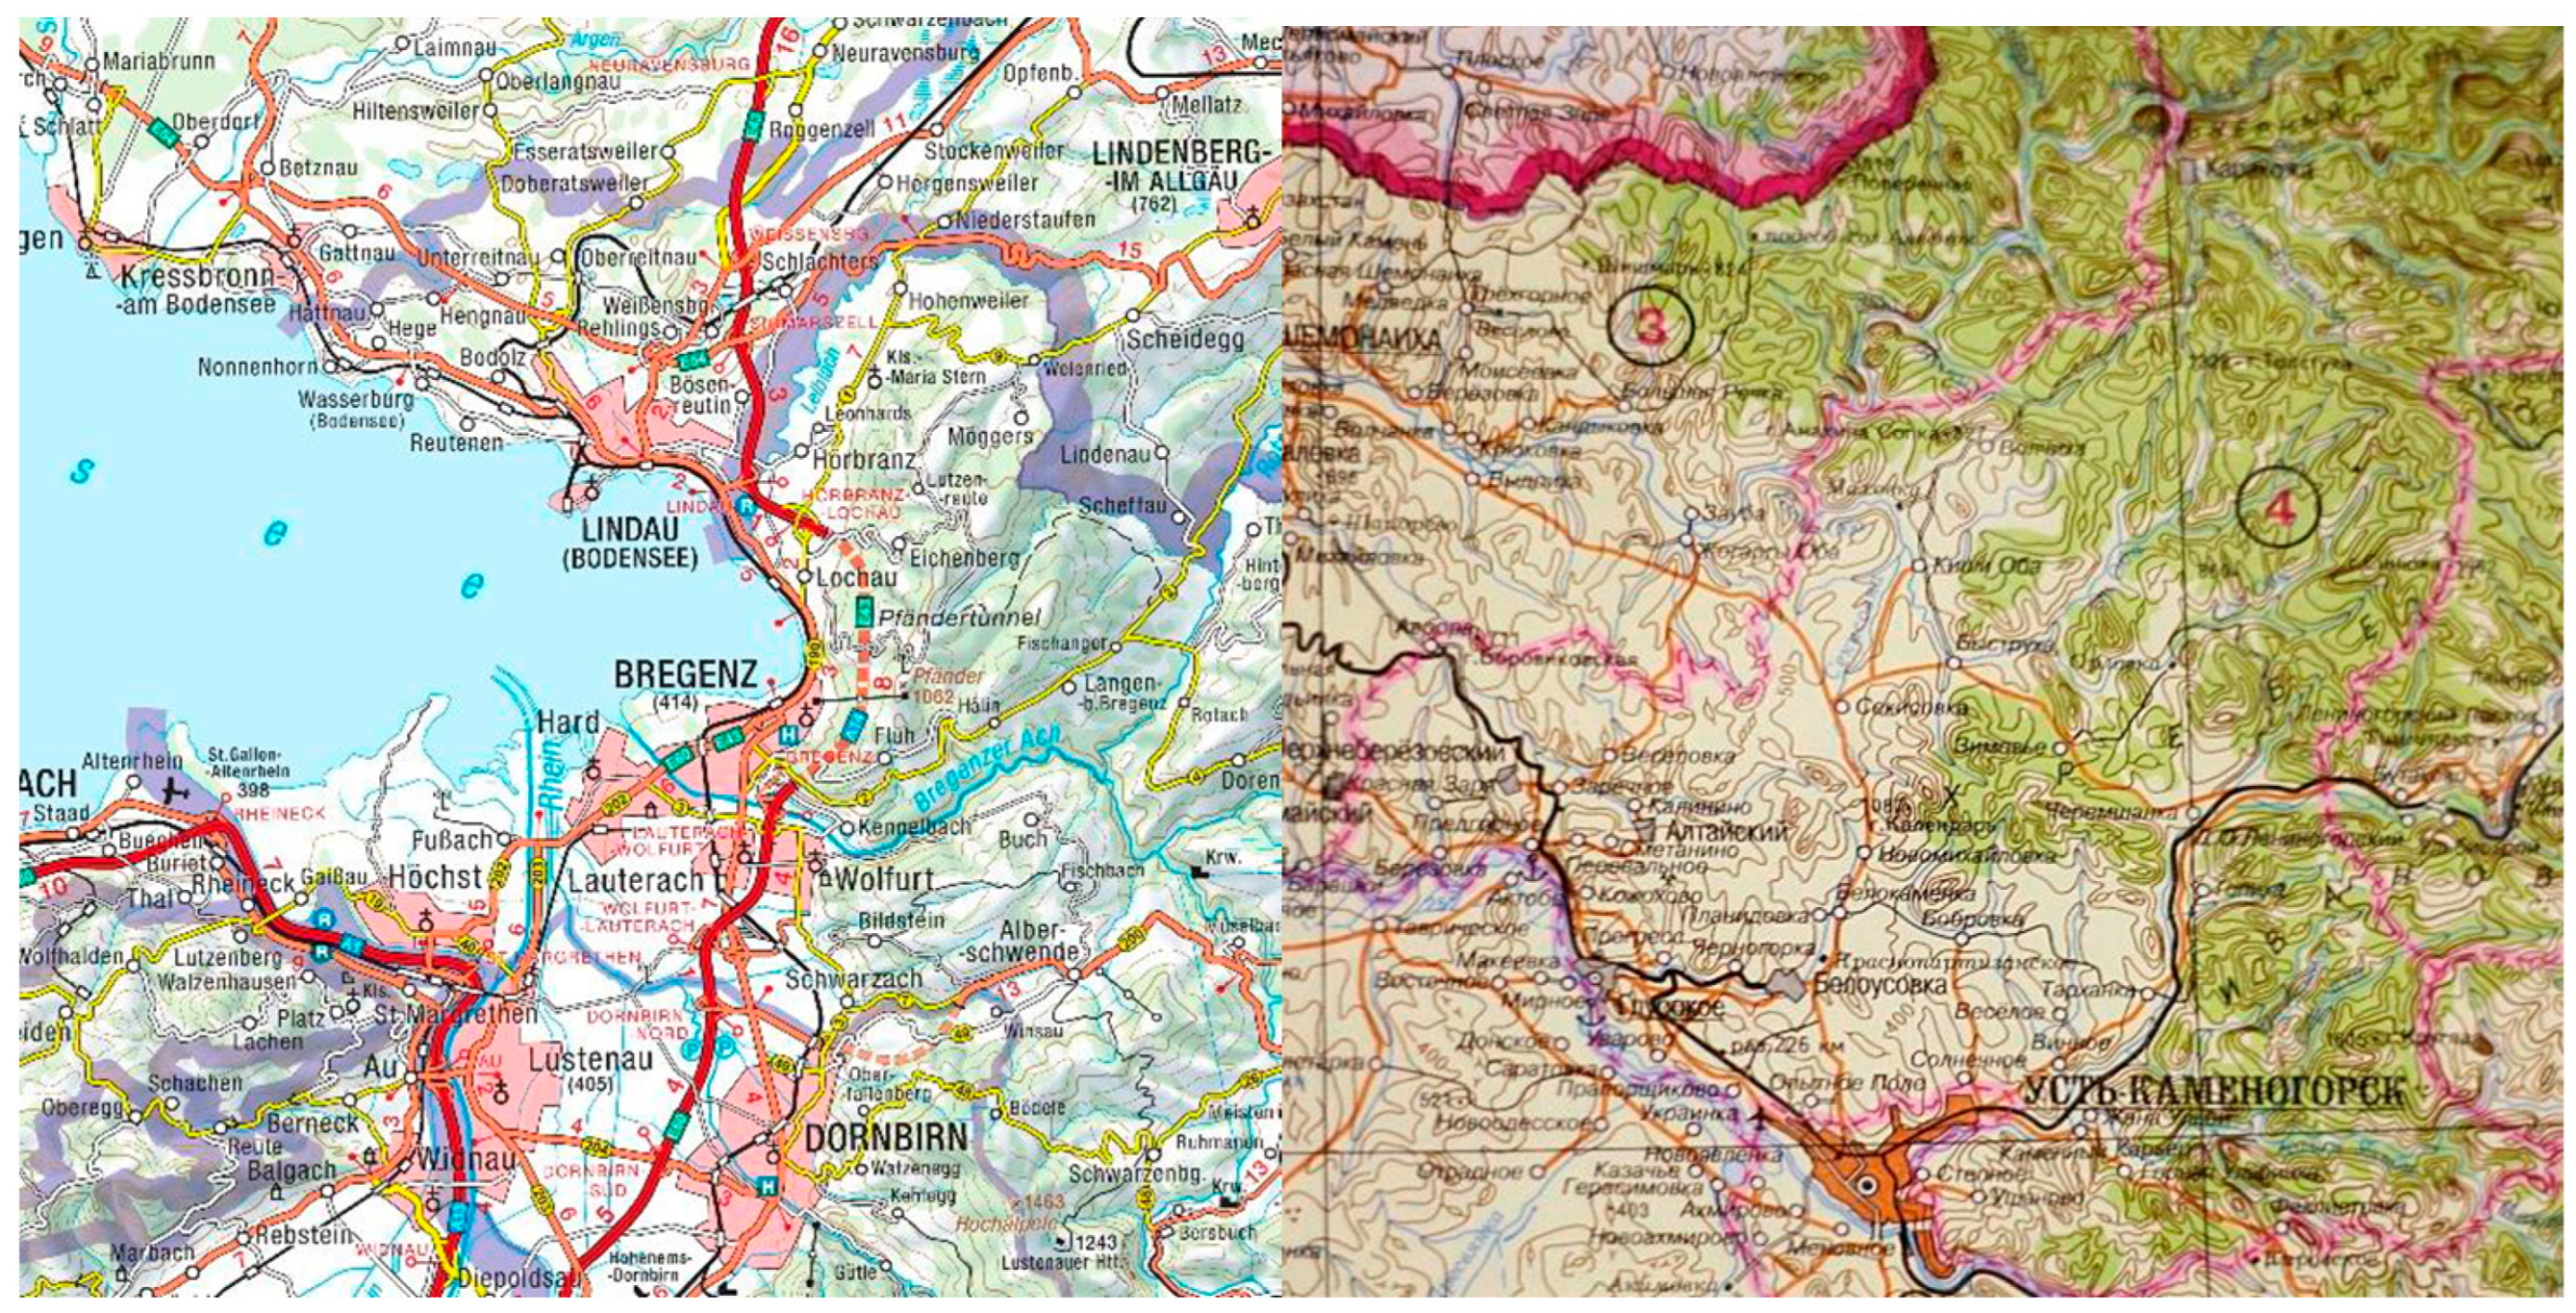
As the first step, map samples were produced for a fictional landscape replicating the topographic styles of two national mapping agencies, the Austrian Federal Office of Metrology and Surveying and the Kazak Committee of Geodesy and Cartography (Figure 1).

Figure 1.
Topographic Map Style of Austrian NMA (1:250,000) on the left side, and topographic map style of Kazahstan NMA (1:250,000) on the right side.
A transition schema (an equivalence catalogue of symbols for map features) for several map symbology definitions was created and applied to a sample fictional map (Figure 2) to allow for a comparison of perception parameters rather then differences in the map content.
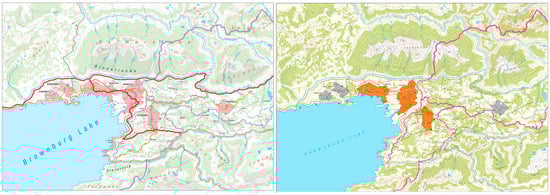
Figure 2.
Fictional maps with official Austrian map style and official Kazak Map Style [17].
The experiment was conducted among 50 participants aged between 15 and 40. The interviewees were divided into two groups (Group 1: Westerners, Group 2: Asians) based on their background, determined by cultural and environmental dimensions, and psychological constructs. For this categorization, a model of cultural dimensions at a national level [23] was applied. The experiment consisted of a questionnaire, including sections on personal data on the participant’s background; map-reading tasks, followed by the assessment of those tasks; and a feedback option. The whole experiment was carried out without direct human interaction, orally and visually, via communication platforms (Zoom, Skype, Telegram). Here, a thinking-aloud evaluation technique was used, and all interactions were recorded. The last stage of the experiment was aimed at supporting or rejecting the influence of cultural background on cognitive abilities. Thereby, participants were invited to examine the design/aesthetic component of two distinct map samples and subsequently answer open-ended questions.
3.1.3. Results
The quantitative measurements were intended to examine the state of cognitive abilities like attention, perception, and learning between two user groups by recording the time needed to solve the map-reading tasks, which involved finding a labeled place on two map samples. In the second part of the experiment, participants were invited to assess the design/aesthetic component of two distinct map samples and subsequently share their opinions, associations, logical strategies, and feedback during the whole session.
With respect to the quantitative measures, no evidence for the hypothesis that Group I (western) would perform better on map reading tasks on Map 1 (Austrian Map Style) and Group 2 (Asian) on Map II (Kazak Map Style) was found here. However, with respect to the results of the qualitative methodology, differences can be found. The main assumption to be tested here was that “participants will highly assess the map based on their experience and familiarity”. The determination of whether familiarity has an impact on individual assessments can be based on several psychological phenomena, including the following:
- The mere exposure effect describes the tendency to make preferences and to like things based on subjective familiarity. Ref. [24] discovered that the more often one sign was shown to a participant, the more the individual liked it, even if they could not interpret this sign. Moreover, the mere exposure effect can proceed without conscious cognition, and, thus, the preferences are not supported by inferences.
- The mere exposure effect is characterized by perceptual fluency [25] and the modified two-factor model [25]. Ref. [26] confirmed that the repetition of information increases the perceptual fluency and semantic memory retrieval. The modified two-factor model posits that an individual prefers something familiar, and thus, it reflects the process of learning. This was confirmed in Zajonc’s study [24], which demonstrated that prior exposure positively influences processing speed and fluency, which leads to higher rankings.
Based on this, we assume that Group I representing European countries would rank Map I higher than Map II, and Group II would demonstrate the opposite attitude. Further steps of our deductive approach were carried out in a statistical hypothesis analysis by group. The above assumption was tested by collecting the attributes in the questionnaire through a bipolar semantic differential five-scale ranking characterizing negative and positive variables (How attractive is the design of the map? (ugly–attractive); What feelings does the design of the map evoke? (discouragement-motivation); What feelings does the design of the map evoke? (confusion–clarity)) and aggregate them accordingly. “Ugly–attractive” conforms to the attractiveness and hedonic attributes of identification and evocation, “discouragement–motivation” is explained by the hedonic dimension of stimulation, and “confusion–clarity” shows the pragmatic quality and usability. Based on this aggregation an equal variance, a T-distribution test was performed, which resulted in three equations supporting the hypothesis (there is a significant difference between the records for “ugly–attractive”, “discouragement–motivation”, and “confusion–clarity” dimensions in the sample set to the sample size):
t1 _(4.44) > t _(1.677), so we can accept the hypothesis
t2 _(5.27) > t _(1.677), so we can accept the hypothesis
t3 _(9.44) > t _(1.677), so we can accept the hypothesis.
These findings show that there is a significant difference between the values for both maps in all given categories. Thus, this means that the participants from Group I ranked Map I in all dimensions higher than Map II. This demonstrates that the level of familiarity plays a crucial role in such types of ratings as the evaluation of attractiveness and usability [25]. When repeating the same procedure with Group 2, similar results are achieved. In their comments, participants mention that Map 1 “confuses them or create biases due to unfamiliar color schemes”. By parsing and analyzing all thinking-aloud comments, strong evidence can be found that participants tend to like the map design style based on their experience and familiarity. This includes a significant positive correlation between the given feedback on the map samples’ design and ranking values. Furthermore, participants also found similarities between the design of the judged map and the maps that they have experienced. For instance, the light shades of green and blue, unobtrusive light strokes of contour lines, pink-colored polygons for residential areas, multilevel transportation network, serif font style, self-explaining font colors, the placement of text labels repeating the direction of an object (mountains, valleys, rivers), the common symbolization of the railway road, and graphic symbols are mentioned with respect to the familiar “look and feel”.
The findings of this study serve as evidence of cross-cultural differences in map design perception. Particularly, consistent assessment ranking and feedback highlighted a significant level of importance of participants’ cultural background whilst communicating their opinions of the map. The outcomes of the qualitative data also revealed the presence of psychological phenomena, namely, the mere exposure, perceptual fluency, and modified two-factor models. According to this, our experience creates and shapes our world-view. Since the input information and content acquired from the surrounding setting varies from culture to culture, it can be assumed that “how we perceive” is to some extent influenced by cultural circumstances, thus directly influencing our trust in maps. However, in order to build upon a wider fundament, the question remains regarding whether these results and interpretations hold true when repeating the same experiment with a different group of participants and a different map design style. In order to answer this question, a second experiment comparing Austrian map style perception with Bulgarian map style perception was performed [18].
3.2. Cross Checking the Kazak/Austrian Experiment
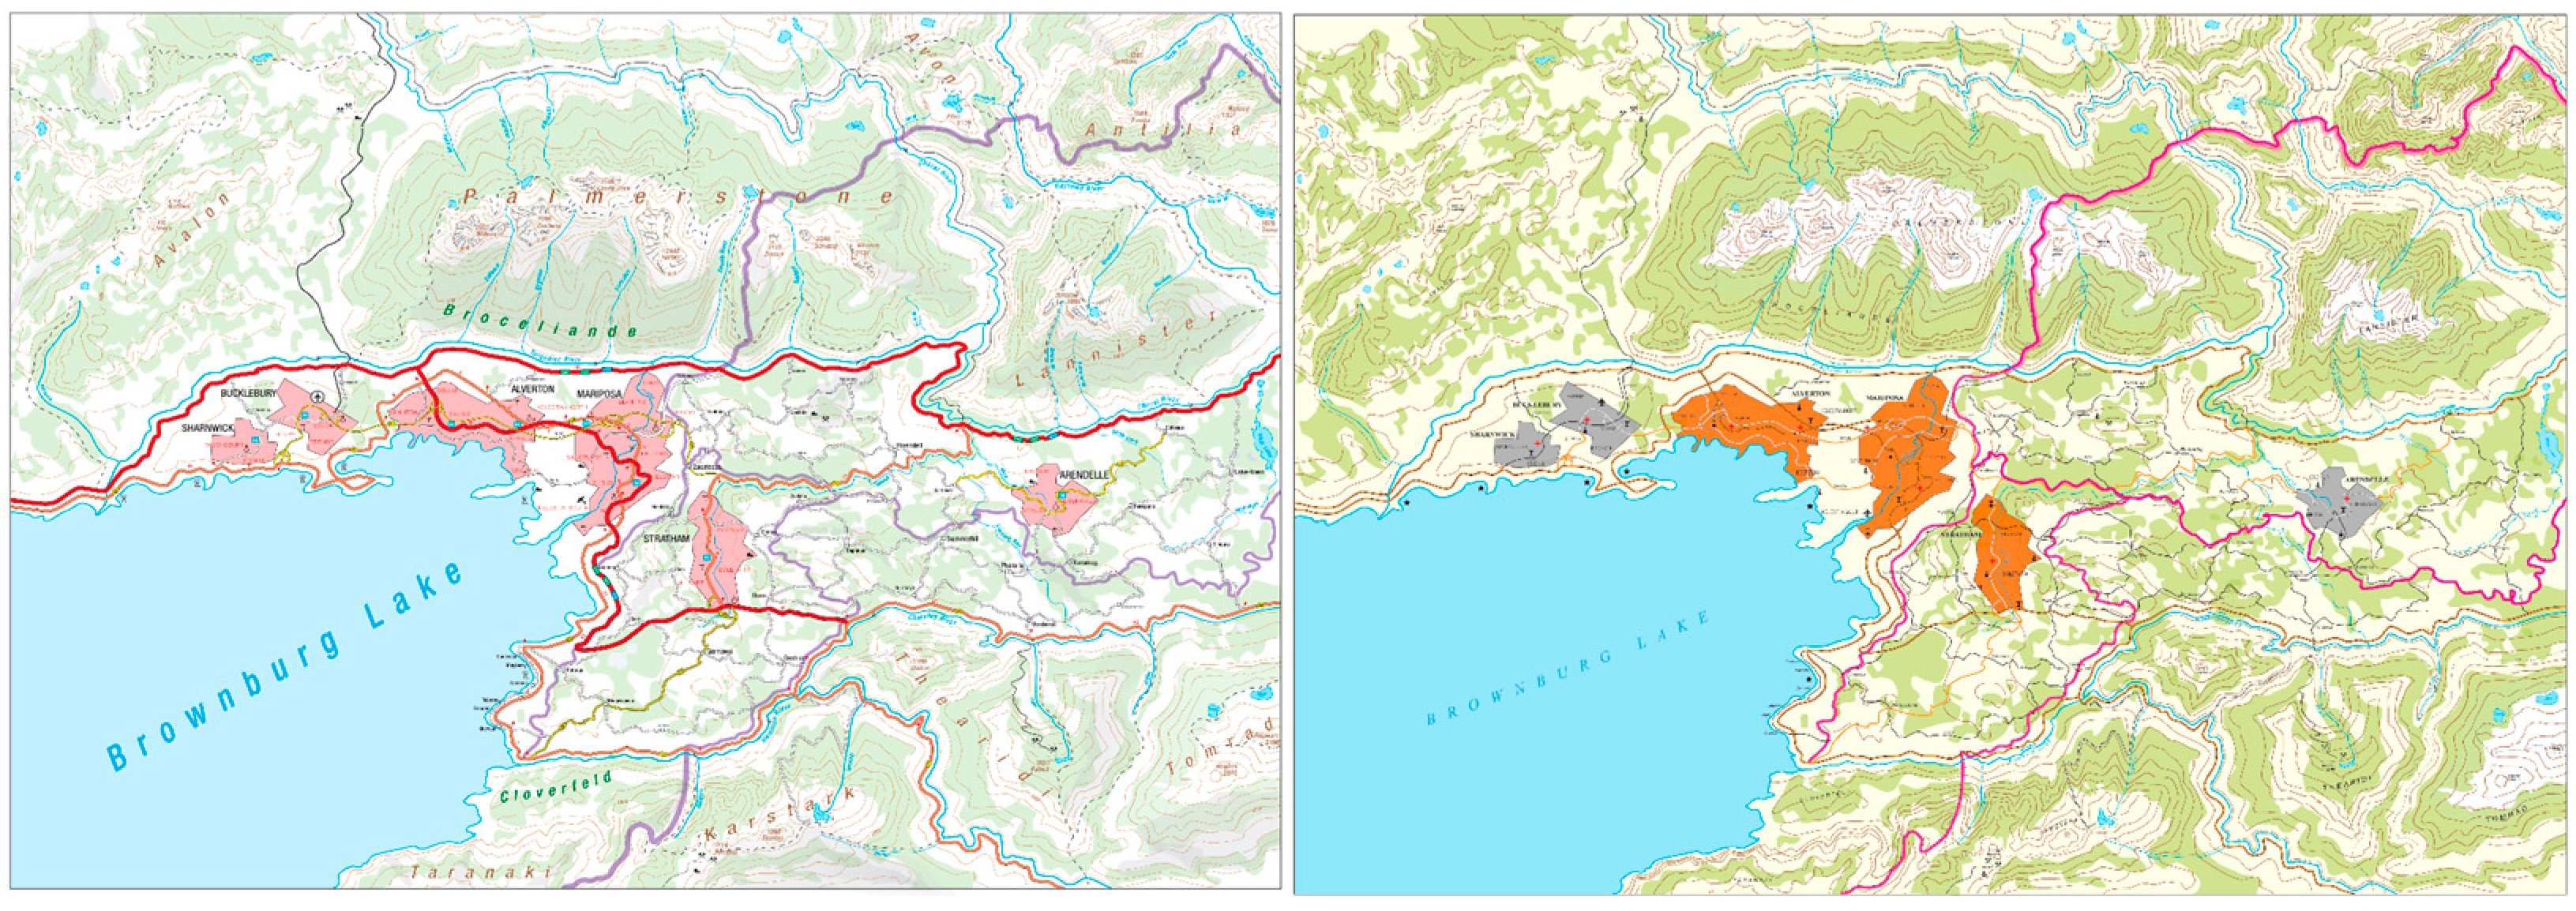
In an attempt to cross-check the results of the cross-cultural map design perception experiment comparing Kazak and Austrian map styles, the exact same experiment was perfomed replacing the kazak map style sample with a bulgarian map style sample, as defined by the military geographic service of the Bulgarian Armed Forces (Figure 3). Also, this time, one group of participants was chosen with a Bulgarian (Eastern European) background.
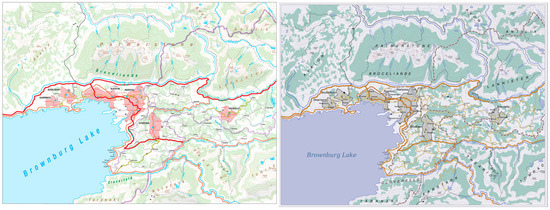
Figure 3.
Fictitious maps with official Austrian map style and official Bulgarian Map Style [18].
The experiment was conducted with Austrian (group 1, n = 20) and Bulgarian (group 2, n = 11) participants. The exact same tasks and questionnaire structure and conditions as in the experiment regarding Austrian/Kazak differences were applied [18].
The most relevant results in the context of the trustworthiness of maps are the “thinking-aloud” answers, as 70% of the Austrian participants prefer Map 1 (Austrian map style), while 55% of the Bulgarian participants prefer Map 2 (Bulgarian map style). Also, both groups in the map reading tasks perform better on “their familiar” map. Thus, we can conclude that the assumption that “participants perform better on chosen and liked maps” can be accepted.
3.3. Lessons Learned: Correlation of Map Expression and Map Trustworthiness
The correlation between map trustworthiness and map expression refers to the relationship between how reliable and accurate people perceive a map to be (trustworthiness) and the degree of information and details conveyed through the map (expression). Maps that accurately represent geographic features, locations, and spatial relationships can generally be considered to achieve more trustworthiness. If users can rely on a map to provide accurate information, they are likely to trust it more. However, in the study above, it is demonstrated that although the two maps are equally accurate, as the features, locations, and spatial relationships are depicted identically on the two maps, users often form perceptions of a map’s trustworthiness based on their ability to understand and interpret the information presented. If a map is expressive and provides information in a familiar manner, users are more likely to trust it.
4. Discussion and Conclusions
Cartographic modeling is a complex, user-oriented process that transforms geographical data into informative and accessible maps. The trustworthiness of these maps is a linchpin in their utility and impact, as they are often used to make essential decisions and convey information to the public. Ensuring trustworthiness is a multifaceted endeavor that involves reasonable decisions, transparency, reliance on reliable data sources, and trustworthy decision makers. In an age where maps are easily created and disseminated, the quest for trustworthy maps continues to evolve, with cartographers and the broader community working to maintain the integrity and reliability of these indispensable tools. As the field of cartography continues to grow, the context of cartographic modeling and the pursuit of trustworthiness will remain central to its evolution and enduring impact on society. This paper has the aim of contributing to this field through empirical studies and theoretical conceptualization, especially taking the influence of cultural background into consideration.
The main findings of these two empirical studies on the influence of cultural background can be read as confirmation of the complexity of ensuring the trustworthiness of maps. In these experiments significant differences were detected regarding the assumption that “the more familiar to the user the map is, the higher it will be assessed”. Thus, participants from Austria ranked the Austrian map higher than the Kazakh resp. Bulgarian map and vice versa. Taken as a whole, the resulting outcomes corroborate the primary hypothesis that the level of familiarity plays a crucial role in such ratings as the evaluation of attractiveness, usability, and trustworthiness [4]. In order to validate this reasoning further follow-up studies are underway, including investigating the influence of global mapping service styles (such as Google Maps) in the given context, as well as investigating various means of transparently offering further hints and explanations on the cartographic decisions being taken, thus providing user-accessible transparent background information, and analyzing the effect of this on the perceived trustworthiness of maps.
Author Contributions
Conceptualization, Georg Gartner; methodology, Bibigul Zhunis and Johanna Pühringer; investigation, Olesia Ignateva; resources, Olesia Ignateva; writing—original draft preparation, Georg Gartner; writing—review and editing, Olesia Ignateva; visualization, Bibigul Zhunis and Johanna Pühringer. All authors have read and agreed to the published version of the manuscript.
Funding
This research received no external funding.
Data Availability Statement
Data is unavailable due to privacy or ethical restrictions.
Conflicts of Interest
The authors declare no conflict of interest.
References
- Robinson, A.; Demsar, U.; Moore, A.; Buckley, A.; Jiang, B.; Field, K.; Kraak, M.J.; Camboin, S.; Sluter, C. Geospatial big data and cartography: Research challenges and opportunities for making maps that matter. Int. J. Cartogr. 2017, 3 (Supp. S1), 32–60. [Google Scholar] [CrossRef]
- Fairbairn, D.; Gartner, G.; Peterson, M. Epistemological thoughts on the success of maps and the role of cartography. Int. J. Cartogr. 2021, 7, 317–331. [Google Scholar] [CrossRef]
- Fairbairn, D.; Gartner, G.; Peterson, M. Engagement, communication and context: The success of the human-map nexus. Int. J. Cartogr. 2023, 1–21. [Google Scholar] [CrossRef]
- Gartner, G. Towards a Research Agenda for Increasing Trust in Maps and Their Trustworthiness. Kartogr. I Geoinformacije 2022, 21, 48–58. [Google Scholar] [CrossRef]
- Crampton, J.W. Mapping: A Critical Introduction to Cartography and GIS; Wiley-Blackwell: Hoboken, NJ, USA, 2010. [Google Scholar]
- Kent, A. Trust Me, I’m a Cartographer: Post-Truth and the Problem of Acritical Cartography. Cartogr. J. 2017, 54, 193–195. [Google Scholar] [CrossRef]
- Xiong, C.; Padilla, L.; Grayson, K.; Franconeri, S. Examining the Components of Trust in Map-Based Visualizations. In Proceedings of the 1st EuroVis Workshop on Trustworthy Visualization, TrustVis, Porto, Portugal, 3 June 2019. [Google Scholar] [CrossRef]
- Roth, R.; Ross, K.; MacEachren, A. User-centered design for interactive maps: A cases study in crime analysis. ISPRS Int. J. Geo-Inf. 2015, 4, 262–301. [Google Scholar] [CrossRef]
- Gotlib, D.; Olszewski, R.; Gartner, G. The extended concept of the map in view of modern geoinformation products. ISPRS Int. J. Geo-Inf. 2021, 10, 142. [Google Scholar] [CrossRef]
- Dumont, M.; Touya, G.; Duchene, C. More is less—Adding zoom levels in multi-scale maps to reduce the need for zooming interactions. J. Spat. Inf. Sci. 2023, 27, 93–124. [Google Scholar] [CrossRef]
- Bertin, J. Graphische Semiologie; De Gruyter: Berlin, Germany, 1974. [Google Scholar]
- Usery, L.; Varanka, D. Design and development of linked data from the national map. Semant. Web 2012, 3, 4. [Google Scholar] [CrossRef]
- Prestby, T. Trust in maps: What we know and what we need to know. Cartogr. Geogr. Inf. Sci. 2023, 1–18. [Google Scholar] [CrossRef]
- British Cartographic Society. Code of Ethics. 2020. Available online: https://www.cartography.org.uk/code-of-ethics (accessed on 11 November 2023).
- Jobst, M.; Gartner, G. Accessing spatial knowledge networks with maps. Int. J. Cartogr. 2022, 8, 102–117. [Google Scholar] [CrossRef]
- Ceballos Cantu, J.P.; Jobst, M.; Gartner, G. Understanding relevance in maps through the use of knowledge graphs. Int. J. Cartogr. 2023, 9, 466–487. [Google Scholar] [CrossRef]
- Zhunis, B. Cross-Cultural Differences in Map Design Perception. Master‘s Thesis, Technische Universität Wien, Vienna, Austria, 2020. [Google Scholar] [CrossRef]
- Pühringer, J. Cross-Cultural Differences in Topographic Map Design. Bachelor‘s Thesis, Technische Universität Wien, Vienna, Austria, 2022. [Google Scholar]
- Vygotsky, L.S. Mind in Society: The Development of Higher Psychological Processes; Harvard University Press: Cambridge, MA, USA, 1979. [Google Scholar]
- Montello, D.R. Cognition of Geographic Information. In A Research Agenda for Geographic Information Science; CRC Press: Boca Raton, FL, USA, 2004. [Google Scholar]
- Sasinka, C.; Stachon, Z.; Cenek, J.; Sasinkova, A.; Popelka, S.; Ugwitz, P.; Lacko, D. A comparison of the performance of extrinsic and intrinsic cartographic visualisations through correctness, reponse time and cognitive processing. PLoS ONE 2021, 16, e0250164. [Google Scholar] [CrossRef]
- Stachon, Š. Effect of Size, Shape and Map Background in Cartographic Visualization: Experimental Study on Czech and Chinese Populations. ISPRS Int. J. Geo-Inf. 2018, 7, 427. [Google Scholar] [CrossRef]
- Hofstede, G. Dimensionalizing Cultures: The Hofstede Model in Context. Online Read. Psychol. Cult. 2011, 2, 8. [Google Scholar] [CrossRef]
- Zajonc, R.B. Attitudinal effects of mere exposure. J. Personal. Soc. Psychol. 1968, 9 Pt 2, 1–27. [Google Scholar] [CrossRef]
- Lee, A.Y. The Mere Exposure Effect: An Uncertainty Reduction Explanation Revisited. Personal. Soc. Psychol. Bull. 2001, 27, 1255–1266. [Google Scholar] [CrossRef]
- Joye, Y.; Steg, L.; Unal, A.; Pals, R. When Complex Is Easy on the Mind: Internal Repetition of Visual Information in Complex Objects Is a Source of Perceptual Fluency. J. Exp. Psychol. Hum. Percept. Perform. 2015, 42, 103. [Google Scholar] [CrossRef] [PubMed]

Disclaimer/Publisher’s Note: The statements, opinions and data contained in all publications are solely those of the individual author(s) and contributor(s) and not of MDPI and/or the editor(s). MDPI and/or the editor(s) disclaim responsibility for any injury to people or property resulting from any ideas, methods, instructions or products referred to in the content. |
© 2024 by the authors. Licensee MDPI, Basel, Switzerland. This article is an open access article distributed under the terms and conditions of the Creative Commons Attribution (CC BY) license (https://creativecommons.org/licenses/by/4.0/).