Article

Online Decision Support Infrastructures for Integrating Spatial Planning and Flood Risk Management Policies

1
School of Architecture and Planning, Hunan University, Changsha 410082, China
2
Urban Institute, University of Manchester, Manchester M13 9PL, UK
3
Department of Urban and Regional Planning, University of Illinois Urbana-Champaign, Champaign, IL 61820, USA
4
School of Architecture, Planning, and Environmental Policy, University College Dublin, D04 V1W8 Dublin, Ireland
*
Author to whom correspondence should be addressed.
ISPRS Int. J. Geo-Inf. 2024, 13(2), 53; https://doi.org/10.3390/ijgi13020053
Submission received: 14 November 2023 / Revised: 24 January 2024 / Accepted: 31 January 2024 / Published: 11 February 2024

Abstract

:
Accessible geospatial data are crucial for informed decision making and policy development in urban planning, environmental governance, and hazard mitigation. Spatial data infrastructures (SDIs) have been implemented to facilitate such data access. However, with the rapid advancements in geospatial software and modelling tools, it is important to re-visit the theoretical discussion about the different roles of data-focused SDIs and decision support and modelling tools, particularly in relation to their different impacts on policy making and policy integration. This research focuses on addressing this issue within the specific context of policy integration in spatial planning and flood risk management. To investigate this, an experiment was conducted comparing a data-focused SDI, the Myplan Viewer, with a prototype Internet-based Spatially Integrated Policy Infrastructure (SIPI). The findings reveal that the SIPI, which provides access to both data and decision support and modelling tools, significantly enhances policy integration compared to the Myplan Viewer. Moreover, drawing upon communicative action theory, this study underscores that while data-focused SDIs support instrumental goals, they possess limitations in facilitating trade-offs and balancing diverse interests in the policy-making process, particularly in supporting strategic and communicative actions.

1. Introduction

With the increasing frequency of climate change and extreme rainfall events, flooding disasters have resulted in widespread impacts on both the population and economy. Among the various measures taken to address flooding disasters, integrating the goal of reducing flood risk with spatial planning is considered a more effective and sustainable approach compared to traditional engineering measures, such as embankments and diversion channels [1,2,3,4,5]. However, integrating the goals of flood risk management (FRM) in urban plans and spatial policies is difficult due to numerous obstacles, including political, financial, and organisational barriers, especially when they conflict with the development goals [6]. The spatial mismatch between jurisdictions of spatial planning (SP) and FRM institutions adds to the difficulty of aligning proper spatial plans with flood risk mitigation objectives [3,7]. The lack of easy access to flood information during the planning process and the lack of planning scenarios when making flood management plans are also noteworthy hindrances for the coordination, integration, and alignment between the two disciplines [5].
Flood maps, both in paper and digital formats, are useful for identifying flood zones and considering policy alternatives in flood-prone areas. However, as they are static maps, their value is limited in providing an understanding of the flooding consequences in different contexts and under various development scenarios [8,9,10], in providing an understanding of the impact on the groundwater system [11], and in providing an understanding of the cumulative effect of land use changes on the catchment (watershed) scale [12,13]. A practical difficulty in considering the consequences of various development scenarios is that planners and policy makers often lack access to decision support and modelling tools, or they lack the expertise to explore the dynamics between land use and flood risks [14]. For this reason, the access to easy-to-use tools appears to be an important factor in the development and integration of spatial planning and flood risk management policies. This research is grounded in three fundamental concepts: policy integration, spatial data infrastructures (SDIs), and decision support and modelling tools.

1.1. Policy Integration

Policy integration can be understood in different ways. Some researchers define it as the inclusion of specific public policy objectives, such as environmental protection or disaster mitigation, in policy-making outcomes [15]. Others consider policy integration as the highest level of interaction throughout the policy-making process [6], in which ‘all significant consequences of policy decisions are recognised as decision premises, where policy options are evaluated on the basis of their effects on some aggregate measure of utility, and where the different policy elements are in accord with each other’ [16] (p. 162). By integrating policies from different fields, the efforts and priorities of various stakeholders can be coordinated, aiming to achieve goals such as disaster mitigation, sustainable development, and climate change adaptation [17,18,19].
The goals of achieving policy integration between spatial planning and flood risk management are to avoid policy conflict, balance the objectives of development and safety, and help stakeholders in different sectors gain better understanding so that urban planning policy will actually help to mitigate flood risk.

1.2. Spatial Data Infrastructures

Spatial data infrastructures (SDIs) facilitate access to geospatial data through various devices and platforms. SDIs involve elements such as metadata, geospatial data, data sharing policies, network services, and the involvement of people and institutions in data sharing and utilisation. From an end-user perspective, SDIs typically consist of two main functional components: (1) data and information and (2) access tools and protocols. In this paper, we refer to such SDIs as data-focused SDIs. The development of SDIs has been widespread since the early 2000s [20,21,22,23].
The roles and effectiveness of such SDIs have been topics of major theoretical discussion within the GIS field. Influential research has identified maps and geospatial data provided by SDI portals as “integration mediums” that promote policy integration, mutual understanding, and communication [24]. Other studies justify the roles of SDIs by examining how they provide access to geospatial data and maps, enhancing communication and collaboration among policy makers [25,26]. Fabbro and Haselsberger [27] argue that sharing data and information from all jurisdictions is important to gain a full picture of cross-boundary issues. Access tools and protocols also contribute to institutional integration and facilitate collaboration, consensus building, and partnerships among institutions [28,29]. However, the effectiveness of SDIs is influenced by factors such as funding, institutional arrangements, socio-political stability, and vision [30]. Overall, studies indicate that while SDIs with both data and information and access tools and protocols have a positive impact on policy making, their specific roles in the entire policy-making process, beyond the policy outcome, require further exploration.
In the context of integrating spatial planning (SP) and flood risk management (FRM), the lack of information, such as flood maps and risk maps, has hindered planning authorities from effectively utilising spatial plans for flood mitigation [5,8]. In response to this limitation, the EU member states are required to prepare flood hazard maps and flood risk maps according to the EU Floods Directive (2007/60/EC). Several SDIs specifically focus on providing flood-related maps, such as the Global Runoff Data Centre (http://www.bafg.de/GRDC/EN/Home/homepage_node.html accessed on 2 February 2024), the European Floods Portal (http://floods.jrc.ec.europa.eu/efas-flood-forecasts accessed on 2 February 2024), the Irish Flood Hazard Mapping (http://www.floodmaps.ie accessed on 2 February 2024), and the Australian National Flood Risk Information Portal (http://www.ga.gov.au/flood-study-search/ accessed on 2 February 2024).

1.3. Decision Support and Modelling Tools

In addition to maps and geospatial data, decision support and modelling tools have demonstrated additional value when incorporated into traditional data-focused SDIs. For instance, a study by Pelzer and Geertman [31] examined the Planning Support System (PSS) and found that it improved collaboration and communication among stakeholders in the planning context. Building on this idea, researchers have proposed integrating decision support and modelling tools into traditional data-focused SDIs. Kiehle, Greve [32] suggested that SDIs could be enhanced by incorporating geoprocessing functions. However, these geoprocessing functions primarily focus on data access, querying, basic analysis, delivery, and maintenance rather than focusing on more complex modelling and geospatial analysis [33].
To fully realise the potential of SDIs, integrating decision support and more functional modelling tools that target policy making and policy integration is essential. In the realm of web-based GIS, this trend is observed in the shifts from early “distributed GIS processing” to “CyberGIS” [34] and from providing basic data access and visualisation functions to more advanced analytical and modelling capabilities [35]. The concept of web-based decision and planning support systems has also been proposed in spatial planning to support collaborative planning efforts [36]. With these developments in SDIs, it is crucial to expand their capacity and role in capturing the knowledge base required to develop integrated policy solutions for different contexts, utilising various decision support and modelling tools.
SDIs that rely on web-based decision support and modelling tools to complement raw data repositories, viewing, and downloading offer unique potential to bridge the communication gap between experts and non-experts in exploring policy solutions [37,38]. Sharing models and tools helps disseminate the scientific analysis and expertise underlying them [39]. However, further research is needed to advance this knowledge by identifying the additional functions enabled by sharing decision support and modelling tools through infrastructures. Moreover, existing research has focused on data access and decision support and modelling tools primarily in the domain of Geographic Information Technologies (GITs) for promoting communication, cooperation, and coordination. A knowledge gap remains regarding whether GITs can directly facilitate policy integration more effectively.

2. Theoretical Framework and Research Methods

To address the knowledge gap regarding the direct role of SDIs and Geographic Information Technologies, such as decision support and modelling tools, in facilitating policy integration, the concept of a Spatially Integrated Policy Infrastructure (SIPI) was proposed by Ran and Nedovic-Budic [40]. An SIPI prototype was subsequently developed for the River Dodder catchment in Ireland [41]. This prototype incorporates both data and decision support and modelling tools with the aim of facilitating the integration of spatial planning and flood risk management policies. An experiment was conducted to investigate the extent to which this SIPI prototype, which includes both data and modelling tools, could support policy integration in the context of spatial planning and flood risk management. Additionally, the experiment sought to compare the performance of the SIPI prototype with that of a traditional data-focused SDI.

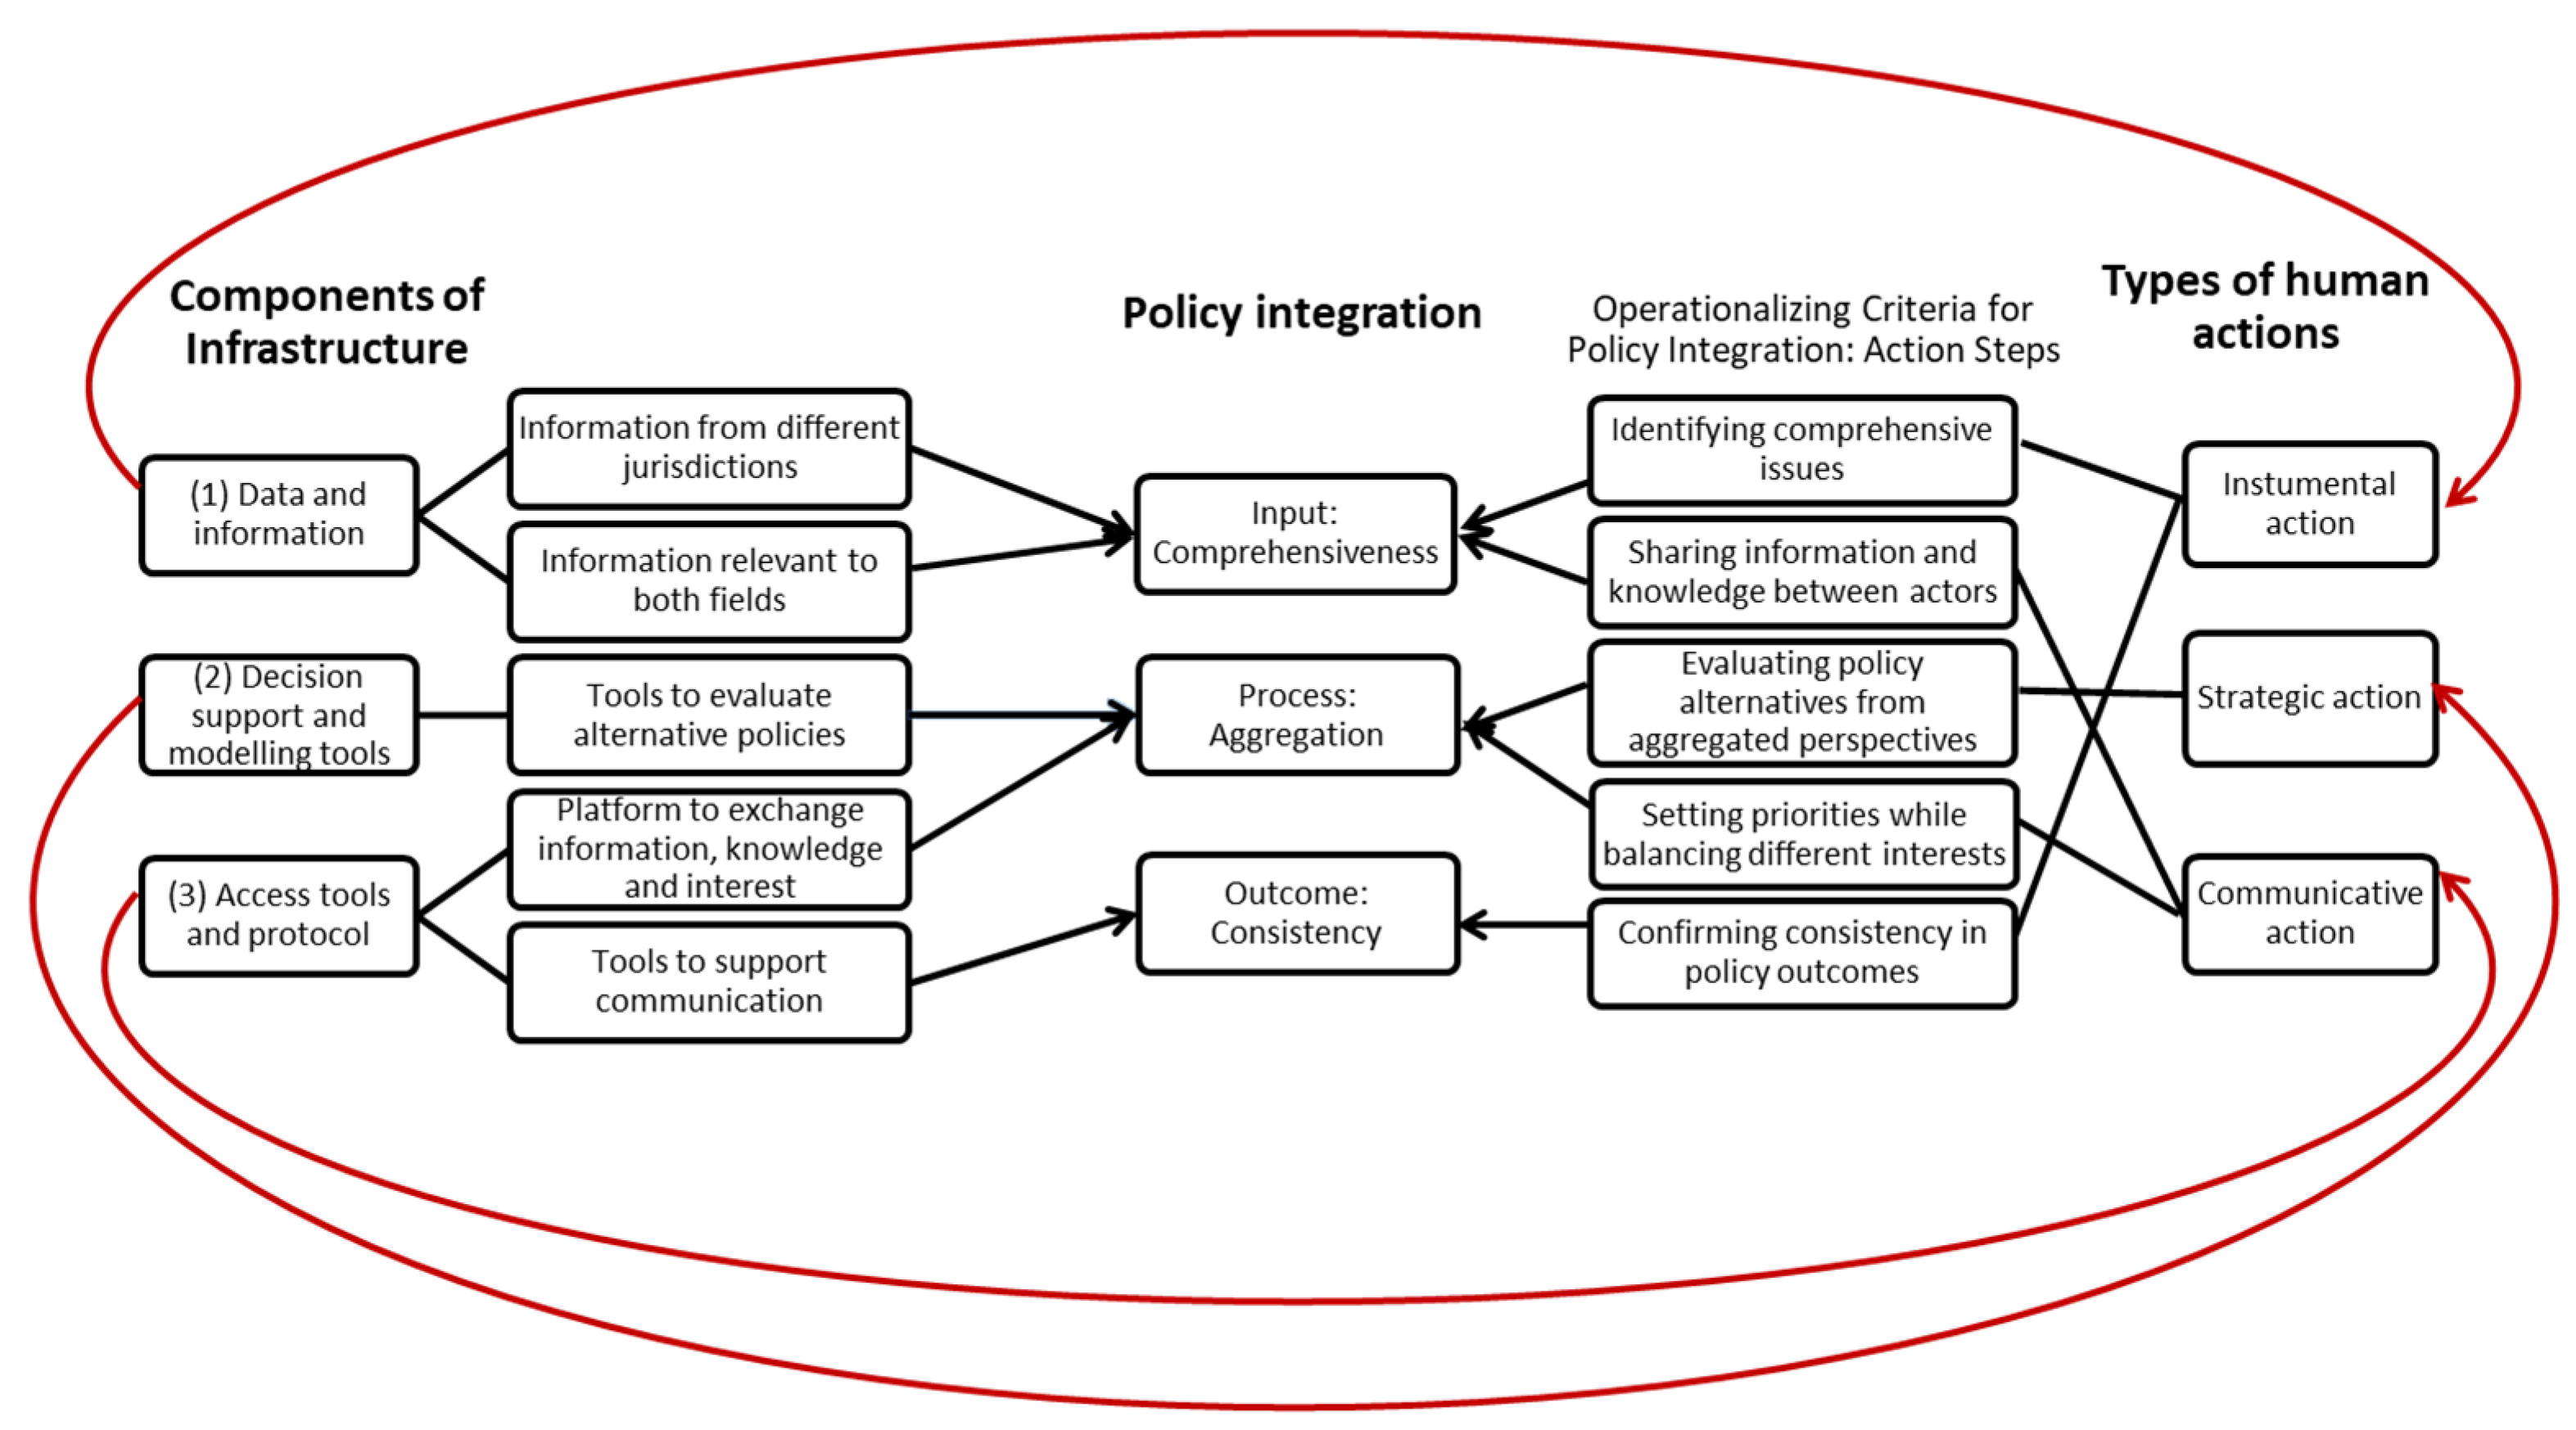
2.1. Theoretical Framework: Components of Infrastructure, Policy Integration, and Human Actions

To guide the experimental research design, a theoretical framework was developed (Figure 1), drawing upon the literature on information infrastructure, policy integration, and communicative action theory. These theoretical perspectives provide a foundation for understanding the role and impact of SDIs and decision support and modelling tools in promoting policy integration between spatial planning and flood risk management.
First, the centre of the framework lies within policy integration, which we hope to achieve. In this study, policy integration is defined as follows: in the policy input process, comprehensive issues are considered, and knowledge sharing happens among various actors; in the policy-making process, policy alternatives are evaluated with the priorities that balance interests from various perspectives; and for policy outputs, policies are consistent with policies at a larger spatial scale, both in neighbouring areas and from different authorities [15,42,43,44]. Underdal (1980) summarises in his framework that policy integration is measured by its ‘comprehensiveness to the input stage; aggregation to the processing of inputs; and consistency to outputs’ [16] (p. 159).
Policy making and policy integration, from another perspective, are the outcomes of human actions, which, according to Habermas’ Communicative Action Theory, is defined as ‘the symbolic expressions with which the actor takes up a relation to at least one world’ [45] (p. 96). According to Habermas’s ontology, elements of the lifeworld can be categorised as the subjective world, the objective world, and the social world. The objective world is ‘the totality of facts’ and ‘the existence of a corresponding state of affairs that can count as true’. We can categorise three main types of human actions according to the part of lifeworld that they relate to. Instrumental action and strategic action are teleological and presuppose ‘relations between subjective and objective world’ [45] (p. 87). In instrumental action, actors achieve their goals by manipulating and controlling existence in the objective world, while in strategic action, they achieve their goals using the knowledge and predictions of other actors’ goal-directed actions. Both instrumental action and strategic action aim to achieve ‘a goal or [bring] about the occurrence of a desired state’. However, strategic action differs from instrumental action in that it achieves its goal by influencing the decisions of ‘at least one additional goal-directed actor’ [45] (p. 86). Knowledge related to decision theory, behaviour, sociology, and psychology all can be applied to support the success of such strategic action.
The third type of human action, communicative action, relates to people’s subjective worlds and social worlds, which refer to individuals’ perceptions, beliefs, agreements, and feelings [46]. Unlike goal-directed action, communicative action aims to reach a mutual understanding or agreement through a common background of values, shared norms, conventions, habits, and assumptions about the world [45]. When the common base is challenged or breaks down, normally, the members will first try to fix or rebuild this common base through discussion, negotiation, and agreement. This process belongs to communicative action, but if discourse fails, each member will return to their own instrumental action or strategic action.
In this context, policy makers engage in instrumental actions to fully explore the issues and confirm the consistency of the policy’s outcome. Strategic actions occur when a participant tries to persuade other participants to view and evaluate the scenario from their perspective. Communicative actions are also required to make policies based upon a mutual understanding of the issues and agreement regarding priorities. The success of both instrumental and strategic actions can be evaluated in terms of their efficiency in achieving the given goals, while the success of communicative action can be assessed according to the level of fit, the scale of self-presentation, and the level of mutual understanding [46].
Three components of information infrastructure play roles both in the policy-making process and human actions, including (1) data and information, (2) decision support and modelling tools, and (3) access tools and protocols. A traditional SDI usually focuses on providing data and information via access tools and protocols. However, adding the components of decision support and modelling tools is the next evolutionary step of SDIs. By providing access to tools for modelling, analysis, and simulation, i.e., land use models and hydrological models, we expect to enable policy makers to be aware of the interplay between human activities and flood hazards, and thus, to better integrate the objectives of spatial planning and flood risk management. For example, in this case, by sharing flood models with planners, we expect them to be able to assess and compare the benefit or detriment of each alternative policy to flood mitigation. Similarly, by sharing land use models with flood engineers, we expect them to be able to consider the human impacts on the extent of flooding. It shall be noted that sharing modelling tools, as shown in our framework, is different from sharing the output of the models; we appeal for sharing the modelling process through access tools so that the scientific analysis and knowledge that underlie them are also exchanged among stakeholders. However, such conceptualisation of components of information infrastructure does not mean that other important elements that make such infrastructures functional, i.e., people, networks, standards, and policies [47], are ignored. Providing access to models cannot be achieved without standardised, open, friendly, and transparent modelling procedures.
Researchers have suggested that organisations achieving a high degree of policy integration tend to have carried out more communicative action than those with lower degrees of policy integration [6,15,48]. In addition, GITs are identified to have the potential to promote communication [25,26]. Based on the connections among the concepts, as illustrated in Figure 1, this research focuses on examining the impact of information infrastructure on policy integration. Subsequently, these findings are validated through an investigation into the relationship between information infrastructure and human actions.

2.2. SIPI Prototype Development

This research hypothesises that decision support and modelling tools would directly support integration in the policy-making process. To test this hypothesis, this work builds upon an SIPI prototype developed by Ran and Nedovic-Budic [40,41]. The SIPI falls within the broader category of information infrastructure and represents the type of future trend in SDIs, which incorporate more decision analysis models to enable dynamic analysis and real-time simulations. In other words, the SIPI is a type of SDI that provides both data and decision support and modelling tools to enable the dynamic analysis needed for policy making, so that it may facilitate the integration of multiple policies.
In this study, our objective is to compare this future SDI, enriched with decision analysis models, with traditional data-focused SDIs. We seek to assess their respective roles in shaping spatial planning and flood-related policies, elucidating the distinctions in their contributions. However, due to the limited funding and resources, this research did not develop a fully functioning SIPI, but an SIPI prototype which simulates the added functions. These functions are predictions of the flood extent from 2015 to 2025 under different local development scenarios in two study areas in Dublin, Ireland. (1) The inner-city study area, the Dublin City-River Dodder downstream area, is likely to have three planning scenarios for coverage changes in green space that may affect the percentage of permeable surfaces and, thus, influence the rainfall–runoff process. (2) The upper catchment suburban area, the Ballycullen–Oldcourt area, is likely to see three new development scenarios with different densities, which affect flooding at different levels. The user end of the SIPI prototype involves two websites (web link for the SIPI prototype for the Ballycullen–Oldcourt case area: https://www.arcgis.com/apps/webappviewer/index.html?id=3599c2e1863d41b6a4524740a6e1efbb, accessed on 6 January 2024; web link for the SIPI prototype for the Dublin City-River Dodder Downstream case area: https://www.arcgis.com/apps/webappviewer/index.html?id=550f272ccd7e436aa919a851c927fc93) accessed on 2 February 2024 that visualise the maps of flood extent under each development scenario and other relevant information such as official flood maps, land cover, and current zoning maps.
By focusing on studying the added value of accessing decision support and modelling tools via this infrastructure, we conducted an experiment in which we compared this SIPI prototype with a generic SDI, the Myplan Viewer. The Myplan Viewer is an official SDI developed by the Department of Environment, Community and Local Government to provide public access to planning information. Since its launch on 4 April 2012, the Myplan Viewer has been updated with zoning maps, census data, school locations, flood maps, and several other relevant datasets (Myplan Viewer: https://viewer.myplan.ie/ accessed on 2 February 2024). However, unlike the SIPI, in the Myplan Viewer, the flood risk map is a static assessment of the overall risk. This risk map does not provide flood information about how planning scenarios will change the flood risk in particular study areas, such as the Dublin City-River Dodder area or the Ballycullen-Oldcourt area.

2.3. Method: Experimental Research Design

An experiment in the form of participatory workshops was conducted to compare the roles of the SIPI prototype and the MyPlan Viewer in facilitating policy integration. Two groups of participants were recruited with a purposive sampling method. Each group comprised four participants: one planner from the Dublin City Council, one planner from the South Dublin County Council, one flood engineer from the Office of Public Works, and one representative of the local residents. The recruited participants were all familiar with web-based GISs. Some of them knew of the Myplan Viewer, but none of them used it for their routine work. Each group took part in two workshops: one focused on the Dublin City study area, and the other one focused on the Ballycullen study area (Table 1). Each workshop started with a guided group discussion of the policy alternatives in the study area and ended with a survey using questionnaires. The guided discussion consisted of a control session and an experimental session. In the control session, the participants were guided to discuss three development scenarios in the study areas with the aid of the Myplan Viewer. In the experimental session, the participants were asked to discuss the scenarios with the aid of the SIPI prototype.
After each workshop, the participants were asked to fill out a questionnaire individually and anonymously. The statements in the questionnaire were developed to gather information about the participants’ perception of the Myplan Viewer and SIPI in terms of supporting policy integration and human actions. Hence, there were 12 statements related to each infrastructure system (the SIPI prototype and Myplan Viewer), which collected the users’ levels of agreement regarding the function of the infrastructure in supporting policy integration, and that also corresponded to the three types of human actions (Table 2). The 12 statements/questions for the Myplan Viewer were asked in the same way as the questions for the SIPI to support the comparison between the SIPI and Myplan Viewer.
The participants responded to these statements by selecting a value on the five-point Likert scale: strongly agree, agree, neither agree nor disagree, disagree, and strongly disagree. Scales with a higher number of categories are available for use, but their contributions to generating more reliable results are debated [49]. Dawes (2008) found that five-point, seven-point, and ten-point scales did not show any significant differences in terms of the standard variation, skewness, or kurtosis [50]. Thus, for the purpose of the survey administered in this study, we decided to apply the Likert scale with the minimum number of categories, which was a five-point scale, as suggested by Allen and Seaman [51]. In total, 16 questionnaires were returned. In this case, considering the limited number of experts who had experience in making policies regarding planning and flood risk management in the case area, 16 was judged to be an acceptable sample size for the purpose of gaining relevant insights and information.
We then applied a T-test to compare the users’ agreement levels regarding the function of the Myplan Viewer and that of the SIPI prototype. Based on this analysis, the results addressed two questions: (1) Based on the concept of policy integration, was SIPI more effective than Myplan Viewer in supporting policy input, the policy-making process, and policy outcomes? (2) From the perspective of human actions, was SIPI more effective than Myplan Viewer in supporting instrumental, strategic, and communicative actions in policy making?

3. Observations from the Guided Group Discussions

The guided discussions during the workshops were recorded, transcribed, and subjected to a thorough thematic analysis. The qualitative analysis of the workshops aimed to discern whether the SIPI played a distinct role compared to the Myplan Viewer in supporting policy integration. Within the scope of this research and considering the spectrum of human actions involved in the policy-making process, we extended Underdal’s policy integration criteria [16] into five dimensions: issues, actors, perspectives, priorities, and consistency. These criteria signify that, in the policy input phase, comprehensive issues are identified, and diverse actors contribute their knowledge. Throughout the policy-making process, a variety of perspectives are employed to evaluate policy alternatives, and priorities are balanced among different subjects. As for the policy outcomes, we ensure consistency with legislation and coherence between policies. The adapted framework is illustrated in Figure 1. The subsequent section will present the qualitative analysis results corresponding to each criterion.
Criterion 1:
Identification of issues.
The interviews focusing on Dublin City highlighted how flood modelling helped participants identify a more comprehensive set of issues. The flood maps under different scenarios in the SIPI supported the identification of new flood-related issues. In the scenario where the flood extent increases (‘grey space increases’), such information helped participants to identify the specific type of land use that would be at risk of flooding. They also discussed new issues related to flood mitigation action, including public awareness, preparedness, the design of new development, and the cost of flood relief actions. In the scenario where flood extent could be decreased (‘green space increases’), flood modelling enhanced the participants’ confidence in selecting this scenario. Furthermore, it improved the participants’ awareness that green infrastructure alone plays a limited role. That is, it needs to be combined with other measures in order to be robust.
The interviews focusing on the Ballycullen area highlighted the usefulness of the overlay function and the importance of visualising the boundaries and scenarios of the study area. With the Myplan Viewer, users can also visualise a flood map, but they cannot see the boundaries of their interest area. With the SIPI, users can view a flood map and overlay it with the three development scenarios. Hence, the SIPI helped participants to easily identify the residential zones that are located within flood-prone areas in each scenario and to discuss their findings with more confidence. In addition to the overlay function, the modelling results helped participants to provisionally compare the impacts of the three development scenarios on flooding. After the initial comparison, the participants suggested pursuing a further flood risk assessment and requested additional information related to flooding.
Taking the findings in both study areas into account, we can conclude that with the support of the SIPI, the participants identified additional flood-related issues. In particular, the maps of development scenarios, the boundaries of the study areas, the overlay function, and the flood modelling results played a major role in the identification of new issues.
Criterion 2:
Actors—sharing of information and knowledge among actors.
For the scenarios in the Dublin City area, the SIPI played the same role as the Myplan Viewer in alerting participants to the existing flood risk, because both websites provide flood maps. As one participant said, ‘I think if I was an individual doing my house extension, useful to know, but I think Myplan [Viewer] would have given me much the same sort of red light or orange light’ (FG2-SIPI).
In addition to playing a role in identifying the existing flood risk, the SIPI also supported the comparison of the impact of the three scenarios on potential flood zones. In this comparison, the participants shared their interpretations regarding the flood modelling results. For example, some participants found that the SIPI modelling results supported their choice of the ‘green space increases’ scenario, as one stated the following: ‘So the grey space increase is not really changing the flood zones […], but increasing the green space is actually making quite a significant change’ (FG1-SIPI). At the same time, some participants questioned the benefit of green infrastructures; one participant stated the following: ‘So you’d be wondering then […] what are the benefits? Look, there’s loads of other benefits in terms of like road surface’ (PDG2-SIPI).
In the case of the Ballycullen study area, the SIPI allowed the participants to overlay the development scenarios with flood maps so that they could easily identify whether the planned development was within potential flood zones. The participants in both groups also applied the SIPI to compare the three scenarios and found that the differences among them in terms of flooding were not significant. When this information was revealed, the participants started to share their knowledge of the reasons why there were no significant differences:
[I]f the footprint of the building is going to be the same, instead of being two storeys it’s now four storeys or six storeys, from a flood risk point of view, it’s not making any difference. (FG2-SIPI)
Well, probably the streams have very little runoff at that stage because you’re really only having agriculture runoff where you’ve done the scenario. (PSG1-SIPI)
More importantly, the modelling result of the extent of flooding did not prevent them from considering flood-related issues. On the contrary, the participants proceeded to consider flood-related issues in the three scenarios in greater depth. For example, they shared their understanding of the relationship between the density of development and the percentage of permeable surface:
But at a high-density level surely you’d need more parking for a high-density development […] (PDG2-SIPI)
[L]ow density means […] you have the same number of units but you’ve bigger green spaces between them which will absorb water. (FG2-SIPI)
The findings indicated that the SIPI supported further information and knowledge sharing among actors. In particular, flood engineers were more active in sharing their knowledge in the SIPI sessions than in the Myplan Viewer sessions. In the interviews focused on scenarios in Dublin City, the participants shared their knowledge of the comprehensive flood risk management plan after using the SIPI. Moreover, flood engineers used this study area as an example to explain the structural measures conducted by the Office of Public Works (OPW), establishing a mutual understanding of the necessity of combining structural and green infrastructure measures. In the interviews focused on the Ballycullen area, after using the SIPI, flood engineers and other participants discussed the measurement of permeability and shared knowledge of cumulative effects. The participants gained a better idea of what information they would need later in order to support an alternative evaluation.
Criterion 3:
Perspectives—the SIPI facilitated the perspectives from which alternatives are evaluated.
In the discussion focused on the Dublin City area, all of the scenarios were evaluated based on their influences on flood hazard both with the Myplan Viewer and with the SIPI. The difference was that, after the participants used the SIPI, the issues identified from this perspective were supported with more details, such as the scale of the impact and the locations of affected areas. For example, after using Myplan Viewer, the participants commented that the grey scenario (S1) would increase flooding. After using the SIPI, the participants commented on the scale of such an increase. One participant said, ‘you can see it’s actually only small blocks of change really if you increase the green space by ten percent’ (RG2-SIPI). Also, the participants discussed where the impact could be and who might be affected: ‘it just reduces it slightly around […] Templeogue […] or Bushy Par’ (PDG2-SIPI) and ‘increased flooding of some local roads, property parks, institutional lands’ (PDG1-SIPI).
For this study area, however, issues from the other perspective, i.e., the perspective that flooding influences planning, were identified only for the ‘grey space increases’ scenario when the participants used the Myplan Viewer. They recognised that flood relief measures would be required for this scenario: ‘They need to fund flood relief or flood protection measures in the local area and further downstream’ (PDG1-Myplan). After using the SIPI, issues from this perspective were added to all three scenarios (Table 3). For the ‘grey space increases’ and ‘no land cover changes’ scenarios, the participants noted that the existing risk of flooding is huge: ‘See, if you look around the Shelbourne and Lansdowne Road [working on the computer]. Look at the risk. It’s huge’ (FG1-SIPI). For the ‘green space increases’ scenario, the participants said that the flood risk would not decrease very much: ‘It’s not just greening space or yeah, so I think that you have to have a very good plan in place […] because it affects so much residential area […]’ (RG1-SIPI).
In the workshops regarding the Ballycullen study areas, with the aid of the SIPI, more issues related to the three scenarios were added, and they enhanced the aggregation of the two perspectives. From the perspective that flooding impacts planning, after using the SIPI, the participants recognised that the Ballycullen area intersects with flood-prone areas in the preliminary flood map from OPW but not in the final flood map provided during the National Catchment-based Flood Risk Assessment and Management (CFRAM) Programme. Thus, they concluded that a further flood risk assessment should be performed by the local authority. From the perspective that the planning of development influences flood features, the participants exhibited a more in-depth understanding of the extent of this influence and its cumulative effects after they used the SIPI.
In summary, the analysis of perspectives in the guided discussions showed that the aggregation of perspectives was improved with the aid of the SIPI. The participants in the discussion, who were also important players in the planning process, all considered the scenarios from the perspective of flooding. After the use of the SIPI, their evaluation of the scenarios was more thorough regarding strengths and weaknesses and the two-way interplay between flooding and spatial planning.
Criterion 4:
Priority—the priority given to considerations of flooding.
In the discussions facilitated by the use of the Myplan Viewer, all participants gave flood-related issues good consideration. In general, the flood experts and residents gave a higher priority to flood concerns than the planners. The planners gave relatively equal priority to flooding and other broad perspectives, such as transportation, infrastructure, environment, housing, economy and development, culture, design, landscape, community satisfaction, and climate change. In the discussions facilitated by the use of the SIPI, the residents gave lower priority to flood considerations after seeing that the differences between the scenarios were small, whereas the planners and flood engineers did not change their priorities in selecting the preferred scenario but became more confident in their decisions.
However, although some participants decreased the priority they gave to flood consideration after using the SIPI, the weight they gave to flood consideration increased after a discussion with the other participants. For example, one resident said before using the SIPI that ‘[Green-space-increase is the best], of course, for the future. I mean you have to. There is no choice I think’ (RG1-Myplan). After seeing the flood maps for the three scenarios, this participant thought the differences were very small: ‘it looks like [it] isn’t […] [an] emergency’ (RG1-SIPI). A flood engineer in this group disagreed with this perception of what constitutes an emergency regarding a flood-related issue because a one-in-one-hundred-year flood could actually happen during the mortgage period, consequently impacting house insurance. This flood engineer said, ‘if […] you live to seventy-five, you’ve got a one-in-two chance of that actual scenario happening if you stay in the same property’ (FG1-SIPI). Finally, the resident agreed and said, ‘We have the problem already. […] They won’t insure us for flood damage now’ (RG1-SIPI).
Regarding the criterion of priority, the role of the SIPI was not conclusive. The SIPI played a positive role in supporting a balanced priority setting in these group discussions, but that might not have occurred without the involvement of flood experts or someone with a particular interest in flood issues. For residents and some planners who did not have sound knowledge of or a strong interest in flooding, sharing the SIPI modelling results could have the opposite effect. When the modelling results showed significant differences among the scenarios, these participants were likely to give flooding a higher priority. However, when the differences among scenarios were not significant, these participants, if using the SIPI without consulting others, were likely to downgrade the priority of flood-related issues.
Criterion 5:
Consistency—the consistency of the policy outcome with legislation.
In this experimental policy-making practice, the outcome can be understood as the group’s choice of a preferable scenario of land cover changes (in the lower catchment) or the density for new development (in the upper catchment).
In the Dublin City area, a large area was at risk of being flooded. To be consistent with the Planning and Development Act (2000), the selection of the scenarios in this area ought to be consistent with the goal of ‘regulating, restricting or controlling development in areas at risk of flooding’. Hence, both the ‘no land cover change’ and ‘green space increases’ scenarios would be consistent with the legislation. After using the Myplan Viewer, Group 1 and Group 2 agreed that they would not seek a decrease in green space in the first instance and then seek a marginal increase. After using the SIPI, the participants did not change their choices, but confirmed them. The comparison of the scenarios validated their earlier decisions and gave them more confidence.
The Ballycullen area is located outside of flood-prone areas. The flood-related requirement in the Planning and Development Act (2000) focuses on the area with flood risk. None of the three scenarios introduced development in the flood-prone area; thus, they were all consistent with the flood-related policies. However, in the regional and county development plans, the Ballycullen area was zoned as a residential area for new development. Hence, ‘low-density development’ and ‘high-density development’ are more consistent with higher-level policies than ‘no new development’. After using the Myplan Viewer, Group 1 preferred the ‘high-density development scenario’ with the addition of a Sustainable Drainage System (SuDS) measure to control flooding. The participants in Group 2 thought that a development scenario somewhere in between low density and high density would be the best. After using the SIPI, both groups became more cautious about selecting the scenarios. They asked for more information, including the time span for the cumulative effect of ongoing development, parking details, and the necessity of sewage information to be included in the model. This newfound caution reflected that the participants had a clearer understanding of what information they needed in order to make their decisions more reliable and more consistent with flood regulation and policies.
The scenarios selected by the groups were consistent with the requirements of flood regulation and higher-level policy in both the Myplan Viewer and SIPI sessions. The policy outcome emerged from the trade-off between multiple perspectives and the setting of priorities. The role of the SIPI in these two specific tasks of policy making was to confirm and verify that the policy outcome was consistent with the flood objectives.
To summarise the findings on the role of the SIPI according to all criteria, the SIPI improved the overall degree of policy integration. Specifically, the SIPI played a larger role than the Myplan Viewer in integrating the criteria of issues, actors, and perspectives. The interviews involved four groups of actors and allowed free communication among them. Under such conditions, the participants gave flood considerations higher priority after using the SIPI, but there is a risk that participants would give less priority to flooding without the opportunity to interact and communicate with one another. In terms of consistency, the SIPI played the same role as the Myplan Viewer in confirming policy consistency. The role of the SIPI revealed in this section was based on the analysis of the researcher. The findings were then triangulated with a questionnaire analysis which indicated how the participants perceived the role of the SIPI.

4. Results

Before examining the difference between the SIPI and MyPlan in contributing to policy integration and related human actions, it was necessary to confirm that neither the participants’ characteristics nor the topics they discussed changed the findings. Therefore, T-tests were applied to examine whether the mean values of Group 1’s answers to the questions were significantly different from the mean values of the answers given by Group 2. The overall T-test, which compared the overall mean value of 24 questions of Group 1 with that of Group 2, showed a p-value of 0.143, which is greater than 0.05. This result confirmed that the two groups were comparable.
Then, the data were regrouped according to the topics (study areas). A T-test was also applied to examine whether the mean values from the interviews focused on the Dublin City area were significantly different from the mean values from those focused on the Ballycullen area. The results showed that similarities were very high for most of the questions with 95% significance (Appendix A). Hence, it was reasonable to aggregate the data from the two groups and for the two topics, and thus, the sample size was sixteen. The responses to the questions related to the SIPI were compared to the responses to the questions related to the Myplan Viewer to answer the two research questions.
Hypothesis 1.
The SIPI with decision support/modelling tools is more effective than the Myplan Viewer in supporting policy integration.
The twelve questions related to policy-making stages were grouped according to the specific stage to which they related: input, process, or outcome. This subsection presents the results of the analysis and answers the following question: was the SIPI more effective in supporting policy making in these stages than the Myplan Viewer? The question was answered by conducting a T-test on the mean values of the responses to the SIPI and the mean values of the responses to the Myplan Viewer.
An analysis of the data related to policy input, the policy-making process, and policy outcomes revealed that the mean values of responses for the SIPI were greater than those for the Myplan Viewer for all of the variables of interest (Table 3). The results indicated that the participants agreed that the SIPI supported their activities in all policy-making stages, whilst they somewhat agreed that the Myplan Viewer supported policy making. The overall mean value of the scores for the SIPI was significantly higher than that for the Myplan Viewer. This result indicated that, at this particular topic, the SIPI might be more effective than the Myplan Viewer in facilitating policy making in all stages. In order to be confident with this conclusion, a t-test was conducted to compare the mean value of the responses to each question regarding the SIPI and Myplan Viewer.
The results showed that in the questions related to policy input, the significance level for the difference between the SIPI and Myplan Viewer varied. The participants agreed that both the Myplan Viewer and SIPI provided access to trustworthy information related to the site context (Q1, Q3, and Q5). However, for this function, the participants did not report significant differences between the SIPI and Myplan Viewer. Regarding the sufficiency of information for evaluating the scenarios and the influence on the initial opinions of the scenarios (Q2 and Q4), the participants neither agreed nor disagreed that the Myplan Viewer played a role (mean values were 3 and 3.06). The participants agreed that the SIPI was more helpful than the Myplan Viewer in helping them to evaluate and modify their initial opinions of the development scenarios.
In the questions related to the policy-making process and in support of the outcome, the SIPI received average scores greater than 4, while the Myplan Viewer received average scores lower than 3.5. The differences between the SIPI and Myplan Viewer were significant at the 95% confidence level, except for the ‘supports the trade-off process’ variable (Q6), which was significant at the 90% confidence level. The higher average score for the SIPI suggested that the SIPI could be more effective than the Myplan Viewer in supporting aggregation in the process and policy consistency in the outcome. This test confirmed that the additional functionality of the SIPI, such as its capability to model diverse planning scenarios and simulate flooding, made more of a difference than the Myplan Viewer.
Hypothesis 2.
SIPI with decision support/modelling tools is more effective than Myplan Viewer in supporting communicative actions.
The twelve questions were then grouped according to the types of actions to which they related. Analysing the mean values of the responses to these questions revealed that the participants gave the SIPI average scores higher than 4 in the questions related to instrumental, strategic, and communicative actions (mean values of 4.16, 4.01, and 4.02). This result indicated that the participants agreed that the SIPI supported all types of actions in policy making. In contrast, the participants only somewhat agreed that the Myplan Viewer supported such actions. It can be concluded that the participants perceived the SIPI as being more useful than the Myplan Viewer in supporting the three types of actions. To test this conclusion, a T-test on the mean value for each variable was conducted to compare the SIPI and Myplan Viewer.
The T-test results showed that, in questions related to instrumental action, the average mean values for the SIPI were significantly higher than those for the Myplan Viewer (the mean for the SIPI was 4.16, and the mean for the Myplan Viewer was 3.51). Specifically, in two out of five questions (Q2 and Q10), the scores for the SIPI were significantly higher than those for the Myplan Viewer. However, the differences were not significant for the other three questions (Q1, Q3, and Q6). The results indicated that the participants agreed that the SIPI supported their overall instrumental actions. However, they felt that the SIPI was not more effective than the Myplan Viewer in supporting access to information on context.
For almost all of the questions related to strategic actions, the SIPI received average scores greater than 4. The exception was the ‘modifies initial opinion’ question (Q4). These results suggest that the participants agreed that the SIPI was useful in conducting strategic actions, such as expressing their views and understanding others’ opinions, but they felt that it had a relatively low impact on the results of strategic action, i.e., on changing people’s opinions. However, the SIPI still outperformed the Myplan Viewer in supporting all types of strategic actions, with significance at the 95% confidence level.
Regarding communicative actions, the participants agreed that the SIPI helped them to gain new knowledge (Q9) and to increase flood awareness (Q12), but they agreed to a lesser degree that the SIPI gained their trust (Q5). Compared to the Myplan Viewer, the SIPI received significantly higher scores for Q9 and Q12, but there was no significant difference for Q5. These results showed that, overall, the SIPI supported communicative actions, but in terms of gaining trust on the information provided by the infrastructure, its function and performance were not different from those of the Myplan Viewer.
In summary, the results presented above statistically confirmed that both of the hypotheses were validated in this experiment. With the additional functionality of decision support and modelling tools, the SIPI prototype was more effective in supporting policy integration and all three types of human actions than the Myplan Viewer.

5. Discussion and Conclusions

Schuurman [24] proposed that GIS data and information could serve asan “integration medium”. However, this research expands on that notion by demonstrating that a data-focused SDI alone has limited efficacy in fulfilling this role. In contrast, the inclusion of decision support and modelling tools enhances its effectiveness as an “integration medium”. As observed in this study, an information infrastructure incorporating decision support and modelling tools, the SIPI, proves more advantageous for supporting policy integration, particularly in terms of aggregating diverse perspectives and reconciling conflicting interests.
The disparity between the SIPI and generic data-focused SDIs primarily stems from the distinction between maps and tools. Maps merely present analysis outcomes with predetermined priority settings, allowing minimal input from map consumers to tailor the maps to their specific needs. In contrast, decision support and modelling tools offer interactive options for users to input their own information and engage in discussions and trade-offs among policy alternatives. Consequently, while data-focused SDIs primarily focus on policy input and outcomes, decision support and modelling tools possess the additional functionality of facilitating aggregation within the policy-making process.
Our findings concerning the Myplan Viewer demonstrated that data-focused SDIs support the comprehensiveness of policy input and the consistency of outcomes by providing easy access to information related to flooding and the site context, primarily involving instrumental human actions. However, these SDIs prove less effective in facilitating knowledge sharing, aggregating perspectives, and setting priorities. The overall perceived functionality of the Myplan Viewer in terms of policy integration was deemed unsatisfactory. This finding aligns with Smith et al.’s conclusion [52] that while SDIs may support instrumental goals, they are inadequate in facilitating trade-offs and balancing diverse interests within the policy-making process.
In Smith et al.’s research [52], stakeholders indicated that they would use such tools to reduce the dialogue between actors, as one of their informants said, ‘if they’re getting lots and lots of [planning] applications in, they don’t want to have to come to EPA(Environmental Protection Agency) every time and ask, […] We want to be able to share that information with them so that they can just look it up’. This finding raised a concern that such SDIs will eventually replace the dialogue between actors. Our research does not argue against the important role of face-to-face discussions, but it looks at the potential for SDIs with additional functionality, namely decision support and modelling tools, to carry the capacity to support policy integration. Also, we are aware that there are many other dynamics related to human actions that could not be captured by the survey. Our present work agrees that opportunities for communicative actions are crucial for policy integration, and in particular, for the aggregation of policy alternatives. However, we found that dialogue focusing on the goal of collecting data serves instrumental actions and does not represent the kind of communicative action required for policy integration. A valuable discussion or dialogue for policy integration should focus on strategic and communicative purposes, such as sharing knowledge of the problems, exchanging different perspectives to evaluate policy alternatives, and deliberating the settings of priorities for each perspective. These real communicative actions were impeded by the lack of GIT resources in the Irish context. Hence, replacing the time-consuming dialogue for data collection with efficient data access is not harmful for policy integration. In fact, some researchers have indicated that efficient data collection and data access were potentially useful for communication and building consensus [53,54,55].
Valuable dialogue for policy integration is conducted for strategic and communicative purposes. More specifically, it is important to create opportunities for in-depth dialogue focusing on knowledge, policy alternatives, perspectives, and priorities [56]. Such communication opportunities are commonly considered the core element of public consultation or workshops with strategic stakeholders in the policy-making process [57,58]. It would be valuable to save time discussing or explaining data in these meetings and workshops so that more time would be left for meaningful discursive interactions.
The findings in this paper are also aligned with those of other studies and projects in the field of SDI and planning, which emphasises the value of the process of developing SDIs rather than the products of SDIs [59,60]. For example, Jacoby and Smith conducted an empirical study of an SDI for the local government in Australia and suggested that the development of this kind of SDI resulted in increased coordination among local government authorities and between local and state governments [61]. The present paper contributes to the evolution of SDIs by showing evidence that SDIs with additional modelling and decision support functions are more effective in facilitating policy integration, particularly in supporting strategic and communicative actions. However, additional empirical studies and theoretical discussion regarding the differences between maps and decision support and modelling tools would be helpful to make this knowledge more robust.

Author Contributions

All authors made valuable contributions to this paper. Conceptualisation and methodology, Jing Ran and Zorica Nedovic-Budic; platform development, visualisation, interview, and data analysis, Jing Ran; resources, Jing Ran and Zorica Nedovic-Budic; writing—original draft preparation, Jing Ran; writing—review and editing, Zorica Nedovic-Budic; funding acquisition, Jing Ran and Zorica Nedovic-Budic All authors have read and agreed to the published version of the manuscript.

Funding

This research was funded by the Higher Education Authority of Ireland and co-funded by the European Regional Development Fund (ECO3); it was also funded by the Natural Science Foundation of Hunan Province, funding numbers 2022JJ40076 and 2022JJ30149, and the High-end Foreign Experts Recruitment Plan of China, funding number G2022160005L.

Data Availability Statement

Data are contained within the article.

Conflicts of Interest

The authors declare no conflicts of interest.

Appendix A

t-test on the differences between the topics of discussion (Dublin City and Ballycullen areas).
CodeQuestionsMean for
Dublin City
(N = 8)
Mean for Ballycullen
(N = 8)
p-ValueSignificantly Different?
MP_Q1Myplan Viewer provides sufficient information for me to understand the context/geography4.1253.50.140NO
MP_Q2Myplan Viewer provides sufficient information for me to evaluate the development scenarios3.1252.8750.626NO
MP_Q3I can access data easily via Myplan Viewer43.6250.080NO
MP_Q4I trust the information provided by Myplan Viewer 3.53.6250.785NO
MP_Q5Information I reviewed on Myplan Viewer modifies my initial view of the scenarios3.12530.802NO
MP_Q6Myplan Viewer supports me to balance the pros and cons of each scenario3.6253.750.836NO
MP_Q7Myplan Viewer facilitates me in expressing my view in the group3.53.6250.685NO
MP_Q8Myplan Viewer helps me understand other group members’ opinion3.253.750.381NO
MP_Q9Myplan Viewer helps me gain new knowledge of how land use change can influence the extent of flooding32.8750.763NO
MP_Q10Myplan Viewer helps me overlay/integrate data and information on the screen3.530.275NO
MP_Q11Myplan Viewer helps me to identify potential flood-related issues that each scenario may cause beyond the case area (plan lands)32.8750.815NO
MP_Q12Myplan Viewer increases my awareness of flood-related issues 3.753.1250.095NO
SIPI_Q1SIPI provides sufficient information for me to understand the context/geography4.3753.750.049YES **
SIPI_Q2SIPI provides sufficient information for me to evaluate the development scenarios4.2540.516NO
SIPI_Q3I can access data easily via SIPI3.8754.1250.451NO
SIPI_Q4I trust the information provided by SIPI3.6253.6251.000NO
SIPI_Q5Information I reviewed on SIPI modifies my initial view of the scenarios3.8753.3750.381NO
SIPI_Q6SIPI helps me to balance the pros and cons of each scenario4.53.750.111NO
SIPI_Q7SIPI facilitates me in expressing my view in the group4.540.104NO
SIPI_Q8SIPI helps me understand other group members’ opinion4.253.8750.351NO
SIPI_Q9SIPI helps me gain new knowledge of how land use changes can influence the extent of flooding4.3754.1250.563NO
SIPI_Q10SIPI helps me overlay/integrate data and information on the screen4.54.51NO
SIPI_Q11SIPI helps me to identify potential flood-related issues that each scenario may cause beyond the case area (plan lands)4.6253.6250.050NO
SIPI_Q12SIPI increases my awareness of flood-related issues4.6253.750.041YES **
Note: ** significant with 95% confidence.

References

  1. Hsieh, L.-S.; Hsu, M.-H.; Li, M.-H. An Assessment of Structural Measures for Flood-prone Lowlands with High Population Density along the Keelung River in Taiwan. Nat. Hazards 2006, 37, 133–152. [Google Scholar] [CrossRef]
  2. Juergen, W. Disaster mitigation: The concept of vulnerability revisited. Disaster Prev. Manag. Int. J. 2001, 10, 85–95. [Google Scholar]
  3. Howe, J.; White, I. Like a fish out of water: The relationship between planning and flood risk management in the UK. Plan. Pract. Res. 2004, 19, 415–425. [Google Scholar] [CrossRef]
  4. Khailani, D.K.; Perera, R. Mainstreaming disaster resilience attributes in local development plans for the adaptation to climate change induced flooding: A study based on the local plan of Shah Alam City, Malaysia. Land Use Policy 2013, 30, 615–627. [Google Scholar] [CrossRef]
  5. Neuvel, J.M.M.; Van Den Brink, A. Flood risk management in Dutch local spatial planning practices. J. Environ. Plan. Manag. 2009, 52, 865–880. [Google Scholar] [CrossRef]
  6. Stead, D.; Meijers, E. Spatial planning and policy integration: Concepts, facilitators and inhibitors. Plan. Theory Pract. 2009, 10, 317–332. [Google Scholar] [CrossRef]
  7. White, I.; Richards, J. Planning policy and flood risk: The translation of national guidance into local policy. Plan. Pract. Res. 2007, 22, 513–534. [Google Scholar] [CrossRef]
  8. De Moel, H.; Van Alphen, J.; Aerts, J.C.J.H. Flood maps in Europe—Methods, availability and use. Nat. Hazards Earth Syst. Sci. 2009, 9, 289–301. [Google Scholar] [CrossRef]
  9. Sutanta, H.; Rajabifard, A.; Bishop, I.D. An integrated approach for disaster risk Reduction using spatial planning and SDI Platform. In Proceedings of the Surveying & Spatial Sciences Institute Biennial International Conference, Adelaide, Australia, 28 September–2 October 2009; Surveying & Spatial Sciences Institute: Canberra, Australia, 2009. [Google Scholar]
  10. Pettit, C.J. Use of a Collaborative GIS-Based Planning-Support System to Assist in Formulating a Sustainable-Development Scenario for Hervey Bay, Australia. Environ. Plan. B Plan. Des. 2005, 32, 523–545. [Google Scholar] [CrossRef]
  11. Dams, J.; Woldeamlak, S.T.; Batelaan, O. Predicting land-use change and its impact on the groundwater system of the Kleine Nete catchment, Belgium. Hydrol. Earth Syst. Sci. 2008, 12, 1369–1385. [Google Scholar] [CrossRef]
  12. Choi, W.; Deal, B.M. Assessing hydrological impact of potential land use change through hydrological and land use change modeling for the Kishwaukee River basin (USA). J. Environ. Manag. 2008, 88, 1119–1130. [Google Scholar] [CrossRef] [PubMed]
  13. Xu, Y.; Xu, J.; Ding, J.; Chen, Y.; Yin, Y.; Zhang, X. Impacts of urbanization on hydrology in the Yangtze River Delta, China. Water Sci. Technol. 2010, 62, 1221–1229. [Google Scholar]
  14. Hutter, G. Strategic Planning for Long-Term Flood Risk Management: Some Suggestions for Learning How to Make Strategy at Regional and Local Level. Int. Plan. Stud. 2007, 12, 273–289. [Google Scholar] [CrossRef]
  15. Mickwitz, P.; Kivimaa, P. Evaluating policy integration: The case of policies for environmentally friendlier technological innovations. Evaluation 2007, 13, 68–86. [Google Scholar] [CrossRef]
  16. Underdal, A. Integrated marine policy: What? why? how? Mar. Policy 1980, 4, 159–169. [Google Scholar] [CrossRef]
  17. Van Oosterzee, P.; Dale, A.; Preece, N.D. Integrating agriculture and climate change mitigation at landscape scale: Implications from an Australian case study. Glob. Environ. Chang. 2013, 29, 306–317. [Google Scholar] [CrossRef]
  18. Djalante, R.; Holley, C.; Thomalla, F.; Carnegie, M. Pathways for adaptive and integrated disaster resilience. Nat. Hazards 2013, 69, 2105–2135. [Google Scholar] [CrossRef]
  19. Olazabal, M.; Urzelai, A.; García, G.; Herranz-Pascual, K.; Abajo, B.; Feliú, E.; Santa-Coloma, O.; Aspuru, I. Sustainable spatial management: An integrated approach. Proc. Inst. Civ. Eng. Munic. Eng. 2010, 163, 33–41. [Google Scholar] [CrossRef]
  20. Maguire, D.J.; Longley, P.A. The emergence of geoportals and their role in spatial data infrastructures. Comput. Environ. Urban Syst. 2005, 29, 3–14. [Google Scholar] [CrossRef]
  21. Budhathoki, N.R.; Bruce, B.; Nedovic-Budic, Z. Reconceptualizing the role of the user of spatial data infrastructure. GeoJournal 2008, 72, 149–160. [Google Scholar] [CrossRef]
  22. Abramic, A.; Bigagli, E.; Barale, V.; Assouline, M.; Lorenzo-Alonso, A.; Norton, C. Maritime spatial planning supported by infrastructure for spatial information in Europe (INSPIRE). Ocean Coast. Manag. 2018, 152, 23–36. [Google Scholar] [CrossRef]
  23. Marasović, S.; Crompvoets, J.; Poslončec-Petrić, V. State and development of local spatial data infrastructures in Croatia. J. Spat. Sci. 2019, 64, 405–422. [Google Scholar] [CrossRef]
  24. Schuurman, N. The ghost in the machine: Spatial data, information and knowledge in GIS. Can. Geogr. 2003, 47, 1–4. [Google Scholar] [CrossRef]
  25. Roche, S.; Sureau, K.; Caron, C. How to improve the social utility value of geographic information systems for French local governments? A Delphi study. Environ. Plan. B Plan. Des. 2003, 30, 429–447. [Google Scholar] [CrossRef]
  26. Roose, A.; Kull, A. Empowering spatial information in the evolution of planning systems: Lessons of ad-hoc pans in Estonia. Reg. Stud. 2012, 46, 493–508. [Google Scholar] [CrossRef]
  27. Fabbro, S.; Haselsberger, B. Spatial Planning Harmonisation as a Condition for Trans-National Cooperation. Eur. Plan. Stud. 2009, 17, 1335–1356. [Google Scholar] [CrossRef]
  28. Carey, J.M.; Beilin, R.; Boxshall, A.; Burgman, M.A.; Flander, L. Risk-based approaches to deal with uncertainty in a data-poor system: Stakeholder involvement in hazard identification for marine national parks and marine sanctuaries in Victoria, Australia. Risk Anal. 2007, 27, 271–281. [Google Scholar] [CrossRef] [PubMed]
  29. Borisova, T.; Racevskis, L.; Kipp, J. Stakeholder analysis of a collaborative watershed management process: A Florida case study. J. Am. Water Resour. Assoc. 2012, 48, 277–296. [Google Scholar] [CrossRef]
  30. Nedovic-Budic, Z.; Pinto, J.K.; Budhathoki, N.R. SDI Effectiveness from the User Perspective. In A Multi-View Framework to Assess Sptial Data Infrastructures; Crompvoets Joep, R.A., van Loenen, B., Tatiana, D.F., Eds.; The Melbourne University Press: Melbourne, Australia, 2008; pp. 273–303. [Google Scholar]
  31. Pelzer, P.; Geertman, S.; van der Heijden, R.; Rouwette, E. The added value of Planning Support Systems: A practitioner’s perspective. Comput. Environ. Urban Syst. 2014, 48, 16–27. [Google Scholar] [CrossRef]
  32. Kiehle, C.; Greve, K.; Heier, C. Standardized geoprocessing–taking spatial data infrastructures one step further. In Proceedings of the 9th AGILE International Conference on Geographic Information Science, Visegrád, Hungary, 20–22 April 2006. [Google Scholar]
  33. Steiniger, S.; Hunter, A.J.S. Free and Open Source GIS Software for Building a Spatial Data Infrastructure. In Geospatial Free and Open Source Software in the 21st Century: Proceedings of the First Open Source Geospatial Research Symposium, OGRS 2009; Bocher, E., Neteler, M., Eds.; Springer: Berlin/Heidelberg, Germany, 2012; pp. 247–261. [Google Scholar]
  34. Wang, S.; Anselin, L.; Bhaduri, B.; Crosby, C.; Goodchild, M.F.; Liu, Y.; Nyerges, T.L. CyberGIS software: A synthetic review and integration roadmap. Int. J. Geogr. Inf. Sci. 2013, 27, 2122–2145. [Google Scholar] [CrossRef]
  35. Li, S.; Veenendaal, B.; Dragicevic, S. Advances, challenges and future directions in web-based GIS, mapping services and applications. In Advances in WebGIS, Mapping Services, and Applications; Li, S., Veenendaal, B., Dragicevic, S., Eds.; Taylor and Francis: London, UK, 2011; pp. 3–12. [Google Scholar]
  36. Simão, A.; Densham, P.J.; Haklay, M. Web-based GIS for collaborative planning and public participation: An application to the strategic planning of wind farm sites. J. Environ. Manag. 2009, 90, 2027–2040. [Google Scholar] [CrossRef] [PubMed]
  37. Malczewski, J. GIS-based multicriteria decision analysis: A survey of the literature. Int. J. Geogr. Inf. Sci. 2006, 20, 703–726. [Google Scholar] [CrossRef]
  38. Boroushaki, S.; Malczewski, J. Measuring consensus for collaborative decision-making: A GIS-based approach. Comput. Environ. Urban Syst. 2010, 34, 322–332. [Google Scholar] [CrossRef]
  39. Boerboom, L.G.J. Integrating spatial planning and decision support system infrastructure and spatial data infrastructure. Int. J. Spat. Data Infrastruct. Res. 2013, 8, 1–21. [Google Scholar]
  40. Ran, J.; Nedovic-Budic, Z. Integrating spatial planning and flood risk management: A new conceptual framework for the spatially integrated policy infrastructure. Comput. Environ. Urban Syst. 2016, 57, 68–79. [Google Scholar] [CrossRef]
  41. Ran, J.; Nedovic-Budic, Z. Designing an Information Infrastructure for Policy Integration of Spatial Planning and Flood Risk Management. Int. J. E-Plan. Res. (IJEPR) 2018, 7, 53–85. [Google Scholar] [CrossRef]
  42. Nilsson, M.; Persson, Å. Framework for Analysing Environmental Policy Integration. J. Environ. Policy Plan. 2003, 5, 333–359. [Google Scholar] [CrossRef]
  43. Lafferty, W.M.; Hovden, E. Environmental policy integration: Towards an analytical framework. Environ. Politics 2003, 12, 1–22. [Google Scholar] [CrossRef]
  44. Ishii, A.; Langhelle, O. Toward policy integration: Assessing carbon capture and storage policies in Japan and Norway. Glob. Environ. Chang. 2011, 21, 358–367. [Google Scholar] [CrossRef]
  45. Habermas, J. The Theory of Communicative Action, Volume 1: Reason and the Rationalization of Society; Beacon Press: Boston, MA, USA, 1984. [Google Scholar]
  46. Klein, H.; Huynh, M. The critical social theory of Jürgen Habermas and its implications for IS research. In Social Theory and Philosophy for Information Systems; Mingers, J., Willcocks, L., Eds.; Willey: Hoboken, NJ, USA, 2004; pp. 157–237. [Google Scholar]
  47. Williamson, I.P.; Rajabifard, A.; Feeney, M.-E. Developing Spatial Data Infrastructures: From Concept to Reality; Taylor & Francis: New York, NY, USA, 2003. [Google Scholar]
  48. Eggenberger, M.; Partidário, M.R. Development of a framework to assist the integration of environmental, social and economic issues in spatial planning. Impact Assess. Proj. Apprais. 2000, 18, 201–207. [Google Scholar] [CrossRef]
  49. Matell, M.S.; Jacoby, J. Is there an optimal number of alternatives for Likert scale items? Study I: Reliability and validity. Educ. Psychol. Meas. 1971, 31, 657–674. [Google Scholar] [CrossRef]
  50. Dawes, J. Do data characteristics change according to the number of scale points used? An experiment using 5-point, 7-point and 10-point scales. Int. J. Mark. Res. 2008, 50, 61–104. [Google Scholar] [CrossRef]
  51. Allen, I.E.; Seaman, C.A. Likert scales and data analyses. Qual. Prog. 2007, 40, 64–65. [Google Scholar]
  52. Smith, H.M.; Wall, G.; Blackstock, K.L. The role of map-based environmental information in supporting integration between river basin planning and spatial planning. Environ. Sci. Policy 2013, 30, 81–89. [Google Scholar] [CrossRef]
  53. McCall, M.K. Seeking good governance in participatory-GIS: A review of processes and governance dimensions in applying GIS to participatory spatial planning. Habitat Int. 2003, 27, 549–573. [Google Scholar] [CrossRef]
  54. Margerum, R.D. Collaborative Planning: Building Consensus and Building a Distinct Model for Practice. J. Plan. Educ. Res. 2002, 21, 237–253. [Google Scholar] [CrossRef]
  55. Puri, S.K.; Sahay, S. Participation through communicative action: A case study of GIS for addressing land/water development in India. Inf. Technol. Dev. 2003, 10, 179–199. [Google Scholar] [CrossRef]
  56. Sheate, W.R.; Partidário, M.R. Strategic approaches and assessment techniques—Potential for knowledge brokerage towards sustainability. Environ. Impact Assess. Rev. 2010, 30, 278–288. [Google Scholar] [CrossRef]
  57. Few, R.; Brown, K.; Tompkins, E.L. Public participation and climate change adaptation: Avoiding the illusion of inclusion. Clim. Policy 2007, 7, 46–59. [Google Scholar] [CrossRef]
  58. Irvin, R.A.; Stansbury, J. Citizen Participation in Decision Making: Is It Worth the Effort? Public Adm. Rev. 2004, 64, 55–65. [Google Scholar] [CrossRef]
  59. Rajabifard, A.; Feeney, M.-E.F.; Williamson, I.P. Future directions for SDI development. Int. J. Appl. Earth Obs. Geoinf. 2002, 4, 11–22. [Google Scholar] [CrossRef]
  60. Rajabifard, A.; Williamson, I.P. Spatial Data Infrastructures: An initiative to facilitate spatial data sharing. In Global Environmental Databases Present Situation; Future Directions Volume 2; Tateishi, R., Hastings, D., Eds.; The ISPRS: Hannover, Germany, 2002. [Google Scholar]
  61. Jacoby, S.; Smith, J.; Ting, L.; Williamson, I. Developing a common spatial data infrastructure between State and Local Government—An Australian case study. Int. J. Geogr. Inf. Sci. 2002, 16, 305–322. [Google Scholar] [CrossRef]
Figure 1. The theoretical relationship among the components of data infrastructures, the criteria of policy integration, and types of human actions.
Ijgi 13 00053 g001
Table 1. Design of the experiment with four participatory workshops.
Topics of the WorkshopsParticipatory WorkshopsControl Session
(Facilitated by Myplan Viewer)
Experimental Session (Facilitated by SIPI Prototype)
Coverage of green space in Dublin City areaWorkshop 1Group 1 with Myplan Viewer Group 1 with SIPI
Workshop 3Group 2 with Myplan ViewerGroup 2 with SIPI
Development density in Ballycullen–Oldcourt areaWorkshop 2Group 1 with Myplan Viewer Group 1 with SIPI
Workshop 4Group 2 with Myplan ViewerGroup 2 with SIPI
Table 2. Statements in the questionnaire and analysis matrix to assess the role of Myplan Viewer and SIPI prototype in supporting policy integration and human actions.
Policy Integration
/Action
The Infrastructure Supports Instrumental ActionThe Infrastructure Supports Strategic ActionThe Infrastructure Supports Communicative Action
The infrastructure is useful for comprehensive policy InputQ1 [Myplan Viewer/SIPI] provides sufficient information for me to understand the context/geography
Q2 [Myplan Viewer/SIPI] provides sufficient information for me to evaluate the development scenarios
Q3 I can access data easily via [Myplan Viewer/SIPI]
Q4 Information I reviewed on [Myplan Viewer/SIPI] modifies my initial view of the scenariosQ5 I trust the information provided by [Myplan Viewer/SIPI]
The infrastructure is supporting policy-making processQ6 [Myplan Viewer/SIPI] supports me to balance the pros and cons of each scenarioQ7 [Myplan Viewer/SIPI] facilitates me in expressing my view in the group
Q8 [Myplan Viewer/SIPI] helps me to understand other group members’ opinion
Q9 [Myplan Viewer/SIPI] helps me gain new knowledge of how land use change can influence the extent of flooding
The infrastructure is helpful for generating consistent policy outcomesQ10 [Myplan Viewer/SIPI] helps me to overlay/integrate data and information on the screenQ11 [Myplan Viewer/SIPI] helps me to identify potential flood issues that each scenario may cause beyond the case area (plan lands)Q12 [Myplan Viewer/SIPI] increases my awareness of flood issues
Note: In the section for Myplan Viewer, the word in the square bracket is Myplan Viewer; in the section for SIPI, the word in the square bracket is SIPI. In the questionnaire, there were 5 additional questions about the design and usage of the infrastructures (5 for SIPI and 5 for Myplan Viewer), which are not shown in this table.
Table 3. T-test on the differences between Myplan Viewer and SIPI in supporting policy integration and human actions.
Policy MakingQuestionMean for Myplan Viewer
(N = 16)
Mean for SIPI
(N = 16)
p-ValueSignificantly Different?Human
Actions
Input:
Comprehensiveness
Q1: Provides information on context3.814.060.215NOInstrumental
Q2: Provides information for evaluation3.004.130.000YES ***Instrumental
Q3: Provides easy access to data3.874.000.167NOInstrumental
Q4: Modifies initial opinions3.063.630.033YES **Strategic
Q5: Provides trustworthy information3.603.670.733NOCommunicative
Process: AggregationQ6: Supports the trade-off process3.694.130.067YES *Instrumental
Q7: Helps to express views3.564.250.001YES ***Strategic
Q8: Helps to understand others’ views3.504.060.011YES **Strategic
Q9: Helps to gain knowledge2.944.250.000YES ***Communicative
Outcome: ConsistencyQ10: Helps to overlay information3.254.500.000YES ***Instrumental
Q11: Helps to identify flood areas2.944.130.001YES ***Strategic
Q12: Increases awareness of flooding3.444.190.005YES ***Communicative
Note: * Significant with 90% confidence; ** significant with 95% confidence; *** significant with 99% confidence.
Disclaimer/Publisher’s Note: The statements, opinions and data contained in all publications are solely those of the individual author(s) and contributor(s) and not of MDPI and/or the editor(s). MDPI and/or the editor(s) disclaim responsibility for any injury to people or property resulting from any ideas, methods, instructions or products referred to in the content.

