Next Issue
Volume 11, June
Previous Issue
Volume 11, April


ISPRS Int. J. Geo-Inf., Volume 11, Issue 5 (May 2022) – 52 articles

Cover Story (view full-size image): 
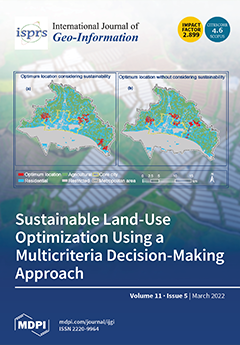
There are many approaches and methods that can be implemented to optimize urban land-use allocation. However, the focus on addressing urban sustainability in land-use optimization is very limited. In this study, we presented a GIS-based multicriteria decision-making (GIS-MCDM) approach to optimize the location of a new residential development by considering sustainability dimensions (social, economic, and environmental benefits). Rajshahi City in Bangladesh was taken as a case study. The findings suggest that about 9.00% more sustainability benefits can be achieved using our approach. Using our proposed approach, we also generated six alternative decision scenarios. Among the alternative decision strategies, “high risk–no trade-off” proved to be the most optimal decision strategy that generated the highest sustainability benefit in our case. View this paper
  • Issues are regarded as officially published after their release is announced to the table of contents alert mailing list.
  • You may sign up for e-mail alerts to receive table of contents of newly released issues.
  • PDF is the official format for papers published in both, html and pdf forms. To view the papers in pdf format, click on the "PDF Full-text" link, and use the free Adobe Reader to open them.
Order results
Result details
Select all
Export citation of selected articles as:
27 pages, 5210 KiB  
Article
County-Level Assessment of Vulnerability to COVID-19 in Alabama
by Souleymane Fall, Ehsan Abdalla, Joseph Quansah, Meghan J. Franklin and Timmera Whaley-Omidire
ISPRS Int. J. Geo-Inf. 2022, 11(5), 320; https://doi.org/10.3390/ijgi11050320 - 23 May 2022
Cited by 5 | Viewed by 2563
Abstract
The COVID-19 pandemic has posed an unprecedented challenge to public health across the world and has further exposed health disparities and the vulnerability of marginal groups. Since the pandemic has exhibited marked regional differences, it is necessary to better understand the levels of [...] Read more.
The COVID-19 pandemic has posed an unprecedented challenge to public health across the world and has further exposed health disparities and the vulnerability of marginal groups. Since the pandemic has exhibited marked regional differences, it is necessary to better understand the levels of vulnerability to the disease at local levels and provide policymakers with additional tools that will allow them to develop finely targeted policies. In this study, we develop for the State of Alabama (USA) a composite vulnerability index at county level that can be used as a tool that will help in the management of the pandemic. Twenty-four indicators were assigned to the following three categories: exposure, sensitivity, and adaptive capacity. The resulting subindices were aggregated into a composite index that depicts the vulnerability to COVID-19. A multivariate analysis was used to assign factor loadings and weights to indicators, and the results were mapped using Geographic Information Systems. The vulnerability index captured health disparities very well. Many of the most vulnerable counties were found in the Alabama Black Belt region. A deconstruction of the overall index and subindices allowed the development of individual county profiles and the detection of local strengths and weaknesses. We expect the model developed in this study to be an efficient planning tool for decision-makers. Full article
Show Figures

Figure 1

18 pages, 8929 KiB  
Article
Research on Three-Dimensional Electronic Navigation Chart Hybrid Spatial Index Structure Based on Quadtree and R-Tree
by Yunong Zhang, Anmin Zhang, Miao Gao and Yi Liang
ISPRS Int. J. Geo-Inf. 2022, 11(5), 319; https://doi.org/10.3390/ijgi11050319 - 23 May 2022
Cited by 5 | Viewed by 1992
Abstract
The three-dimensional (3D) visualization of the electronic navigation chart (ENC) can reflect the marine environment and various marine features truly, accurately, and directly, to reduce misoperation during chart use and improve the convenience of using the chart. Due to a large amount of [...] Read more.
The three-dimensional (3D) visualization of the electronic navigation chart (ENC) can reflect the marine environment and various marine features truly, accurately, and directly, to reduce misoperation during chart use and improve the convenience of using the chart. Due to a large amount of ENC data, complex data structure, and uneven distribution in 3D space, the construction and real-time rendering of 3D ENCs depend on the retrieval speed of 3D spatial data. Improving the spatial retrieval efficiency of 3D ENC data is helpful for the rapid rendering of a 3D scene. In this paper, based on the S-100 universal hydrological data model (S-100) and the 3D characteristics to classify the ENC features and create the 3D ENC data set, a hybrid spatial index structure is proposed based on quadtree and R-tree and ENC features data structure, using the smallest minimum bounding box (SMBB) and classification retrieval methods to optimize the spatial index structure. All the ENC features are rendered in a 3D marine scene. By analyzing the overlap of ENC features and testing the efficiency of spatial index structure, the results show that this method can effectively reduce the overlap rate of index nodes and improve the efficiency of data retrieval, realize the effective management of 3D ENC data, and improve the drawing speed of 3D ENCs. Full article
Show Figures

Figure 1

26 pages, 4367 KiB  
Article
Organizational Geosocial Network: A Graph Machine Learning Approach Integrating Geographic and Public Policy Information for Studying the Development of Social Organizations in China
by Xinjie Zhao, Shiyun Wang and Hao Wang
ISPRS Int. J. Geo-Inf. 2022, 11(5), 318; https://doi.org/10.3390/ijgi11050318 - 23 May 2022
Cited by 5 | Viewed by 2419
Abstract
This study aims to give an insight into the development trends and patterns of social organizations (SOs) in China from the perspective of network science integrating geography and public policy information embedded in the network structure. Firstly, we constructed a first-of-its-kind database which [...] Read more.
This study aims to give an insight into the development trends and patterns of social organizations (SOs) in China from the perspective of network science integrating geography and public policy information embedded in the network structure. Firstly, we constructed a first-of-its-kind database which encompasses almost all social organizations established in China throughout the past decade. Secondly, we proposed four basic structures to represent the homogeneous and heterogeneous networks between social organizations and related social entities, such as government administrations and community members. Then, we pioneered the application of graph models to the field of organizations and embedded the Organizational Geosocial Network (OGN) into a low-dimensional representation of the social entities and relations while preserving their semantic meaning. Finally, we applied advanced graph deep learning methods, such as graph attention networks (GAT) and graph convolutional networks (GCN), to perform exploratory classification tasks by training models with county-level OGNs dataset and make predictions of which geographic region the county-level OGN belongs to. The experiment proves that different regions possess a variety of development patterns and economic structures where local social organizations are embedded, thus forming differential OGN structures, which can be sensed by graph machine learning algorithms and make relatively accurate predictions. To the best of our knowledge, this is the first application of graph deep learning to the construction and representation learning of geosocial network models of social organizations, which has certain reference significance for research in related fields. Full article
Show Figures

Figure 1

15 pages, 7238 KiB  
Article
An Improved Ant Colony Algorithm for Urban Bus Network Optimization Based on Existing Bus Routes
by Yuanyuan Wei, Nan Jiang, Ziwei Li, Dongdong Zheng, Minjie Chen and Miaomiao Zhang
ISPRS Int. J. Geo-Inf. 2022, 11(5), 317; https://doi.org/10.3390/ijgi11050317 - 22 May 2022
Cited by 4 | Viewed by 3015
Abstract
Adding new lines on the basis of the existing public transport network is an important way to improve public transport operation networks and the quality of urban public transport service. Aiming at the problem that existing routes are rarely considered in the previous [...] Read more.
Adding new lines on the basis of the existing public transport network is an important way to improve public transport operation networks and the quality of urban public transport service. Aiming at the problem that existing routes are rarely considered in the previous research on public transportation network planning, a public transportation network optimization method based on an ant colony optimization (ACO) algorithm coupled with the existing routes is proposed. First, the actual road network and existing bus lines were abstracted with a graph data structure, and the integration with origin–destination passenger flow data was completed. Second, according to the ACO algorithm, combined with the existing line structure constraints and ant transfer rules at adjacent nodes, new bus-line planning was realized. Finally, according to the change of direct passenger flow in the entire network, the optimal bus-line network optimization scheme was determined. In the process of node transfer calculation, the algorithm adopts the Softmax strategy to realize path diversity and increase the path search range, while avoiding premature convergence and falling into local optimization. Moreover, the elite ant strategy increases the pheromone release on the current optimal path and accelerates the convergence of the algorithm. Based on existing road network and bus lines, the algorithm carries out new line planning, which increases the rationality and practical feasibility of the new bus-line structure. Full article
Show Figures

Figure 1

22 pages, 3723 KiB  
Article
Development of a Conceptual Data Model for 3D Geospatial Road Management Based on LandInfra Standard: A Case Study of Korea
by Munkhbaatar Buuveibaatar, Kangjae Lee and Wonhee Lee
ISPRS Int. J. Geo-Inf. 2022, 11(5), 316; https://doi.org/10.3390/ijgi11050316 - 21 May 2022
Viewed by 4234
Abstract
In practice, road management data are typically managed in two-dimensional (2D) geospatial forms. However, 2D geographic information system (GIS)-based road infrastructure management data have limitations in their representation of complex roads, such as interchanges, bridges, and tunnels. As such, complex and large road [...] Read more.
In practice, road management data are typically managed in two-dimensional (2D) geospatial forms. However, 2D geographic information system (GIS)-based road infrastructure management data have limitations in their representation of complex roads, such as interchanges, bridges, and tunnels. As such, complex and large road network management data cannot be adequately managed in a 2D GIS-based form. This study discusses the use of the LandInfra standard for road infrastructure management in Korea, considering its focus on land and civil engineering infrastructure facilities. To facilitate the transition from 2D to 3D GIS, we analyzed existing road management models of road pavement and road register information and created Unified Modeling Language (UML) class diagrams depicting these models. Then, existing road management classes and LandInfra classes were mapped. Based on the results, we propose a road management model based on the Facility, Alignment, and Road parts of LandInfra. For its implementation, several classes of the proposed data model were encoded into InfraGML using real-world data input. Taken together, this study shows how the LandInfra standard can be extended and applied to the field of road infrastructure management in Korea, supporting the transition from a 2D to a 3D GIS-based model. Full article
Show Figures

Figure 1

16 pages, 4389 KiB  
Article
The Impact of Built Environment Factors on Elderly People’s Mobility Characteristics by Metro System Considering Spatial Heterogeneity
by Hong Yang, Zehan Ruan, Wenshu Li, Huanjie Zhu, Jie Zhao and Jiandong Peng
ISPRS Int. J. Geo-Inf. 2022, 11(5), 315; https://doi.org/10.3390/ijgi11050315 - 19 May 2022
Cited by 9 | Viewed by 2461
Abstract
This study used metro smart-card data from Wuhan, China, and explored the impact of the built environment on the metro ridership and station travel distance of elderly people using geographically weighted regression (GWR). First, our results show that elderly ridership at transfer stations [...] Read more.
This study used metro smart-card data from Wuhan, China, and explored the impact of the built environment on the metro ridership and station travel distance of elderly people using geographically weighted regression (GWR). First, our results show that elderly ridership at transfer stations is significantly higher than that at non-transfer stations. The building floor area ratio and the number of commercial facilities positively impact elderly ridership, while the number of road intersections and general hospitals has the opposite impact, of which factors show significant heterogeneity. Second, our results show that the average travel distance of terminal stations is significantly higher than that of non-terminal stations, and the average travel distance of non-transfer stations is higher than that of transfer stations. The distance of stations from the subcenter and building volume ratio have a positive effect, while station opening time and betweenness centrality have a negative effect. Our findings may provide insights for the optimization of land use in the built environment of age-friendly metros, help in the formulation of relevant policies to enhance elderly mobility, and provide a reference for other similar cities. Full article
Show Figures

Figure 1

35 pages, 7593 KiB  
Article
Applying Check-in Data and User Profiles to Identify Optimal Store Locations in a Road Network
by Yen-Hsun Lin, Yi-Chung Chen, Sheng-Min Chiu, Chiang Lee and Fu-Cheng Wang
ISPRS Int. J. Geo-Inf. 2022, 11(5), 314; https://doi.org/10.3390/ijgi11050314 - 16 May 2022
Cited by 1 | Viewed by 1871
Abstract
Spatial information analysis has gained increasing attention in recent years due to its wide range of applications, from disaster prevention and human behavioral patterns to commercial value. This study proposes a novel application to help businesses identify optimal locations for new stores. Optimal [...] Read more.
Spatial information analysis has gained increasing attention in recent years due to its wide range of applications, from disaster prevention and human behavioral patterns to commercial value. This study proposes a novel application to help businesses identify optimal locations for new stores. Optimal store locations are close to other stores with similar customer groups. However, they are also a suitable distance from stores that might represent competition. The style of a new store also exerts a significant effect. In this paper, we utilized check-in data and user profiles from location-based social networks to calculate the degree of influence of each store in a road network on the query user to identify optimal new store locations. As calculating the degree of influence of every store in a road network is time-consuming, we added two accelerating algorithms to the proposed baseline. The experiment results verified the validity of the proposed approach. Full article
Show Figures

Figure 1

22 pages, 4163 KiB  
Article
Sustainable Urban Land-Use Optimization Using GIS-Based Multicriteria Decision-Making (GIS-MCDM) Approach
by Md. Mostafizur Rahman and György Szabó
ISPRS Int. J. Geo-Inf. 2022, 11(5), 313; https://doi.org/10.3390/ijgi11050313 - 15 May 2022
Cited by 10 | Viewed by 4242
Abstract
Land-use optimization is an effective technique to produce optimal benefits in urban land-use planning. There are many approaches and methods to optimize land-use allocation. However, the focus on addressing urban sustainability in land-use optimization is very limited. In this study, we presented a [...] Read more.
Land-use optimization is an effective technique to produce optimal benefits in urban land-use planning. There are many approaches and methods to optimize land-use allocation. However, the focus on addressing urban sustainability in land-use optimization is very limited. In this study, we presented a GIS-based multicriteria decision-making (GIS-MCDM) approach to optimize the location of a new residential development considering sustainability dimensions (social, economic, and environmental benefits). Rajshahi City in Bangladesh was taken as a case study. Different types of data, including land use, land cover, ecosystem service value, land surface temperature, and carbon storage, were used to define sustainability criteria. Five physical criteria, three sustainability criteria, and two constraints were used to optimize residential land. Fuzzy membership functions were used to standardize the criteria. The ordered weighted averaging (OWA) was used to produce a residential suitability map. Finally, the multiobjective land allocation (MOLA) module of TerrSet v 19.0 was used to generate optimal locations under an alternative decision scenario. The findings suggest that about 9.00% more sustainability benefits can be achieved using our approach. Using our proposed approach, we also generated six alternative decision scenarios. Among the alternative decision strategies, “high risk–no trade-off” proved to be the most optimal decision strategy that generated the highest sustainability benefit in our case. Full article
Show Figures

Figure 1

18 pages, 5989 KiB  
Article
Spatial Concept Query Based on Lattice-Tree
by Aopeng Xu, Zhiyuan Zhang, Xiaqing Ma, Zixiang Zhang and Tao Xu
ISPRS Int. J. Geo-Inf. 2022, 11(5), 312; https://doi.org/10.3390/ijgi11050312 - 15 May 2022
Cited by 2 | Viewed by 2037
Abstract
As a basic method of spatial data operation, spatial keyword query can provide meaningful information to meet user demands by searching spatial textual datasets. How to accurately understand users’ intentions and efficiently retrieve results from spatial textual big data are always the focus [...] Read more.
As a basic method of spatial data operation, spatial keyword query can provide meaningful information to meet user demands by searching spatial textual datasets. How to accurately understand users’ intentions and efficiently retrieve results from spatial textual big data are always the focus of research. Spatial textual big data and their complex correlation between textual features not only enrich the connotation of spatial objects but also bring difficulties to the efficient recognition and retrieval of similar spatial objects. Because there are a lot of many-to-many relationships between massive spatial objects and textual features, most of the existing research results that employ tree-like and table-like structures to index spatial data and textual data are inefficient in retrieving similar spatial objects. In this paper, firstly, we define spatial textual concept (STC) as a group of spatial objects with the same textual keywords in a limited spatial region in order to present the many-to-many relationships between spatial objects and textual features. Then we attempt to introduce the concept lattice model to maintain a group of related STCs and propose a hybrid tree-like spatial index structure, the lattice-tree, for spatial textual big data. Lattice-tree employs R-tree to index the spatial location of objects, and it embeds a concept lattice structure into specific tree nodes to organize the STC set from a large number of textual keywords of objects and their relationships. Based on this, we also propose a novel spatial keyword query, named Top-k spatial concept query (TkSCQ), to answer STC and retrieve similar spatial objects with multiple textual features. The empirical study is carried out on two spatial textual big data sets from Yelp and Amap. Experiments on the lattice-tree verify its feasibility and demonstrate that it is efficient to embed the concept lattice structure into tree nodes of 3 to 5 levels. Experiments on TkSCQ evaluate lattice from results, keywords, data volume, and so on, and two baseline index structures based on IR-tree and Fp-tree, named the inverted-tree and Fpindex-tree, are developed to compare with the lattice-tree on data sets from Yelp and Amap. Experimental results demonstrate that the Lattice-tree has the better retrieval efficiency in most cases, especially in the case of large amounts of data queries, where the retrieval performance of the lattice-tree is much better than the inverted-tree and Fpindex-tree. Full article
Show Figures

Figure 1

16 pages, 1618 KiB  
Article
Few-Shot Building Footprint Shape Classification with Relation Network
by Yaohui Hu, Chun Liu, Zheng Li, Junkui Xu, Zhigang Han and Jianzhong Guo
ISPRS Int. J. Geo-Inf. 2022, 11(5), 311; https://doi.org/10.3390/ijgi11050311 - 14 May 2022
Cited by 11 | Viewed by 2671
Abstract
Buildings are important entity objects of cities, and the classification of building shapes plays an indispensable role in the cognition and planning of the urban structure. In recent years, some deep learning methods have been proposed for recognizing the shapes of building footprints [...] Read more.
Buildings are important entity objects of cities, and the classification of building shapes plays an indispensable role in the cognition and planning of the urban structure. In recent years, some deep learning methods have been proposed for recognizing the shapes of building footprints in modern electronic maps. Furthermore, their performance depends on enough labeled samples for each class of building footprints. However, it is impractical to label enough samples for each type of building footprint shapes. Therefore, the deep learning methods using few labeled samples are more preferable to recognize and classify the building footprint shapes. In this paper, we propose a relation network based method for the recognization of building footprint shapes with few labeled samples. Relation network, composed of embedding module and relation module, is a metric based few-shot method which aims to learn a generalized metric function and predict the types of the new samples according to their relation with the prototypes of these few labeled samples. To better extract the shape features of the building footprints in the form of vector polygons, we have taken the TriangleConv embedding module to act as the embedding module of the relation network. We validate the effectiveness of our method based on a building footprint dataset with 10 typical shapes and compare it with three classical few-shot learning methods in accuracy. The results show that our method performs better for the classification of building footprint shapes with few labeled samples. For example, the accuracy reached 89.40% for the 2-way 5-shot classification task where there are only two classes of samples in the task and five labeled samples for each class. Full article
Show Figures

Figure 1

20 pages, 3723 KiB  
Article
Analysis of Spatiotemporal Data Imputation Methods for Traffic Flow Data in Urban Networks
by Endra Joelianto, Muhammad Farhan Fathurrahman, Herman Yoseph Sutarto, Ivana Semanjski, Adiyana Putri and Sidharta Gautama
ISPRS Int. J. Geo-Inf. 2022, 11(5), 310; https://doi.org/10.3390/ijgi11050310 - 12 May 2022
Cited by 8 | Viewed by 2253
Abstract
The increase in traffic in cities world-wide has led to a need for better traffic management systems in urban networks. Despite the advances in technology for traffic data collection, the collected data are still suffering from significant issues, such as missing data, hence [...] Read more.
The increase in traffic in cities world-wide has led to a need for better traffic management systems in urban networks. Despite the advances in technology for traffic data collection, the collected data are still suffering from significant issues, such as missing data, hence the need for data imputation methods. This paper explores the spatiotemporal probabilistic principal component analysis (PPCA) based data imputation method that utilizes traffic flow data from vehicle detectors and focuses specifically on detectors in urban networks as opposed to a freeway setting. In the urban context, detectors are in a complex network, separated by traffic lights, measuring different flow directions on different types of roads. Different constructions of a spatial network are compared, from a single detector to a neighborhood and a city-wide network. Experiments are conducted on data from 285 detectors in the urban network of Surabaya, Indonesia, with a case study on the Diponegoro neighborhood. Methods are tested against both point-wise and interval-wise missing data in various scenarios. Results show that a spatial network adds robustness to the system and the choice of the subset has an impact on the imputation error. Compared to a single detector, spatiotemporal PPCA is better suited for interval-wise errors and more robust against outliers and extreme missing data. Even in the case where an entire day of data is missing, the method is still able to impute data accurately relying on other vehicle detectors in the network. Full article
Show Figures

Figure 1

25 pages, 6266 KiB  
Article
Scientometric Analysis for Spatial Autocorrelation-Related Research from 1991 to 2021
by Qing Luo, Kai Hu, Wenxuan Liu and Huayi Wu
ISPRS Int. J. Geo-Inf. 2022, 11(5), 309; https://doi.org/10.3390/ijgi11050309 - 12 May 2022
Cited by 5 | Viewed by 2341
Abstract
Spatial autocorrelation describes the interdependent relationship between the realizations or observations of a variable that is distributed across a geographical landscape, which may be divided into different units/areas according to natural or political boundaries. Researchers of Geographical Information Science (GIS) always consider spatial [...] Read more.
Spatial autocorrelation describes the interdependent relationship between the realizations or observations of a variable that is distributed across a geographical landscape, which may be divided into different units/areas according to natural or political boundaries. Researchers of Geographical Information Science (GIS) always consider spatial autocorrelation. However, spatial autocorrelation research covers a wide range of disciplines, not only GIS, but spatial econometrics, ecology, biology, etc. Since spatial autocorrelation relates to multiple disciplines, it is difficult gain a wide breadth of knowledge on all its applications, which is very important for beginners to start their research as well as for experienced scholars to consider new perspectives in their works. Scientometric analyses are conducted in this paper to achieve this end. Specifically, we employ scientometrc indicators and scientometric network mapping techniques to discover influential journals, countries, institutions, and research communities; key topics and papers; and research development and trends. The conclusions are: (1) journals categorized into ecological and biological domains constitute the majority of TOP journals;(2) northern American countries, European countries, Australia, Brazil, and China contribute the most to spatial autocorrelation-related research; (3) eleven research communities consisting of three geographical communities and eight communities of other domains were detected; (4) hot topics include spatial autocorrelation analysis for molecular data, biodiversity, spatial heterogeneity, and variability, and problems that have emerged in the rapid development of China; and (5) spatial statistics-based approaches and more intensive problem-oriented applications are, and still will be, the trend of spatial autocorrelation-related research. We also refine the results from a geographer’s perspective at the end of this paper. Full article
Show Figures

Figure 1

4 pages, 196 KiB  
Editorial
Geographic Complexity: Concepts, Theories, and Practices
by Changxiu Cheng, Samuel A. Cushman, Hung-Chak Ho and Peichao Gao
ISPRS Int. J. Geo-Inf. 2022, 11(5), 308; https://doi.org/10.3390/ijgi11050308 - 12 May 2022
Viewed by 1850
Abstract
Geography is a fundamentally important discipline that provides a framework for understanding the complex surface of our Earth [...] Full article
(This article belongs to the Special Issue Geographic Complexity: Concepts, Theories, and Practices)
13 pages, 1620 KiB  
Article
Space—Time Surveillance of COVID-19 Seasonal Clusters: A Case of Sweden
by Augustus Aturinde and Ali Mansourian
ISPRS Int. J. Geo-Inf. 2022, 11(5), 307; https://doi.org/10.3390/ijgi11050307 - 10 May 2022
Viewed by 3303
Abstract
While COVID-19 is a global pandemic, different countries have experienced different morbidity and mortality patterns. We employ retrospective and prospective space–time permutation analysis on COVID-19 positive records across different municipalities in Sweden from March 2020 to February 2021, using data provided by the [...] Read more.
While COVID-19 is a global pandemic, different countries have experienced different morbidity and mortality patterns. We employ retrospective and prospective space–time permutation analysis on COVID-19 positive records across different municipalities in Sweden from March 2020 to February 2021, using data provided by the Swedish Public Health Agency. To the best of our knowledge, this is the first study analyzing nationwide COVID-19 space–time clustering in Sweden, on a season-to-season basis. Our results show that different municipalities within Sweden experienced varying extents of season-dependent COVID-19 clustering in both the spatial and temporal dimensions. The reasons for the observed differences could be related to the differences in the earlier exposures to the virus, the strictness of the social restrictions, testing capabilities and preparedness. By profiling COVID-19 space–time clusters before the introduction of vaccines, this study contributes to public health efforts aimed at containing the virus by providing plausible evidence in evaluating which epidemiologic interventions in the different regions could have worked and what could have not worked. Full article
Show Figures

Figure 1

23 pages, 10008 KiB  
Article
Deducing Flood Development Process Using Social Media: An Event-Based and Multi-Level Modeling Approach
by Yang Liu, Rui Li, Shunli Wang, Huayi Wu and Zhipeng Gui
ISPRS Int. J. Geo-Inf. 2022, 11(5), 306; https://doi.org/10.3390/ijgi11050306 - 10 May 2022
Cited by 1 | Viewed by 2403
Abstract
Social media is increasingly being used to obtain timely flood information to assist flood disaster management and situational awareness. However, since data in social media are massive, redundant, and unstructured, it is tricky to intuitively and clearly obtain effective information. To automatically obtain [...] Read more.
Social media is increasingly being used to obtain timely flood information to assist flood disaster management and situational awareness. However, since data in social media are massive, redundant, and unstructured, it is tricky to intuitively and clearly obtain effective information. To automatically obtain clear flood information and deduce flood development processes from social media, the authors of this paper propose an event-based and multi-level modeling approach including a data model and two methods. Through the hierarchical division of events (division into spatial object, phase, and attribute status), the flood information structure (including time, space, topic, emotion, and disaster condition) is defined. We built an entity construction method and a development process deduction method to achieve the automatic transition from cluttered data to orderly flood development processes. Taking the flooding event of the Yangtze and Huai Rivers in 2020 as an example, we successfully obtained true flood information and development process from social media data, which verified the effectiveness of the model and methods. Meanwhile, spatiotemporal pattern mining was carried out by using entities from different levels. The results showed that the flood was from west to east and the damage level was positively correlated with the number of flood-related social media texts, especially emotional texts. In summary, through the model and methods in this paper, clear flood information and dynamic development processes can be quickly and automatically obtained, and the spatiotemporal patterns of flood entities can be examined. It is beneficial to extract timely flood information and public sentiments towards flood events in order to perform better disaster relief and post-disaster management. Full article
Show Figures

Figure 1

20 pages, 13707 KiB  
Article
Continuous Monitoring of the Surface Water Area in the Yellow River Basin during 1986–2019 Using Available Landsat Imagery and the Google Earth Engine
by Qingfeng Hu, Chongwei Li, Zhihui Wang, Yang Liu and Wenkai Liu
ISPRS Int. J. Geo-Inf. 2022, 11(5), 305; https://doi.org/10.3390/ijgi11050305 - 10 May 2022
Cited by 6 | Viewed by 3583
Abstract
The Yellow River Basin (YRB) has been facing severe water shortages; hence, the long-term dynamic monitoring of its surface water area (SWA) is essential for the efficient utilization of its water resources and sustainable socioeconomic development. In order to detect the changing trajectory [...] Read more.
The Yellow River Basin (YRB) has been facing severe water shortages; hence, the long-term dynamic monitoring of its surface water area (SWA) is essential for the efficient utilization of its water resources and sustainable socioeconomic development. In order to detect the changing trajectory of the SWA of the YRB and its influencing factors, we used available Landsat images from 1986 through to 2019 and a water and vegetation indices-based method to analyze the spatial–temporal variability of four types of SWAs (permanent, seasonal, maximum and average extents), and their relationship with precipitation (Pre), temperature (Temp), leaf area index (LAI) and surface soil moisture (SM).The multi-year average permanent surface water area (SWA) and seasonal SWA accounted for 46.48% and 53.52% in the Yellow River Basin (YRB), respectively. The permanent and seasonal water bodies were dominantly distributed in the upper reaches, accounting for 70.22% and 48.79% of these types, respectively. The rate of increase of the permanent SWA was 49.82 km2/a, of which the lower reaches contributed the most (34.34%), and the rate of decrease of the seasonal SWA was 79.18 km2/a, of which the contribution of the source region was the highest (25.99%). The seasonal SWA only exhibited decreasing trends in 13 sub-basins, accounting for 15% of all of the sub-basins, which indicates that the decrease in the seasonal SWA was dominantly caused by the change in the SWA in the main river channel region. The conversions from seasonal water to non-water bodies, and from seasonal to permanent water bodies were the dominant trends from 1986 to 2019 in the YRB. The SWA was positively correlated with precipitation, and was negatively correlated with the temperature. Because the permanent and seasonal water bodies were dominantly distributed in the river channel region and sub-basins, respectively, the change in the permanent SWA was significantly affected by the regulation of the major reservoirs, whereas the change in the seasonal SWA was more closely related to climate change. The increase in the soil moisture was helpful in the formation of the permanent water bodies. The increased evapotranspiration induced by vegetation greening played a significant positive role in the SWA increase via the local cooling and humidifying effects, which offset the accelerated water surface evaporation caused by the atmospheric warming. Full article
(This article belongs to the Special Issue Geo-Information for Watershed Processes)
Show Figures

Figure 1

17 pages, 2751 KiB  
Article
Geo-Enabled Sustainable Municipal Energy Planning for Comprehensive Accessibility: A Case in the New Federal Context of Nepal
by Hari Krishna Dhonju, Bikash Uprety and Wen Xiao
ISPRS Int. J. Geo-Inf. 2022, 11(5), 304; https://doi.org/10.3390/ijgi11050304 - 10 May 2022
Cited by 2 | Viewed by 2526
Abstract
Energy is a fundamental need of modern society and a basis for economic and social development, and one of the major Sustainable Development Goals (SDG), particularly SDG7. However, the UN’s SDG Report 2021 betrays millions of people living without electricity and one-third of [...] Read more.
Energy is a fundamental need of modern society and a basis for economic and social development, and one of the major Sustainable Development Goals (SDG), particularly SDG7. However, the UN’s SDG Report 2021 betrays millions of people living without electricity and one-third of the world’s population deprived of using modern energy cooking services (MECS) through access to electricity. Achieving the SDG7 requires standard approaches and tools that effectively address the geographical, infrastructural, and socioeconomic characteristics of a (rural) municipality of Nepal. Furthermore, Nepal’s Constitution 2015 incorporated a federal system under the purview of a municipality as the local government that has been given the mandate to ensure electricity access and clean energy. To address this, a methodology is developed for local government planning in Nepal in order to identify the optimal mix of electrification options by conducting a detailed geospatial analysis of renewable energy (RE) technologies by exploring accessibility and availability ranging from grid extensions to mini-grid and off-grid solutions, based on (a) life cycle cost and (b) levelized cost of energy. During energy assessment, geospatial and socio-economic data are coupled with household and community level data collected from a mobile survey app, and are exploited to garner energy status-quo and enable local governments to assess the existing situation of energy access/availability and planning. In summary, this paper presents a geo-enabled municipal energy planning method and a comprehensive toolkit to facilitate sustainable energy access to local people. Full article
(This article belongs to the Special Issue Geospatial Electrification and Energy Access Planning)
Show Figures

Figure 1

13 pages, 3096 KiB  
Article
Quantifying Urban Expansion from the Perspective of Geographic Data: A Case Study of Guangzhou, China
by Qingyao Huang, Yihua Liu and Chengjing Chen
ISPRS Int. J. Geo-Inf. 2022, 11(5), 303; https://doi.org/10.3390/ijgi11050303 - 10 May 2022
Viewed by 2030
Abstract
Understanding and quantifying urban expansion is critical to urban management and urban planning. The accurate delineation of built-up areas (BUAs) is the foundation for quantifying urban expansion. To quantify urban expansion simply and efficiently, we proposed a method for delineating BUAs using geographic [...] Read more.
Understanding and quantifying urban expansion is critical to urban management and urban planning. The accurate delineation of built-up areas (BUAs) is the foundation for quantifying urban expansion. To quantify urban expansion simply and efficiently, we proposed a method for delineating BUAs using geographic data, taking Guangzhou as the study area. First, Guangzhou’s natural cities (NCs) in 2014 and 2020 were derived from the point of interest (POI) data. Second, multiple grid maps were combined with NCs to delineate BUAs. Third, the optimal grid map for delineating BUA was determined based on the real BUA data and applying accuracy evaluation indexes. Finally, by comparing the 2014 and 2020 BUAs delineated by the optimal grid maps, we quantified the urban expansion occurring in Guangzhou. The results demonstrated the following. (1) The accuracy score of the BUAs delineated by the 200 m × 200 m grid map reaches a maximum. (2) The BUAs in the central urban area of Guangzhou had a smaller area of expansion, while the northern and southern areas of Guangzhou experienced considerable urban expansion. (3) The BUA expansion was smaller in all spatial orientations in the developed district, while the BUA expansion was larger in all spatial orientations in the developing district. This study provides a new method for delineating BUAs and a new perspective for mapping the spatial distribution of urban BUAs, which helps to better understand and quantify urban expansion. Full article
Show Figures

Figure 1

25 pages, 10057 KiB  
Article
Geographical Determinants of Regional Retail Sales: Evidence from 12,500 Retail Shops in Qiannan County, China
by Wei Wang, Luyao Wang, Xu Wang and Yankun Wang
ISPRS Int. J. Geo-Inf. 2022, 11(5), 302; https://doi.org/10.3390/ijgi11050302 - 09 May 2022
Cited by 3 | Viewed by 2374
Abstract
The rapid development of the Chinese economy has stimulated consumer demand and brought huge opportunities for the retail industry. Previous studies have emphasized the importance of estimating regional consumption potentiality. However, the determinants of retail sales are yet to be systematically studied, especially [...] Read more.
The rapid development of the Chinese economy has stimulated consumer demand and brought huge opportunities for the retail industry. Previous studies have emphasized the importance of estimating regional consumption potentiality. However, the determinants of retail sales are yet to be systematically studied, especially at the micro level. As a result, the realization of sustainable development goals in the retail industry is restricted. In this paper, we studied the determinants of retail sales from two aspects—location-based socioeconomic factors and spatial competition between shops. Using 12,500 retail shops as our sample and by adopting a grid-division strategy, we found that regional retail sales can be positively impacted by nearby population, road length, and most non-commercial points of interest (POIs). By contrast, the number of other commercial facilities, such as catering facilities and shopping malls, and the area of geographic barriers often caused negative impacts on retail sales. As to the competition effects, we found that the isolation and decentralization of shops in one area have a marginally positive effect on sales performance within a threshold distance of 226.19 m for a central grid and a threshold distance of 514.85 m for surrounding grids, respectively. This study explores the determinants of micro-level retail sales and provides decision makers with practical and realistic approaches for generating better site selection and marketing strategies, thus realizing the sustainable development goals of the retail industry. Full article
Show Figures

Figure 1

31 pages, 20413 KiB  
Article
Spatio-Temporal Monitoring of Atmospheric Pollutants Using Earth Observation Sentinel 5P TROPOMI Data: Impact of Stubble Burning a Case Study
by Neeraj K. Maurya, Prem Chandra Pandey, Subhadip Sarkar, Rajesh Kumar and Prashant K. Srivastava
ISPRS Int. J. Geo-Inf. 2022, 11(5), 301; https://doi.org/10.3390/ijgi11050301 - 08 May 2022
Cited by 10 | Viewed by 3778
Abstract
The problems of atmospheric pollutants are causing significant concern across the globe and in India. The aggravated level of atmospheric pollutants in the surrounding environment poses serious threats to normal living conditions by deteriorating air quality and causing adverse health impacts. Pollutant concentration [...] Read more.
The problems of atmospheric pollutants are causing significant concern across the globe and in India. The aggravated level of atmospheric pollutants in the surrounding environment poses serious threats to normal living conditions by deteriorating air quality and causing adverse health impacts. Pollutant concentration increases during harvesting seasons of Kharif/Rabi due to stubble burning and is aggravated by other points or mobile sources. The present study is intended to monitor the spatio-temporal variation of the major atmospheric pollutants using Sentinel-5P TROPOMI data through cloud computing. Land Use/Land Cover (LULC-categorization or classification of human activities and natural coverage on the landscape) was utilised to extract the agricultural area in the study site. It involves the cloud computing of MOD64A1 (MODIS Burned monthly gridded data) and Sentinel-5P TROPOMI (S5P Tropomi) data for major atmospheric pollutants, such as CH4, NO2, SOX, CO, aerosol, and HCHO. The burned area output provided information regarding the stubble burning period, which has seen post-harvesting agricultural residue burning after Kharif crop harvesting (i.e., rice from April to June) and Rabi crop harvesting (i.e., wheat from September to November). The long duration of stubble burning is due to variation in farmers’ harvesting and burning stubble/biomass remains in the field for successive crops. This period was used as criteria for considering the cloud computing of the Sentinel-5P TROPOMI data for atmospheric pollutants concentration in the study site. The results showed a significant increase in CH4, SO2, SOX, CO, and aerosol concentration during the AMJ months (stubble burning of Rabi crops) and OND months (stubble burning of Kharif crops) of each year. The results are validated with the ground control station data for PM2.5/PM10. and patterns of precipitation and temperature-gridded datasets. The trajectory frequency for air mass movement using the HYSPLIT model showed that the highest frequency and concentration were observed during OND months, followed by the AMJ months of each year (2018, 2019, 2020, and 2021). This study supports the role and robustness of Earth observation Sentinel-5P TROPOMI to monitor and evaluate air quality and pollutants distribution. Full article
Show Figures

Figure 1

21 pages, 9312 KiB  
Article
How Has the Recent Climate Change Affected the Spatiotemporal Variation of Reference Evapotranspiration in a Climate Transitional Zone of Eastern China?
by Meng Li, Ronghao Chu, Xiuzhu Sha, Abu Reza Md. Towfiqul Islam, Yuelin Jiang and Shuanghe Shen
ISPRS Int. J. Geo-Inf. 2022, 11(5), 300; https://doi.org/10.3390/ijgi11050300 - 06 May 2022
Cited by 3 | Viewed by 1768 | Correction
Abstract
Reference evapotranspiration (ET0) is essential for agricultural production and crop water management. The recent climate change affecting the spatiotemporal variation of ET0 in eastern China continues to still be less understood. For this purpose, the latest observed data from 77 [...] Read more.
Reference evapotranspiration (ET0) is essential for agricultural production and crop water management. The recent climate change affecting the spatiotemporal variation of ET0 in eastern China continues to still be less understood. For this purpose, the latest observed data from 77 meteorological stations in Anhui province were utilized to determine the spatiotemporal variations of ET0 by the use of the Penman–Monteith FAO 56 (PMF-56) model. Furthermore, the Theil–Sen estimator and the Mann–Kendall (M–K) test were adopted to analyze the trends of ET0 and meteorological factors. Moreover, the differential method was employed to explore the sensitivity of ET0 to meteorological factors and the contributions of meteorological factors to ET0 trends. Results show that the ET0 decreased significantly before 1990, and then increased slowly. The ET0 is commonly higher in the north and lower in the south. ET0 is most sensitive to relative humidity (RH), except in summer. However, in summer, net radiation (Rn) is the most sensitive factor. During 1961–1990, Rn was the leading factor annually, during the growing season and summer, while wind speed (u2) played a leading role in others. All meteorological factors provide negative contributions to ET0 trends, which ultimately lead to decreasing ET0 trends. During 1991–2019, the leading factor of ET0 trends changed to the mean temperature (Ta) annually, during the growing season, spring and summer, and then to Rn in others. Overall, the negative contributions from u2 and Rn cannot offset the positive contributions from Ta and RH, which ultimately lead to slow upward ET0 trends. The dramatic drop in the amount of u2 that contributes to the changes in ET0 in Region III is also worth noting. Full article
Show Figures

Figure 1

19 pages, 3980 KiB  
Article
Digital Soil Mapping of Soil Organic Matter with Deep Learning Algorithms
by Pengyuan Zeng, Xuan Song, Huan Yang, Ning Wei and Liping Du
ISPRS Int. J. Geo-Inf. 2022, 11(5), 299; https://doi.org/10.3390/ijgi11050299 - 06 May 2022
Cited by 5 | Viewed by 3110
Abstract
Digital soil mapping has emerged as a new method to describe the spatial distribution of soils economically and efficiently. In this study, a lightweight soil organic matter (SOM) mapping method based on a deep residual network, which we call LSM-ResNet, is proposed to [...] Read more.
Digital soil mapping has emerged as a new method to describe the spatial distribution of soils economically and efficiently. In this study, a lightweight soil organic matter (SOM) mapping method based on a deep residual network, which we call LSM-ResNet, is proposed to make accurate predictions with background covariates. ResNet not only integrates spatial background information around the observed environmental covariates, but also reduces problems such as information loss, which undermines the integrity of information and reduces prediction uncertainty. To train the model, rectified linear units, mean squared error, and adaptive momentum estimation were used as the activation function, loss/cost function, and optimizer, respectively. The method was tested with Landsat5, the meteorological data from WorldClim, and the 1602 sampling points set from Xinxiang, China. The performance of the proposed LSM-ResNet was compared to a traditional machine learning algorithm, the random forest (RF) algorithm, and a training set (80%) and a test set (20%) were created to test both models. The results showed that the LSM-ResNet (RMSE = 6.40, R2 = 0.51) model outperformed the RF model in both the roots mean square error (RMSE) and coefficient of determination (R2), and the training accuracy was significantly improved compared to RF (RMSE = 6.81, R2 = 0.46). The trained LSM-ResNet model was used for SOM prediction in Xinxiang, a district of plain terrain in China. The prediction maps can be deemed an accurate reflection of the spatial variability of the SOM distribution. Full article
Show Figures

Figure 1

17 pages, 6461 KiB  
Article
Revising Cadastral Data on Land Boundaries Using Deep Learning in Image-Based Mapping
by Bujar Fetai, Dejan Grigillo and Anka Lisec
ISPRS Int. J. Geo-Inf. 2022, 11(5), 298; https://doi.org/10.3390/ijgi11050298 - 04 May 2022
Cited by 7 | Viewed by 3164
Abstract
One of the main concerns of land administration in developed countries is to keep the cadastral system up to date. The goal of this research was to develop an approach to detect visible land boundaries and revise existing cadastral data using deep learning. [...] Read more.
One of the main concerns of land administration in developed countries is to keep the cadastral system up to date. The goal of this research was to develop an approach to detect visible land boundaries and revise existing cadastral data using deep learning. The convolutional neural network (CNN), based on a modified architecture, was trained using the Berkeley segmentation data set 500 (BSDS500) available online. This dataset is known for edge and boundary detection. The model was tested in two rural areas in Slovenia. The results were evaluated using recall, precision, and the F1 score—as a more appropriate method for unbalanced classes. In terms of detection quality, balanced recall and precision resulted in F1 scores of 0.60 and 0.54 for Ponova vas and Odranci, respectively. With lower recall (completeness), the model was able to predict the boundaries with a precision (correctness) of 0.71 and 0.61. When the cadastral data were revised, the low values were interpreted to mean that the lower the recall, the greater the need to update the existing cadastral data. In the case of Ponova vas, the recall value was less than 0.1, which means that the boundaries did not overlap. In Odranci, 21% of the predicted and cadastral boundaries overlapped. Since the direction of the lines was not a problem, the low recall value (0.21) was mainly due to overly fragmented plots. Overall, the automatic methods are faster (once the model is trained) but less accurate than the manual methods. For a rapid revision of existing cadastral boundaries, an automatic approach is certainly desirable for many national mapping and cadastral agencies, especially in developed countries. Full article
(This article belongs to the Special Issue Upscaling AI Solutions for Large Scale Mapping Applications)
Show Figures

Figure 1

16 pages, 5647 KiB  
Article
A New Urban Space Analysis Method Based on Space Syntax and Geographic Information System Using Multisource Data
by Zhaolian Xing and Weimin Guo
ISPRS Int. J. Geo-Inf. 2022, 11(5), 297; https://doi.org/10.3390/ijgi11050297 - 04 May 2022
Cited by 7 | Viewed by 3675
Abstract
With large-scale urban demolition, the spatial pattern of the urban area in many cities has been destroyed, leading to the loss of urban regional identity; therefore, these urban spaces need to be urgently studied and protected. Previous studies on the spatial pattern of [...] Read more.
With large-scale urban demolition, the spatial pattern of the urban area in many cities has been destroyed, leading to the loss of urban regional identity; therefore, these urban spaces need to be urgently studied and protected. Previous studies on the spatial pattern of urban areas focused on spatial morphology or urban texture. However, due to difficulties in obtaining field survey data, such studies cannot comprehensively analyze the space; thus, the proposed conservation strategies are also more one-sided. In order to study the urban space more scientifically and systematically, and to propose a more operable spatial conservation strategy, this paper conducts a new urban space analysis method based on space syntax and the geographic information system using multisource data. With the help of software such as Depthmap and ArcGIS, as well as theories and methods such as space syntax and regression analysis, this article conducted a visual and quantitative analysis of the spatial information data such as integration of urban road networks, building height, architectural style, points of interest, number of lanes, and maximum road speed. Taking the old city of Wuxi as an example, the method’s feasibility was verified. The regression model analysis revealed that, when the integration of the area was higher, the buildings distributed around were multilane, fast lane, modern buildings, taller buildings, commercial buildings, and vice versa, which gives a scientific basis for the proposed strategy of creating regional characteristics of urban space. This new analysis method of urban space is of great significance for the study of urban problems, the exploration of urban characteristics, and the proposal of urban strategies. Full article
Show Figures

Figure 1

17 pages, 2688 KiB  
Article
Exploring the Evolution of the Accessibility of Educational Facilities and Its Influencing Factors in Mountainous Areas: A Case Study of the Rocky Desertification Area in Yunnan, Guangxi, and Guizhou
by Lingling Yao, Minjuan Lv, Tao Li, Donghua Wang and Xiaoshu Cao
ISPRS Int. J. Geo-Inf. 2022, 11(5), 296; https://doi.org/10.3390/ijgi11050296 - 03 May 2022
Cited by 3 | Viewed by 1936
Abstract
The optimal allocation of educational resources has been a hot issue, and exploring the accessibility of educational facilities in poor mountainous areas helps to reasonably plan the layout of educational facilities and promote the balanced development of education. Taking the rocky desertification area [...] Read more.
The optimal allocation of educational resources has been a hot issue, and exploring the accessibility of educational facilities in poor mountainous areas helps to reasonably plan the layout of educational facilities and promote the balanced development of education. Taking the rocky desertification area in Yunnan, Guangxi, and Guizhou (YGGRD) as the study area, based on the POI data of educational facilities in the YGGRD in 2000, 2010 and 2019, this study explored the evolution of the accessibility of educational facilities in the YGGRD through raster accessibility. And the influencing factors were analyzed by the ordinary least square method (OLS) and geographically weighted regression model (GWR), and evaluated the model through cross validation. The results show that the overall accessibility of educational facilities improved significantly from 2000 to 2019. Educational facilities mainly have good accessibility and average accessibility. Poor accessibility areas are concentrated in the interprovincial border regions, and the boundary effect is significant. County accessibility, population density and rural per capita disposable income have a great impact on the accessibility of educational facilities in the YGGRD. It is suggested to strengthen the construction of educational facilities in the interprovincial border regions, relocate and integrate villages, and improve the education quality of township schools to improve the supply of rural educational resources. Full article
Show Figures

Figure 1

16 pages, 4015 KiB  
Article
Modeling Health Seeking Behavior Based on Location-Based Service Data: A Case Study of Shenzhen, China
by Wei Hu, Lin Li and Mo Su
ISPRS Int. J. Geo-Inf. 2022, 11(5), 295; https://doi.org/10.3390/ijgi11050295 - 02 May 2022
Cited by 4 | Viewed by 2753
Abstract
Understanding residents’ health seeking behavior is crucial for the planning and utilization of healthcare resources. With the support of emerging location-based service (LBS) data, this study proposes a framework for inferring health seeking trips, measuring observed spatial accessibility to healthcare, and interpreting the [...] Read more.
Understanding residents’ health seeking behavior is crucial for the planning and utilization of healthcare resources. With the support of emerging location-based service (LBS) data, this study proposes a framework for inferring health seeking trips, measuring observed spatial accessibility to healthcare, and interpreting the determinants of health seeking behavior. Taking Shenzhen, China as a case study, a supply–demand ratio calculation method based on observed data is developed to explore basic patterns of health seeking, while health seeking behavior is described using a spatial analysis framework based on the Huff model. A total of 95,379 health seeking trips were identified, and their analysis revealed obvious differences between observed and potential spatial accessibility. In addition to the traditional distance decay effect and number of doctors, the results showed health seeking behavior to be determined by hospital characteristics such as hospital scale, service quality, and popularity. Furthermore, this study also identified differences in health seeking behavior between subgroups with different ages, incomes, and education levels. The findings highlight the need to incorporate actual health seeking behavior when measuring the spatial accessibility of healthcare and planning healthcare resources. The framework and methods proposed in this study can be applied to other contexts and other types of public facilities. Full article
Show Figures

Figure 1

19 pages, 9369 KiB  
Article
An Integrated Graph Model for Spatial–Temporal Urban Crime Prediction Based on Attention Mechanism
by Miaomiao Hou, Xiaofeng Hu, Jitao Cai, Xinge Han and Shuaiqi Yuan
ISPRS Int. J. Geo-Inf. 2022, 11(5), 294; https://doi.org/10.3390/ijgi11050294 - 30 Apr 2022
Cited by 11 | Viewed by 2643
Abstract
Crime issues have been attracting widespread attention from citizens and managers of cities due to their unexpected and massive consequences. As an effective technique to prevent and control urban crimes, the data-driven spatial–temporal crime prediction can provide reasonable estimations associated with the crime [...] Read more.
Crime issues have been attracting widespread attention from citizens and managers of cities due to their unexpected and massive consequences. As an effective technique to prevent and control urban crimes, the data-driven spatial–temporal crime prediction can provide reasonable estimations associated with the crime hotspot. It thus contributes to the decision making of relevant departments under limited resources, as well as promotes civilized urban development. However, the deficient performance in the aspect of the daily spatial–temporal crime prediction at the urban-district-scale needs to be further resolved, which serves as a critical role in police resource allocation. In order to establish a practical and effective daily crime prediction framework at an urban police-district-scale, an “online” integrated graph model is proposed. A residual neural network (ResNet), graph convolutional network (GCN), and long short-term memory (LSTM) are integrated with an attention mechanism in the proposed model to extract and fuse the spatial–temporal features, topological graphs, and external features. Then, the “online” integrated graph model is validated by daily theft and assault data within 22 police districts in the city of Chicago, US from 1 January 2015 to 7 January 2020. Additionally, several widely used baseline models, including autoregressive integrated moving average (ARIMA), ridge regression, support vector regression (SVR), random forest, extreme gradient boosting (XGBoost), LSTM, convolutional neural network (CNN), and Conv-LSTM models, are compared with the proposed model from a quantitative point of view by using the same dataset. The results show that the predicted spatial–temporal patterns by the proposed model are close to the observations. Moreover, the integrated graph model performs more accurately since it has lower average values of the mean absolute error (MAE) and root mean square error (RMSE) than the other eight models. Therefore, the proposed model has great potential in supporting the decision making for the police in the fields of patrolling and investigation, as well as resource allocation. Full article
Show Figures

Figure 1

30 pages, 10785 KiB  
Article
Predicting Poverty Using Geospatial Data in Thailand
by Nattapong Puttanapong, Arturo Martinez, Jr., Joseph Albert Nino Bulan, Mildred Addawe, Ron Lester Durante and Marymell Martillan
ISPRS Int. J. Geo-Inf. 2022, 11(5), 293; https://doi.org/10.3390/ijgi11050293 - 30 Apr 2022
Cited by 18 | Viewed by 6949
Abstract
Poverty statistics are conventionally compiled using data from socioeconomic surveys. This study examines an alternative approach to estimating poverty by investigating whether readily available geospatial data can accurately predict the spatial distribution of poverty in Thailand. In particular, the geospatial data examined in [...] Read more.
Poverty statistics are conventionally compiled using data from socioeconomic surveys. This study examines an alternative approach to estimating poverty by investigating whether readily available geospatial data can accurately predict the spatial distribution of poverty in Thailand. In particular, the geospatial data examined in this study include the intensity of night-time light (NTL), land cover, vegetation index, land surface temperature, built-up areas, and points of interest. The study also compares the predictive performance of various econometric and machine-learning methods such as generalized least squares, neural network, random forest, and support-vector regression. Results suggest that the intensity of NTL and other variables that approximate population density are highly associated with the proportion of an area’s population that are living in poverty. The random forest technique yielded the highest level of prediction accuracy among the methods considered in this study, primarily due to its capability to fit complex association structures even with small-to-medium-sized datasets. This obtained result suggests the potential applications of using publicly accessible geospatial data and machine-learning methods for timely monitoring of the poverty distribution. Moving forward, additional studies are needed to improve the predictive power and investigate the temporal stability of the relationships observed. Full article
Show Figures

Figure 1

25 pages, 5307 KiB  
Article
Mapping for Awareness of Indigenous Stories
by Stephanie Pyne, Melissa Castron, Annita Parish, Peter Farrell and Shawn Johnston
ISPRS Int. J. Geo-Inf. 2022, 11(5), 292; https://doi.org/10.3390/ijgi11050292 - 30 Apr 2022
Cited by 1 | Viewed by 2977
Abstract
Joseph Kerski has identified five converging global trends—geo-awareness, geo-enablement, geotechnologies, citizen science, and storytelling—which contribute to the increased relevance of geography for education and society. While these trends are discussed by Kerski in the context of the proliferating significance of geography in teaching [...] Read more.
Joseph Kerski has identified five converging global trends—geo-awareness, geo-enablement, geotechnologies, citizen science, and storytelling—which contribute to the increased relevance of geography for education and society. While these trends are discussed by Kerski in the context of the proliferating significance of geography in teaching and education, they also provide a useful lens for considering the increasing ubiquity of critical approaches to cartography both in general and in the context of teaching and education, where mapping can include participatory collaborations with individuals from a variety of knowledge communities and extend to the mapping of experiences, emotions, and Indigenous perspectives. In this paper, we consider these trends and related ideas such as Kerski’s “geoliteracy” and metaliteracy in light of some relatively current examples and in light of the evolution of research and teaching linked with a series of interrelated map-based projects and courses that take a multidimensional approach to teaching and learning about the Residential Schools Legacy in Canada. Full article
(This article belongs to the Special Issue Mapping Indigenous Knowledge in the Digital Age)
Show Figures

Figure 1

23 pages, 55691 KiB  
Article
Preservation of Villages in Central Italy: Geomatic Techniques’ Integration and GIS Strategies for the Post-Earthquake Assessment
by Fabio Piccinini, Alban Gorreja, Francesco Di Stefano, Roberto Pierdicca, Luis Javier Sanchez Aparicio and Eva Savina Malinverni
ISPRS Int. J. Geo-Inf. 2022, 11(5), 291; https://doi.org/10.3390/ijgi11050291 - 30 Apr 2022
Cited by 4 | Viewed by 2352
Abstract
Historical villages represent a highly vulnerable cultural heritage; their preservation can be ensured thanks to technological innovations in the field of geomatics and information systems. Among these, Geographical Information Systems (GISs) allow exploiting heterogeneous data for efficient vulnerability assessment, in terms of both [...] Read more.
Historical villages represent a highly vulnerable cultural heritage; their preservation can be ensured thanks to technological innovations in the field of geomatics and information systems. Among these, Geographical Information Systems (GISs) allow exploiting heterogeneous data for efficient vulnerability assessment, in terms of both time and usability. Geometric attributes, which currently are mainly inferred by visual inspections, can be extrapolated from data obtained by geomatic technologies. Furthermore, the integration with non-metric data ensures a more complete description of the post-seismic risk thematic mapping. In this paper, a high-performance information system for small urban realities, such as historical villages, is described, starting from the 3D survey obtained through the integrated management of recent innovative geomatic sensors, such as Unmanned Aerial Vehicles (UAVs), Terrestrial Laser Scanners (TLSs), and 360º images. The results show that the proposed strategy of the automatic extraction of the parameters from the GIS can be generalized to other case studies, thus representing a straightforward method to enhance the decision-making of public administrations. Moreover, this work confirms the importance of managing heterogeneous geospatial data to speed up the vulnerability assessment process. The final result, in fact, is an information system that can be used for every village where data have been acquired in a similar way. This information could be used in the field by means of a GIS app that allows updating the geospatial database, improving the work of technicians. This approach was validated in Gabbiano(Pieve Torina), a village in Central Italy affected by earthquakes in 2016 and 2017. Full article
Show Figures

Figure 1

Previous Issue
Next Issue
Back to TopTop