
Organizational Geosocial Network: A Graph Machine Learning Approach Integrating Geographic and Public Policy Information for Studying the Development of Social Organizations in China


Abstract
:1. Introduction
2. Related Topics
2.1. Social Network
2.2. Geographic Information System (GIS)
2.3. Natural Language Processing
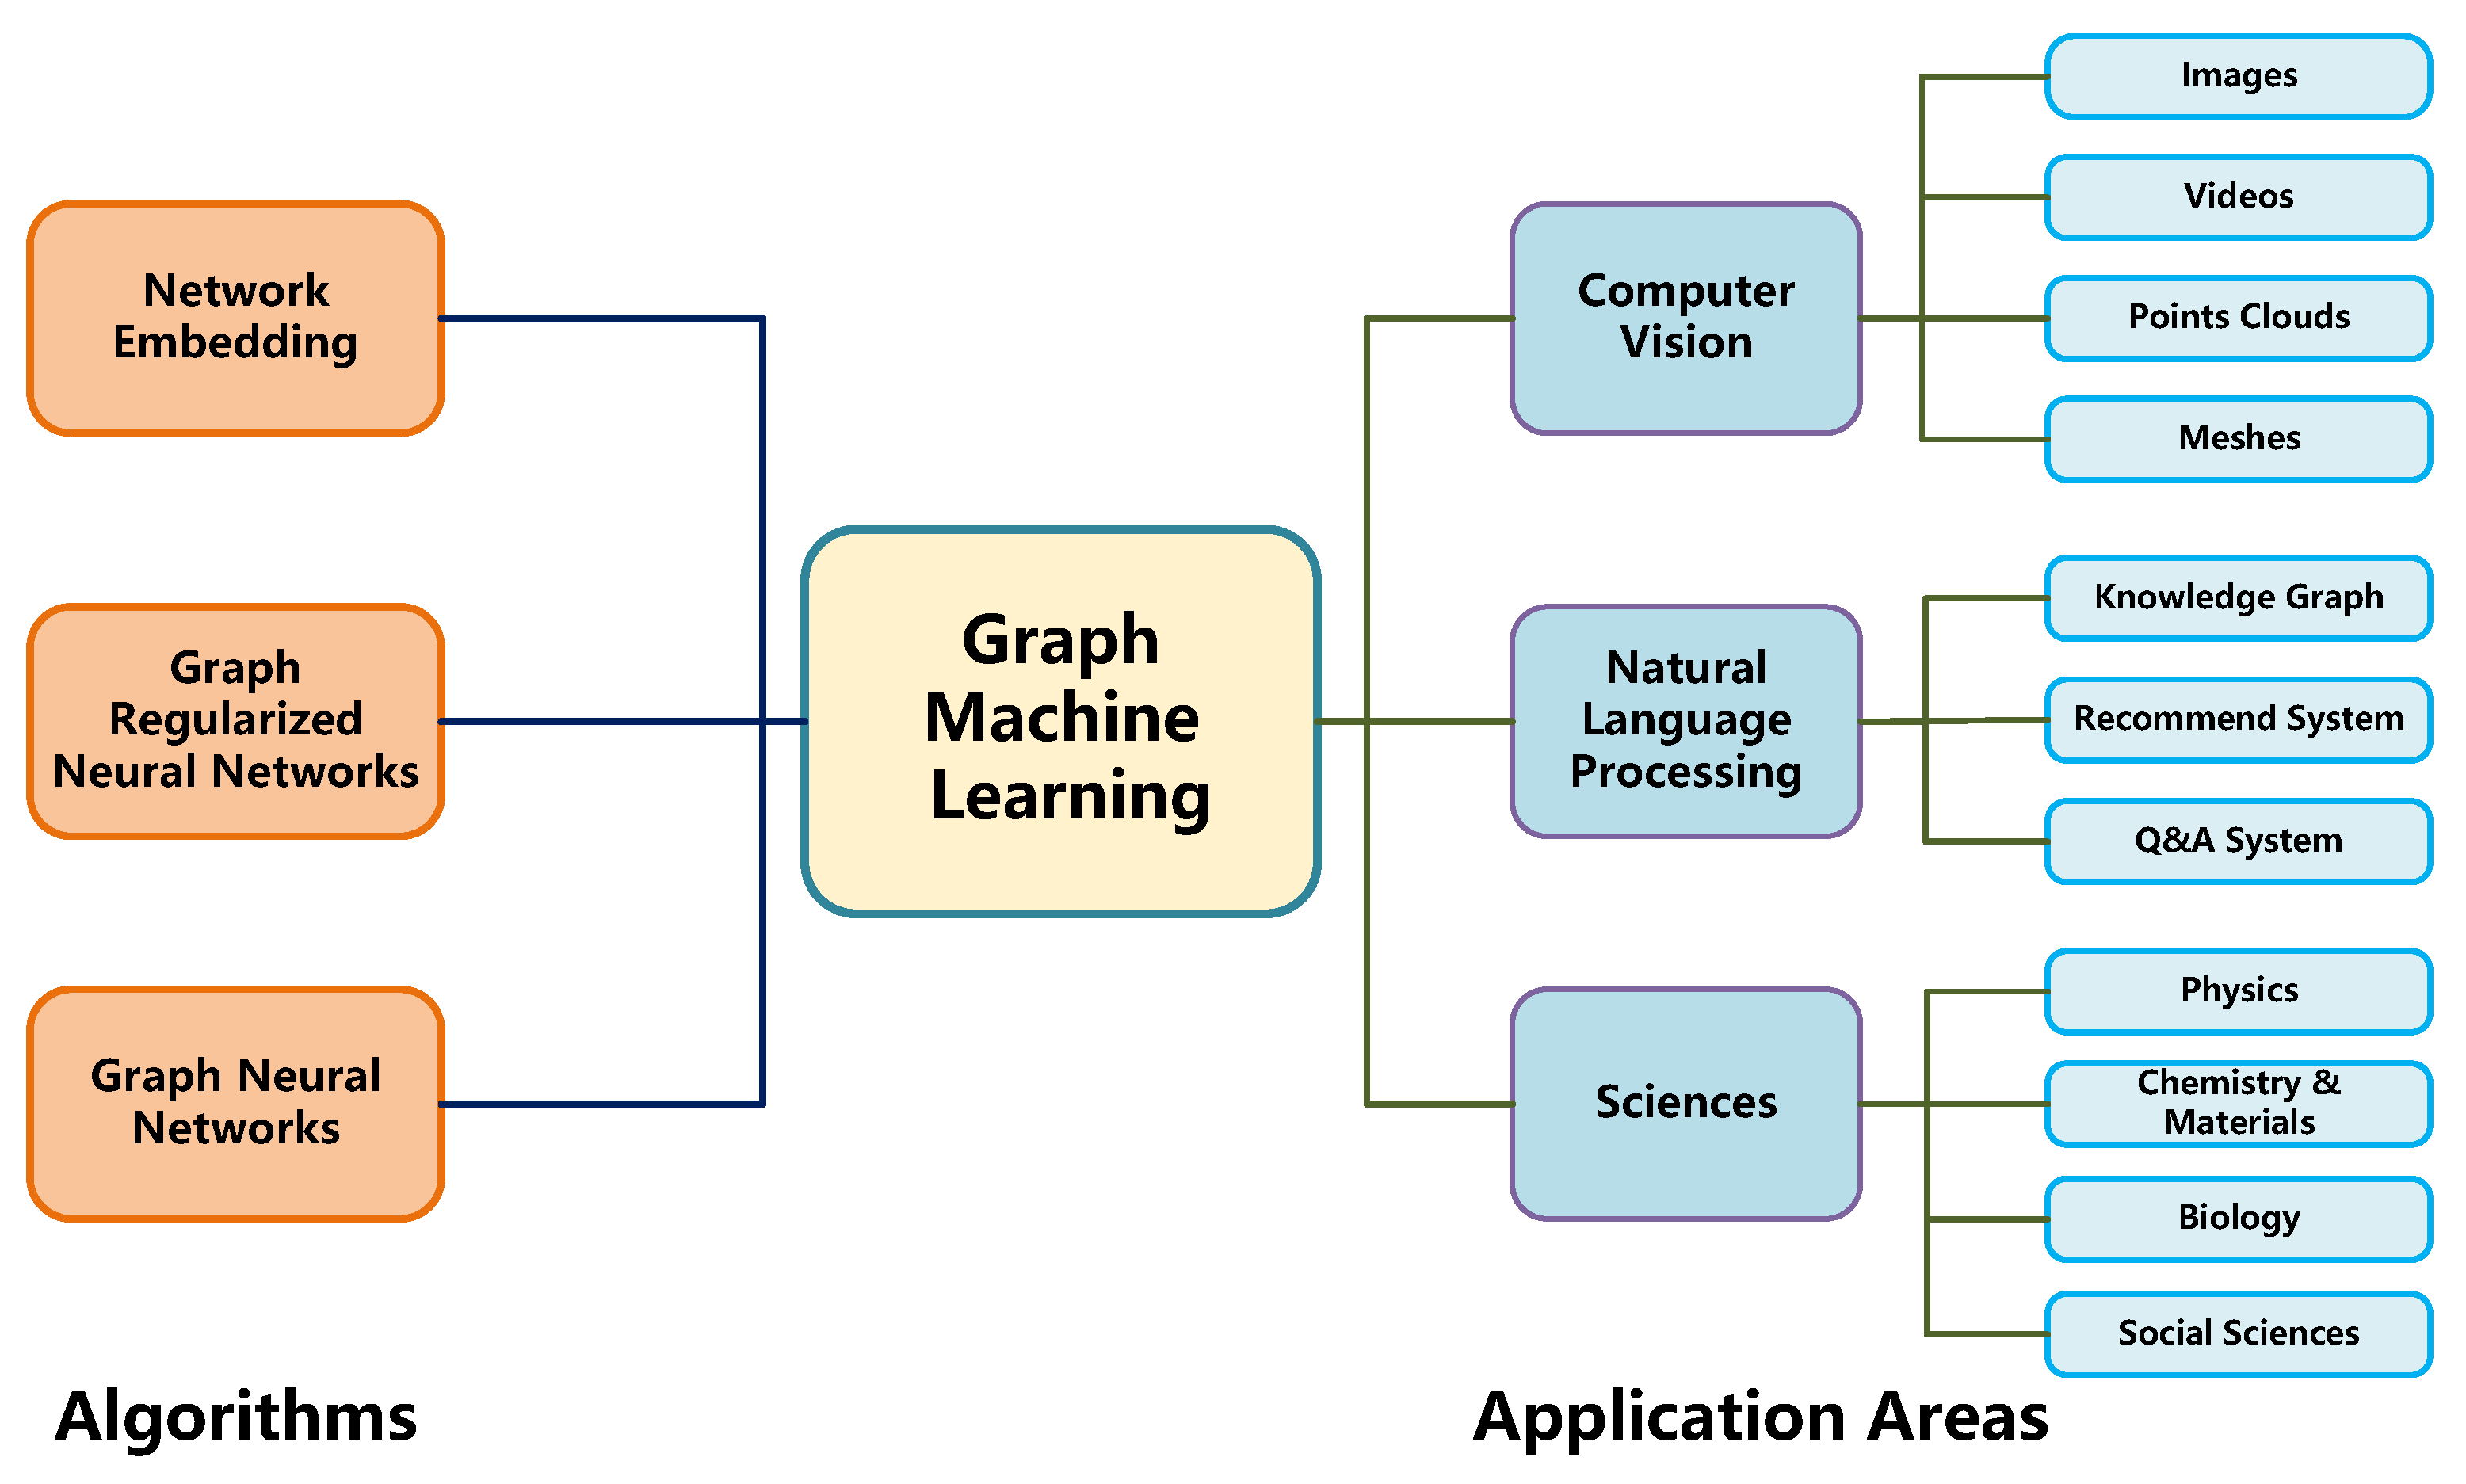
2.4. Graph Machine Learning
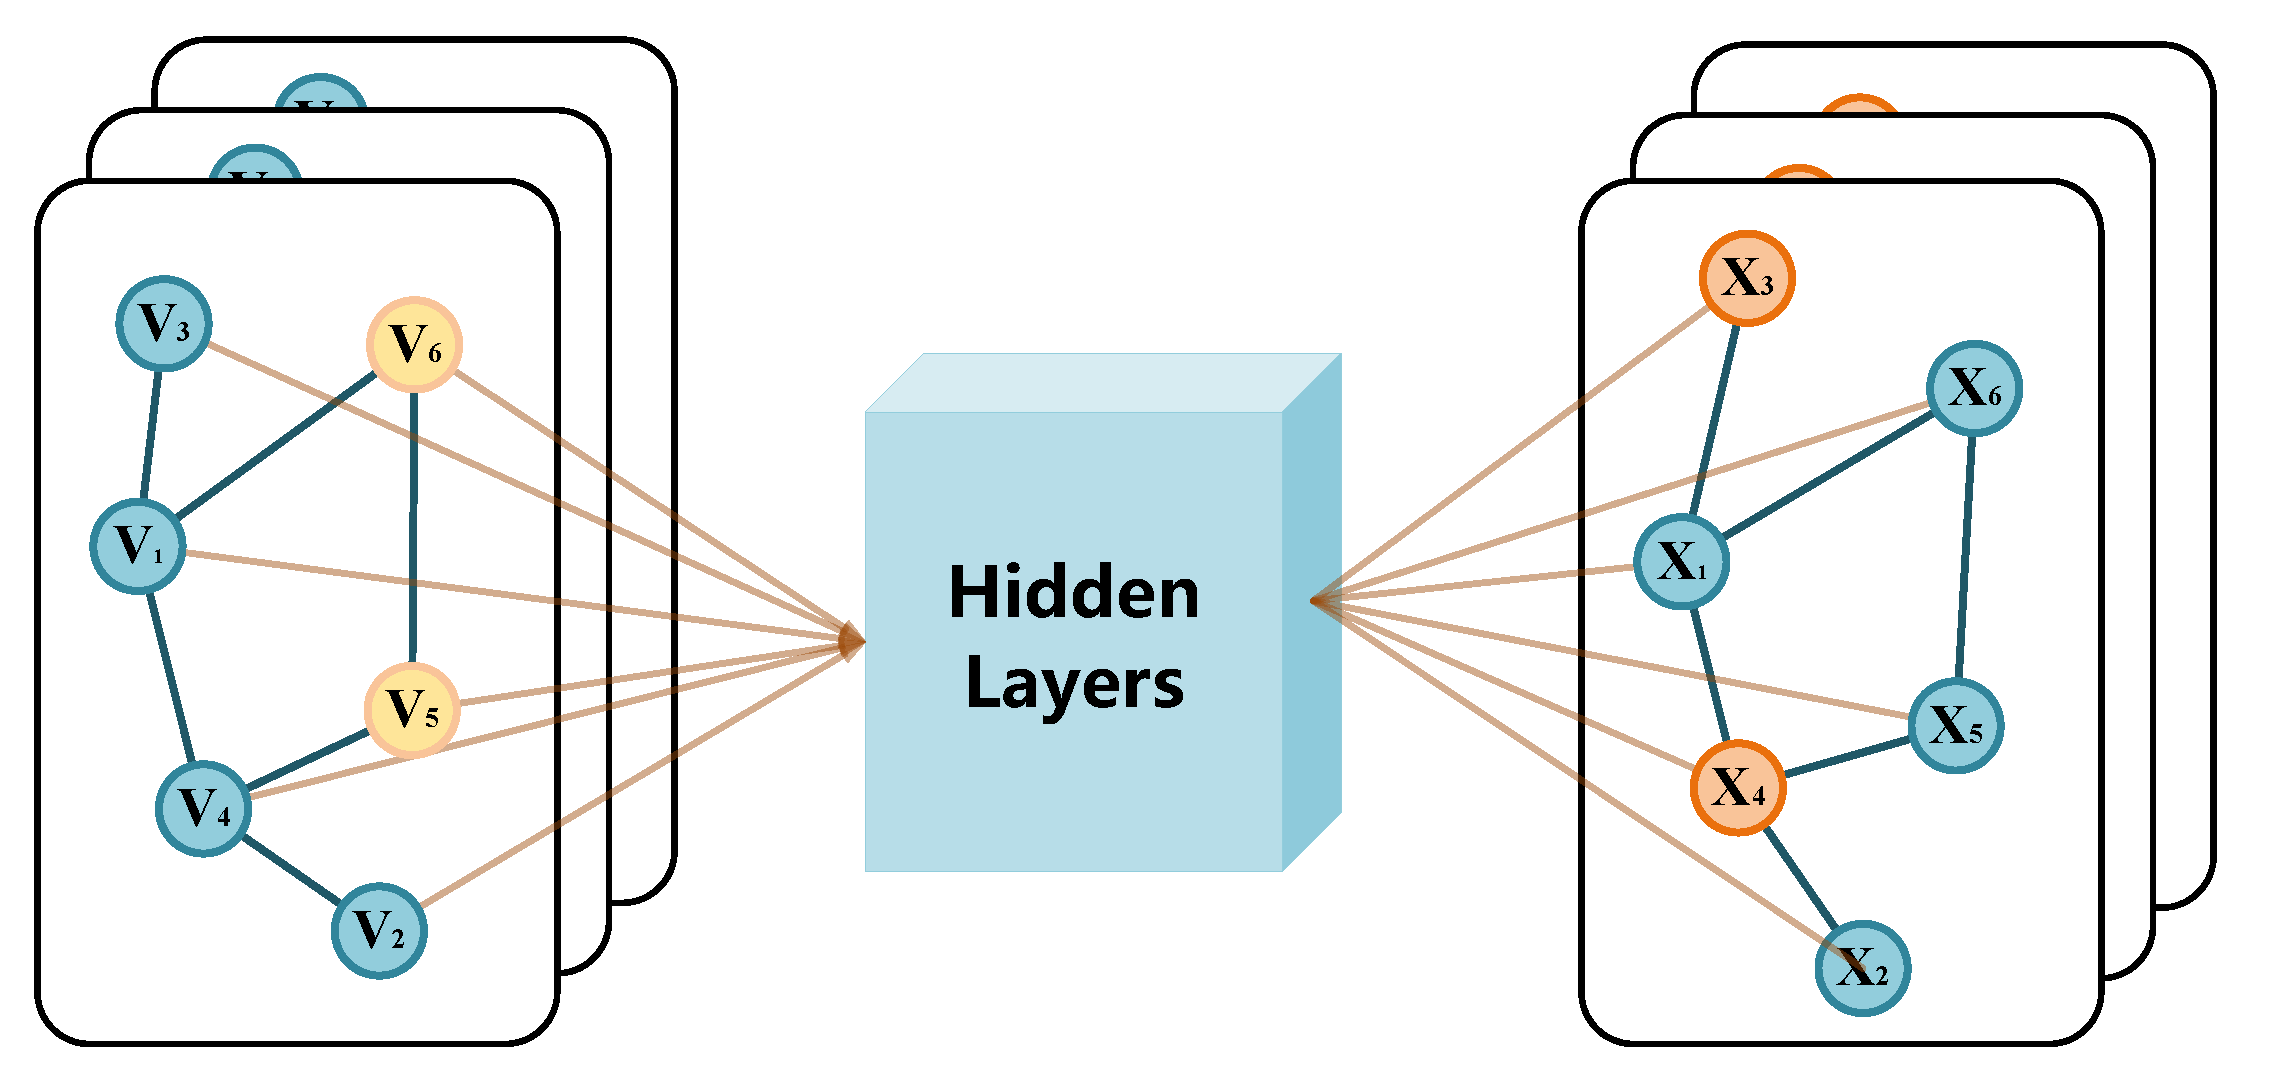
2.4.1. Graph Convolutional Neural Network
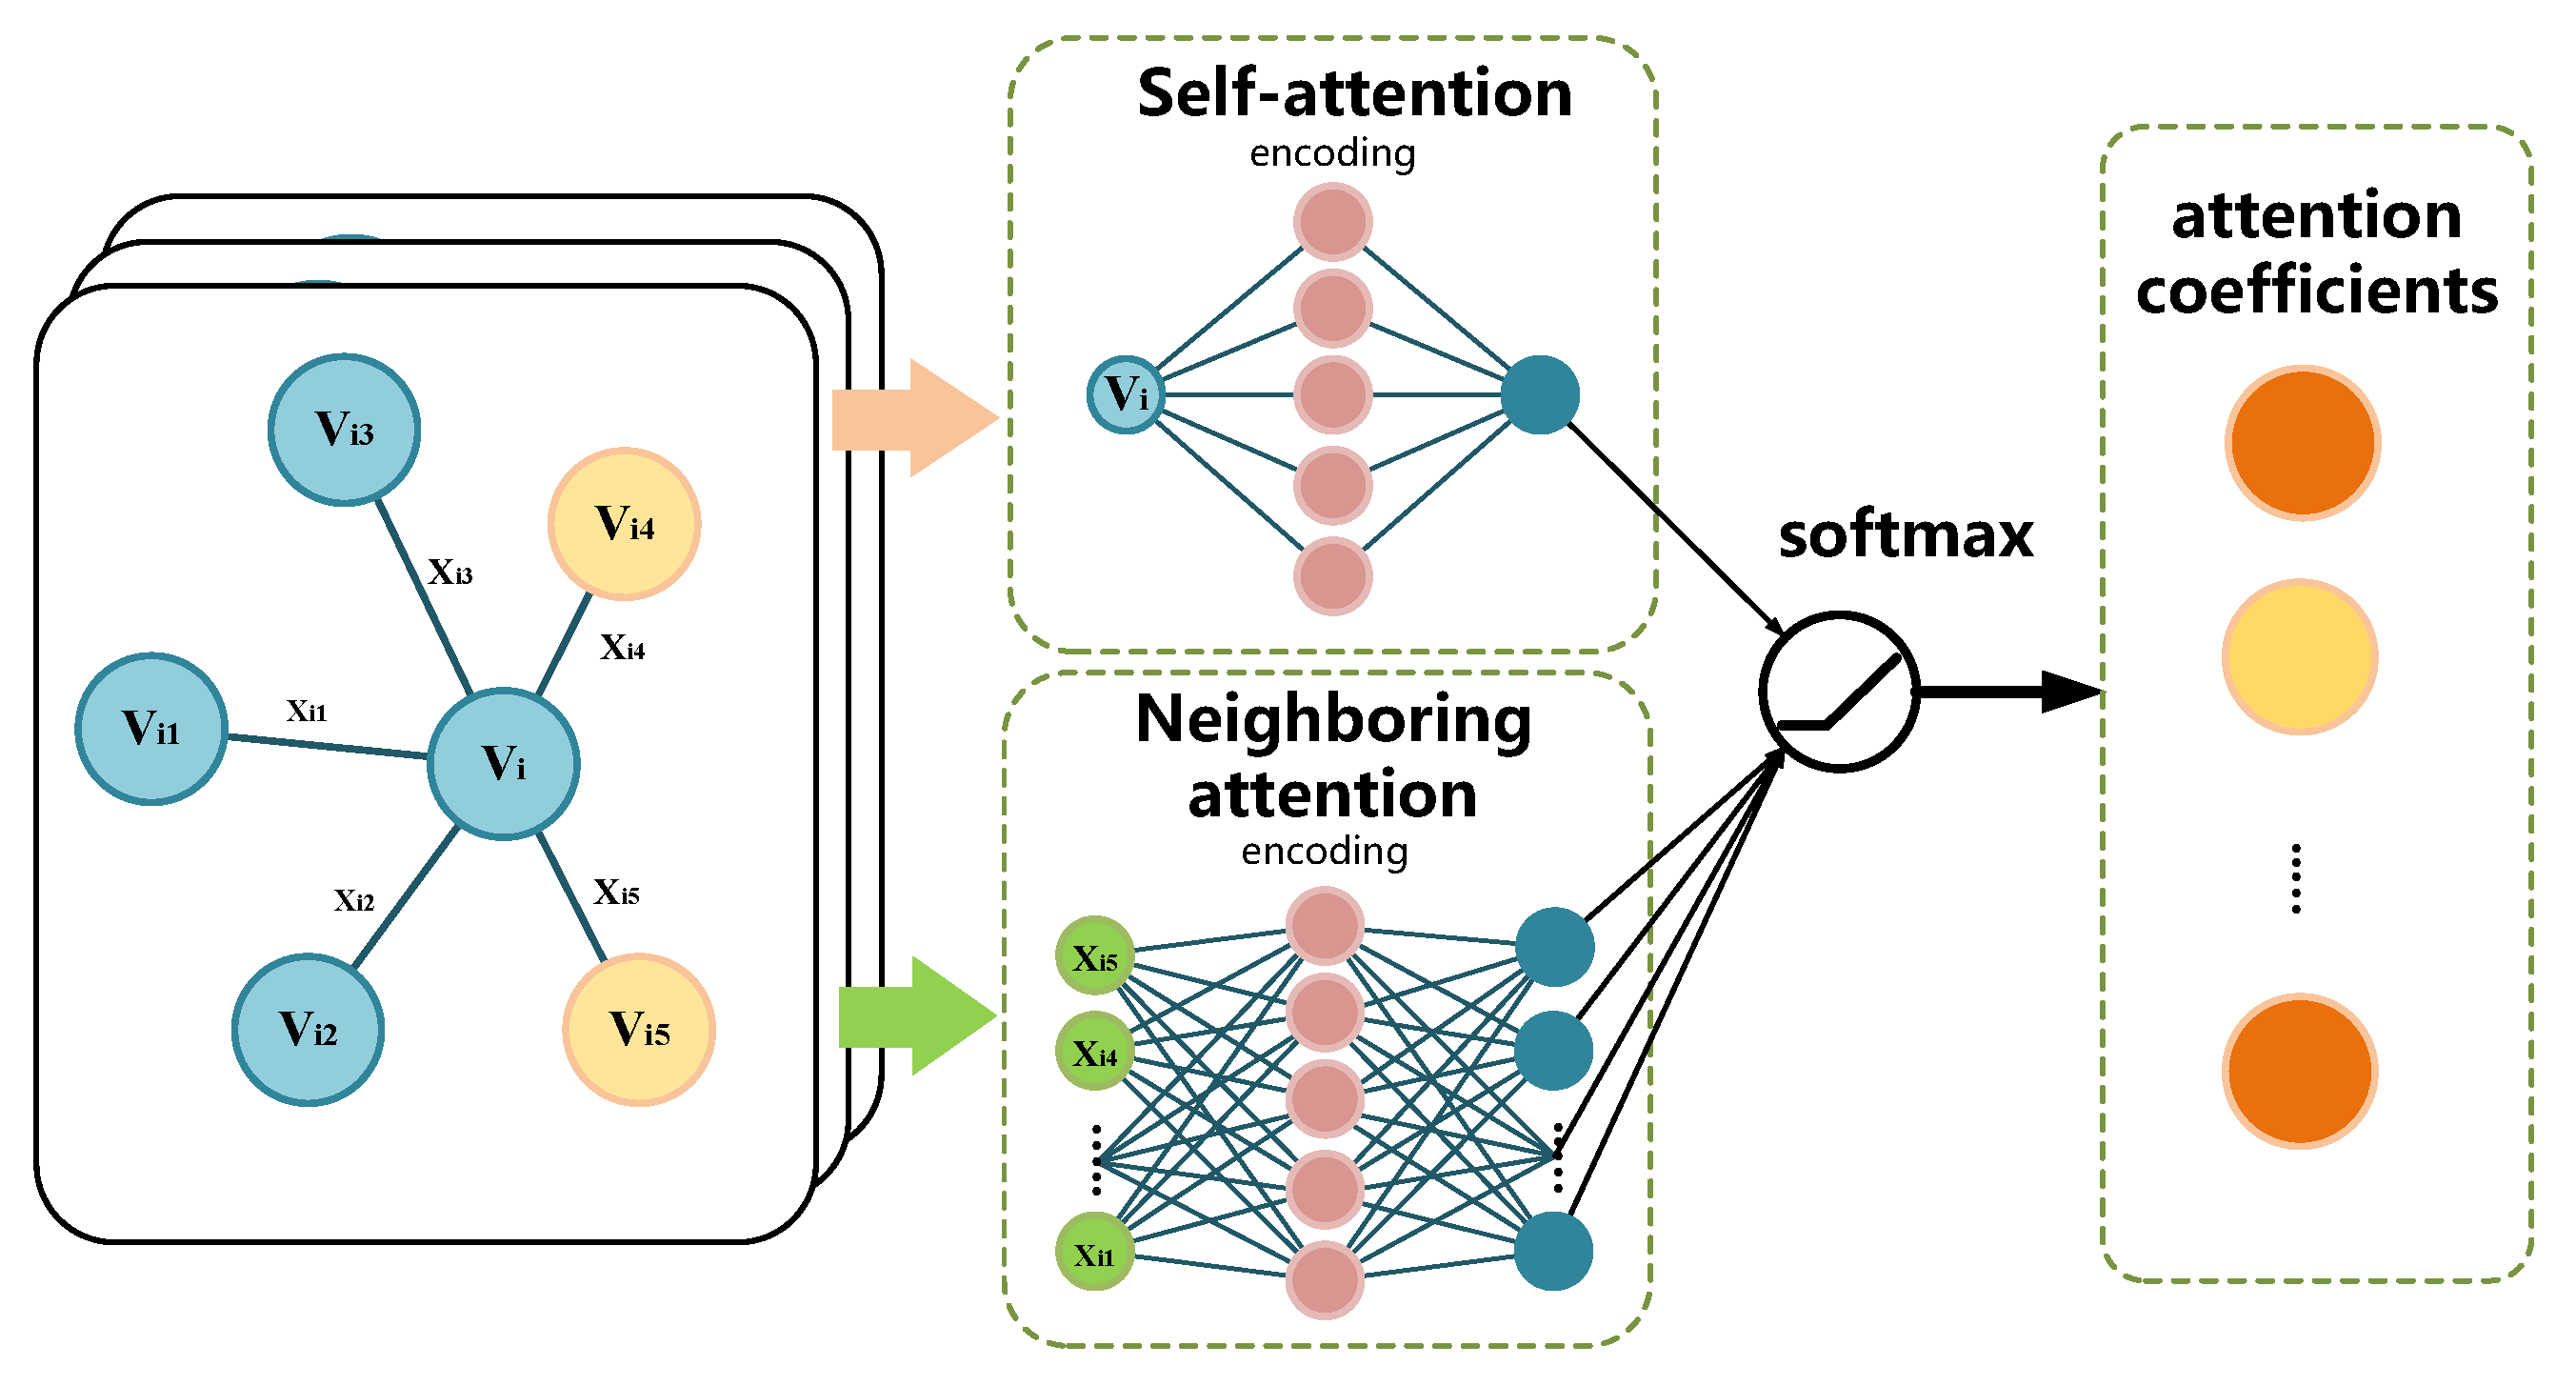
2.4.2. Graph Attention Neural Network
3. The Novel Database of Social Organizations in China
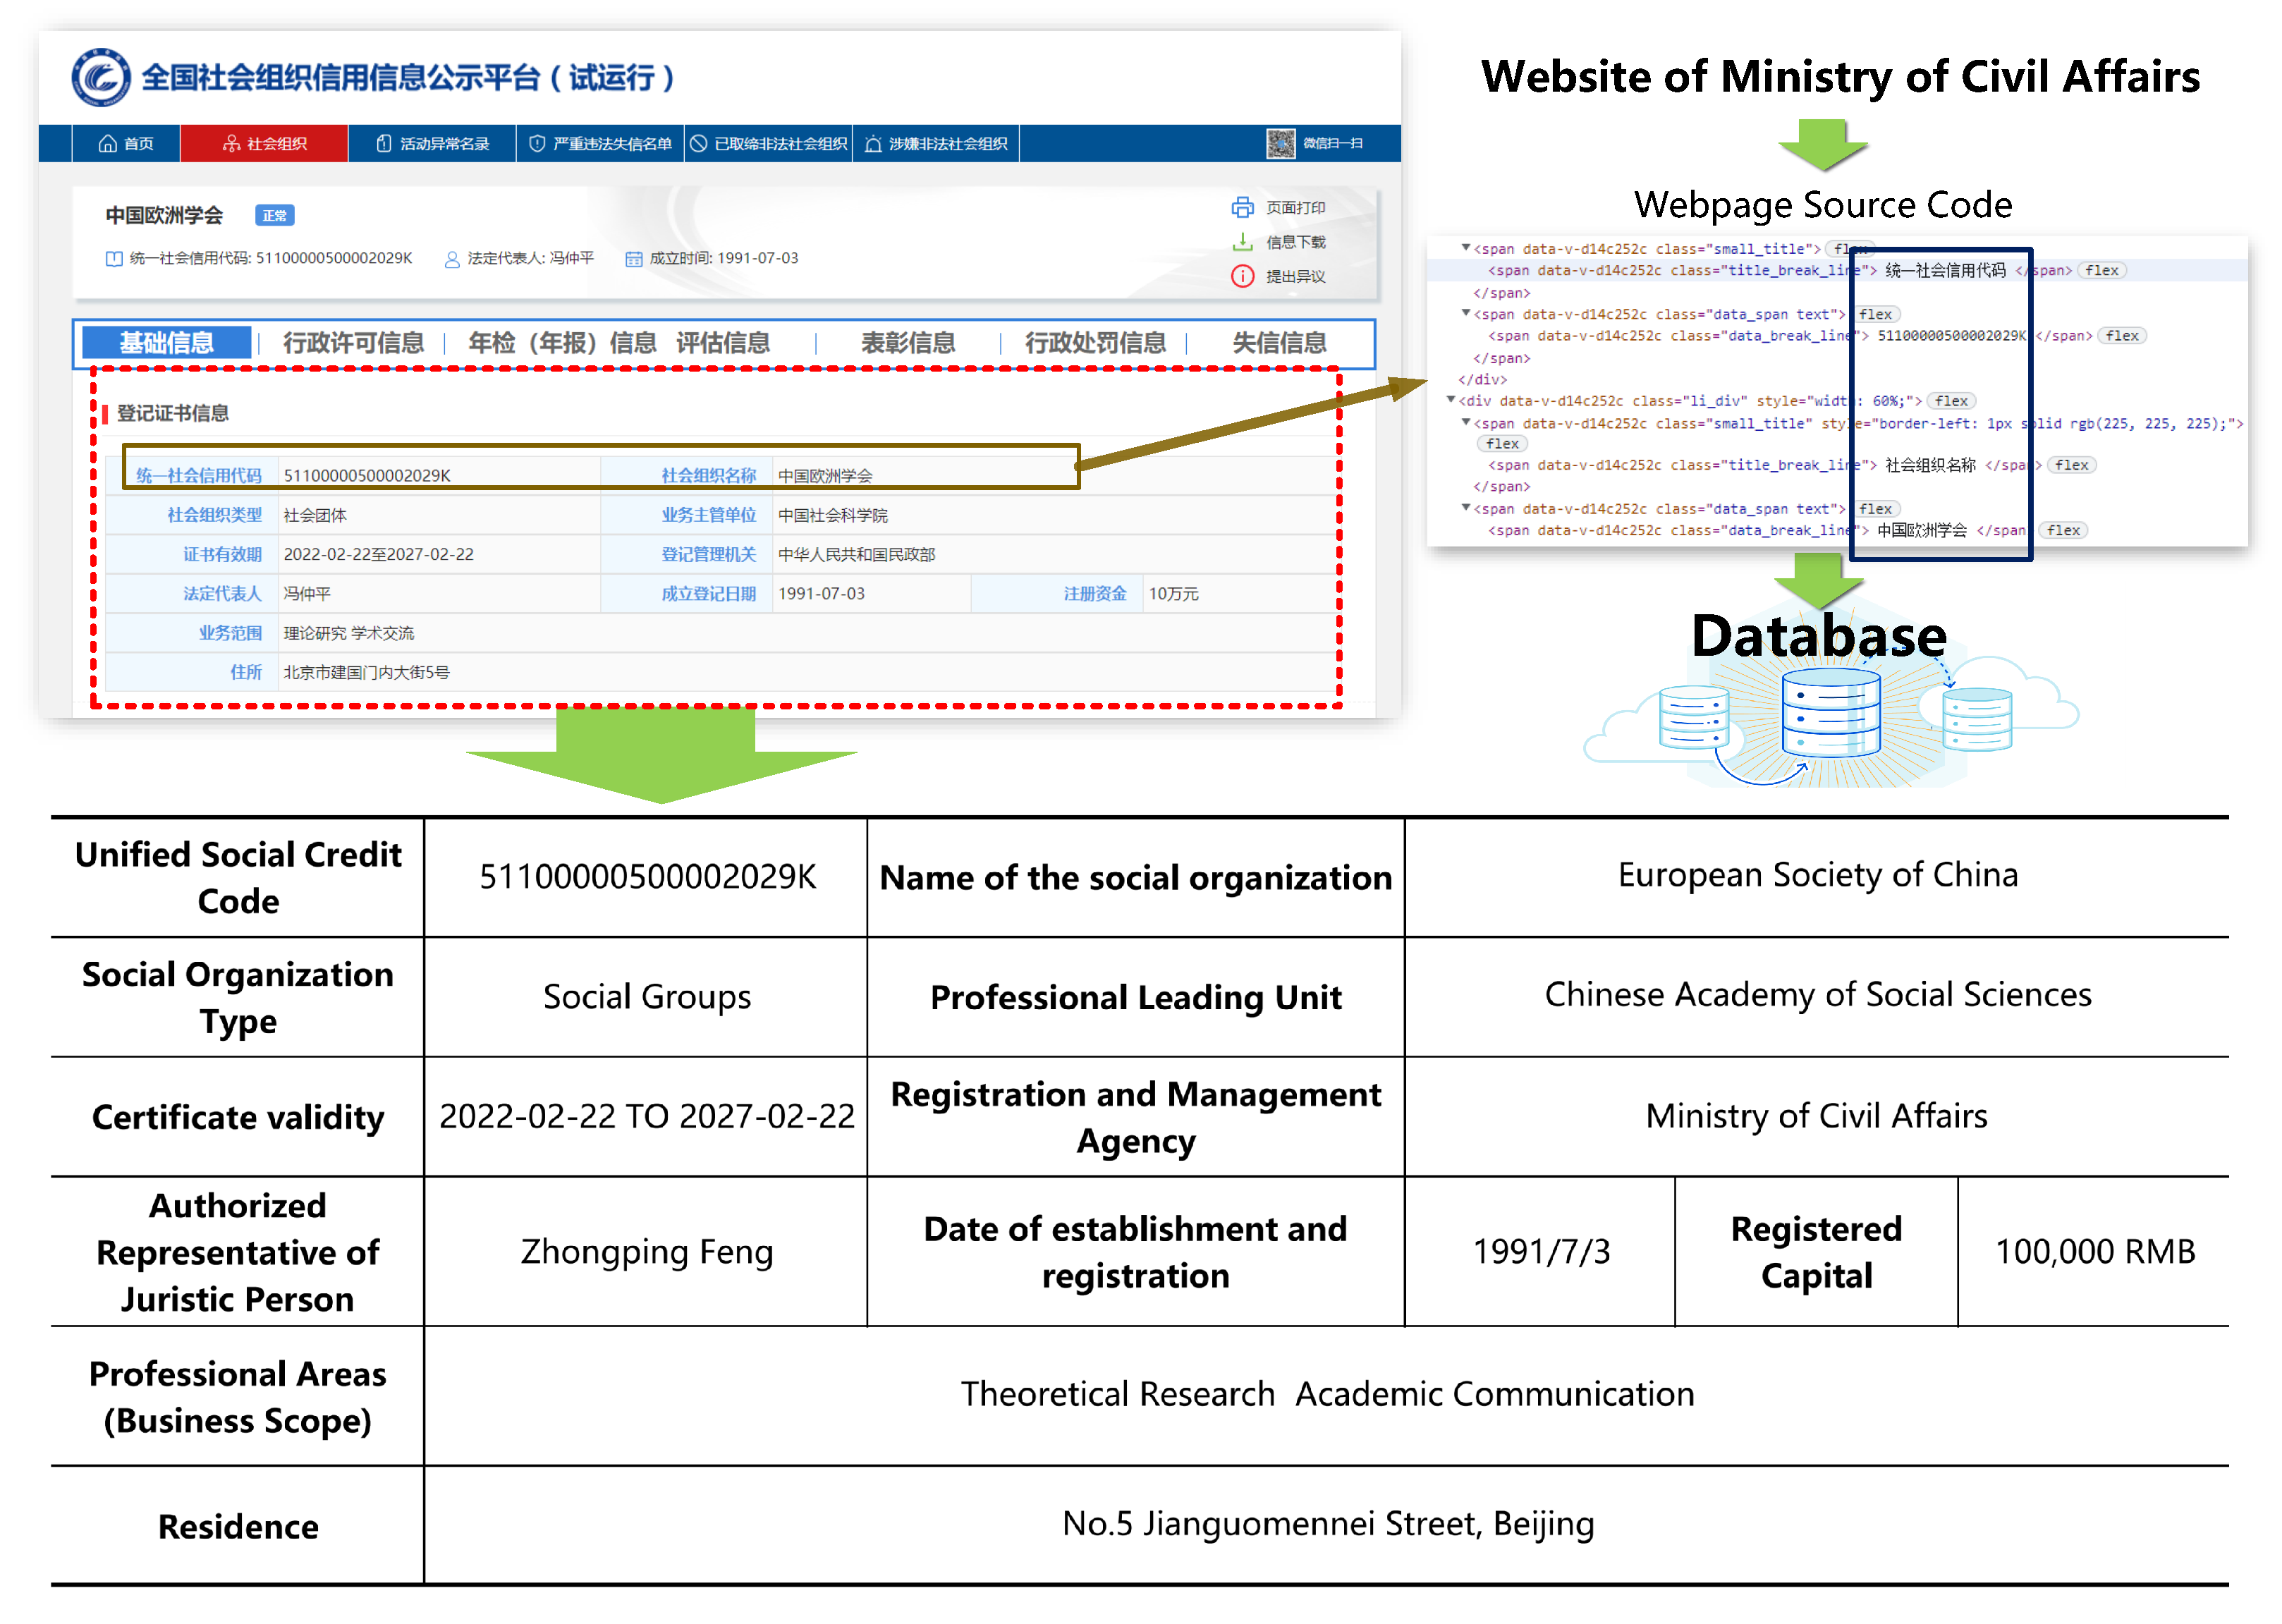
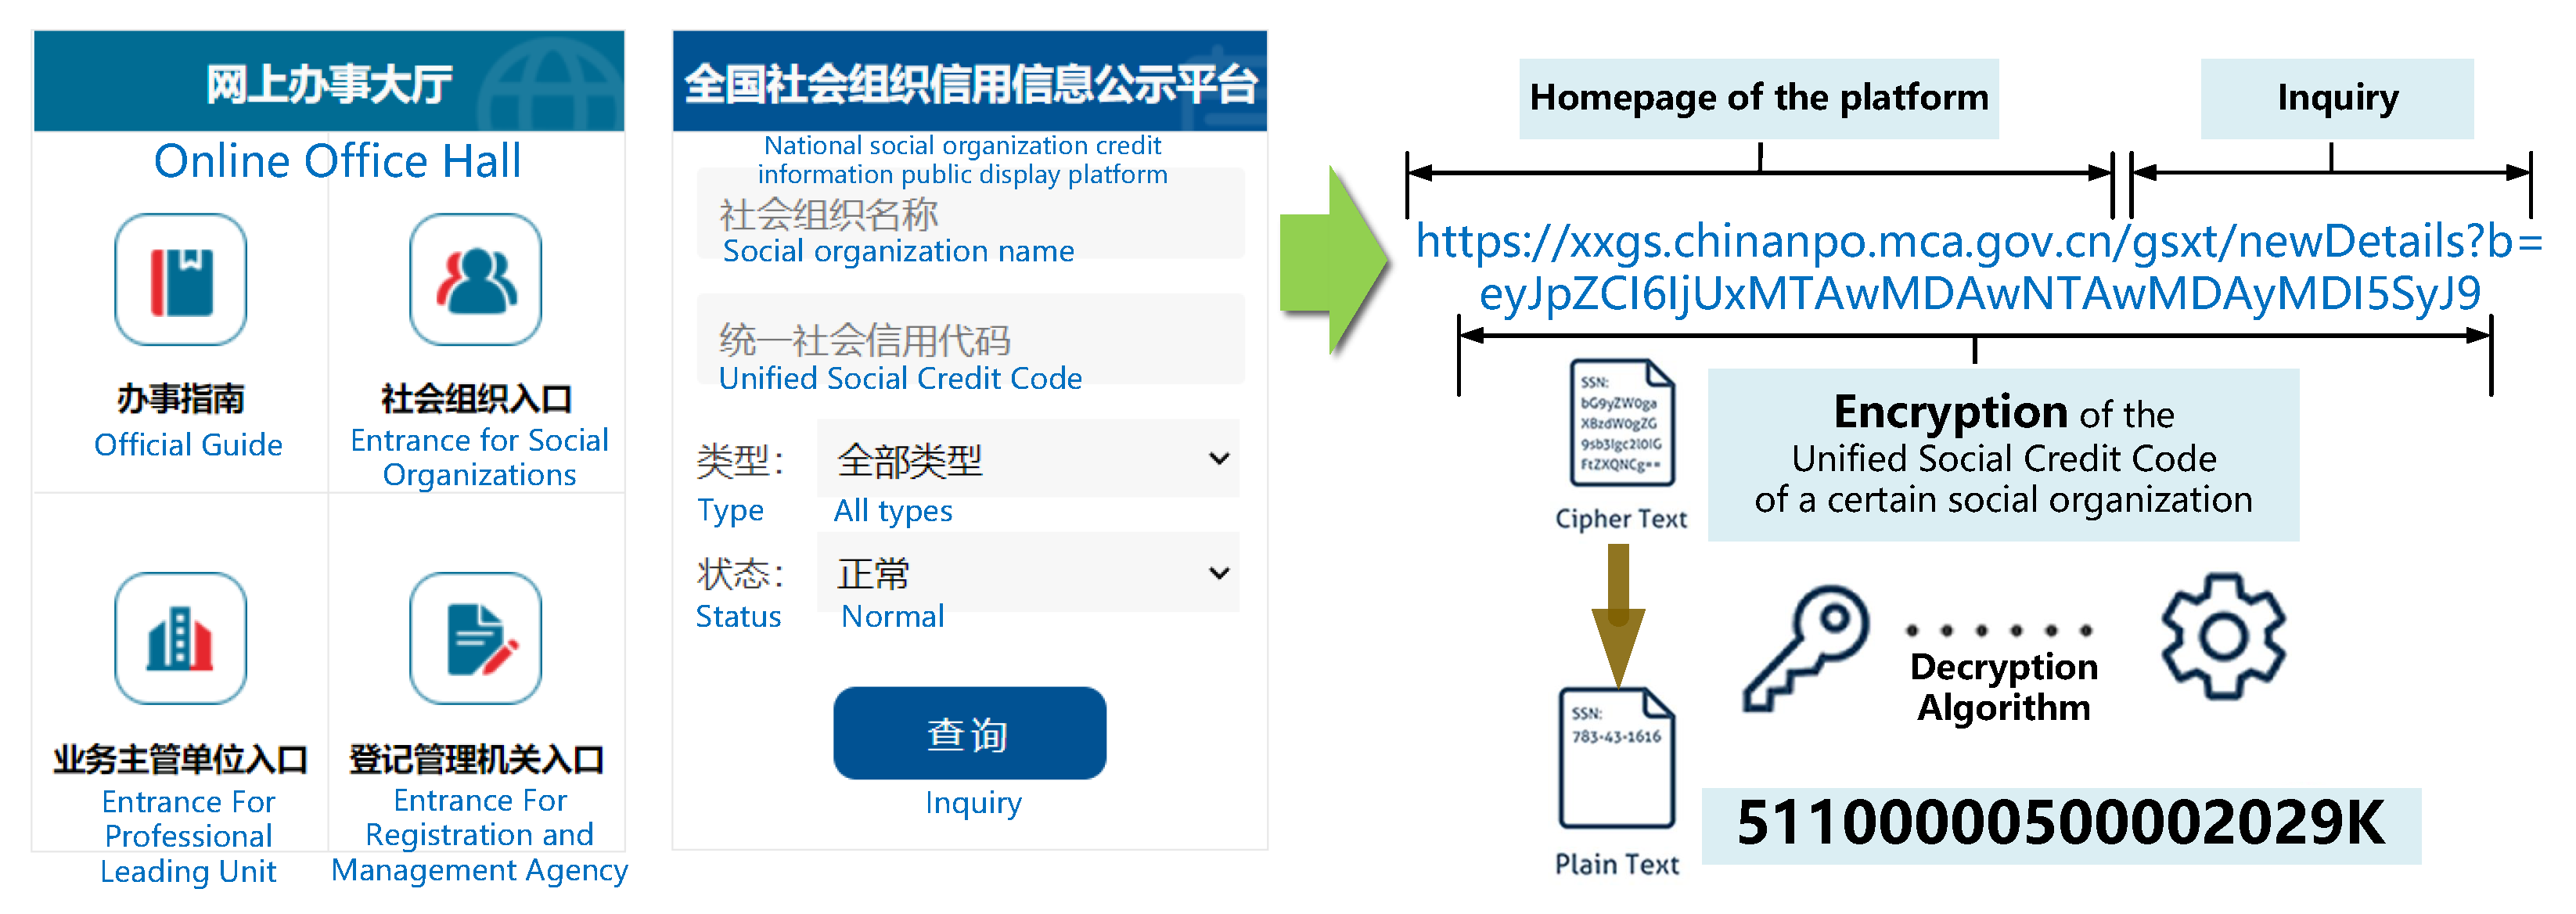
3.1. Design and Implementation of Web Crawlers
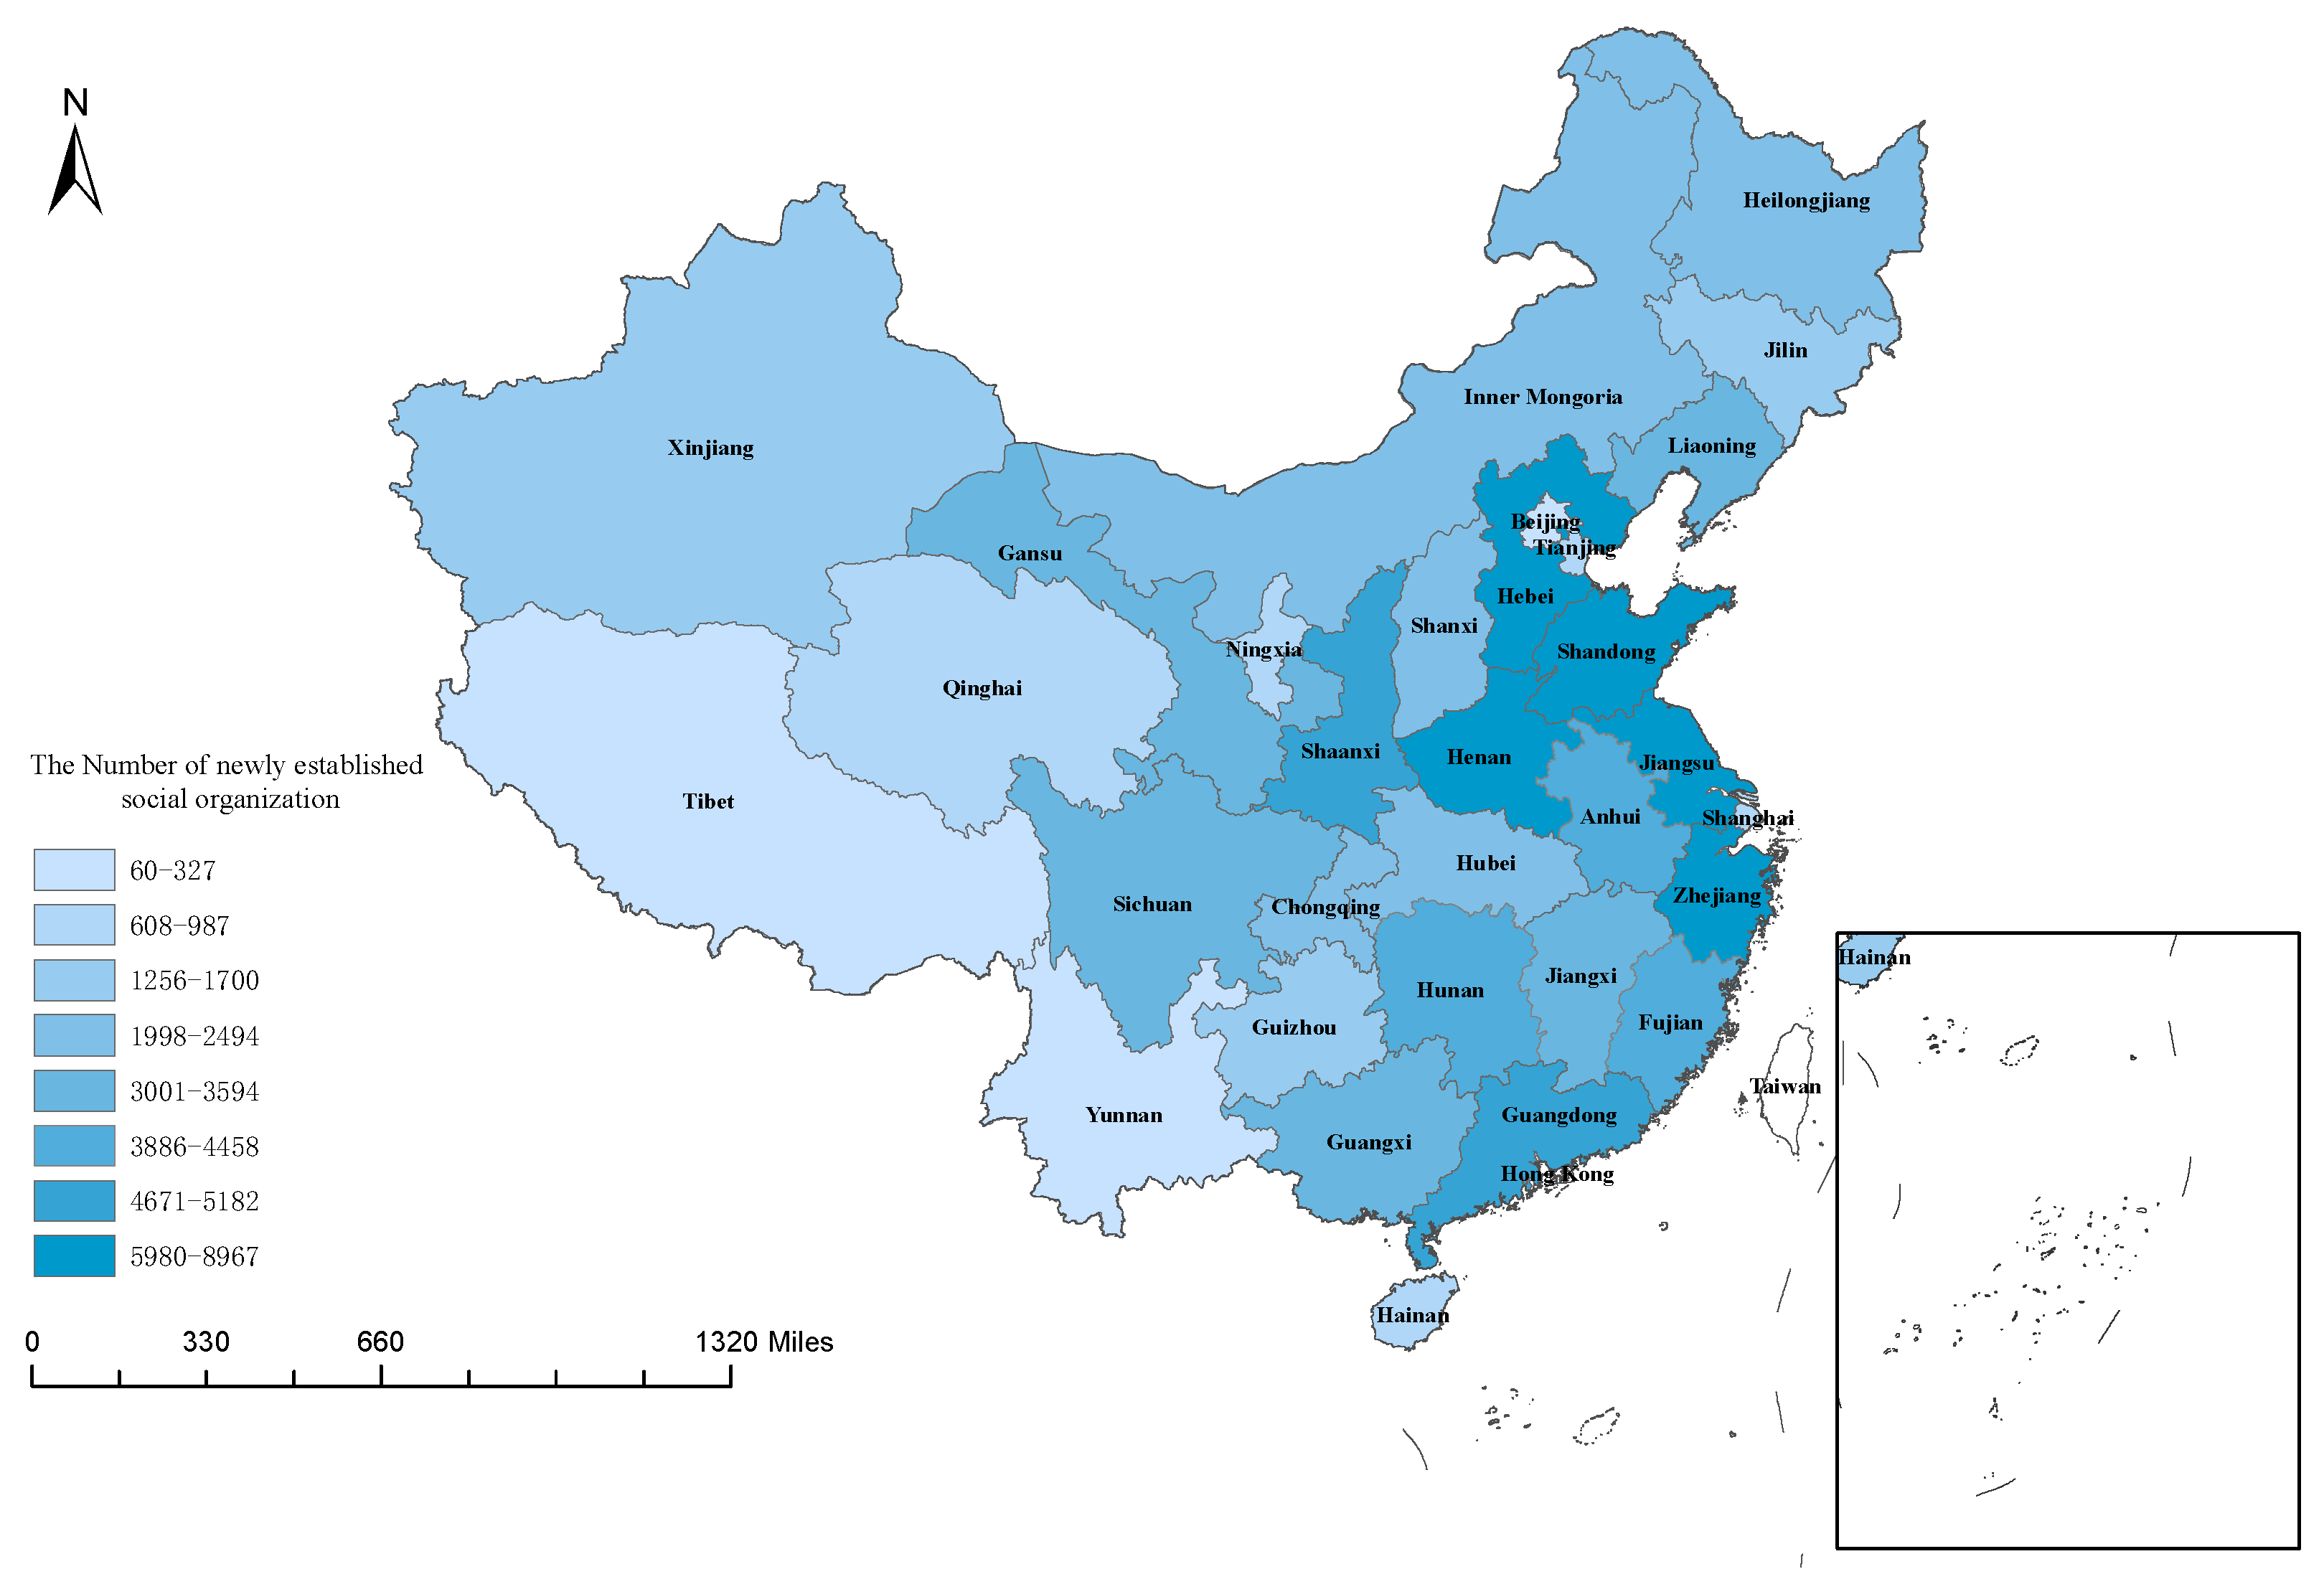
3.2. Data Cleaning and Geographic Information Integration
3.3. Text Data Analysis
4. Graph Model in Organizational Social Networks
4.1. Overview of the Graph Structure
4.2. Homogeneous Networks of Organizations
4.3. Heterogeneous Networks of Organizations
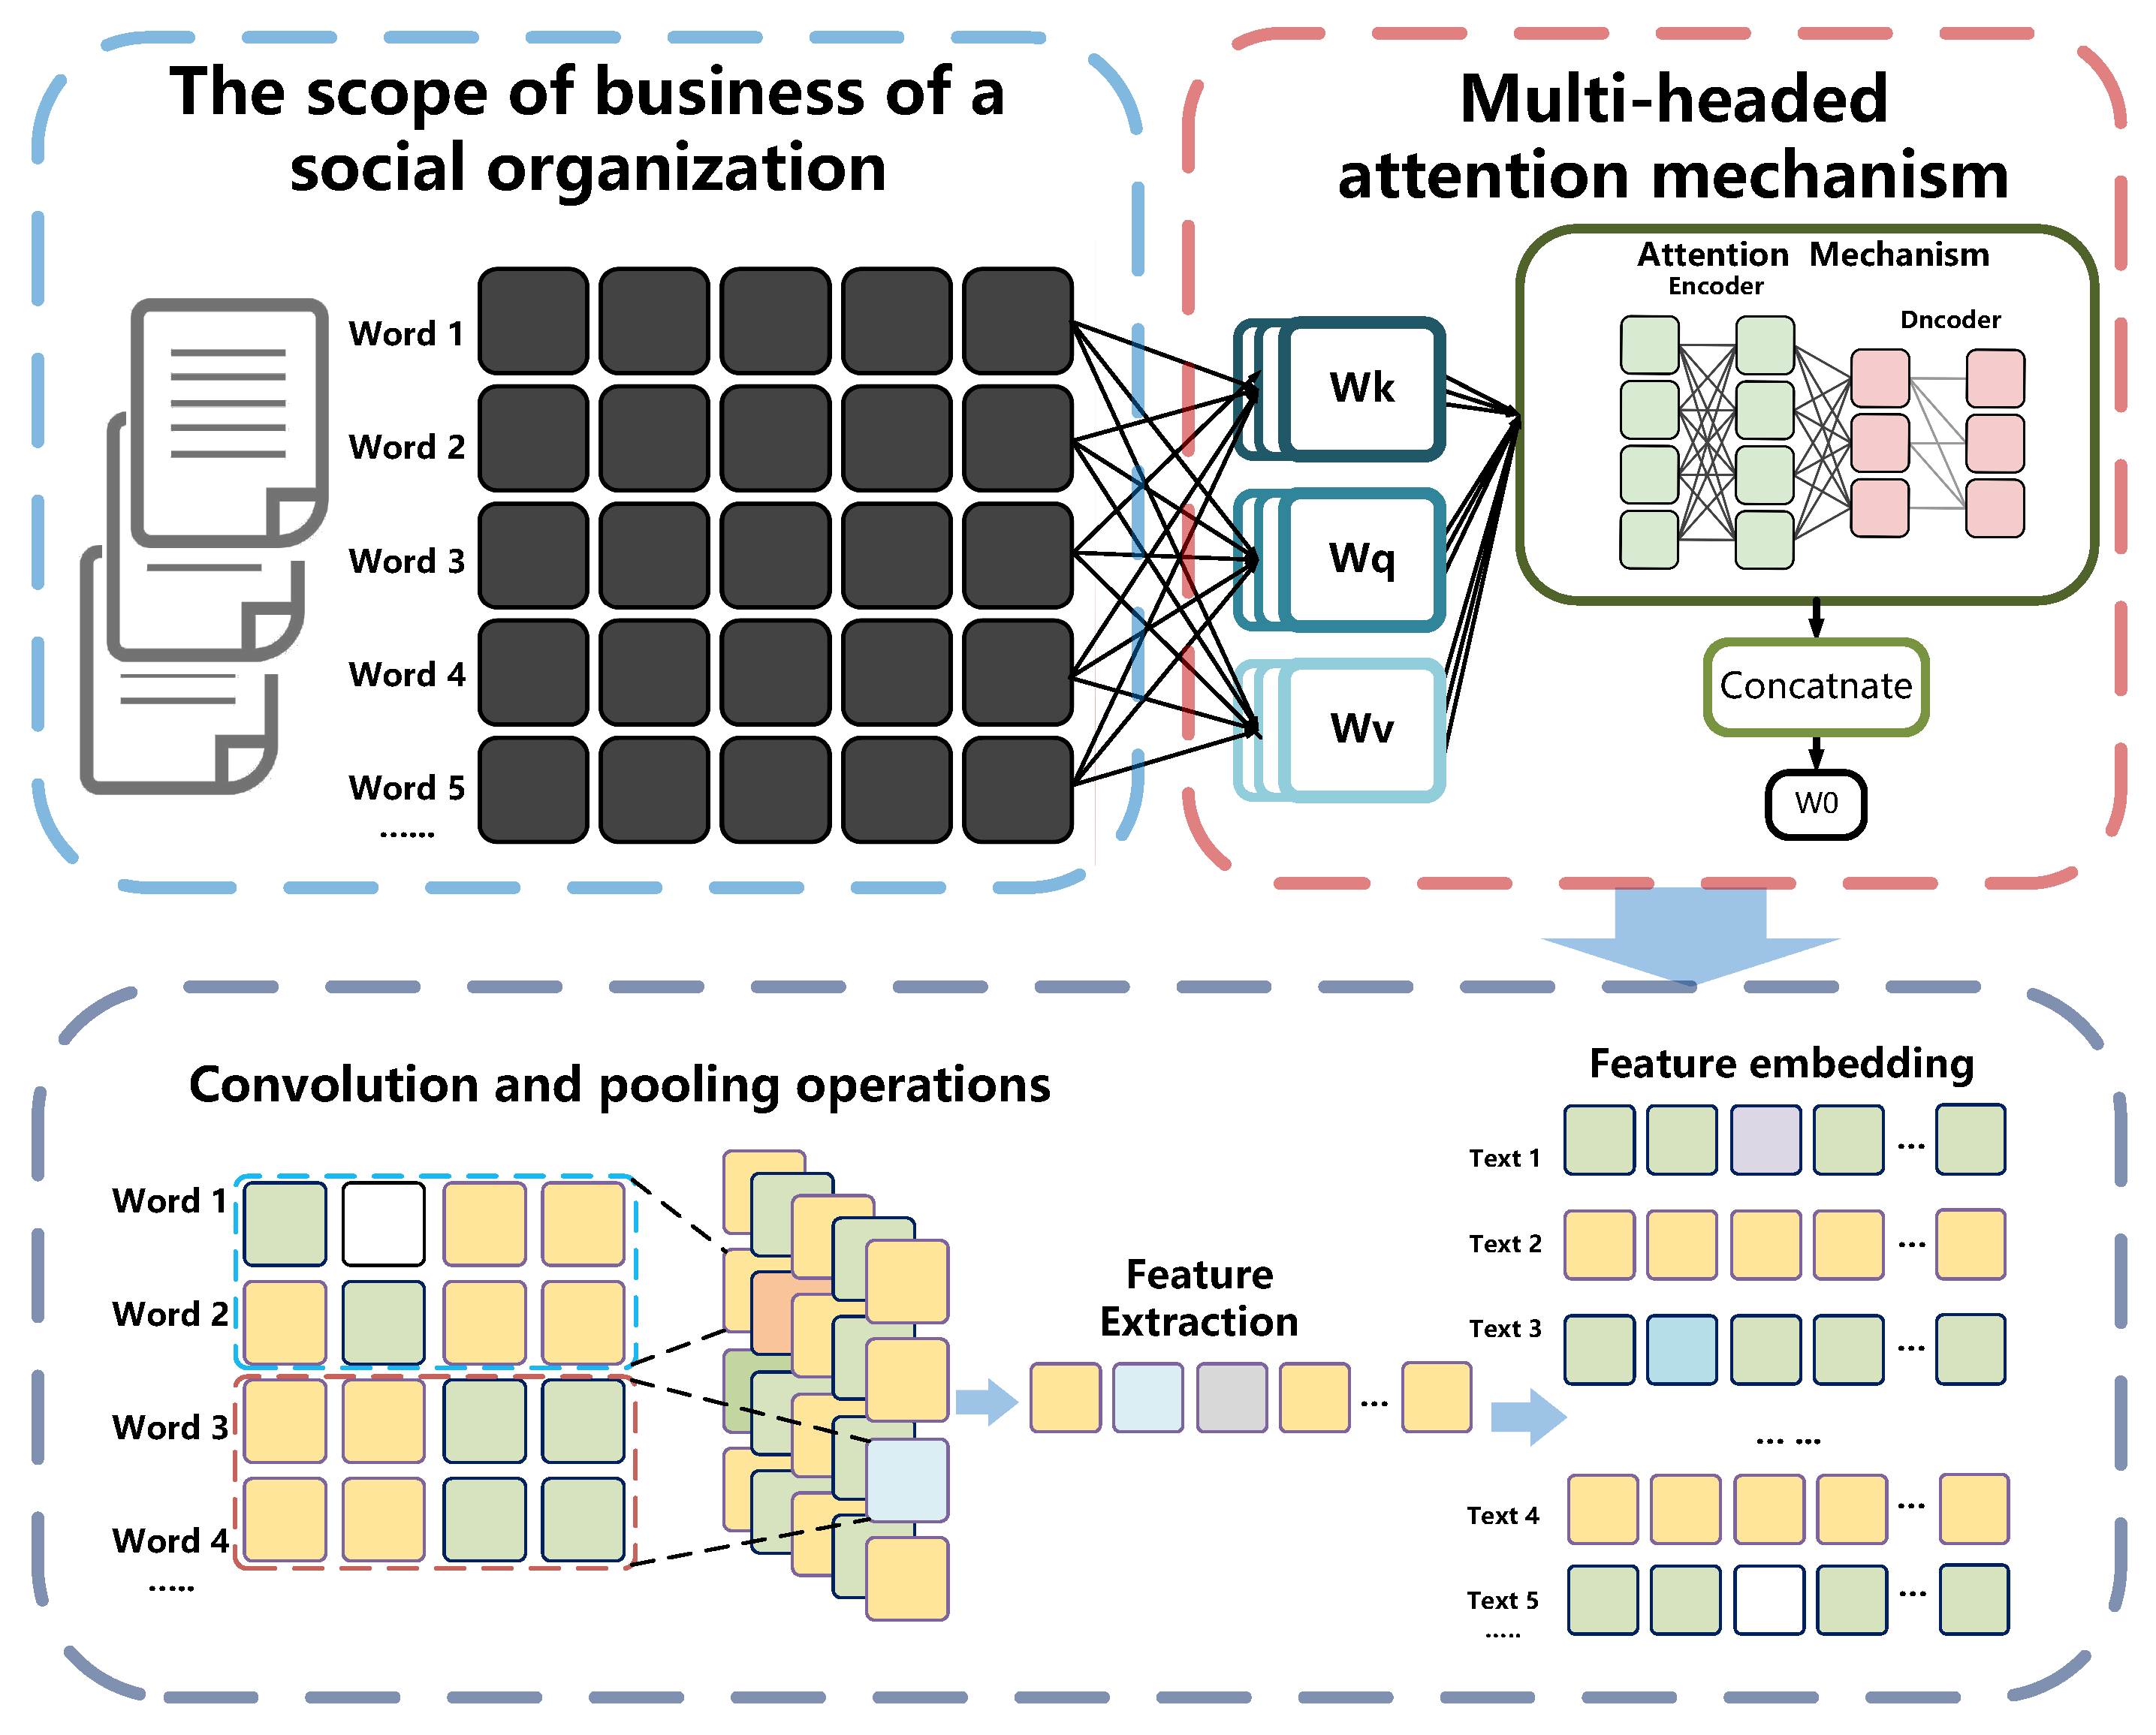
4.4. Attributed Network Embedding with Text Information
4.4.1. Multi-Headed Self-Attention Mechanism
4.4.2. Convolutional Neural Networks and Pooling Operations
5. Exploratory Analysis of Organizational Geosocial Network with Graph Machine Learning
5.1. Experimental Deployment Environment
5.2. Dataset Construction for Classification Task
5.3. Graph Attention Network Model Construction
5.4. Evaluation Metrics
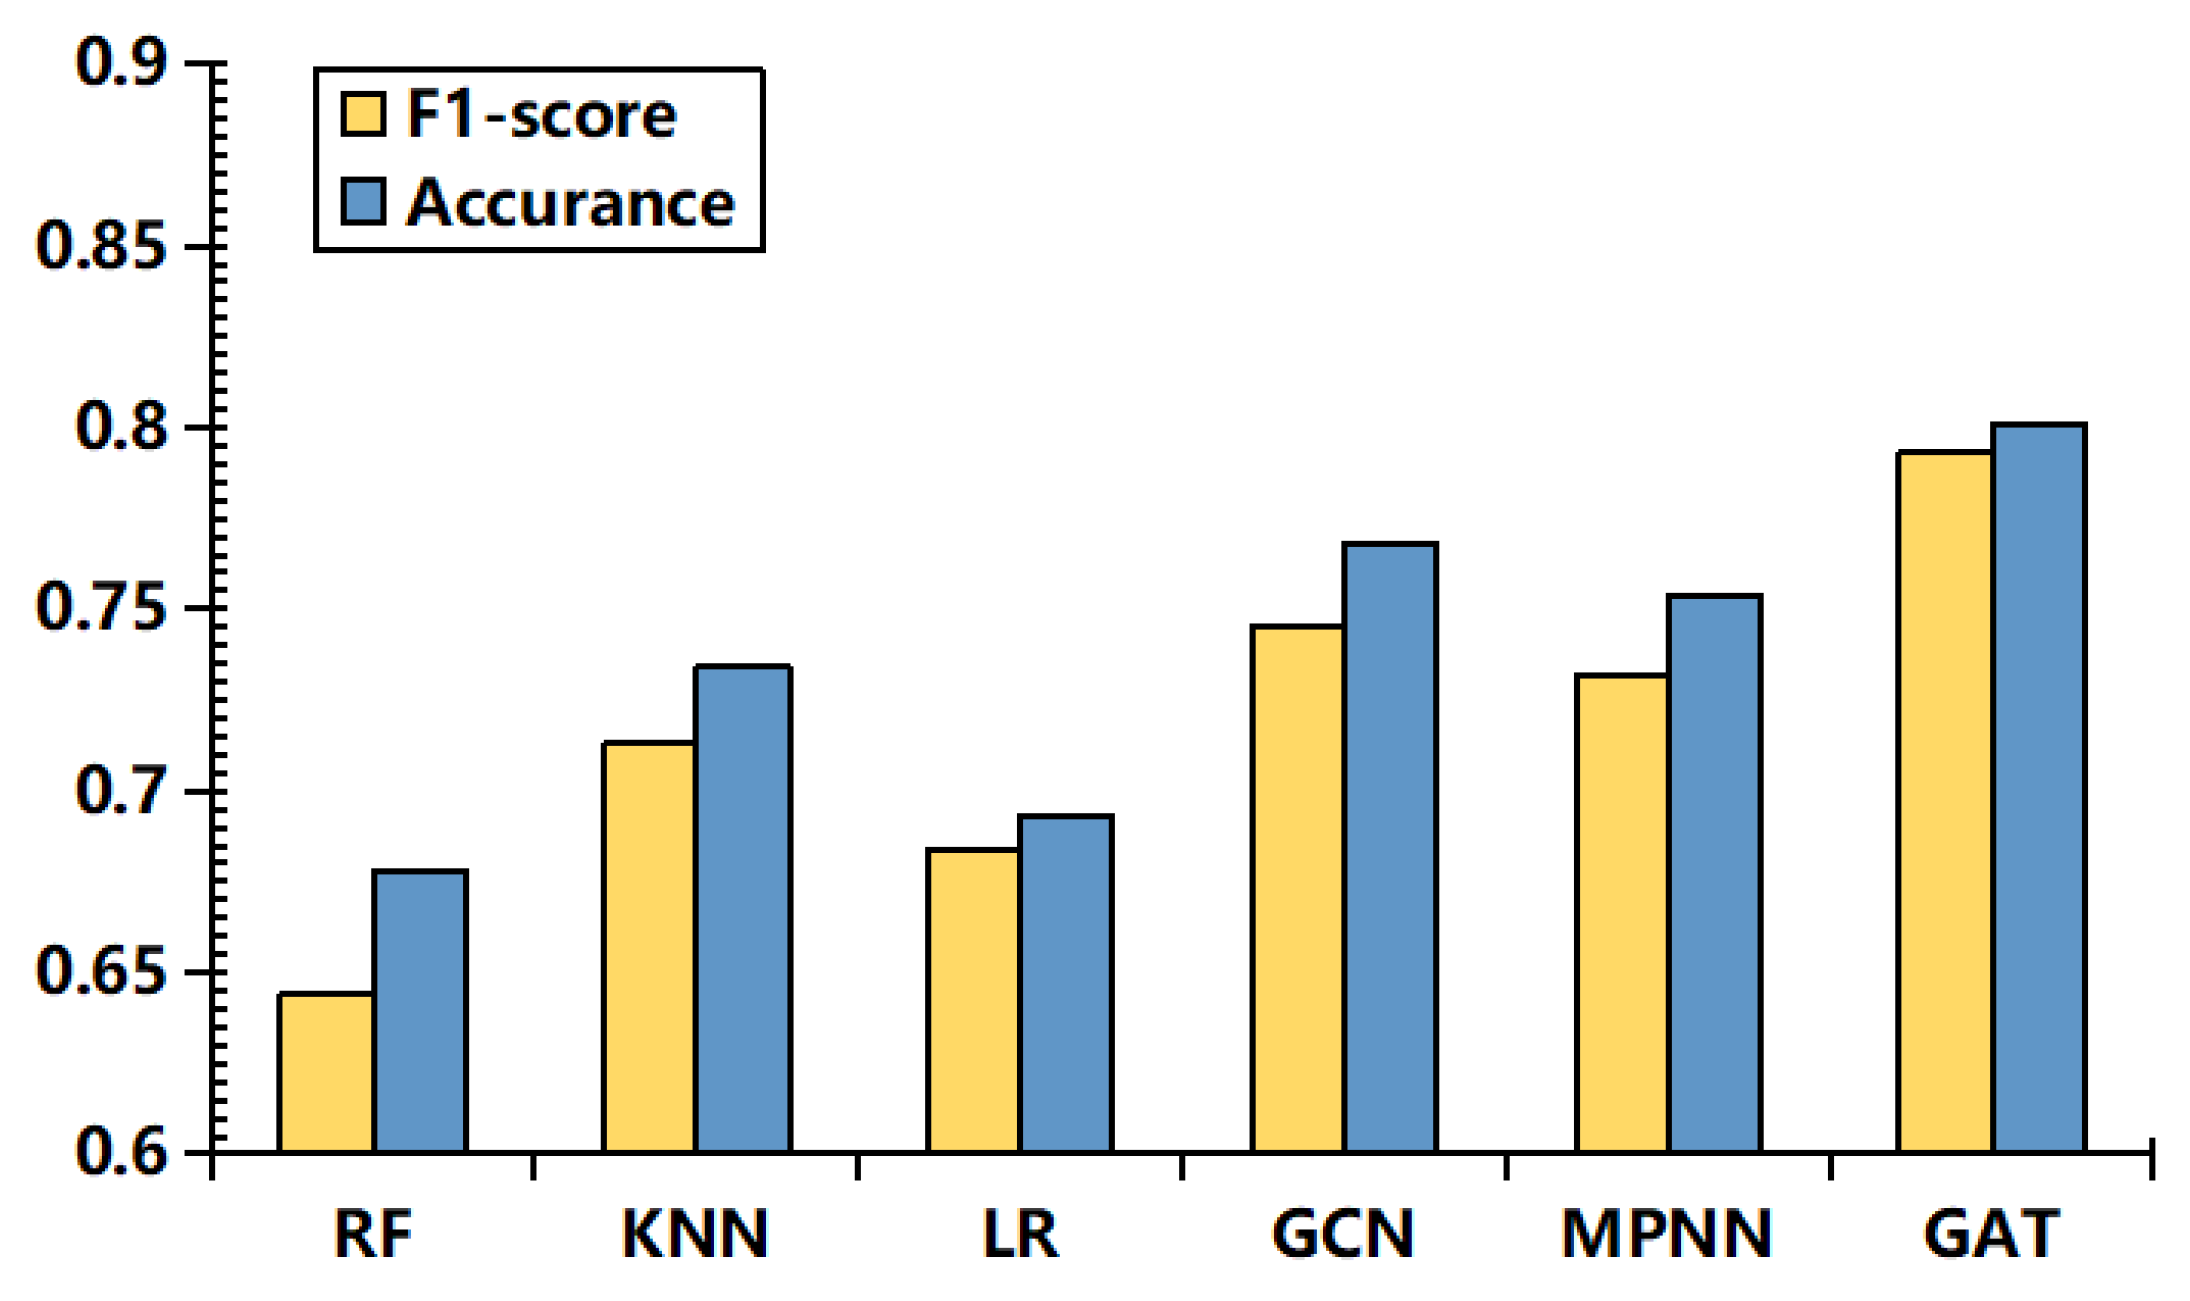
5.5. Comparison Experiments with Baseline Models
5.5.1. Machine Learning Baseline Model
5.5.2. Graph Neural Network Baseline Model
5.6. Ablation Experiment
6. Conclusions
Author Contributions
Funding
Institutional Review Board Statement
Informed Consent Statement
Data Availability Statement
Conflicts of Interest
References
- Yang, A.; Cheong, P.H. Building a Cross-Sectoral Interorganizational Network to Advance Nonprofits: NGO Incubators as Relationship Brokers in China. Nonprofit Volunt. Sect. Q. 2019, 48, 784–813. [Google Scholar] [CrossRef]
- Ianni, M.; Masciari, E.; Sperli, G. A survey of Big Data dimensions vs Social Networks analysis. J. Intell. Inf. Syst. 2021, 57, 73–100. [Google Scholar] [CrossRef] [PubMed]
- Wasserman, S.; Faust, K. Social Network Analysis: Methods and Applications; Cambridge University Press: Cambridge, MA, USA, 1994. [Google Scholar]
- Xiang, Y.; Fujimoto, K.; Schneider, J.; Jia, Y.; Zhi, D.; Tao, C. Network context matters: Graph convolutional network model over social networks improves the detection of unknown HIV infections among young men who have sex with men. J. Am. Med. Inform. Assoc. 2019, 26, 1263–1271. [Google Scholar] [CrossRef] [PubMed]
- Peng, H.; Li, J.; Song, Y.; Yang, R.; Ranjan, R.; Yu, P.S.; He, L. Streaming Social Event Detection and Evolution Discovery in Heterogeneous Information Networks. ACM Trans. Knowl. Discov. Data 2021, 15, 1–33. [Google Scholar] [CrossRef]
- Boyd, D.M.; Ellison, N.B. Social Network Sites: Definition, History, and Scholarship. J. Comput.-Mediat. Commun. 2007, 13, 210–230. [Google Scholar] [CrossRef] [Green Version]
- Dhand, A.; White, C.C.; Johnson, C.; Xia, Z.; De Jager, P.L. A scalable online tool for quantitative social network assessment reveals potentially modifiable social environmental risks. Nat. Commun. 2018, 9, 3930. [Google Scholar] [CrossRef]
- Bonacich, P. Some unique properties of eigenvector centrality. Soc. Netw. 2007, 29, 555–564. [Google Scholar] [CrossRef]
- Gong, H.; Chen, C.; Bialostozky, E.; Lawson, C.T. A GPS/GIS method for travel mode detection in New York City. Comput. Environ. Urban Syst. 2012, 36, 131–139. [Google Scholar] [CrossRef]
- Borgatti, S.; Mehra, A.; Brass, D.; Labianca, G. Network Analysis in the Social Sciences. Science 2009, 323, 892–895. [Google Scholar] [CrossRef] [Green Version]
- Stephure, R.J.; Boon, S.D.; MacKinnon, S.L.; Deveau, V.L. Internet Initiated Relationships: Associations between Age and Involvement in Online Dating. J. Comput.-Mediat. Commun. 2009, 14, 658–681. [Google Scholar] [CrossRef] [Green Version]
- Kane, G.C.; Alavi, M.; Labianca, G.; Borgatti, S.P. What’s Different About Social Media Networks? A Framework and Research Agenda. MIS Q. 2014, 38, 275–304. [Google Scholar] [CrossRef] [Green Version]
- Espín-Noboa, L.; Wagner, C.; Strohmaier, M.; Karimi, F. Inequality and inequity in network-based ranking and recommendation algorithms. Sci. Rep. 2022, 12, 2012. [Google Scholar] [CrossRef] [PubMed]
- Shiau, W.L.; Dwivedi, Y.K.; Yang, H.S. Co-citation and cluster analyses of extant literature on social networks. Int. J. Inf. Manag. 2017, 37, 390–399. [Google Scholar] [CrossRef] [Green Version]
- Sanchez-Lozano, J.M.; Teruel-Solano, J.; Soto-Elvira, P.L.; Socorro Garcia-Cascales, M. Geographical Information Systems (GIS) and Multi-Criteria Decision Making (MCDM) methods for the evaluation of solar farms locations: Case study in south-eastern Spain. Renew. Sustain. Energy Rev. 2013, 24, 544–556. [Google Scholar] [CrossRef]
- Quartulli, M.; Olaizola, I. A review of EO image information mining. Int. J. Photogramm. Remote Sens. 2013, 75, 11–28. [Google Scholar] [CrossRef] [Green Version]
- Liao, S.H.; Chu, P.H.; Hsiao, P.Y. Data mining techniques and applications—A decade review from 2000 to 2011. Expert Syst. Appl. 2012, 39, 11303–11311. [Google Scholar] [CrossRef]
- Tenney, I.; Das, D.; Pavlick, E. BERT rediscovers the classical NLP pipeline. arXiv 2019, arXiv:1905.05950. [Google Scholar]
- Manning, C.; Surdeanu, M.; Bauer, J.; Finkel, J.; Bethard, S.; McClosky, D. The Stanford CoreNLP Natural Language Processing Toolkit. In Proceedings of the 52nd Annual Meeting of the Association for Computational Linguistics: System Demonstrations, Baltimore, MD, USA, 23–24 June 2014; pp. 55–60. [Google Scholar]
- Piktus, A.; Petroni, F.; Karpukhin, V.; Okhonko, D.; Broscheit, S.; Izacard, G.; Lewis, P.; Oğuz, B.; Grave, E.; Yih, W.t.; et al. The Web Is Your Oyster—Knowledge-Intensive NLP against a Very Large Web Corpus. arXiv 2021, arXiv:2112.09924. [Google Scholar]
- Ribeiro, M.T.; Singh, S.; Guestrin, C. Model-agnostic interpretability of machine learning. arXiv 2016, arXiv:1606.05386. [Google Scholar]
- Cui, Y.; Che, W.; Liu, T.; Qin, B.; Wang, S.; Hu, G. Revisiting Pre-Trained Models for Chinese Natural Language Processing. In Findings of the Association for Computational Linguistics: EMNLP 2020; Association for Computational Linguistics: Stroudsburg, PA, USA, 2020; pp. 657–668. [Google Scholar]
- Liu, Q.; Zheng, Z.; Zheng, J.; Chen, Q.; Liu, G.; Chen, S.; Chu, B.; Zhu, H.; Akinwunmi, B.; Huang, J.; et al. Health Communication Through News Media During the Early Stage of the COVID-19 Outbreak in China: Digital Topic Modeling Approach. J. Med. Internet Res. 2020, 22, e19118. [Google Scholar] [CrossRef]
- Chami, I.; Abu-El-Haija, S.; Perozzi, B.; Ré, C.; Murphy, K. Machine Learning on Graphs: A Model and Comprehensive Taxonomy. arXiv 2021, arXiv:2005.03675. [Google Scholar]
- Wu, Z.; Pan, S.; Chen, F.; Long, G.; Zhang, C.; Yu, P.S. A Comprehensive Survey on Graph Neural Networks. IEEE Trans. Neural Netw. Learn. Syst. 2021, 32, 4–24. [Google Scholar] [CrossRef] [PubMed] [Green Version]
- Zhou, J.; Cui, G.; Hu, S.; Zhang, Z.; Yang, C.; Liu, Z.; Wang, L.; Li, C.; Sun, M. Graph neural networks: A review of methods and applications. AI Open 2020, 1, 57–81. [Google Scholar] [CrossRef]
- Bandinelli, N.; Bianchini, M.; Scarselli, F. Learning long-term dependencies using layered graph neural networks. In Proceedings of the 2010 International Joint Conference on Neural Networks (IJCNN), Barcelona, Spain, 18–23 July 2010; pp. 1–8. [Google Scholar]
- Zhang, S.; Tong, H.; Xu, J.; Maciejewski, R. Graph convolutional networks: A comprehensive review. Comput. Soc. Netw. 2019, 6, 11. [Google Scholar] [CrossRef] [Green Version]
- Veličković, P.; Cucurull, G.; Casanova, A.; Romero, A.; Liò, P.; Bengio, Y. Graph Attention Networks. arXiv 2018, arXiv:1710.10903. [Google Scholar]
- Song, W.; Xiao, Z.; Wang, Y.; Charlin, L.; Zhang, M.; Tang, J. Session-based Social Recommendation via Dynamic Graph Attention Networks. In Proceedings of the Twelfth ACM International Conference on Web Search and Data Mining, Melbourne, Australia, 11–15 February 2019; pp. 555–563. [Google Scholar]
- Kosaraju, V.; Sadeghian, A.; Martín-Martín, R.; Reid, I.; Rezatofighi, S.H.; Savarese, S. Social-BiGAT: Multimodal Trajectory Forecasting using Bicycle-GAN and Graph Attention Networks. arXiv 2019, arXiv:1907.03395. [Google Scholar]
- Piao, J.; Zhang, G.; Xu, F.; Chen, Z.; Li, Y. Predicting Customer Value with Social Relationships via Motif-based Graph Attention Networks. In Proceedings of the Web Conference, Ljubljana, Slovenia, 19–23 April 2021; pp. 3146–3157. [Google Scholar]
- Baek, H.; Ahn, J.; Choi, Y. Helpfulness of Online Consumer Reviews: Readers’ Objectives and Review Cues. Int. J. Electron. Commer. 2012, 17, 99–126. [Google Scholar] [CrossRef]
- Silver, D.; Schrittwieser, J.; Simonyan, K.; Antonoglou, I.; Huang, A.; Guez, A.; Hubert, T.; Baker, L.; Lai, M.; Bolton, A.; et al. Mastering the game of Go without human knowledge. Nature 2017, 550, 354–359. [Google Scholar] [CrossRef]
- He, K.; Zhang, X.; Ren, S.; Sun, J. Deep Residual Learning for Image Recognition. arXiv 2015, arXiv:1512.03385. [Google Scholar]
- Luo, C.; Ma, Y.; Jiang, P.; Zhang, T.; Yin, F. The construction and visualization of the transmission networks for COVID-19: A potential solution for contact tracing and assessments of epidemics. Sci. Rep. 2021, 11, 8605. [Google Scholar] [CrossRef]
- Bengtsson, M.; Kock, S. “Coopetition” in Business Networks—To Cooperate and Compete Simultaneously. Ind. Mark. Manag. 2000, 29, 411–426. [Google Scholar] [CrossRef]
- Klimas, P. Organizational culture and coopetition: An exploratory study of the features, models and role in the Polish Aviation Industry. Ind. Mark. Manag. 2016, 53, 91–102. [Google Scholar] [CrossRef]
- Roininen, S.; Westerberg, M. Network Structure and Networking capability among new ventures: Tools for competitive advantage or a waste of resources? (summary). Front. Entrep. Res. 2008, 28, 3. [Google Scholar]
- Krajewski, L.J.; Malhotra, M.K.; Ritzman, L.P. Operations Management. Processes and Supply Chains, 11th ed.; Pearson: Boston, MA, USA, 2016. [Google Scholar]
- Kim, J. Networks, Network Governance, and Networked Networks. Int. Rev. Public Adm. 2006, 11, 19–34. [Google Scholar] [CrossRef]
- Leicht, A.; Heiss, J.; Byun, W.J. Issues and Trends in Education for Sustainable Development; Education on the Move; UNESCO Publishing: Paris, France, 2018; p. 271. [Google Scholar]
- South, J.; Button, D.; Quick, A.; Bagnall, A.M.; Trigwell, J.; Woodward, J.; Coan, S.; Southby, K. Complexity and Community Context: Learning from the Evaluation Design of a National Community Empowerment Programme. Int. J. Environ. Res. Public Health 2020, 17, 91. [Google Scholar] [CrossRef] [Green Version]
- Wang, M.; Yang, S.; Sun, Y.; Gao, J. Discovering urban mobility patterns with PageRank based traffic modeling and prediction. Phys.-Stat. Mech. Its Appl. 2017, 485, 23–34. [Google Scholar] [CrossRef]
- Zhang, S.; Li, X.; Zong, M.; Zhu, X.; Wang, R. Efficient kNN classification with different numbers of nearest neighbors. IEEE Trans. Neural Netw. Learn. Syst. 2017, 29, 1774–1785. [Google Scholar] [CrossRef]
- Hosmer, D.W., Jr.; Lemeshow, S.; Sturdivant, R.X. Applied Logistic Regression; John Wiley & Sons: Hoboken, NJ, USA, 2013; Volume 398. [Google Scholar]
- Grover, A.; Leskovec, J. node2vec: Scalable feature learning for networks. In Proceedings of the 22nd ACM SIGKDD International Conference on Knowledge Discovery and Data Mining, San Francisco, CA, USA, 13–17 August 2016; pp. 855–864. [Google Scholar]
- Gilmer, J.; Schoenholz, S.S.; Riley, P.F.; Vinyals, O.; Dahl, G.E. Neural Message Passing for Quantum Chemistry. In Proceedings of the International Conference on Machine Learning, Sydney, Australia, 11 August 2017; pp. 1263–1272. [Google Scholar]
- Ren, S.; He, K.; Girshick, R.; Sun, J. Faster R-CNN: Towards Real-Time Object Detection with Region Proposal Networks. arXiv 2016, arXiv:1506.01497. [Google Scholar] [CrossRef] [Green Version]
- Pennington, J.; Socher, R.; Manning, C. Glove: Global Vectors for Word Representation. In Proceedings of the 2014 Conference on Empirical Methods in Natural Language Processing (EMNLP), Doha, Qatar, 25–29 October 2014; pp. 1532–1543. [Google Scholar]
- Aliakbary, S.; Motallebi, S.; Rashidian, S.; Habibi, J.; Movaghar, A. Distance metric learning for complex networks: Towards size-independent comparison of network structures. Chaos Interdiscip. J. Nonlinear Sci. 2015, 25, 023111. [Google Scholar] [CrossRef]
- Zhang, D.; Yin, J.; Zhu, X.; Zhang, C. Network Representation Learning: A Survey. IEEE Trans. Big Data 2020, 6, 3–28. [Google Scholar] [CrossRef] [Green Version]
- Belle, V.; Papantonis, I. Principles and Practice of Explainable Machine Learning. Front. Big Data 2021, 4, 688969. [Google Scholar] [CrossRef] [PubMed]


| Name | Type | Content |
|---|---|---|
| Name | Text | The name of the social organization that the legal person has registered. |
| Unified Social Credit Code | String | Unified Social Credit Code is an 18-digit number (sometimes including letters), unique for every single Chinese organizational. |
| Social Organization Type | Text | The type of the social organization that the legal person has registered. |
| Certificate Validity | Date | The validity period is the time interval during which the registration certificate is guaranteed to maintain its status information. |
| Date of Establishment and Registration | Date | The date of establishment and registration. |
| Authorized Representative of Juristic Person | Text | The authorized representative of juristic person is one who represents or stands in the place of another under authority recognized by law especially with respect to the other’s property or interests. |
| Professional Areas (Business Scope) | Text | Related trade, scientific or other professional areas of this social organization including charitable activities, poverty alleviation, environment protection, education, etc. |
| Residence (Location and Coordinates) | String | The residence is the designated place to carry out social organization-related activities. |
| Professional Leading Unit | Text | State Council relevant departments and local government relevant departments at county level and above, or organs empowered by the State Council or local government at county level and above, serve as the relevant leading units of social organizations in related trade, scientific or other professional areas. |
| Registration and Management Agency | Text | The basic peoples government agencies for registration and management of social organizations, namely the Ministry of Civil Affairs and local Civil Affairs departments at county level and above. |
| Registered Capital | Integer | The registered capital is the capital contributed or promised to be contributed by all shareholders when they apply to the local industrial and commercial bureau for the establishment of a social organization. |
| The Unified Social Credit Code | ||||
|---|---|---|---|---|
| 1st | 2nd | 3rd–8th | 9th–17th | 18th |
| 5 | X | X1 X2 X3 X4 X5 X6 | X X X X X X X X X | X |
| Registering Authority | Registered Entitiy Type | Registered Region | Organization Code | Check Digit |
| 1: Public institutions 5: Social organizations 9: Enterprises Y: Others The first digit of social organizations starts with 5. | 1: Social groups 2: Non-enterprise Private Units 3: Foundation 4: Others The second digit of the code indicates the type of the social organization. | This string of six numbers indicates where the organization is registered. | The same as the China Organization Code certificate. | This singular entry is a safety measure that allows Chinese authorities to confirm that the code is indeed valid. |
| n | vn | nl | adj | s |
|---|---|---|---|---|
| Association | Training | Kindergarten | Small | East |
| (协会) | (培训) | (幼儿园) | (小) | (东方) |
| 266,285 | 40,737 | 158,868 | 8882 | 3750 |
| Schools | Education | Pension | New | Overseas |
| (学校) | (教育) | (养老) | (新) | (海外) |
| 77,611 | 28,703 | 21,150 | 8561 | 853 |
| Service | Poverty Alleviate | teenager | Big | Outside the Party |
| (服务中心) | (扶贫) | (青年) | (大) | (党外) |
| 67,972 | 27,758 | 10,856 | 3758 | 809 |
| Town | Mutual support | Sunshine | Old | City North |
| (镇) | (互助) | (阳光) | (老) | (城北) |
| 58,705 | 24,239 | 9880 | 3215 | 771 |
| Community | Organize | Charity | Healthy | Off-campus |
| (社区) | (组织) | (慈善) | (健康) | (校外) |
| 49,468 | 21,857 | 6048 | 3036 | 595 |
| Street | Development | Nursing homes | Happy | External |
| (街道) | (发展) | (养老院) | (幸福) | (对外) |
| 46,462 | 18,581 | 3966 | 2351 | 529 |
| Centre | Promote | High-tech Zone | Peace | Outdoors |
| (中心) | (促进) | (高新区) | (平安) | (户外) |
| 39,818 | 14,079 | 3617 | 1774 | 523 |
| Village | Planting | Blue Sky | Hard | Haikou |
| (村) | (种植) | (蓝天) | (难) | (海口) |
| 35,122 | 4643 | 3158 | 1057 | 471 |
| District | Exercise | Baby | Harmonious | West Coast |
| (区) | (健身) | (宝贝) | (和谐) | (西海岸) |
| 28,118 | 4046 | 2979 | 942 | 427 |
| Culture | Care | Gold | Good | Suburbs |
| (文化) | (关爱) | (金) | (好) | (郊区) |
| 25,834 | 3050 | 2683 | 589 | 354 |
| Network Type | Features | Graph Structure |
|---|---|---|
| Competition and Cooperation Networks | A competition network [37] consists of market (direct and indirect) competitors and all the active, competitive ties among them. The Resource Based View theory [38] assumes that competitive or cooperative relationships between organizations is the result of resource gaps To gain access to resources and competencies available inside the network held by other actors [39] the organizations ought to be able to develop and utilize inter organizational relationships The trade-off between cooperation and competition has been emphasized as a mean of creating progress among actors involved in long-term relationships. A Competition and Cooperation network can be represented as an undirected graph , where V denotes the set of social organizations that are related with each other, and the edges E denote the link type, such as competition, cooperation or even coopetition, between two organizations. and indicates the conflicting degree of credibility values of node . | 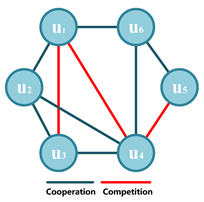 |
| Supply-Chain Networks | Businesses are part of a complex network formed within organizations, through supply-chain network, we can highlight the interactions between organizations, such as the cross-organizational flow of employees, information and raw materials [40]. Instead of remaining static, the supply-chain network is dynamic, adaptive and constantly evolving, by modeling it, we can predict and guide an organization’s business strategy more effectively and minimize risk at a system level. An supply-chain network in the business layer can be represented as a directed graph , where U and E are the node and edge sets, respectively. Nodes represent different types of social organizations, such as vocational education institutions or nursing homes, which can provide/receive services or propagate information at time . A directed edge, , between nodes represents the direction of service delivery or information propagation. Each directed edge is assumed to be associated with an service delivery or information propagation probability, . | 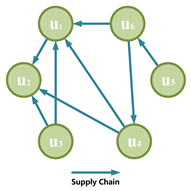 |
| Network Type | Features | Graph Structure |
|---|---|---|
| Policy Networks | Public organizations are engaged in interdependent relations with the public administration [41]. The policy networks can represent the correlations among different types of social entities, such as governments, policymakers, policies, and social organizations, during process of social development [42]. The multisectoral and intersectoral characteristics of the interactions between these social entities have potential to promote the evolution of social structure and well-being for all. A policy network consists of nodes representing governments, organizations, policymakers, and policies, and the edges indicate the interactions among them. For example, edge demonstrates that policymakers p issue a policy item u, and represents that this policy u is accepted by organizations u. | 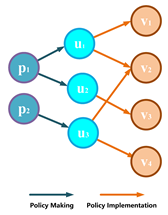 |
| Service Networks | Centered on the provision of public services for community members [43], a service network can be represented as a directed network , where the nodes can be all kinds of organizations and community members, and the edges denote the link type between two nodes, namely, the provided by social organizations to local residents, and people’s attitudes towards these services, such as supporting, denying, opposing, etc. Service networks can be used to measure the contribution and impact of social organizations to the society. | 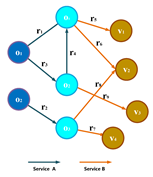 |
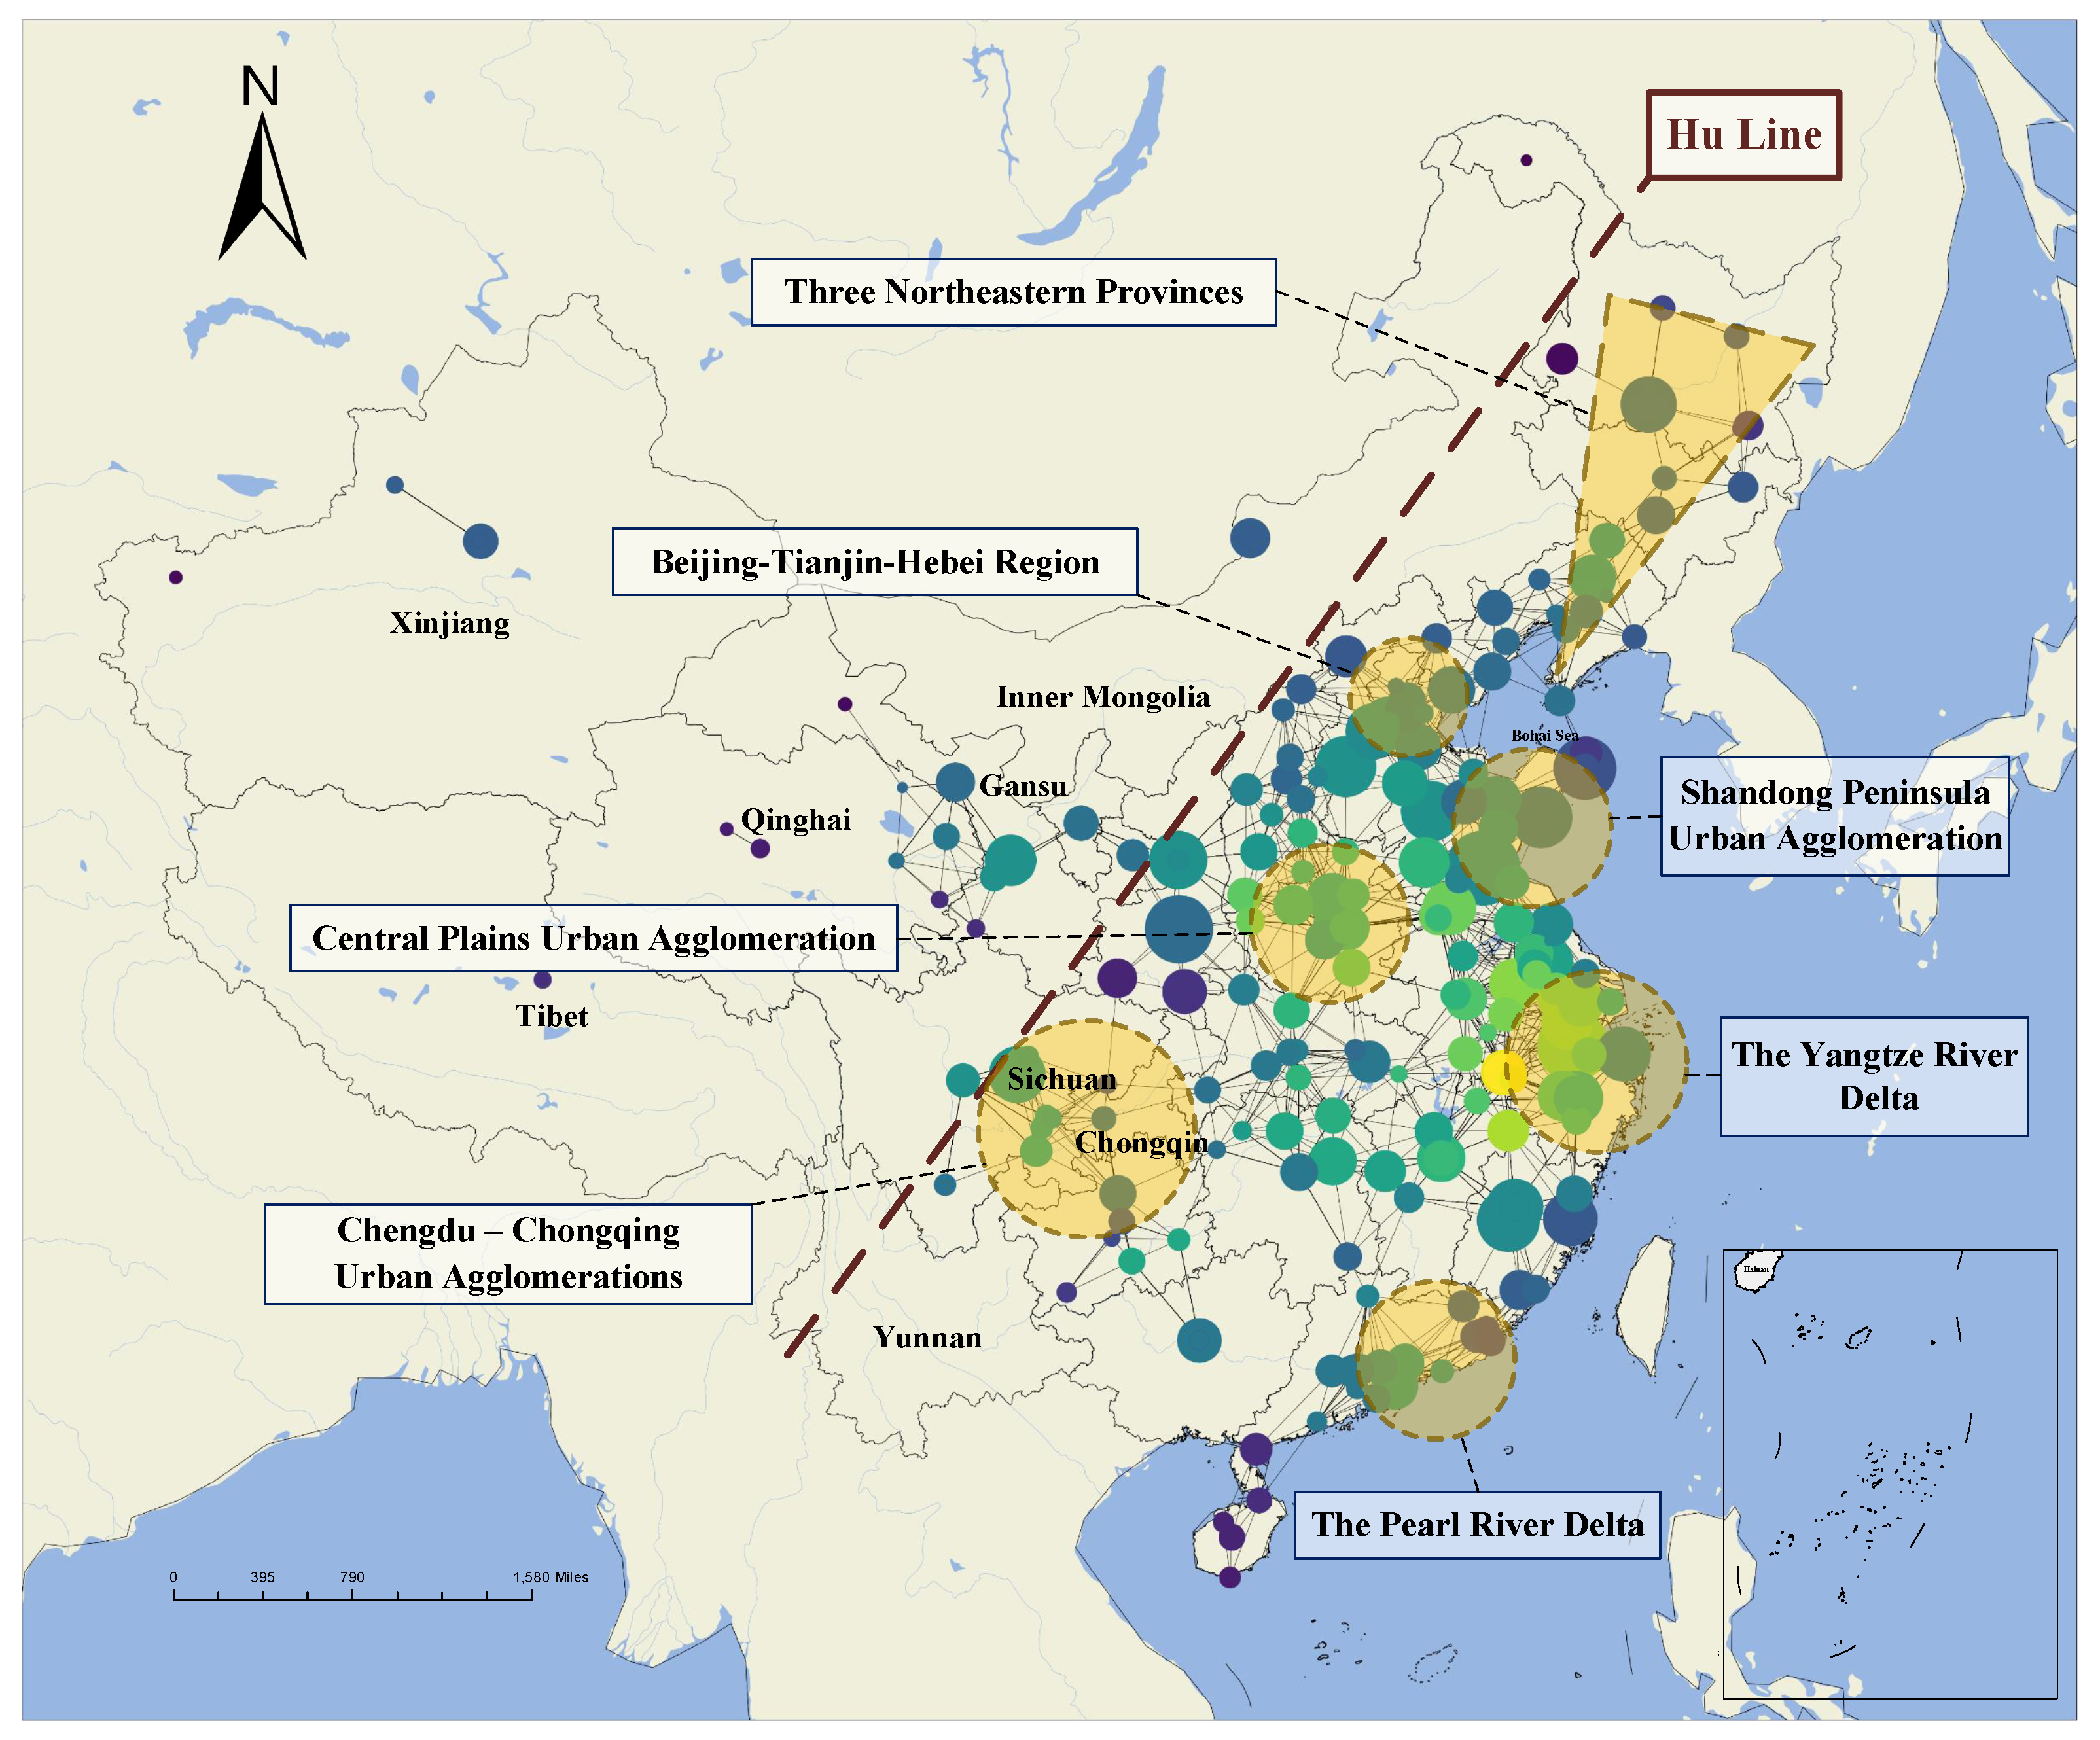
| Region | Provincial Administrative Units | County Administrative Units |
|---|---|---|
| Beijing–Tianjin–Hebei Region | Beijing | – |
| Tianjin | – | |
| Hebei | Baoding, Tangshan, Langfang, Shijiazhuang, Qinhuangdao, Zhangjiakou, Chengde, Cangzhou, Hengshui, Xingtai, Handan | |
| Pearl River Delta | Guangdong | Guangzhou, Foshan, Zhaoqing, Shenzhen, Dongguan, Huizhou, Zhuhai, Zhongshan, Jiangmen |
| Yangtze River Delta | Shanghai | – |
| Jiangsu Province | Nanjing, Wuxi, Changzhou, Suzhou, Nantong, Huaian, Yancheng, Yangzhou, Zhenjiang, Taizhou | |
| Zhejiang | Hangzhou, Ningbo, Wenzhou, Shaoxing, Jiaxing, Jinhua |
Publisher’s Note: MDPI stays neutral with regard to jurisdictional claims in published maps and institutional affiliations. |
© 2022 by the authors. Licensee MDPI, Basel, Switzerland. This article is an open access article distributed under the terms and conditions of the Creative Commons Attribution (CC BY) license (https://creativecommons.org/licenses/by/4.0/).
Share and Cite
Zhao, X.; Wang, S.; Wang, H. Organizational Geosocial Network: A Graph Machine Learning Approach Integrating Geographic and Public Policy Information for Studying the Development of Social Organizations in China. ISPRS Int. J. Geo-Inf. 2022, 11, 318. https://doi.org/10.3390/ijgi11050318
Zhao X, Wang S, Wang H. Organizational Geosocial Network: A Graph Machine Learning Approach Integrating Geographic and Public Policy Information for Studying the Development of Social Organizations in China. ISPRS International Journal of Geo-Information. 2022; 11(5):318. https://doi.org/10.3390/ijgi11050318
Chicago/Turabian StyleZhao, Xinjie, Shiyun Wang, and Hao Wang. 2022. "Organizational Geosocial Network: A Graph Machine Learning Approach Integrating Geographic and Public Policy Information for Studying the Development of Social Organizations in China" ISPRS International Journal of Geo-Information 11, no. 5: 318. https://doi.org/10.3390/ijgi11050318
APA StyleZhao, X., Wang, S., & Wang, H. (2022). Organizational Geosocial Network: A Graph Machine Learning Approach Integrating Geographic and Public Policy Information for Studying the Development of Social Organizations in China. ISPRS International Journal of Geo-Information, 11(5), 318. https://doi.org/10.3390/ijgi11050318