Abstract
The COVID-19 pandemic has posed an unprecedented challenge to public health across the world and has further exposed health disparities and the vulnerability of marginal groups. Since the pandemic has exhibited marked regional differences, it is necessary to better understand the levels of vulnerability to the disease at local levels and provide policymakers with additional tools that will allow them to develop finely targeted policies. In this study, we develop for the State of Alabama (USA) a composite vulnerability index at county level that can be used as a tool that will help in the management of the pandemic. Twenty-four indicators were assigned to the following three categories: exposure, sensitivity, and adaptive capacity. The resulting subindices were aggregated into a composite index that depicts the vulnerability to COVID-19. A multivariate analysis was used to assign factor loadings and weights to indicators, and the results were mapped using Geographic Information Systems. The vulnerability index captured health disparities very well. Many of the most vulnerable counties were found in the Alabama Black Belt region. A deconstruction of the overall index and subindices allowed the development of individual county profiles and the detection of local strengths and weaknesses. We expect the model developed in this study to be an efficient planning tool for decision-makers.
1. Introduction
In December 2019, a novel coronavirus, the severe acute respiratory syndrome coronavirus-2 (SARS-CoV-2), emerged in Wuhan, Hubei Providence (China) and started spreading rapidly across the world. The World Health Organization (WHO) activated its incident management system, and then declared the outbreak as a Public Health Emergency of International Concern in January 2020, and finally declared COVID-19 a pandemic in March 2020. In the United States, the Centers for Disease Control and Prevention (CDC) acknowledged the first U.S. laboratory-confirmed case of COVID-19 on 20 January 2020. In mid-March, the US declared a nationwide emergency and started to shut down in order to prevent the spread of the disease. By April 2020, COVID-19 had spread over most of the country and the US surpassed Italy as the global leader for reported deaths due to COVID-19, with over 23,000 deaths [1]. Since then, several waves of COVID-19 have struck the US and as of early April 2022, there were more than 80,000,000 cases and 980,000 deaths due to the disease [2].
As more data were available and more was learned about the new disease, it became evident that (i) although anyone can get sick with the disease, people with underlying medical conditions and older people are more at higher risk of being infected and developing serious illness [3]; (ii) racial and ethnic minority groups are more likely to get sick and experience more severe illness and death from the virus [4,5]. In addition to laying bare health disparities, the pandemic triggered an unprecedented and multifaceted crisis worldwide. Markets and supply chains were disrupted by lockdowns, border closures, and resulting trade limitations, with devastating consequences on businesses and individuals [6]. High morbidity and mortality rates from the pandemic and the measures taken to mitigate it decimated jobs worldwide, causing profound social disruptions, particularly among the most vulnerable populations [6,7,8,9,10].
In the US, the unemployment rate increased by 11.2% between April and November 2020 [11]. People’s livelihoods were affected in many of the following ways: lack of access to health facilities overwhelmed by the pandemic, job losses, furloughs, wage reductions, exhaustion of emergency savings (if any), increased caretaking responsibilities (full-time childcare and caretaking of older people), decrease in work productivity, reduced income and access to food, to cite a few examples [6,11,12,13,14,15,16]. Although billions of dollars have been so far appropriated by federal and state governments to mitigate the impacts of the pandemic, many vulnerable households across the US are still facing serious financial problems [14,15,16].
Today, the pandemic is far from being under control, despite better knowledge of the virus’s modus operandi, the stimulus packages aimed at helping businesses and people face the disruptions caused by COVID-19, the progress made in medical treatments, and the vaccination of an increasing number of people. The highly contagious COVID-19 Delta and Omicron variants have quickly spread over the world, including in the US. Mitigation efforts to block the spread of the virus have been hampered by a number of factors, including refusal from a portion of the population to get vaccinated, misinformation, disinformation, politicization, and denial of science [17].
The COVID-19 impacts are widespread: the pandemic has spread in various types of neighborhoods, regardless of the level of affluence. However, regarding the ability to deal with the pandemic, communities have been differently affected [4,18]. Health disparities are the differences in health outcomes and their structural determinants between segments of the population [19,20]. The social determinants include race, income, education, disability status, level of access to health services and insurance, language barrier, and geographic location [19,20]. Health inequities are not new, as attested by a large body of studies [19,20,21,22,23,24,25]. The magnitude of the COVID-19 pandemic and its association with various comorbidities have further exposed such differences. As a result, a growing number of studies have focused on the association between social vulnerability and COVID-19 [26,27,28,29,30,31,32]. Socially vulnerable groups are less able to cope with and recover from the impact of disasters [24]. Another set of studies deals with the role of environmental factors in the transmission of COVID-19; investigators have examined the influence of a variety of factors including temperature, humidity, pollution (particulate matter, CO2 emissions), and the impacts of hydrometeorological events [33,34,35,36,37,38,39,40]. It is worth noting that the lockdowns enforced worldwide resulted in a notable improvement of air quality, especially in urban areas [41,42,43,44].
In addition to socioeconomic and environmental determinants, many other risk factors contribute to making the management of COVID-19 a complex task and, as the disease is better known, new factors come into consideration. This multi-faceted and dynamic nature of COVID-19 warrants a holistic approach for a better understanding of the interplay between different risk factors and the identification of the most vulnerable communities. One approach widely used is to develop a composite vulnerability index, which is a single value obtained by aggregating multiple indicators using mathematical computation [45,46,47,48]. Composite indices can summarize complex, multidimensional phenomena and are often used as communication tools, but also to compare and rank performances at various scales, and to provide support to policymakers [47,49,50,51,52,53,54]. The literature on the use of composite indices to assess the vulnerability to COVID-19 is already substantial [55,56,57,58,59,60,61,62]. Some of these studies have resulted in the development of dashboards aimed at providing real-time information on the pandemic. For example, Marvel et al. (2021) developed the interactive Pandemic Vulnerability Index (PVI) Dashboard, which aims at providing support to decision makers at county level [59]. The PVI Dashboard offers various monitoring, visualization, and forecast tools that help identify local vulnerabilities and predict potential future outcomes. Despite their growing number, the aforementioned studies are not redundant, since the pandemic has exhibited strong regional and local differences, and therefore requires a focus on finer scales. As noted by the CDC [63], “monitoring jurisdiction-level numbers of COVID-19 cases, deaths, and changes in incidence is critical for understanding community risk and making decisions about community mitigation.” COVID-19′s health, economic, social, and fiscal impact varies considerably within each country and places local authorities and communities at the forefront of crisis management and recovery [64,65]. For example, the pandemic has caused a dramatic drop in municipal revenues across the United States [66,67]. Moreover, communities have more confidence in local governments than national or federal ones [65,68]. Therefore, the management of the pandemic requires a local approach to policy responses.
The aim of this study is to develop a COVID-19 vulnerability index at county level for the State of Alabama by aggregating a set of indicators that are relevant to the levels of exposure, sensitivity, and resilience of populations. It is expected that the composite index will capture the diversity of local communities and provide policymakers with comprehensive information that will help them rank the state’s counties on multifaceted issues, better identify the most vulnerable populations, and take mitigation and recovery actions adapted to local realities. The model used in this study can be replicated in other US states and as knowledge about the pandemic progresses, it can be refined and made appropriate to the prevailing situation.
2. Materials and Methods
2.1. Study Area
The State of Alabama, located in the southern US (Figure 1a), is composed of sixty-seven counties. The largest population densities are found in the following counties that harbor big cities: Jefferson, Madison, Montgomery, and Mobile Counties, which are home to Birmingham, Huntsville, Montgomery and Mobile, respectively. One prominent demographic characteristic of the state is that some of its counties are part of the southern Black Belt, which is currently defined as the region composed of counties where the black population is predominant (Figure 1b). Although household income has grown over the recent years, there still exists a notable income gap across the state, which is also the case in many other US states [69]. As shown in Figure 1c, the spatial patterns of households below the poverty level reflects faithfully enough the distribution of minorities across the state. This is an important factor, given the racial and socioeconomic health disparities associated with COVID-19 [19,20,21,22,23,24,25].
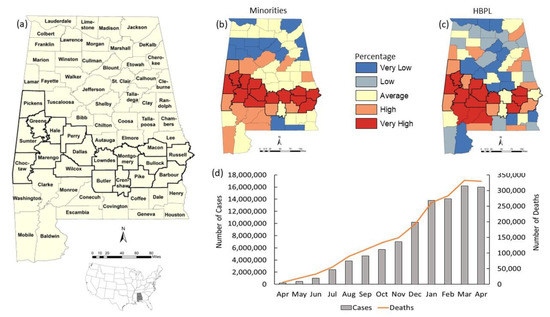
Figure 1.
The study area: (a) location of the State of Alabama; (b) percentage of minority population in Alabama counties; (c) percentage of the number of households with income below poverty level for each county; (d) the number of COVID-19 cases (grey bars) and deaths (red line) between April 2020 and April 2021. The thick black lines in the maps indicate the boundaries of Black Belt counties.
As all other US States, the State of Alabama experienced a devastating spread of the virus. The first known COVID-19 case in Alabama was announced on 3 March 2020. The following month, the Governor issued a statewide stay-at-home order. Between 1 April 2020 and 30 April 2021, there was a sharp increase in COVID-19 cases and deaths, but this increasing trend seemed to stabilize by the month of April 2021 (Figure 1d). During this period, Alabama ranked among the US states with fewer tested people. As of late September 2021, there were over 794,000 cases and 14,155 deaths related to the disease, and Alabama ranked among the states with fewer vaccinated people [70].
To assess the vulnerability of the state’s population to the new disease at county level, data from various sources were used.
2.2. Data Types and Sources
The health data used in this study were obtained from the Alabama Department of Public Health [71]. Since the advent of COVID-19, ADPH has posted on its website various county-level information on the disease on a daily basis, and maintained the Alabama COVID-19 Dashboard Hub, which houses various dashboards. The data posted on the ADPH website can be downloaded as spreadsheets and consist of statistics and location information on vaccine providers, appointment-only clinics, drive-thru and walk-in clinics, case data, test sites, and county vaccine data. Vaccine providers, appointment-only clinics, drive-thru and walk-in clinics, and test sites are presented as a list of addresses. The case data consist of the total number of cases, people tested and deaths per county. The county vaccine data provide statistics on population > 16, people who received at least one dose (total number and percentage), number of people completely vaccinated, and number of doses administered.
Additional health data obtained from various other sources include statistics on the number of smokers, adult obesity, diabetes, and cancer rates obtained from the University of Wisconsin Population Health Institute 2020 County Health Rankings [72], and the Environmental Protection Agency Air Toxics Respiratory Hazard Index, which is the sum of hazard indices, where each hazard index is the ratio of exposure concentration in the air to the health-based reference concentration set by the Environmental Protection Agency [73]. These additional health data denote some of the comorbidities and other health risks that are likely to cause severe illness from COVID-19 [74]. Statistics on hospitalizations due to COVID-19 were obtained from the New York Times, which compiled data from Alabama State and local agencies [75]. Data on the number of staffed intensive care unit (ICU) beds available (7-day total: 24–30 April 2021) were obtained from HealthData.gov [76].
Most of the demographic and socioeconomic data originated from the US Census Bureau and were updated and converted by the Environmental Systems Research Institute (ESRI) into a geodatabase format readily usable with the Geographic Information System (GIS) software. The related variables are generally used in the development of vulnerability indices that have demographic, social, and economic components [24,77,78,79,80,81,82,83]. The demographic data consist of population density and daytime population density, and of the percentages of minority population, senior Population (age ≥ 65), and households with 5 people or more. All the demographic data were obtained from 2019 ESRI Demographics, except for daytime population density, which originates from the 2018 CDC Social Vulnerability Index [84]. The socioeconomic data consist of (1) geodatabase files from 2019 ESRI Demographics, which includes the following: unemployment rate, households below the poverty level, people with some high school but no diploma; (2) 2019 food insecurity rate obtained from Feeding America [85]; and (3) uninsured population obtained from the 2020 County Health Rankings and Roadmaps developed by the University of Wisconsin Population Health Institute [72].
2.3. Preliminary Data Processing
Given the variety of formats, the county-level data were processed using ESRI’s ArcGIS. Although most of the data were already in a spatial format and added to a map document, some variables, such as adult obesity, diabetes, cancer rates, the number of ICU beds, number of smokers, uninsured populations, and food insecurity rate, came as tables that were added to the map document and joined to the attribute table of the spatial data, using county names as the common field. Health data presented as tables of addresses were first converted to point shapefiles by geocoding addresses, then summarized to produce the number of facilities per county. All the variables were assembled in a master-dataset in shapefile format, by joining the various tables to the shapefile’s attribute table using the county names as the common field, and the associated attribute table was exported as a text file in a comma-separated format (csv) suitable for further processing in an Excel spreadsheet. From this master-table, three subsets were created, each of them regrouping the variables (indicators) belonging to the corresponding determinant. It is worth mentioning that all the count values were converted to percentages. For example, the household indicator was calculated as follows: (number of households with five or more people/total number of households) ∗ 100.
2.4. Development of the Vulnerability Index
2.4.1. Vulnerability Framework
A system is vulnerable when it is likely to experience harm due to its exposure to a hazard and/or it is unable to cope with adverse effects of the hazard [86]. A hazard is defined as a “threat to a system, comprised of perturbations and stress, … and the consequences it produces” [87]. According to IPCC [86], vulnerability is a function of exposure, sensitivity, and adaptive capacity. Exposure is “the nature and degree to which a system is exposed”. Sensitivity is “the degree to which a system is affected, either adversely or beneficially”. Adaptive capacity is the ability of a system to implement effective adaptation measures to moderate potential damages, to take advantage of opportunities, or to cope with the consequences, by using its whole capabilities, resources, and institutions [86,88]. This vulnerability framework presented in the IPCC third assessment report [86] was employed in many subsequent studies (for example, [89,90]).
In this study, we adopted this IPCC framework and developed a vulnerability composite index, which combines the following three determinants (subindices): exposure, sensitivity, and adaptive capacity (Figure 2). Exposure and sensitivity describe the potential impacts COVID-19 can have on populations. High values of exposure and sensitivity combined with low values of adaptive capacity result in high scores of the overall index, which indicate high vulnerability.
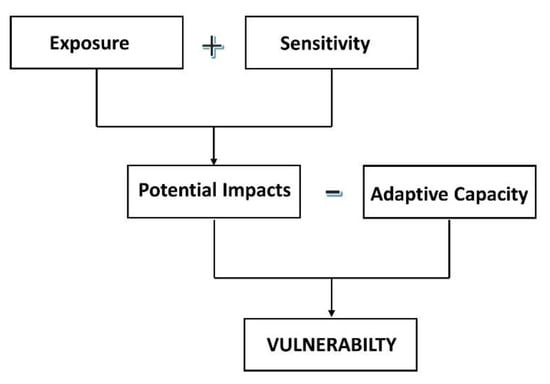
Figure 2.
Vulnerability assessment framework used in this study.
Therefore, the equation for computing the COVID-19 Vulnerability Index was defined as the following:
Vulnerability = (Exposure + Sensitivity) − Adaptive Capacity
The selection of indicators constitutes a crucial stage in the development of a vulnerability index [47]. Our choice of vulnerability indicators for each determinant was guided by the framework chosen, which allowed us to categorize and structure indicators in accordance with the three components of the index. The choice of indicators was also based on (1) an extensive body of literature on various types of vulnerability assessments (vulnerability to climate change and other natural hazards, social vulnerability), which allowed the selection of well-established variables used to quantify vulnerability; and (2) expert knowledge of COVID-19 from the World Health Organization (WHO) and leading health institutions, such as the Center for Disease Control and Prevention (CDC) and the National Institutes of Health (NIH).
2.4.2. Indicators
The indicators for each subindex are shown in Table 1.

Table 1.
Description of indicators for each subindex and data sources.
Exposure indicators. The indicators for exposure to COVID-19, calculated for each Alabama county, consist of the following three variables: (1) the total number of COVID-19 cases in Alabama, from 1 April 2021 to 30 April 2021; the incidence rate was obtained by computing the difference of the number of cases between the two dates, dividing it by the county’s population, and multiplying the result by 1000; (2) the one-week average number of hospitalizations due to COVID-19 (24–30 April 2021); the hospitalization rate was computed for 100,000 people; (3) the COVID-19 death rate per 1000 people over the study period.
Sensitivity indicators. To characterize sensitivity, this study used fifteen variables assigned to the following four subgroups: crowding, demographic status, socioeconomic status, and health status, including comorbidities. The crowding subgroup is defined by the following three variables: (1) population density; (2) daytime population density (which is also an indicator of mobility); and (3) residential crowding, which depicts the percentage of households with five persons or more. We know now that COVID-19 is mainly transmitted by infected persons who breathe out droplets and very small particles that contain the virus; therefore, crowded and poorly ventilated spaces must be avoided [3,91]. High values of crowding variables indicate higher concentrations of people, which makes social distancing more difficult to implement efficiently, hence, an increased risk of spreading the disease. The demographic status subgroup is composed of the following two variables: (1) seniors, the percentage of the population aged 65 or older; (2) minorities, the percentage of minority populations. These two groups are known for being more prone to infection and adverse outcomes from contracting the virus [3,5,91]. The socioeconomic status subgroup includes the following five variables: (1) poverty, the percentage of households below poverty level; (2) unemployment, the unemployment rate at county level; (3) uninsured, the percentage of the population without health insurance; (4) no diploma, the percentage of the population that attended some high school but did not graduate; (5) food insecurity, the food insecurity rate computed by combining state and county-level food, demographic and socioeconomic data, such as homeownership, disability prevalence, median income, average dollar amount spent on food per week, and the non-undergraduate student poverty rate. The methods for computing the food insecurity index are detailed in a technical report from Feeding America [85]. The indicators in the socioeconomic status subgroup characterize marginalized populations with low income, limited access to health education, medical care, and many other crucial resources. In a large body of studies, such groups have been identified as more vulnerable, less able to cope with health threats [19,24,92,93]. The health status subgroup is determined by the following five variables: (1) obesity, the percentage of obese adults in each county; (2) diabetes prevalence, the percentage of people with diabetes; (3) cancer prevalence, the percentage of people with cancer; (4) smokers, the number of smokers as a percentage; (5) air toxics, the Air Toxics Respiratory Hazard Index. It is well known that people with certain underlying medical conditions are more likely to experience severe illness from COVID-19 [3,91,94,95]. Regarding smoking, although there is not yet evidence linking it to severe illness from COVID-19, such practice increases the risk of heart disease and lung disorders and may increase the risk of infection with the virus, due to the frequent hand-to-mouth action while smoking [3].
Adaptive capacity indicators. Seven indicators were chosen to determine adaptive capacity, which are as follows: (1) ICU beds, the adult staffed ICU beds available per 10,000 people; low values of this variable indicate that the county is less able to deal with severe COVID-19 illness and/or that hospitals are operating under high stress; (2) vaccinated, the percentage of fully vaccinated people older than 16; (3) vaccine providers, the number of vaccine providers per 10,000 people; (4) test sites, the number of COVID-19 test sites per 10,000 people; (5) tested, the total population older than 16 tested, per 10,000 people; (6) doses, the COVID-19 doses administered, per 1000 people older than 16; (7) clinics, the number of clinics (both drive-through and appointments only) that are administering COVID-19 vaccines, per 10,000 people. Overall, higher values of all the adaptive capacity indicators indicate that the county has higher ability to prepare for and cope with the effects of COVID-19.
2.4.3. Statistical Analysis
Reduction in the number of variables: an important preliminary step is to use multivariate analysis (1) to explore the structure of the data and examine the interrelationships between variables. The successful development of a composite index depends first on an appropriate choice of the constituting variables, since overly complex data structure and too much data can adversely affect the index development process and confuse decision makers as well as potential users [47,96]; (2) to identify potential redundancy in the dataset, since it is preferable that each variable uniquely contributes to the data matrix, and the resulting data reduction will also improve computational performance [96,97]. In this reduction process, the first step was to standardize all variables using the following formula:
where z is the standard score, x is the observed value, μ is the mean of the sample set, and σ is the standard deviation of the sample set.
z = (x − μ)/σ
Next, principal component analysis (PCA) was applied using the standardized variables grouped under each determinant, as a method for data reduction [98,99]. One of the PCA outputs is a correlation matrix of the variables. Under each determinant or subgroup, correlations were examined for redundancy, looking for pairwise correlations with a coefficient greater than 0.90 [100]. In such cases, the variable with the lowest PCA loading was removed. As a result of this process, the following three redundancies were identified: under the crowding subgroup, the correlation coefficient of density vs. daytime density was 0.99; under the demographic status subgroup, the coefficient for seniors vs. minorities was 0.95; and under the adaptive capacity determinant, it was 0.97 for vaccinated vs. doses. The variables with lower PCA loadings, namely daytime density, minorities, and doses, were removed.
Weighting: factor analysis (FA) with varimax rotation was used to assign weights to variables under each determinant. With this data-based method, each variable is weighted based on its contribution to the overall variance in the data [47,101]. The process consists of several steps, and prior to executing FA, the variables were normalized to have an identical range (0, 1), which is as follows:
where x′ is the normalized value, and x is an original value.
x′ = (x − min f(x))/(max f(x) − min f(x))
First, it is necessary to verify whether FA is suitable for the data by using the following two tests: the Kaiser–Meyer–Olkin (KMO) test and Bartlett’s test of sphericity. KMO is a measure of sampling adequacy (MSA) [102]. The test yields a MSA for each variable and an overall MSA. The KMO statistic can vary from 0 to 1, and a value smaller than 0.6 indicates that the sampling is not adequate, and FA may not be appropriate for the data [103]. In this study, the KMO test for the three determinants showed that it is appropriate to use FA for the data, since the test yielded the following MSA results: exposure 0.68; sensitivity, 0.84; and adaptive capacity, 0.75. The second test, the Bartlett’s test of sphericity, is used to test the hypothesis that the observed correlation matrix is an identity matrix (hence, the individual indicators in the correlation matrix are uncorrelated) [104]. Small values of the significance level (p-value less than 0.05) indicate that it is appropriate to proceed with FA. In this study, Bartlett’s test results showed the data were appropriate for FA, since all the resulting p-values were smaller than 0.0001.
The next step was to perform factor extraction by running FA on the data and retaining only the number of factors that will represent the data. There are various guidelines for deciding on the number of factors to keep. We followed a standard practice adopted in several studies and for a factor to be retained, there are three qualifications, which are as follows: (1) the factor is associated with an eigenvalue larger than unity (>1); (2) the factor explains more than 10% of the overall variance of the data; (3) the cumulative variance of the chosen factors must be more than 60% [47,51,101]. Based on these criteria, the factors for each determinant were retained as follows: sensitivity, three factors; adaptive capacity, two factors. Regarding the exposure determinant, which is composed of three indicators only, the full guidelines could not be followed; only the first factor had an eigenvalue larger than unity and was retained.
Next, the factor loadings were rotated using the varimax method, which yields a simpler organization of the retained factors. Instead of having all the salient loadings (indicators with high loading) in the same factor, each indicator is loaded exclusively on one of the retained factors. The rotated factor loadings were then squared. The resulting values represent the proportion of the total unit variance of the indicator, which is explained by the factor [105].
The squared factor loadings were scaled to sum to 1 as follows:
where N is the normalizer, and x is an item from the list of numbers to be normalized. Next, every number in the list was multiplied by the normalizer, and the resulting total is 1.0, as shown in Equation (5), which is as follows:
N = 1/(x1 + x2 + … + xn)
([x1 × N] + [x2 × N] + … + [xn × N]) = 1.0
Intermediate composites were created by grouping indicators with highest loadings (also called salient loadings) into respective factors [101]. The intermediate composites were then aggregated, and each of the resulting values was assigned a weight by multiplying it to its corresponding eigenvalue. The last step of this statistical process was to scale the resulting weight scores to sum to unity as shown in Equations (4) and (5).
For each determinant, the normalized value of the indicators was multiplied to its corresponding final weight, and the resulting scores were summed to obtain a subindex for the determinant. Finally, the scores of the three determinants were combined as indicated in Equation (1) to create the final vulnerability index.
GIS methods were used to join the resulting tables to a shapefile of the Alabama counties for spatial analysis and mapping, using the Environmental Systems Research Institute GIS software, ArcGIS. Various classification schemes were employed, including mapping quantities using graduated colors and charts. The quantile method was used to classify scores resulting from the statistical analysis.
3. Results
In this section, the results from the statistical analysis and geospatial processing are presented for each determinant and the final vulnerability index.
3.1. Statistical Analysis
Table 2 shows the FA results for the exposure subindex, which is composed of only three indicators: the number of COVID-19 cases, deaths, and hospitalizations. The FA process yielded only one factor with an eigenvalue of 1.4 and explains 23% of the variance. The largest weight score was assigned to COVID-19 deaths (0.46), followed by the number of cases (0.38). Hospitalizations received the smallest weight (0.17).
Table 2.
Factor analysis results for the exposure subindex.
The FA results for the sensitivity subindex are presented in Table 3. The three factors retained account for 63.2% of the variance (Table 3). Factor 1 has salient loadings on unemployment (0.78), households below poverty level (0.97), food insecurity (0.41), households with 5+ people (0.19), Respiratory Index (1.26), and obesity (0.59). This factor is dominated by socioeconomic conditions and, to a lesser extent, health status. Three of the indicators were assigned the highest weights (Table 4). Factor 2, which is formed by population density (0.40), some high school but no diploma (0.77), uninsured (0.08), smokers (0.54), and diabetes (0.39), represents a mix of socioeconomic and health conditions. Factor 3 has high loadings with seniors (4.43) and cancer (2.94). The final weights are displayed in Table 4. Overall, most of the indicators with the highest weights were loaded into Factor 1.
Table 3.
Factor loadings for the exposure subindex.
Table 4.
Eigenvalues and weight scores for the Exposure subindex.
For the adaptive capacity subindex, the following two factors accounting for 62.2% of the variance were retained: Factor 1 explains 42.1% of the variance and has an eigenvalue of 2.6; Factor 2 explains 20.1% of the variance (eigenvalue: 1.5) (Table 5). Factor 1 has high loadings with the variables test sites, clinics, vaccine providers, and ICU beds. Given its components, this first factor may be interpreted as the infrastructure available for dealing with COVID-19. Factor 2 is formed by the variables of vaccinated (which has the highest loading, 0.9), and tested (0.03). This factor depicts actions that have been taken by people to track the disease and reduce its transmission. Table 6 shows the final weights of the adaptive capacity indicators. The following variables were assigned the highest weights: vaccinated (0.33), clinics (0.29), and vaccine providers (0.21). Test sites, ICU beds, and tested exhibited the lowest weight values.
Table 5.
Factor loadings for the adaptive capacity subindex.
Table 6.
Eigenvalues and weight scores for the Adaptive Capacity subindex.
3.2. Spatial Patterns of the Subindices and Final Vulnerability Index
The spatial distribution of the exposure subindex scores is shown in Figure 3. Most of the counties with the highest incidence of COVID-19 cases, hospitalization, and/or deaths are located in the Alabama Black Belt (they constitute 6 out of the 10 counties with the highest exposure score).
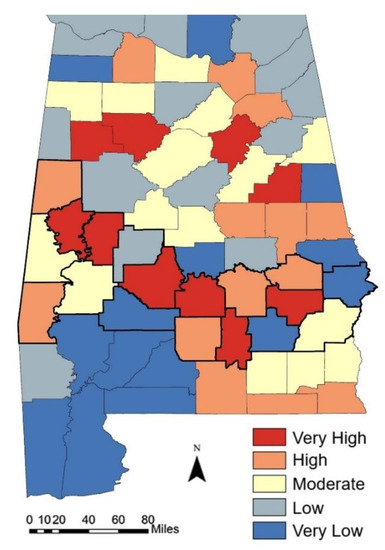
Figure 3.
Spatial distribution of the exposure subindex. The scores are classified as quintiles. The thick black lines indicate the boundaries of Black Belt counties.
In those counties, COVID-19 deaths are the main contributor to the exposure subindex, followed by hospitalizations and the number of cases (Figure 4a). Fourteen counties are classified as the least exposed to COVID-19. They are mainly located in the southwestern part of the State. However, this group includes three Black Belt counties: Russel, Pike and Wilcox. The exposure subindex score in these counties is driven by COVID-19 hospitalizations and, to a lesser extent, COVID-19 cases and deaths (Figure 4b).
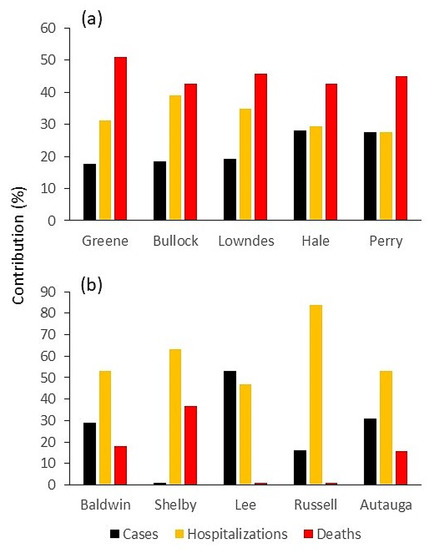
Figure 4.
Percent contribution of each indicator to the exposure subindex for (a) the most exposed, and (b) least exposed counties.
Figure 5 displays the spatial patterns of the sensitivity subindex scores. The counties that exhibit the highest scores are all located in the Alabama Black Belt, except for Monroe County. The sensitivity subindex score of these counties is mainly explained by the higher contribution of the number of smokers and the Respiratory Hazard Index, closely followed by household income below poverty level, food insecurity, and obesity. Most of the counties with the lowest scores are located north of the Alabama Black Belt. In these counties, households with five people or more are the main contributor to the sensitivity subindex, followed by cancer, Respiratory Hazard Index, and smokers.
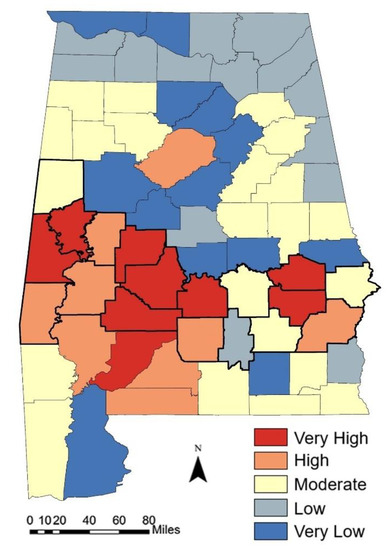
Figure 5.
Spatial distribution of the sensitivity subindex. The scores are classified as quintiles. The thick black lines indicate the boundaries of Black Belt counties.
The spatial distribution of the adaptive capacity scores is shown in Figure 6. The distribution patterns of the counties with the highest scores are not coherent since they are scattered over various parts of the state. The lowest scores are mostly found in a cluster of counties in the western Alabama Black Belt and neighboring southern counties.
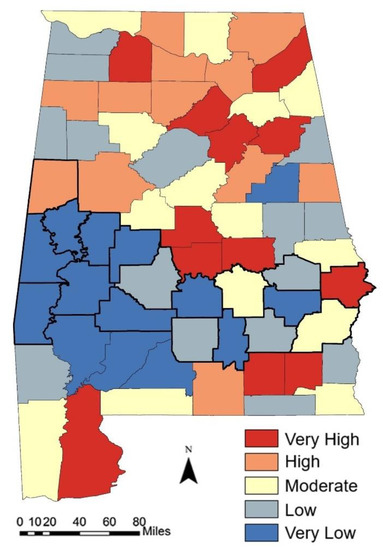
Figure 6.
Spatial distribution of the adaptive capacity subindex. The scores are classified as quintiles. The thick black lines indicate the boundaries of Black Belt counties.
In high scoring counties, the main contributors to the adaptive capacity subindex are the number of ICU beds, followed by the number of test sites, vaccine providers and tested people (Figure 7a). In low scoring counties, the subindex is driven by the number of COVID-19 clinics, vaccine providers and test sites (Figure 7b).
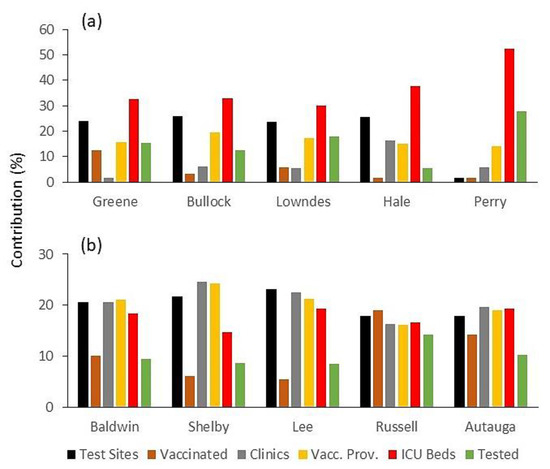
Figure 7.
Percent contribution of each indicator to the adaptive capacity subindex for counties with the (a) highest and (b) lowest subindex scores.
The three subindices were aggregated to form the overall COVID-19 Vulnerability Index. The spatial distribution of the resulting overall scores is displayed in Figure 8. The most vulnerable counties are found in the Alabama Black Belt (a total of eight out of nine counties). In general, the least vulnerable counties are located north of the Black Belt (a total of eleven out of fourteen counties). Only two least exposed counties, Baldwin and Coffee, are located south of the Black Belt. Russel County constitutes one notable exception: despite being a Black Belt County, it is one of the least vulnerable counties, thanks to a lower exposure (number of COVID-19 cases and deaths) and a higher adaptive capacity (relatively high number of clinics, tested and vaccinated people).
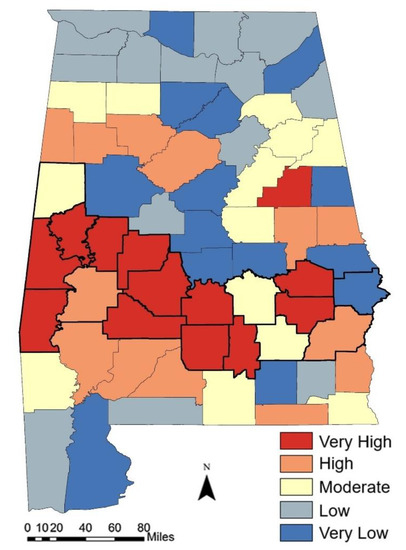
Figure 8.
Spatial distribution of the overall COVID-19 Vulnerability Index at county level. The thick black lines indicate the boundaries of Black Belt counties.
The ranking of the five least and most vulnerable counties (Figure 9) confirms that Alabama’s most vulnerable counties to COVID-19 are located in the Black Belt, which also includes one of the least vulnerable counties (Russel County). However, it should be noted that a majority of the Alabama population lives in counties with low vulnerability. Based on 2021 population estimates from the US Census Bureau, 59.6% of Alabamians live in such counties, while only 28.4% live in highly vulnerable counties.
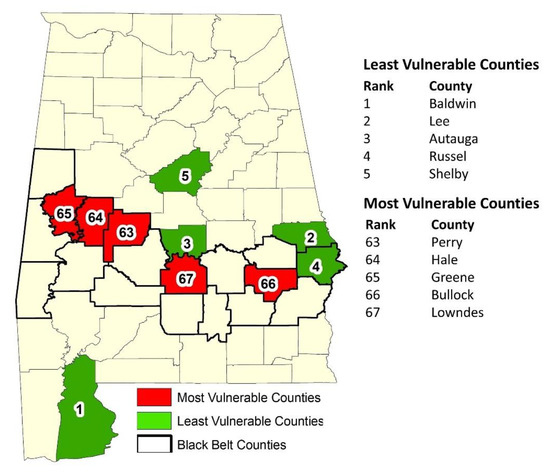
Figure 9.
Ranking and location of the five least and most vulnerable counties.
3.3. Deconstruction of the COVID-19 Vulnerability Index
The relative importance of the subindices to the overall vulnerability index is summarized in Table 7. The correlation of the subindices with the overall index shows that the vulnerability scores are mainly explained by adaptive capacity (−0.86) and sensitivity (0.85).
Table 7.
Correlation between subindices and the COVID-19 Vulnerability Index.
The overall vulnerability index is a summary of the constituting subindices and indicators, which can be used by policymakers to start the decision-making process. However, to extend the analysis, understand the contribution of each subindex, and better understand the meaning of each score and the performance of each county, it is necessary to deconstruct the overall index [47,106]. Figure 10 shows the contribution of each subindex to the overall composite index for the five most and least vulnerable counties. In highly vulnerable counties, sensitivity and exposure are the main contributors to the overall index, while contribution from adaptive capacity is weak. The least vulnerable counties exhibit very strong contribution from adaptive capacity and low contribution from the other subindices. For example, the percent contribution of the subindices to the overall index for the most vulnerable county (Lowndes) are as follows: exposure: 45%; sensitivity: 42%; adaptive capacity: 13%. In contrast, the values for the least vulnerable county (Baldwin) are 17%, 9%, and 75%, respectively.
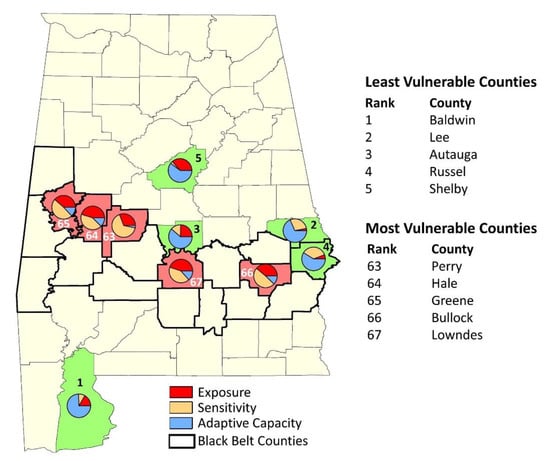
Figure 10.
Percent contribution of each subindex to the overall composite index for the five least and most vulnerable counties.
This contrast is illustrated in Figure 11, which shows for the highest and lowest scoring counties (Baldwin and Lowndes, respectively), the percent contribution of each indicator to the overall index, with respect to the value range and average. To summarize, the highly vulnerable counties are more exposed to and affected by COVID-19, and less able to cope with the disease, due to weak adaptive capacity.
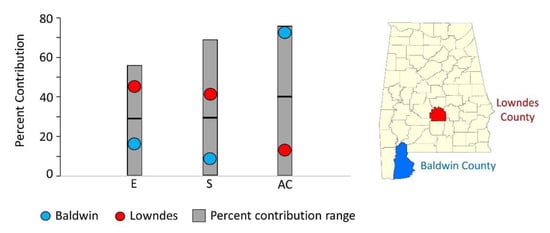
Figure 11.
Percent contribution to the COVID-19 Vulnerability Index for the least and most vulnerable counties (Baldwin and Lowndes, respectively). E: exposure; S: sensitivity; AC: adaptive capacity. The grey area shows the range of percent values for each indicator.
The analysis can be further extended by disaggregating each subindex. It must be remembered that higher scores denote higher vulnerability to COVID-19. Figure 12 shows the correlation of each subindex with the constituting indicators. The exposure subindex (Figure 12a), with a correlation coefficient of 0.78, is highly correlated with COVID-19 deaths. The other two indicators are much less correlated with the subindex (hospitalizations, 0.28; cases: 0.26). The sensitivity subindex is mainly explained by the following four indicators: household income below poverty level (0.88), Respiratory Hazard Index (0.88), unemployment rate (0.83), and obesity (0.72) (Figure 12b). Three other indicators are relatively important, but to a lesser extent: food insecurity (0.65), smokers (0.62), and diabetes (0.61). The uninsured indicator displays a very weak relationship with the subindex (0.04). The two crowding indicators (population density and households with five people or more) are negatively correlated with the subindex. Overall, many indicators substantially contribute to the sensitivity subindex. The adaptive capacity subindex is mainly dominated by four indicators: clinics (0.87), vaccine providers (0.72), vaccinated people (0.67), and test sites (0.62). The two other indicators (ICU beds and tested people) display a weak and negative correlation with the subindex (−0.20 and −0.01, respectively). Overall, the correlation coefficient values are consistent with the weights assigned to indicators; the highest (lowest) coefficients correspond to the highest (lowest) weights.
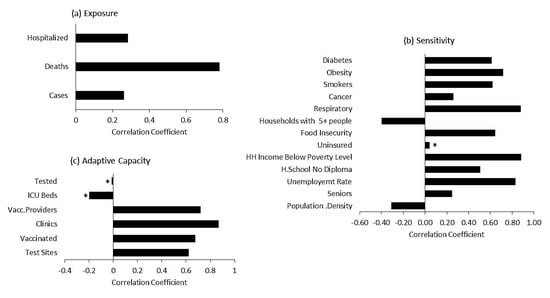
Figure 12.
Correlation of each subindex with its indicators: (a) exposure; (b) sensitivity; (c) adaptive capacity. All correlation coefficients are significant at the 5% level, except for those marked with an asterisk.
By returning to the underlying indicators, the deconstruction allows a better understanding of each subindex score and associated rankings [47,106]. The spider diagrams (radar charts) presented in Figure 13 are an example of the disaggregation of subindices for an easier interpretation of the overall composite index scores. For each subindex, the scores of indicators for the least and most vulnerable counties (Baldwin County and Lowndes County, respectively) are displayed alongside the sample mean (average score for all counties). This method allows us to analyze the relative performance of each county with respect to the whole sample. The deconstruction of the exposure subindex (Figure 13a) shows that Lowndes County scores higher than the sample mean on all indicators, while Baldwin County scores lower. However, for the number of COVID-19 cases and people hospitalized, the scores for both counties are relatively close to the sample mean. Most of the differences between the two counties is explained by one indicator, the number of COVID-19 deaths, which exhibits the largest gap between the scores:; the average score for the whole sample is 45%, while Lowndes County’s score is much above the average (88%), in contrast with Baldwin County’s score (15%). All the indicators point to Lowndes County’s greater exposure to COVID-19. Figure 13b displays the scores of thirteen indicators, which constitute the sensitivity subindex for both counties, along with the sample mean. Lowndes County’s high sensitivity to COVID-19 is mainly explained by the high scores of socioeconomic and comorbidity indicators. Lowndes scores much higher than the sample mean for eight indicators, and matches it for the two other ones. In contrast, Baldwin County scores much lower than the sample mean for ten indicators. As a result, for most of the indicators, the gap between the two counties is very large. For example, Lowndes County surpasses Baldwin County by more than 50% for household income below poverty level, people with some high school but no diploma, food insecurity rate, Air Toxic Respiratory Index, the number of smokers, and obesity. There are some notable exceptions: despite being the most vulnerable county, Lowndes scores lower than Baldwin County with population density, households with at least five people, and the number of seniors and uninsured people. The deconstruction of the adaptive capacity subindex is shown on Figure 13c. For all the indicators, Baldwin County scores higher than Lowndes County and the sample mean. The following 4 indicators (out of 6) have scores higher than 90%: the number of tested people, test sites, clinics, and vaccine providers. Conversely, Lowndes County scores below average with all indicators, except for a match with test sites. An area of concern for both counties and the State of Alabama is the number of ICU beds, which exhibits the lowest scores, including for the sample mean.
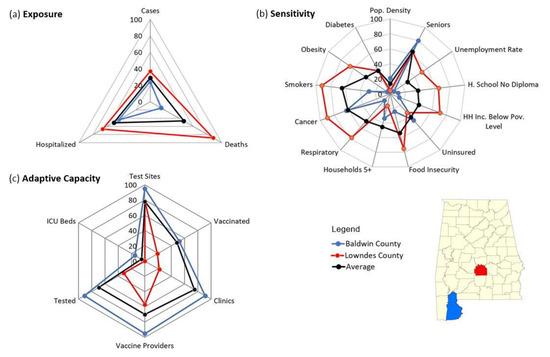
Figure 13.
Deconstruction of subindices shown as spider diagrams, for the least and most vulnerable counties (Baldwin and Lowndes, respectively), and the average for all the Alabama counties. Values are scaled between 0 (lowest performance) and 100 (highest).
Regardless of the overall score achieved, the situation of each county must be analyzed in detail. Spider diagrams comparing each county’s indicator scores with the average score for all the counties can be displayed alongside the associated demographic, socioeconomic and health data. One example (Madison County) is shown in Figure 14. The resulting county profile provides more information and better support for the decision-making process [106].
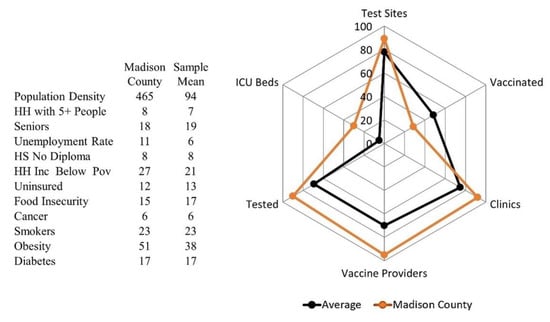
Figure 14.
County profile for Madison County compared with the average for all the state’s counties (values are percentages).
Furthermore, the deconstruction of subindices can be more useful for policy makers if the original values of individual indicators are considered, with respect to the sample [47,106]. Such a practice, by considering actual values rather than normalized ones, provides a better understanding of the meaning of the score of each indicator, since familiar units are used.
4. Summary and Conclusions
In this study, the vulnerability to COVID-19 at county level was assessed for the State of Alabama. Multivariate analysis methods were used to (1) assess and weigh demographic, socioeconomic, and health indicators that are relevant to the disease; (2) combine them into three subindices: exposure, sensitivity, and adaptive capacity; and (3) aggregate the subindices into a composite vulnerability index. GIS methods were used to map the results.
Spatial patterns of the composite index showed that vulnerability to COVID-19 varied considerably across Alabama counties. The most vulnerable counties were found in the Alabama Black Belt, while most of the least vulnerable ones were located north of the Black Belt. The subindices contributed differently to the vulnerability index, which was mainly explained by adaptive capacity and sensitivity. The subindices driving the composite index also varied spatially: most vulnerable counties were characterized by low adaptive capacity, and high exposure and sensitivity, while the least vulnerable counties exhibited strong contribution from adaptive capacity.
Further deconstruction of each subindex gave new insights into the meaning of the composite index and allowed the development of individual county profiles that can be very useful for decision makers. Information obtained from the deconstruction can allow decision-makers to detect strengths and weaknesses of each county, identify indicators that are less important, and precisely pinpoint areas where intervention is needed. For example, (1) being the least vulnerable county did not preclude Baldwin from showing weaknesses in some areas (e.g., cancer, seniors, uninsured); (2) decision-makers analyzing Lowndes’s situation would be able to quickly determine that although it was the most vulnerable county, crowding, level of health insurance enrollment, and number of seniors were not a main concern. Therefore, depending on each county’s situation, different remedial measures might be undertaken.
The limitations of this study include the non-availability of more recent datasets for some indicators, and well documented weaknesses that are inherent in the statistical methods used to normalize, weigh, and aggregate the data [47,54,105]. For example, both factor analysis and normalization are very sensitive to the presence of extreme values or outliers, which may result in the spurious variability of the data and affect the composite score. Moreover, all the weighting and aggregation methods have their pros and cons, and as concluded in a study, “there is no perfect solution to the weighting issue” [105]. In addition, the attribution of indicators to each determinant can influence the outcome of the analysis. For example, in this study, the number of deaths and hospitalizations are considered as exposure indicators (the nature and degree to which populations are exposed). However, both indicators could also depict the degree to which populations are affected (sensitivity). Another limitation of this study consists in the lack of a sensitivity indicator indicating population mobility. Daytime population density was initially chosen as a measure of both crowding and mobility, given that a closer proximity of people increases disease spread [59]. However, this indicator was eventually discarded for redundancy and very low PCA loading. Our study was also limited by the lack of statewide data quantifying local policies that can influence the level of vulnerability to the pandemic. For example, some cities such as Birmingham, Tuscaloosa, and Montgomery tried to make their own rules (city-wide curfew, stay-at-home, mandatory face masks), but this was not a widespread trend. In general, there has been very few areas in Alabama with different prevention measures. Instead, the measures decided by the Governor at the peak of the pandemic (limited public gatherings, the stay-at-home order issued on 3 April 2020) were applied statewide, with no exceptions.
The COVID-19 Vulnerability Index developed in this study was based on a set of indicators that have been confirmed by specialists in the medical and social fields as being relevant to the disease. They include comorbidities, the availability of ICU beds, and a variety of demographic and socioeconomic variables that are often referred to as health disparity determinants. The index was able to capture the prevalence of COVID-19 exacerbated by inequities related to the aforementioned factors. The fact that most vulnerable counties were found in the Alabama Black Belt is not surprising; according to the CDC, the rate ratio for black compared to white and non-Hispanic persons is 2.8× for hospitalizations and 2.0× for deaths [18]. As attested in many studies, the disproportional impact of COVID-19 on African Americans results from a variety of factors, including demographic, social, economic and health inequities [4,19,28,107]. Our study corroborates this fact.
Future work to improve this study will consist of (1) the inclusion of an uncertainty analysis and sensitivity analysis to assess the robustness of the composite index; and (2) a further review of the indicators. This can be accomplished by implicating stakeholders and communities, further incorporating the contribution subject-matter experts, and as the diseases evolves, considering the removal of indicators that are not important and the addition of new indicators (such as disability, prisons, nursing homes, and homelessness). The products resulting from this study, if updated on a regular basis and refined, can help decision makers develop an efficient system for the integrated monitoring of the pandemic, and act on the underlying determinants of the composite index and subindices for a data-driven response to COVID-19. Integrating this tool into the larger framework of public health emergency management will enable the development of strategies adapted to each county, allow a targeted allocation of resources, and help communities build resilience during a pandemic.
Author Contributions
Conceptualization: Souleymane Fall; methodology: Souleymane Fall and Ehsan Abdalla; software: Souleymane Fall and Joseph Quansah; validation: Souleymane Fall, Ehsan Abdalla, Joseph Quansah, Timmera Whaley-Omidire and Meghan J. Franklin; formal analysis: Souleymane Fall; investigation: Souleymane Fall and Ehsan Abdalla; resources: Souleymane Fall and Joseph Quansah; data curation: Souleymane Fall, Timmera Whaley-Omidire and Meghan J. Franklin; writing—original draft preparation: Souleymane Fall; writing—review and editing: Souleymane Fall, Ehsan Abdalla, Joseph Quansah, Meghan J. Franklin and Timmera Whaley-Omidire; visualization: Souleymane Fall, Joseph Quansah, Timmera Whaley-Omidire and Meghan J. Franklin; supervision: Souleymane Fall; project administration: Souleymane Fall; funding acquisition: Souleymane Fall and Joseph Quansah. All authors have read and agreed to the published version of the manuscript.
Funding
This study was supported by USDA-NIFA Grant #1001194. We gratefully acknowledge the funding support provided by Tuskegee University’s George Washington Carver Agricultural Experiment Station.
Institutional Review Board Statement
Not applicable.
Informed Consent Statement
Not applicable.
Data Availability Statement
This research did not include any data through intervention or interaction with individuals. There was no identifiable private information disclosed. The data used are publicly available and the sources are already clearly indicated in the manuscript (see Table 1).
Acknowledgments
We thank Tuskegee University’s George Washington Carver Agricultural Experiment Station. We are also thankful to Ramsey Archibald, who provided useful information on the ICU beds in Alabama.
Conflicts of Interest
The authors declare no conflict of interest. The funders had no role in the design of the study; in the collection, analyses, or interpretation of data; in the writing of the manuscript, or in the decision to publish the results.
References
- Centers for Disease Control and Prevention. CDC Museum COVID-19 Timeline. 2021. Available online: https://www.cdc.gov/museum/timeline/covid19.html (accessed on 12 June 2020).
- Johns Hopkins University; Coronavirus Resource Center; Center for Systems Science and Engineering at Johns Hopkins University & Medicine. 2021. Available online: https://coronavirus.jhu.edu/map.html (accessed on 3 May 2022).
- World Health Organization. Coronavirus Disease 2019 Q&As. 2020. Available online: https://www.who.int/emergencies/diseases/novel-coronavirus-2019/question-and-answers-hub/q-a-detail/coronavirus-disease-covid-19 (accessed on 12 June 2020).
- Centers for Disease Control and Prevention: Introduction to COVID-19 Racial and Ethnic Health Disparities. 2020. Available online: https://www.cdc.gov/coronavirus/2019-ncov/community/health-equity/racial-ethnic-disparities/index.html (accessed on 26 December 2020).
- Goldfarb, A. The State of COVID-19 Race and Ethnicity Data. The COVID Tracking Project. 2021. Available online: https://covidtracking.com/analysis-updates/state-of-COVID-race-and-ethnicity-data (accessed on 9 April 2021).
- World Health Organization. Impact of COVID-19 on People’s Livelihoods, Their Health and Our Food Systems. 2020. Available online: https://www.who.int/news/item/13-10-2020-impact-of-covid-19-on-people%27s-livelihoods-their-health-and-our-food-systems (accessed on 12 June 2020).
- Gautam, S.; Hens, L. COVID-19: Impact by and on the environment, health and economy. Environ. Dev. Sustain. 2020, 22, 4953–4954. [Google Scholar] [CrossRef] [PubMed]
- Power, K. The COVID-19 pandemic has increased the care burden of women and families. Sustain. Sci. Pr. Policy 2020, 16, 67–73. [Google Scholar] [CrossRef]
- Beckman, J.; Countryman, A.M. The Importance of Agriculture in the Economy: Impacts from COVID-19. Am. J. Agric. Econ. 2021, 103, 1595–1611. [Google Scholar] [CrossRef] [PubMed]
- Phillipson, J.; Gorton, M.; Turner, R.; Shucksmith, M.; Aitken-McDermott, K.; Areal, F.; Cowie, P.; Hubbard, C.; Maioli, S.; McAreavey, R.; et al. The COVID-19 Pandemic and Its Implications for Rural Economies. Sustainability 2020, 12, 3973. [Google Scholar] [CrossRef]
- National Institutes of Health. COVID-19: The Ripple Effects. 2020. Available online: https://covid19.nih.gov/news-and-stories/covid19-ripple-effects (accessed on 22 May 2021).
- Flaherty, C. No Room of One’s Own: Early Journal Submission Data Suggest COVID-19 Is Tanking Women’s Research Productivity. Inside Higher Ed. 2020. Available online: https://www.insidehighered.com/news/2020/04/21/early-journal-submission-data-suggest-covid-19-tanking-womens-research-productivity (accessed on 22 May 2021).
- Pulrang, A. 5 Things to Know about Coronavirus and People with Disabilities. Forbes. 2020. Available online: https://www.forbes.com/sites/andrewpulrang/2020/03/08/5-things-to-know-about-coronavirus-and-people-with-disabilities/?sh=531d04ec1d21 (accessed on 28 December 2020).
- National Public Radio; The Robert Wood Johnson Foundation; Harvard, T.H.; Chan School of Public Health. The Impact of Coronavirus on Households Across America. 2020. Available online: https://cdn1.sph.harvard.edu/wp-content/uploads/sites/21/2020/09/NPR-RWJF-Harvard-National-Report_092220_Final1-4.pdf (accessed on 9 April 2021).
- National Public Radio; The Robert Wood Johnson Foundation; Harvard, T.H.; Chan School of Public Health. The Impact of Coronavirus on Households in Rural America. 2020. Available online: https://cdn1.sph.harvard.edu/wp-content/uploads/sites/94/2020/10/Rural-Report_100520-FINAL.pdf (accessed on 9 April 2021).
- National Public Radio; The Robert Wood Johnson Foundation; Harvard, T.H.; Chan School of Public Health. The Impact of Coronavirus on Households with Children. 2020. Available online: https://cdn1.sph.harvard.edu/wp-content/uploads/sites/94/2020/09/HH-Children-Report_093020.pdf (accessed on 9 April 2021).
- Evanega, S.; Lynas, M.; Adams, J.; Smolenyak, K.; Insights, C.G. Coronavirus misinformation: Quantifying sources and themes in the COVID-19 ‘infodemic’. J. Med. Internet Res. 2020; preprints. [Google Scholar] [CrossRef]
- Centers for Disease Control and Prevention. Health Equity Considerations and Racial and Ethnic Minority Groups. 2021. Available online: https://www.cdc.gov/coronavirus/2019-ncov/community/health-equity/race-ethnicity.html (accessed on 21 May 2021).
- Centers for Disease Control and Prevention. Health Disparities and Inequalities Report—United States. Mortal. Morb. Wkly. Report. 2011, 60, 1–113. [Google Scholar]
- World Health Organization. Closing the Gap in a Generation: Health Equity through Action on the Social Determinants of Health. Final Report of the Commission on Social Determinants of Health; World Health Organization: Geneva, Switzerland, 2008. [Google Scholar]
- Keppel, K.G.; Pearcy, N.J.; Wagener, K.G. Trends in racial and ethnic-specific rates for the health status indicators: United States, 1990–1998. Healthy People 2000 Stat Notes 2002, 23, 1–16. [Google Scholar]
- Nelson, A.R. Unequal treatment: Report of the institute of medicine on racial and ethnic disparities in healthcare. Ann. Thorac. Surg. 2003, 76, S1377–S1381. [Google Scholar] [CrossRef]
- US Department of Health and Human Services. With Understanding and Improving Health and Objectives for Improving Health. In Healthy People 2010, 2nd ed.; US Government Printing Office: Washington, DC, USA, 2000. Available online: https://files.eric.ed.gov/fulltext/ED443794.pdf (accessed on 21 May 2021).
- Centers for Disease Control and Prevention. Planning for an Emergency: Strategies for Identifying and Engaging At-Risk Groups. A guidance document for Emergency Managers, 1st ed.; CDC: Atlanta, GA, USA, 2015. [Google Scholar]
- Agency for Healthcare Research and Quality. 2019 National Healthcare Quality and Disparities Report. Rockville, MD: Agency for Healthcare Research and Quality. 2020 Dec; AHRQ Pub. No. 20(21)-0045-EF. Available online: https://www.ahrq.gov/research/findings/nhqrdr/nhqdr19/index.html (accessed on 9 February 2021).
- Dasgupta, S.; Bowen, V.B.; Leidner, A.; Fletcher, K.; Musial, T.; Rose, C.; Cha, A.; Kang, G.; Dirlikov, E.; Pevzner, E.; et al. Association Between Social Vulnerability and a County’s Risk for Becoming a COVID-19 Hotspot—United States, June 1–July 25, 2020. MMWR. Morb. Mortal. Wkly. Rep. 2020, 69, 1535–1541. [Google Scholar] [CrossRef]
- Karaye, I.M.; Horney, J.A. The Impact of Social Vulnerability on COVID-19 in the U.S.: An Analysis of Spatially Varying Relationships. Am. J. Prev. Med. 2020, 59, 317–325. [Google Scholar] [CrossRef]
- Kim, S.J.; Bostwick, W. Social Vulnerability and Racial Inequality in COVID-19 Deaths in Chicago. Health Educ. Behav. 2020, 47, 509–513. [Google Scholar] [CrossRef]
- Nayak, A.; Islam, S.J.; Mehta, A.; Ko, Y.-A.; Patel, S.A.; Goyal, A.; Sullivan, S.; Lewis, T.T.; Vaccarino, V.; Morris, A.A.; et al. Impact of Social Vulnerability on COVID-19 Incidence and Outcomes in the United States. medRxiv, 2020; preprint. [Google Scholar] [CrossRef] [Green Version]
- Wyper, G.M.A.; Assunção, R.; Cuschieri, S.; Devleesschauwer, B.; Fletcher, E.; Haagsma, J.A.; Hilderink, H.B.M.; Idavain, J.; Lesnik, T.; Von der Lippe, E.; et al. Population vulnerability to COVID-19 in Europe: A burden of disease analysis. Arch. Public Health 2020, 78, 47. [Google Scholar] [CrossRef] [PubMed]
- Biggs, E.N.; Maloney, P.M.; Rung, A.L.; Peters, E.S.; Robinson, W.T. The Relationship Between Social Vulnerability and COVID-19 Incidence Among Louisiana Census Tracts. Front. Public Health 2021, 8, 617976. [Google Scholar] [CrossRef] [PubMed]
- Esobi, I.C.; Lasode, M.K.; Anyanwu, C.I.; Flores-Barriguete, M.O.; Okorie, M.A.; Lasode, D.O. Food Insecurity, Social Vulnerability, and the Impact of COVID-19 on Population Dependent on Public Assistance/SNAP: A Case Study of South Carolina, USA. J. Food Secur. 2021, 9, 8–18. [Google Scholar] [CrossRef]
- Conticini, E.; Frediani, B.; Caro, D. Can atmospheric pollution be considered a co-factor in extremely high level of SARS-CoV-2 lethality in Northern Italy? Environ. Pollut. 2020, 261, 114465. [Google Scholar] [CrossRef]
- Hossain, M.A. Is the spread of COVID-19 across countries influenced by environmental, economic and social factors? medRxiv 2020. [Google Scholar] [CrossRef]
- Jiang, Y.; Xu, J. The association between COVID-19 deaths and short-term ambient air pollution/meteorological condition exposure: A retrospective study from Wuhan, China. Air Qual. Atmos. Health 2020, 14, 1–5. [Google Scholar] [CrossRef]
- Khursheed, A.; Mustafa, F.; Akhtar, A. Investigating the roles of meteorological factors in COVID-19 transmission in Northern Italy. Environ. Sci. Pollut. Res. 2021, 28, 48459–48470. [Google Scholar] [CrossRef]
- Tahmasebi, P.; Shokri-Kuehni, S.M.S.; Sahimi, M.; Shokri, N. How do environmental, economic and health factors influence regional vulnerability to COVID-19? medRxiv 2020. [Google Scholar] [CrossRef]
- Wang, Q.; Berger, N.A.; Xu, R. Analyses of Risk, Racial Disparity, and Outcomes Among US Patients with Cancer and COVID-19 Infection. JAMA Oncol. 2021, 7, 220. [Google Scholar] [CrossRef]
- Zoran, M.A.; Savastru, R.S.; Savastru, D.M.; Tautan, M.N. Assessing the relationship between surface levels of PM2.5 and PM10 particulate matter impact on COVID-19 in Milan, Italy. Sci. Total Environ. 2020, 738, 139825. [Google Scholar] [CrossRef]
- Wu, X.; Nethery, R.C.; Sabath, M.B.; Braun, D.; Dominici, F. Air pollution and COVID-19 mortality in the United States: Strengths and limitations of an ecological regression analysis. Sci. Adv. 2020, 6, eabd4049. [Google Scholar] [CrossRef] [PubMed]
- Liu, F.; Wang, M.; Zheng, M. Effects of COVID-19 lockdown on global air quality and health. Sci. Total Environ. 2020, 755, 142533. [Google Scholar] [PubMed]
- Soga, M.; Evans, M.J.; Cox, D.T.C.; Gaston, K.J. Impacts of the COVID-19 pandemic on human–nature interactions: Pathways, evidence and implications. People Nat. 2021, 3, 518–527. [Google Scholar] [CrossRef] [PubMed]
- McNeely, J.A. Nature and COVID-19: The pandemic, the environment, and the way ahead. Ambio 2021, 50, 767–781. [Google Scholar] [CrossRef]
- Turek, T.; Diakowska, E.; Kamińska, J.A. Has COVID-19 Lockdown Affected on Air Quality?—Different Time Scale Case Study in Wrocław, Poland. Atmosphere 2021, 12, 1549. [Google Scholar] [CrossRef]
- Saisana, M.; Tarantola, S. State-of-The-Art Report on Current Methodologies and Practices for Composite Indicator Development; European Commission, Joint Research Centre, Institute for the Protection and the Security of the Citizen, Technological and Economic Risk Management Unit: Ispra, Italy, 2002; EUR 20408 EN. [Google Scholar]
- Salzman, J. Methodological Choices Encountered in the Construction of Composite Indices of Economic and Social Well-Being. Technical Report; Center for the Study of Living Standards: Ottawa, ON, Canada, 2003. [Google Scholar]
- Nardo, M.; Saisana, M.; Saltelli, A.; Tarantola, S.; Hoffmann, A.; Giovannini, E. Handbook on Constructing Composite Indicators: Methodology and User Guide; JRC47008; OECD Publishing: Paris, France, 2008. [Google Scholar]
- Cutter, S.L.; Burton, C.G.; Emrich, C.T. Disaster Resilience Indicators for Benchmarking Baseline Conditions. J. Homel. Secur. Emerg. Manag. 2010, 7, 1–24. [Google Scholar] [CrossRef]
- Cutter, S.L.; Boruff, B.J.; Shirley, W.L. Social Vulnerability to Environmental Hazards. Soc. Sci. Q. 2003, 84, 242–261. [Google Scholar] [CrossRef]
- Freudenberg, M. Composite Indicators of Country Performance: A Critical Assessment. OECD Sci. Technol. Ind. Work. Pap. 2003, 16, 1–24. [Google Scholar] [CrossRef]
- Nardo, M.; Saisana, M.; Saltelli, A.; Tarantola, S. Tools for Composite Indicators Building; EUR 21682 EN. 2005. JRC31473; European Communities: Brussels, Belgium, 2005. [Google Scholar]
- Sonrexa, J.; Moodie, R. The Race to Be the Perfect Nation (March 2013). Aust. Econ. Rev. 2013, 46, 70–77. [Google Scholar] [CrossRef]
- Beccari, B. A Comparative Analysis of Disaster Risk, Vulnerability and Resilience Composite Indicators. PLoS Curr. Disasters 2016, 8, 56. [Google Scholar] [CrossRef]
- Becker, W.; Saisana, M.; Paruolo, P.; Vandecasteele, I. Weights and importance in composite indicators: Closing the gap. Ecol. Indic. 2017, 80, 12–22. [Google Scholar] [CrossRef] [PubMed]
- Acharya, R.; Porwal, A. A vulnerability index for the management of and response to the COVID-19 epidemic in India: An ecological study. Lancet Glob. Health 2020, 8, e1142–e1151. [Google Scholar] [CrossRef]
- Kiaghadi, A.; Rifai, H.S.; Liaw, W. Assessing COVID-19 risk, vulnerability and infection prevalence in communities. PLoS ONE 2020, 15, e0241166. [Google Scholar] [CrossRef] [PubMed]
- Sarkar, A.; Chouhan, P. COVID-19: District level vulnerability assessment in India. Clin. Epidemiology Glob. Health 2020, 9, 204–215. [Google Scholar] [CrossRef]
- Shadeed, S.; Alawna, S. GIS-based COVID-19 vulnerability mapping in the West Bank, Palestine. Int. J. Disaster Risk Reduct. 2021, 64, 102483. [Google Scholar] [CrossRef]
- Marvel, S.W.; House, J.S.; Wheeler, M.; Song, K.; Zhou, Y.-H.; Wright, F.A.; Chiu, W.A.; Rusyn, I.; Motsinger-Reif, A.; Reif, D. The COVID-19 Pandemic Vulnerability Index (PVI) Dashboard: Monitoring County-Level Vulnerability Using Visualization, Statistical Modeling, and Machine Learning. Environ. Health Perspect. 2021, 129, 017701. [Google Scholar] [CrossRef]
- Snyder, B.F.; Parks, V. Spatial variation in socio-ecological vulnerability to Covid-19 in the contiguous United States. Health Place 2020, 66, 102471. [Google Scholar] [CrossRef]
- Tiwari, A.; Dadhania, A.V.; Ragunathrao, V.A.B.; Oliveira, E.R. Using machine learning to develop a novel COVID-19 Vulnerability Index (C19VI). Sci. Total Environ. 2021, 773, 145650. [Google Scholar] [CrossRef]
- Campos, I.S.; Aratani, V.F.; Cabral, K.B.; Limongi, J.E.; de Oliveira, S.V. A Vulnerability Analysis for the Management of and Response to the COVID-19 Epidemic in the Second Most Populous State in Brazil. Front. Public Health 2021, 9, 586670. [Google Scholar] [CrossRef]
- Centers for Disease Control and Prevention; CDC COVID-19 Response Team. Geographic Differences in COVID-19 Cases, Deaths, and Incidence—United States, February 12–April 7, 2020. Morb. Mortal Wkly. Rep. 2020, 69, 465–471. [Google Scholar] [CrossRef] [Green Version]
- OECD. OECD Policy Responses to Coronavirus (COVID-19): The Territorial Impact of COVID-19: Managing the Crisis across Levels of Government. 2020. Available online: https://read.oecd-ilibrary.org/view/?ref=128_128287-5agkkojaaa&title=The-territorial-impact-of-covid-19-managing-the-crisis-across-levels-of-government&_ga=2.223860242.821842099.1633583599-1452410078.1633583599 (accessed on 9 February 2021).
- Pipa, A.F.; Bouchet, M. Leadership at the local level: How can cities drive a sustainable recovery? In Brookings Institution (2020) Reimagining the Global Economy: Building Back Better in a Post-COVID-19 World; Global Economy and Development at Brookings: Washington, DC, USA, 2020; pp. 17–23. [Google Scholar]
- Chernick, H.; Copeland, D.; Reschovsky, A. The fiscal effects of the COVID-19 pandemic on cities: An initial assessment. Natl. Tax J. 2020, 73, 699–732. [Google Scholar] [CrossRef]
- National League of Cities. What COVID-19 Means for City Finances. 2020. Available online: https://covid19.nlc.org/wp-content/uploads/2020/06/What-Covid-19-Means-For-City-Finances_Report-Final.pdf (accessed on 9 February 2021).
- Edelman. Government Trust Surges to an All-Time High Amid COVID-19 Pandemic Making It the Most Trusted Institution. 2020. Available online: https://www.edelman.com/news/trust-2020-spring-update-press-release (accessed on 12 January 2021).
- Semega, J.; Kollar, M.; Shrider, E.A.; Creamer, J.F. Income and Poverty in the United States: 2019 U.S. Census Bureau, Current Population Reports, P60-270 (RV). 2020. Available online: https://www.census.gov/content/dam/Census/library/publications/2020/demo/p60-270.pdf (accessed on 12 October 2021).
- John Hopkins University and Medicine. Understanding Vaccination Progress. 2021. Available online: https://coronavirus.jhu.edu/vaccines/international (accessed on 18 November 2021).
- Alabama Department of Public Health. COVID-19 in Alabama. ADPH Division of Infectious Diseases & Outbreaks. 2021. Available online: https://dph1.adph.state.al.us/covid-19 (accessed on 5 January 2021).
- University of Wisconsin Population Health Institute/County Health Rankings & Roadmaps. County Health Rankings Key Findings Report. 2020; pp. 1–16. Available online: https://www.countyhealthrankings.org/reports/2020-county-health-rankings-key-findings-report (accessed on 5 January 2021).
- U.S. Environmental Protection Agency (EPA). EJSCREEN Technical Documentation. 2015; pp. 1–123. Available online: https://www.epa.gov/sites/default/files/2015-05/documents/ejscreen_technical_document_20150505.pdf (accessed on 12 August 2021).
- Centers for Disease Control and Prevention. People with Certain Medical Conditions. 2021. Available online: https://www.cdc.gov/coronavirus/2019-ncov/need-extra-precautions/people-with-medical-conditions.html (accessed on 14 October 2021).
- The New York Times. Tracking Coronavirus in Alabama: Latest Map and Case Count. Available online: https://www.nytimes.com/interactive/2021/us/alabama-covid-cases.html (accessed on 23 October 2021).
- HealthData.Gov. COVID-19 Reported Patient Impact and Hospital Capacity by Facility. Available online: https://healthdata.gov/Hospital/COVID-19-Reported-Patient-Impact-and-Hospital-Capa/uqq2-txqb/data (accessed on 12 May 2021).
- Flanagan, B.E.; Gregory, E.W.; Hallisey, E.J.; Heitgerd, J.L.; Lewis, B. A Social Vulnerability Index for Disaster Management. J. Homel. Secur. Emerg. Manag. 2011, 8, 23. [Google Scholar] [CrossRef]
- Horney, J.; Simon, M.; Grabich, S.; Berke, P. Measuring participation by socially vulnerable groups in hazard mitigation planning, Bertie County, North Carolina. J. Environ. Plan. Manag. 2015, 58, 802–818. [Google Scholar] [CrossRef]
- Wolkin, A.; Patterson, J.R.; Harris, S.; Soler, E.; Burrer, S.; McGeehin, M.; Greene, S. Reducing Public Health Risk During Disasters: Identifying Social Vulnerabilities. J. Homel. Secur. Emerg. Manag. 2015, 12, 809–822. [Google Scholar] [CrossRef] [PubMed] [Green Version]
- An, R.; Xiang, X. Social Vulnerability and Obesity among U.S. Adults. Int. J. Health Sci. (IJHS) 2015, 3, 7–21. [Google Scholar] [CrossRef] [Green Version]
- Gay, J.L.; Robb, S.W.; Benson, K.M.; White, A. Can the Social Vulnerability Index Be Used for More Than Emergency Preparedness? An Examination Using Youth Physical Fitness Data. J. Phys. Act. Health 2016, 13, 121–130. [Google Scholar] [CrossRef] [PubMed]
- Flanagan, B.E.; Hallisey, E.J.; Adams, E.; Lavery, A. Measuring Community Vulnerability to Natural and Anthropogenic Hazards: The Centers for Disease Control and Prevention’s Social Vulnerability Index. J. Environ. Health 2018, 80, 34–36. [Google Scholar]
- Lehnert, E.A.; Wilt, G.; Flanagan, B.; Hallisey, E. Spatial exploration of the CDC’s Social Vulnerability Index and heat-related health outcomes in Georgia. Int. J. Disaster Risk Reduct. 2020, 46, 101517. [Google Scholar] [CrossRef]
- Centers for Disease Control and Prevention; Agency for Toxic Substances and Disease Registry. Geospatial Research, Analysis, and Services Program. CDC/ATSDR Social Vulnerability Index. 2018. Available online: https://www.atsdr.cdc.gov/placeandhealth/svi/index.html (accessed on 28 April 2021).
- Feeding America. Map the Meal Gap 2021 Technical Brief: An Analysis of County and Congressional District Food Insecurity and County Food Cost in the United States in 2019. Available online: https://www.feedingamerica.org/research/map-the-meal-gap/how-we-got-the-map-data (accessed on 15 January 2021).
- Intergovernmental Panel on Climate Change, 2001. In Climate Change 2001: The Scientific Basis. Contribution of Working Group I to the Third Assessment Report of the Intergovernmental Panel on Climate Change; Houghton, J.T.; Ding, Y.; Griggs, D.J.; Noguer, M.; van der Linden, P.J.; Dai, X.; Maskell, K.; Johnson, C.A. (Eds.) Cambridge University Press: Cambridge, UK; New York, NY, USA, 2001; p. 881. [Google Scholar]
- Turner, B.L., II; Kasperson, R.E.; Matson, P.A.; McCarthy, J.J.; Corell, R.W.; Christensen, L.; Eckley, N.; Kasperson, J.X.; Luers, A.; Martello, M.L.; et al. A framework for vulnerability analysis in sustainability science. Proc. Natl. Acad. Sci. USA 2003, 100, 8074–8079. [Google Scholar] [CrossRef] [Green Version]
- Intergovernmental Panel on Climate Change, 2007. In Climate Change 2007: Impacts, Adaptation and Vulnerability. Contribution of Working Group II to the Fourth Assessment Report of the Intergovernmental Panel on Climate Change; Parry, M.L.; Canziani, O.F.; Palutikof, J.P.; van der Linden, P.J.; Hanson, C.E. (Eds.) Cambridge University Press: Cambridge, UK, 2007; p. 976. [Google Scholar]
- Murphy, D.J.; Wyborn, C.; Yung, L.; Williams, D.R. Key Concepts and Methods in Social Vulnerability and Adaptive Capacity; Gen. Tech. Rep. RMRS-GTR-328; Department of Agriculture, Forest Service, Rocky Mountain Research Station: Fort Collins, CO, USA, 2015; pp. 1–24. [Google Scholar]
- Fischer, A.P.; Frazier, T.G. Social Vulnerability to Climate Change in Temperate Forest Areas: New Measures of Exposure, Sensitivity, and Adaptive Capacity. Ann. Am. Assoc. Geogr. 2017, 108, 658–678. [Google Scholar] [CrossRef]
- Centers for Disease Control and Prevention. How COVID-19 Spreads. 2021. Available online: https://www.cdc.gov/coronavirus/2019-ncov/prevent-getting-sick/how-covid-spreads.html (accessed on 14 July 2021).
- Luber, G.; McGeehin, M. Climate Change and Extreme Heat Events. Am. J. Prev. Med. 2008, 35, 429–435. [Google Scholar] [CrossRef] [PubMed]
- U.S. Global Change Research Program. The Impacts of Climate Change on Human Health in the United States: A Scientific Assessment. Crimmins; Balbus, A.J., Gamble, J.L., Beard, C.B., Bell, J.E., Dodgen, D., Eisen, R.J., Fann, N., Hawkins, M.D., Herring, S.C., Jantarasami, L., et al., Eds.; U.S. Global Change Research Program: Washington, DC, USA, 2016; p. 312. [Google Scholar] [CrossRef] [Green Version]
- Pranata, R.; Huang, I.; Lim, M.A.; Wahjoepramono, E.J.; July, J. Impact of cerebrovascular and cardiovascular diseases on mortality and severity of COVID-19–systematic review, meta-analysis, and meta-regression. J. Stroke Cerebrovasc. Dis. 2020, 29, 104949. [Google Scholar] [CrossRef] [PubMed]
- Robilotti, E.V.; Babady, N.E.; Mead, P.A.; Rolling, T.; Perez-Johnston, R.; Bernardes, M.; Bogler, Y.; Caldararo, M.; Figueroa, C.J.; Glickman, M.S.; et al. Determinants of COVID-19 disease severity in patients with cancer. Nat. Med. 2020, 26, 1218–1223. [Google Scholar] [CrossRef] [PubMed]
- Hall, M.A.; Smith, L.A. Feature subset selection: A correlation-based filter approach. In 1997 International Conference on Neural Information Processing and Intelligent Information Systems; Springer: Berlin/Heidelberg, Germany, 1997; pp. 855–858. [Google Scholar]
- Chao, Y.-S.; Wu, C.-J. Principal component-based weighted indices and a framework to evaluate indices: Results from the Medical Expenditure Panel Survey 1996 to 2011. PLoS ONE 2017, 12, e0183997. [Google Scholar] [CrossRef] [PubMed]
- Jolliffe, I.T. Principal Component Analysis; Springer Series in Statistics; Springer: New York, NY, USA, 2002; p. 477. ISBN 0-387-95442-2. [Google Scholar]
- Everitt, B.S.; Hothorn, T. Principal Component Analysis. A Handbook of Statistical Analyses Using R; Chapman and Hall/CRC: London, UK, 2006; p. 348. ISBN 9781482204582. [Google Scholar]
- Kuhn, M. Building Predictive Models in R Using the caret Package. J. Stat. Softw. 2008, 28, 1–26. [Google Scholar] [CrossRef] [Green Version]
- Nicoletti, G.; Scarpetta, S.; Boylaud, O. Summary Indicators of Product Market Regulation with an Extension to Employment Protection Legislation; OECD Economics Department Working Papers, No 226; OECD Publishing: Paris, France, 2000. [Google Scholar] [CrossRef]
- Kaiser, H.F. A second generation little jiffy. Psychometrika 1970, 35, 401–415. [Google Scholar] [CrossRef]
- Kaiser, H.F.; Rice, J. Little jiffy, mark IV. Educ. Psychol. Meas. 1974, 34, 111–117. [Google Scholar] [CrossRef]
- Bartlett, M.S. Properties of sufficiency and statistical tests. Proc. R. Soc. Lond. Ser. A Math. Phys. Sci. 1937, 160, 268–282. [Google Scholar] [CrossRef]
- Sharpe, A.; Andrews, B. An Assessment of Weighting Methodologies for Composite Indicators: The Case of the Index of Economic Well-Being; Centre for the Study of Living Standards (CSLS) Research Report No. 2012-10; Centre for the Study of Living Standards: Ottawa, ON, Canada, 2012; p. 49. [Google Scholar]
- Dillard, M.K.; Goedeke, T.L.; Lovelace, S.; Orthmeyer, A. Monitoring Well-Being and Changing Environmental Conditions in Coastal Communities: Development of An Assessment Method; National Oceanic and Atmospheric Administration (NOAA) Technical Memorandum NOS NCCOS 174; National Oceanic and Atmospheric Administration: Silver Spring, MD, USA, 2013; p. 176. [Google Scholar]
- Yancy, C.W. COVID-19 and African Americans. JAMA 2020, 323, 1891. [Google Scholar] [CrossRef] [Green Version]
Publisher’s Note: MDPI stays neutral with regard to jurisdictional claims in published maps and institutional affiliations. |
© 2022 by the authors. Licensee MDPI, Basel, Switzerland. This article is an open access article distributed under the terms and conditions of the Creative Commons Attribution (CC BY) license (https://creativecommons.org/licenses/by/4.0/).