


Abstract
N4-acetylcytosine (4acC) is a naturally occurring DNA modification; however, its presence and distribution characteristics in prokaryotes remain unclear. In this study, based on the differential deamination activity of APOBEC3A (A3A) toward cytosine (C) and 4acC, we developed a single-base-resolution sequencing method termed 4acC-A3A-seq (4acC-APOBEC3A-sequencing). Following validation using template strands and optimization of reaction conditions, we applied this method to the genome of Escherichia coli (E. coli) and successfully identified 2271 high-confidence candidate 4acC sites, generating the first single-base-resolution genome-wide map of 4acC in a prokaryote. This study provided a key technological approach and foundational data for further exploration of the biological functions and evolutionary conservation of 4acC at single-base resolution.
1. Introduction
As a core mechanism of epigenetic regulation, DNA chemical modifications play pivotal roles in critical biological processes including gene expression regulation, genome stability maintenance, and cell fate determination [1]. With breakthrough advancements in high-throughput sequencing technologies and mass spectrometry analytical methods [2], researchers have identified a diverse array of DNA modifications that significantly expand the complexity of the genetic code [3]. Among these, 5-methylcytosine (5mC) and its derivatives such as 5-hydroxymethylcytosine (5hmC) and 5-formylcytosine (5fC) have been most systematically studied [4,5,6,7,8,9], demonstrating crucial regulatory functions in physiological and pathological processes, including embryonic development [10], tumorigenesis [11], and neurodegenerative diseases [12].
Notably, the recent discovery of N-position-modified C, such as N4-methylcytosine (4mC) [13,14], and ac4C [15,16], is reshaping our understanding of modification diversity. Unlike the well-studied C5-position modifications, these N4-position derivatives represent a distinct and relatively unexplored epigenetic frontier. Despite its significant scientific promise [17], our understanding of DNA 4acC is currently limited to a single landmark publication, leaving a vast landscape of its distribution and function entirely uncharted.
Currently, research on 4acC faces several critical challenges. Primarily, due to its extremely low abundance in the genome and inherent chemical instability (prone to deacetylation), conventional detection methods such as mass spectrometry and antibody-based enrichment sequencing struggle to achieve high sensitivity and specificity [17]. Secondly, the lack of single-base resolution techniques capable of precisely mapping this modification across the entire genome severely limits in-depth analysis of its biological functions. Furthermore, the dynamic changes of 4acC under various physiological and pathological conditions and its regulatory mechanisms remain elusive [17]. These technical bottlenecks directly hinder progress in this field.
In recent years, sequencing technologies based on APOBEC (apolipoprotein B mRNA-editing enzyme catalytic polypeptide-like) family deaminases have brought new opportunities for DNA modification research [18]. Particularly, the APOBEC3A (A3A) protein has attracted significant attention due to its unique substrate specificity [19,20,21,22,23]. Studies have demonstrated that A3A can specifically recognize and deaminate unmodified C and 5mC while remaining inert toward 4mC [24,25]. This characteristic provided crucial insights for developing novel DNA modification detection methods [18,20]. Structurally, both 4acC and 4mC are N4-modified C derivatives, with 4acC bearing an acetyl group and 4mC bearing a methyl group. Given that A3A exhibited deamination resistance toward 4mC, we hypothesized that 4acC might similarly be inert to A3A-mediated deamination. Meanwhile, alkaline treatment has been established as a chemical method for specifically removing acetyl modifications. NH2OH can specifically remove the acetyl group from ac4C in RNA without compromising RNA integrity [26]. Under conventional conditions, 5mC does not react with alkaline.
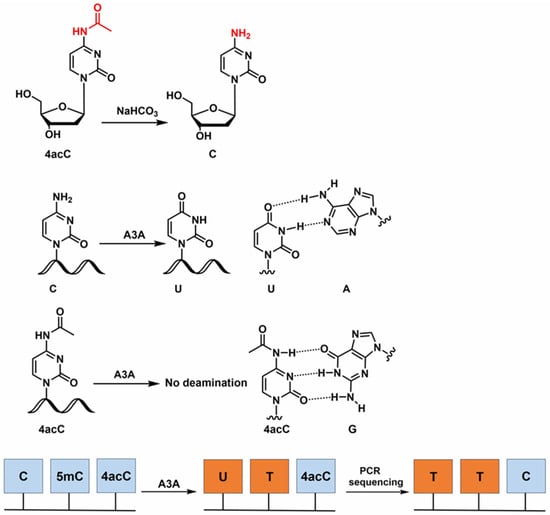
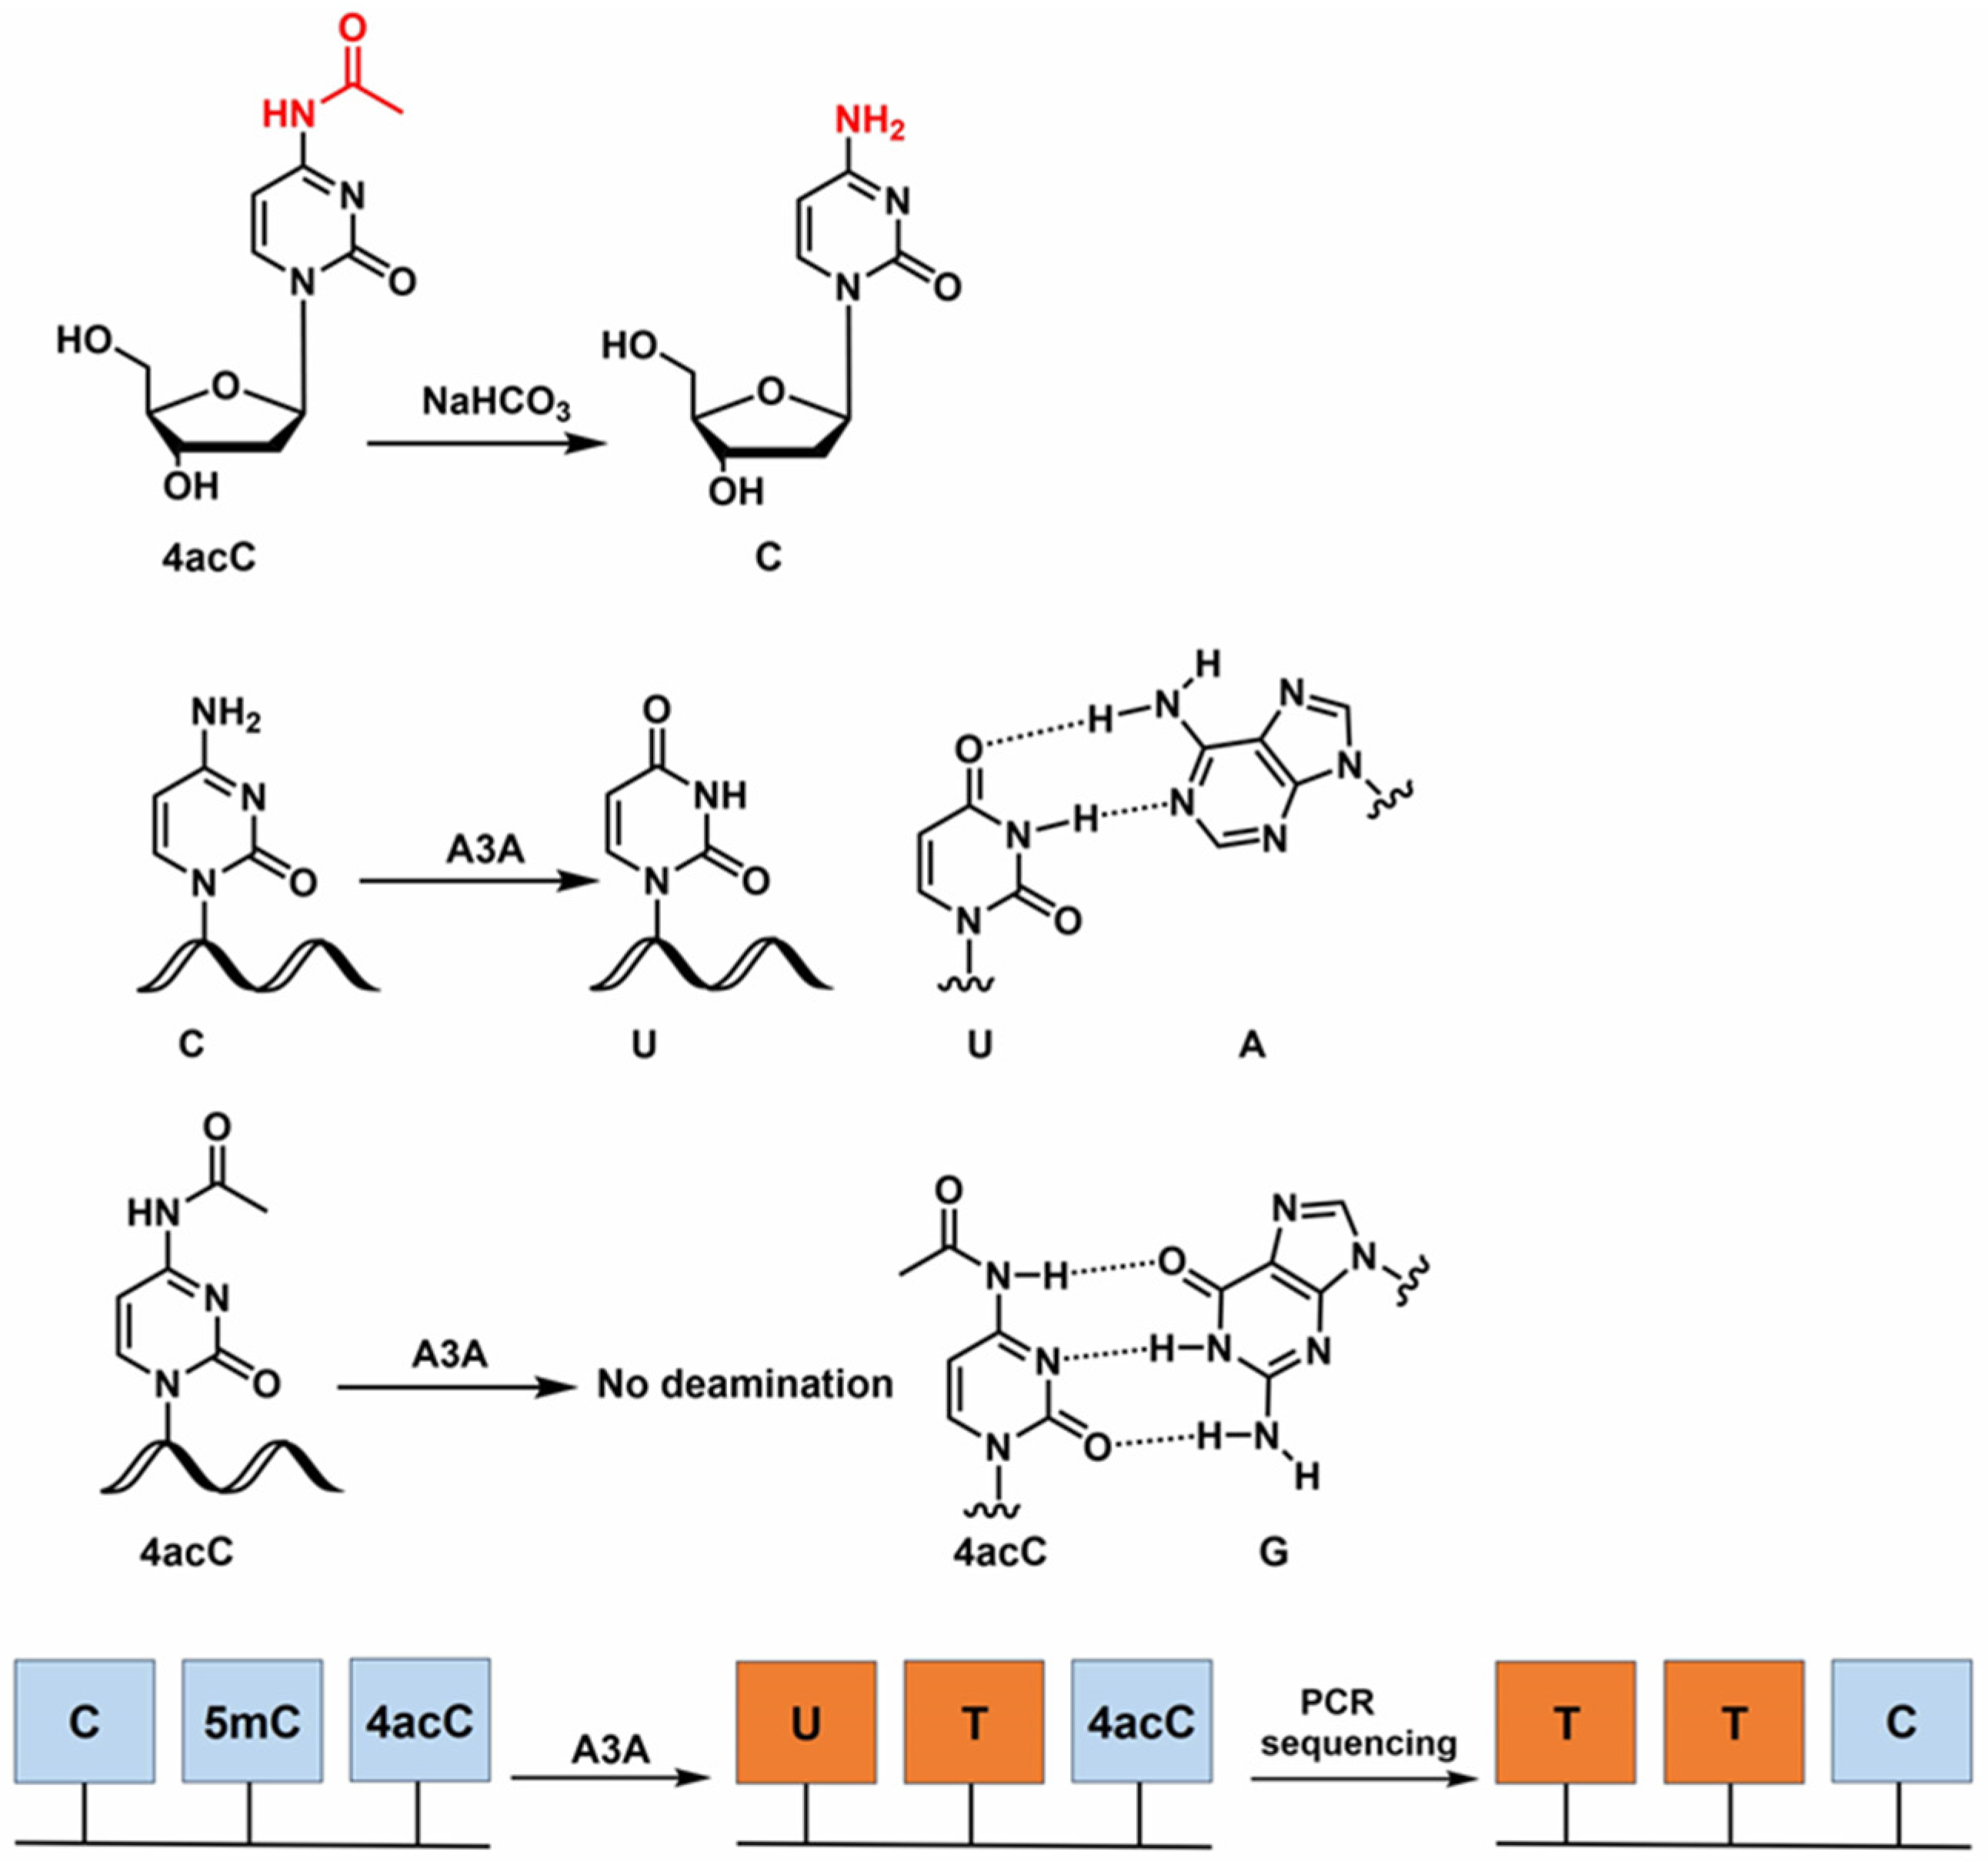
Building on these findings, we developed 4acC-A3A-seq to achieve single-base-resolution mapping of 4acC in E. coli genomic DNA (gDNA). The core principle of this method is illustrated in Figure 1. Upon A3A treatment, unmodified C in the DNA strand is deaminated to uracil (U), whereas 4acC, due to its structural similarity to 4mC, is expected to remain unchanged. Following PCR amplification, the original “C” sites are read as “T”, while 4acC sites are read as “C”. To eliminate experimental background and ensure high specificity, we introduced an alkaline pretreatment as a negative control. alkaline deacetylates 4acC to unmodified C, rendering it susceptible to subsequent A3A-mediated deamination. This strategy enables discrimination of 4acC from other deamination-resistant modified bases. By comparing sequencing results before and after alkaline treatment, genome-wide mapping of 4acC sites can be generated.
Figure 1.
Principle of 4acC-A3A-seq. Under alkaline conditions, 4acC undergoes deacetylation to yield unmodified C. Unmodified C undergoes deamination by A3A to produce U (which base-pairs with A), whereas 4acC remains resistant to A3A activity and maintains its pairing with G. Following PCR amplification, the original C sites are read as “T”, while 4acC sites are read as “C”.
2. Materials and Methods
2.1. Chemicals and Reagents
2′-deoxynucleoside-5′-triphosphates (dGTP, dATP, dTTP, dCTP), recombinant DNase I, S1 nuclease, alkaline phosphatase and Taq HS DNA polymerase (R007Q) were purchased from Takara Biotechnology Co., Ltd. (Dalian, China). 2′-deoxycytidine (dC), N4-acetyl-2′-deoxycytidine and N4-acetyl-2′-deoxycytidine-5′-triphosphates were purchased from Shanghai yuanye Bio-Technology Co., Ltd. (Shanghai, China). All oligonucleotides used in this study were commercially synthesized by Wuhan Qingke Biotechnology Co., Ltd. (Wuhan, China). The sequences of these oligonucleotides are listed in Table S1. VAHTS DNA Clean Beads, RNase A, EpiArt DNA Enzymatic Methylation Kit (EM301) and EpiArt® DNA Methylation Library Kit for lllumina V3 (NE103) and VAHTS Multiplex Oligos Set 4/5 for lllumina (N321/N322) were purchased from Vazyme Biotech Co., Ltd. (Nanjing, China). Oligo Clean & Concentrator was purchased from Zymo Research (Orange, CA, USA). Deep Vent (exo-) DNA polymerase (M0259S), nuclease P1 and Taq DNA polymerase (M0273V) were purchased from NEB (Ipswich, MA, USA). Dream taq DNA polymerase (EP0701) was purchased from Thermo (Waltham, MA, USA). 2× HieffTM PCR master was purchased from Yeasen (Shanghai, China). RNase A-treated E. coli gDNA was purchased from Nanjing Zoonbio Biotechnology Co., Ltd. (Nanjing, China). The nuclease-free water (BL1040A) was purchased from Biosharp (Beijing, China). Deionized formamide (≥99.5%) was purchased from Sigma-Aldrich (St. Louis, MO, USA).
2.2. Enzymatic Digestion of DNA
gDNA (10 μg) was denatured in 37 μL nuclease-free water (95 °C, 10 min), immediately chilled on ice (2 min), then digested overnight at 37 °C in 50 μL reaction volume containing 5 μL 5× digestion buffer (100 mM NaCl, 500 mM Tris-HCl, 10 mM ZnSO4, 10 mM MgCl2, pH 7.0), 180 U S1 nuclease, 4 U recombinant DNase I, 0.002 U nuclease P1, and 30 U alkaline phosphatase. After adding 280 μL each of nuclease-free water and chloroform, the mixture was vortexed vigorously and centrifuged (12,000× g, 5 min). The aqueous phase was transferred to a fresh tube, reextracted with chloroform, and 100 μL of the final supernatant, without any prior dilution, was analyzed by HPLC-MS/MS. HPLC–MS/MS analysis was performed on a triple quadrupole mass spectrometer (QTRAP5500+, AB Sciex, Framingham, MA, USA) in positive ESI mode, coupled with a Shim-pack GIST C18 column (2.0 μm, 2.1 mm × 100 mm, Shimadzu, Kyoto, Japan) maintained at 30 °C. The injection volume was 2 µL. The mobile phase was composed of A (0.1% formic acid, v/v) and B (methanol), with a flow rate of 0.2 mL/min. The gradient was as follows: 5% B for 3 min, 5% B to 80% B over 7 min, 80% B for 3 min, 80% B to 5% B over 30 s and 5% B for 6.5 min. The source-dependent parameters were as follows: curtain gas, 30 psi; collision gas, 9 psi; ion source gas 1, 55 psi; ion source gas 2, 60 psi; ion spray voltage, 5500 V; source temperature, 550 °C. Mass transitions (precursor ions → product ions) were 4acC (quantifier, 270.1 → 112.0; qualifier, 270.1 → 154.0) and dC (228.1 → 112.0). The declustering potential (DP) and collision energy (CE) were set at 50 V and 35 V for the 4acC quantifier, 50 V and 18 V for the 4acC qualifier, and 50 V and 26 V for dC, respectively. Stock solutions of 4acC and dC standards were prepared in nuclease-free water and serially diluted to generate calibration curves. Nucleoside concentrations in each DNA sample were determined by fitting the peak areas to standard curves. For ion-ratio confirmation, the peak-area ratio of the qualifier to the quantifier transition was calculated for both standards and samples. When the ion ratio exceeded 0.5, a tolerance of less than 20% was applied between the sample and standard ion ratios. The 4acC/dC percentage was calculated as (C4acC/CdC) × 100%. The acceptable retention-time difference in our study is defined by the relative deviation of retention time (RT), calculated as: . The acceptance criterion is set at ≤2.0%.
2.3. Synthesis of dsDNA-4acC (Containing Both C and 4acC)
The dsDNA-4acC (containing both C and 4acC) was synthesized in a 50 μL reaction containing 2 μM each of 18-T/T1/T3 and 18-P/T2/T4, 1 U Deep Vent (exo-) DNA polymerase, 1× ThermoPol buffer, 0.2 mM each dATP/dGTP/dTTP, and 0.2 mM 4acdCTP/dC. The reaction was denatured at 95 °C for 15 s, followed by extension at 55 °C for 10 min. The product was purified using Oligo Clean &Concentrator. Mass spectrometric analysis was performed on a Thermo LTQ XL linear ion trap mass spectrometer (Thermo Fisher Scientific, Waltham, MA, USA) equipped with an electrospray ionization (ESI) source. ESI gently converts solution-phase samples into gas-phase charged ions; the ions then enter the linear ion trap and are sequentially ejected and detected according to their mass-to-charge ratio (m/z) under the radiofrequency electric field. Because ESI often generates multiply charged ions, the software converts the m/z values of the individual charge states using their corresponding charge numbers to obtain the molecular mass of the analyte. The mobile phase composition followed the national standard GB/T 34797 [27]. The ionization parameters were set as follows: spray voltage, 4.5 kV; capillary temperature, 350 °C; and the analysis was conducted in negative ion mode. Raw data were acquired and processed using Xcalibur 4.2 SP1 software to determine the molecular weight of oligonucleotides. The experimentally determined masses were compared with the calculated values, and a mass error of ≤±0.05% was considered acceptable.
2.4. Deamination Assay
The deamination reagents were obtained from the EpiArt DNA Enzymatic Methylation Kit (EM301). The dsDNA-4acC substrate (100 ng in 10 μL) was denatured at 95 °C for 15 s, immediately chilled on ice. After 2 min, 10 μL DEA Reaction Buffer, 1 μL BSA, and 1 μL APOBEC3A (DEA Enzyme Mix) were added, and the volume was adjusted to 100 µL with nuclease-free water. The reaction was then incubated at 37 °C for 20 h. Products were purified using VAHTS DNA Clean Beads.
2.5. Deacetylation Assay
1 µg of dsDNA-4acC substrate was mixed with a 6-fold volume of deionized formamide, incubated at 85 °C for 10 min, and immediately placed on ice. After 2 min, 10 µL NaHCO3 (1 M, pH 9.53) and 0.2 µL ZnCl2 (1 M) were added, and the volume was adjusted to 100 µL with nuclease-free water. The reaction was then incubated at 65 °C for 3 h. Reaction products were purified using Oligo Clean & Concentrator.
2.6. PCR Amplification
The PCR amplification was conducted in a 50 μL reaction mixture containing 0.5 μL Taq HS DNA polymerase, 1× PCR buffer, 0.2 mM dNTPs, 0.2 μM each of 160-FP and 160-RP. The PCR program included an initial denaturation at 98 °C for 30 s, followed by 29 cycles of 98 °C for 10 s, 55 °C for 30 s, and 72 °C for 1 min, with a final extension at 72 °C for 5 min. The PCR products were purified using VAHTS DNA Clean Beads and subjected to either Sanger sequencing or clonal sequencing analysis.
2.7. Molecular Cloning
Purified PCR products were ligated into the pClone007 Versatile Simple Vector using the manufacturer’s protocol and transformed into DH5α competent cells. Transformed cells were plated on LB agar plates containing 100 μg/mL ampicillin at 37 °C overnight. Positive clones were subsequently verified by Sanger sequencing.
2.8. qPCR Procedure
A 10 μL qPCR reaction mixture was prepared in a strip tube containing: 1 μL DNA template, 1 μL qPCR FP (10 μM), 1 μL qPCR RP (10 μM), 5 μL 2× HieffTM PCR master, 2 μL nuclease-free water. The reaction was mixed thoroughly by vortexing and briefly centrifuged. Real-time amplification was carried out using the following protocol: initial denaturation at 95 °C for 5 min, followed by 40 cycles of denaturation at 95 °C for 10 s, annealing at 60 °C for 30 s, and extension at 72 °C for 20 s.
2.9. 4acC-A3A-Seq
Two independent technical replicates were set up in parallel for both the experimental and control groups. Reagents were obtained from the EpiArt® DNA Methylation Library Kit for Illumina V3 (NE103), EpiArt DNA Enzymatic Methylation Kit (EM301), and VAHTS Multiplex Oligos Set 4/5 for Illumina (N321/N322). gDNA was sonicated into 200–400 bp fragments with a Bioruptor Plus (Diagenode, Seraing, Belgium).
Spike-in libraries were constructed separately to calculate the deamination rate.
Control group (NaHCO3 + A3A): 1 ng of spike-in DNA (dsDNA-4acC or dsDNA-C, obtained by extending T3 and T4, Table S1) and 999 ng of sonicated gDNA were mixed together, followed by the addition of a 6-fold volume of deionized formamide. The mixture was incubated at 85 °C for 10 min and immediately placed on ice. After 2 min, 10 µL NaHCO3 (1 M, pH 9.53) and 0.2 µL ZnCl2 (1 M) were added, and the volume was adjusted to 100 µL with nuclease-free water. The reaction was then incubated at 65 °C for 3 h. Reaction products were purified using Oligo Clean & Concentrator and eluted with 20 µL nuclease-free water. 200 ng of the sample was denatured at 95 °C for 15 s, immediately chilled on ice. After 2 min, 10 μL DEA Reaction Buffer, 1 μL BSA, and 2 μL APOBEC3A (DEA Enzyme Mix) were added, and the volume was adjusted to 100 µL with nuclease-free water. The reaction was then incubated at 37 °C for 20 h. Products were purified using VAHTS DNA Clean Beads and eluted with 20 µL nuclease-free water.
Experimental group (A3A only): 0.2 ng of spike-in DNA (dsDNA-4acC or dsDNA-C, obtained by extending T3 and T4, Table S1) and 199.8 ng of sonicated gDNA were mixed together. The sample was denatured at 95 °C for 15 s, immediately chilled on ice. After 2 min, 10 μL DEA Reaction Buffer, 1 μL BSA, and 2 μL APOBEC3A (DEA Enzyme Mix) were added, and the volume was adjusted to 100 µL with nuclease-free water. The reaction was then incubated at 37 °C for 20 h. Products were purified using VAHTS DNA Clean Beads and eluted with 20 µL nuclease-free water.
The subsequent library construction steps were performed as follows: Samples (20 µL) were incubated at 95 °C for 2 min (heated lid, 105 °C) and immediately chilled on ice for 2 min. A premixed solution of 10 µL 3′ Ligation Buffer, 5 µL 3′ Ligation Enzyme Mix, and 5 µL 3′ Adapter was added. After mixing and brief centrifugation, the reaction was performed at 37 °C for 15 min, followed by 95 °C for 2 min. After chilling on ice for 2 min, 5 µL Extension Primer and 35 µL Extension Enzyme Mix were added. The mixture was incubated at 98 °C for 1 min, 62 °C for 2 min, and 65 °C for 5 min. The products were purified using VAHTS DNA Purification Beads to obtain 20 µL of purified sample. Then, 15 µL 5′ Ligation Mix and 5 µL 5′ Adapter were added, and the reaction was performed at 25 °C for 15 min. The products were purified using VAHTS DNA Purification Beads to obtain 20 µL of purified sample. 1 µL purified product was used for qPCR. The remaining 19 µL was then combined with 5 µL PCR Primer Mix 3 for Illumina, 25 µL VAHTS HiFi Amplification Mix, and 1 µL nuclease-free water. PCR was performed with the heated lid at 105 °C as follows: 95 °C for 3 min; a specific number of cycles of 98 °C for 20 s, 60 °C for 15 s, and 72 °C for 30 s; and 72 °C for 5 min. The products were purified using VAHTS DNA Purification Beads and finally suspended in 20 μL of nuclease-free water to yield the sequencing library.
For E. coli gDNA, libraries were constructed separately without the addition of spike-in DNA.
Control group (NaHCO3 + A3A): 1 µg of gDNA was treated under the same conditions as the control group described above (NaHCO3 + A3A).
Experimental group (A3A only): 200 ng of the untreated gDNA was treated under the same conditions as the experimental group described above (A3A only).
2.10. 4acC-A3A-Seq Data Analysis
For spikein in gDNA data, the raw FASTQ reads were also preprocessed using fastp (v0.23.2) for adapter trimming [28]. Then the clean reads were then aligned to the genome with forward strand and reverse strand spikein sequences using bowtie2 (v2.5.4) [29]. The C to T conversion rates vcf files were extracted by samtools [30] mkpileup and varscan [31] pileup2cns form bam files.
For E. coli genome library data, the raw FASTQ reads for the E. coli genome library were also preprocessed using fastp (v0.23.2) for adapter trimming [28]. Then the tail added in adapter ligation steps was removed by cutadapt [32]. The clean reads were then aligned to the E. coli reference genome (from NCBI, GCF_000005845.2) using bismark (v0.24.2) [33]. The cytosine and 4acC base conversion rates were calculated using bismark_methylation_extractor command. High-confidence candidate 4acC sites were identified based on four stringent criteria: (1) Sequencing depth ≥ 50 in all samples, (2) An unconverted rate > 10% in the A3A treatment sample, and (3) An unconverted rate < 5% in the A3A and NaHCO3 treatment sample. (4) All the sites were required to pass the DML test in DSS [34], and the absolute difference in the unconverted rate between the A3A treatment sample and A3A and NaHCO3 treatment samples should be greater than 10%, and the posterior probability should be greater than 0.85.
The detailed process has been uploaded to github (https://github.com/whu-XiXin/4acC-A3A-seq (accessed on 25 October 2026)).
3. Results
3.1. Verification of 4acC Existence in E. coli gDNA
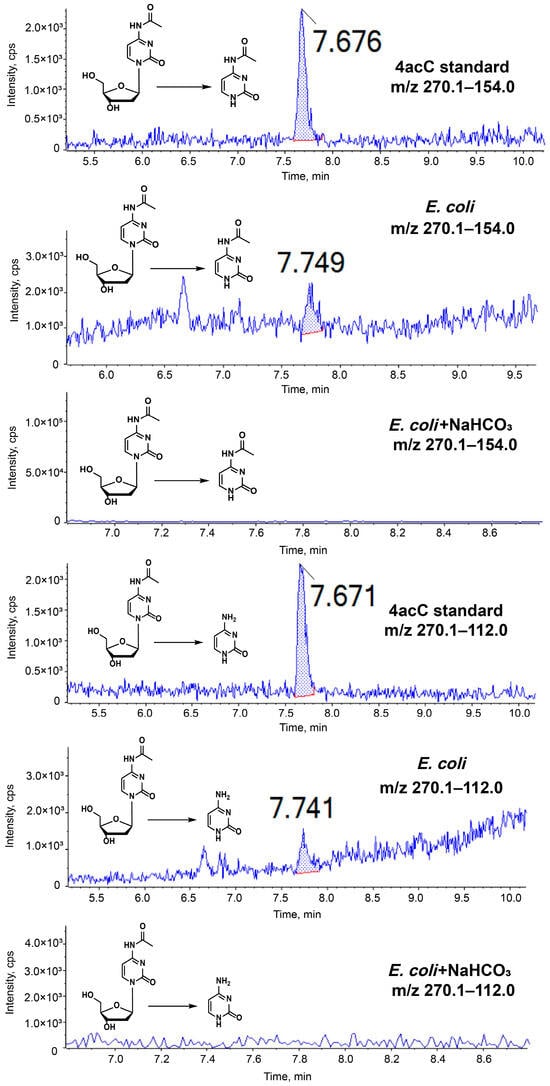
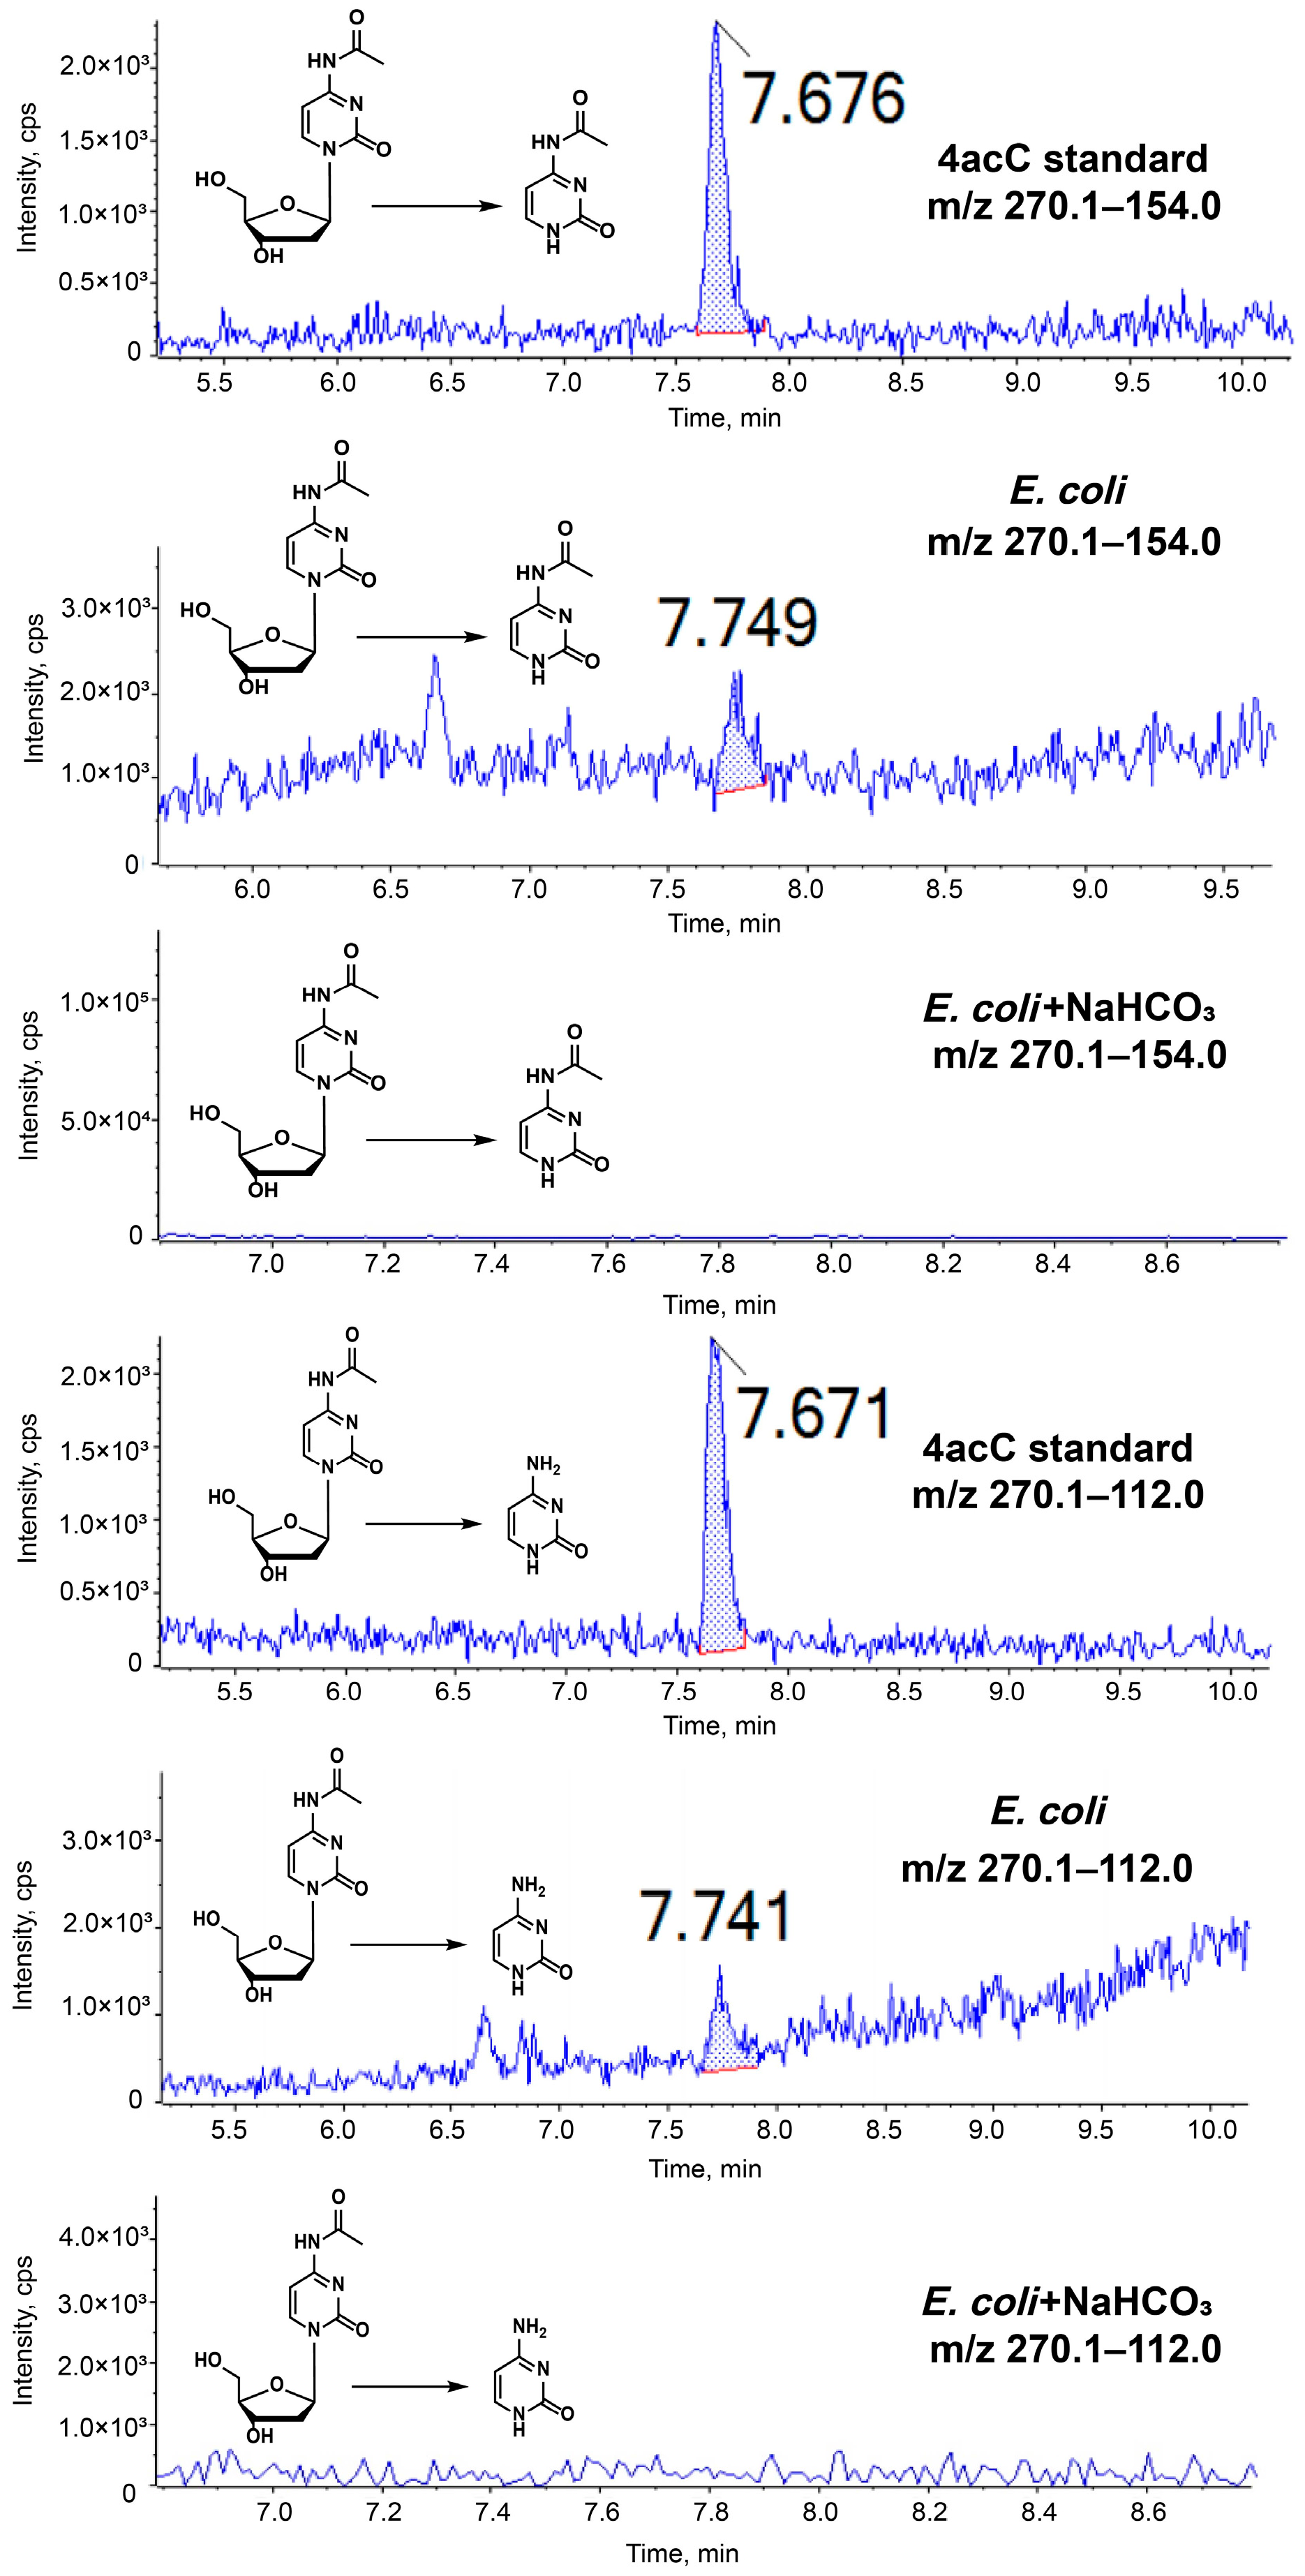
In this study, high-performance liquid chromatography-tandem mass spectrometry (HPLC-MS/MS) was employed to analyze the enzymatically digested gDNA of E. coli after the removal of RNA. As illustrated in Figure 2 and Figure S1 and Table 1, peaks corresponding to the 4acC standard were identified at a retention time of approximately 7.5–8.0 min. Crucially, the observed mass transitions of m/z 270.1 → 154.0 and m/z 270.1 → 112.0 represent the loss of the deoxyribose moiety and the combined loss of both the deoxyribose and acetyl groups, respectively. The presence of these characteristic fragments unequivocally confirmed the existence of 4acC in the E. coli genome. For ion-ratio confirmation, the quantifier ion was set as 270.1 → 112.0 and the qualifier ion as 270.1 → 154.0. When the ion ratio exceeded 0.5, a tolerance of less than 20% was applied between the sample and standard ion ratios. The standard ion ratio was 0.91, giving a permissible range of 0.73–1.09. The sample ion ratio was 0.97, which fell within this range, confirming that the ion ratio of the sample was consistent with that of the standard. Moreover, after NaHCO3 treatment, no characteristic peaks of 4acC were observed at the retention time of approximately 7.5–8.0 min, and the corresponding mass transitions of m/z 270.1 → 154.0 and m/z 270.1 → 112.0 were absent, indicating the complete removal or conversion of 4acC in the E. coli genome under this condition. Following this qualitative validation, we performed a quantitative analysis with a method detection limit (MDL) of 0.04 nM. Based on the standard curves for dC and 4acC (Figure S2), the 4acC/dC ratio in the E. coli gDNA sample was (0.20 nM/2056.61 nM) × 100% ≈ 0.01%. Based on the measured 4acC/dC ratio of 0.01% and an E. coli genome size of approximately 4.64 Mb with a GC content of 50.8%, the number of dC per genome was estimated to be approximately 1.2 × 10⁶, corresponding to approximately 120 4acC molecules per E. coli gDNA.
Figure 2.
HPLC-MS/MS analysis of the E. coli gDNA. MRM chromatograms of the 4acC standard, E. coli gDNA, and NaHCO3-treated E. coli gDNA, showing the qualifier (270.1 → 154.0) and quantifier (270.1 → 112.0) transitions. The RT deviation between sample and standard peaks was within ±2.0%, confirming the presence of 4acC.
Table 1.
HPLC-MS/MS peak intensities.
3.2. Validation of 4acC-A3A-Seq by Sanger Sequencing and Clonal Sequencing
The acetyl group of 4acC renders the base susceptible to nucleophilic attack, resulting in hydrolysis-mediated deacetylation and conversion of 4acC to unmodified C. Consequently, to maintain the chemical integrity of the 4acC modification during the enzymatic synthesis of template strands, it is imperative to optimize key reaction parameters—including pH, temperature, and incubation duration—to minimize unintended deacetylation.
Following preliminary screening, three DNA polymerases—Deep Vent (exo-) DNA polymerase, Dream Taq DNA polymerase, and Taq DNA polymerase—were evaluated for extension assays. Reaction mixtures were prepared according to the manufacturer-recommended concentrations for each polymerase, and the extension protocol consisted of denaturation at 95 °C for 15 s followed by extension at 55 °C for 10 min. Given the molecular weight detection limitations of mass spectrometry, an 18-mer oligonucleotide containing a single 4acC site (obtained by extending 18-T and 18-P, Table S1) was designed and synthesized for MS validation. In this system, 18-T served as the template strand (calculated mass 5580.68 Da), ssDNA-4acC represented the synthesized target strand containing the 4acC modification (calculated mass 5462.58 Da, complementary to the template), and ssDNA-C (calculated mass 5420.58 Da) was the deacetylated product of ssDNA-4acC. The mass difference between ssDNA-4acC (calculated mass 5462.58 Da) and ssDNA-C (calculated mass 5420.58 Da) is 42 Da, corresponding to the loss of an acetyl group, confirming the deacetylation of 4acC. As shown in Figure S3 and Table S2, Deep Vent (exo-) DNA polymerase exhibited the best performance, successfully synthesizing the 4acC-containing strand without detectable deacetylation. In contrast, although DreamTaq and Taq DNA polymerases also produced the 4acC-containing strand, the yields were extremely low, and the majority of the products were deacetylated to C. Therefore, Deep Vent (exo-) DNA polymerase was selected for subsequent experiments.
Subsequently, the extension time for Deep Vent (exo-) DNA polymerase was optimized. Extension times of 30 min, 1 h, and 2 h were tested and verified by mass spectrometry. As shown in Figure S4 and Table S2, only 18-T and ssDNA-4acC were detected under all three conditions, with no ssDNA-C observed, indicating the absence of deacetylation. Product yield was not strongly correlated with extension time; in fact, a 10 min extension yielded higher productivity. Accordingly, 10 min was adopted as the extension time for subsequent experiments.
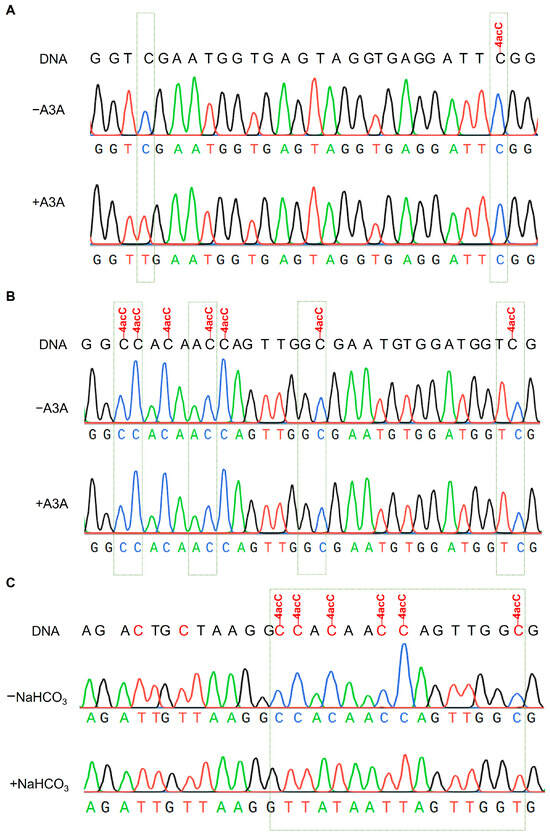
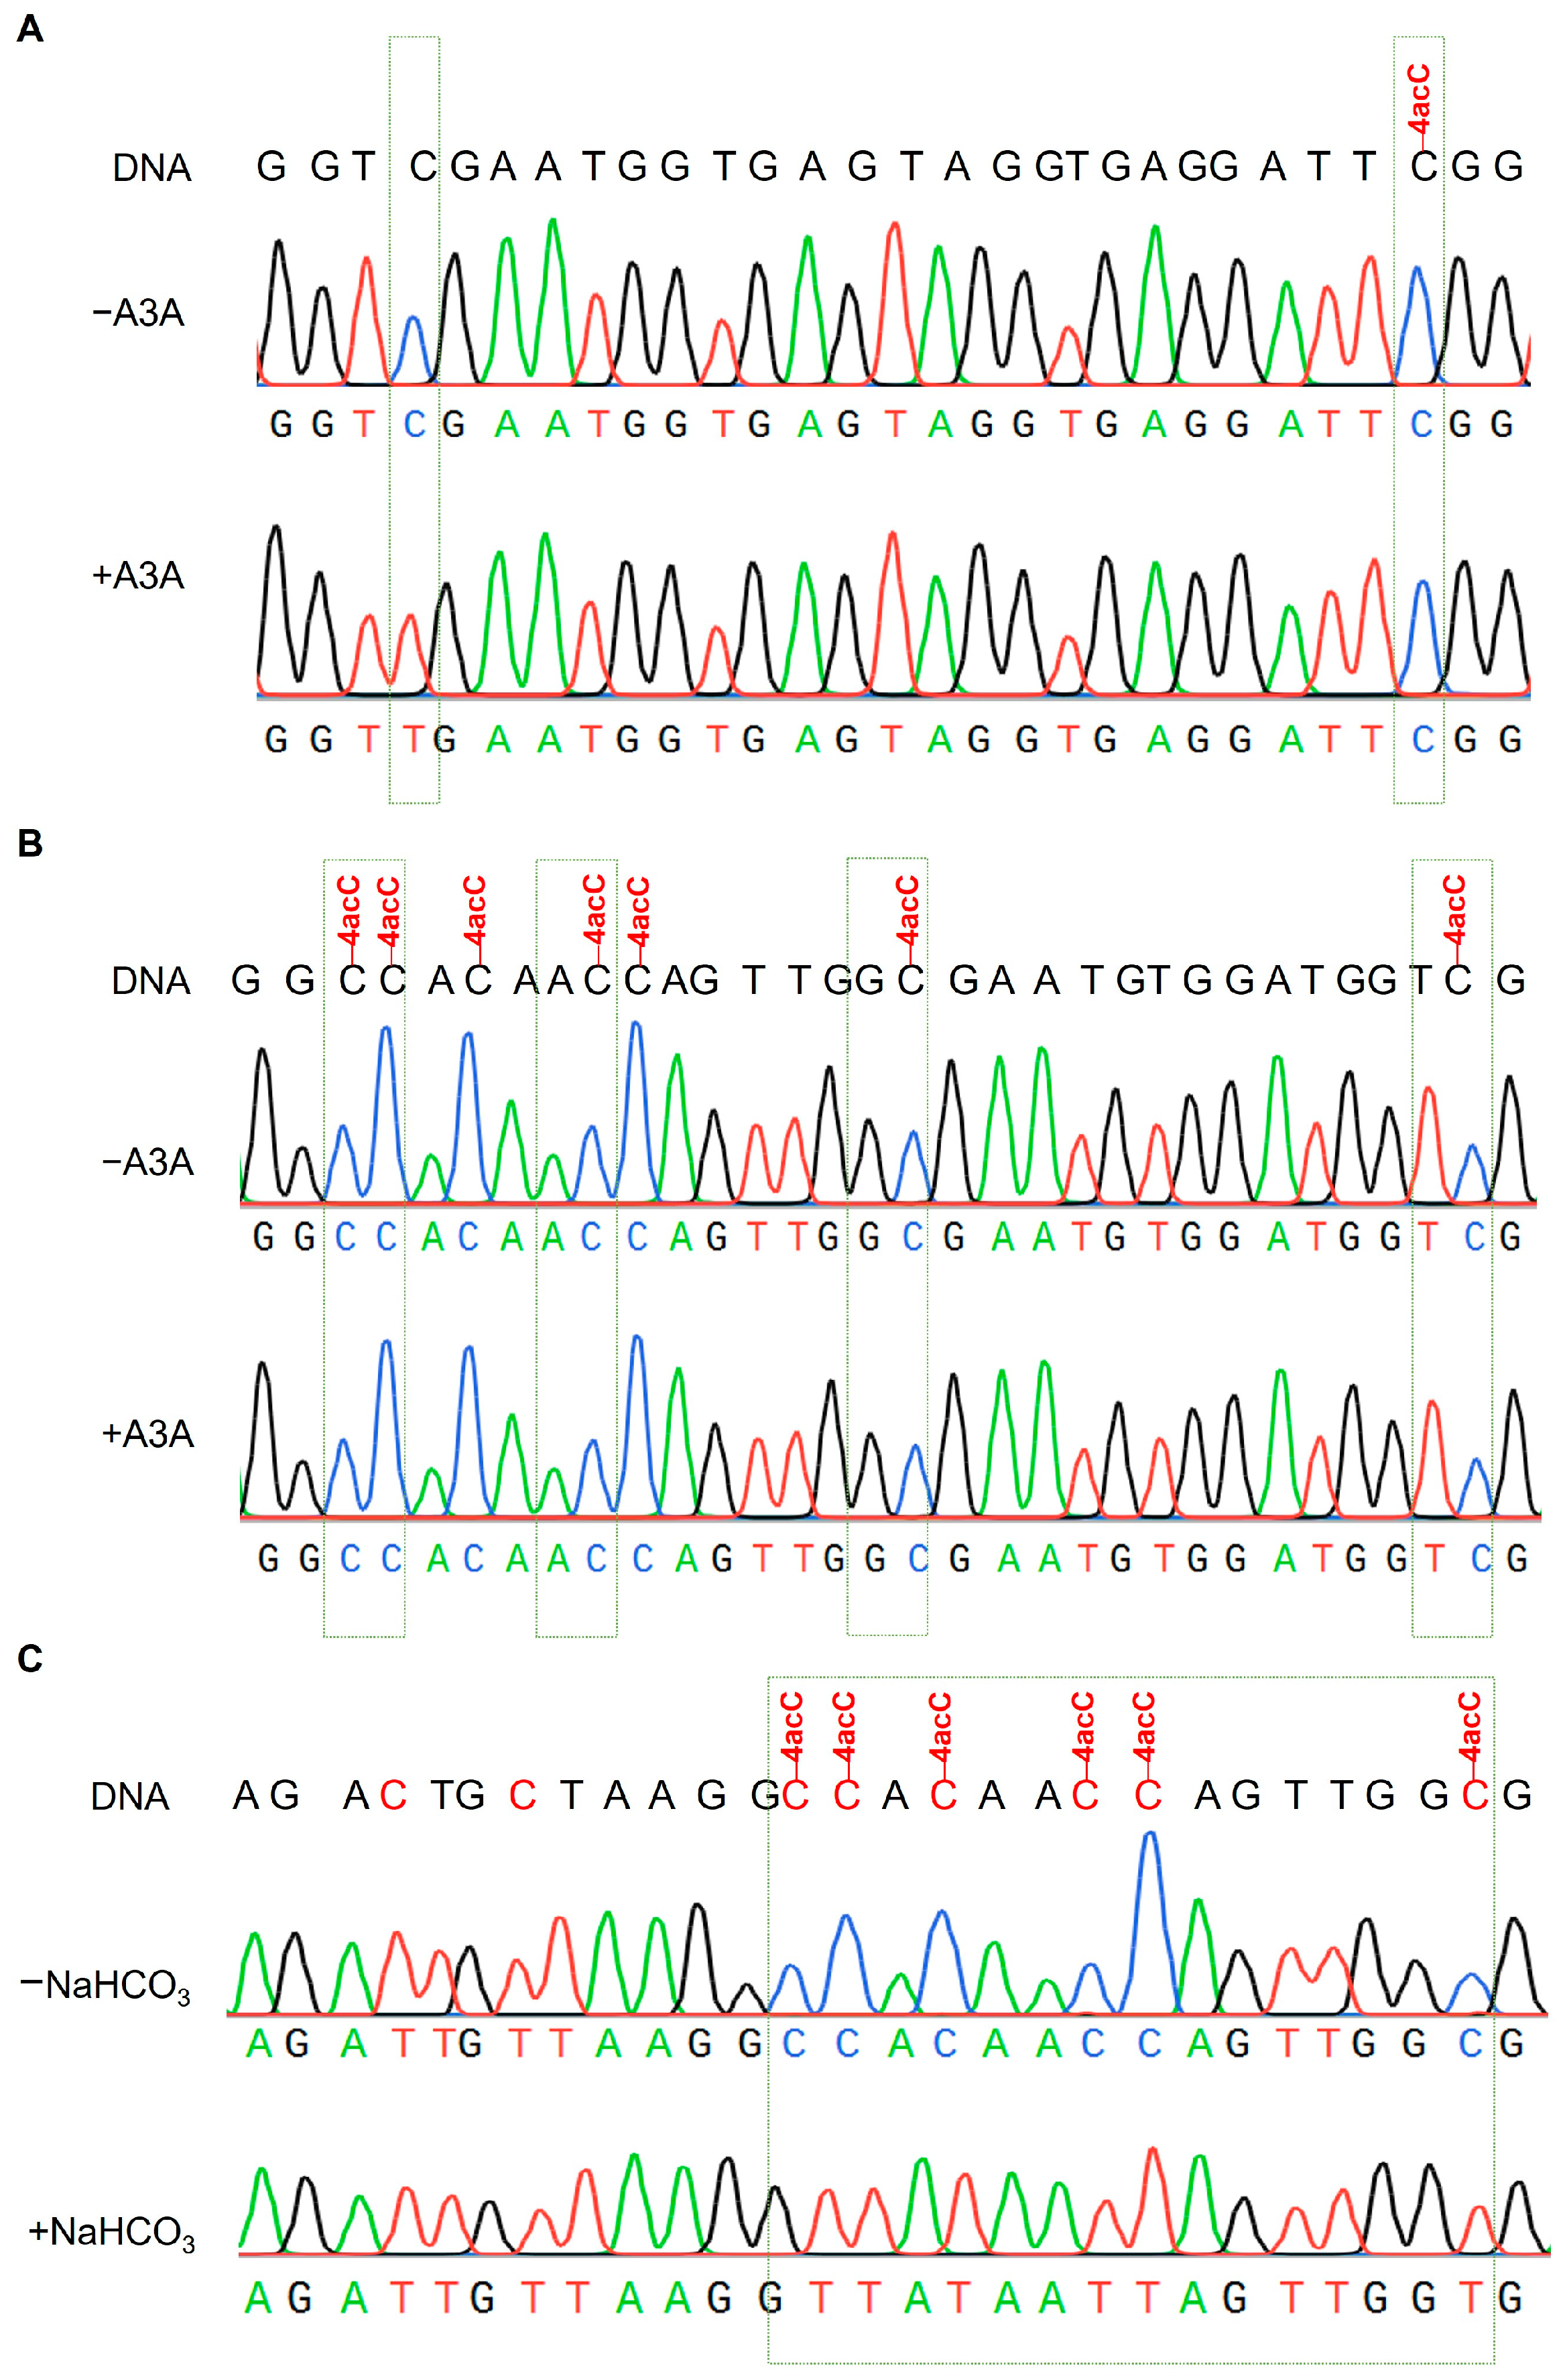
To validate the feasibility of the 4acC-A3A-seq method, a 160 bp double-stranded DNA containing a single 4acC site (generated by extension with T1 and T2, Table S1) was designed and synthesized. Following A3A treatment and PCR amplification, the product was subjected to Sanger sequencing to assess whether 4acC underwent deamination. As shown in Figure 3A, after A3A treatment, all unmodified cytosines were fully deaminated and read as “T”, whereas the 4acC site remained unchanged and was read as “C”. These results confirm the feasibility of the A3A-mediated deamination approach.
Figure 3.
Single-base resolution analysis of 4acC in DNA by Sanger sequencing. Peak colors: black = G, green = A, red = T, blue = C. (A) A3A treatment converted “C” to “T”, while 4acC sites remained read as “C”. (B) 4acC sites remained read as “C” in four sequence contexts (TC, CC, GC, AC) with A3A treatment. (C) NaHCO3 treatment removed the acetyl group, resulting in 4acC being read as “C” after subsequent A3A treatment.
Previous studies have demonstrated that the 5′ adjacent base substantially influences the deamination activity of A3A toward C [8,35,36]. To investigate the sequence preference of A3A deaminase, we designed multiple DNA substrates containing 4acC sites in distinct sequence contexts, including TC, CC, GC, and AC motifs (generated by extension with T3 and T4, Table S1). As shown in Figure 3B, A3A did not exhibit appreciable deamination activity toward 4acC in any of the tested dinucleotide sequence contexts.
To accurately distinguish 4acC-specific signals from non-specific background, a key control experiment was designed. Specifically, 4acC-modified DNA was subjected to deacetylation to convert it to unmodified C, after which we assessed whether A3A could recognize and deaminate the resulting C, leading to a corresponding change in sequencing signals. Several alkaline reagents—including NH2OH, NaOH, NaHCO3, and Na2CO3—were tested for deacetylation efficiency. Among these, NaHCO3 exhibited the highest efficiency and was therefore selected for subsequent control experiments involving pretreatment of 4acC-containing DNA templates.
As illustrated in Figure 3C, templates pretreated with NaHCO3 followed by A3A treatment exhibited a clear “C → T” conversion at the original 4acC site. In contrast, the control group without NaHCO3 pretreatment retained a “C” at this position, with no signal alteration. These results validated the feasibility of NaHCO3-mediated chemical deacetylation.
Finally, deamination was systematically evaluated over a time gradient (0.5–3 h). As shown in Figure S5, the deamination efficiency of A3A remained largely consistent within the range of 0.5 h to 2 h. However, upon extending the reaction to 3 h, partial deacylation of 4acC was observed. Therefore, 0.5 h was selected as the optimal deamination time for subsequent experiments.
Collectively, these results demonstrated that the 4acC-A3A-seq exhibited excellent performance in terms of specificity, sequence compatibility, condition controllability, and result reliability, establishing it as an effective technical approach for single-base-resolution detection of 4acC.
3.3. Detection of 4acC in E. coli gDNA by 4acC-A3A-Seq
The precision of 4acC-A3A-seq hinges on the unique substrate selectivity of A3A, which efficiently deaminates unmodified C to U on single-stranded DNA (ssDNA) while remaining notably inactive toward 4acC. This differential activity subsequently generates distinguishable C/T signals during sequencing, enabling single-base-resolution mapping.
When applying 4acC-A3A-seq to E. coli gDNA, we found that the deamination efficiency of A3A toward unmodified C in gDNA was markedly lower than that toward synthetic DNA fragments: after 3 h of incubation, the C → T deamination rate of unmodified C in gDNA was only about 69%, which was insufficient to generate a clear C/T signal difference. To improve the deamination rate, we extended the A3A incubation time for gDNA to 20 h, thereby achieving detectable C → T conversion. However, prolonged incubation also led to partial deamination of 4acC, resulting in partial loss of the 4acC signal. To address this, we introduced dsDNA-4acC and dsDNA-C (obtained by extending T3 and T4, Table S1) with known sequences as spike-in controls. These spike-in controls were integrated into fragmented gDNA and subsequently processed for library preparation and high-throughput sequencing following the standard 4acC-A3A-seq protocol. By separately quantifying the C → T conversion rate at C sites and the 4acC → T conversion rate at 4acC sites in the spike-in controls, we could objectively assess the actual deamination efficiency of A3A toward unmodified C and 4acC in each experiment, thereby determining whether the data from that experiment were reliable.
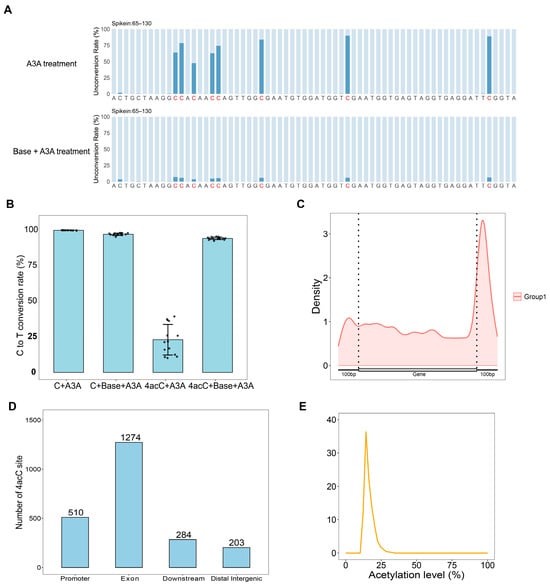
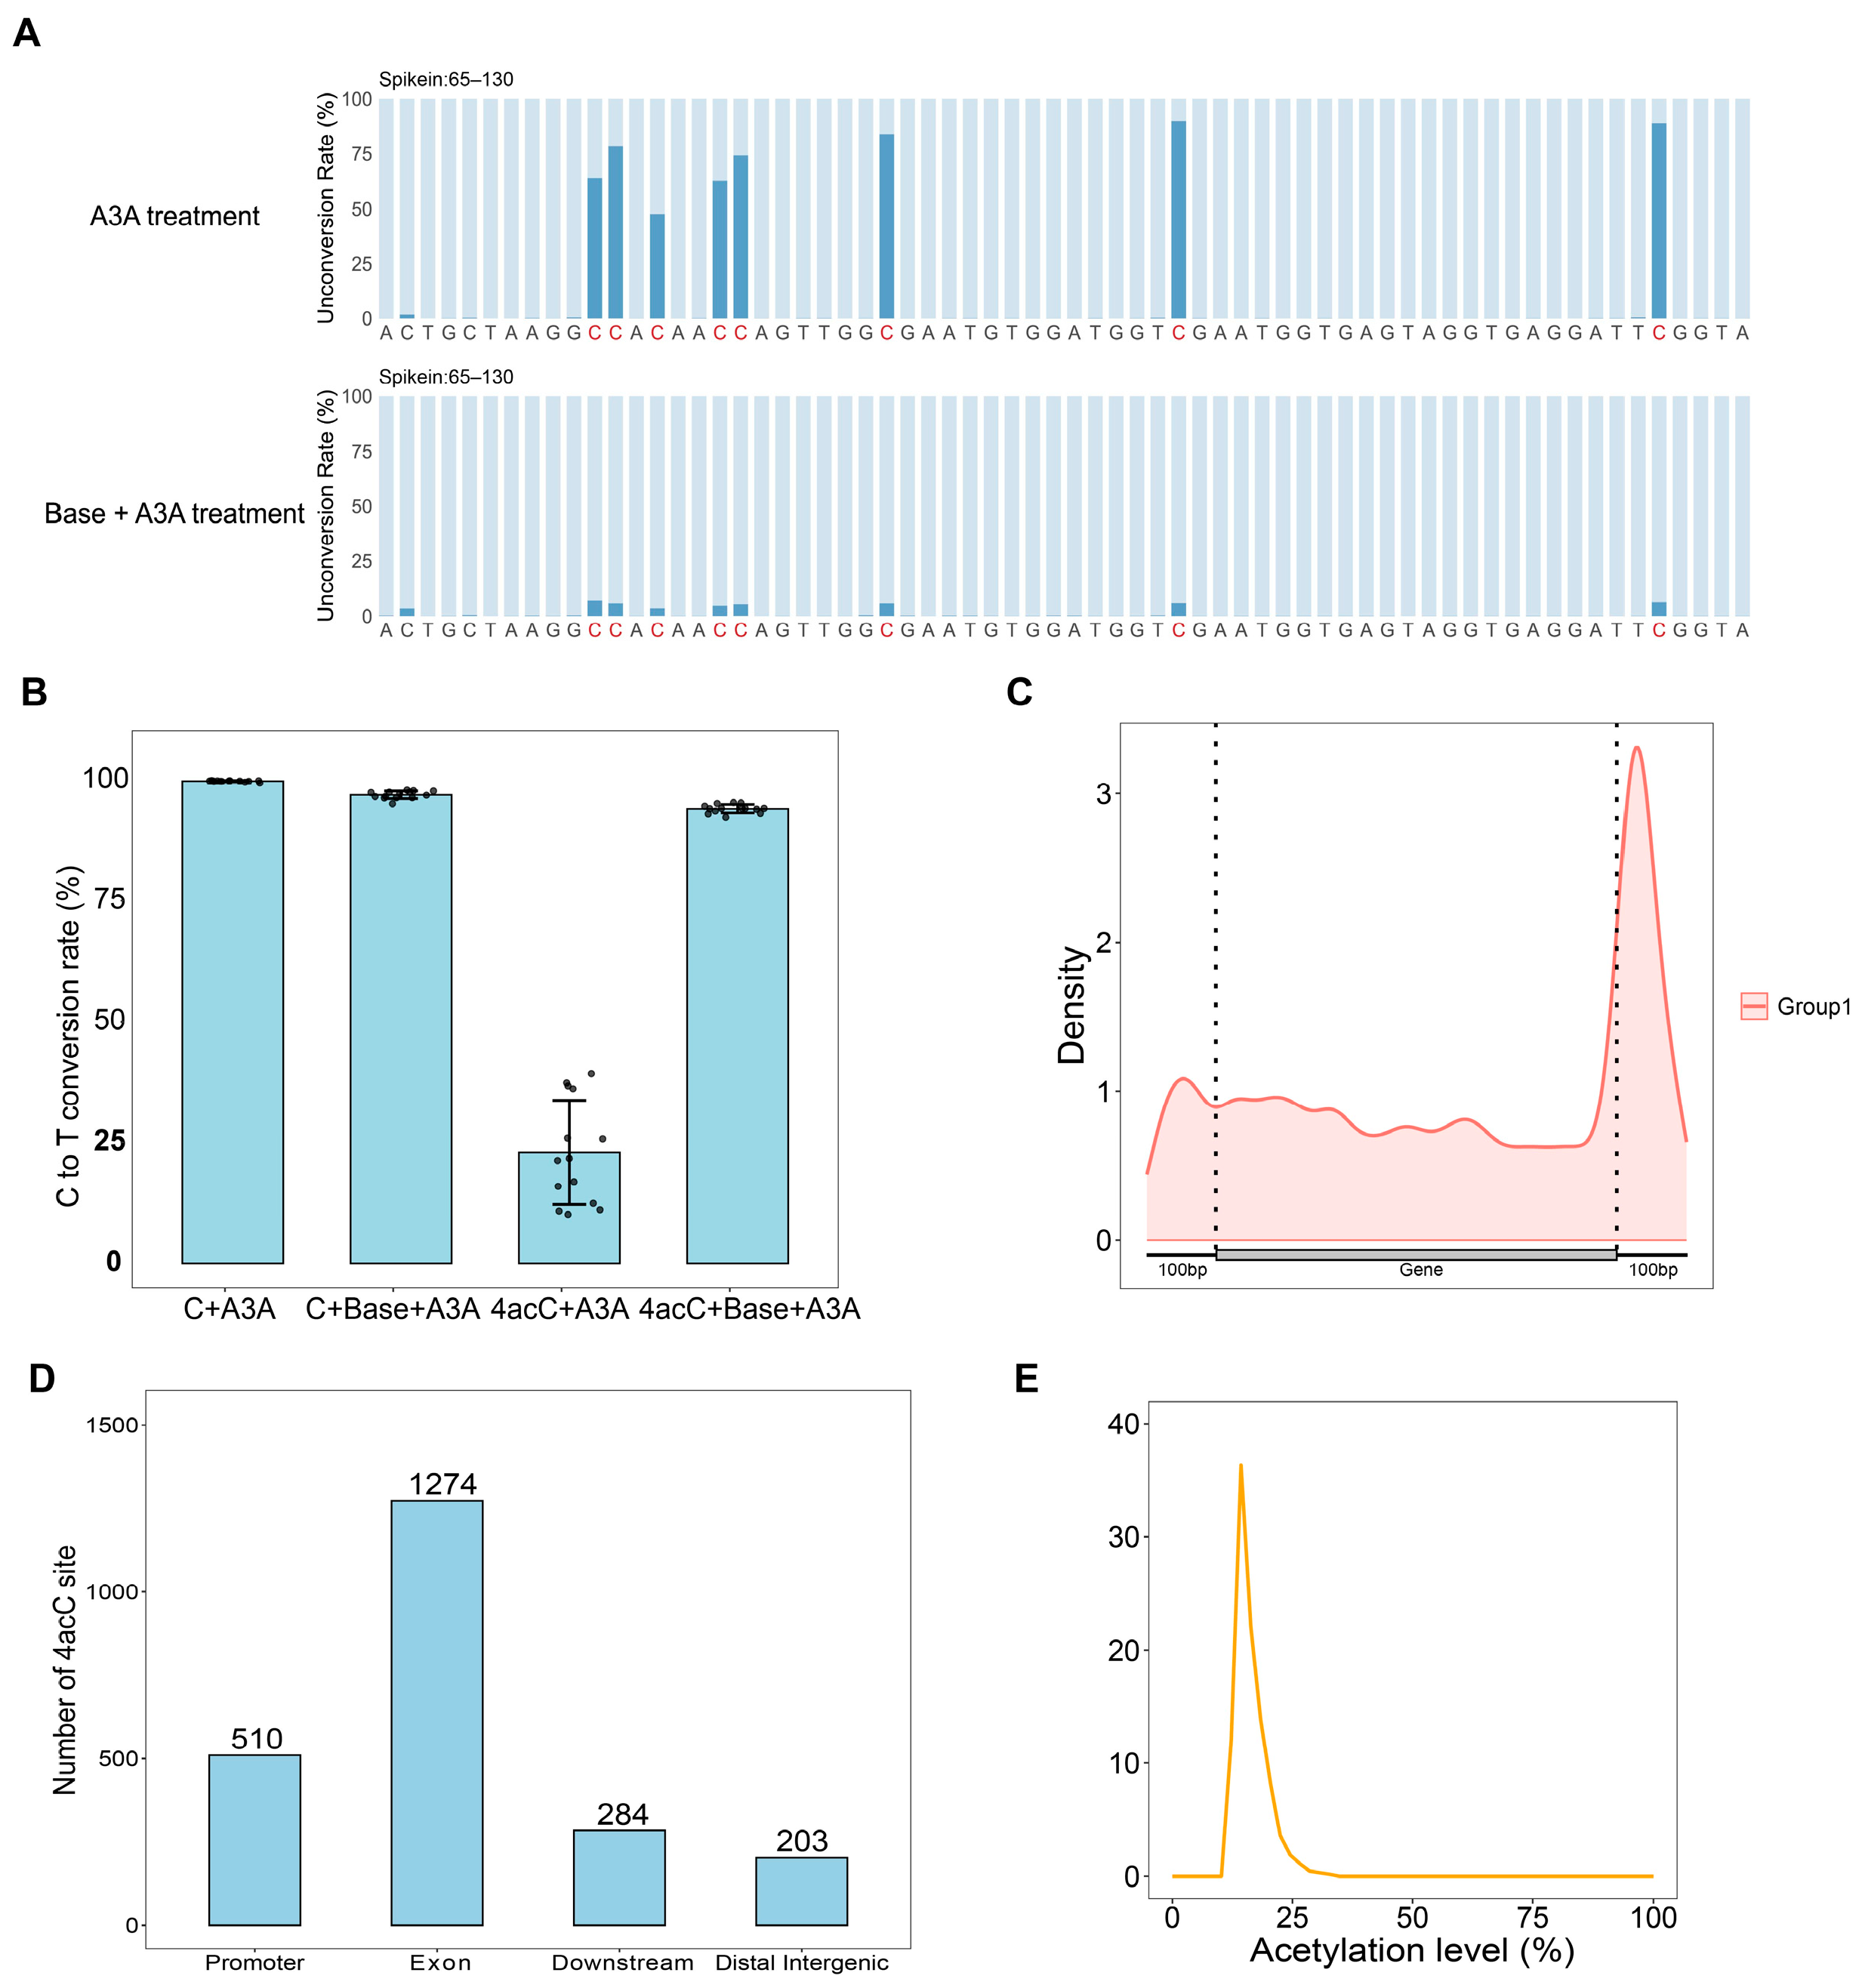
As shown in Figure 4A,B, the C-to-T conversion rate for unmodified C in dsDNA-C was 99.8% following A3A treatment alone, and 97% after sequential treatment with NaHCO3 and A3A. For 4acC in dsDNA-4acC, the conversion rate was approximately 23% after A3A treatment alone, which increased to approximately 94% after sequential NaHCO3 and A3A treatment. These results confirm that NaHCO3 effectively restores the deamination susceptibility of 4acC, validating the specificity of our dual-treatment strategy.
Figure 4.
Single-base resolution mapping of 4acC in E. coli gDNA by 4acC-A3A-seq. (A) “C-to-T” non-conversion rates at the 4acC site in dsDNA-4acC from sequencing data. (B) “C to T” conversion rates at 4acC/C sites from sequencing data. (C) Distribution of 4acC across gene bodies and 100 bp upstream/downstream regions. (D) Distribution of 4acC across genomic elements. (E) Acetylation rate of 4acC sites.
2271 high-confidence candidate 4acC sites were identified by analyzing the two technical replicate groups across the E. coli gDNA (Figure S6). The distribution of these sites across genetic elements was subsequently analyzed. As shown in Figure 4C,D, in E. coli 4acC sites were predominantly located within genic regions. Notably, the density of 4acC sites was higher at the gene start and termination sites, especially in the 100 bp downstream region of genes. Which exhibiting a saddle-shaped distribution pattern. This spatial enrichment suggests that 4acC modification might play a functional role in the regulation of gene expression.
Further analysis of acetylation stoichiometry (Figure 4E) revealed a measured acetylation rate of approximately 20% at the identified sites. However, based on the results from the control template (dsDNA-4acC), direct A3A treatment of gDNA induced approximately 23% C-to-T conversion at 4acC sites. Considering this conversion rate, the actual acetylation rate of 4acC modifications in the genome was estimated to be approximately 25%.
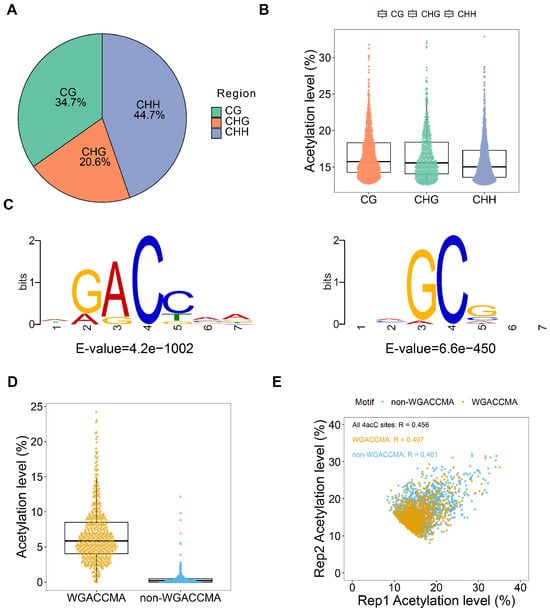
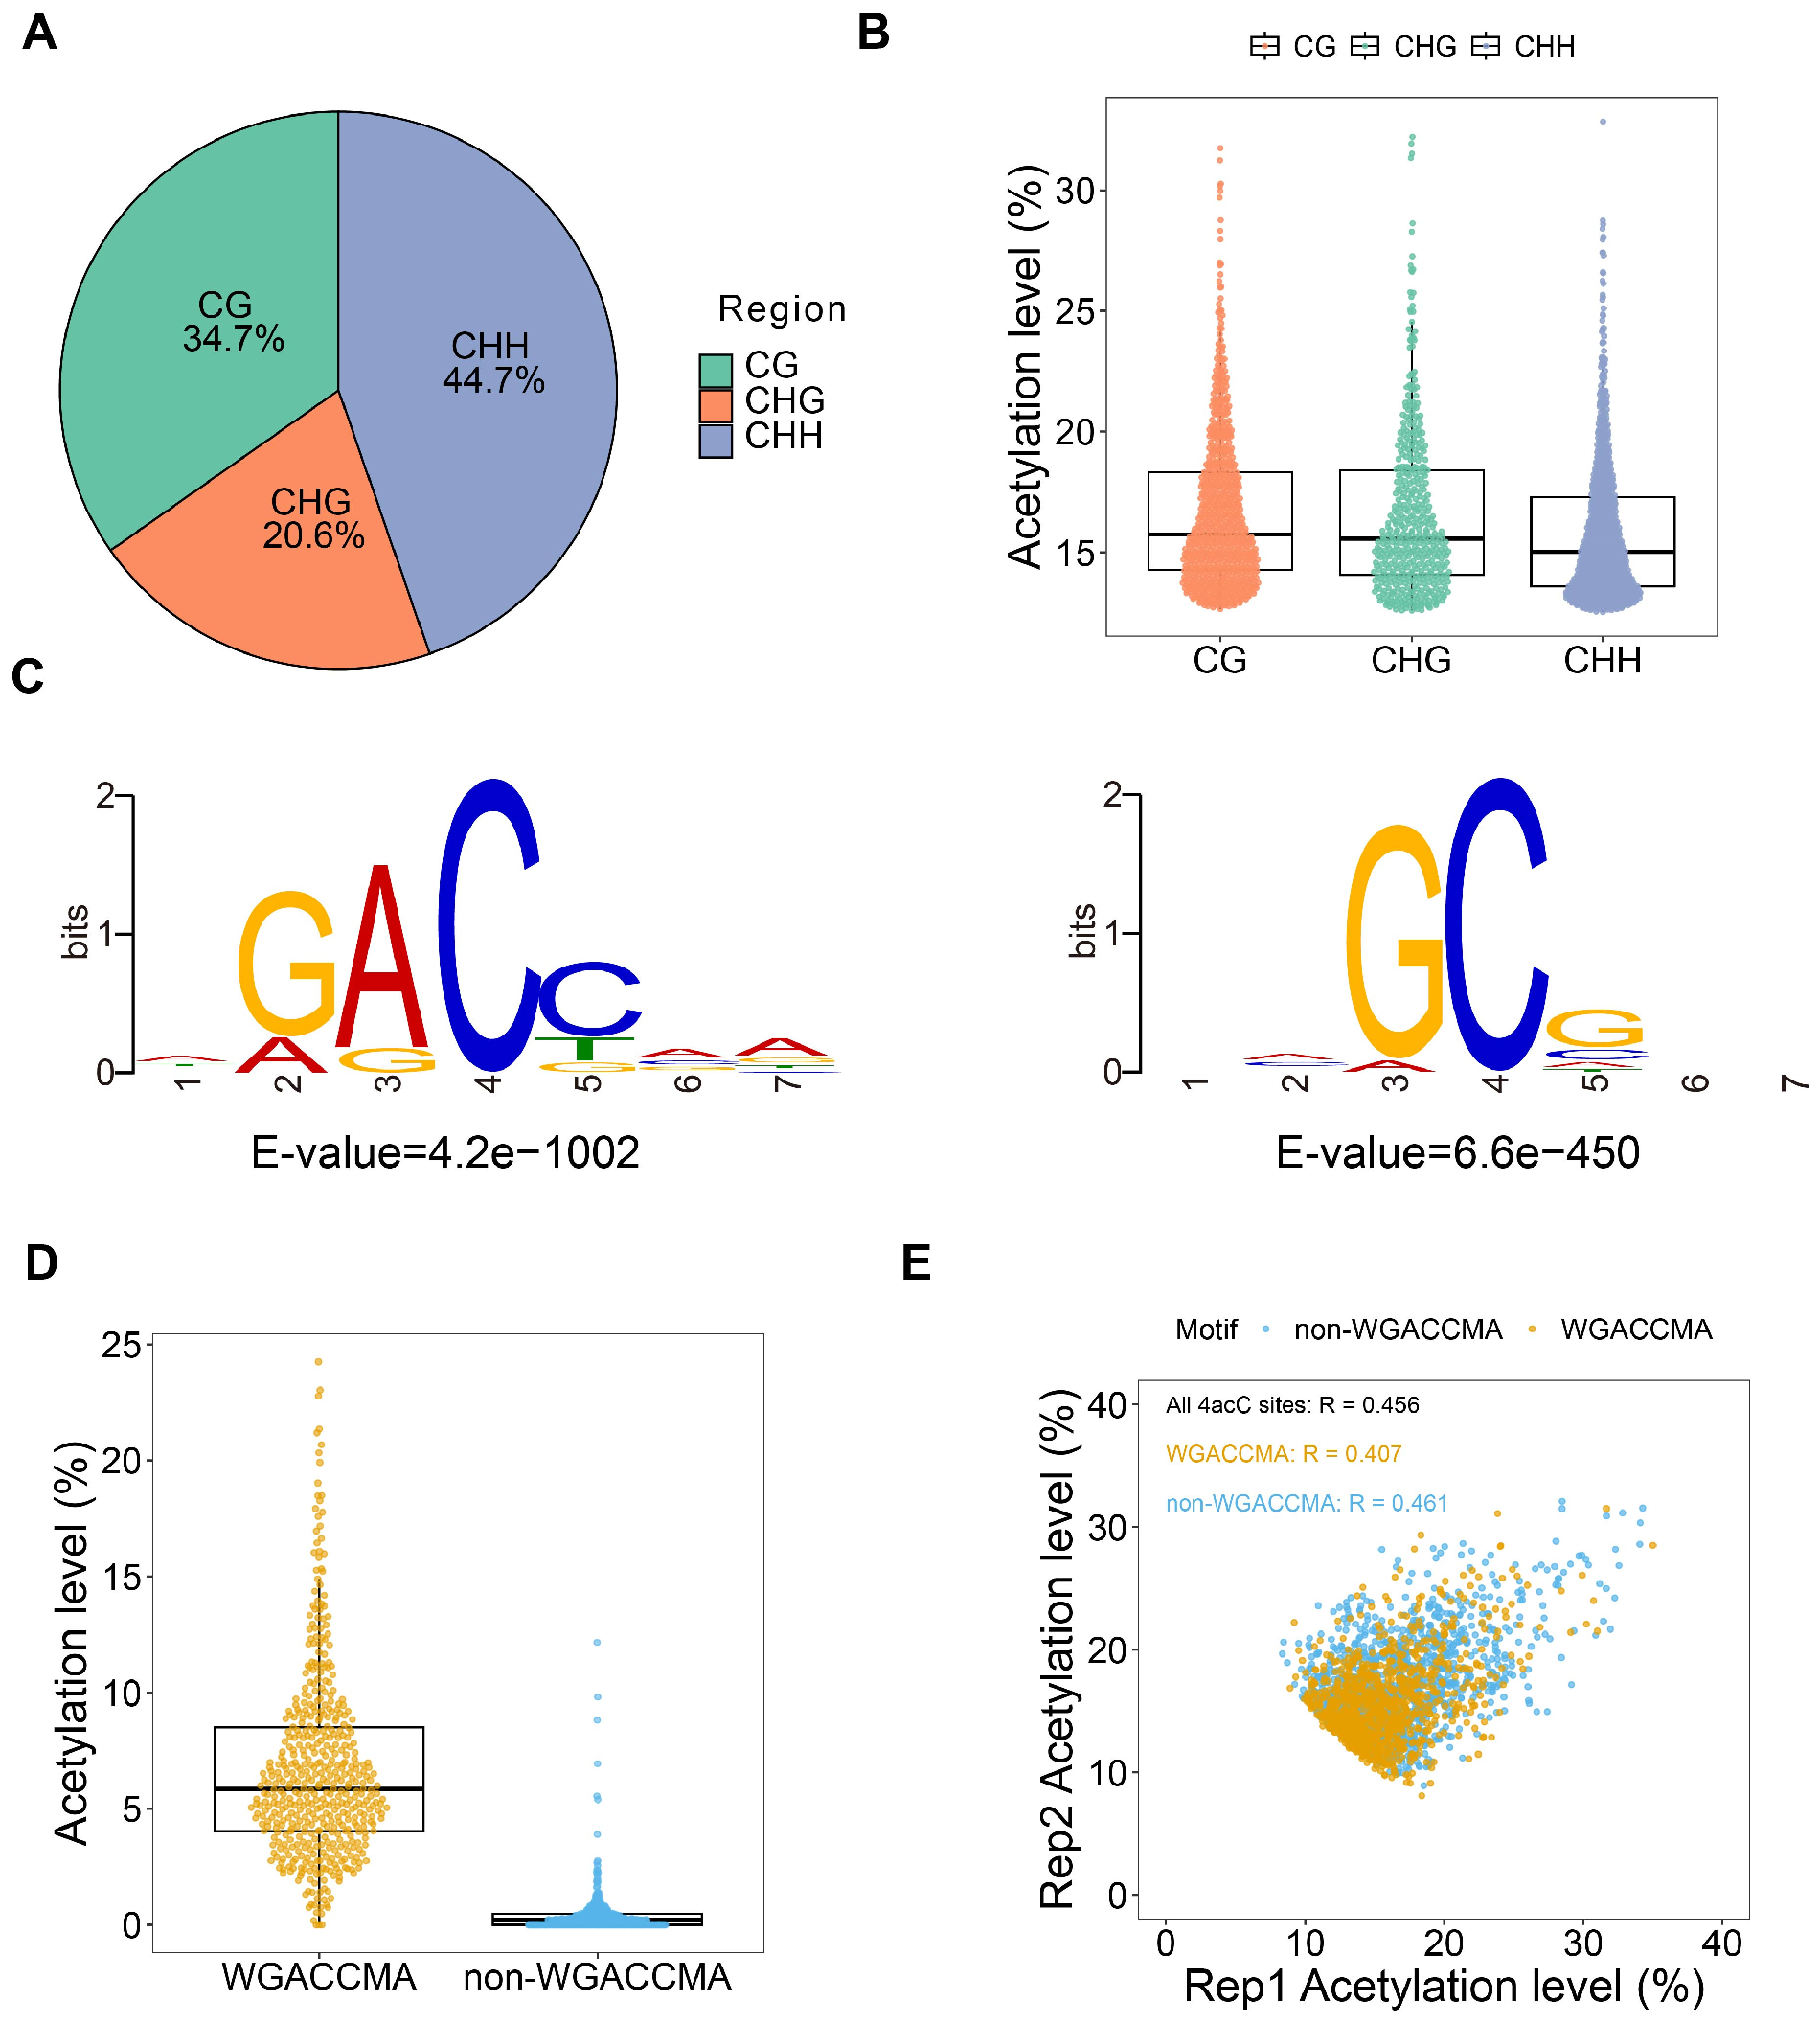
To investigate the sequence preference of 4acC sites, we performed a comprehensive statistical analysis of its local sequence contexts. As shown in Figure 5A, 4acC modifications in E. coli were primarily enriched within CHH contexts, a distribution pattern that diverges significantly from DNA 5mC methylation, which is predominantly found in CG contexts. This disparity suggested that 4acC and DNA methylation might exhibit distinct genomic distribution patterns and potentially fulfill different biological functions. Subsequently, we constructed box plots to illustrate the distribution of measured acetylation rates within CG, CHG, and CHH contexts (Figure 5B). The results revealed no substantial differences in acetylation rate distributions across the three sequence contexts, although the average acetylation rates for CG and CHG were slightly higher than that for CHH.
Figure 5.
Distribution of 4acC in E. coli gDNA. (A) Pie chart showing the distribution of 4acC. (B) Box plot showing the distribution of 4acC. (C) Motif information of 4acC sites. (D) Acetylation levels in WGACCMA versus non-WGACCMA motifs. (E) Distribution of acetylation rates between the two parallel groups of the 2271 4acC sites: those belonging to the WGACCMA motif and those not belonging to the WGACCMA motif. (All 4acC sites Person coefficient = 0.456).
To further explore the distribution pattern of 4acC in E. coli gDNA, motif enrichment analysis was performed on the 2271 high-confidence candidate 4acC sites. As shown in Figure 5C, this analysis yielded two high-confidence sequence motifs: WGACCMA and NMGCGNN. Focusing on WGACCMA, the most prevalent motif identified, we observed that the measured acetylation levels at these motifs were significantly higher than those at non-WGACCMA sequences (Figure 5D), suggesting a potential biological association between the WGACCMA motif and 4acC modification. Interestingly, a comparison of acetylation rates for 4acC sites within versus outside the WGACCMA motif (Figure 5E) showed comparable levels. Collectively, these findings indicated that while 4acC modifications exhibited a preference for the WGACCMA motif, the acetylation levels did not differ substantially between distinct sequence contexts, revealing no obvious sequence-dependent quantitative pattern.
4. Conclusions
To establish a single-base-resolution detection method, we synthesized DNA template strands containing specific 4acC sites and verified the stable presence of the modified base in the synthesized strands using mass spectrometry. Building on this foundation, we innovatively developed the 4acC-A3A-seq detection system based on the APOBEC3A deaminase reaction. This method enabled the conversion of 4acC sites into detectable sequence variations through in vitro enzymatic conversion coupled with sequencing analysis.
To validate the feasibility of this approach, we first applied 4acC-A3A-seq to template strands and successfully achieved single-base-resolution identification of known 4acC sites via Sanger sequencing. Subsequently, we further optimized the reaction conditions and ultimately applied this technique to E. coli gDNA. Through high-throughput sequencing and data analysis, we successfully generated the first single-base-resolution genome-wide map of 4acC in a prokaryotic organism.
In summary, the work presented in this paper not only confirmed the presence and low-abundance characteristics of 4acC in prokaryotic genomes, but more importantly, established and validated a methodological framework capable of detecting this modification at single-base resolution across the entire genome. These findings laid the foundation for subsequent in-depth investigations into the distribution patterns, evolutionary significance, and biological functions of 4acC in prokaryotic genomes. The 2271 sites identified in this study are therefore reported as high-confidence candidate 4acC sites rather than definitively confirmed sites.
Although this method has achieved single-base sequencing of 4acC throughout the genome of E. coli, it still has certain limitations: (1) During the A3A treatment process, some 4acC will undergo conversion from C to T (Through the analysis of spikein data, it can be seen that the conversion rate of this part is around 25%). This causes the measured 4acC acetylation modification level to be lower. For 4acC modifications with relatively low abundance, this may result in a decrease in the signal overlap between parallel groups. Therefore, the number of detected sites may be less than the actual sites. (2) This method requires a high sequencing depth at the site to ensure the generation of differences in the C to T signals of 4acC sites under different treatment methods. That makes this method difficult to apply to higher organisms with larger genomes (such as humans, mice, etc.). Therefore, future improvement methods can focus on developing better deamination methods or reducing the sequencing depth requirement by enriching the signal.
Supplementary Materials
The following supporting information can be downloaded at: https://www.mdpi.com/article/10.3390/biom16111570/s1, Figure S1. Representative MRM chromatograms of dC (228.1 → 112.0) in the dC standard, E. coli gDNA, and E. coli gDNA + NaHCO3 samples; Figure S2. Standard curve. (A) Linearity of dC standard curve. (B) Linearity of 4acC standard curve; Figure S3. Mass spectrometry results obtained from reaction systems using different DNA polymerases. (A) Deep Vent (exo-) DNA polymerase; (B) Dream Taq DNA polymerase; (C) Taq DNA polymerase; Figure S4. MS analysis obtained at different extension times. (A) 30 min. (B) 1 h. (C) 2 h; Figure S5. Sanger sequencing at different time points; Figure S6. Overlap of 4acC sites between Rep1 and Rep2; Table S1. The sequences of DNA oligonucleotide for dsDNA-4acC Synthesis; Table S2. Comparison of calculated and experimentally determined masses of 18-T, ssDNA-4acC, and ssDNA-C in Figures S3 and S4. Deviation = Neutral mass after +H − Calculated neutral mass; Mass error (%) = Deviation/Calculated neutral mass × 100%.
Author Contributions
Y.D. conceptualized the project. Y.L. and X.X. wrote the manuscript. Y.L. performed wet lab experiments. X.X. performed bioinformatics analyses. X.W. and X.Z. supervised the study, provided resources, and acquired funding. All authors have read and agreed to the published version of the manuscript.
Funding
This research was funded by the National Natural Science Foundation of China (22277091).
Institutional Review Board Statement
Not applicable.
Informed Consent Statement
Not applicable.
Data Availability Statement
The raw sequencing data generated in this study have been deposited in the NCBI Gene Expression Omnibus (GEO) database and are accessible through GEO Series accession number GSE349517 and GSE329892. Other data and materials are available from the authors upon reasonable request.
Conflicts of Interest
The authors declare no conflicts of interest.
Abbreviations
The following abbreviations are used in this manuscript:
| 4acC | N4-acetylcytosine |
| A3A | APOBEC3A |
| C | cytosine |
| 4acC-A3A-seq | 4acC-APOBEC3A-sequencing |
| E. coli | Escherichia coli |
| 5mC | 5-methylcytosine |
| 5hmC | 5-hydroxymethylcytosine |
| 5fC | 5-formylcytosine |
| 4mC | N4-methylcytosine |
| gDNA | genomic DNA |
| HPLC-MS/MS | high-performance liquid chromatography–tandem mass spectrometry |
| U | uracil |
References
- Smith, Z.D.; Meissner, A. DNA Methylation: Roles in Mammalian Development. Nat. Rev. Genet. 2013, 14, 204–220. [Google Scholar] [CrossRef] [Scilit] [PubMed]
- Beck, S.; Rakyan, V.K. The Methylome: Approaches for Global DNA Methylation Profiling. Trends Genet. 2008, 24, 231–237. [Google Scholar] [CrossRef] [Scilit] [PubMed]
- Sood, A.J.; Viner, C.; Hoffman, M.M. DNAmod: The DNA Modification Database. J. Cheminform. 2019, 11, 30. [Google Scholar] [CrossRef] [Scilit] [PubMed]
- Ito, S.; Shen, L.; Dai, Q.; Wu, S.C.; Collins, L.B.; Swenberg, J.A.; He, C.; Zhang, Y. Tet Proteins Can Convert 5-Methylcytosine to 5-Formylcytosine and 5-Carboxylcytosine. Science 2011, 333, 1300–1303. [Google Scholar] [CrossRef] [Scilit] [PubMed]
- Schübeler, D. Function and Information Content of DNA Methylation. Nature 2015, 517, 321–326. [Google Scholar] [CrossRef] [Scilit] [PubMed]
- Luo, C.; Hajkova, P.; Ecker, J.R. Dynamic DNA Methylation: In the Right Place at the Right Time. Science 2018, 361, 1336–1340. [Google Scholar] [CrossRef] [Scilit] [PubMed]
- Kriaucionis, S.; Heintz, N. The Nuclear DNA Base 5-Hydroxymethylcytosine Is Present in Purkinje Neurons and the Brain. Science 2009, 324, 929–930. [Google Scholar] [CrossRef] [Scilit] [PubMed]
- Guo, X.; Wu, J.; Ji, T.T.; Wang, M.; Zhang, S.; Xiong, J.; Gang, F.Y.; Liu, W.; Gu, Y.H.; Liu, Y.; et al. Orthologous Mammalian A3A-Mediated Single-Nucleotide Resolution Sequencing of DNA Epigenetic Modification 5-Hydroxymethylcytosine. Chem. Sci. 2025, 16, 3953–3963. [Google Scholar] [CrossRef] [Scilit] [PubMed]
- Parasyraki, E.; Mallick, M.; Hatch, V.; Vastolo, V.; Musheev, M.U.; Karaulanov, E.; Gopanenko, A.; Moxon, S.; Méndez-Lago, M.; Han, D.; et al. 5-Formylcytosine is an activating epigenetic mark for RNA Pol III during zygotic reprogramming. Cell 2024, 187, 6088–6103. [Google Scholar] [CrossRef] [Scilit] [PubMed]
- Goll, M.G.; Bestor, T.H. Eukaryotic Cytosine Methyltransferases. Annu. Rev. Biochem. 2005, 74, 481–514. [Google Scholar] [CrossRef] [Scilit] [PubMed]
- Baylin, S.B.; Jones, P.A. Epigenetic Determinants of Cancer. Cold Spring Harb. Perspect. Biol. 2016, 8, a019505. [Google Scholar] [CrossRef] [Scilit] [PubMed]
- Lovrecic, L.; Maver, A.; Zadel, M.; Peterlin, B. The Role of Epigenetics in Neurodegenerative Diseases. Neurodegener. Dis. 2013, 12, 43–48. [Google Scholar]
- Janulaitis, A.; Klimasauskas, S.; Petrusyte, M.; Butkus, V. Cytosine Modification in DNA by BcnI Methylase Yields N4-Methylcytosine. FEBS Lett. 1983, 161, 131–134. [Google Scholar] [CrossRef] [Scilit] [PubMed]
- Yu, M.; Ji, L.; Neumann, D.A.; Chung, D.H.; Groom, J.; Westpheling, J.; He, C.; Schmitz, R.J. Base-Resolution Detection of N4-Methylcytosine in Genomic DNA Using 4mC-Tet-Assisted-Bisulfite-Sequencing. Nucleic Acids Res. 2015, 43, e148. [Google Scholar] [CrossRef] [Scilit] [PubMed]
- Thalalla Gamage, S.; Sas-Chen, A.; Schwartz, S.; Meier, J.L. Quantitative Nucleotide Resolution Profiling of RNA Cytidine Acetylation by ac4C-seq. Nat. Protoc. 2021, 16, 2286–2307. [Google Scholar] [CrossRef] [Scilit] [PubMed]
- Yan, S.; Lu, Z.; Yang, W.; Xu, J.; Wang, Y.; Xiong, W.; Zhu, R.; Ren, L.; Chen, Z.; Wei, Q.; et al. Antibody-Free Fluorine-Assisted Metabolic Sequencing of RNA N4-Acetylcytidine. J. Am. Chem. Soc. 2023, 145, 22232–22242. [Google Scholar] [CrossRef] [Scilit] [PubMed]
- Wang, S.; Xie, H.; Mao, F.; Wang, H.; Wang, S.; Chen, Z.; Zhang, Y.; Xu, Z.; Xing, J.; Cui, Z.; et al. N4-Acetyldeoxycytosine DNA Modification Marks Euchromatin Regions in Arabidopsis Thaliana. Genome Biol. 2022, 23, 5. [Google Scholar] [CrossRef] [Scilit] [PubMed]
- Harris, R.S.; Liddament, M.T. Retroviral Restriction by APOBEC Proteins. Nat. Rev. Immunol. 2004, 4, 868–877. [Google Scholar] [CrossRef] [Scilit] [PubMed]
- Carpenter, M.A.; Li, M.; Rathore, A.; Lackey, L.; Law, E.K.; Land, A.M.; Leonard, B.; Shandilya, S.M.; Bohn, M.F.; Schiffer, C.A.; et al. Methylcytosine and Normal Cytosine Deamination by the Foreign DNA Restriction Enzyme APOBEC3A. J. Biol. Chem. 2012, 287, 34801–34808. [Google Scholar] [CrossRef] [Scilit] [PubMed]
- Schutsky, E.K.; DeNizio, J.E.; Hu, P.; Liu, M.Y.; Nabel, C.S.; Fabyanic, E.B.; Hwang, Y.; Bushman, F.D.; Wu, H.; Kohli, R.M. Nondestructive, Base-Resolution Sequencing of 5-Hydroxymethylcytosine Using a DNA Deaminase. Nat. Biotechnol. 2018, 36, 1083–1090. [Google Scholar] [CrossRef] [Scilit] [PubMed]
- Barka, A.; Berríos, K.N.; Bailer, P.; Schutsky, E.K.; Wang, T.; Kohli, R.M. The Base-Editing Enzyme APOBEC3A Catalyzes Cytosine Deamination in RNA with Low Proficiency and High Selectivity. ACS Chem. Biol. 2022, 17, 629–636. [Google Scholar] [CrossRef] [Scilit] [PubMed]
- Byeon, I.J.; Ahn, J.; Mitra, M.; Byeon, C.H.; Hercík, K.; Hritz, J.; Charlton, L.M.; Levin, J.G.; Gronenborn, A.M. NMR Structure of Human Restriction Factor APOBEC3A Reveals Substrate Binding and Enzyme Specificity. Nat. Commun. 2013, 4, 1890. [Google Scholar] [CrossRef] [Scilit] [PubMed]
- Brown, R.E.; Coxon, M.; Larsen, B.; Allison, M.; Chadha, A.; Mittelstadt, I.; Mertz, T.M.; Roberts, S.A.; Freudenreich, C.H. APOBEC3A Deaminates CTG Hairpin Loops to Promote Fragility and Instability of Expanded CAG/CTG Repeats. Proc. Natl. Acad. Sci. USA 2025, 122, e2408179122. [Google Scholar] [CrossRef] [Scilit] [PubMed]
- Xiong, J.; Wang, P.; Shao, W.X.; Li, G.; Ding, J.H.; Xie, N.B.; Wang, M.; Cheng, Q.Y.; Xie, C.; Feng, Y.Q.; et al. Genome-Wide Mapping of N4-Methylcytosine at Single-Base Resolution by APOBEC3A-Mediated Deamination Sequencing. Chem. Sci. 2022, 13, 9960–9972. [Google Scholar] [CrossRef] [Scilit] [PubMed]
- Wang, F.C.; He, B.D.; Wang, Z.X.; Deng, X.; Chen, H.; Meng, W.Y.; Fu, Y.T.; Zou, W.Y.; Ge, T.; Li, Y.; et al. Base-Resolution Profiling of 5-Glyceryl-Methylcytosine in Chlamydomonas Reinhardtii via Deaminase-Assisted Sequencing. Nucleic Acids Res. 2025, 53, gkaf012. [Google Scholar] [CrossRef] [Scilit] [PubMed]
- Sinclair, W.R.; Arango, D.; Shrimp, J.H.; Zengeya, T.T.; Thomas, J.M.; Montgomery, D.C.; Fox, S.D.; Andresson, T.; Oberdoerffer, S.; Meier, J.L. Profiling Cytidine Acetylation with Specific Affinity and Reactivity. ACS Chem. Biol. 2017, 12, 2922–2926. [Google Scholar] [CrossRef] [Scilit] [PubMed]
- GB/T 34797-2017; Quality Technical Requirements for Nucleic Acid Primers and Probes. General Administration of Quality Supervision, Inspection and Quarantine of the People’s Republic of China & Standardization Administration of China: Beijing, China, 2017.
- Chen, S.; Zhou, Y.; Chen, Y.; Gu, J. Fastp: An Ultra-Fast All-in-One FASTQ Preprocessor. Bioinformatics 2018, 34, 884–890. [Google Scholar] [CrossRef] [Scilit] [PubMed]
- Langmead, B.; Salzberg, S.L. Fast Gapped-Read Alignment with Bowtie 2. Nat. Methods 2012, 9, 357–359. [Google Scholar] [CrossRef] [Scilit] [PubMed]
- Li, H.; Handsaker, B.; Wysoker, A.; Fennell, T.; Ruan, J.; Homer, N.; Marth, G.; Abecasis, G.; Durbin, R. The Sequence Alignment/Map Format and SAMtools. Bioinformatics 2009, 25, 2078–2079. [Google Scholar] [CrossRef] [Scilit] [PubMed]
- Koboldt, D.C.; Chen, K.; Wylie, T.; Larson, D.E.; McLellan, M.D.; Mardis, E.R.; Weinstock, G.M.; Wilson, R.K.; Ding, L. VarScan: Variant Detection in Massively Parallel Sequencing of Individual and Pooled Samples. Bioinformatics 2009, 25, 2283–2285. [Google Scholar] [CrossRef] [Scilit] [PubMed]
- Martin, M. Cutadapt Removes Adapter Sequences from High-Throughput Sequencing Reads. EMBnet J. 2011, 17, 10–12. [Google Scholar] [CrossRef] [Scilit]
- Krueger, F.; Andrews, S.R. Bismark: A Flexible Aligner and Methylation Caller for Bisulfite-Seq Applications. Bioinformatics 2011, 27, 1571–1572. [Google Scholar] [CrossRef] [Scilit] [PubMed]
- Feng, H.; Conneely, K.; Wu, H. A Bayesian Hierarchical Model to Detect Differentially Methylated Loci from Single Nucleotide Resolution Sequencing Data. Nucleic Acids Res. 2014, 42, e69. [Google Scholar] [CrossRef] [Scilit] [PubMed]
- Schutsky, E.K.; Nabel, C.S.; Davis, A.K.F.; DeNizio, J.E.; Kohli, R.M. APOBEC3A Efficiently Deaminates Methylated, but Not TET-Oxidized, Cytosine Bases in DNA. Nucleic Acids Res. 2017, 45, 7655–7665. [Google Scholar] [CrossRef] [Scilit] [PubMed]
- Ito, F.; Fu, Y.; Kao, S.A.; Yang, H.; Chen, X.S. Family-Wide Comparative Analysis of Cytidine and Methylcytidine Deamination by Eleven Human APOBEC Proteins. J. Mol. Biol. 2017, 429, 1787–1799. [Google Scholar] [CrossRef] [Scilit] [PubMed]

Disclaimer/Publisher’s Note: The statements, opinions and data contained in all publications are solely those of the individual author(s) and contributor(s) and not of MDPI and/or the editor(s). MDPI and/or the editor(s) disclaim responsibility for any injury to people or property resulting from any ideas, methods, instructions or products referred to in the content. |
© 2026 by the authors. Licensee MDPI, Basel, Switzerland. This article is an open access article distributed under the terms and conditions of the Creative Commons Attribution (CC BY) license.