


Abstract
Background/Objectives: Maresin 1 (MaR1), a pro-resolving mediator derived from docosahexaenoic acid (DHA), differs from DHA in its C7/C14 hydroxylation pattern and double-bond arrangement. We compared their recognition by peroxisome proliferator-activated receptor α (PPARα), peroxisome proliferator-activated receptor γ (PPARγ), and retinoic acid receptor-related orphan receptor α (RORα) in the context of metabolic dysfunction-associated steatotic liver disease (MASLD). Methods: We validated Glide docking by redocking reference ligands and performed four independent 250 ns molecular dynamics simulations per complex (24 trajectories; 6.0 μs). We evaluated structural stability, replica-resolved contacts, oxygen distance profiles, and conformational sampling; relative energetic estimates were obtained using molecular mechanics/generalized Born surface area (MM-GBSA) calculations. Results: Redocking RMSDs were ≤1.5 Å, and the replicated trajectories showed no ligand dissociation. In PPARα, MaR1 showed recurrent C7-OH–Lys358 proximity and reproducible carboxylate-associated contacts with Tyr314 and Ser280. In PPARγ, the MaR1 carboxylate sampled Tyr473 in helix 12 and HIE323 with replica-dependent geometry, whereas DHA retained an Arg288-centered anchor. In RORα, MaR1 preferentially sampled an Arg370-centered arrangement, whereas DHA predominantly engaged Arg367; both ligands displayed replica-dependent alternative polar contacts. MaR1 showed more negative hydrogen-bonding, lipophilic, and van der Waals contributions and lower numerical total MM-GBSA scores than DHA across all three receptor pairs. Conclusions: MaR1 showed receptor-specific redistribution of polar contacts associated with alternative carboxylate positioning. Although the calculations do not establish binding affinity or receptor activation, these patterns, rather than a conserved direct C7-OH/C14-OH recognition motif, define testable interaction sites for matched-analog studies and functional assays.
1. Introduction
Metabolic dysfunction-associated steatotic liver disease (MASLD) is the hepatic manifestation of systemic metabolic dysfunction and one of the most prevalent chronic liver diseases worldwide [1,2]. Previously described as non-alcoholic fatty liver disease (NAFLD) and, under an alternative metabolically based framework, as metabolic dysfunction-associated fatty liver disease (MAFLD), MASLD is characterized by disturbances in lipid metabolism, insulin sensitivity, mitochondrial function, and inflammatory signaling. Disease progression can lead to metabolic dysfunction-associated steatohepatitis (MASH), fibrosis, cirrhosis, and hepatocellular carcinoma [3,4,5]. Beyond hepatic injury, MASLD is closely associated with obesity, type 2 diabetes mellitus, and cardiovascular disease, supporting its recognition as a multisystem metabolic disorder rather than an isolated liver condition [6,7,8]. Although the recent approval of resmetirom for selected patients with noncirrhotic MASH and moderate-to-advanced fibrosis represents a major therapeutic milestone [9], pharmacological options for MASLD remain limited. Nuclear receptors such as peroxisome proliferator-activated receptor alpha (PPARα) and gamma (PPARγ), and retinoic acid receptor-related orphan receptor alpha (RORα) play essential roles in lipid metabolism and hepatic metabolic homeostasis. Yet, the molecular basis by which they recognize endogenous lipid mediators relevant to MASLD remains incompletely characterized.
These ligand-responsive nuclear receptors (NRs) integrate lipid-derived signals with gene-expression programs involved in hepatic metabolic homeostasis [10,11]. Among them, PPARα and PPARγ regulate complementary aspects of lipid metabolism. PPARα is predominantly expressed in hepatocytes, where it promotes fatty-acid β-oxidation and lipid catabolism. Impaired hepatic PPARα activity has been associated with defective lipid handling and MASLD progression [12]. By contrast, PPARγ is predominantly expressed in adipose tissue under physiological conditions but becomes upregulated in steatotic hepatocytes, where it contributes to lipid uptake and storage, glucose homeostasis, and insulin sensitivity [13]. Because these effects are context-dependent, selective PPARγ modulation has been explored as a strategy to retain its metabolic benefits while limiting the adverse effects associated with full agonism [14].
RORα complements these PPAR-mediated pathways through a distinct regulatory mechanism. Whereas PPARs generally bind DNA as heterodimers with retinoid X receptor (RXR), RORα recognizes ROR response elements (ROREs) primarily as a monomer [11,15]. RORα regulates hepatic lipid homeostasis and associated transcriptional programs [10]. Liver-specific deletion of RORα aggravates experimental steatohepatitis through mitochondrial dysfunction [16], whereas MaR1–RORα signaling attenuates inflammation and disease progression in diet-induced steatohepatitis [17].
Despite their different DNA-recognition and regulatory mechanisms, PPARα, PPARγ, and RORα belong to the nuclear receptor superfamily and share a conserved modular architecture comprising an N-terminal activation domain, a central DNA-binding domain, a hinge region, and a C-terminal ligand-binding domain (LBD). Their LBDs retain a predominantly α-helical framework in which the C-terminal helix 12 (H12) contributes to the activation function-2 (AF-2) coregulator-binding surface [11]. This conserved LBD framework, combined with the distinct metabolic functions of PPARα, PPARγ, and RORα, provides the rationale for comparing how structurally related endogenous lipid mediators are accommodated across the three receptors.
From a medicinal chemistry perspective, the AF-2/H12 region forms a conformational interface between ligand binding and NR regulation. Ligand-dependent changes in H12 positioning can remodel the coregulator-binding surface and influence receptor conformational states and coregulator recruitment [18,19,20]. In PPARγ, Tyr473 engagement is characteristic of classical full agonists, whereas partial agonists and selective modulators can shift the LBD toward distinct conformational ensembles and coregulator recruitment profiles [19,20,21].
Endogenous lipid mediators can regulate NR function by altering receptor conformation, coregulator interactions, and transcriptional responses. Experimental evidence indicates that docosahexaenoic acid (DHA; C22:6 ω-3) can modulate PPAR-dependent pathways, including PPARα activity in primary hepatocytes and PPARγ–RXR-dependent responses in human dendritic cells [22,23]. DHA has shown hepatoprotective effects in experimental hepatic fibrosis, whereas recent evidence from pediatric NAFLD indicates that n-3 PUFA supplementation may improve selected biochemical and imaging outcomes, although its effects on liver histology remain uncertain [24,25]. DHA also serves as a biosynthetic precursor of specialized pro-resolving mediators (SPMs), including maresin 1 (MaR1), a DHA-derived lipid mediator with anti-inflammatory, antioxidant, and tissue-protective actions in experimental models of liver injury [26,27]. Notably, Han et al. identified MaR1 as an endogenous ligand of RORα and described a pro-resolving RORα–12-lipoxygenase (12-LOX)–MaR1 circuit [17].
Despite sharing a common C22:6 polyunsaturated backbone, DHA and MaR1 differ in chemical features that may influence ligand recognition. MaR1 contains two additional hydroxyl groups at C7 and C14 and a reorganized conjugated triene system. The hydroxyl groups increase its potential to establish hydrogen-bonding interactions relative to DHA [27]. These differences may favor receptor-specific contacts within the ligand-binding pocket and contribute to distinct conformational preferences. Existing structural and computational studies provide precedent for nuclear receptor recognition of DHA. The RXRα–DHA crystal structure revealed an adaptable ligand-binding pocket dominated by van der Waals contacts, whereas subsequent docking and molecular dynamics studies examined DHA recognition by PPARs and RXRα and the stability of the DHA–PPARγ complex [28,29,30]. For MaR1, PPARα-dependent signaling has been reported [31], whereas direct binding has been demonstrated for RORα [17] and, more recently, PPARγ [32].
However, these studies were conducted in distinct biological and methodological contexts and did not directly compare MaR1 and DHA across PPARα, PPARγ, and RORα using a common, replicated molecular dynamics workflow. Consequently, it remains unclear whether the additional polar functionality and altered double-bond arrangement of MaR1 produce a conserved recognition motif or receptor-dependent interaction patterns across these three LBDs.
We hypothesized that the combined structural differences in MaR1, including C7/C14 hydroxylation and altered double-bond position and geometry, would redistribute polar interactions and energetic contributions in a receptor-dependent manner. To test this hypothesis, we compared the recognition of MaR1 and DHA by PPARα, PPARγ, and RORα using molecular docking, four independent 250 ns molecular dynamics simulations per complex, protein–ligand contact and distance profiling, free-energy landscape and principal component analyses, and MM-GBSA calculations. We focused on ligand-specific interaction patterns, conformational sampling, and energetic components, particularly in AF-2/H12-proximal regions.
2. Materials and Methods
2.1. Protein Structure Selection and Preparation
We selected receptor structures using a common set of structural criteria: a wild-type human ligand-binding domain, high crystallographic resolution, an experimentally resolved ligand-binding pocket and AF-2/H12 region, and a crystallographic reference pose suitable for redocking. Accordingly, we used PPARα (PDB ID: 2P54; resolution: 1.79 Å; co-crystallized with GW590735 and an SRC1 peptide), PPARγ (PDB ID: 6MS7; resolution: 1.43 Å; co-crystallized with (S)-VSP-77 and a PGC1 coactivator peptide), and RORα (PDB ID: 1N83; resolution: 1.63 Å; co-crystallized with cholesterol) [33,34,35]. The crystallographic ligands defined experimentally observed receptor-specific pockets and served as internal reference ligands for redocking. Selection therefore prioritized structural quality and independent holo templates over maximal chemical similarity to MaR1 or DHA. More chemically related lipid-bound structures are available, including PPARα complexes with endogenous fatty acids and PPARγ complexes with DHA-derived oxidized fatty acids [36,37]; however, independent reference-ligand templates were retained to minimize ligand-template bias toward either test ligand. Because the simulations were initiated from ligand-bound structures, AF-2/H12-proximal contacts were interpreted as ligand accessibility within the selected starting conformations rather than as evidence that MaR1 or DHA induced or stabilized an active H12 state. A structure-by-structure screening record, including the filtered candidate set, selection status, rationale, and wwPDB model- and ligand-validation metrics, is provided in Tables S1 and S2.
PPARα and PPARγ possess large, predominantly hydrophobic, branched ligand-binding cavities commonly described as Y-shaped pockets with three principal arms [37,38,39]. A more detailed structural classification of PPARα further distinguishes a central region, Arms I–III, and an additional Arm X [37]. The canonical acidic-head-group recognition region adjacent to AF-2/H12 comprises Ser280, Tyr314, His440, and Tyr464 in PPARα and the corresponding Ser289, His323, His449, and Tyr473 residues in PPARγ [37,39]. The remaining branches provide predominantly hydrophobic volume that can accommodate flexible fatty-acid chains in alternative orientations [37,38]. By contrast, RORα contains an elongated, predominantly hydrophobic sterol-binding cavity with a polar region involving Gln289, Tyr290, Arg367, and Arg370 [35,40].
Structures were prepared using the Protein Preparation Wizard in Schrödinger Suite 2020-3 (Schrödinger LLC, New York, NY, USA) [41]. Bond orders were assigned, hydrogen atoms were added, and protonation states were predicted at pH 7.4 using Epik [42,43]. We denoted neutral histidine residues protonated at Nε2 as HIE. Missing side chains and loops were modeled using Prime [44]. We retained the co-crystallized ligands during initial preparation to define the crystallographically observed binding pockets and removed them before grid generation. Crystallographic waters located more than 5 Å from hetero groups, together with buffer ions and nonessential crystallographic additives, were removed consistently across receptors. Accordingly, water-bridged interactions detected during trajectory analysis refer to dynamically sampled solvent molecules rather than static crystallographic waters. Prepared structures underwent restrained minimization with the OPLS3e force field [45] until the heavy-atom RMSD converged below 0.30 Å. Table S3 summarizes the corresponding protein-preparation, grid-generation, ligand-preparation, docking, and redocking-validation parameters. SiteMap descriptors of the co-crystallized-ligand-centered sites and the corresponding binding-pocket residue inventory are provided in Tables S4 and S5, respectively.
2.2. Ligand Preparation
The lipid ligands were maresin 1 (MaR1; PubChem CID: 60201795) and docosahexaenoic acid (DHA; PubChem CID: 445580). Although the PubChem records describe the neutral parent acids, we prepared both ligands as deprotonated carboxylates, consistent with their expected ionization state at physiological pH. MaR1 retained the biologically relevant 7R,14S configuration and 4Z,8E,10E,12Z,16Z,19Z double-bond geometry (C22H31O4−; net charge: −1), whereas DHA retained the all-cis 4Z,7Z,10Z,13Z,16Z,19Z geometry (C22H31O2−; net charge: −1). Structures were prepared using LigPrep in Schrödinger Suite 2020-3, ionization states were predicted at pH 7.4 using Epik [42,43], geometries were minimized using the OPLS3e force field, and low-energy conformers were generated with ConfGen [46]. We retained these protonation, stereochemical, and double-bond assignments throughout docking and molecular dynamics simulations, as summarized in Table S3.
2.3. Molecular Docking and Redocking Validation
Molecular docking was performed using Glide in Schrödinger Suite 2020-3. Receptor grids were centered on the centroid of the corresponding co-crystallized ligand: GW590735 (PDB ligand code 735) for PPARα (PDB ID: 2P54), VSP-77 (V77) for PPARγ (6MS7), and cholesterol (CLR) for RORα (1N83). The inner grid box was set to 10 Å × 10 Å × 10 Å, whereas outer grid boxes of approximately 28, 23, and 28 Å were used for PPARα, PPARγ, and RORα, respectively, according to the dimensions of each ligand-binding pocket. Grids were generated with the OPLS3e force field using van der Waals radii scaling of 1.00 and a partial-charge cutoff of 0.250.
We docked MaR1 and DHA using a hierarchical Glide SP–XP workflow. Initial Standard Precision docking [47,48] was followed by Extra Precision docking of the top 10% of SP-ranked poses according to SP GlideScore [49]. During XP docking, van der Waals radii scaling of 0.80 was applied to nonpolar ligand atoms with a partial-charge cutoff of 0.15, and post-docking minimization was enabled. Glide was configured to write up to 10 XP poses per receptor–ligand pair, ranked by XP GScore; however, the number of poses returned varied among systems, and all returned poses were retained for pose-level assessment. Default parameters were used unless otherwise specified. The ligand conformational-sampling census and the system-specific Glide XP pose-selection funnel are summarized in Table S6. The protocol was validated by redocking each co-crystallized ligand into its prepared receptor pocket and comparing the docked and crystallographic orientations by heavy-atom RMSD. All redocking RMSD values were ≤1.5 Å, supporting use of the grid and docking settings for MaR1 and DHA. Complete grid dimensions, docking parameters, and redocking results are reported in Table S3; representative-pose selection is described in Section 2.4.
2.4. Ligand–Receptor Pose Selection
Among the XP poses returned for each receptor–ligand pair, those occupying the binding pocket defined by the corresponding co-crystallized ligand were considered structurally admissible, and the structurally admissible pose ranked highest by XP GScore was selected as representative. Emodel is Glide’s composite within-ligand pose-discrimination term, which combines GlideScore (reported here as XP GScore for XP docking) with ligand–receptor molecular-mechanics interaction energy and ligand strain energy [47,48,49]. We examined Emodel only as a secondary within-ligand pose-assessment descriptor and did not use it for interligand ranking or binding-free-energy estimation. Pose-level Prime MM-GBSA (Section 2.9) was evaluated separately as an additional relative energetic descriptor.
2.5. Molecular Dynamics Simulation Setup
The selected XP pose for each receptor–ligand complex was prepared using the System Builder module in Desmond [50], implemented in Schrödinger Suite 2020-3. Each complex was solvated in an orthorhombic box of explicit TIP3P water molecules with a minimum 10 Å buffer between the solute and the box boundary [51]. Counterions were added to neutralize the systems, and NaCl was included at a final concentration of 0.15 M. All systems were parametrized with the OPLS3e force field [45] and contained approximately 72,650–73,053 atoms.
Each system was relaxed using the default Desmond multistep equilibration protocol, comprising restrained minimization, low-temperature Brownian dynamics, gradual heating to 300 K, and NPT equilibration with progressive release of positional restraints. Production simulations were performed under NPT conditions at 300 K and 1.01325 bar using the Nosé–Hoover thermostat [52] and Martyna–Tobias–Klein barostat [53]. Long-range electrostatics were treated using the particle mesh Ewald method with a 9 Å short-range cutoff [54]. Bonds involving hydrogen atoms were constrained using M-SHAKE [55]. Production trajectories were integrated using the RESPA multiple-time-step algorithm with a fundamental integration timestep of 2 fs; bonded and short-range nonbonded interactions were evaluated every 2 fs, whereas long-range interactions were evaluated every 6 fs [56].
We generated four independent 250 ns production replicas with distinct initial velocity seeds for each of the six receptor–ligand complexes, yielding 24 trajectories and approximately 6.0 μs of aggregate production sampling. We saved coordinates every 100 ps, producing 2501 frames per replica. We analyzed replicas independently and calculated complex-level summaries as mean ± sample standard deviation across the four equally weighted replicas. We restricted replica pooling to descriptive distributions constructed using a common structural reference and equal frame counts; we derived numerical summaries from independent replica-level values.
2.6. Trajectory Stability and Flexibility Analyses
Trajectory stability and protein flexibility were evaluated independently for each replica. Protein backbone stability was assessed using Cα RMSD after alignment to the initially minimized structure of each receptor–ligand complex. Ligand positional stability was assessed using heavy-atom RMSD relative to the initially minimized bound pose. Before calculating ligand RMSD, each trajectory frame was least-squares aligned to the receptor Cα atoms of the corresponding initially minimized complex, thereby removing global translation and rotation of the receptor–ligand system. Ligand RMSD was interpreted as a descriptor of positional and conformational displacement within the binding pocket and not as an independent measure of binding affinity. Local flexibility was quantified using Cα RMSF, with particular attention to the ligand-binding domain, ligand-binding pocket, and AF-2/H12 region. H12 boundaries were defined according to the secondary-structure assignment of the corresponding crystallographic receptor structure.
Secondary-structure persistence was monitored using the Dictionary of Secondary Structure of Proteins (DSSP) algorithm [57], as implemented in the Desmond Simulation Interaction Diagram module. The persistence of α-helical and β-sheet elements was evaluated to verify maintenance of the nuclear receptor ligand-binding-domain fold. We defined mean α-helical content for each replica as the fraction of protein residue–frame assignments classified as helical. Unless otherwise indicated, complex-level stability and flexibility descriptors were reported as mean ± sample standard deviation across four independent replicas (n = 4). Replica-level Cα RMSD and Cα RMSF statistics are provided in Table S7.
2.7. Protein–Ligand Contact, Hydrogen-Bond, and Water-Bridge Analyses
Protein–ligand interactions were analyzed independently for each replica using the Simulation Interaction Diagram module in Desmond, as implemented in Schrödinger Suite 2020-3 [50]. We defined contact occupancy as the percentage of saved trajectory frames in which a residue met the geometric criteria for a classified interaction; total occupancy represented frames containing at least one such interaction. We reported hydrogen-bond/polar, ionic, hydrophobic, and water-bridge occupancies separately because these categories can coexist and should not be summed. Occupancy does not represent the uninterrupted lifetime of an individual contact; we therefore described interactions as high-occupancy, recurrent, or replica-dependent. Complex-level values were summarized as mean ± sample standard deviation across four independent replicas. We retained contacts with a prespecified mean total occupancy > 30% for main text descriptive reporting. Reproducibility was classified using a prespecified replica count scheme based on the number of replicas in which total occupancy reached ≥50%: consensus contacts occurred in 4/4 replicas, majority contacts in 3/4, and replica-dependent contacts in 1–2/4. We used these thresholds for descriptive categorization and did not treat them as inferential statistical cutoffs.
Contacts were classified according to the geometric criteria implemented in the Desmond interaction-analysis module [50]. Hydrogen bonds required a hydrogen–acceptor distance ≤ 2.5 Å, a donor–hydrogen–acceptor angle ≥ 120°, and a hydrogen–acceptor–acceptor-neighbor angle ≥ 90°. Ionic interactions were assigned when oppositely charged groups were within 3.7 Å. Water bridges were assigned when a single water molecule connected a protein residue and the ligand through hydrogen-bond-compatible distances within 2.8 Å. Hydrophobic contacts were assigned when nonpolar atoms were within 3.6 Å.
Oxygen-specific distance profiles were extracted independently for selected residues in each trajectory. Ligand oxygen identities were verified from chemical connectivity: MaR1 O1 corresponded to C7-OH, O2 to C14-OH, and O3/O4 to the carboxylate group, whereas DHA O1/O2 corresponded to its carboxylate group. For carboxylates, we calculated the minimum of the two residue–oxygen distances in each frame before replica-level averaging. We defined geometric reproducibility as a distance < 4.0 Å in at least 50% of frames within a replica. The four equally weighted replicas provided 10,004 frames per complex for pooled descriptive analyses. We interpreted distances as measures of geometric proximity rather than hydrogen-bond occupancy. Replica-level contact occupancies for residues meeting the broader ≥ 5% supplementary reporting threshold, oxygen-atom assignments, and replica-level mean residue–ligand oxygen distances are reported in Tables S8, S9, and S10, respectively.
2.8. Free-Energy Landscape and Principal Component Analyses
We used free-energy landscape (FEL) analysis to describe ligand-dependent conformational sampling. Production trajectories were generated using conventional NPT molecular dynamics without positional restraints or external biasing potentials; no bias was applied along Cα RMSD, radius of gyration (Rg), or any other collective variable. Because Cα RMSD and Rg are global structural descriptors rather than validated reaction coordinates, we interpreted the resulting landscapes as apparent relative free-energy projections of the populations sampled over the simulated timescale. Accordingly, we used them descriptively and did not interpret them as converged thermodynamic free-energy surfaces or as quantitative estimates of transition barriers. Cα RMSD and Rg were calculated independently for each 250 ns replica using the Geo-Measures plugin [58] implemented in the PyMOL Molecular Graphics System, version 3.1 (Schrödinger, LLC, New York, NY, USA) [59]. We excluded frame 0 from each trajectory, leaving 2500 frames per replica; we then pooled the four replicas with equal weighting, yielding 10,000 frames per complex. Two-dimensional probability distributions were constructed using bin widths of 0.005 nm for RMSD and 0.0025 nm for Rg and smoothed with a Gaussian kernel (σ = 1.5 bins). Relative free energy was calculated as ΔG = −RT ln[P(RMSD,Rg)/Pmax] at 300 K, with the probability maximum of each system assigned ΔG = 0 kJ·mol−1. All maps were displayed using a common 0–11 kJ·mol−1 scale. Representative structures correspond to observed trajectory frames closest to the center of the lowest apparent-free-energy bin in the corresponding FEL. Numerical parameters and the corresponding replica, local-frame, and simulation time identifiers are provided in Table S11.
We interpreted PCA results as descriptors of conformational sampling within the simulated timescale. We conducted system-level PCA separately for each receptor–ligand complex using a replica-balanced ensemble of the four backbone-aligned trajectories. A Cartesian covariance matrix of Cα coordinates and a common system-specific eigenvector basis were constructed for each complex, and all replica frames were projected onto that basis for visualization. Because each complex had an independently calculated PCA basis, we interpreted PC1 and PC2 coordinates only within the corresponding system and did not directly compare them across complexes. System-level eigenvalues and cumulative explained variance values are reported in Table S12A.
We performed replica-level PCA independently for each aligned 250 ns trajectory to assess between-replica variability and sampling diagnostics. For each replica, we calculated the cumulative variance explained by PC1 and PC2 and the cosine content of their corresponding score time series. We used cosine content to identify potential diffusion-like, time-correlated behavior in the principal components; we did not interpret it as evidence of convergence [60]. Because each replica defined an independent eigenvector basis, we interpreted replica-specific score coordinates only within the corresponding trajectory and did not directly superimpose or quantitatively compare them across replicas. Replica-level cumulative variance and cosine content metrics are summarized in Table S12B. We interpreted PCA results as descriptors of conformational sampling within the simulated timescale.
2.9. MM-GBSA Analysis and Energetic Decomposition
We calculated MM-GBSA relative energetic estimates using Prime in Schrödinger Suite 2020-3 with the OPLS3e force field and the VSGB 2.0 implicit-solvent model [45]. We performed calculations on production-trajectory snapshots while retaining the identity of each independent replica. After excluding the initial frame, we analyzed 2500 frames per replica, yielding 10,000 frames per receptor–ligand complex.
We decomposed the total MM-GBSA score into van der Waals, Coulombic, hydrogen-bonding, lipophilic, and polar-solvation contributions. We calculated component values at the frame level and then summarized them independently for each replica. Final values were reported as the mean ± sample standard deviation of the four independent replica means (n = 4). Because MM-GBSA is an approximate endpoint method that does not explicitly account for the full conformational entropy of binding, we used the calculated values only to describe relative energetic trends among the modeled complexes and did not interpret them as quantitative thermodynamic binding free energies [61,62].
2.10. Data Processing, Visualization, and Reproducibility
Trajectory-derived datasets—including protein Cα RMSD, ligand heavy-atom RMSD, protein Cα RMSF, contact occupancies, residue–ligand oxygen distances, FEL parameters, PCA eigenvalues, and MM-GBSA energy terms—were exported for downstream analysis. We obtained replica-level total contact occupancies using the Desmond Simulation Interaction Diagram module and extracted residue–ligand oxygen distance profiles as described in Section 2.7. Numerical datasets were processed in R version 4.5.2 using RStudio version 2026.01.1 Build 403. Contact-occupancy and residue–ligand distance heatmaps were generated using the ggplot2, patchwork, and scales packages. We prepared the remaining quantitative figures and descriptive summaries using GraphPad Prism version 10.6.1. Molecular representations were generated with PyMOL version 3.1 [59], whereas two-dimensional interaction diagrams were generated using the Maestro interaction-diagram tool in Schrödinger Suite 2020-3. Unless otherwise indicated, results were reported as mean ± sample standard deviation across four independent replicas (n = 4).
Given the limited number of independent trajectories per complex and the temporal autocorrelation among molecular dynamics frames, we did not apply inferential statistical tests to trajectory-derived descriptors or treat individual frames as independent observations [63]. Comparisons between DHA and MaR1 were therefore based on descriptive analyses of independent replicas, including contact occupancies, residue–ligand oxygen distance profiles, conformational sampling patterns, and relative energetic trends.
3. Results
3.1. Docking Validation and Initial Binding Modes of DHA and MaR1
The docking protocol was validated by redocking three co-crystallized reference ligands: GW590735 in PPARα (PubChem CID: 9956726; PDB ligand code: 735; PDB ID: 2P54; resolution: 1.79 Å), cholesterol in RORα (PubChem CID: 5997; PDB ligand code: CLR; PDB ID: 1N83; resolution: 1.63 Å), and (S)-VSP-77 in PPARγ (PubChem CID: 139267749; PDB ligand code: V77; PDB ID: 6MS7; resolution: 1.43 Å). The chemical structures of MaR1, DHA, and the reference ligands are shown in Figure 1A–E, and the corresponding pocket-level redocking comparisons in Figure 1F–H. Redocking reproduced the crystallographic poses with heavy-atom RMSD values of 0.36, 0.50, and 1.06 Å for GW590735, cholesterol, and (S)-VSP-77, respectively (Figure 1F–H and Table 1). All values were below the predefined 1.5 Å acceptance threshold, supporting use of the protocol for comparative docking of MaR1 and DHA. Complete two-dimensional interaction diagrams for the highest-ranked structurally admissible Glide XP poses are provided in Figure S1. Comparative representations of receptor-pocket architecture and polarity are provided in Figure S2, with the corresponding SiteMap descriptors and residue inventories reported in Tables S4 and S5.
Figure 1.
Chemical structures of the investigated ligands and co-crystallized reference ligands, together with validation of the molecular docking protocol. Chemical structures are shown for (A) maresin 1 (MaR1), (B) docosahexaenoic acid (DHA), (C) GW590735 (PDB ligand code: 735), (D) cholesterol (PDB ligand code: CLR), and (E) (S)-VSP-77 (PDB ligand code: V77). Redocking validation is shown for (F) the RORα ligand-binding domain (PDB ID: 1N83; resolution: 1.63 Å) with cholesterol, (G) the PPARα ligand-binding domain (PDB ID: 2P54; resolution: 1.79 Å) with GW590735, and (H) the PPARγ ligand-binding domain (PDB ID: 6MS7; resolution: 1.43 Å) with (S)-VSP-77. Receptor surfaces are shown in gray, and the enlarged pocket views display superpositions of the crystallographic reference ligand, its corresponding redocked pose, and the highest-ranked structurally admissible Glide XP poses of MaR1 and DHA. Crystallographic and redocked reference-ligand poses are shown in dark blue and cyan, respectively, whereas MaR1 and DHA are shown in green and orange, respectively. Redocking RMSD values calculated relative to the corresponding crystallographic poses are reported in Table 1. Selected pocket residues are labeled to facilitate structural orientation; the labeled residues are illustrative rather than exhaustive. Complete two-dimensional interaction diagrams are provided in Figure S1.
Table 1.
Validation of the molecular docking protocol using redocking of co-crystallized ligands.
After validation, we docked DHA and MaR1 into the ligand-binding pockets of PPARα, PPARγ, and RORα using the same validated hierarchical Glide SP–XP workflow. Table 2 summarizes the resulting docking scores and the main predicted AF-2/H12-proximal polar contacts. MaR1 yielded a lower numerical XP GScore than DHA in all three receptor models: −10.174 versus −5.422 kcal·mol−1 in PPARα, −10.502 versus −9.434 kcal·mol−1 in PPARγ, and −10.165 versus −9.058 kcal·mol−1 in RORα. These docking scores were interpreted descriptively and not as quantitative measures of binding affinity.
Table 2.
Comparative Glide XP docking scores and main predicted polar and H12-proximal contacts for MaR1 and DHA.
In PPARα, both ligands occupied the Y-shaped pocket and oriented their carboxylates toward the AF-2/H12 region, sharing predicted contacts with Tyr464, Tyr314, HIE440, and Ser280. MaR1 additionally contacted Thr279 and the Ala333 backbone, producing a broader polar interaction profile. In PPARγ, both ligands showed carboxylate-associated contacts with Tyr473, Ser289, HIE323, and HIE449. MaR1 also formed an ionic interaction with Arg288 at 3.6 Å and backbone contacts with Cys285 and Ser342, whereas DHA showed no ionic contact. Glide returned only one pocket-compatible PPARγ/DHA XP pose (Emodel = −54.033 kcal·mol−1); because Emodel could not discriminate among alternative poses, this structure was retained as a structurally admissible starting configuration for MD, and the single-pose selection was treated as a limitation (Section 4.5). In RORα, neither ligand showed a direct H12-proximal polar contact, with Tyr507 located 11.4 Å from MaR1 and 14.2 Å from DHA. MaR1 formed an ionic interaction with Arg370, backbone-associated contacts with Gln289 and Tyr290, and a carbonyl contact with Val364. DHA instead contacted the backbone amides of Asp382 and Gly383 without an ionic anchor.
Overall, MaR1 yielded lower numerical XP GScores and broader predicted polar or ionic interaction networks across the three receptor models. These results were not interpreted as evidence of stronger binding affinity, receptor activation, or ligand efficacy. Molecular dynamics was therefore used to assess the persistence and evolution of the predicted interactions.
3.2. Replicated Molecular Dynamics Simulations Support Stable Receptor–Ligand Complexes
We performed four independent 250 ns molecular dynamics simulations for each of the six receptor–ligand systems, yielding 24 trajectories and approximately 6.0 μs of aggregate production time. Cα RMSD values reached stable plateaus within the first 50–100 ns and remained within a narrow range thereafter (Figure S3A), with means ranging from 1.93 ± 0.25 Å for RORα/DHA to 2.49 ± 0.13 Å for PPARγ/DHA. Ligand heavy-atom RMSD profiles, calculated relative to the initially minimized bound pose after receptor Cα alignment, are shown in Figure S3B and provide a replica-resolved description of ligand positional and conformational displacement within the binding pocket. Visual inspection of the trajectories showed no ligand dissociation. Radius-of-gyration profiles likewise showed no evidence of major unfolding or loss of receptor compactness.
Local flexibility was similar across five complexes, with mean Cα RMSF values ranging from 1.00 ± 0.07 Å for PPARα/DHA to 1.03 ± 0.09 Å for PPARα/MaR1, whereas PPARγ/DHA showed a moderately higher value of 1.27 ± 0.07 Å (Table 3). Replica-level Cα RMSD and RMSF statistics are reported in Table S7; complete per-residue RMSF profiles are shown in Figure S4, and the corresponding per-replica radius-of-gyration profiles are provided in Figure S5. Mean α-helical content ranged from 56.43 ± 0.45% for PPARα/DHA to 61.51 ± 0.37% for RORα/DHA, indicating that all six complexes retained the predominantly α-helical LBD fold throughout the simulated timescale.
Table 3.
Structural stability metrics from replicated molecular dynamics simulations.
3.3. Molecular Dynamics Contact Profiling Reveals Receptor-Specific Recognition Patterns of DHA and MaR1
Protein–ligand contacts were analyzed independently across the four replicas using the occupancy and reproducibility criteria described in Section 2.7. Figure 2 presents replica-resolved total contact occupancies, whereas Figure 3 shows selected residue–ligand oxygen distances. Table 4 summarizes the principal interactions and their between-replica reproducibility. Complete per-residue occupancies, ligand oxygen assignments, replica-level mean distances, and two-dimensional interaction diagrams are provided in Tables S8–S10 and Figure S6.
Figure 2.
Replica-resolved total protein–ligand contact occupancies across the six receptor–ligand complexes. Heatmaps are shown, from left to right, for PPARα/DHA, PPARα/MaR1, PPARγ/DHA, PPARγ/MaR1, RORα/DHA, and RORα/MaR1. Each heatmap reports the percentage of analyzed frames in which the indicated residue formed at least one classified contact with the ligand in four independent 250 ns replicas (R1–R4), together with the corresponding replica mean. Only residues with a mean total occupancy > 30% are displayed. Cell values are percentages rounded to the nearest whole number, and darker blue indicates greater contact occupancy. Total occupancy describes the fraction of frames containing a classified contact and does not represent the uninterrupted lifetime of an individual interaction. Complete replica-level values and interaction-type occupancies are provided in Table S8.
Figure 3.
Replica-level mean residue–ligand oxygen distances for selected interactions across the six receptor–ligand complexes. Four independent 250 ns replicas (R1–R4) are shown for each selected residue–oxygen pair. Yellow–green colors indicate shorter distances, whereas violet colors indicate longer distances. Values are reported in Å within each cell, and boldface identifies replica-level mean distances < 4.0 Å. The color scale was capped at 7.0 Å for visualization, whereas the numerical cell labels report the uncapped values. Boldface describes the replica-level mean and should not be interpreted as equivalent to geometric reproducibility, which was defined as a distance < 4.0 Å in at least 50% of the analyzed frames within a replica. For carboxylate groups, the minimum distance to either carboxylate oxygen was calculated in each frame before replica-level averaging. Distances describe geometric proximity rather than hydrogen-bond occupancy. Ligand oxygen assignments and complete replica-level distance values are provided in Tables S9 and S10, respectively; Table 4 summarizes the principal interactions and their structural interpretations.
Table 4.
Mean protein–ligand contact occupancies across four independent 250 ns molecular dynamics replicas.
In RORα/MaR1, Arg370 showed a mean total occupancy of 84.9 ± 30.2% and met the ≥50% occupancy criterion in 3/4 replicas. Its mean carboxylate-associated distance was 3.02 ± 0.53 Å, with geometrically reproducible proximity in 3/4 replicas. Arg367 showed a mean occupancy of 43.1 ± 34.7% and geometrically reproducible carboxylate proximity in 1/4 replicas, with a mean distance of 4.12 ± 0.86 Å. Gln289 reached an occupancy of 83.5 ± 32.7% in 3/4 replicas, but direct carboxylate proximity did not meet the geometric-reproducibility criterion in any replica. In RORα/DHA, Arg367 showed an occupancy of 72.7 ± 34.1% and a mean carboxylate-associated distance of 3.53 ± 1.13 Å, with both criteria met in 3/4 replicas. Arg370 reached 59.1 ± 47.9% occupancy and a mean distance of 3.62 ± 1.11 Å, with both criteria met in 2/4 replicas. Gln289 showed an occupancy of 82.0 ± 30.3% in 3/4 replicas, whereas direct carboxylate proximity was geometrically reproducible in 1/4 replicas.
In PPARα/MaR1, Lys358, Tyr314, Ser280, and Phe273 each met the ≥50% occupancy criterion in all four replicas, with mean occupancies of 92.3 ± 13.1%, 95.8 ± 8.0%, 93.6 ± 4.6%, and 92.3 ± 9.6%, respectively. The mean Lys358–C7-OH distance was 3.12 ± 0.31 Å, whereas the mean Tyr314–carboxylate and Ser280–carboxylate distances were 2.72 ± 0.13 and 2.87 ± 0.11 Å, respectively. These three distance criteria were reproduced in 4/4 replicas. In PPARα/DHA, HIE440, Tyr314, and Ser280 showed mean occupancies of 97.3 ± 2.4%, 93.6 ± 7.3%, and 88.3 ± 10.7%, respectively, and each met the occupancy criterion in 4/4 replicas. Tyr464/H12 showed an occupancy of 75.6 ± 26.7% and met the occupancy criterion in 3/4 replicas. The mean DHA carboxylate-associated distances to Tyr314, Ser280, and Tyr464 were 2.86 ± 0.20, 3.20 ± 0.32, and 3.09 ± 0.43 Å, respectively, with geometrically reproducible proximity in all four replicas. Among the hydroxyl-specific pairs evaluated for MaR1, recurrent proximity was observed for Lys358–C7-OH, whereas no persistent C14-OH-associated direct proximity was detected.
In PPARγ/MaR1, Tyr473 and HIE323 showed mean total occupancies of 77.5 ± 27.9% and 71.8 ± 24.5%, respectively, and each met the ≥50% occupancy criterion in 3/4 replicas. Their mean carboxylate-associated distances were 3.85 ± 1.12 and 3.84 ± 1.47 Å, respectively. Direct carboxylate proximity was geometrically reproducible in 2/4 replicas for Tyr473 and 3/4 replicas for HIE323. In PPARγ/DHA, Arg288 showed a mean occupancy of 97.9 ± 1.7% and a mean carboxylate-associated distance of 2.82 ± 0.12 Å, with both criteria met in 4/4 replicas. Tyr473 showed a hydrophobic contact occupancy of 31.9 ± 27.1% and met the occupancy criterion in 1/4 replicas, without hydrogen-bond or ionic occupancy. The mean DHA distances to Tyr473 and HIE323 were 14.73 ± 1.21 and 16.89 ± 1.14 Å, respectively, and direct carboxylate proximity did not meet the geometric-reproducibility criterion in any replica.
3.4. FEL and PCA Analyses of Conformational Sampling
Replica-balanced FEL analyses revealed receptor- and ligand-dependent differences in the RMSD–Rg regions sampled by the six complexes (Figure 4). Each landscape comprised 10,000 equally weighted frames from four independent replicas and was displayed using a common 0–11 kJ·mol−1 scale. Numerical parameters and representative-frame identifiers are provided in Table S11, and replica-resolved two-dimensional landscapes are shown in Figure S7. For clarity, FEL RMSD/Rg coordinates and Rg profiles are reported in nm (1 nm = 10 Å), whereas redocking RMSD, trajectory-stability RMSD/RMSF, and residue–ligand distances are reported in Å throughout the manuscript and Supplementary Materials.
Figure 4.
Replica-balanced two-dimensional apparent relative free-energy landscapes (FELs) of the six receptor–ligand complexes. Receptor Cα RMSD and radius of gyration (Rg) were used as structural descriptors. Each landscape was constructed from 10,000 frames obtained by equally pooling 2500 frames from each of four independent 250 ns replicas after excluding frame 0 from every trajectory. Apparent relative free energy was calculated at 300 K from the pooled probability distribution, with the global minimum bin of each four-replica ensemble assigned ΔG = 0 kJ·mol−1. All landscapes are displayed using a common 0–11 kJ·mol−1 scale. The white star in each panel marks the center of the global minimum bin identified from the corresponding pooled, replica-balanced landscape and does not represent a minimum calculated from an individual replica. (A) RORα/MaR1, (B) PPARα/MaR1, (C) PPARγ/MaR1, (D) RORα/DHA, (E) PPARα/DHA, and (F) PPARγ/DHA. Table S11 summarizes the numerical and processing parameters and identifies the observed trajectory frame closest to the center of each global minimum bin.
In PPARγ, MaR1 produced a comparatively compact region of low apparent relative free energy, with a global minimum at RMSD = 0.193 nm and Rg = 1.899 nm. DHA sampled a broader, higher-RMSD region with a global minimum at RMSD = 0.258 nm and Rg = 1.916 nm. The corresponding pooled distributions had mean RMSD/Rg coordinates of 0.194/1.905 nm for MaR1 and 0.249/1.918 nm for DHA. This represented the most pronounced ligand-dependent difference in RMSD–Rg sampling among the three receptor pairs.
For RORα and PPARα, ligand-associated differences were less pronounced. RORα showed closely matched replica-level RMSD/Rg averages for MaR1 (0.198 ± 0.025/1.911 ± 0.008 nm) and DHA (0.194 ± 0.025/1.920 ± 0.005 nm). Their global minima occurred at nearly identical RMSD values but slightly different Rg values: 0.168/1.919 nm for MaR1 and 0.168/1.921 nm for DHA. MaR1 also displayed a higher RMSD extension, driven mainly by replica 3. In PPARα, both ligands retained connected regions of low apparent relative free energy, with global minima at RMSD/Rg = 0.203/1.886 nm for MaR1 and 0.213/1.884 nm for DHA. The corresponding replica-level averages were 0.227 ± 0.025/1.887 ± 0.008 nm and 0.216 ± 0.011/1.887 ± 0.004 nm, respectively.
System-level PCA was used to visualize the conformational regions sampled within each receptor–ligand complex (Figure 5A–F), whereas replica-level PCA quantified between-replica variability in the variance captured by PC1 and PC2 and in their cosine contents (Figure 5G,H). Because independent PCA bases were calculated for each system and replica, score coordinates were interpreted only within their corresponding analyses and were not compared directly across complexes or replicas. Tables S12A and S12B report system-level eigenvalues and replica-level metrics, respectively; Figure S8 shows individual-replica projections and cumulative explained variance profiles through PC10.
Figure 5.
System-level principal component analysis (PCA) projections and replica-level sampling diagnostics for the six receptor–ligand complexes. (A–F) PC1–PC2 projections obtained from backbone-aligned Cα coordinates. For each complex, a single system-specific PCA basis was derived from a replica-balanced ensemble of the four independent trajectories, and all corresponding frames were projected onto it. Points are colored by their sequential position in the concatenated replica dataset; this scale illustrates sampling progression but does not represent a single continuous trajectory. Panels correspond to (A) RORα/MaR1, (B) PPARα/MaR1, (C) PPARγ/MaR1, (D) RORα/DHA, (E) PPARα/DHA, and (F) PPARγ/DHA. Because the PCA bases were calculated independently, PC coordinates and explained variance percentages were interpreted only within each system. (G) Cumulative variance explained by PC1 and PC2 from PCA performed independently for each 250 ns replica. Points represent individual replicas, and lines with error bars indicate the mean ± sample SD (n = 4); green and orange denote MaR1 and DHA, respectively. (H) Replica-level cosine content of PC1 (blue circles) and PC2 (gray triangles). Values approaching 1 indicate greater cosine-like, time-correlated behavior and were treated as a sampling diagnostic, not as evidence of convergence. System-level eigenvalues and replica-level metrics are reported in Tables S12A and S12B, respectively; individual-replica projections and explained variance profiles through PC10 are shown in Figure S8.
Replica-level PCA showed that the cumulative variance explained by PC1 and PC2 ranged from 30.96 ± 5.33% for PPARα/DHA to 54.50 ± 5.68% for RORα/DHA. The corresponding values were 52.24 ± 13.97% for RORα/MaR1, 34.77 ± 2.81% for PPARα/MaR1, 35.16 ± 4.70% for PPARγ/MaR1, and 47.83 ± 8.57% for PPARγ/DHA. The greatest between-replica variability occurred in RORα/MaR1, followed by PPARγ/DHA. Cumulative profiles through PC10 were most closely grouped for PPARγ/MaR1 (63.49–67.76%) and PPARα/MaR1 (60.01–65.97%), whereas RORα/MaR1 showed the greatest separation (69.58–86.35%), driven by replica 3, which reached 86.35% (Figure S8(F3)).
Cosine content analysis provided additional context for this heterogeneity. In RORα/MaR1, replica 3 showed cosine content values of 0.7762 for PC1 and 0.3807 for PC2, whereas the remaining replicas ranged from 0.0118 to 0.0343 and from 0.0001 to 0.0092, respectively. This isolated profile coincided with the higher-RMSD extension observed in the FEL. PPARγ/MaR1 showed elevated PC1 cosine content in three replicas (0.7950–0.8968). By contrast, PPARγ/DHA showed elevated values across all four replicas, ranging from 0.6433 to 0.8852 for PC1 and from 0.4039 to 0.7679 for PC2. PPARα/DHA also showed elevated PC1 cosine content in replicas 2–4 (0.7943–0.8708), whereas replica 1 had a substantially lower value (0.0266). Thus, the comparatively compact pooled FEL of PPARγ/MaR1 coexisted with substantial time-correlated contributions in most replicas, whereas PPARγ/DHA showed time-correlated behavior in both dominant components across all four trajectories. The higher-RMSD extension of RORα/MaR1 arose mainly from a single replica. Taken together, the FEL and PCA results describe trajectory-dependent conformational sampling, with cosine content profiles identifying systems in which time-correlated motions limit interpretation of the dominant principal components.
3.5. MM-GBSA Analysis Shows Receptor-Specific Energetic Profiles of MaR1 and DHA
MM-GBSA calculations complemented the structural and conformational analyses by providing relative endpoint energetic estimates. Across the six receptor–ligand complexes, mean total MM-GBSA scores ranged from −76.95 ± 2.15 to −61.91 ± 2.44 kcal·mol−1, with each value representing the mean ± SD across four independent replicas (n = 4; Figure 6 and Table 5). MaR1 yielded lower numerical total scores than DHA in all three receptor pairs. In RORα, the total scores were −68.94 ± 2.45 kcal·mol−1 for MaR1 and −61.91 ± 2.44 kcal·mol−1 for DHA. The corresponding values were −76.49 ± 1.43 and −69.46 ± 2.85 kcal·mol−1 in PPARα and −76.95 ± 2.15 and −69.92 ± 2.84 kcal·mol−1 in PPARγ, respectively. We did not apply inferential statistical tests to these numerical differences and interpreted them only as receptor-specific relative energetic trends.
Figure 6.
MM-GBSA relative energetic estimates and component decomposition for the six receptor–ligand complexes. Bars represent the mean ± sample SD of the four per-replica mean values (n = 4), each calculated from an independent 250 ns simulation using Prime MM-GBSA with the OPLS3e force field and VSGB 2.0 implicit-solvent model. Individual points represent the corresponding replica means. Displayed terms include the total MM-GBSA score (Total), Coulombic contribution (Coulomb), hydrogen-bonding contribution (H-bond), lipophilic contribution (Lipophilic), polar-solvation contribution (Sol-GB), and van der Waals contribution (vdW). (A) RORα/MaR1, (B) PPARα/MaR1, (C) PPARγ/MaR1, (D) RORα/DHA, (E) PPARα/DHA, and (F) PPARγ/DHA. Summary values are provided in Table 5.
Table 5.
MM-GBSA relative energetic estimates and component decomposition for the six receptor–ligand complexes.
Component decomposition showed consistent numerical differences between MaR1 and DHA across the three receptor pairs. MaR1 yielded more negative van der Waals, lipophilic, and hydrogen-bonding contributions than DHA, together with lower numerical Coulombic contributions. Conversely, DHA yielded lower polar-solvation contributions. The magnitude and between-replica variability of these components differed among receptor–ligand systems (Figure 6 and Table 5).
MaR1 exhibited consistently more negative hydrogen-bonding contributions across the three receptors, ranging from −3.86 to −3.50 kcal·mol−1, compared with −3.34 to −2.99 kcal·mol−1 for DHA. Accordingly, the MaR1 values were approximately 0.51–0.52 kcal·mol−1 more negative than the corresponding DHA values. MaR1 also showed more negative lipophilic contributions (−27.44 to −26.56 kcal·mol−1) than DHA (−25.57 to −24.69 kcal·mol−1) and more negative van der Waals contributions (−55.51 to −53.64 versus −53.14 to −51.27 kcal·mol−1). Within each receptor pair, the Coulombic contribution was numerically lower for MaR1, whereas the Sol-GB contribution was lower for DHA.
Between-replica variability in the Coulombic and Sol-GB contributions was greatest for PPARγ/MaR1, for which the corresponding standard deviations were 6.32 and 5.15 kcal·mol−1, respectively. Among the DHA complexes, the largest variability in these terms occurred for RORα/DHA, with standard deviations of 3.35 and 3.47 kcal·mol−1. By comparison, the corresponding standard deviations were 0.98 and 0.40 kcal·mol−1 for both PPARα/DHA and PPARγ/DHA. These component values were interpreted descriptively and were not used to infer quantitative thermodynamic binding free energies, receptor activation, or ligand efficacy.
3.6. Representative Structures from Apparent FEL Minima Illustrate Receptor-Specific Binding-Pocket Arrangements
To visualize local interaction arrangements sampled by each receptor–ligand complex, we extracted representative trajectory frames from the global minimum bins of the replica-balanced RMSD–Rg landscapes (Figure 7). Receptor-scale superpositions are shown in Figure 7A–C, whereas pocket-level views are presented for DHA in Figure 7D–F and MaR1 in Figure 7G–I. These individual snapshots provide spatial context for the replica-level contact and distance analyses. Their corresponding replica, local-frame, and simulation time identifiers are reported in Table S11.
Figure 7.
Receptor-scale localization and pocket-level interaction patterns of representative structures selected from the global minimum bins of the apparent free-energy landscapes. (A–C) Receptor-scale superpositions of the representative MaR1- and DHA-containing structures for RORα, PPARα, and PPARγ, respectively, showing ligand localization within each binding pocket. MaR1 and DHA are shown in green and orange, respectively, whereas AF-2/H12 is highlighted in dark gray. (D–F) Pocket-level views of RORα/DHA, PPARα/DHA, and PPARγ/DHA, respectively. (G–I) Pocket-level views of RORα/MaR1, PPARα/MaR1, and PPARγ/MaR1, respectively. Dashed yellow lines indicate selected hydrogen–acceptor distances in the representative snapshots; values are reported in Å. These snapshot-level measurements should be interpreted alongside the replica-level contact occupancies in Figure 2, the residue–ligand oxygen distance profiles in Figure 3, the summary statistics in Table 4, and the complete per-residue occupancies in Table S8; they are not equivalent to trajectory-averaged distance profiles and do not independently establish trajectory-wide contact persistence. Table S11 reports the replica, local-frame, and simulation time identifiers of the selected structures. In the detailed views, oxygen and nitrogen atoms are shown in red and blue, respectively.
In RORα/DHA, the selected structure displayed an Arg370-proximal ligand orientation, with Ile327 and Phe399 also lining the local environment of the ligand (Figure 7D). Replica-level analysis nevertheless identified Arg367 as the more frequently reproduced carboxylate anchor, whereas Arg370 represented an alternative, replica-dependent arrangement. Gln289 showed frequent classified contact but did not exhibit consistently reproduced direct carboxylate proximity. The RORα/MaR1 snapshot showed direct proximity to Arg370 (Figure 7G), consistent with the majority-reproduced Arg370-centered arrangement; Arg367 was less reproducible, and Gln289 did not meet the criterion for reproducible direct carboxylate proximity.
The PPARα/DHA snapshot positioned the ligand within the canonical polar region involving Tyr464, Tyr314, and Ser280 (Figure 7E). Across replicas, HIE440, Tyr314, and Ser280 formed consensus polar contacts, whereas Tyr464/H12 was reproduced in three replicas and showed carboxylate proximity in all four. The PPARα/MaR1 snapshot displayed local proximity to Lys358, Tyr314, and Tyr464 (Figure 7H). Replica-level analysis distinguished the recurrent Lys358–C7-OH geometry and reproducible Tyr314/Ser280–carboxylate proximity from the more variable Tyr464 association.
In PPARγ/DHA, the representative structure retained an Arg288-centered arrangement, with Tyr473 located in the surrounding AF-2/H12 region (Figure 7F). Arg288 was reproduced as the principal carboxylate anchor across all four replicas, whereas Tyr473 showed only replica-dependent hydrophobic proximity without reproducible polar or ionic engagement. The PPARγ/MaR1 snapshot instead displayed local carboxylate-associated proximity to HIE323 and Tyr473 (Figure 7I). Both residues reached the contact-occupancy criterion in three replicas, whereas direct carboxylate proximity was geometrically reproducible in three replicas for HIE323 and two replicas for Tyr473.
4. Discussion
We directly compared MaR1 and DHA recognition by PPARα, PPARγ, and RORα using a common, replicated computational workflow. Previous studies have linked MaR1 to PPARα-dependent signaling [31], established its direct binding to RORα [17] and PPARγ [32], and characterized DHA recognition by RXRα and PPARs [28,29,30]. Because this evidence has remained fragmented across receptors and experimental contexts, the present design enabled a direct comparison of the two lipids across the three LBDs.
The principal finding was that the combined structural differences in the MaR1 scaffold—C7/C14 hydroxylation and altered double-bond position and geometry [64]—were associated with receptor-specific redistribution of polar anchoring, conformational sampling, and MM-GBSA component contributions. MaR1 also yielded lower numerical total MM-GBSA scores than DHA across all three receptor pairs. Because MM-GBSA provides approximate endpoint estimates, this consistent numerical pattern was interpreted as a model-dependent relative energetic trend rather than as quantitative evidence of stronger binding affinity. Thus, receptor-specific redistribution of molecular recognition remained the principal structural distinction between MaR1 and DHA, with the energetic estimates providing complementary descriptive context.
4.1. Structural Features of the MaR1 Scaffold as Candidate Determinants of Receptor-Specific Recognition
Atom-level analyses did not support a conserved direct C7-OH/C14-OH recognition motif across the three receptors. Instead, MaR1 accommodation was characterized by receptor-specific carboxylate positioning, with recurrent hydroxyl-specific proximity detected only between C7-OH and Lys358 in PPARα. MaR1 sampled canonical polar regions involving Ser280 and Tyr314 in PPARα and HIE323 and Tyr473 in PPARγ, together with an alternative Arg370-centered arrangement in RORα. DHA formed a canonical PPARα polar network involving HIE440, Tyr314, Ser280, and Tyr464/H12, retained a persistent Arg288-centered anchor in PPARγ, and preferentially engaged Arg367 while also sampling Arg370 in RORα. These patterns indicate that the structural differences between MaR1 and DHA redistribute polar contacts according to the architecture of each pocket rather than imposing a common anchoring mode.
Structural studies of related lipid–nuclear receptor systems support this type of binding-pocket plasticity. In PPARγ, oxidized fatty acids containing additional polar groups can adopt distinct arrangements within the ligand-binding pocket [36]. In RORα, cholesterol sulfate shifts toward the hydrophilic region and establishes additional polar contacts compared with cholesterol [35,40]. PPARα structures likewise show that occupation of different pocket regions contributes to ligand recognition and selectivity [37]. Together, these precedents illustrate how changes in lipid structure can reorganize polar anchoring and overall ligand positioning across nuclear receptor pockets.
The absence of persistent C14-OH-associated proximity suggests that the MaR1 hydroxyl groups may influence ligand conformation and pocket accommodation without acting as a conserved pair of direct anchors. Because MaR1 and DHA also differ in double-bond position and geometry, matched structural analogs will be required to distinguish the individual contributions of C7-OH, C14-OH, and the altered unsaturation pattern. Experimental evidence linking MaR1 to RORα binding and activity, PPARα-dependent signaling, and direct PPARγ binding [17,31,32] provides a biological framework for this validation. Within that framework, the receptor-specific carboxylate arrangements and the recurrent C7-OH–Lys358 proximity represent priority features for functional testing.
4.2. Receptor-Specific Recognition of MaR1 and DHA
In PPARγ, MaR1 sampled a carboxylate arrangement involving His323 (modeled as HIE323) and the AF-2/H12 residue Tyr473, although Tyr473 engagement varied among replicas. DHA instead retained predominantly Arg288-centered carboxylate anchoring. Tyr473 belongs to the canonical polar network through which classical PPARγ full agonists stabilize H12 and promote coactivator recruitment, whereas selective modulators can shift the LBD toward distinct conformational ensembles and coregulator recruitment profiles [19,20,21]. Together with the reported direct binding of MaR1 to PPARγ and its PPARγ-dependent effects in cardiac resident macrophages [32], these results identify Tyr473, HIE323, and the surrounding AF-2/H12-proximal region as candidate determinants of MaR1 accommodation. The replica dependence of Tyr473 engagement further indicates that MaR1 dynamically accesses this polar region rather than maintaining a single fixed geometry.
In PPARα, DHA formed a reproducible canonical polar network involving HIE440, Tyr314, Ser280, and Tyr464/H12, whereas MaR1 combined carboxylate-associated contacts involving Tyr314 and Ser280 with recurrent C7-OH–Lys358 proximity and a persistent Phe273 hydrophobic contact. Thus, both ligands accessed the canonical polar region, but MaR1 additionally sampled the monitored C7-OH-specific geometry involving Lys358. This receptor-specific distribution is consistent with the capacity of the Y-shaped PPARα pocket to accommodate chemically diverse ligands across multiple subpockets [37,38]. Jung et al. reported PPARα-dependent anti-inflammatory effects of MaR1 in human umbilical vein endothelial cells [31]; however, to our knowledge, direct MaR1–PPARα binding has not yet been demonstrated experimentally. Tyr314, Ser280, and Lys358 therefore define candidate sites for determining whether the predicted MaR1 interaction network contributes to PPARα-dependent signaling relevant to fatty-acid oxidation and hepatic lipid catabolism in MASLD [12,65].
RORα displayed overlapping but differently weighted polar anchoring patterns. MaR1 preferentially sampled Arg370, with less frequent Arg367 engagement, whereas DHA predominantly engaged Arg367 but also sampled Arg370; both ligands formed recurrent contacts with Gln289, although direct carboxylate proximity to this residue showed limited geometric reproducibility. The polarity-dependent displacement of cholesterol sulfate within the RORα pocket provides a structural precedent for this type of redistribution [40]. Han et al. identified MaR1 as an endogenous RORα ligand and demonstrated direct binding, enhanced transcriptional activity, and attenuation of diet-induced steatohepatitis through a RORα-dependent mechanism [17]. Against this experimental background, Arg370, Arg367, and Gln289 emerge as candidate contributors to MaR1 accommodation. The replica-dependent interchange between the two arginine-centered arrangements supports interpretation as an accessible ensemble of polar states rather than a single invariant binding geometry.
4.3. Conformational and Energetic Implications of the MaR1 Scaffold
FEL and replica-level PCA diagnostics revealed receptor-dependent differences in conformational sampling between the MaR1- and DHA-bound systems. In PPARγ, MaR1 occupied a comparatively compact region of low apparent relative free energy in the replica-balanced RMSD–Rg projection, whereas DHA sampled a broader distribution. Together with the recurrent but replica-dependent Tyr473 engagement, this finding indicates distinct ligand-associated conformational sampling under the simulated conditions. Elevated cosine content values indicated diffusion-like, time-correlated contributions to the principal components [60], while the observed between-replica variability supported a descriptive interpretation of the sampled ensemble [63]. Accordingly, the relative compactness of the PPARγ/MaR1 distribution was interpreted as a descriptive property of the conformations sampled during the simulated timescale.
In RORα, the dominant MaR1 population was accompanied by a higher-RMSD extension contributed predominantly by replica 3, indicating replica-specific sampling. In PPARα, both ligand-bound complexes retained connected regions of low apparent relative free energy but differed in their RMSD–Rg distributions and interaction networks. Across the three receptors, no common MaR1-associated conformational signature emerged; instead, the observed differences followed the architecture and polar environment of each binding pocket. This receptor dependence is consistent with evidence that ligand identity can alter PPAR binding modes, pocket occupancy, and coactivator recruitment [19,37], while ligand efficacy can shift the PPARγ LBD conformational ensemble between distinct functional states [20].
MM-GBSA component decomposition provided complementary energetic context. MaR1 yielded lower numerical total scores across all three receptor pairs, together with more negative hydrogen-bonding, lipophilic, and van der Waals contributions and lower Coulombic terms, whereas DHA showed lower polar-solvation contributions. Although consistent across receptors, this component-level pattern cannot isolate the individual contributions of C7-OH, C14-OH, or the altered unsaturation pattern and should not be interpreted as a quantitative difference in binding affinity. Considered alongside the FEL and PCA results, the energetic estimates support a model-dependent relative trend accompanying receptor-specific, rather than conserved, conformational and contact patterns.
4.4. Nuclear Receptor Recognition in MASLD: A Structural Working Model
PPARα, PPARγ, and RORα are relevant to MASLD because they regulate complementary aspects of hepatic metabolic homeostasis. PPARα promotes fatty-acid oxidation and lipid catabolism [12,65], PPARγ regulates insulin sensitivity and hepatic lipid handling in a context-dependent manner [13,14], and RORα contributes to mitochondrial integrity and inflammatory regulation [16,17]. These pathways converge on processes disrupted during MASLD progression. Circulating MaR1 concentrations have also been reported to be lower in patients with NAFLD and inversely associated with the presence of the disease [66], providing clinical context for investigating how MaR1 recognition differs from that of its precursor DHA.
In vivo exposure data provide additional translational context. In a previous study from our group, a single intraperitoneal dose of MaR1 (4 ng/g body weight) administered to Sprague–Dawley rats produced the highest measured plasma concentration at 30 min, followed by a decline to low levels at 6 h. At 30 min, ELISA-measured MaR1 concentrations in the liver, kidney, and heart increased approximately two- to threefold over baseline. After 35 days of repeated administration, higher hepatic MaR1 concentrations were also detected at the study endpoint, particularly in animals with DEN-induced chronic liver injury [67]. These observations establish systemic and hepatic exposure under the evaluated protocols and support the investigation of MaR1–receptor interactions in biologically relevant tissues.
Within this biological context, the simulations define a receptor-specific set of interaction sites for experimental evaluation: recurrent C7-OH–Lys358 proximity accompanied by Tyr314 and Ser280 carboxylate-associated contacts in PPARα; AF-2/H12-proximal sampling involving HIE323 and Tyr473 in PPARγ; and an alternative Arg370-centered arrangement with variable Gln289 proximity in RORα. These features connect the reported PPARα-dependent effects of MaR1 [31] and its direct binding to RORα [17] and PPARγ [32] with molecular hypotheses that can be evaluated using matched structural analogs, site-directed mutagenesis, direct binding measurements, and receptor-functional assays.
Nuclear-receptor engagement is likely one component of MaR1 biology, because MaR1 can also signal through LGR6 [68] and its actions may depend on receptor and tissue context. From a pharmaceutical-development perspective, validation should progress from direct binding and residue-level testing to cellular target engagement, followed by assessment of pharmacokinetics, tissue exposure, metabolic stability, formulation, efficacy, and safety. Figure 8 summarizes this staged structural and translational working model.
Figure 8.
Integrative structural and translational working model of MaR1 and DHA recognition by PPARα, PPARγ, and RORα in a MASLD-related context. (1) C7/C14 hydroxylation and differences in double-bond position and geometry distinguish MaR1 from DHA and were associated with receptor-specific redistribution of polar contacts; MaR1 yielded lower numerical total MM-GBSA scores across all three receptor pairs, interpreted as relative endpoint estimates. (2) Replica-resolved simulations identified recurrent C7-OH–Lys358 proximity accompanied by Tyr314/Ser280 carboxylate contacts in PPARα, replica-dependent HIE323/Tyr473 sampling near AF-2/H12 in PPARγ, and an alternative Arg370-centered arrangement with variable Gln289 proximity in RORα. (3) Published evidence of MaR1 receptor-dependent effects and tissue exposure provides biological context for these structural predictions. (4) Experimental validation should progress through matched structural analogs, direct binding measurements, site-directed mutagenesis, and receptor-functional assays, followed by pharmacokinetic, efficacy, and safety assessment. Solid, dashed, and dotted arrows denote findings from the present computational study, published biological or exposure evidence, and proposed consequences requiring validation, respectively. Created in BioRender. Quiñones S. Martín, M. (2026). https://BioRender.com/ekaifom.
4.5. Limitations and Future Directions
Several limitations define the scope of the present conclusions. Although four independent 250 ns simulations per complex enabled replica-level assessment, all trajectories for each complex originated from a single selected XP pose. This design evaluates the reproducibility of the sampled interactions from a common starting configuration but cannot exhaustively capture alternative ligand orientations, slow H12 transitions, or rare receptor states. This constraint is particularly relevant to PPARγ/DHA and RORα/DHA, for which Glide returned only one XP pose. For PPARγ/DHA, the Emodel value was reported descriptively and was not interpreted as evidence of pose optimality; because no alternative XP pose was available, Emodel could not perform its intended within-ligand pose-discrimination function. Ligand retention within the binding pockets supports the local compatibility of the selected configurations but does not establish that their starting orientations were unique or globally preferred. Accordingly, the present results characterize the evolution of selected pocket-compatible poses rather than exhaustively ranking all possible binding modes. Future studies should compare poses generated using independent docking algorithms and receptor ensembles and evaluate them through longer replicated or enhanced-sampling simulations [63].
The sampling analyses also have statistical limitations. Replica-level comparisons were descriptive because only four independent trajectories were available per complex and successive frames within each trajectory were temporally autocorrelated. Furthermore, each complex was analyzed using an independently calculated PCA basis, precluding direct comparison of PC coordinates across systems. Between-replica differences and elevated cosine content values indicated that some principal components contained diffusion-like, time-correlated contributions and were therefore treated as sampling diagnostics rather than evidence of convergence [60,63]. Similarly, the RMSD–Rg FEL projections represent apparent relative free-energy distributions sampled over the simulated timescale rather than converged thermodynamic free-energy surfaces.
Functional inference is additionally limited by the use of isolated ligand-binding domains, which excluded DNA binding, coregulator recruitment, post-translational modifications, and PPAR–RXR heterodimerization. The simulations were also initiated from ligand-bound templates with resolved AF-2/H12 conformations, potentially constraining the local conformational ensemble accessible within the simulated timescale. Apo receptors and complexes containing established full or partial agonists were not included as reference controls. Moreover, because MaR1 and DHA differ in C7/C14 hydroxylation as well as in double-bond position and geometry, the present comparison cannot isolate the contribution of any individual structural feature. MM-GBSA component scores were therefore treated exclusively as relative endpoint energetic descriptors; their sensitivity to methodological choices and incomplete treatment of conformational entropy preclude interpretation as quantitative thermodynamic binding free energies [61,62]. Within these boundaries, the predicted recognition patterns constitute structural hypotheses for experimental testing rather than evidence of receptor activation, transcriptional modulation, or biological efficacy.
Future studies should quantify MaR1 and DHA binding under matched experimental conditions across the three receptors, with particular emphasis on establishing direct MaR1–PPARα binding. Receptor-transactivation and coactivator recruitment assays should then be combined with site-directed mutagenesis of Tyr473 and His323 in PPARγ; Lys358, Tyr314, and Ser280 in PPARα; and Arg370, Arg367, and Gln289 in RORα. Matched MaR1 analogs that independently modify C7-OH, C14-OH, or double-bond geometry would help distinguish the contribution of each structural feature. Extending these experiments to MASLD-relevant cellular systems and including established full and partial agonists as comparators would determine whether the predicted interaction patterns translate into receptor-selective transcriptional or metabolic responses.
5. Conclusions
This comparative computational study indicates that MaR1 and DHA are accommodated through receptor-specific rather than conserved recognition patterns across PPARα, PPARγ, and RORα. In PPARα, MaR1 combined recurrent C7-OH–Lys358 proximity with Tyr314- and Ser280-associated carboxylate contacts, whereas DHA engaged a canonical polar network involving HIE440, Tyr314, Ser280, and Tyr464/H12. In PPARγ, MaR1 sampled HIE323 and Tyr473 near AF-2/H12 with replica-dependent geometry, whereas DHA remained predominantly anchored through Arg288. In RORα, MaR1 preferentially sampled Arg370 and DHA Arg367, although both ligands accessed alternative arginine-centered arrangements and contacted Gln289.
MaR1 yielded lower numerical total MM-GBSA scores and more negative hydrogen-bonding, lipophilic, and van der Waals contributions across all three receptor pairs. These results were interpreted as model-dependent relative energetic trends rather than quantitative differences in binding affinity. Atom-level analyses did not identify a conserved direct C7-OH/C14-OH recognition motif, and recurrent hydroxyl-specific proximity was limited to C7-OH–Lys358 in PPARα. Because MaR1 and DHA also differ in double-bond position and geometry, matched structural analogs will be required to resolve the contribution of each molecular feature. Together, the identified residues define testable sites for matched binding measurements, site-directed mutagenesis, and receptor-functional assays in MASLD-relevant systems.
Supplementary Materials
The following supporting information can be downloaded at https://www.mdpi.com/article/10.3390/biom16111558/s1: Supplementary Tables: Table S1: Crystallographic structures screened for receptor-template selection and structural comparison; Table S2: wwPDB model- and ligand-validation metrics for the crystallographic structures included in the receptor-template screening; Table S3: Protein preparation, Glide grid generation, ligand preparation, hierarchical SP–XP docking, and redocking-validation parameters used for PPARα, PPARγ, and RORα; Table S4: SiteMap descriptors of the co-crystallized-ligand-centered sites in the prepared PPARα, PPARγ, and RORα structures; Table S5: Binding-pocket residue inventory of the three receptor templates, grouped by structural region; Table S6: Ligand conformational-sampling census and Glide XP pose-selection funnel; Table S7: Per-replica Cα RMSD and Cα RMSF statistics from the full 250 ns molecular dynamics trajectories of the six receptor–ligand complexes; Table S8: Replica-level total protein–ligand contact occupancies across four independent 250 ns molecular dynamics replicas of the six receptor–ligand complexes (including Table S8a–f); Table S9: Ligand oxygen-atom assignments used for the residue–ligand distance analyses; Table S10: Replica-level mean residue–ligand oxygen distances used to generate Figure 3; Table S11: Numerical parameters and representative-frame identifiers for the global minima of the two-dimensional free-energy landscapes obtained from the replica-balanced 10,000-frame ensembles; Table S12A: System-level principal component analysis eigenvalues and cumulative explained variance for the six receptor–ligand complexes from the replica-balanced ensemble analyses; Table S12B: Replica-level PCA cumulative variance and cosine-content metrics across four independent 250 ns trajectories of the six receptor–ligand complexes. Supplementary Figures: Figure S1: Two-dimensional Glide XP ligand–receptor interaction diagrams of MaR1 and DHA with PPARα, PPARγ, and RORα; Figure S2: Architecture and polarity of the three ligand-binding pockets; Figure S3A: Time evolution of protein backbone Cα RMSD during replicated molecular dynamics simulations of the receptor–ligand complexes; Figure S3B: Time evolution of ligand heavy-atom RMSD during replicated molecular dynamics simulations of the six receptor–ligand complexes; Figure S4: Per-residue Cα RMSF profiles of receptor–ligand complexes obtained from replicated 250 ns molecular dynamics simulations; Figure S5: Per-replica radius of gyration profiles of the receptor Cα backbone during 250 ns molecular dynamics simulations of the six receptor–ligand complexes; Figure S6: Replica-resolved two-dimensional protein–ligand interaction diagrams from the 250 ns molecular dynamics simulations of the six receptor–ligand complexes; Figure S7: Replica-resolved two-dimensional apparent relative free-energy landscapes (FELs) of the six receptor–ligand complexes; Figure S8: Replica-resolved principal component analysis (PCA) score projections and cumulative explained-variance profiles for the six receptor–ligand complexes.
Author Contributions
Conceptualization, M.Q.S.M., Y.P.-S. and J.Z.-H.; methodology, M.Q.S.M., C.O.-F. and Y.P.-S.; software, M.Q.S.M., C.O.-F. and E.S.-C.; validation, M.Q.S.M., C.O.-F., Y.P.-S. and J.Z.-H.; formal analysis, M.Q.S.M.; investigation, M.Q.S.M., C.O.-F., F.H.-V., R.N.-G. and E.S.-C.; resources, D.R.G., Y.P.-S. and J.Z.-H.; data curation, M.Q.S.M. and Y.P.-S.; writing—original draft preparation, M.Q.S.M.; writing—review and editing, M.Q.S.M., C.O.-F., R.N.-G., D.R.G., E.S.-C., Y.P.-S. and J.Z.-H.; visualization, M.Q.S.M.; supervision, D.R.G., Y.P.-S. and J.Z.-H.; project administration, Y.P.-S. and J.Z.-H.; funding acquisition, D.R.G., Y.P.-S. and J.Z.-H. All authors have read and agreed to the published version of the manuscript.
Funding
This work was supported by the Agencia Nacional de Investigación y Desarrollo (ANID), ANID National Doctoral Scholarship No. 21220031 awarded to Matías Quiñones San Martín; ANID FOVI Grant No. 230100 awarded to Daniel R. González; and Universidad de Talca, Project INES 815-2023 awarded to Jessica Zúñiga-Hernández.
Institutional Review Board Statement
Not applicable.
Informed Consent Statement
Not applicable.
Data Availability Statement
The receptor structures analyzed in this study are publicly available from the RCSB Protein Data Bank under accession codes 2P54, 6MS7, and 1N83. The processed numerical data supporting the figures and tables are included in the article and its Supporting Information. Additional replica-level trajectory-derived datasets and analysis scripts are available from the corresponding author upon reasonable request because of file-size limitations.
Acknowledgments
Figure 8 was created with BioRender.com. During the preparation of this manuscript, the authors used ChatGPT (GPT-5.6 Sol; OpenAI; accessed 1 August 2026) and Grammarly (version 1.2.304.1976; Grammarly, Inc.; accessed 1 August 2026) to assist with language refinement and grammatical editing. Generative AI was not used to generate the molecular dynamics simulations or primary numerical data. The authors reviewed and verified all outputs and take full responsibility for the content of this publication.
Conflicts of Interest
The authors declare no conflicts of interest. The funders had no role in the study design; data collection, analysis, or interpretation; manuscript writing; or the decision to publish the results.
Abbreviations
The following abbreviations are used in this manuscript:
| Abbreviation | Definition |
| AF-2 | Activation function 2 |
| Cα | Alpha-carbon atom |
| CID | PubChem compound identifier |
| DEN | Diethylnitrosamine |
| DHA | Docosahexaenoic acid |
| DSSP | Dictionary of Secondary Structure of Proteins |
| ELISA | Enzyme-linked immunosorbent assay |
| FEL | Free-energy landscape |
| H12 | Helix 12 |
| HB | Hydrogen bond |
| HIE | Neutral histidine protonated at Nε2 |
| LBD | Ligand-binding domain |
| LGR6 | Leucine-rich repeat-containing G-protein-coupled receptor 6 |
| MaR1 | Maresin 1 |
| MASH | Metabolic dysfunction-associated steatohepatitis |
| MASLD | Metabolic dysfunction-associated steatotic liver disease |
| MD | Molecular dynamics |
| MM-GBSA | Molecular mechanics/generalized Born surface area |
| NAFLD | Non-alcoholic fatty liver disease |
| NPT | Isothermal–isobaric ensemble |
| OPLS3e | Optimized Potentials for Liquid Simulations 3e force field |
| PC1/PC2 | First and second principal components |
| PCA | Principal component analysis |
| PDB | Protein Data Bank |
| PGC1 | Peroxisome proliferator-activated receptor gamma coactivator 1 |
| PPARα | Peroxisome proliferator-activated receptor alpha |
| PPARγ | Peroxisome proliferator-activated receptor gamma |
| RESPA | Reversible reference system propagator algorithm |
| Rg | Radius of gyration |
| RMSD | Root-mean-square deviation |
| RMSF | Root-mean-square fluctuation |
| RORα | Retinoic acid receptor-related orphan receptor alpha |
| RXRα | Retinoid X receptor alpha |
| SD | Standard deviation |
| Sol-GB | Generalized Born polar-solvation term |
| SP | Standard Precision |
| SPM | Specialized pro-resolving mediator |
| SRC1 | Steroid receptor coactivator 1 |
| TIP3P | Three-point transferable intermolecular potential water model |
| vdW | van der Waals |
| VSGB | Variable-dielectric surface generalized Born implicit-solvent model |
| XP | Extra Precision |
References
- Rinella, M.E.; Lazarus, J.V.; Ratziu, V.; Francque, S.M.; Sanyal, A.J.; Kanwal, F.; Romero, D.; Abdelmalek, M.F.; Anstee, Q.M.; Arab, J.P.; et al. A Multisociety Delphi Consensus Statement on New Fatty Liver Disease Nomenclature. Hepatology 2023, 78, 1966–1986. [Google Scholar] [CrossRef] [Scilit]
- Chui, Z.S.W.; Xue, Y.; Xu, A. Hormone-Based Pharmacotherapy for Metabolic Dysfunction-Associated Fatty Liver Disease. Med. Rev. 2024, 4, 158–168. [Google Scholar] [CrossRef] [Scilit]
- Danpanichkul, P.; Suparan, K.; Diaz, L.A.; Fallon, M.B.; Chen, V.L.; Namsathimaphorn, K.; Rakwong, K.; Inkongngam, T.; Kaeosri, C.; Kalligeros, M.; et al. The Rising Global Burden of MASLD and Other Metabolic Diseases (2000–2021). United Eur. Gastroenterol. J. 2025, 13, 1141–1154. [Google Scholar] [CrossRef] [Scilit]
- Vaz, K.; Clayton-Chubb, D.; Majeed, A.; Lubel, J.; Simmons, D.; Kemp, W.; Roberts, S.K. Current Understanding and Future Perspectives on the Impact of Changing NAFLD to MAFLD on Global Epidemiology and Clinical Outcomes. Hepatol. Int. 2023, 17, 1082–1097. [Google Scholar] [CrossRef] [Scilit]
- Tacke, F.; Horn, P.; Wai-Sun Wong, V.; Ratziu, V.; Bugianesi, E.; Francque, S.; Zelber-Sagi, S.; Valenti, L.; Roden, M.; Schick, F.; et al. EASL–EASD–EASO Clinical Practice Guidelines on the Management of Metabolic Dysfunction-Associated Steatotic Liver Disease (MASLD). J. Hepatol. 2024, 81, 492–542. [Google Scholar] [CrossRef] [Scilit]
- Jia, S.; Ye, X.; Wu, T.; Wang, Z.; Wu, J. Global Prevalence of Metabolic Dysfunction-Associated Fatty Liver Disease in Children and Adolescents with Overweight and Obesity: A Systematic Review and Meta-Analysis. BMC Gastroenterol. 2025, 25, 691. [Google Scholar] [CrossRef] [Scilit]
- Cao, L.; An, Y.; Liu, H.; Jiang, J.; Liu, W.; Zhou, Y.; Shi, M.; Dai, W.; Lv, Y.; Zhao, Y.; et al. Global Epidemiology of Type 2 Diabetes in Patients with NAFLD or MAFLD: A Systematic Review and Meta-Analysis. BMC Med. 2024, 22, 101. [Google Scholar] [CrossRef] [Scilit]
- Zhao, J.; Liu, L.; Cao, Y.-Y.; Gao, X.; Targher, G.; Byrne, C.D.; Sun, D.-Q.; Zheng, M.-H. MAFLD as Part of Systemic Metabolic Dysregulation. Hepatol. Int. 2024, 18, 834–847. [Google Scholar] [CrossRef] [Scilit]
- Keam, S.J. Resmetirom: First Approval. Drugs 2024, 84, 729–735. [Google Scholar] [CrossRef] [Scilit]
- Kim, K.; Boo, K.; Yu, Y.S.; Oh, S.K.; Kim, H.; Jeon, Y.; Bhin, J.; Hwang, D.; Kim, K.I.; Lee, J.S.; et al. RORα Controls Hepatic Lipid Homeostasis via Negative Regulation of PPARγ Transcriptional Network. Nat. Commun. 2017, 8, 162. [Google Scholar] [CrossRef] [Scilit]
- Burris, T.P.; de Vera, I.M.S.; Cote, I.; Flaveny, C.A.; Wanninayake, U.S.; Chatterjee, A.; Walker, J.K.; Steinauer, N.; Zhang, J.; Coons, L.A.; et al. International Union of Basic and Clinical Pharmacology CXIII: Nuclear Receptor Superfamily—Update 2023. Pharmacol. Rev. 2023, 75, 1233–1318. [Google Scholar] [CrossRef] [Scilit]
- Montagner, A.; Polizzi, A.; Fouché, E.; Ducheix, S.; Lippi, Y.; Lasserre, F.; Barquissau, V.; Régnier, M.; Lukowicz, C.; Benhamed, F.; et al. Liver PPARα Is Crucial for Whole-Body Fatty Acid Homeostasis and Is Protective against NAFLD. Gut 2016, 65, 1202–1214. [Google Scholar] [CrossRef] [Scilit]
- Lee, S.M.; Muratalla, J.; Karimi, S.; Diaz-Ruiz, A.; Frutos, M.D.; Guzman, G.; Ramos-Molina, B.; Cordoba-Chacon, J. Hepatocyte PPARγ Contributes to the Progression of Non-Alcoholic Steatohepatitis in Male and Female Obese Mice. Cell. Mol. Life Sci. 2023, 80, 39. [Google Scholar] [CrossRef] [Scilit]
- Zhou, Z.; Jin, R.; Gu, Y.; Ji, Y.; Lou, Y.; Wu, J. Therapeutic Targeting of PPARγ in Nonalcoholic Fatty Liver Disease: Efficacy, Safety, and Drug Development. Drug Des. Devel. Ther. 2025, 19, 7293–7319. [Google Scholar] [CrossRef] [Scilit]
- Lee, J.M.; Kim, H.; Baek, S.H. Unraveling the Physiological Roles of Retinoic Acid Receptor-Related Orphan Receptor α. Exp. Mol. Med. 2021, 53, 1278–1286. [Google Scholar] [CrossRef] [Scilit]
- Kim, H.-J.; Han, Y.-H.; Na, H.; Kim, J.-Y.; Kim, T.; Kim, H.-J.; Shin, C.; Lee, J.W.; Lee, M.-O. Liver-Specific Deletion of RORα Aggravates Diet-Induced Nonalcoholic Steatohepatitis by Inducing Mitochondrial Dysfunction. Sci. Rep. 2017, 7, 16041. [Google Scholar] [CrossRef] [Scilit]
- Han, Y.H.; Shin, K.O.; Kim, J.Y.; Khadka, D.B.; Kim, H.J.; Lee, Y.M.; Cho, W.J.; Cha, J.Y.; Lee, B.J.; Lee, M.O. A Maresin 1/RORα/12-Lipoxygenase Autoregulatory Circuit Prevents Inflammation and Progression of Nonalcoholic Steatohepatitis. J. Clin. Investig. 2019, 129, 1684–1698. [Google Scholar] [CrossRef] [Scilit]
- Chrisman, I.M.; Nemetchek, M.D.; de Vera, I.M.S.; Shang, J.; Heidari, Z.; Long, Y.; Reyes-Caballero, H.; Galindo-Murillo, R.; Cheatham, T.E.; Blayo, A.-L.; et al. Defining a Conformational Ensemble That Directs Activation of PPARγ. Nat. Commun. 2018, 9, 1794. [Google Scholar] [CrossRef] [Scilit]
- Kamata, S.; Honda, A.; Yashiro, S.; Kaneko, C.; Komori, Y.; Shimamura, A.; Masuda, R.; Oyama, T.; Ishii, I. Competitive Ligand-Induced Recruitment of Coactivators to Specific PPARα/δ/γ Ligand-Binding Domains Revealed by Dual-Emission FRET and X-Ray Diffraction of Cocrystals. Antioxidants 2025, 14, 494. [Google Scholar] [CrossRef] [Scilit]
- MacTavish, B.S.; Zhu, D.; Shang, J.; Shao, Q.; He, Y.; Yang, Z.J.; Kamenecka, T.M.; Kojetin, D.J. Ligand Efficacy Shifts a Nuclear Receptor Conformational Ensemble between Transcriptionally Active and Repressive States. Nat. Commun. 2025, 16, 2065. [Google Scholar] [CrossRef] [Scilit]
- Nolte, R.T.; Wisely, G.B.; Westin, S.; Cobb, J.E.; Lambert, M.H.; Kurokawa, R.; Rosenfeld, M.G.; Willson, T.M.; Glass, C.K.; Milburn, M.V. Ligand Binding and Co-Activator Assembly of the Peroxisome Proliferator-Activated Receptor-Gamma. Nature 1998, 395, 137–143. [Google Scholar] [CrossRef] [Scilit]
- Zapata-Gonzalez, F.; Rueda, F.; Petriz, J.; Domingo, P.; Villarroya, F.; Diaz-Delfin, J.; de Madariaga, M.A.; Domingo, J.C. Human Dendritic Cell Activities Are Modulated by the Omega-3 Fatty Acid, Docosahexaenoic Acid, Mainly through PPARγ:RXR Heterodimers: Comparison with Other Polyunsaturated Fatty Acids. J. Leukoc. Biol. 2008, 84, 1172–1182. [Google Scholar] [CrossRef] [Scilit]
- Pawar, A.; Jump, D.B. Unsaturated Fatty Acid Regulation of Peroxisome Proliferator-Activated Receptor Alpha Activity in Rat Primary Hepatocytes. J. Biol. Chem. 2003, 278, 35931–35939. [Google Scholar] [CrossRef] [Scilit]
- He, J.; Bai, K.; Hong, B.; Zhang, F.; Zheng, S. Docosahexaenoic Acid Attenuates Carbon Tetrachloride-Induced Hepatic Fibrosis in Rats. Int. Immunopharmacol. 2017, 53, 56–62. [Google Scholar] [CrossRef] [Scilit]
- Dionysopoulos, G.; Kalopitas, G.; Vadarlis, A.; Bakaloudi, D.R.; Gkiourtzis, N.; Karanika, E.; Tsekitsidi, E.; Chourdakis, M. Can Omega-3 Fatty Acids Be Beneficial in Pediatric NAFLD? A Systematic Review and Meta-Analysis. Crit. Rev. Food Sci. Nutr. 2023, 63, 8545–8553. [Google Scholar] [CrossRef] [Scilit]
- Rodríguez, M.J.; Sabaj, M.; Tolosa, G.; Herrera Vielma, F.; Zúñiga, M.J.; González, D.R.; Zúñiga-Hernández, J. Maresin-1 Prevents Liver Fibrosis by Targeting Nrf2 and NF-ΚB, Reducing Oxidative Stress and Inflammation. Cells 2021, 10, 3406. [Google Scholar] [CrossRef] [Scilit]
- Serhan, C.N.; Yang, R.; Martinod, K.; Kasuga, K.; Pillai, P.S.; Porter, T.F.; Oh, S.F.; Spite, M. Maresins: Novel Macrophage Mediators with Potent Antiinflammatory and Proresolving Actions. J. Exp. Med. 2009, 206, 15–23. [Google Scholar] [CrossRef] [Scilit]
- Gani, O.A.B.S.M.; Sylte, I. Molecular Recognition of Docosahexaenoic Acid by Peroxisome Proliferator-Activated Receptors and Retinoid-X Receptor α. J. Mol. Graph. Model. 2008, 27, 217–224. [Google Scholar] [CrossRef] [Scilit]
- Musfiroh, I.; Megawati, G.; Herawati, D.M.D.; Ifaya, M. Stability of Omega-3 Compounds Complex with PPAR-γ Receptor as an Anti-Obesity Using Molecular Dynamic Simulation. Int. J. Appl. Pharm. 2022, 14, 45–49. [Google Scholar] [CrossRef] [Scilit]
- Egea, P.F.; Mitschler, A.; Moras, D. Molecular Recognition of Agonist Ligands by RXRs. Mol. Endocrinol. 2002, 16, 987–997. [Google Scholar] [CrossRef]
- Jung, T.W.; Park, H.S.; Choi, G.H.; Kim, D.; Ahn, S.H.; Kim, D.S.; Lee, T.; Jeong, J.H. Maresin 1 Attenuates Pro-Inflammatory Reactions and ER Stress in HUVECs via PPARα-Mediated Pathway. Mol. Cell. Biochem. 2018, 448, 335–347. [Google Scholar] [CrossRef] [Scilit]
- Sun, X.; Feng, Y.; Zhao, Y.; Cai, Y.; Cao, Z.; Zhang, Y.; Wei, Z.; Du, A.; Xu, B. Maresin 1 Ameliorates Myocardial Ischaemia—Reperfusion Injury by Promoting Tissue Resident Macrophage Efferocytosis. Cardiovasc. Res. 2026, 122, 397–411. [Google Scholar] [CrossRef] [Scilit]
- Sierra, M.L.; Beneton, V.; Boullay, A.B.; Boyer, T.; Brewster, A.G.; Donche, F.; Forest, M.C.; Fouchet, M.H.; Gellibert, F.J.; Grillot, D.A.; et al. Substituted 2-[(4-Aminomethyl)Phenoxy]-2-Methylpropionic Acid PPARalpha Agonists. 1. Discovery of a Novel Series of Potent HDLc Raising Agents. J. Med. Chem. 2007, 50, 685–695. [Google Scholar] [CrossRef] [Scilit]
- Jiang, H.; Zhou, X.E.; Shi, J.; Zhou, Z.; Zhao, G.; Zhang, X.; Sun, Y.; Suino-Powell, K.; Ma, L.; Gao, H.; et al. Identification and Structural Insight of an Effective PPARγ Modulator with Improved Therapeutic Index for Anti-Diabetic Drug Discovery. Chem. Sci. 2020, 11, 2260–2268. [Google Scholar] [CrossRef] [Scilit]
- Kallen, J.A.; Schlaeppi, J.M.; Bitsch, F.; Geisse, S.; Geiser, M.; Delhon, I.; Fournier, B. X-Ray Structure of the HRORα LBD at 1.63 Å: Structural and Functional Data That Cholesterol or a Cholesterol Derivative Is the Natural Ligand of RORα. Structure 2002, 10, 1697–1707. [Google Scholar] [CrossRef] [Scilit]
- Itoh, T.; Fairall, L.; Amin, K.; Inaba, Y.; Szanto, A.; Balint, B.L.; Nagy, L.; Yamamoto, K.; Schwabe, J.W.R. Structural Basis for the Activation of PPARγ by Oxidized Fatty Acids. Nat. Struct. Mol. Biol. 2008, 15, 924–931. [Google Scholar] [CrossRef] [Scilit]
- Kamata, S.; Oyama, T.; Saito, K.; Honda, A.; Yamamoto, Y.; Suda, K.; Ishikawa, R.; Itoh, T.; Watanabe, Y.; Shibata, T.; et al. PPARα Ligand-Binding Domain Structures with Endogenous Fatty Acids and Fibrates. iScience 2020, 23, 101727. [Google Scholar] [CrossRef] [Scilit]
- Miyachi, H. Structural Biology-Based Exploration of Subtype-Selective Agonists for Peroxisome Proliferator-Activated Receptors. Int. J. Mol. Sci. 2021, 22, 9223. [Google Scholar] [CrossRef] [Scilit]
- Shang, J.; Kojetin, D.J. Structural Mechanism Underlying Ligand Binding and Activation of PPARγ. Structure 2021, 29, 940–950.e4. [Google Scholar] [CrossRef] [Scilit]
- Kallen, J.; Schlaeppi, J.M.; Bitsch, F.; Delhon, I.; Fournier, B. Crystal Structure of the Human RORα Ligand Binding Domain in Complex with Cholesterol Sulfate at 2.2 Å. J. Biol. Chem. 2004, 279, 14033–14038. [Google Scholar] [CrossRef] [Scilit]
- Madhavi Sastry, G.; Adzhigirey, M.; Day, T.; Annabhimoju, R.; Sherman, W. Protein and Ligand Preparation: Parameters, Protocols, and Influence on Virtual Screening Enrichments. J. Comput. Aided. Mol. Des. 2013, 27, 221–234. [Google Scholar] [CrossRef] [Scilit]
- Greenwood, J.R.; Calkins, D.; Sullivan, A.P.; Shelley, J.C. Towards the Comprehensive, Rapid, and Accurate Prediction of the Favorable Tautomeric States of Drug-like Molecules in Aqueous Solution. J. Comput. Aided. Mol. Des. 2010, 24, 591–604. [Google Scholar] [CrossRef] [Scilit]
- Shelley, J.C.; Cholleti, A.; Frye, L.L.; Greenwood, J.R.; Timlin, M.R.; Uchimaya, M. Epik: A Software Program for PKa Prediction and Protonation State Generation for Drug-like Molecules. J. Comput. Aided. Mol. Des. 2007, 21, 681–691. [Google Scholar] [CrossRef] [Scilit]
- Jacobson, M.P.; Pincus, D.L.; Rapp, C.S.; Day, T.J.F.; Honig, B.; Shaw, D.E.; Friesner, R.A. A Hierarchical Approach to All-Atom Protein Loop Prediction. Proteins 2004, 55, 351–367. [Google Scholar] [CrossRef] [Scilit]
- Roos, K.; Wu, C.; Damm, W.; Reboul, M.; Stevenson, J.M.; Lu, C.; Dahlgren, M.K.; Mondal, S.; Chen, W.; Wang, L.; et al. OPLS3e: Extending Force Field Coverage for Drug-Like Small Molecules. J. Chem. Theory Comput. 2019, 15, 1863–1874. [Google Scholar] [CrossRef] [Scilit]
- Watts, K.S.; Dalal, P.; Murphy, R.B.; Sherman, W.; Friesner, R.A.; Shelley, J.C. ConfGen: A Conformational Search Method for Efficient Generation of Bioactive Conformers. J. Chem. Inf. Model. 2010, 50, 534–546. [Google Scholar] [CrossRef] [Scilit]
- Friesner, R.A.; Banks, J.L.; Murphy, R.B.; Halgren, T.A.; Klicic, J.J.; Mainz, D.T.; Repasky, M.P.; Knoll, E.H.; Shelley, M.; Perry, J.K.; et al. Glide: A New Approach for Rapid, Accurate Docking and Scoring. 1. Method and Assessment of Docking Accuracy. J. Med. Chem. 2004, 47, 1739–1749. [Google Scholar] [CrossRef] [Scilit]
- Halgren, T.A.; Murphy, R.B.; Friesner, R.A.; Beard, H.S.; Frye, L.L.; Pollard, W.T.; Banks, J.L. Glide: A New Approach for Rapid, Accurate Docking and Scoring. 2. Enrichment Factors in Database Screening. J. Med. Chem. 2004, 47, 1750–1759. [Google Scholar] [CrossRef] [Scilit]
- Friesner, R.A.; Murphy, R.B.; Repasky, M.P.; Frye, L.L.; Greenwood, J.R.; Halgren, T.A.; Sanschagrin, P.C.; Mainz, D.T. Extra Precision Glide: Docking and Scoring Incorporating a Model of Hydrophobic Enclosure for Protein-Ligand Complexes. J. Med. Chem. 2006, 49, 6177–6196. [Google Scholar] [CrossRef] [Scilit]
- Bowers, K.J.; Sacerdoti, F.D.; Salmon, J.K.; Shan, Y.; Shaw, D.E.; Chow, E.; Xu, H.; Dror, R.O.; Eastwood, M.P.; Gregersen, B.A.; et al. Molecular Dynamics Scalable Algorithms for Molecular Dynamics Simulations on Commodity Clusters. In Proceedings of the 2006 ACM/IEEE Conference on Supercomputing (SC ’06), Tampa, FL, USA, 11–17 November 2006; ACM Press: New York, NY, USA, 2006; p. 84. [Google Scholar] [CrossRef] [Scilit]
- Jorgensen, W.L.; Chandrasekhar, J.; Madura, J.D.; Impey, R.W.; Klein, M.L. Comparison of Simple Potential Functions for Simulating Liquid Water. J. Chem. Phys. 1983, 79, 926–935. [Google Scholar] [CrossRef] [Scilit]
- Hoover, W.G. Canonical Dynamics: Equilibrium Phase-Space Distributions. Phys. Rev. A 1985, 31, 1695–1697. [Google Scholar] [CrossRef] [Scilit]
- Martyna, G.J.; Tobias, D.J.; Klein, M.L. Constant Pressure Molecular Dynamics Algorithms. J. Chem. Phys. 1994, 101, 4177–4189. [Google Scholar] [CrossRef] [Scilit]
- Darden, T.; York, D.; Pedersen, L. Particle Mesh Ewald: An N⋅log(N) Method for Ewald Sums in Large Systems. J. Chem. Phys. 1993, 98, 10089–10092. [Google Scholar] [CrossRef] [Scilit]
- Kräutler, V.; van Gunsteren, W.F.; Hünenberger, P.H. A Fast SHAKE Algorithm to Solve Distance Constraint Equations for Small Molecules in Molecular Dynamics Simulations. J. Comput. Chem. 2001, 22, 501–508. [Google Scholar] [CrossRef] [Scilit]
- Tuckerman, M.; Berne, B.J.; Martyna, G.J. Reversible Multiple Time Scale Molecular Dynamics. J. Chem. Phys. 1992, 97, 1990–2001. [Google Scholar] [CrossRef] [Scilit]
- Kabsch, W.; Sander, C. Dictionary of Protein Secondary Structure: Pattern Recognition of Hydrogen-bonded and Geometrical Features. Biopolymers 1983, 22, 2577–2637. [Google Scholar] [CrossRef] [Scilit]
- Kagami, L.P.; das Neves, G.M.; Timmers, L.F.S.M.; Caceres, R.A.; Eifler-Lima, V.L. Geo-Measures: A PyMOL Plugin for Protein Structure Ensembles Analysis. Comput. Biol. Chem. 2020, 87, 107322. [Google Scholar] [CrossRef] [Scilit]
- Schrödinger LLC. The PyMOL Molecular Graphics System, version 3.1; Schrödinger LLC: New York, NY, USA, 2025.
- Hess, B. Convergence of Sampling in Protein Simulations. Phys. Rev. E 2002, 65, 031910. [Google Scholar] [CrossRef] [Scilit]
- Tuccinardi, T. What Is the Current Value of MM/PBSA and MM/GBSA Methods in Drug Discovery? Expert Opin. Drug Discov. 2021, 16, 1233–1237. [Google Scholar] [CrossRef] [Scilit]
- Wang, E.; Sun, H.; Wang, J.; Wang, Z.; Liu, H.; Zhang, J.Z.H.; Hou, T. End-Point Binding Free Energy Calculation with MM/PBSA and MM/GBSA: Strategies and Applications in Drug Design. Chem. Rev. 2019, 119, 9478–9508. [Google Scholar] [CrossRef] [Scilit]
- Grossfield, A.; Patrone, P.N.; Roe, D.R.; Schultz, A.J.; Siderius, D.; Zuckerman, D.M. Best Practices for Quantification of Uncertainty and Sampling Quality in Molecular Simulations. Living J. Comput. Mol. Sci. 2019, 1, 5067. [Google Scholar] [CrossRef] [Scilit]
- Ferreira, I.; Falcato, F.; Bandarra, N.; Rauter, A.P. Resolvins, Protectins, and Maresins: DHA-Derived Specialized Pro-Resolving Mediators, Biosynthetic Pathways, Synthetic Approaches, and Their Role in Inflammation. Molecules 2022, 27, 1677. [Google Scholar] [CrossRef] [Scilit]
- Bougarne, N.; Weyers, B.; Desmet, S.J.; Deckers, J.; Ray, D.W.; Staels, B.; De Bosscher, K. Molecular Actions of PPARα in Lipid Metabolism and Inflammation. Endocr. Rev. 2018, 39, 760–802. [Google Scholar] [CrossRef] [Scilit]
- Fang, X.; Wang, H.; Ye, T.; Fu, X.; Tan, X.; Zeng, Y.; Fan, J.; Xu, Y. Low Serum Maresin-1 Levels Are Associated with Non-Alcoholic Fatty Liver Disease: A Cross-Sectional Study. Lipids Health Dis. 2021, 20, 96. [Google Scholar] [CrossRef] [Scilit]
- Herrera Vielma, F.; Quiñones San Martin, M.; Muñoz-Carrasco, N.; Berrocal-Navarrete, F.; Herrada, A.A.; Olate-Briones, A.; Zagmutt, S.; Rodríguez-Rodríguez, R.; González, D.R.; Zúñiga-Hernandez, J. Maresin 1 Induces Resolution of Hepatic Fibrosis through RORα-Dependent Reprogramming of Resident Macrophages. Front. Pharmacol. 2026, 17, 1826739. [Google Scholar] [CrossRef] [Scilit]
- Chiang, N.; Libreros, S.; Norris, P.C.; De La Rosa, X.; Serhan, C.N. Maresin 1 Activates LGR6 Receptor Promoting Phagocyte Immunoresolvent Functions. J. Clin. Investig. 2019, 129, 5294–5311. [Google Scholar] [CrossRef] [Scilit]
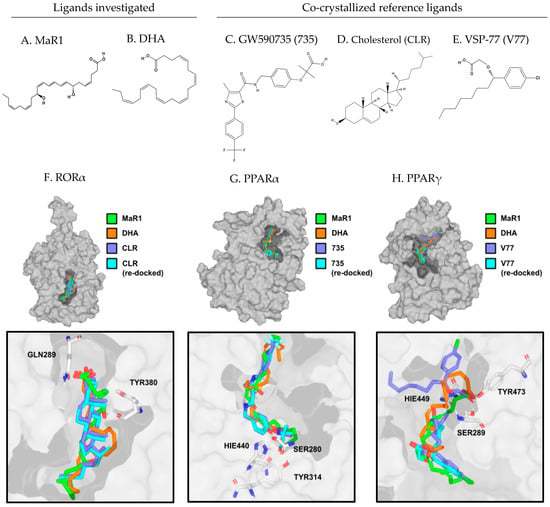
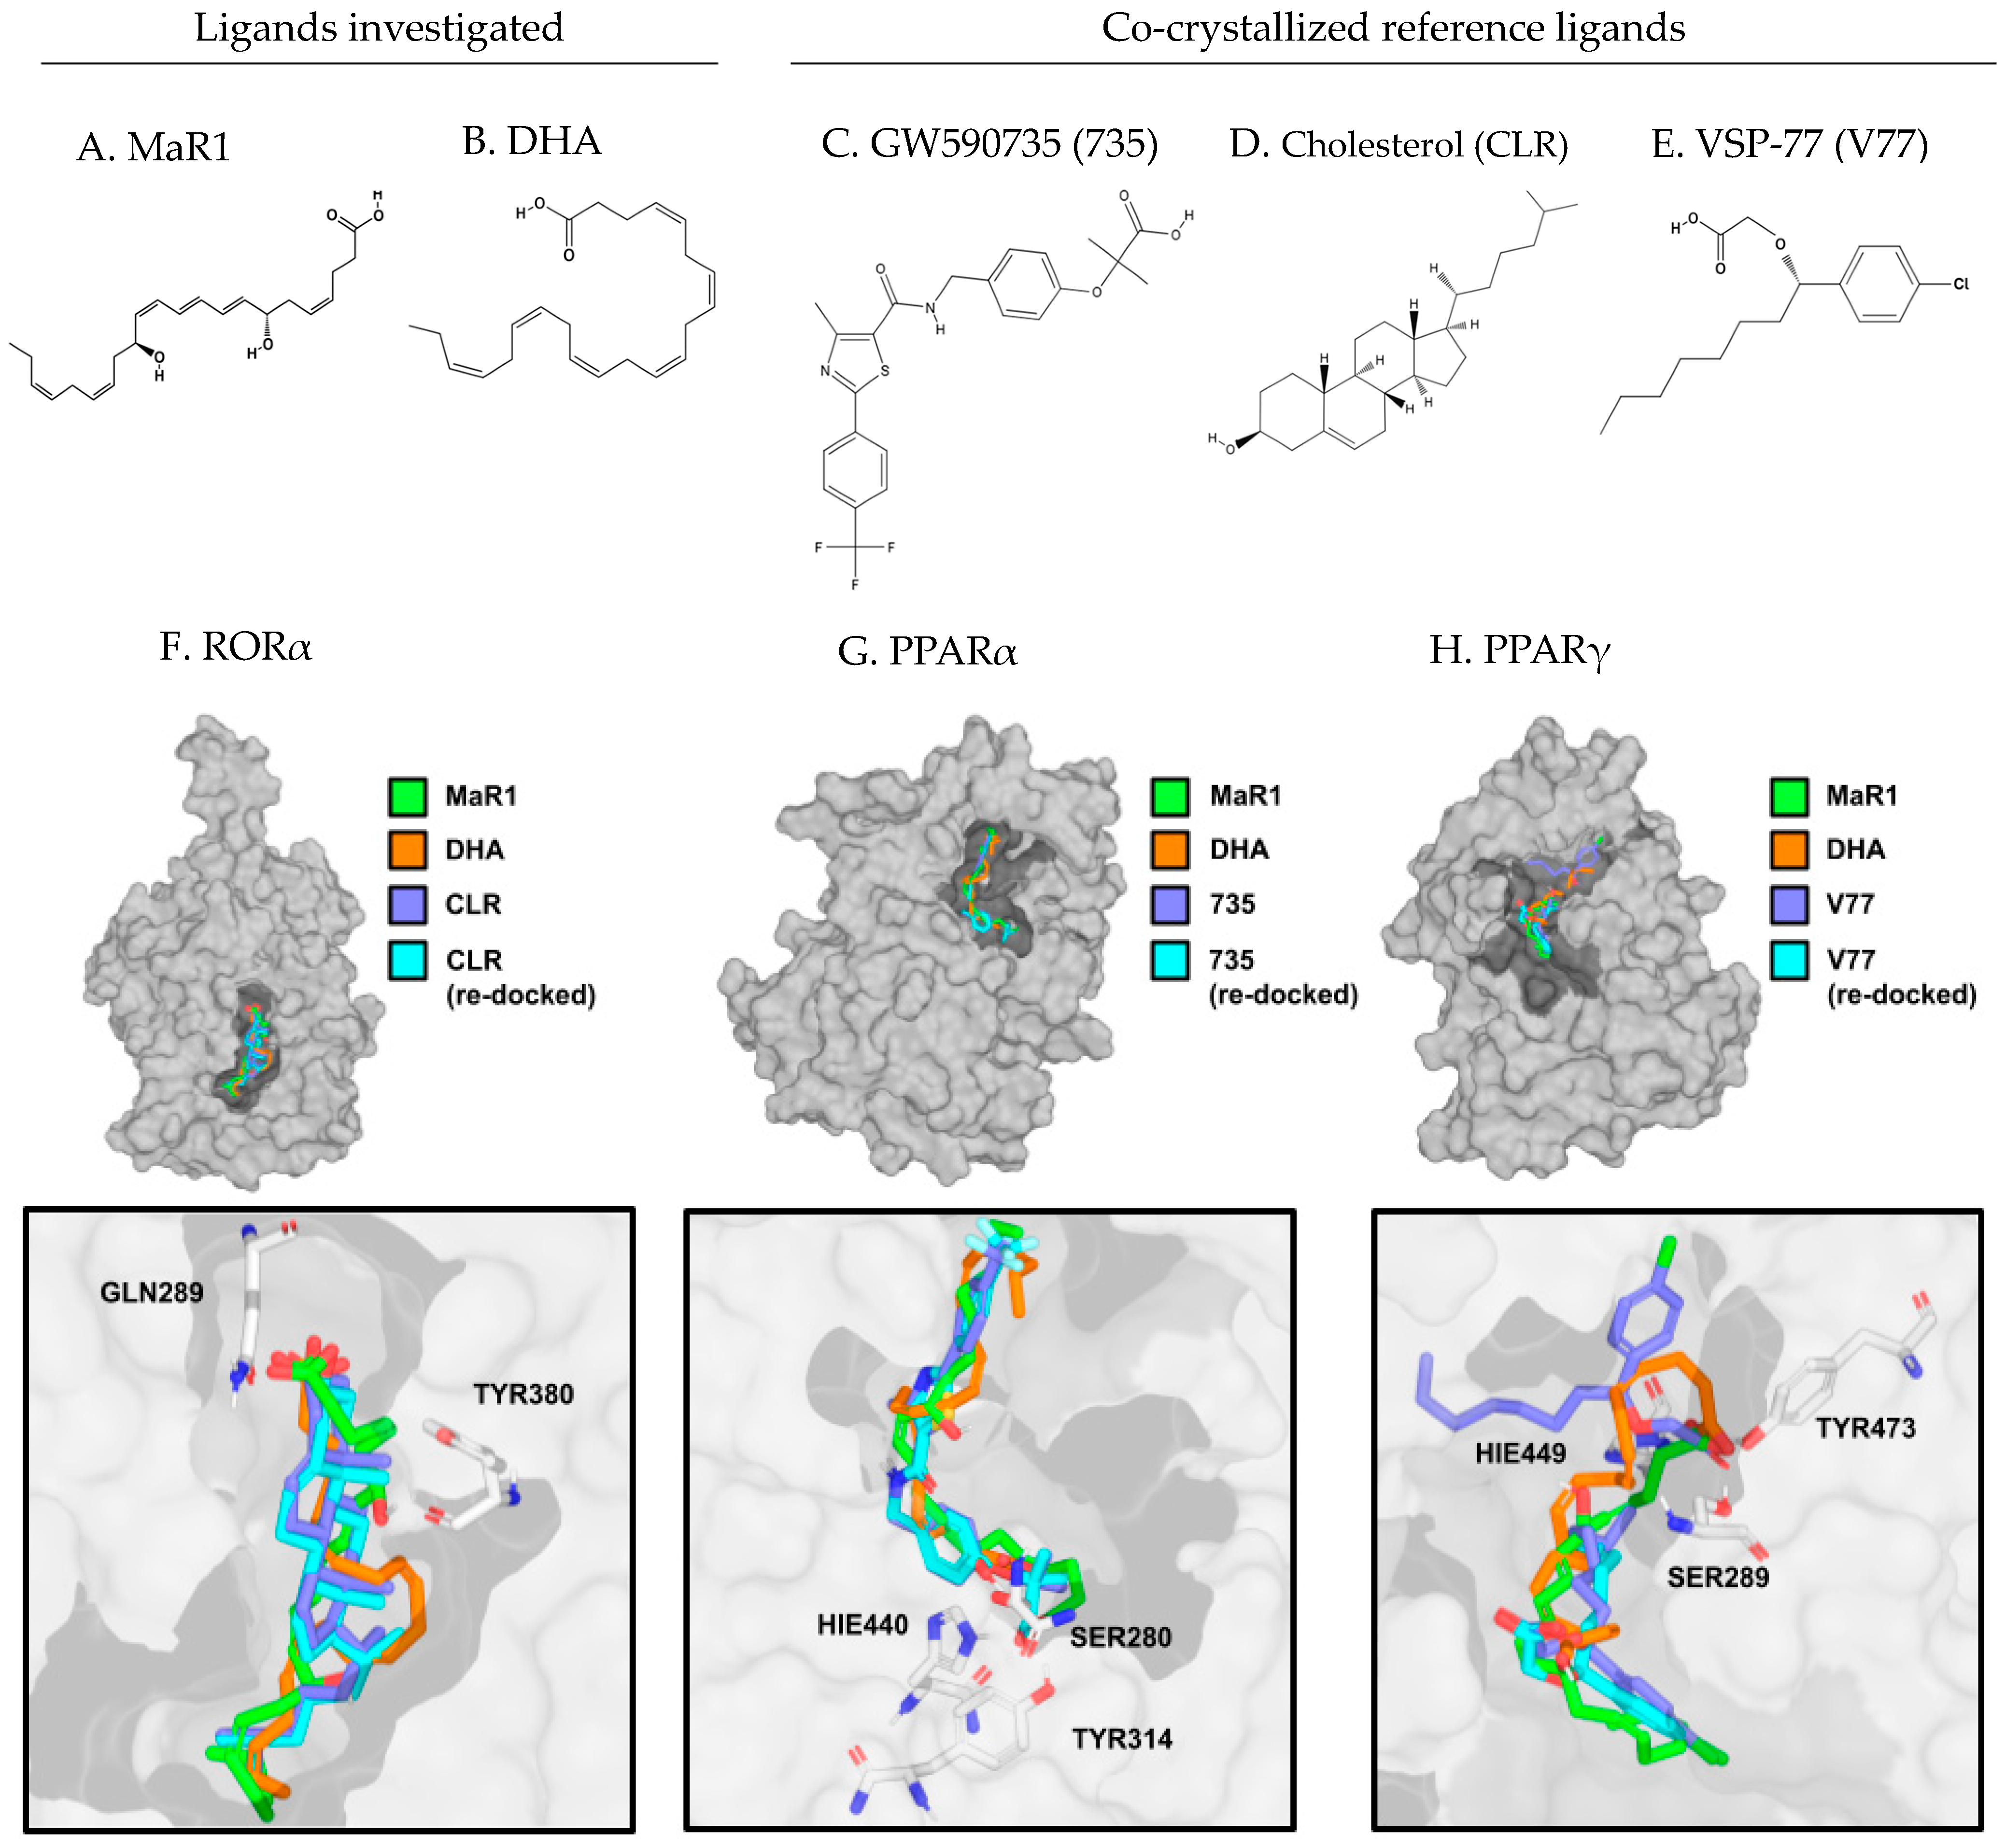
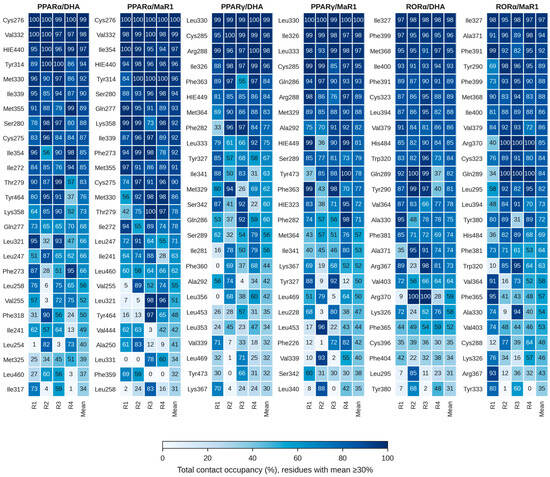
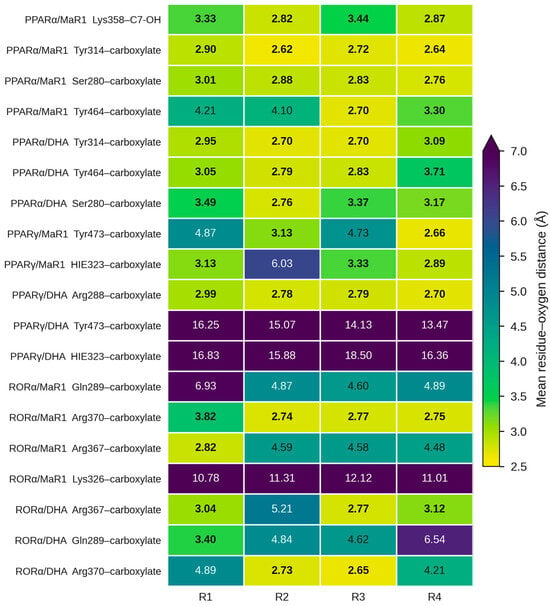
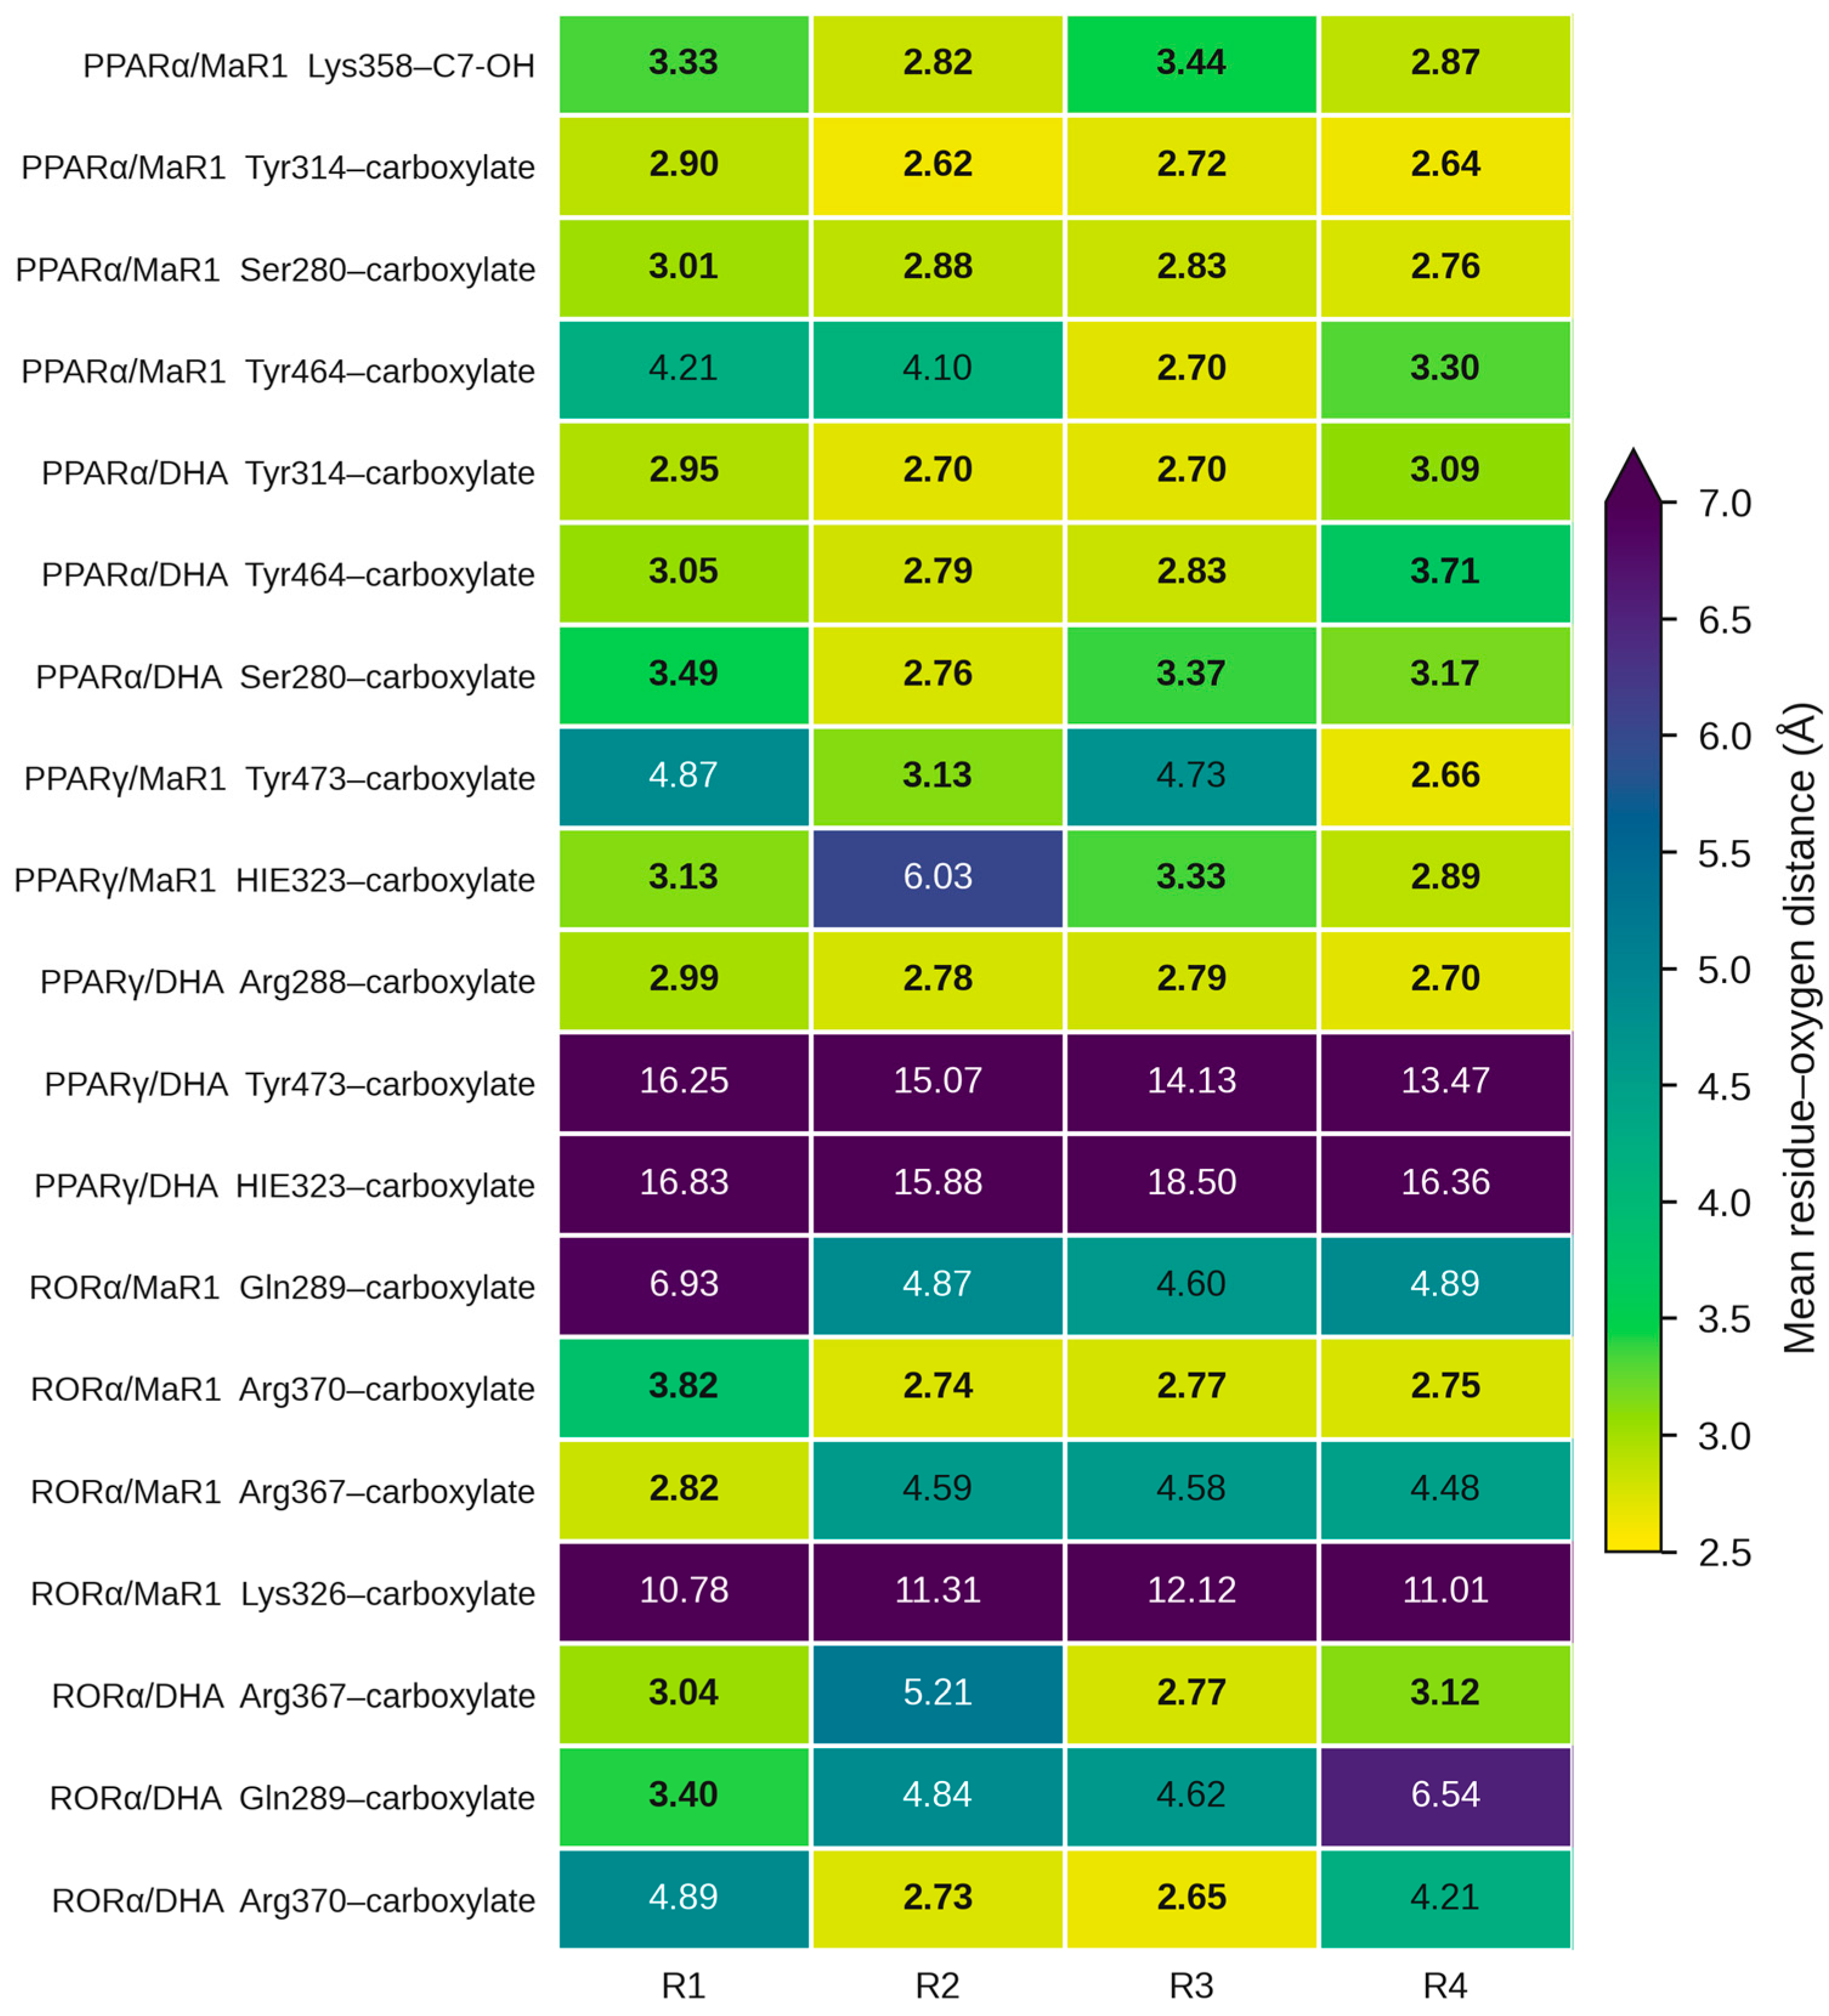
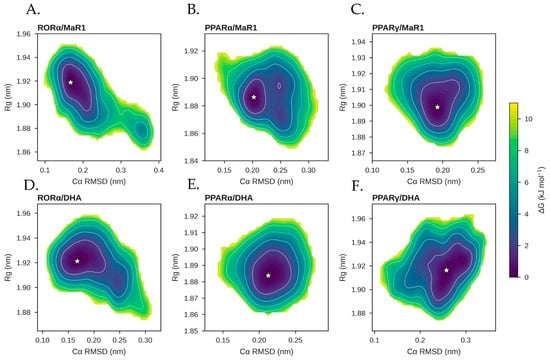
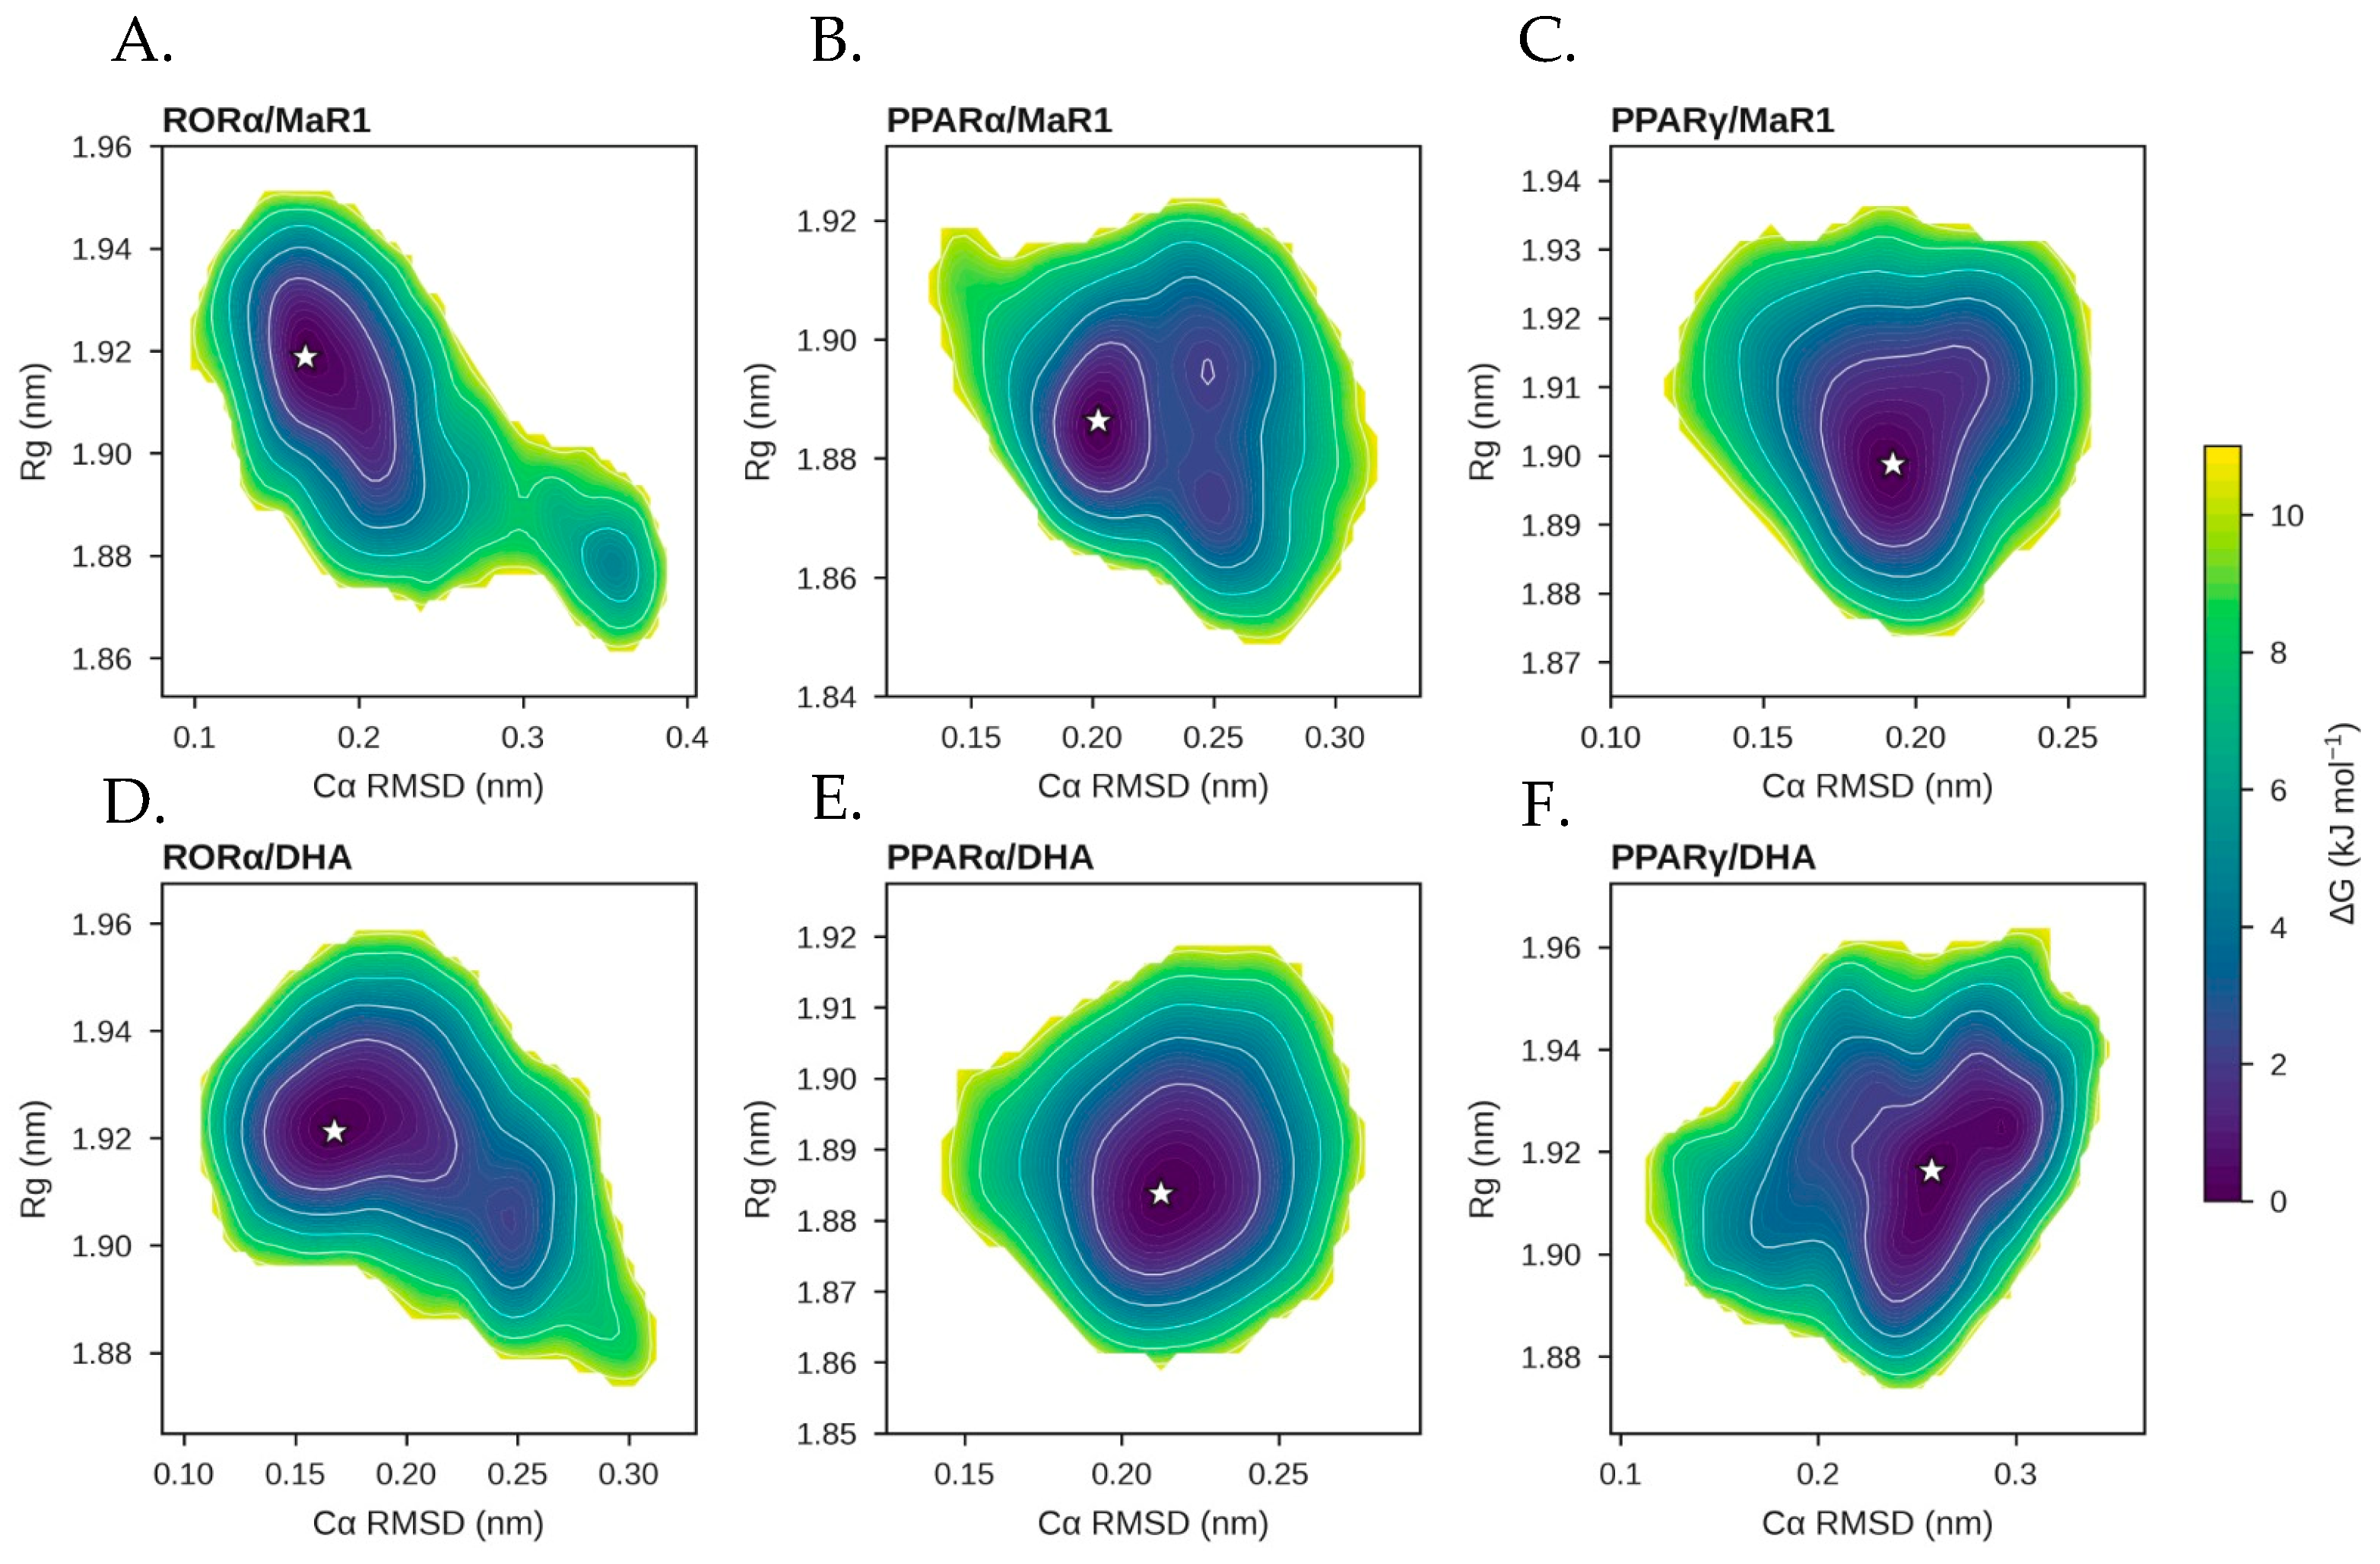
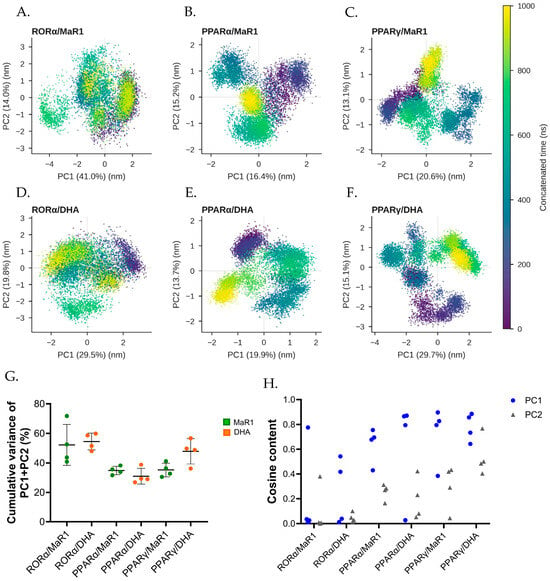
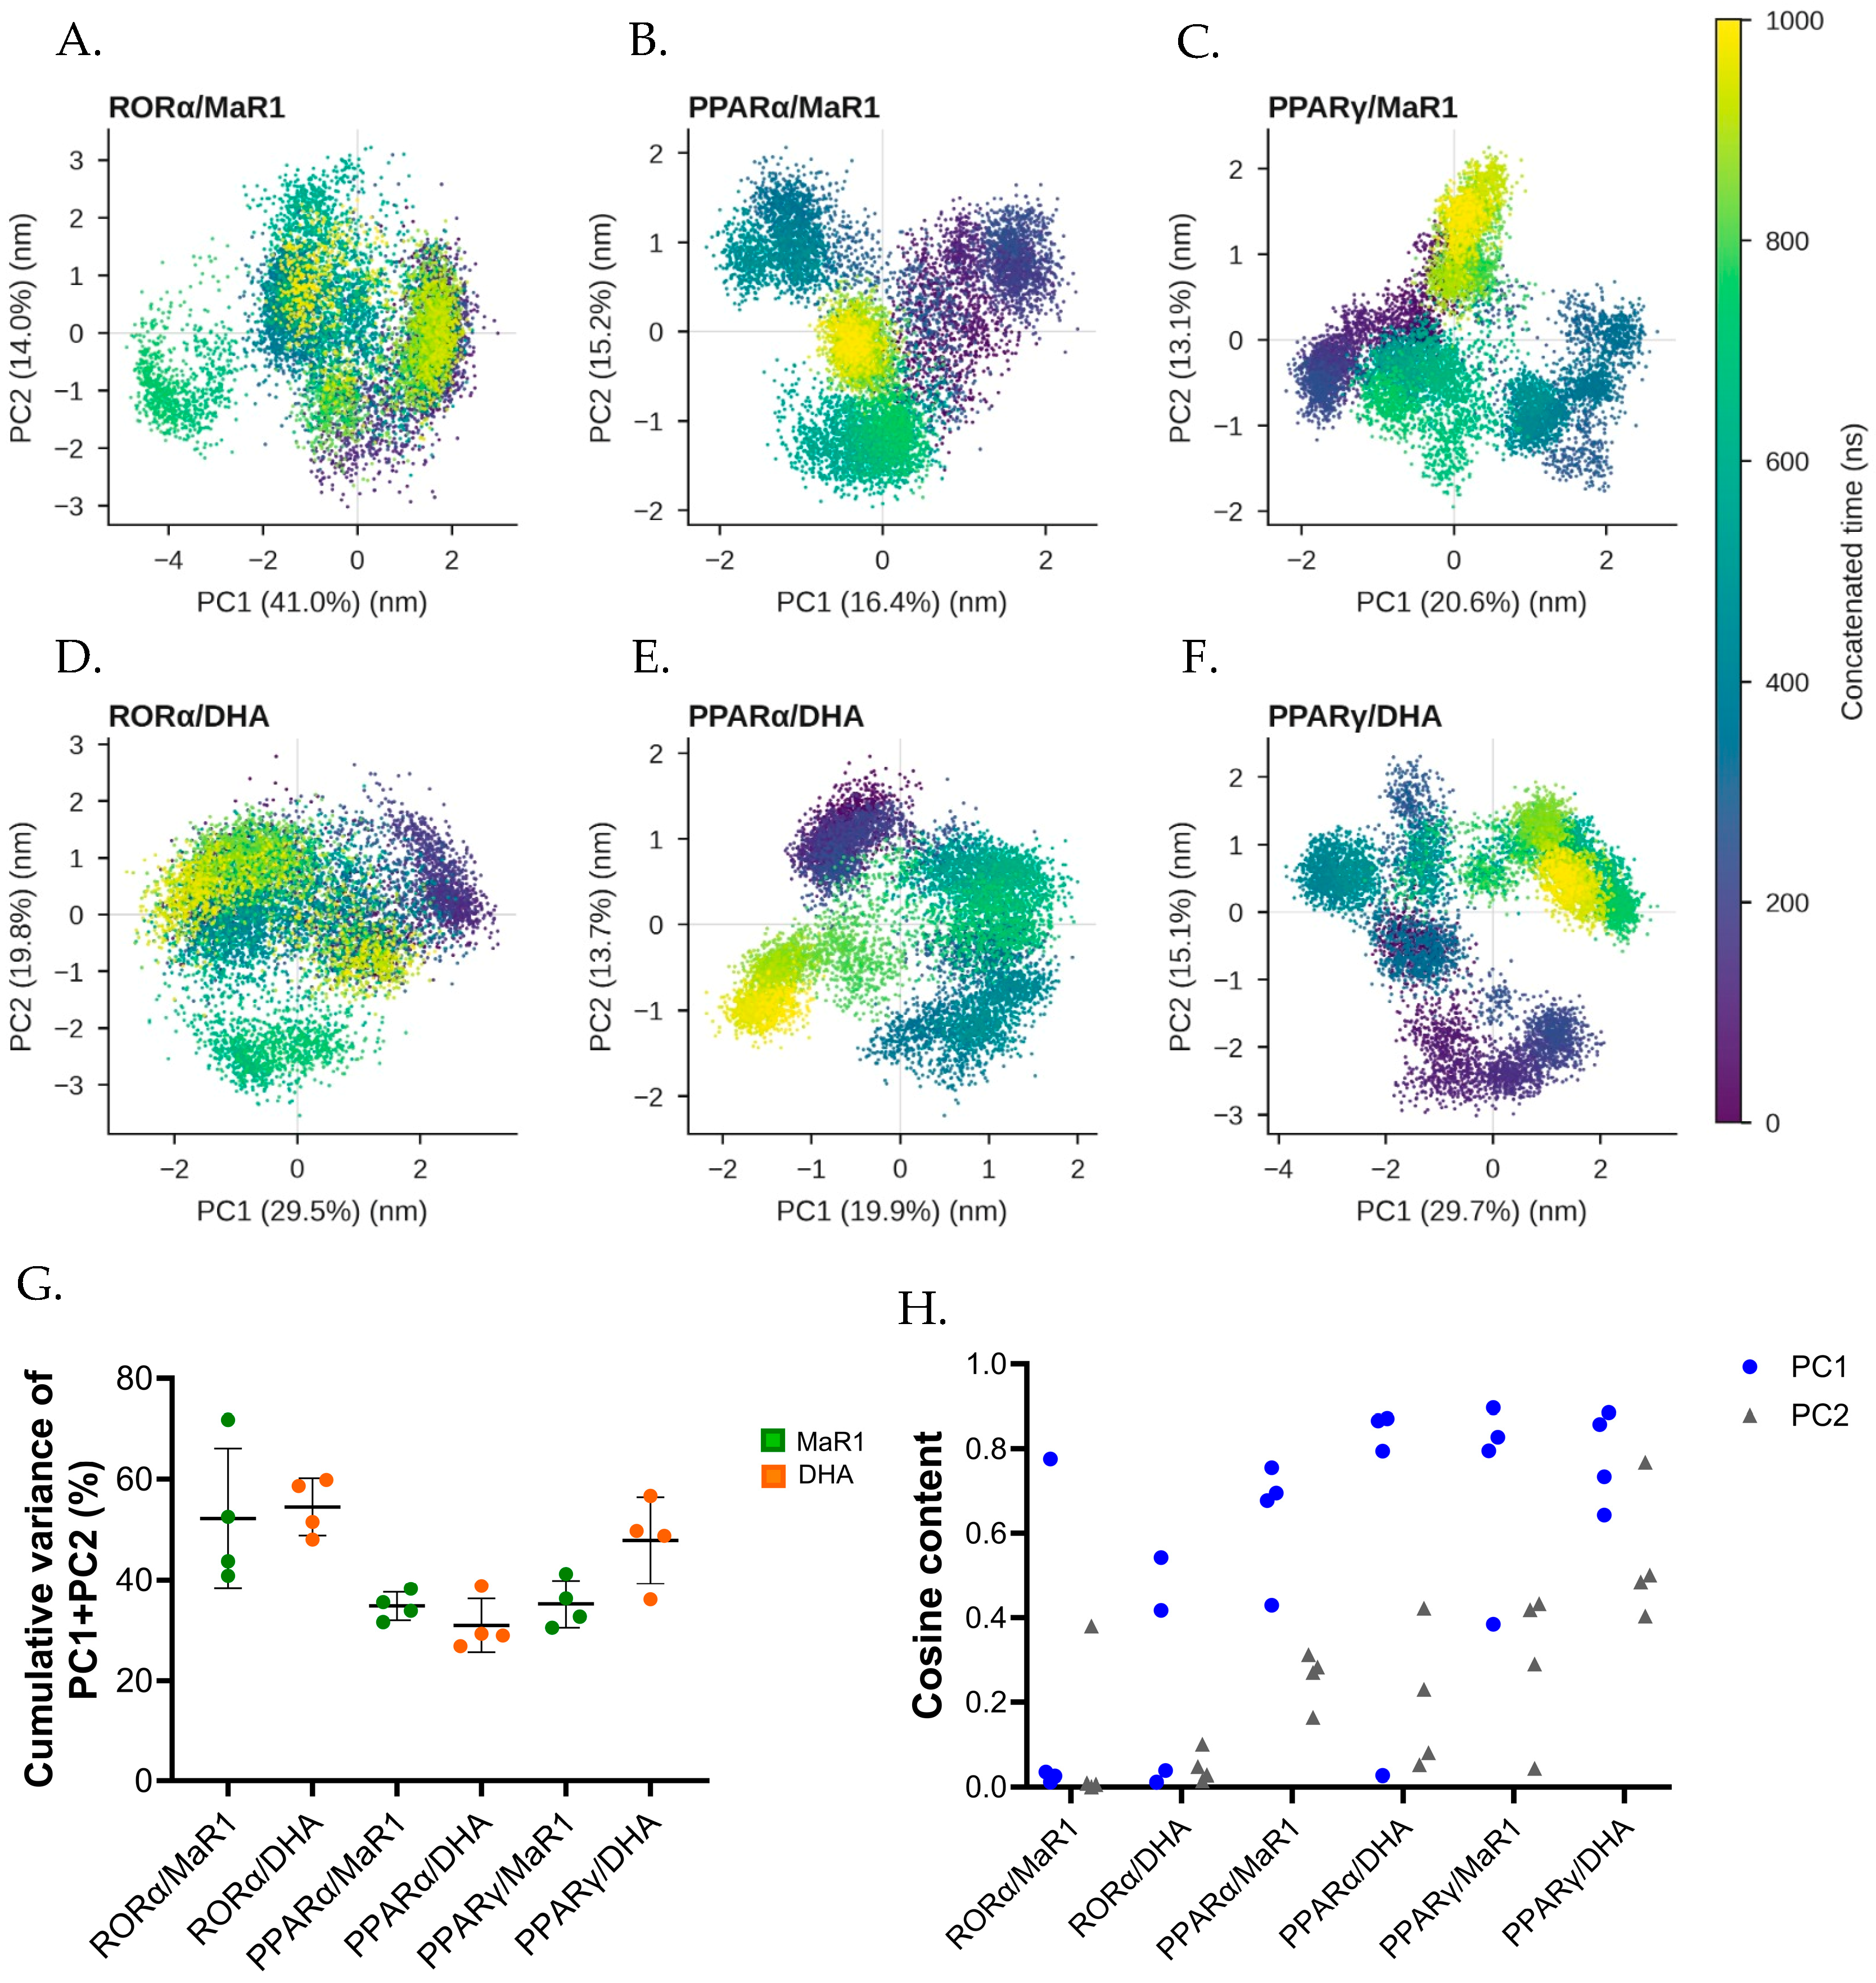
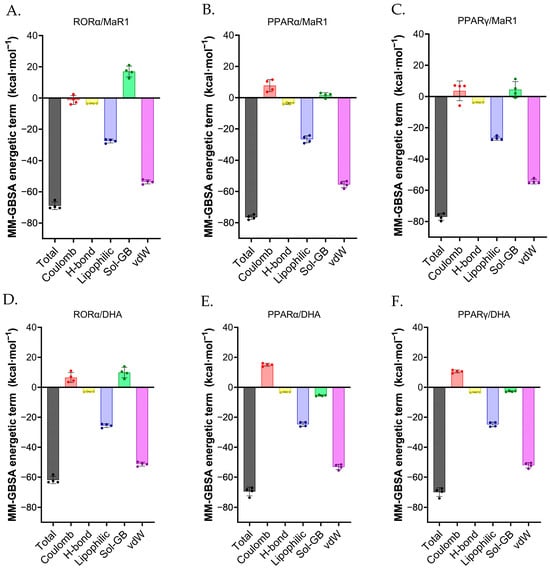
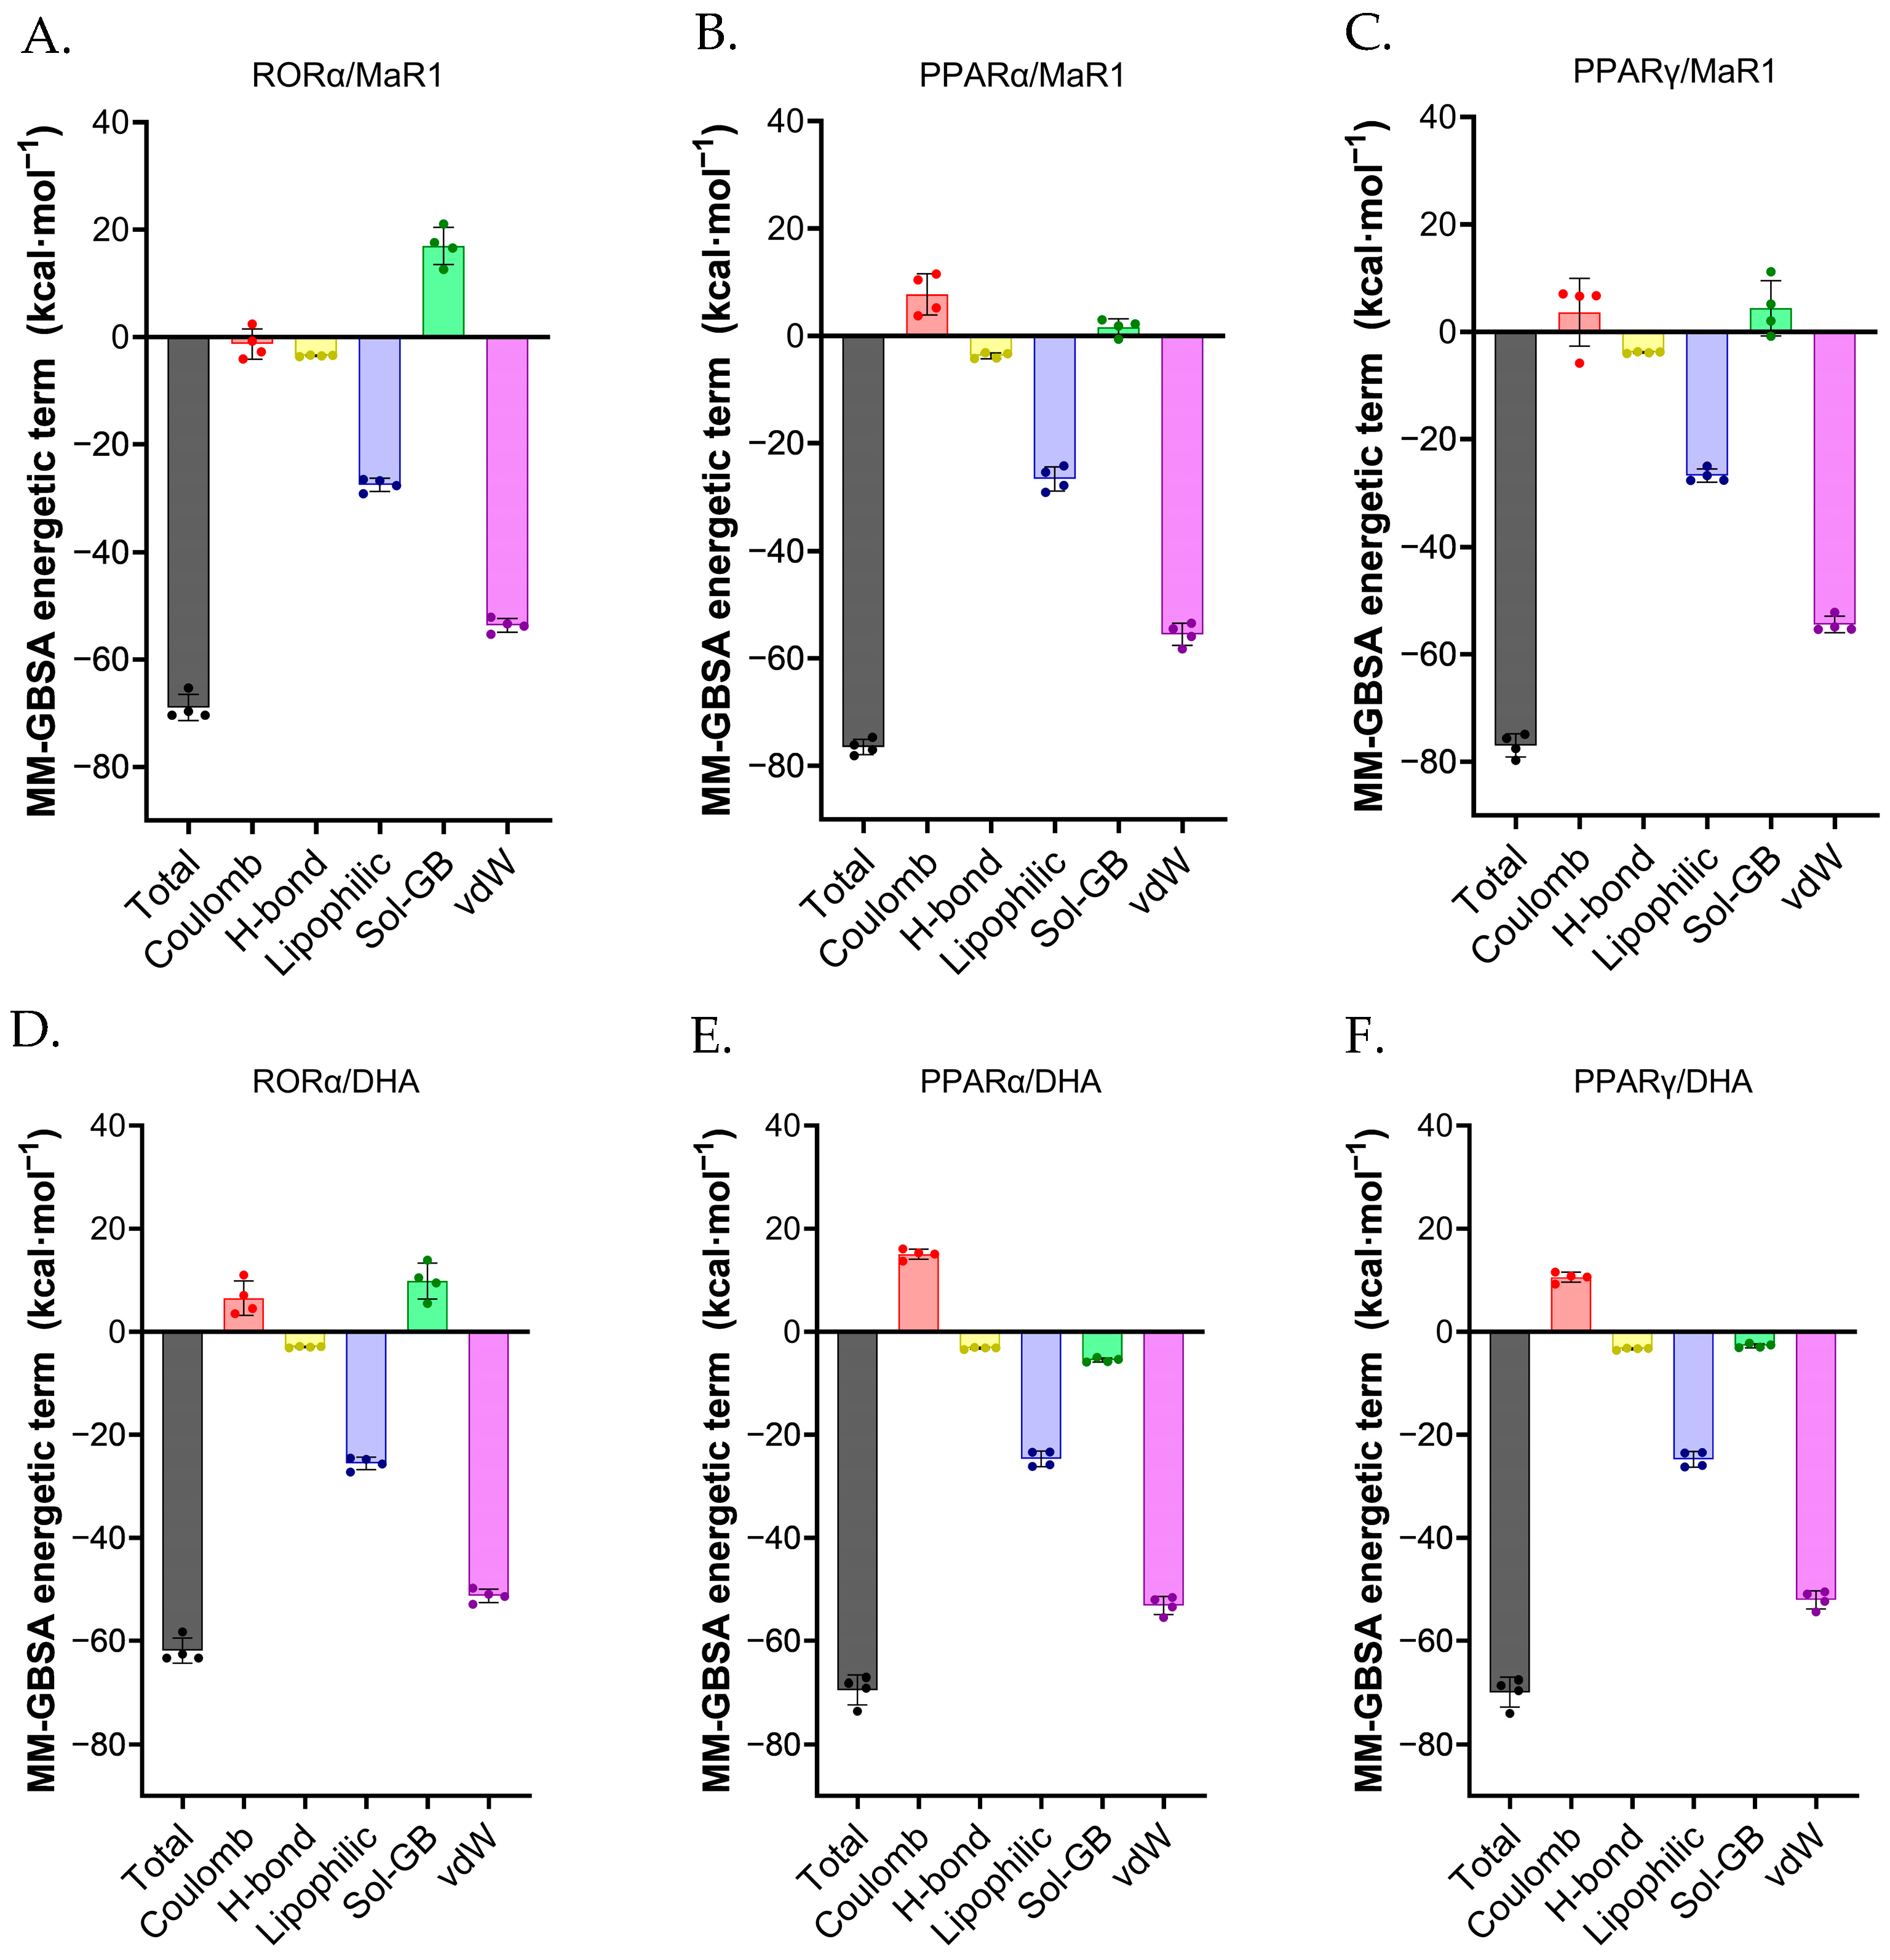
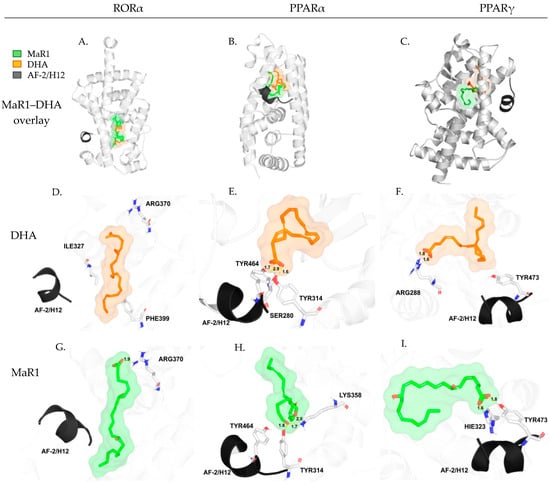
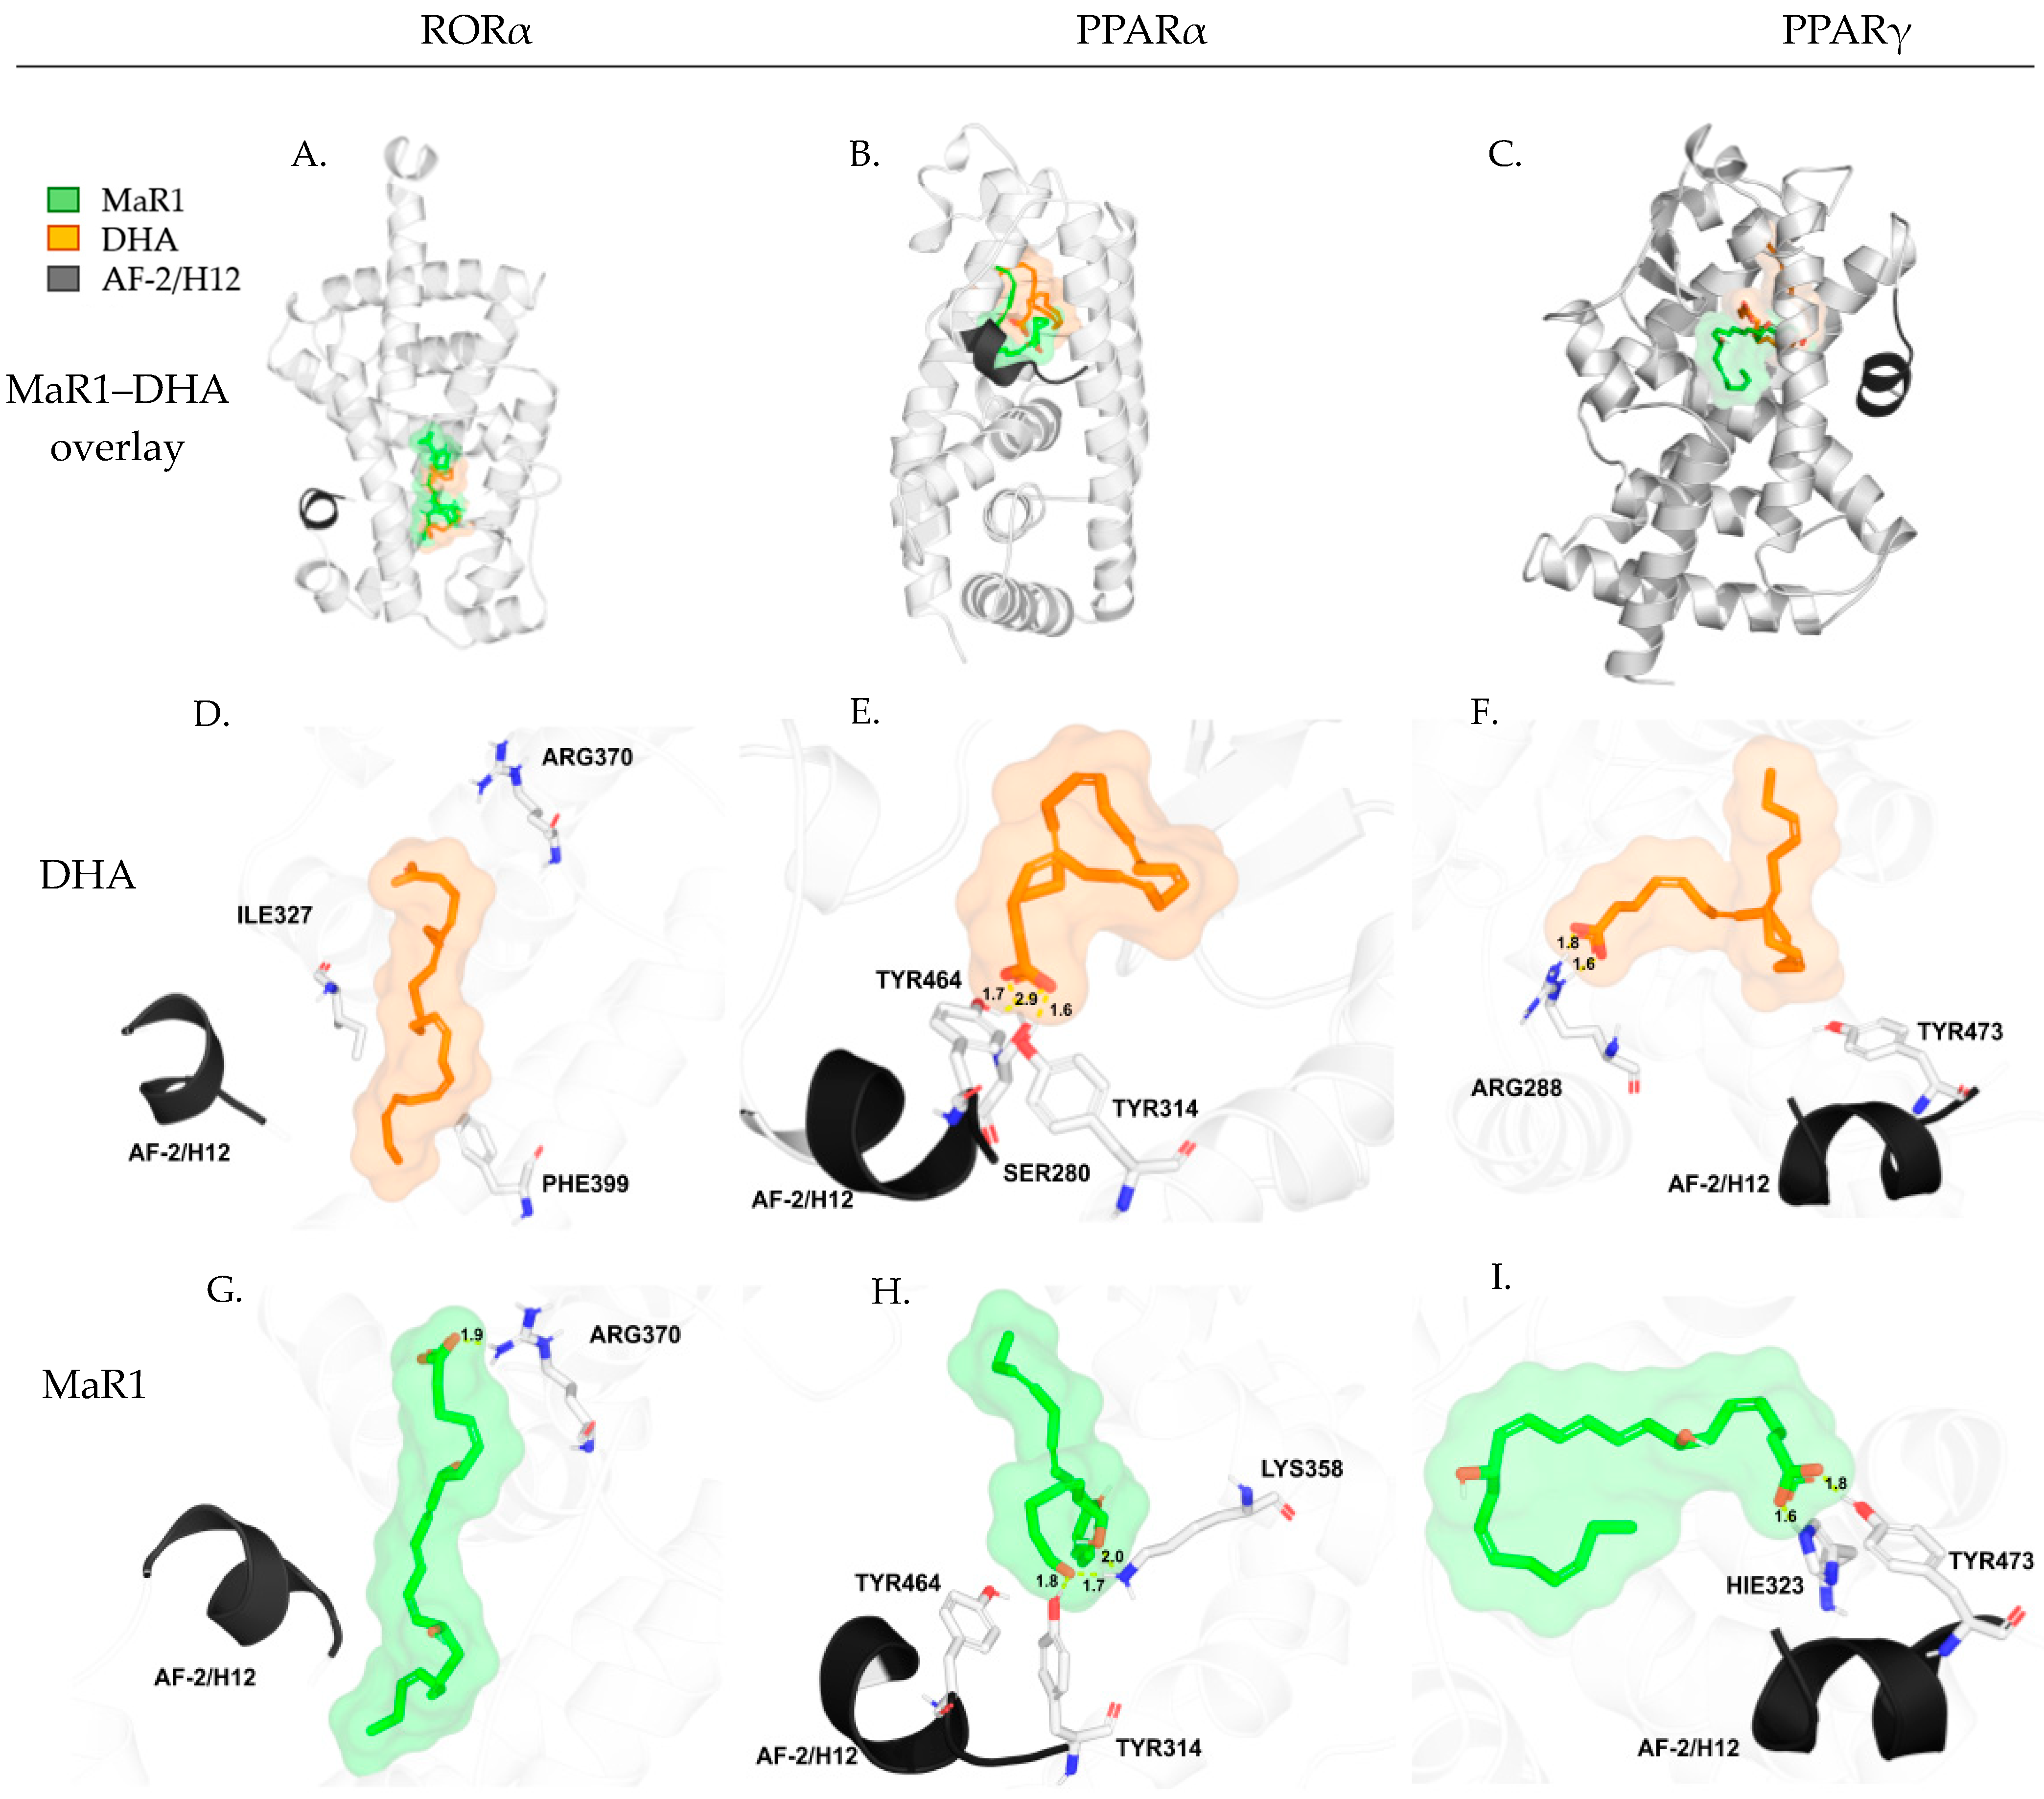
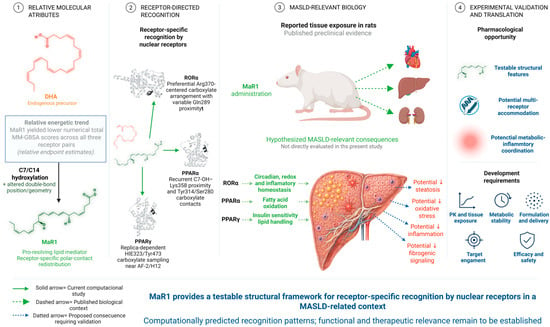
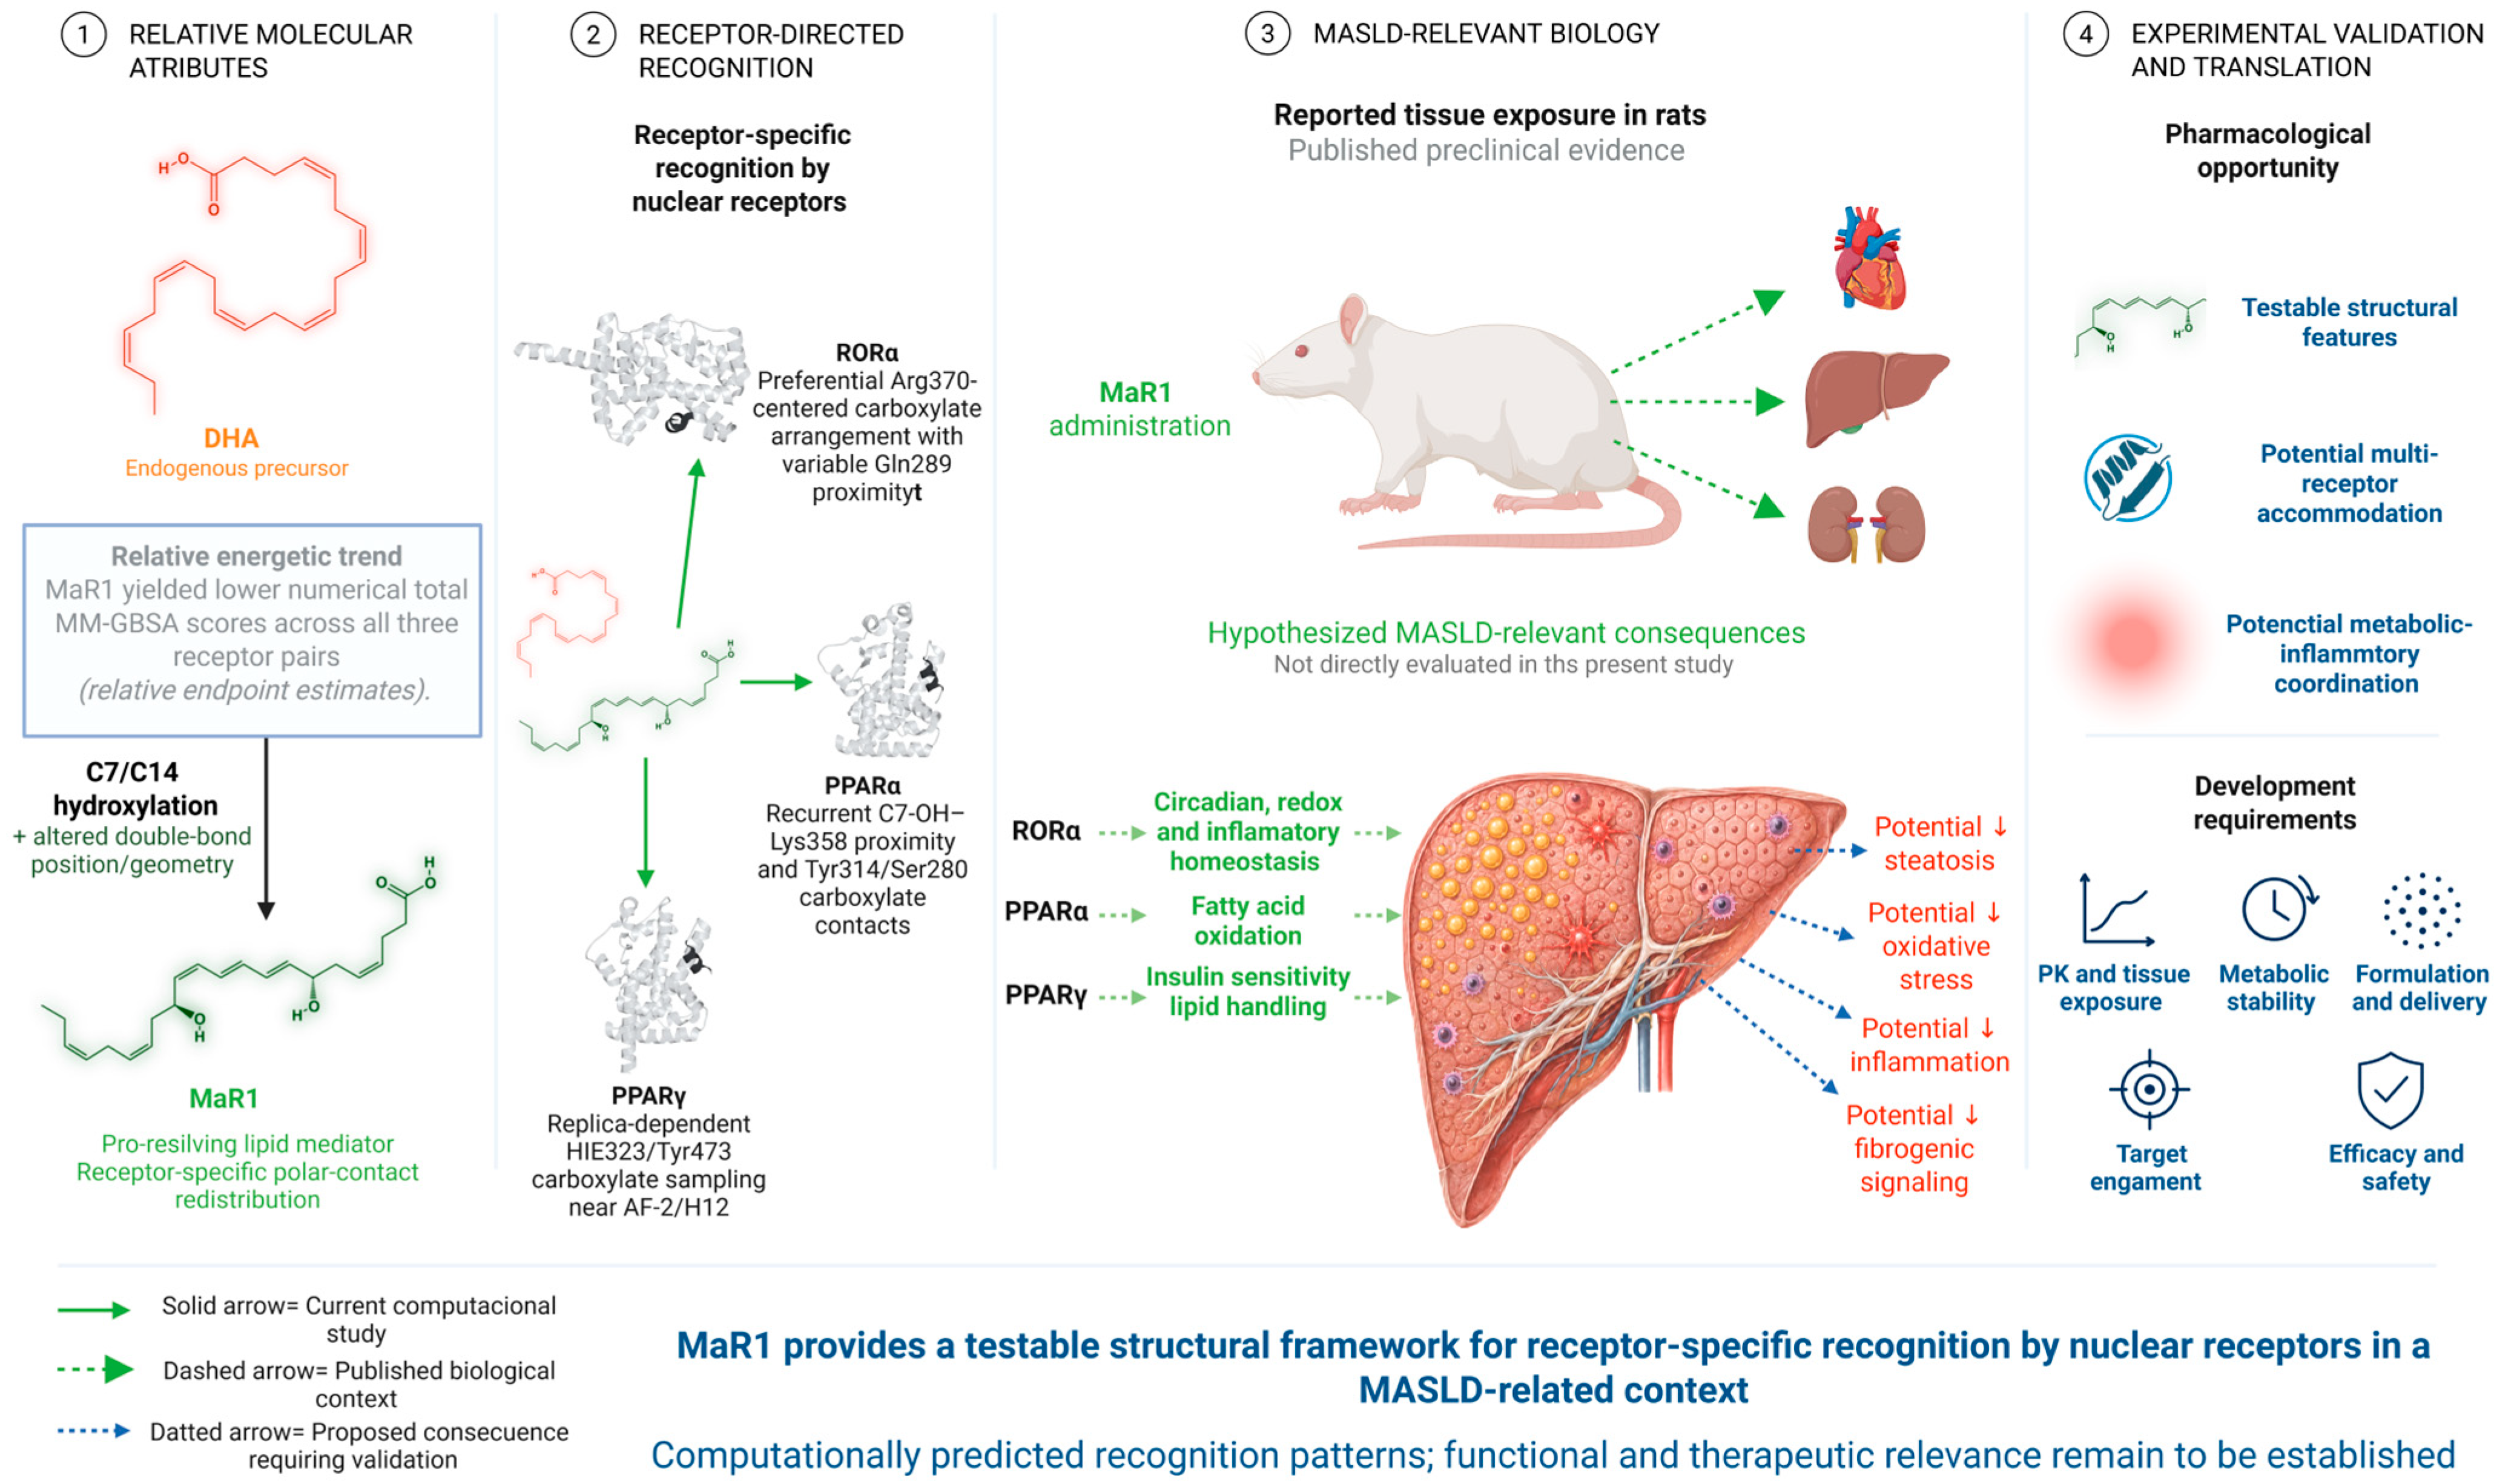

Disclaimer/Publisher’s Note: The statements, opinions and data contained in all publications are solely those of the individual author(s) and contributor(s) and not of MDPI and/or the editor(s). MDPI and/or the editor(s) disclaim responsibility for any injury to people or property resulting from any ideas, methods, instructions or products referred to in the content. |
© 2026 by the authors. Licensee MDPI, Basel, Switzerland. This article is an open access article distributed under the terms and conditions of the Creative Commons Attribution (CC BY) license.