


Abstract
Background/Objectives: Photodynamic therapy (PDT) generates tumour-killing oxidative damage, but cellular stress responses may limit its effects. We investigated whether low nanomolar concentrations of brusatol (BRU) can increase the efficacy of milder regimens of PDT in human A-431 epidermoid carcinoma cells. Methods: PDT was performed using the previously characterized P2.1 and P2.2 porphyrins. A-431 cells were exposed in vitro to PDT in the absence and presence of 20 nM BRU. Cellular viability, proliferation, and cellular electrical impedance, along with the expression changes of the HMOX1 and IL1B genes, were investigated. In vitro-treated A-431 cells were further implanted subcutaneously into immunocompromised mice to assess subsequent tumour growth. Results: In the context of PDT, BRU induced a late decrease in the number of metabolically active tumour cells, with no significant changes in LDH release. An early and persistent decrease in the cellular electrical impedance was induced by BRU and PDT+BRU. These effects were accompanied by a persistent decrease in the expression level of the redox HMOX1 gene and up-regulation of the inflammatory IL1B gene. The in vitro treatment of tumour cells with BRU and/or PDT and their implantation in immunocompromised mice resulted in a decrease in tumour volume, but the in vitro PDT+BRU combination did not bring a benefit compared with in vitro PDT alone. Conclusions: At low nanomolar concentrations, BRU can moderately increase the efficacy of milder PDT regimens in vitro. This is the first study to report that low BRU concentrations drastically inhibit cancer cell electrical impedance, with or without PDT, but the biological meaning needs further clarification. Nevertheless, it appears that repeated BRU administrations are needed to maintain its in vitro effect in the context of PDT.
1. Introduction
Non-melanoma skin cancers (NMSCs) are among the most common malignant diseases and mainly include basal cell carcinoma (BCC) and squamous cell carcinoma (SCC), together with other less frequent skin tumours. Several therapeutic approaches are currently available for NMSC treatment, including surgical excision, radiotherapy, systemic targeted therapies, immunotherapy, and photodynamic therapy (PDT) [1,2]. Among these therapeutic options, PDT represents a non-invasive targeted approach that can be particularly useful in superficial and multiple skin lesions and can provide good cosmetic results [3,4].
PDT is based on the administration of a photosensitizer that is non-cytotoxic in the “dark”, followed by targeted tumour irradiation with light of an appropriate wavelength. After light absorption, the photosensitizer reaches an excited state and generates mainly singlet oxygen but also other reactive oxygen species (ROS), which induce oxidative damage and finally tumour cell death [5]. Moreover, PDT can induce local hypoxia and can influence the antitumour immune response, which contributes to its therapeutic effect [6].
Porphyrins and other tetrapyrrolic derivatives have been extensively investigated as photosensitizers due to their favourable photophysical properties and their ability to generate ROS after irradiation [7]. The biological effect of PDT depends both on the properties of the photosensitizer and on the capacity of tumour cells to respond to the oxidative stress generated during the treatment [8].
PDT efficacy may be limited by the activation of signalling pathways involved in cellular protection and adaptation to oxidative stress following the ROS burst generated during PDT [4,9]. Among the generated stress proteins is nuclear factor erythroid 2-related factor 2 (NRF2), a cytoprotective transcription factor that regulates many genes involved in antioxidant defence, detoxification, and cellular metabolism [10]. Under physiological conditions, NRF2 protects cells against oxidative and electrophilic stress induced by various types of stressors. However, it also has a “dark” side. Increased basal NRF2 activity has been reported in many types of malignant cells, where it favours cell survival and proliferation and confers resistance to therapies based on oxidative stress, such as PDT and radiotherapy [11,12].
Therefore, pharmacological inhibition of the NRF2 pathway could improve the antitumour effect of PDT by reducing tumour cells’ ability to counteract PDT-induced oxidative stress. Nevertheless, the currently available NRF2 inhibitors have several limitations, including reduced selectivity and an unfavourable pharmacological profile that limit their use for chronic treatment in cancer [13]. Moreover, only a limited number of compounds are available for inhibiting the NRF2 pathway [12,14]. Brusatol (BRU), a quassinoid compound extracted from Brucea javanica, has been frequently used as an experimental inhibitor of NRF2 signalling at nanomolar concentrations [15]. Its action is not highly specific, as other short-lived proteins, like stress proteins, are downregulated through the inhibition of both cap-dependent and cap-independent protein translation [16]. This mode of action makes BRU interesting for downregulating, at multiple levels, the complex stress response triggered by PDT, to increase its efficacy [17]. Moreover, BRU has definite antitumour activity, as recently reviewed in [15], but its chronic use is limited by severe side effects such as hypotension, nausea, and vomiting [18]. Accordingly, a combined therapy with PDT and lower, less toxic doses of BRU could increase PDT efficacy by downregulating the stress response and, for a short period, combining the cytotoxic potential of BRU and PDT while limiting potential side effects.
In the present study, we investigated the in vitro effect of BRU on human A-431 epidermoid carcinoma cells exposed to porphyrin-mediated PDT, addressing cellular viability and proliferation, cellular electrical impedance, and changes in the expression of the redox-related HMOX1 and inflammatory IL1B genes as stress proteins whose expression is increased following PDT. Further, in vitro-treated cells were implanted in immunocompromised mice, and tumour progression was investigated. This is a preliminary proof-of-concept study aiming to test the efficacy of BRU-PDT combined therapy, without going deeper into the underlying mechanisms.
2. Materials and Methods
2.1. Reagents
BRU and sulforaphane (SFN) were purchased from Sigma-Aldrich (St. Louis, MO, USA). Stock solutions of 10 mM and 100 mM were prepared in dimethyl sulfoxide (DMSO) (Sigma-Aldrich, St. Louis, MO, USA), kept frozen at −18 °C, and further diluted in complete cell culture medium immediately before use. The complete culture medium contained DMEM/F12 culture medium with GlutaMAX (Gibco, Thermo Fisher Scientific, Waltham, MA, USA) supplemented with 10% fetal bovine serum (FBS, Sigma-Aldrich, St. Louis, MO, USA), and 1% penicillin–streptomycin (Sigma-Aldrich, St. Louis, MO, USA).
The symmetric porphyrin derivative P2.1 (5,10,15,20-tetrakis-(4-acetoxy-3-methoxyphenyl) porphyrin) and the asymmetric derivative P2.2 (5-(4-hydroxy-3-methoxyphenyl)-10,15,20-tris-(4-acetoxy-3-methoxyphenyl) porphyrin) were synthesized and characterized as previously reported by our group [19,20]. Porphyrin stock solutions (10 mM) were prepared in polyethylene glycol 200 (PEG 200) and stored at room temperature in the dark. Working solutions were made in DMEM/F-12 culture medium with GlutaMAX (Gibco, Thermo Fisher Scientific, Waltham, MA, USA) supplemented with 2% FBS (Sigma-Aldrich, St. Louis, MO, USA) and 1% penicillin–streptomycin (Sigma-Aldrich, St. Louis, MO, USA) as a porphyrin-loading culture medium. Porphyrin solutions and porphyrin-loaded cells were handled under reduced-light conditions to avoid accidental activation of photosensitizers, except during controlled laser irradiation at 635 nm for PDT. The tested P2.1 and P2.2 did not exhibit “dark” toxicity in A-431 epidermoid carcinoma cells, as demonstrated using the MTS reduction assay (Supplementary Materials, Figure S1).
2.2. Cell Culture
Human A-431 epidermoid carcinoma cells (CRL-1555) and human HT-29 colon adenocarcinoma cells (HTB-38) were obtained from the American Type Culture Collection (ATCC, Manassas, VA, USA). Cells were maintained in complete culture medium at 37 °C in a humidified 5% CO2 atmosphere. Cells were periodically detached using 0.05%/0.02% trypsin–EDTA (Biochrom AG, Merck Millipore, Burlington, MA, USA) and were counted using a Bürker–Türk chamber (Paul Marienfeld, Lauda-Königshofen, Germany) with the 4% Trypan blue exclusion test. Cells with viability exceeding 95% and a stable multiplication rate were used in experiments at passages 3–10.
2.3. Photodynamic Therapy
In PDT experiments, 500,000 cells were seeded in 35 mm culture dishes in complete culture medium and were allowed to adhere for 24 h. The complete culture medium was changed to porphyrin-loading culture medium containing the porphyrin photosensitizers P2.1 or P2.2, and cells were further incubated for 18 h. Before PDT, the porphyrin-containing loading culture medium was removed and replaced with 1 mL Hank’s balanced salt solution supplemented with 2% FBS and 1% penicillin–streptomycin (PDT culture medium). PDT was performed at room temperature using a Modulight ML6600 system (Modulight Inc., Tampere, Finland) equipped with a 635 nm laser and software-controlled irradiation parameters. Cells received a fluence of 5 J/cm2 at an irradiance of 30 mW/cm2 for an irradiation time of 167 s. Control cultures were not loaded with photosensitizers, were not exposed to PDT, were maintained at room temperature in the dark, and were manipulated exactly as PDT-exposed samples.
After PDT, the PDT culture medium was replaced with complete culture medium in the presence and absence of BRU, as described below at point 2.4.
2.4. BRU and SFN Administration
For BRU-mediated sensitization, cells were exposed 1 h before PDT to 20 nM BRU (first BRU application). Since PDT was performed after removal of the BRU-containing culture medium, 20 nM BRU in fresh complete culture medium was added to the cell culture immediately after PDT (second BRU application) to restore the concentration of BRU to which cells were exposed. At approximately 2 h after irradiation, cells were detached with 0.05%/0.02% trypsin–EDTA (Biochrom AG, Merck Millipore, Burlington, MA, USA) and temporarily suspended in the BRU-containing culture medium in which they were incubated during the last 2 h, until cells were repeatedly washed by centrifugation in phosphate-buffered saline (PBS, Sigma-Aldrich, St. Louis, MO, USA) to remove trypsin/EDTA. Finally, cells were suspended in complete cell culture medium with or without 20 nM BRU and were counted in a Bürker–Türk chamber using the 4% Trypan blue exclusion test. Part of these cells were used for the MTS reduction assay, the lactate dehydrogenase (LDH) release assay, and for assessing gene expression changes. The remaining cells, in the presence and absence of 20 nM BRU (third application of BRU), were replated to perform various cellular assays at 24 h and 48 h after PDT and to dynamically measure electrical cellular impedance over more than 100 h. The aforementioned BRU applications were not additive but were intended to maintain a constant BRU concentration (20 nM) in cell cultures before PDT, immediately after PDT, and after replating cells for long-term measurements.
To boost the KEAP1-NRF2 system before PDT, SFN was added to cell cultures 90 min before PDT and 30 min before the first BRU addition.
2.5. Functional Cellular Assays
Cells were counted after the 2 h incubation performed post-PDT (see point 2.4). The density of cells in the control sample containing non-treated cells was considered a reference for treated samples. The cell culture volume containing the number of cells specific for each functional assay was determined for the control culture. The same volume of treated cultures, containing the desired number of control cells, was used in the assay, thus allowing measurement of the cytotoxic potential of various treatments.
Cells were cultivated in 96-well plates for the MTS reduction assay and the Lactate Dehydrogenase Release Assay, and in E-plates for electrical cellular impedance measurement.
2.5.1. The MTS Reduction Assay
The number of metabolically active cells in culture was evaluated using the CellTiter 96® AQueous One Solution Cell Proliferation Assay (MTS; Promega Corporation, Madison, WI, USA) according to the manufacturer’s instructions. Briefly, MTS reagent (20 µL) was added to each well containing 100 µL of cell suspension, followed by incubation of samples for 90 min at 37 °C in 5% CO2. The absorbance (OD) was recorded at 490 nm against a 620 nm reference wavelength using a Sunrise microplate reader with Magellan software v6.5 (Tecan, Männedorf, Switzerland). Corrected OD (corr. OD) values were obtained by subtracting the mean OD of cell-free complete medium from the OD of each sample. Replicates (generally, triplicates) were averaged within each independent experiment. Treatment effects were calculated within each experiment as (corr. OD of the treated sample/mean corr. OD of the corresponding control) × 100.
2.5.2. Lactate Dehydrogenase Release Assay
Loss of plasma membrane integrity was evaluated by measuring lactate dehydrogenase (LDH) release using the CytoTox 96® Non-Radioactive Cytotoxicity Assay (Promega Corporation, Madison, WI, USA). Cell-free culture supernatant (50 µL) from cell cultures was transferred to a 96-well plate and mixed with 50 µL of LDH substrate. After 30 min incubation at room temperature in the dark, stop solution (50 µL) was added, and OD was measured at 490 nm using the Sunrise microplate reader (Tecan, Männedorf, Switzerland) and Magellan software v6.5. Corr. OD values were obtained by subtracting the mean OD of cell-free culture medium from the OD values of test samples. Replicates (generally, triplicates) were averaged within each experiment, and the effect of treatment was calculated as (corr. OD of the treated sample/mean corr. OD of the corresponding control) × 100.
2.5.3. Real-Time Electric Cellular Impedance Measurements
Electrical cellular impedance, which provides dynamic information on the adhesion, spreading, morphology changes, and proliferation of adherent cells, was measured in real time using the xCELLigence platform and E-plates 16 (xCELLigence RTCA MP—Multiple Plates, Agilent Technologies, Santa Clara, CA, USA). Briefly, E-plates containing 100 µL of complete medium/well, with or without 2-fold concentrated modulators, were measured to assess the background signal. At least duplicate samples were made for each sample type. The cell suspensions were then added to E-plates. The cellular electrical impedance was measured continuously for more than 100 h using the xCELLigence RTCA Software Pro (version 2.0.0.1301). The impedance across the gold microelectrodes of the E-plate wells, assessed at each time point, was automatically converted using the aforementioned software into a dimensionless cell index (CI). CI quantitatively reflects cell status, including number, membrane area adhered to the electrode, and the adhesion strength on the plate. Results were presented as the mean value of CI ± standard deviation (SD) for replicate samples.
2.6. Gene Expression Changes
Suspension cells at 3 h post-PDT and adherent cells at 48 h post-PDT were homogenized in RiboZol reagent (VWR Life Science) and kept until RNA isolation at −70 °C. Total RNA was isolated using RiboZol according to the protocol provided by the manufacturer. RNA quantity and purity were evaluated with a NanoDrop 2000 spectrophotometer (Thermo Fisher Scientific, Waltham, MA, USA). For reverse transcription, total RNA (600 ng) from each sample was processed using the RT2 First Strand Kit (Qiagen, Hilden, Germany) according to the manufacturer’s protocol. The expression level of two genes of interest, HMOX1 and IL1B, was assessed using the RT2 Profiler™ PCR Assay in combination with RT2 SYBR® Green qPCR Mastermix (Qiagen, Hilden, Germany). Amplification and fluorescence detection were performed on an ABI 7500 Fast Real-Time PCR System (Thermo Fisher Scientific, Waltham, MA, USA). For normalization of gene expression data, six candidate housekeeping genes (IPO8, RPLP0, EIF2B1, RPS13, HPRT1, and RPS23) were chosen based on the literature [17,21,22,23,24,25]. The geometric mean of the two most stable reference genes, RPS23 and RPLP0, selected using the RefFinder tool [26], was used to normalize the expression levels of HMOX1 and IL1B genes. Gene expression levels were calculated using the 2−ΔCt method, and the normalized data were used for statistical analysis. Fold change (FC) was calculated by dividing the mean 2−ΔCt value of test samples by the corresponding mean value of the control samples.
2.7. In Vivo Tumour-Growth Experiment
Forty female athymic homozygous nude mice (strain code 490, Charles River Laboratories International, Inc., Wilmington, MA, USA), aged 29–35 days at receipt, with a body weight of 24.7 ± 1.7 g, were used after acclimatization under specific conditions (constant temperature of 22 ± 2 °C, humidity of 55 ± 10%, and 12 h dark–light cycles). Mice had free access to granulated food and water. The animal study was approved by the Ethics Committee of Victor Babeș National Institute of Pathology, Bucharest, Romania (authorization no. 17/24, September 2025). All procedures were performed in accordance with institutional and applicable national and European requirements for the use of laboratory animals.
A-431 cells assigned to the animal study were treated in vitro according to the protocol described above before being inoculated into mice. BRU was not administered to the animals.
Mice were randomly allocated to four groups (CTRL, BRU, PDT, or PDT+BRU) of ten animals each. Mice were inoculated subcutaneously with the same volume of cell suspension as described at the beginning of sub-chapter 2.5. Tumour dimensions were measured using a caliper on days 14, 21, 28, and 35 after inoculation of in vitro-treated cells. Tumour volume was calculated using the formula: V = length × width2/2. The researcher measuring tumours knew the cage number for each animal and how each mouse was marked but did not know how the cells inoculated in each animal were treated in vitro. Mice received no treatment, except for the inoculation of in vitro-treated tumor cells. Animals were monitored throughout the experiment according to predefined humane endpoints and were euthanized by cervical dislocation when tumours reached a volume of 1.8–2 cm3. One animal in the CTRL group died between days 28 and 35 and was excluded from the complete-case repeated-measures analysis.
2.8. Statistical Analysis
For statistical analyses, GraphPad Prism v6 software was used (GraphPad Software Inc., San Diego, CA, USA). Corr. OD values, rather than effects, were used for inferential testing. Data from replicate wells were averaged to provide one value per condition and independent experiment. Descriptive treatment effects were presented as mean ± standard deviation (SD), while statistical significance was set at p < 0.05.
Porphyrin- and SFN-concentration selection experiments were analyzed using one-way ANOVA followed by Bonferroni-adjusted comparisons with the untreated control. BRU concentration-selection data were analyzed using two-way ANOVA with concentration and application regimen as factors. Within each regimen, concentrations were compared with the corresponding untreated control using multiplicity-adjusted comparisons; single- and double-application regimens were compared at the same concentration using Fisher’s LSD test. Concentration × regimen interaction and both main effects were reported.
For experiments in which all treatments were performed concurrently during each independent run, independent experiments were treated as matched subjects. The initial six-group P2.1/P2.2 datasets, the four-group P2.1 datasets, and the eight-group SFN datasets were analyzed using one-way repeated-measures ANOVA followed by Holm–Šídák-adjusted prespecified comparisons. The same statistical inference was also performed for normalized gene expression data (2−ΔCt values).
Tumour-growth data were analyzed using two-way repeated-measures ANOVA with time and treatment group as factors. Only mice with observations at all time points were included in the complete-case repeated-measures analysis. At each time point, treatment groups were compared with the control (CTRL) group using Dunnett’s multiple-comparisons test.
3. Results
The experimental setup was designed to achieve a milder form of PDT with viable cells remaining at 24 h post-PDT. Such a PDT regimen is a candidate for improvement by modulating the induced stress response with relatively low and moderately cytotoxic doses of BRU to increase PDT efficacy.
3.1. Selection of the PDT Regimen
The concentration-dependent photodynamic effects of the P2.2 and P2.1 porphyrins on human A-431 epidermoid carcinoma cells were initially evaluated using the MTS reduction assay at 4 and 24 h after PDT (5 J/cm2, 30 mW/cm2, 167 s).
At 4 h after PDT, both photosensitizers significantly affected the corr. OD values of tumour cells over the investigated concentration range (2.5–7.5 µM). For P2.2 (asymmetric porphyrin derivative), one-way ANOVA revealed a significant photosensitizer concentration-dependent effect (F(3,8) = 180.3, p < 0.0001, Figure 1A) at 4 h after PDT. Compared with the control (CTRL), PDT using 2.5 µM P2.2 significantly decreased the corr. OD values (Bonferroni-adjusted p = 0.0006), producing an effect of 73.2 ± 10.0%. A more pronounced decrease in MTS reduction was observed at 5 and 7.5 µM P2.2 (p < 0.0001), with corresponding effects of 27.9 ± 0.5% and 15.9 ± 1.0%, respectively. Similarly, P2.1 (symmetric porphyrin derivative) also showed a significant concentration-dependent reduction of corr. OD (F(3,8) = 270.5, p < 0.0001). PDT performed using 2.5 µM P2.1 significantly reduced the corr. OD values compared with CTRL (p < 0.0001, Figure 1B), corresponding to an effect of 74.3 ± 5.4% (Figure 1C). Significant decreases were also observed at 5 and 7.5 µM P2.1 (p < 0.0001), resulting in effects of 56.7 ± 2.0% and 29.8 ± 2.0%, respectively. Both porphyrins significantly reduced the MTS signal at all tested concentrations at 4 h after PDT. The effects obtained with the two photosensitizers were comparable at 2.5 µM. At 5 and 7.5 µM, P2.2-PDT triggered numerically lower MTS signals.
Figure 1.
Effects of PDT with P2.2 and P2.1 on the MTS reduction by human A-431 epidermoid carcinoma cells. (A) corr. OD values for P2.2-PDT at 4 h after PDT; (B) corr. OD values for P2.1-PDT at 4 h after PDT; (C) concentration–response curves for P2.1- and P2.2-PDT, at 4 h after PDT; (D) corr. OD values for P2.2-PDT at 24 h after PDT; (E) corr. OD values for P2.1-PDT at 24 h after PDT; (F) concentration–response curves for both porphyrins at 24 h after PDT. Results are expressed as mean ± SD values (n = 3 replicate samples). *** p < 0.001 vs. control.
At 24 h after PDT, both photosensitizers produced marked concentration-dependent decreases in the MTS signal. For P2.2, one-way ANOVA revealed a significant concentration-dependent effect on the corr. OD values (F(3,8) = 13,136, p < 0.0001, Figure 1D). PDT using 2.5 µM P2.2 significantly reduced the corr. OD compared with CTRL (Bonferroni-adjusted p < 0.0001, 29.9 ± 0.7%). Further decreases in the MTS reduction were observed after PDT with 5 and 7.5 µM P2.2 (p < 0.0001), with effects of 5.2 ± 1.0% and 0.1 ± 0.7%, respectively. Thus, the MTS signal was almost completely abolished at 24 h after PDT using 7.5 µM P2.2, indicating a low number of remaining living cells. The symmetric compound P2.1 also significantly reduced the corr. OD values 24 h after PDT (F(3,8) = 1805, p < 0.0001, Figure 1E). PDT using 2.5 µM P2.1 significantly reduced the MTS response (Bonferroni-adjusted p < 0.0001), with an effect of 23.2 ± 2.0% (Figure 1F). Similar to P2.2, a significant decrease was observed at 5 and 7.5 µM P2.1 (p < 0.0001), with corresponding effects of 11.9 ± 0.7% and 4.6 ± 2.9%, respectively.
At all tested concentrations, both investigated porphyrins significantly decreased the MTS signal at 4 h and 24 h after PDT. The effects at 24 h were considerably lower than those obtained at 4 h, indicating a progressive decrease in the number of metabolically active cells after PDT. Moreover, at 5 and 7.5 µM, the asymmetric derivative P2.2 exhibited numerically lower MTS reduction signals, indicating a higher photodynamic activity than the symmetric P2.1 compound.
LDH release was assessed at 24 h after PDT as an indicator of plasma membrane damage and PDT cytotoxicity. For P2.2, one-way ANOVA revealed a significant concentration-dependent effect of the photosensitizer on corr. OD values (F(3,8) = 104.6, p < 0.0001). PDT using 2.5 µM P2.2 significantly increased LDH release compared with CTRL (Bonferroni-adjusted p < 0.0001, Figure 2A), producing an effect of 301.3 ± 34.3%. Significant increases were also observed at 5 µM and 7.5 µM P2.2 (p < 0.0001), with effects of 308.9 ± 1.3% and 323.7 ± 1.3%, respectively. The mean LDH signal therefore increased across the investigated P2.2 concentration range.
Figure 2.
Effect of PDT with P2.2 and P2.1 on LDH release by human A-431 epidermoid carcinoma cells. (A) corr. OD values for P2.2-PDT at 24 h after PDT; (B) corr. OD values for P2.1-PDT at 24 h after PDT. Results are expressed as mean ± SD values (n = 3 replicate samples). *** p < 0.001 vs. control.
P2.1 also significantly affected LDH release at 24 h after PDT (F(3,8) = 64.06, p < 0.0001). PDT using 2.5, 5, and 7.5 µM P2.1 significantly increased the corr. OD compared with CTRL (Bonferroni-adjusted p < 0.0001, Figure 2B). The corresponding effects were 334.8 ± 7.8%, 327.7 ± 15.4%, and 318.3 ± 44.8%, respectively. Neither photosensitizer exhibited a significant concentration-dependent increase in LDH release over the tested range. PDT performed with either porphyrin significantly increased LDH release at all tested concentrations, indicating substantial membrane damage 24 h after PDT. Considering that the purpose of our study was to achieve a relatively mild PDT regimen and both tested photosensitizers exhibited similar effects at 2.5 µM, we lowered the porphyrin concentration to 2 µM in further experiments to generate a definite mild PDT regimen.
3.2. Selection of BRU Concentration
The effect of BRU concentration and administration regimen on the viability/proliferation of human A-431 epidermoid carcinoma cells was evaluated using the MTS reduction assay. BRU was administered once or twice, with the second application performed 1 h after the first treatment, following replacement of the culture medium to perform PDT. MTS reduction readouts were obtained after a 24 h incubation time. In this experimental setting, the protocol for PDT was mimicked, as we will describe below.
A significant effect of BRU concentration on the corr. OD (two-way ANOVA, F(4,16) = 19.41, p < 0.0001) was obtained. Following a single application, BRU concentrations of 10, 20, and 40 nM did not significantly change the corr. OD values compared with the untreated control (Bonferroni-adjusted p > 0.05, Figure 3A,B). Meanwhile, a single treatment of cells with 80 nM BRU significantly decreased the corr. OD compared with the untreated control (p = 0.0025, 67.4 ± 1.1%).
Figure 3.
Effects of multiple non-additive BRU applications on the MTS reduction by human A-431 epidermoid carcinoma cells. Results are expressed as mean ± SD of corr. OD (A) and treatment effect data (n = 3 replicate samples) (B). The treatment effect was calculated as the percentage of corr. OD corresponding to a treated sample divided by the corr. OD of the control, multiplied by 100. * p < 0.05; ** p < 0.01; *** p < 0.001 vs. corresponding controls; # p < 0.05 between single and double BRU application.
Two consecutive treatments with 10 nM or 20 nM BRU did not significantly change the corr. OD compared with the corresponding untreated control (Bonferroni-adjusted p > 0.05). Meanwhile, a double application of 40 nM BRU significantly decreased the corr. OD (p = 0.0284), resulting in an effect of 76.1 ± 3.2%. A more pronounced decrease in the corr. OD was observed after a double application of 80 nM BRU (p = 0.0001, Bonferroni post hoc), when the effect decreased to 55.3 ± 6.9% relative to control.
Two-way ANOVA also revealed that the overall effect of the application regimen was statistically significant (F(1,4) = 4.484, p = 0.0469), showing that the MTS signal was lower after a double BRU application. However, the interaction between BRU concentration and application regimen was not significant (F(4,16) = 1.089, p = 0.388), indicating that the BRU concentration-dependent pattern of the MTS response was not statistically different between the single- and double-application regimens. In turn, Fisher’s LSD analysis showed that a double application of BRU yielded significantly lower corr. OD values at 40 nM (p = 0.0250) compared with the single-application regimen.
Since 20 nM BRU did not significantly decrease MTS reduction, irrespective of the administration regimen (single or double non-additive application), this BRU concentration was selected for further experiments to modulate the cytotoxic effect of PDT.
Considering that the culture medium was repeatedly discarded during the PDT procedure; for instance, during PDT and when cells were detached at 2 h post-PDT to introduce treated cells and controls into various types of assays, three applications of 20 nM BRU were required to maintain this concentration uniformly in the culture system (application at 1 h before PDT to sensitize the cells, immediately after PDT, and at 2 h post-PDT, as explained above).
3.3. Selection of SFN Concentration
The effect of 5 µM sulforaphane (SFN) on the viability/proliferation of A-431 epidermoid carcinoma cells was evaluated at 24 h after a single SFN application using the MTS reduction assay. One-way ANOVA revealed a significant effect of SFN on the corr. OD values (F(4,9) = 85.85, p < 0.0001). SFN treatment did not significantly modify the corr. OD compared with the untreated control (Bonferroni-adjusted p > 0.05, Figure 4A), showing an effect of 93.0 ± 8.0% relative to the control (Figure 4B). In contrast, 10 µM SFN significantly reduced the corr. OD (p < 0.0001), with an effect of 59.6 ± 3.2% of the control. Further corr. OD decreases were observed at 15 µM and 20 µM SFN, both concentrations leading to significantly lower corr. OD values (p < 0.0001). The corresponding effects were 43.2 ± 0.7% and 39.9 ± 3.0%, respectively. Thus, 5 µM SFN did not exert a significant cytotoxic or antiproliferative action on A-431 cells, whereas concentrations in the range of 10–20 µM produced a significant decrease in the MTS signal. Further experiments in the context of PDT were therefore performed with a non-cytotoxic concentration of SFN (5 µM), aiming to have PDT as the main cytotoxicity trigger in the modulation experiments. Noteworthy, both BRU and SFN, known to inhibit or activate the NRF2 axis, respectively, exerted an anti-tumour effect on human A-431 epidermoid carcinoma cells at higher concentrations.
Figure 4.
SFN effects on the MTS reduction in human A-431 epidermoid carcinoma cells. (A) corr. OD values; (B) concentration–response curve. Results are expressed as mean ± SD values (n = 3 replicate samples). *** p < 0.001.
3.4. Effects of BRU on PDT Efficacy
Further PDT experiments were performed with 2 µM P2.1 or P2.2 porphyrins, in the presence and absence of BRU applied as described at point 3.2.
At 4 h after PDT, the MTS assay revealed a significant overall treatment effect (repeated-measures one-way ANOVA, F(5,10) = 5.086, p = 0.0141). BRU alone did not significantly affect the corr. OD values relative to CTRL (92.3 ± 5.2%; Holm–Šídák-adjusted p > 0.05, Figure 5A). PDT with 2 µM P2.2 or P2.1 produced effects of 78.2 ± 16.0% and 80.9 ± 14.2%, respectively, neither of which differed significantly from CTRL (Holm–Šídák adjusted p > 0.05), indicating a mild PDT regimen. Both P2.2-PDT+BRU and P2.1-PDT+BRU combinations showed significantly lower corr. OD values compared with the control, but not compared with PDT, yielding effects of 67.0 ± 14.9% and 72.9 ± 8.8%, respectively (p = 0.0120 and p = 0.0314, Holm–Šídák correction).
Figure 5.
The effect of P2.2-PDT or P2.1-PDT, alone or in combination with BRU, on the MTS reduction by human A-431 epidermoid carcinoma cells. (A) corr. OD values at 4 h after PDT; (B) corr. OD values at 24 h after PDT; (C) corr. OD values at 48 h after PDT. Results are expressed as mean ± SD values (n = 3 independent experiments). * p < 0.05, ** p < 0.01, *** p < 0.001 vs. control; # p < 0.05 vs. PDT.
At 24 h after PDT, the MTS assay revealed a significant overall treatment effect (repeated-measures one-way ANOVA, F(5,10) = 54.89, p < 0.0001). BRU alone produced a significant effect of 74.6 ± 7.1% relative to CTRL (Holm–Šídák-adjusted p = 0.0005). PDT using 2 µM P2.2 or P2.1 significantly reduced the corr. OD to 50.5 ± 5.6% and 60.8 ± 10.2%, respectively (Holm–Šídák correction, p < 0.0001 for both comparisons, Figure 5B). Combining BRU with P2.2- or P2.1-mediated PDT further decreased MTS reduction to 37.2 ± 10.6% and 46.6 ± 2.7%, respectively, with both combinations differing significantly from control (p < 0.0001 for both comparisons, Holm–Šídák post hoc). Moreover, both P2.2-PDT+BRU (Holm–Šídák correction, p = 0.0150) and P2.1-PDT+BRU (p = 0.0150) differed significantly from the corresponding PDT treatment alone, further decreasing the MTS signal to 72.71 ± 13.97% for P2.2+BRU and 78.04 ± 14.33% for P2.1+BRU. Thus, BRU induced a decrease in the number of metabolically active cells at 24 h post-PDT, irrespective of the photosensitizer used, thereby exerting a significant sensitizing effect.
At 48 h after PDT, the MTS assay showed a significant overall treatment effect (repeated-measures one-way ANOVA, F(5,10) = 16.77, p = 0.0001, Figure 5C). BRU alone exhibited an effect of 77.9 ± 13.4% compared with CTRL, with the difference being statistically significant (Holm–Šídák-adjusted p = 0.0324). PDT using 2 µM P2.2 significantly decreased the corr. OD to 54.9 ± 3.4% (p = 0.0007, Holm–Šídák correction), whereas P2.1-PDT produced an effect of 69.8 ± 11.7% that was also significantly different from CTRL (p = 0.0067). Combining BRU with P2.2-PDT or P2.1-PDT, the inhibitory effects were 40.6 ± 15.2% and 48.4 ± 9.0%, respectively, both combinations differing significantly from CTRL (p < 0.0001 and p = 0.0002, Holm–Šídák post hoc). Moreover, only the P2.1-PDT+BRU combination decreased MTS reduction significantly in comparison with the corresponding PDT treatment alone (Holm–Šídák-adjusted p = 0.0438, 69.74 ± 10.04%), whereas P2.2-PDT+BRU only nominally decreased the corr. OD values compared with P2.2-PDT alone (p > 0.05, 72.96 ± 23.59%). Therefore, BRU enhanced the decrease in the number of metabolically active cells induced by PDT in both cases, but a statistically significant sensitizing effect was demonstrated only in the context of P2.1-PDT at 48 h post-PDT, probably because P2.1 is less photodynamically active than P2.2.
The LDH release assay revealed a significant overall treatment effect at 4 h after PDT (repeated-measures one-way ANOVA, F(5,10) = 54.69, p < 0.0001). BRU alone induced an effect of 102.0 ± 22.8% relative to CTRL, showing that no toxicity was exerted (Holm–Šídák-adjusted p > 0.05, Figure 6A). PDT using P2.2 significantly increased LDH release to 436.7 ± 171.7% (p < 0.0001, Holm–Šídák correction), whereas P2.1-PDT showed a significant but lower effect of 183.8 ± 41.6% (p = 0.0242). Effects of 392.1 ± 132.9% and 195.9 ± 21.0% were registered when combining BRU with P2.2-PDT or P2.1-PDT. The effects of both P2.2–PDT+BRU and P2.1-PDT+BRU combinations were significantly different from CTRL (p < 0.0001 and p = 0.0164, Holm–Šídák post hoc). In turn, neither combination differed significantly from the corresponding PDT treatment alone (Holm–Šídák adjusted p > 0.05).
Figure 6.
Effects of PDT with 2 µM P2.2 and P2.1 alone or in combination with BRU on the LDH release by human A-431 epidermoid carcinoma cells. (A) corr. OD values at 4 h after PDT; (B) corr. OD values at 24 h after PDT; (C) corr. OD values at 48 h after PDT. Results are expressed as mean ± SD values (n = 3 independent experiments). * p < 0.05, ** p < 0.01; *** p < 0.001 vs. control.
At 24 h after PDT, the LDH assay indicated a significant treatment effect (repeated-measures one-way ANOVA, F(5,10) = 12.13, p = 0.0006). BRU treatment had a modest effect of 126.5 ± 34.6% compared with CTRL (Holm–Šídák-adjusted p > 0.05, Figure 6B). P2.2-PDT significantly increased LDH release to 250.9 ± 62.3% (p = 0.0010, Holm–Šídák post hoc), whereas P2.1-PDT produced a statistically significant effect of 187.3 ± 70.2% (p = 0.0363). Combining BRU with P2.2-PDT or P2.1-PDT produced effects of 245.7 ± 74.6% and 145.3 ± 61.8%, respectively. The P2.2-PDT-BRU combination remained significantly different from CTRL (p = 0.0012, Holm–Šídák correction), unlike the P2.1-PDT-BRU combination (p > 0.05). Neither combination differed significantly from the corresponding PDT treatment (Holm–Šídák-adjusted p > 0.05). Thus, BRU did not significantly enhance the PDT-induced membrane damage at 24 h after PDT.
At 48 h after PDT, the LDH assay revealed a significant overall treatment effect (repeated-measures one-way ANOVA, F(5,10) = 27.02, p < 0.0001). BRU alone produced a statistically significant effect of 184.7 ± 22.4% relative to CTRL (Holm–Šídák-adjusted p = 0.0080, Figure 6C). P2.2-PDT increased LDH release to 327.7 ± 46.9% (p < 0.0001, Holm–Šídák correction), whereas P2.1 produced a lower effect of 278.2 ± 48.1% (p < 0.0001). Combining BRU with P2.2-PDT or P2.1-PDT resulted in effects of 297.9 ± 31.5% and 240.7 ± 59.1%, respectively, compared with the control. Interestingly, at 48 h, both P2.2-PDT+BRU and P2.1-PDT+BRU combinations significantly increased LDH release (Holm–Šídák correction, p < 0.0001 and p = 0.0003, respectively). Moreover, no significant differences in LDH release were registered for either PDT+BRU combination at any time point compared with PDT alone.
As P2.1 yielded a milder PDT than P2.2 and BRU seemingly enhanced the photodynamic activity of P2.1 to a greater extent, we chose to perform further investigations with P2.1. Its photodynamic effect in the presence or absence of BRU was evaluated across six independent experiments. At 24 h, the MTS assay revealed a significant overall treatment effect (one-way ANOVA, F(3,15) = 47.91, p < 0.0001). BRU alone significantly reduced the corr. OD to 71.5 ± 5.8% relative to CTRL (Holm–Šídák-adjusted p < 0.0001, Figure 7A), while P2.1-PDT produced a significant decrease to 59.3 ± 10.9% (p < 0.0001). Combining BRU with P2.1-PDT, the effect was further reduced to 49.5 ± 6.0% compared with CTRL (p < 0.0001). Although the combination slightly decreased the MTS signal compared with PDT alone (84.96 ± 12.76%), the result was not statistically significant (p = 0.0551, Holm–Šídák correction). Therefore, BRU nominally enhanced the reduction in the number of metabolically active cells induced by P2.1-PDT at 24 h, but a statistically significant sensitizing effect on PDT was not demonstrated.
Figure 7.
Effects of PDT with 2 µM P2.1, alone or in combination with BRU, on MTS reduction by human A-431 epidermoid carcinoma cells. (A) corr. OD values at 24 h after PDT; (B) corr. OD values at 48 h after PDT. Results are expressed as mean ± SD values (n = 6 independent experiments). *** p < 0.001 vs. control; # p < 0.05 vs. PDT.
At 48 h, the MTS assay showed a significant overall treatment effect (one-way ANOVA, F(3,15) = 30.77, p < 0.0001) across six independent experiments. Treatment with BRU alone significantly reduced the corr. OD to 70.5 ± 12.4% relative to CTRL (Holm–Šídák-adjusted p = 0.0004, Figure 7B), while P2.1-PDT yielded a significant decrease to 59.5 ± 19.9% (p < 0.0001). In combination with BRU, P2.1-PDT further increased the inhibitory effect to 43.4 ± 10.7% compared with CTRL (p < 0.0001, Holm–Šídák post hoc). Furthermore, the combination yielded significantly lower corr. OD values compared with PDT alone (76.35 ± 14.71%, p = 0.0254, Holm–Šídák correction). Similar to the previously presented data from three experiments, BRU showed a statistically significant sensitizing effect on PDT at 48 h.
Considering that P2.1 yielded a milder PDT regimen than P2.2, and that BRU seemingly enhanced the photodynamic activity of P2.1 to a greater extent, we opted to perform further investigations with P2.1.
3.5. Effects of SFN on PDT Efficacy
SFN was used to activate the NRF2 pathway to investigate the cytoprotective potential of NRF2 activation in the PDT context. SFN treatments were applied alone or in combination with BRU and P2.1-PDT.
At 24 h, the MTS assay showed significant treatment effects (repeated-measures one-way ANOVA, F(7,14) = 4.172, p = 0.0111). BRU reduced the MTS signal to 61.0 ± 10.3% relative to CTRL (Holm–Šídák correction, p > 0.05, Figure 8A), whereas 5 µM SFN had no effect (98.6 ± 39.6%, p > 0.05), with both differences being statistically insignificant. BRU combined with SFN produced an effect of 52.8 ± 14.0%, which remained significantly lower than CTRL (Holm–Šídák- adjusted p = 0.0388) and did not differ from BRU alone (p > 0.05). P2.1-PDT alone produced an effect of 59.4 ± 16.6%, while PDT combined with BRU, SFN, or both compounds produced effects of 47.6 ± 0.53%, 75.0 ± 21.0%, and 47.1 ± 21.0%, respectively. Only P2.1-PDT+BRU and P2.1-PDT+BRU+SFN groups had significantly lower values compared with CTRL (p = 0.0213 for both comparisons, Holm–Šídák post hoc). However, P2.1-PDT+BRU did not significantly differ from PDT alone (p > 0.05, Holm–Šídák post hoc), even though the corr. OD values decreased to 84.1 ± 21.0%. Moreover, the increase in corr. OD values produced by SFN following PDT was not statistically significant (126.5 ± 12.9%, p > 0.05, Holm–Šídák post hoc). The triple combination differed neither from PDT alone nor from PDT+BRU (81.1 ± 10.3% and 99.0 ± 15.4%, p > 0.05, Holm–Šídák correction). Thus, SFN may slightly increase the MTS signal when administered alone but did not protect cells against PDT or reverse the effect of BRU under the investigated conditions.
Figure 8.
Effects of PDT with 2 µM P2.1, alone or in combination with BRU and SFN, on the MTS reduction by human A-431 epidermoid carcinoma cells. (A) corr. OD values at 24 h after PDT; (B) corr. OD values at 48 h after PDT. Results are expressed as mean ± SD values (n = 3 independent experiments). * p < 0.05, ** p < 0.01 vs. control.
Similarly, at 48 h, the MTS assay revealed a significant overall treatment effect (repeated-measures one-way ANOVA, F(7,14) = 5.351, p = 0.0038). BRU significantly decreased corr. OD to 51.5 ± 14.1% relative to CTRL (Holm–Šídák-adjusted p = 0.0398, Figure 8B), whereas 5 µM SFN showed an insignificant effect of 95.7 ± 14.1% (p > 0.05). BRU combined with SFN exhibited an effect of 54.9 ± 19.9%, which remained significantly lower than CTRL (p = 0.0398, Holm–Šídák correction) but did not differ from BRU alone (p > 0.05). Relative to the control, P2.1-PDT had an effect of 54.7 ± 32.1%, while PDT combined with BRU, SFN, or both compounds yielded effects of 33.5 ± 3.9%, 65.0 ± 30.6%, and 34.1 ± 1.2%. Interestingly, only P2.1-PDT alone, P2.1-PDT+BRU, and P2.1+BRU+SFN groups differed significantly from CTRL (p = 0.0398, p = 0.0049, and p = 0.0049, respectively, Holm–Šídák post hoc), while the signal decrease observed for the P2.1-PDT+SFN combination remained statistically insignificant (p > 0.05). Moreover, P2.1-PDT+BRU was not significantly different from PDT alone (73.5 ± 31.3%, p > 0.05, Holm–Šídák post hoc), probably due to the strong PDT regimen. The nominal increase produced by SFN following PDT was also statistically insignificant (124.7 ± 15.5%, p > 0.05, Holm–Šídák post hoc). Furthermore, the triple combination was not statistically different, either compared with PDT alone or PDT–BRU (77.8 ± 38.3% and 102.3 ± 8.8%, p > 0.05, Holm–Šídák correction). Therefore, at 48 h after PDT, SFN did not significantly protect cells against PDT or reverse the BRU effect.
3.6. Cellular Impedance Measurements
Cellular impedance measurements using the xCELLigence platform were used to assess the impact of BRU on human A-431 epidermoid carcinoma cells in real time as a method complementary to the MTS reduction assay, which provides information on the number of metabolically active cells in the culture. Cells were monitored for over 100 h with impedance measurements taken every 15 min.
BRU, applied three times to maintain 20 nM in the experimental system as described above, with the 3rd application occurring when the cell suspension was seeded in E-plates, decreased the impedance signal rapidly within 10 min (Figure 9A), indicating an unexpected effect of BRU on cellular electrical impedance during the cell adhesion phase. The decrease was observed for over 100 h, probably due to the disturbance of cellular adhesion, proliferation, and spreading at later measurement times. Cells recovered slowly from the BRU challenge, as indicated by the slow increase in the impedance signal over time. Of note, the effect of BRU on CI calculated from impedance measurements was lower than its effect on MTS reduction (Figure 7) under equivalent experimental conditions, suggesting that BRU may alter cellular processes more profoundly than viability and proliferation.
Figure 9.
Real-time impedance measurements using the xCELLigence platform on human A-431 epidermoid carcinoma cells exposed to PDT with 2 µM P2.1, in the presence or absence of 20 nM BRU. Results are presented as cell index (CI) ± SD for duplicate samples (representative experiment). (A) Three applications of BRU: 1 h before PDT, immediately after PDT, and at cell replating at 3–4 h after PDT; (B) Two applications of BRU: 1 h before PDT and immediately after PDT.
In turn, cells were not significantly affected if BRU was applied only twice, namely in the sensitization phase and for another 2 h after PDT, but not during the following impedance measurements (Figure 9B). It appears that BRU must be present in the experimental system (3rd exposure of cells to BRU at the moment of cell plating for impedance measurements) to significantly affect cellular electrical impedance.
The investigated P2.1-PDT regimen persistently decreased the impedance signal, but some of the exposed cells slowly recovered over time (Figure 9A,B). When cells were co-treated with PDT and BRU (three applications), the impedance signal was significantly lower than the signal provided by PDT alone, indicating a combined action of PDT and BRU, especially at longer cultivation times (Figure 9A).
The mean effect of BRU on cellular impedance in the absence of PDT was 42 ± 17% at 24 h, 37 ± 17% at 48 h, and 41 ± 18% at 72 h (n = 3 independent experiments). In the presence of PDT, the BRU effect was 40 ± 23% at 24 h, 30 ± 18% at 48 h, and 28 ± 17% at 72 h for three independent experiments (Supplementary Materials Figure S2). Results indicate that BRU exerted a persistent effect on both the basal and PDT-modulated cellular impedance. The mentioned decrease in the impedance signal triggered by BRU was more pronounced (Figure 9A) than the effect observed in MTS reduction (Figure 7).
Altogether, results indicate that BRU may alter the behavior of human A-431 epidermoid carcinoma cells more profoundly than a decrease in the number of metabolically active cells measured using the MTS reduction assay.
The described effects of BRU on A-431 cells were not cell-specific. A previous experiment using human HT-29 colon adenocarcinoma cells showed the inhibitory action of BRU at 20 nM and 40 nM, while no effect was registered at 10 nM BRU (Figure 10A). In this experiment, BRU was administered as a single application when cells were seeded in E-plates. In another experiment in which BRU was applied 24 h after seeding cells in E-plates, when cells had already adhered to the electrode, 10, 20, and 40 nM BRU had no significant effect on the impedance signal, and an inhibitory action was observed only when 40 nM BRU was applied (Figure 10B). These experiments suggest that BRU probably altered the adhesion of A-431 cells to the E-plate bottom, measured by impedance changes in the first 24 h after seeding cells, and exerted lower effects when applied after cell adhesion.
Figure 10.
Real-time impedance measurements using the xCELLigence platform on human HT29 colon adenocarcinoma cells exposed to PDT with 2 µM P2.2 (PDT), in the presence or absence of 20 nM BRU. Results are presented as cell index (CI) ± SD for duplicate samples (representative experiment). (A) Dose–effect curve of BRU applied at cell suspension seeding in E-plates; (B) dose–effect curve of BRU applied 24 h after seeding cells in E-plates; (C) effect of three BRU applications: 1 h before PDT, immediately after PDT, and at 2 h after PDT when replating cells for impedance measurement.
Three exposures of HT-29 cells to 20 nM BRU according to the protocol applied to A-431 cells induced an enhanced decrease in the impedance signal of P2.2-PDT samples, especially later, in the time frame of (80–100) h after starting the measurement, when the effect of BRU applied alone ceased (BRU-treated samples reached a similar CI value as CTRL) (Figure 10C).
3.7. Gene Expression Changes
Using RT-PCR, we assessed the expression changes of two stress genes, the redox-regulated HMOX1 gene and the inflammatory IL1B gene, in A-431 epidermoid carcinoma cells exposed to BRU according to the previously described scheme (1 h before P2.1-PDT, immediately after P2.1-PDT for 2 h, and at cell replating), in the presence or absence of P2.1-PDT exposure. RPS23 and RPLP0 housekeeping genes, having stable expression after BRU and PDT treatments, were used to normalize the gene expression data (Supplementary Materials Table S1).
Two exposures of A-431 cells to 20 nM BRU, the first BRU application being performed 1 h before P2.1-PDT and the second one immediately after P2.1-PDT, induced changes in gene expression in detached A-431 cells at approx. 3 h after P2.1-PDT, expressed as FC values. Thus, BRU treatment induced a moderate decrease in the expression level of the HMOX1 gene (Figure 11A), while the IL1B gene was significantly upregulated (FC > 3.3, Figure 11B). An important increase in the HMOX1 level was registered when cells were exposed to P2.1-PDT (FC > 4.4, Figure 11A), accompanied by a smaller upregulation of the IL1B gene (FC > 2.0, Figure 11B). BRU treatment in the context of P2.1-PDT induced a significant decrease in HMOX1 expression compared with PDT alone (Figure 11A), with a decrease to 33 ± 23% of the FC value. Meanwhile, BRU reinforced IL1B expression in PDT-treated cells (Figure 11B), with a mean increase in the FC value of 370 ± 58%.
Figure 11.
Expression changes of the redox-regulated HMOX1 gene and the inflammatory IL1B gene in human A-431 epidermoid carcinoma cells exposed to PDT with 2 µM P2.1 in the presence or absence of 20 nM BRU. Results are presented as fold change (FC) ± SD for 3 independent experiments. (A) HMOX1 gene; (B) IL1B gene. FC values > 1.5 indicate consistent upregulation, while FC values < 0.56 indicate consistent downregulation.
Gene expression changes were also analyzed at 48 h after P2.1-PDT in adherent A-431 cells, presumably living cells, exposed three times to 20 nM BRU. A moderate decrease in the FC value relative to the basal HMOX1 level was observed, similar to that registered at 3 h post-PDT (Figure 11A). It was accompanied by a consistent increase in the basal IL1B level (FC> 2.4) (Figure 11B), as also seen at 3 h post-PDT, indicating persistent BRU effects on IL1B over time. Meanwhile, the effect of P2.1-PDT on gene expression decreased considerably when comparing FC values at 3 h and 48 h post-PDT (Figure 11A,B), indicating a transitory PDT effect. When BRU was applied to PDT-treated cells (3 BRU applications), there were no significant changes in HMOX1 expression (Figure 11A), but an increase of 202 ± 24% in the IL1B expression level compared with PDT alone was registered (Figure 11B). Accordingly, at later stages after PDT, namely 48 h thereafter, an increased inflammatory response was observed, with no improvement in the antioxidant shielding mediated by HMOX1.
The statistical analysis of the 2−ΔCt data (Supplementary Materials Table S1 and Figure S3A–D) further revealed significant changes in HMOX1 expression after 3 h (repeated-measures one-way ANOVA F(3,6) = 12.12, p = 0.0059). P2.1-PDT applied alone significantly increased the 2−ΔCt values compared with the untreated control (p = 0.0089, Holm–Šídák correction). The action of BRU in the context of PDT was confirmed by a significant decrease in the 2−ΔCt values compared with PDT alone (p = 0.0215, Holm–Šídák correction). However, no significant effects of PDT and/or BRU were registered at 48 h after PDT (repeated-measures one-way ANOVA, F(3,6) = 2.068, p > 0.05).
Furthermore, significant changes were also registered for IL1B expression levels at 3 h (repeated-measures one-way ANOVA, F(3,6) = 6.326, p = 0.0274) and 48 h (repeated-measures one-way ANOVA, F(3,6) = 11.42, p = 0.0068) post-PDT. At 3 h, P2.1-PDT alone did not significantly change IL1B expression levels (p = 0.746, Holm–Šídák post hoc test), but BRU alone and PDT+BRU had a tendency to increase the expression level of IL1B compared with the untreated control (p = 0.0585, Holm–Šídák correction) and PDT alone (p = 0.0534, Holm–Šídák correction), respectively. Nevertheless, there was a significant increase in IL1B expression levels in the case of PDT+BRU compared with the untreated control (p = 0.0469, Holm–Šídák post hoc test). At 48 h after PDT, BRU induced a significant increase in IL1B levels (p = 0.0159, Holm–Šídák correction) compared with the untreated control, and this effect was also present in the context of PDT (p = 0.0100, Holm–Šídák correction). Moreover, PDT and BRU combination significantly increased the 2−ΔCt values corresponding to PDT alone (p = 0.0183, Holm–Šídák post hoc test).
3.8. In Vivo Tumour-Growth
Following in vitro pretreatment of human A-431 epidermoid carcinoma cells with PDT and/or BRU (three applications) and their subcutaneous implantation in immunocompromised mice, tumour development was monitored for 35 days after cell inoculation. Two-way repeated-measures ANOVA revealed a significant effect of time on tumour volume (F(3,105) = 50.55, p < 0.0001), whereas the overall treatment-group effect (F(3,35) = 2.039, p = 0.1263) and the time × treatment interaction (F(9,105) = 1.259, p = 0.2681) were not statistically significant. At day 14, mean tumour volumes were 44.7 ± 48.3 mm3 in the CTRL group and 29.1 ± 44.2, 28.8 ± 33.8, and 32.8 ± 59.7 mm3 in the BRU, PDT, and PDT+BRU groups, respectively. These values corresponded to tumour volume reductions of 34.9%, 35.5%, and 26.6% relative to CTRL, but none of the differences were statistically significant (Dunnett’s-adjusted p > 0.05, Figure 12). Similarly, at day 21, tumour volumes remained lower in the BRU, PDT, and PDT+BRU groups, corresponding to reductions of 53.2%, 70.8%, and 53.6%, respectively, relative to CTRL, although none differed significantly from CTRL (p > 0.05, Dunnett’s post hoc test).
Figure 12.
Tumour growth following inoculation of human A-431 epidermoid carcinoma cells pretreated in vitro with vehicle (CTRL, n = 9 mice), BRU (n = 10 mice), P2.1-PDT (PDT, n = 10 mice), or their combination (PDT+BRU, n = 10 mice). Tumour volumes were measured on days 14, 21, 28, and 35 after inoculation and are presented as mean ± SEM. * p < 0.05, ** p < 0.01 vs. control (CTRL).
At day 28, the CTRL group reached a mean tumour volume of 802.5 ± 564.7 mm3. BRU pretreatment reduced the mean volume to 487.9 ± 496.9 mm3, corresponding to a reduction of 39.2% relative to CTRL, but this difference was not statistically significant (p > 0.05, Dunnett’s post hoc test). PDT treatment produced the most pronounced effect, reducing the tumour volume to 299.2 ± 262.6 mm3, a reduction of 62.7% relative to CTRL (p = 0.0496, Dunnett’s post hoc test). The PDT+BRU group exhibited a mean tumour volume of 381.8 ± 388.9 mm3, representing a 52.4% reduction relative to CTRL, but the difference did not reach statistical significance (Dunnett’s adjusted p > 0.05). At day 35, mean tumour volume was 1389.3 ± 881.4 mm3 in the CTRL group. BRU alone exhibited a mean volume of 931.8 ± 886.5 mm3, corresponding to a reduction of 32.9% relative to CTRL, which remained statistically insignificant (Dunnett’s adjusted p = 0.0830). In contrast, tumours derived from PDT-pretreated cells reached 667.8 ± 413.6 mm3, representing a significant 51.9% reduction relative to CTRL (p = 0.0024, Dunnett’s post hoc test). PDT+BRU pretreatment resulted in a mean tumour volume of 859.4 ± 862.0 mm3 and a significant 38.1% reduction compared with CTRL (p = 0.0360, Dunnett’s post hoc test). Thus, in vitro PDT induced the most consistent inhibition of subsequent tumour growth. Although the PDT+BRU group differed significantly from CTRL at day 35, its mean volume decrease was nominally smaller than that obtained with PDT alone, providing no evidence that the in vitro BRU treatment can enhance PDT efficacy under the investigated conditions when in vitro-treated cells were implanted in immunocompromised mice and tumour progression was monitored in vivo.
4. Discussion
This study mainly examined, in vitro, whether pharmacological inhibition of the cellular stress response with BRU can increase the efficacy of porphyrin-mediated PDT in human A-431 epidermoid carcinoma cells. This intervention is highly needed in tumour areas with lower photosensitizer accumulation due to the diffusion-mediated concentration gradient from the tumour blood vessels, where PDT is consequently less efficient.
The rationale for testing low nanomolar concentrations of BRU was to limit its cytotoxicity and to inhibit the cytoprotective stress response activated by cells subjected to PDT, aiming to enhance the damage triggered by PDT. Porphyrin photoactivation was shown to induce an NRF2-dependent increase in the expression of heme oxygenase-1 (HO-1) and the ABCG2 transporter [17,27], while HO-1 induction after hypericin-PDT resulted in limited apoptotic cell death [28]. The tested low BRU concentrations and BRU application scheme may downregulate a broad panel of short-lived cytoprotective stress proteins, possibly including the transcription factor NRF2. This broader inhibition spectrum of BRU, beyond NRF2 inhibition, is expected to increase cancer cells’ sensitivity to PDT. Indeed, the complex stress response impedes PDT efficacy and, therefore, its pharmacological inhibition with low concentrations of BRU for a limited period of time, shortly before, during, and immediately after PDT, is hypothesized to increase PDT efficacy against tumour cells, without introducing additional toxicity and side effects related to chronic treatment with high, cytotoxic concentrations of BRU.
We first showed that P2.1, a symmetric porphyrin derivative, was less efficient at performing PDT on human A-431 epidermoid carcinoma cells than the asymmetric P2.2 derivative, therefore requiring reinforcement of its photodynamic effect using BRU, for instance. The activity of the two investigated porphyrins is consistent with our earlier results [19]. Nevertheless, we have previously shown that the photodynamic properties of P2.1 are worth developing to complement its exquisite fluorescent properties that can be valorized in tumour imaging [19]. To achieve a milder PDT regimen, a lower porphyrin concentration was used for photosensitization, yielding less cell damage following PDT, with a portion of the treated cells surviving PDT. We considered such a milder PDT regimen suitable for studying modulators to improve relatively poor PDT efficacy.
Under a milder PDT regimen, we found that BRU decreased the number of metabolically active A-431 epidermoid carcinoma cells to a greater extent than PDT alone, most consistently in the case of P2.1-PDT at 48 h after PDT.
Similar, but stronger, effects of BRU, alone or combined with PDT, were observed in the electrical cellular impedance of A-431 cells, indicating that BRU may affect cell adhesion, spreading, morphology, or proliferation. This effect was not cell-specific, as demonstrated in both human A-431 epidermoid carcinoma and HT-29 colon adenocarcinoma cells. BRU-induced inhibition persisted in the absence of PDT. Still, cells slowly began to recover, suggesting that BRU should be reapplied after 48–60 h, depending on cell reactivity to BRU, to maintain the marked decrease in cellular impedance. This study does not describe the mechanism underlying this behaviour of A-431 tumour cells treated in vitro with BRU, nor does it investigate its consequences on tumour development. We cannot rule out that BRU’s inhibitory action affects cell adhesion and spreading on the E-plates surface, given that impedance inhibition under BRU treatment was observed within a few hours after adding the cell suspension to the plate. Moreover, we showed that adding BRU after cells had adhered to the plate had a weaker inhibitory effect on the impedance signal. Nevertheless, the biological meaning of lower impedance signals needs further clarification.
The inhibitory effect of BRU on the impedance of human A-431 epidermoid carcinoma cells was stronger and more persistent in the context of a mild P2.1-PDT regimen. Nevertheless, repeated PDT+BRU sessions may be needed to eliminate epidermoid carcinoma cells and fully limit disease recurrence. Indeed, it has been shown that repeated PDT may be beneficial in recurrent forms of disease and proves to be safe in the short term, at least as demonstrated in chronic central serous chorioretinopathy [29]. Milder PDT regimens and repeated sessions may be preferable in skin disorders to avoid early and late adverse PDT effects such as erythema, pain, burns, edema, itching, desquamation, and pustular formation in the short term and eruptive appearance of squamous cell carcinoma in previously PDT-treated areas in the long term [30].
These inhibitory effects of BRU on A-431 epidermoid carcinoma cells in the context of PDT were associated with an early but transient decrease in the expression of the antioxidant HMOX1 gene [31,32] and a notable and persistent upregulation of the inflammatory IL1B gene [33]. As such, BRU disrupted HMOX1-mediated cytoprotective mechanisms in A-431 cells exposed to PDT, making these cancer cells more vulnerable to this treatment. In turn, the observed upregulation of IL1B may reinforce the local inflammatory microenvironment, which is known to sustain tumour progression [34].
Although the HMOX1 gene is a target of the cytoprotective NRF2 transcription factor [10,35] and BRU is a known NRF2 inhibitor at nanomolar concentrations [18], these results cannot establish an NRF2-mediated effect. BRU-induced HMOX1 downregulation was accompanied by IL1B upregulation, a behaviour consistent with current knowledge of an antagonistic crosstalk between the antioxidant NRF2 and the pro-inflammatory NF-κB transcription factors [35]. Moreover, NRF2 can directly inhibit IL1B gene transcription by binding in the proximity of this gene in macrophages and inhibiting RNA Pol II recruitment, independently of ROS levels [36]. In some experiments, we treated cells with SFN, which is a well-known NRF2 activator that rescues cells from oxidative injury [37,38]. The consequences of the short boost with SFN were reversed by repeated BRU exposures, possibly because BRU inhibited the SFN-induced activation of NRF2 and/or accelerated NRF2 degradation through post-translational mechanisms [39]. Overall, without strong experimental evidence, we can only hypothesize that NRF2 inhibition contributes to BRU’s reported effect on epidermoid carcinoma cells. Detailed investigations at both the protein and gene levels are needed to clarify this mechanism, including the expression changes of other NRF2 target genes induced by PDT, such as SQSTM1, FTH1, and GCLM [17].
Further, we used an in vitro–in vivo approach to investigate the persistence of the in vitro-performed treatments on human A-431 epidermoid carcinoma cells implanted in immunocompromised mice (three BRU applications in the absence or presence of PDT). Of note, no treatments were applied to mice after implantation of in vitro-treated A-431 tumour cells. The in vivo tumour-growth study provides an important boundary for validating the in vitro observations. Having the tumour volume as the endpoint, we found that the aforementioned in vitro actions of BRU tended to decrease the tumour volume in six out of ten mice, showing that even low in vitro concentrations of BRU (20 nM) can have an anti-tumour effect in vivo, albeit modest. This BRU action is in agreement with the known anti-cancer activity of BRU, especially at higher nanomolar concentrations [15].
In vitro-performed P2.1-PDT also triggered a statistically significant decrease in tumour volume compared with the CTRL group. In turn, in vitro BRU treatment of tumour cells in the context of PDT did not reduce tumour volume significantly in PDT-BRU mice compared with the PDT group. The lack of a consistent additional benefit from BRU over PDT suggests that the in vivo microenvironment supported the stress response induced by the in vitro PDT regimen, which BRU exposure in vitro could not counteract.
Considering that BRU increased in vitro PDT efficacy when it was present in the experimental system during the whole procedure, including 24–48 h after PDT when various endpoints were measured, a hypothesis arises regarding the fate of tumor cells implanted into immunocompromised mice: single or repeated in vivo treatment of mice with BRU may be required to obtain smaller tumours in PDT+BRU mice compared with PDT mice, in addition to the in vitro BRU treatment.
Several limitations should guide following experiments: (1) this study used mainly the A-431 epidermoid carcinoma cell line and a limited number of experimental endpoints (cellular viability and proliferation using the MTS reduction assay and real-time impedance measurements), complemented by the investigation of the expression changes of only two genes, HMOX1 and IL1B; (2) information on cell death was obtained solely from the LDH release assay, which assesses alterations in membrane integrity associated with necrosis and necroptosis, not allowing in-depth discussion on BRU’s effect on cell death; (3) further studies have to clarify the mechanisms through which BRU alters the cellular electrical impedance of the investigated tumour cells; and (4) the contribution of NRF2 and other stress proteins potentially inhibited by BRU in the effect of BRU on PDT efficacy.
5. Conclusions
BRU concentrations in the nanomolar range, which are minimally cytotoxic when applied briefly before and after PDT, can moderately increase PDT efficacy in human A-431 epidermoid carcinoma cells subjected to a mild PDT regimen by inducing a late decrease in the number of metabolically active cells. This is the first study to report that low BRU concentrations induce an early and persistent decrease in the electrical impedance of cancer cells, with or without PDT, but the biological meaning and consequences of these changes need further clarification. Nevertheless, repeated BRU applications after PDT may be required to maintain and prolong these in vitro effects and their in vivo translation. BRU downregulates the HMOX1 redox gene, consistent with the reported inhibitory effects, but upregulation of the inflammatory IL1B gene may sustain tumour progression. Altogether, BRU emerges as a promising adjunctive therapeutic agent for milder forms of PDT and, using low BRU concentrations only temporarily, we may avoid the considerable side effects of higher BRU concentrations in chronic cancer treatment.
Supplementary Materials
The following supporting information can be downloaded at https://www.mdpi.com/article/10.3390/biom16111682/s1. Figure S1: “Dark” toxicity of P2.1 and P2.2 photosensitizers, evaluated by the MTS reduction assay in human A-431 epidermoid carcinoma cells. Briefly, A-431 cells were incubated in 96-well plates for 24 h to allow adhesion; photosensitizers were then added, and 18 h thereafter, MTS reduction was measured. Results are presented as mean OD ± SEM (n = 9 replicates). ** p < 0.01, *** p < 0.001 vs control (0 concentration) according to the Student’s test for paired samples; Figure S2: Real-time impedance measurements using the xCELLigence platform on human A-431 epidermoid carcinoma cells exposed to PDT with 2 µM P2.1, in the presence or absence of 20 nM BRU applied 1 h before PDT, immediately after PDT, and at cell replating at 3-4 h after PDT. Results are presented as cell index ± SD for duplicate samples. (A) Additional experiment 1; (B) Additional experiment 2; Figure S3: Changes in gene expression levels in human A-431 epidermoid carcinoma cells regarding the redox-regulated HMOX1 gene and the inflammatory IL1B gene in cells exposed to PDT with 2 µM P2.1, in the presence or absence of 20 nM BRU. RPS23 and RPLP0 were used as housekeeping genes to normalize the gene expression data. Results were expressed as mean 2−ΔCt ± SEM values in 3 independent experiments. (A) HMOX1 gene expression levels at 3 h after PDT; (B) HMOX1 gene expression levels at 48 h after PDT; (C) IL1B gene expression levels at 3 h after PDT; (D) IL1B gene expression levels at 48 h after PDT. Comparisons between groups were made using the Holm-Šídák correction: * p < 0.05 vs CTRL; # p < 0.05 vs PDT; Table S1: Gene expression levels in human A-431 epidermoid carcinoma cells regarding the redox-regulated HMOX1 gene and the inflammatory IL1B gene in cells exposed to PDT with 2 µM P2.1, in the presence or absence of 20 nM BRU. Results were expressed as 2−ΔCt values in 3 independent experiments. RPS23 and RPLP0 were used as housekeeping genes to normalize the gene expression data.
Author Contributions
Conceptualization, D.P.M., G.M., S.N. and R.B.; data curation, D.P.M., G.M., I.V.N., G.I. and M.D.; formal analysis, D.P.M.; funding acquisition, C.-E.D.-P. and R.B.; investigation, D.P.M., G.M., I.V.N., G.I. and M.D.; methodology, D.P.M., G.M., I.V.N., G.I. and M.D.; project administration, D.P.M., C.-E.D.-P. and R.B.; resources, G.M., I.V.N., M.D., C.-E.D.-P. and R.B.; software, D.P.M.; supervision, S.N. and R.B.; validation, G.M. and R.B.; visualization, D.P.M., G.M., G.I. and M.D.; writing—original draft, D.P.M., G.M., I.V.N., G.I. and M.D.; writing—review and editing, C.-E.D.-P., S.N. and R.B. All authors have read and agreed to the published version of the manuscript.
Funding
This research was financially supported by Carol Davila University of Medicine and Pharmacy, Bucharest, Romania, through the Advanced Postdoctoral Research Contract No. 28563/02.10.2023 and Contract No. CNFIS-FDI-2026-F-1137.
Institutional Review Board Statement
This study was approved by the Ethics Committee of the Victor Babeș National Institute of Pathology, Bucharest, Romania (authorization no. 17/24 September 2025).
Informed Consent Statement
Not applicable.
Data Availability Statement
The original contributions presented in this study are included in the article/Supplementary Material; further inquiries can be directed to the corresponding author.
Acknowledgments
The work of the team from Victor Babes National Institute of Pathology was supported by the Nucleu grant PN23.16.02.01, financed by the Romanian Ministry of Education and Research.
Conflicts of Interest
The authors declare no conflicts of interest.
References
- Sol, S.; Boncimino, F.; Todorova, K.; Waszyn, S.E.; Mandinova, A. Therapeutic Approaches for Non-Melanoma Skin Cancer: Standard of Care and Emerging Modalities. Int. J. Mol. Sci. 2024, 25, 7056. [Google Scholar] [CrossRef] [Scilit] [PubMed]
- Yan, F.; Schmalbach, C.E. Updates in the Management of Advanced Nonmelanoma Skin Cancer. Surg. Oncol. Clin. N. Am. 2024, 33, 723–733. [Google Scholar] [CrossRef] [Scilit] [PubMed]
- Koumprentziotis, I.-A.; Rompoti, N.; Liopyris, K.; Nicolaidou, E.; Stratigos, A. Photodynamic Therapy for the Treatment of Basal Cell Carcinoma: A Comprehensive Review of Randomized Controlled Trials. Dermatol. Pract. Concept. 2024, 14, e2024105. [Google Scholar] [CrossRef] [Scilit] [PubMed]
- Ajuwon, O.R.; Nsole-Biteghe, F.A.; Ndong, J.D.; Davids, L.M.; Ajiboye, B.O.; Brai, B.; Bamisaye, F.A.; Falode, J.A.; Odoh, I.M.; Adegbite, K.I.; et al. Nrf2-Mediated Antioxidant Response and Drug Efflux Transporters Upregulation as Possible Mechanisms of Resistance in Photodynamic Therapy of Cancers. Onco Targets Ther. 2024, 17, 605–627. [Google Scholar] [CrossRef] [Scilit] [PubMed]
- Cui, S.; Guo, X.; Wang, S.; Wei, Z.; Huang, D.; Zhang, X.; Zhu, T.C.; Huang, Z. Singlet Oxygen in Photodynamic Therapy. Pharmaceuticals 2024, 17, 1274. [Google Scholar] [CrossRef] [Scilit] [PubMed]
- Yu, Q.; Li, X.; Wang, J.; Guo, L.; Huang, L.; Gao, W. Recent Advances in Reprogramming Strategy of Tumor Microenvironment for Rejuvenating Photosensitizers-Mediated Photodynamic Therapy. Small 2024, 20, e2305708. [Google Scholar] [CrossRef] [Scilit] [PubMed]
- Akbar, A.; Khan, S.; Chatterjee, T.; Ghosh, M. Unleashing the power of porphyrin photosensitizers: Illuminating breakthroughs in photodynamic therapy. J. Photochem. Photobiol. B. 2023, 248, 112796. [Google Scholar] [CrossRef] [Scilit] [PubMed]
- Dąbrowska, A.; Mastalerz, J.; Wilczyński, B.; Osiecka, B.; Choromańska, A. Determinants of Photodynamic Therapy Resistance in Cancer Cells. Int. J. Mol. Sci. 2024, 25, 12069. [Google Scholar] [CrossRef] [Scilit] [PubMed]
- Udomsak, W.; Kucinska, M.; Pospieszna, J.; Dams-Kozlowska, H.; Chatuphonprasert, W.; Murias, M. Antioxidant Enzymes in Cancer Cells: Their Role in Photodynamic Therapy Resistance and Potential as Targets for Improved Treatment Outcomes. Int. J. Mol. Sci. 2024, 25, 3164. [Google Scholar] [CrossRef] [Scilit] [PubMed]
- Cuadrado, A.; Manda, G.; Hassan, A.; Alcaraz, M.J.; Barbas, C.; Daiber, A.; Ghezzi, P.; León, R.; López, M.G.; Oliva, B.; et al. Transcription Factor NRF2 as a Therapeutic Target for Chronic Diseases: A Systems Medicine Approach. Pharmacol. Rev. 2018, 70, 348–383. [Google Scholar] [CrossRef] [Scilit] [PubMed]
- Verza, F.A.; DA Silva, G.C.; Nishimura, F.G. The impact of oxidative stress and the NRF2-KEAP1-ARE signaling pathway on anticancer drug resistance. Oncol. Res. 2025, 33, 1819–1834. [Google Scholar] [CrossRef] [Scilit] [PubMed]
- de Klerk, D.J.; de Keijzer, M.J.; Franchi, L.P.; Tian, J.; Gureev, M.A.; Ge, Y.; Mesquita, B.; Saelman, G.E.; Van Herteryck, I.; Dias, L.M.; et al. Pharmacological targeting of nuclear factor (erythroid-derived 2)-like 2 (NRF2): A potential strategy to improve the efficacy of oncological photodynamic therapy. Biochem. Pharmacol. 2026, 248, 117620. [Google Scholar] [CrossRef] [Scilit] [PubMed]
- Zhang, J.; Xu, H.-X.; Zhu, J.-Q.; Dou, Y.-X.; Xian, Y.-F.; Lin, Z.-X. Natural Nrf2 Inhibitors: A Review of Their Potential for Cancer Treatment. Int. J. Biol. Sci. 2023, 19, 3029–3041. [Google Scholar] [CrossRef] [Scilit] [PubMed]
- Lv, B.; Xing, S.; Wang, Z.; Zhang, A.; Wang, Q.; Bian, Y.; Pei, Y.; Sun, H.; Chen, Y. NRF2 inhibitors: Recent progress, future design and therapeutic potential. Eur. J. Med. Chem. 2024, 279, 116822. [Google Scholar] [CrossRef] [Scilit] [PubMed]
- Xi, W.; Zhao, C.; Wu, Z.; Ye, T.; Zhao, R.; Jiang, X.; Ling, S. Brusatol’s anticancer activity and its molecular mechanism: A research update. J. Pharm. Pharmacol. 2024, 76, 753–762. [Google Scholar] [CrossRef] [Scilit] [PubMed]
- Harder, B.; Tian, W.; La Clair, J.J.; Tan, A.; Ooi, A.; Chapman, E.; Zhang, D.D. Brusatol overcomes chemoresistance through inhibition of protein translation. Mol. Carcinog. 2017, 56, 1493–1500. [Google Scholar] [CrossRef] [Scilit] [PubMed]
- Dobre, M.; Boscencu, R.; Neagoe, I.V.; Surcel, M.; Milanesi, E.; Manda, G. Insight into the Web of Stress Responses Triggered at Gene Expression Level by Porphyrin-PDT in HT29 Human Colon Carcinoma Cells. Pharmaceutics 2021, 13, 1032. [Google Scholar] [CrossRef] [Scilit] [PubMed]
- Cai, S.J.; Liu, Y.; Han, S.; Yang, C. Brusatol, an NRF2 inhibitor for future cancer therapeutic. Cell Biosci. 2019, 9, 45. [Google Scholar] [CrossRef] [Scilit] [PubMed]
- Burloiu, A.M.; Manda, G.; Lupuliasa, D.; Socoteanu, R.P.; Mihai, D.P.; Neagoe, I.V.; Anghelache, L.-I.; Surcel, M.; Anastasescu, M.; Olariu, L.; et al. Assessment of Some Unsymmetrical Porphyrins as Promising Molecules for Photodynamic Therapy of Cutaneous Disorders. Pharmaceuticals 2023, 17, 62. [Google Scholar] [CrossRef] [Scilit] [PubMed]
- Boscencu, R.; Manda, G.; Radulea, N.; Socoteanu, R.; Ceafalan, L.; Neagoe, I.; Ferreira Machado, I.; Basaga, S.H.; Vieira Ferreira, L. Studies on the Synthesis, Photophysical and Biological Evaluation of Some Unsymmetrical Meso-Tetrasubstituted Phenyl Porphyrins. Molecules 2017, 22, 1815. [Google Scholar] [CrossRef] [Scilit] [PubMed]
- Iskhakova, E.R.; Aleksandrova, K.V.; Suvorova, I.I. Selection and validation of reference genes for RT-qPCR normalization in dormant cancer cells. Sci. Rep. 2025, 15, 19160. [Google Scholar] [CrossRef] [Scilit] [PubMed]
- Krzystek-Korpacka, M.; Hotowy, K.; Czapinska, E.; Podkowik, M.; Bania, J.; Gamian, A.; Bednarz-Misa, I. Serum availability affects expression of common house-keeping genes in colon adenocarcinoma cell lines: Implications for quantitative real-time PCR studies. Cytotechnology 2016, 68, 2503–2517. [Google Scholar] [CrossRef] [Scilit] [PubMed]
- Liu, L.-L.; Zhao, H.; Ma, T.-F.; Ge, F.; Chen, C.-S.; Zhang, Y.-P. Identification of Valid Reference Genes for the Normalization of RT-qPCR Expression Studies in Human Breast Cancer Cell Lines Treated with and without Transient Transfection. PLoS ONE 2015, 10, e0117058. [Google Scholar] [CrossRef] [Scilit] [PubMed]
- Jacob, F.; Guertler, R.; Naim, S.; Nixdorf, S.; Fedier, A.; Hacker, N.F.; Heinzelmann-Schwarz, V. Careful Selection of Reference Genes Is Required for Reliable Performance of RT-qPCR in Human Normal and Cancer Cell Lines. PLoS ONE 2013, 8, e59180. [Google Scholar] [CrossRef] [Scilit] [PubMed]
- Wong, J.J.W.; Lorenz, S.; Selbo, P.K. All-trans retinoic acid enhances the anti-tumour effects of fimaporfin-based photodynamic therapy. Biomed. Pharmacother. 2022, 155, 113678. [Google Scholar] [CrossRef] [Scilit]
- Xie, F.; Wang, J.; Zhang, B. RefFinder: A web-based tool for comprehensively analyzing and identifying reference genes. Funct. Integr. Genom. 2023, 23, 125. [Google Scholar] [CrossRef] [Scilit] [PubMed]
- Ishikawa, T.; Kajimoto, Y.; Sun, W.; Nakagawa, H.; Inoue, Y.; Ikegami, Y.; Miyatake, S.-I.; Kuroiwa, T. Role of Nrf2 in Cancer Photodynamic Therapy: Regulation of Human ABC Transporter ABCG2. J. Pharm. Sci. 2013, 102, 3058–3069. [Google Scholar] [CrossRef] [Scilit] [PubMed]
- Kocanova, S.; Buytaert, E.; Matroule, J.-Y.; Piette, J.; Golab, J.; de Witte, P.; Agostinis, P. Induction of heme-oxygenase 1 requires the p38MAPK and PI3K pathways and suppresses apoptotic cell death following hypericin-mediated photodynamic therapy. Apoptosis 2007, 12, 731–741. [Google Scholar] [CrossRef] [Scilit] [PubMed]
- van den Tillaart, F.M.; Komrojan, A.; Hoyng, C.B.; Martinez Ciriano, J.P.; Yzer, S. Effectiveness and safety of repeated photodynamic therapy in recurrent central serous chorioretinopathy. Acta Ophthalmol. 2025, 103, 791–798. [Google Scholar] [CrossRef] [Scilit] [PubMed]
- Borgia, F.; Giuffrida, R.; Caradonna, E.; Vaccaro, M.; Guarneri, F.; Cannavò, S. Early and Late Onset Side Effects of Photodynamic Therapy. Biomedicines 2018, 6, 12. [Google Scholar] [CrossRef] [Scilit] [PubMed]
- Consoli, V.; Sorrenti, V.; Grosso, S.; Vanella, L. Heme Oxygenase-1 Signaling and Redox Homeostasis in Physiopathological Conditions. Biomolecules 2021, 11, 589. [Google Scholar] [CrossRef] [Scilit]
- Poss, K.D.; Tonegawa, S. Reduced stress defense in heme oxygenase 1-deficient cells. Proc. Natl. Acad. Sci. USA 1997, 94, 10925–10930. [Google Scholar] [CrossRef] [Scilit] [PubMed]
- Kaneko, N.; Kurata, M.; Yamamoto, T.; Morikawa, S.; Masumoto, J. The role of interleukin-1 in general pathology. Inflamm. Regen. 2019, 39, 12. [Google Scholar] [CrossRef] [Scilit] [PubMed]
- Gelfo, V.; Romaniello, D.; Mazzeschi, M.; Sgarzi, M.; Grilli, G.; Morselli, A.; Manzan, B.; Rihawi, K.; Lauriola, M. Roles of IL-1 in Cancer: From Tumor Progression to Resistance to Targeted Therapies. Int. J. Mol. Sci. 2020, 21, 6009. [Google Scholar] [CrossRef] [Scilit] [PubMed]
- Gao, W.; Guo, L.; Yang, Y.; Wang, Y.; Xia, S.; Gong, H.; Zhang, B.-K.; Yan, M. Dissecting the Crosstalk Between Nrf2 and NF-κB Response Pathways in Drug-Induced Toxicity. Front. Cell Dev. Biol. 2022, 9, 809952. [Google Scholar] [CrossRef] [Scilit] [PubMed]
- Kobayashi, E.H.; Suzuki, T.; Funayama, R.; Nagashima, T.; Hayashi, M.; Sekine, H.; Tanaka, N.; Moriguchi, T.; Motohashi, H.; Nakayama, K.; et al. Nrf2 suppresses macrophage inflammatory response by blocking proinflammatory cytokine transcription. Nat. Commun. 2016, 7, 11624. [Google Scholar] [CrossRef] [Scilit] [PubMed]
- Di Filippo, M.; Paolino, G.; Di Nicola, M.R.; Kiss, N.; Bánvölgyi, A.; Bortone, G.; Nisticò, S.P.; Zampini, E.; Pellacani, G.; Cantisani, C. Sulforaphane as a Photoprotective Agent Against UV-Induced Skin Damage and Carcinogenesis: A Scoping Review. J. Pers. Med. 2026, 16, 319. [Google Scholar] [CrossRef] [Scilit] [PubMed]
- Talalay, P.; Fahey, J.W.; Healy, Z.R.; Wehage, S.L.; Benedict, A.L.; Min, C.; Dinkova-Kostova, A.T. Sulforaphane mobilizes cellular defenses that protect skin against damage by UV radiation. Proc. Natl. Acad. Sci. USA 2007, 104, 17500–17505. [Google Scholar] [CrossRef] [Scilit] [PubMed]
- Olayanju, A.; Copple, I.M.; Bryan, H.K.; Edge, G.T.; Sison, R.L.; Wong, M.W.; Lai, Z.-Q.; Lin, Z.-X.; Dunn, K.; Sanderson, C.M.; et al. Brusatol provokes a rapid and transient inhibition of Nrf2 signaling and sensitizes mammalian cells to chemical toxicity—Implications for therapeutic targeting of Nrf2. Free Radic. Biol. Med. 2015, 78, 202–212. [Google Scholar] [CrossRef] [Scilit] [PubMed]
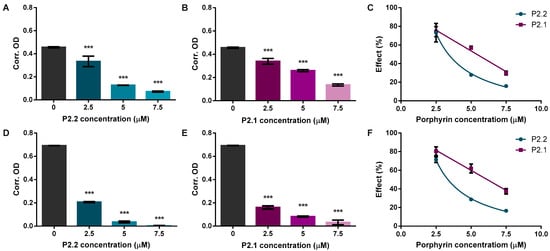
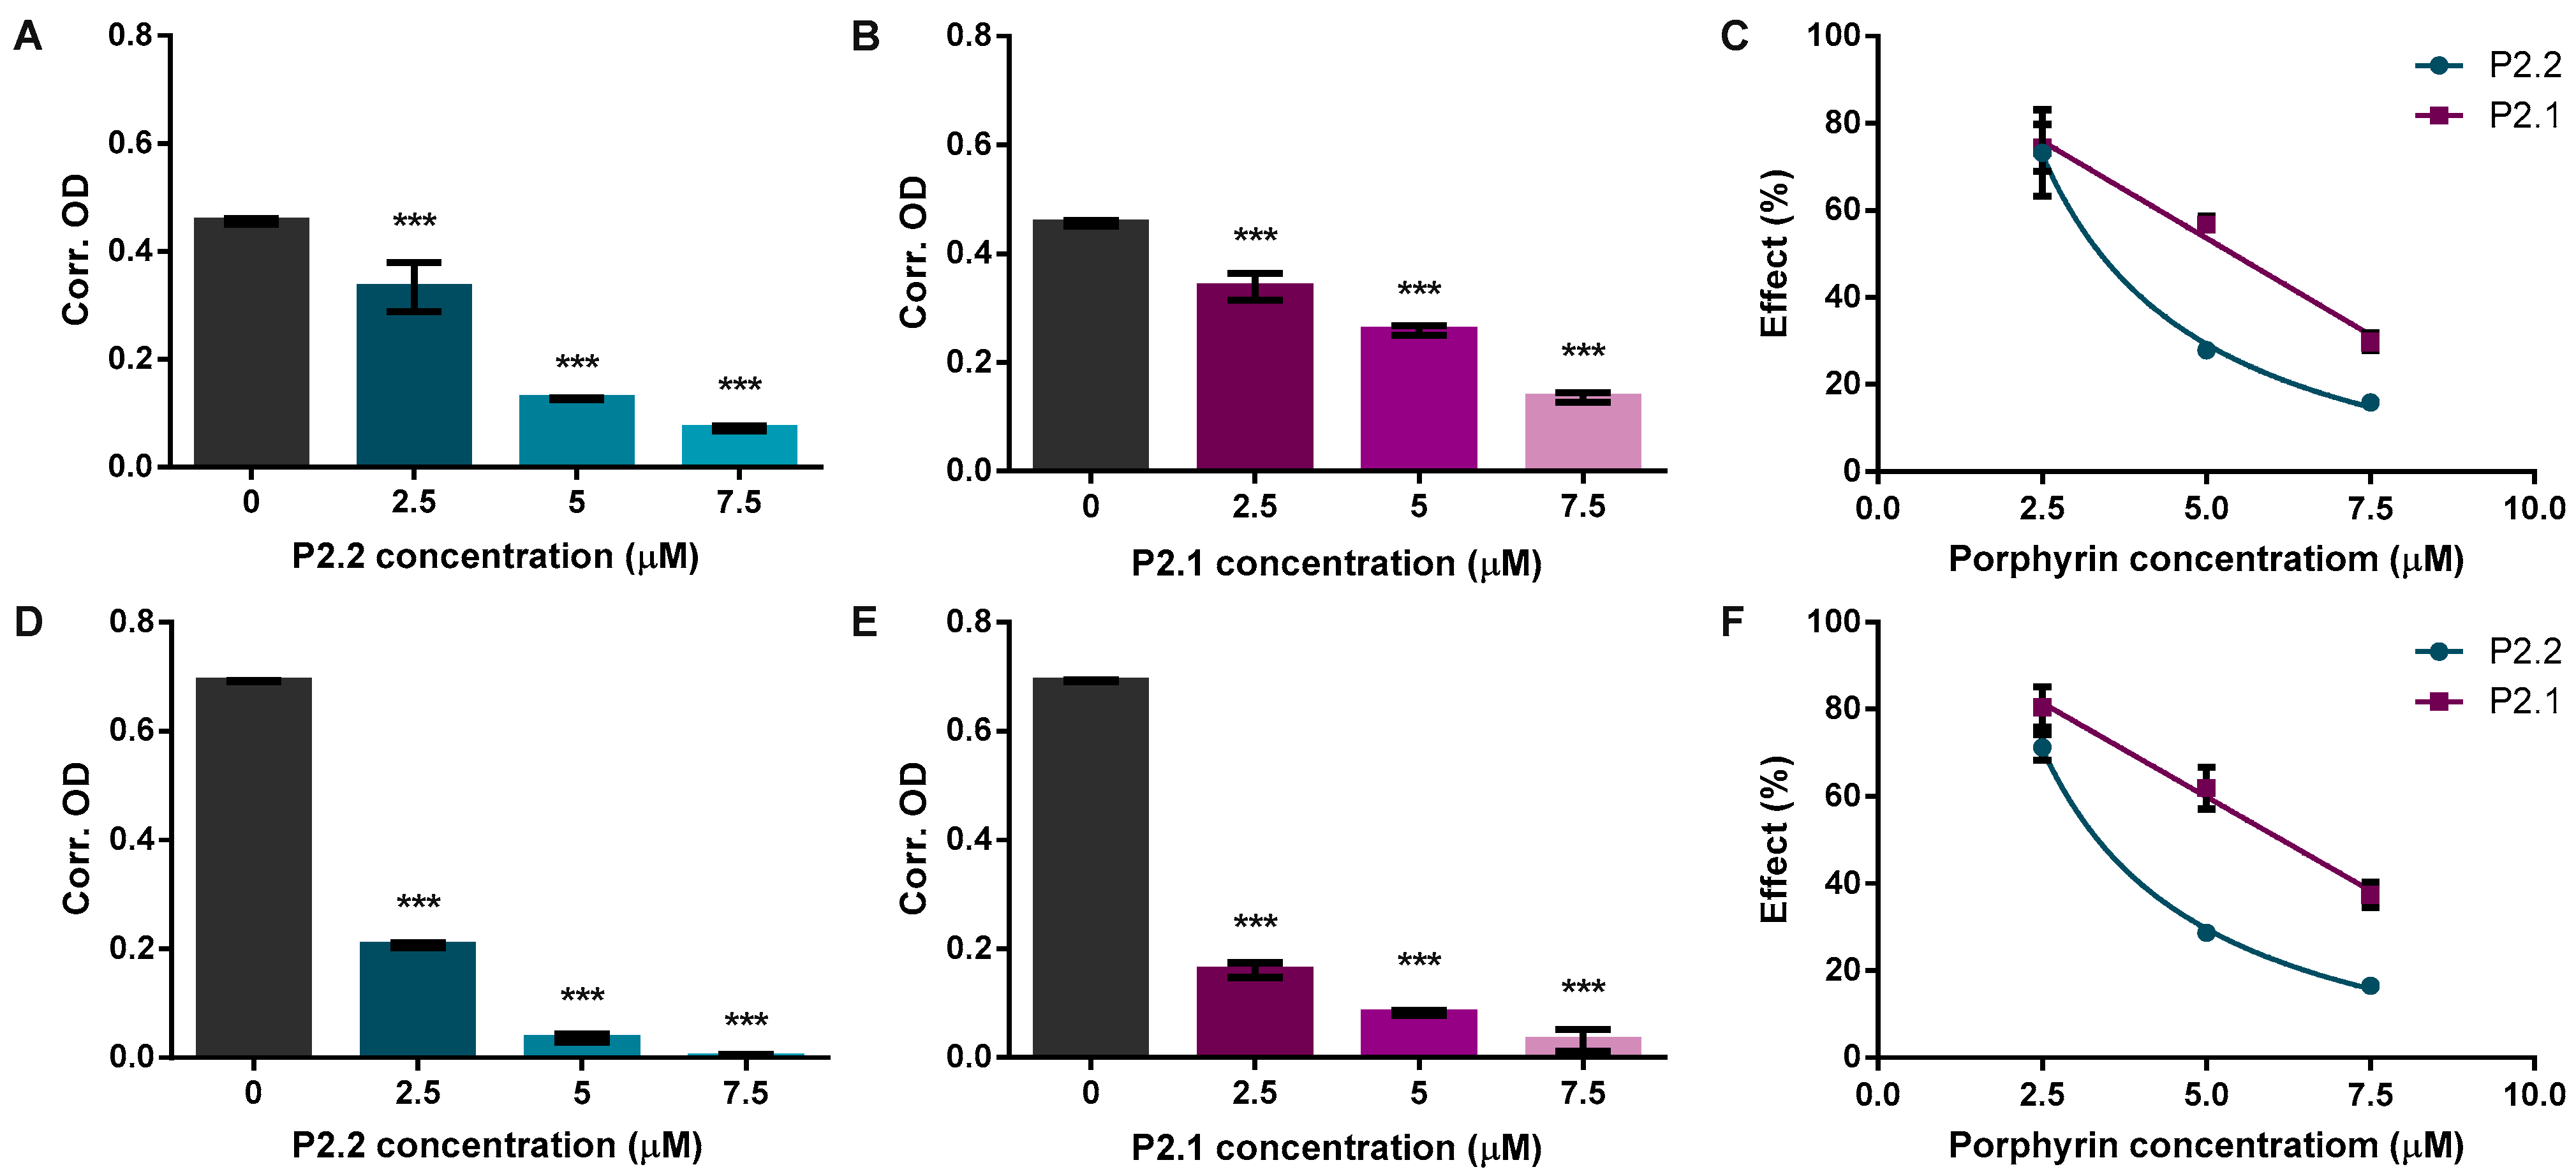
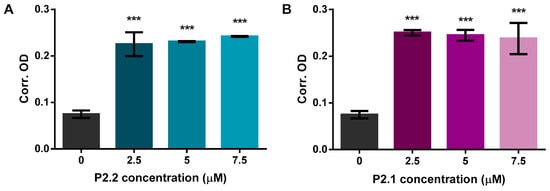
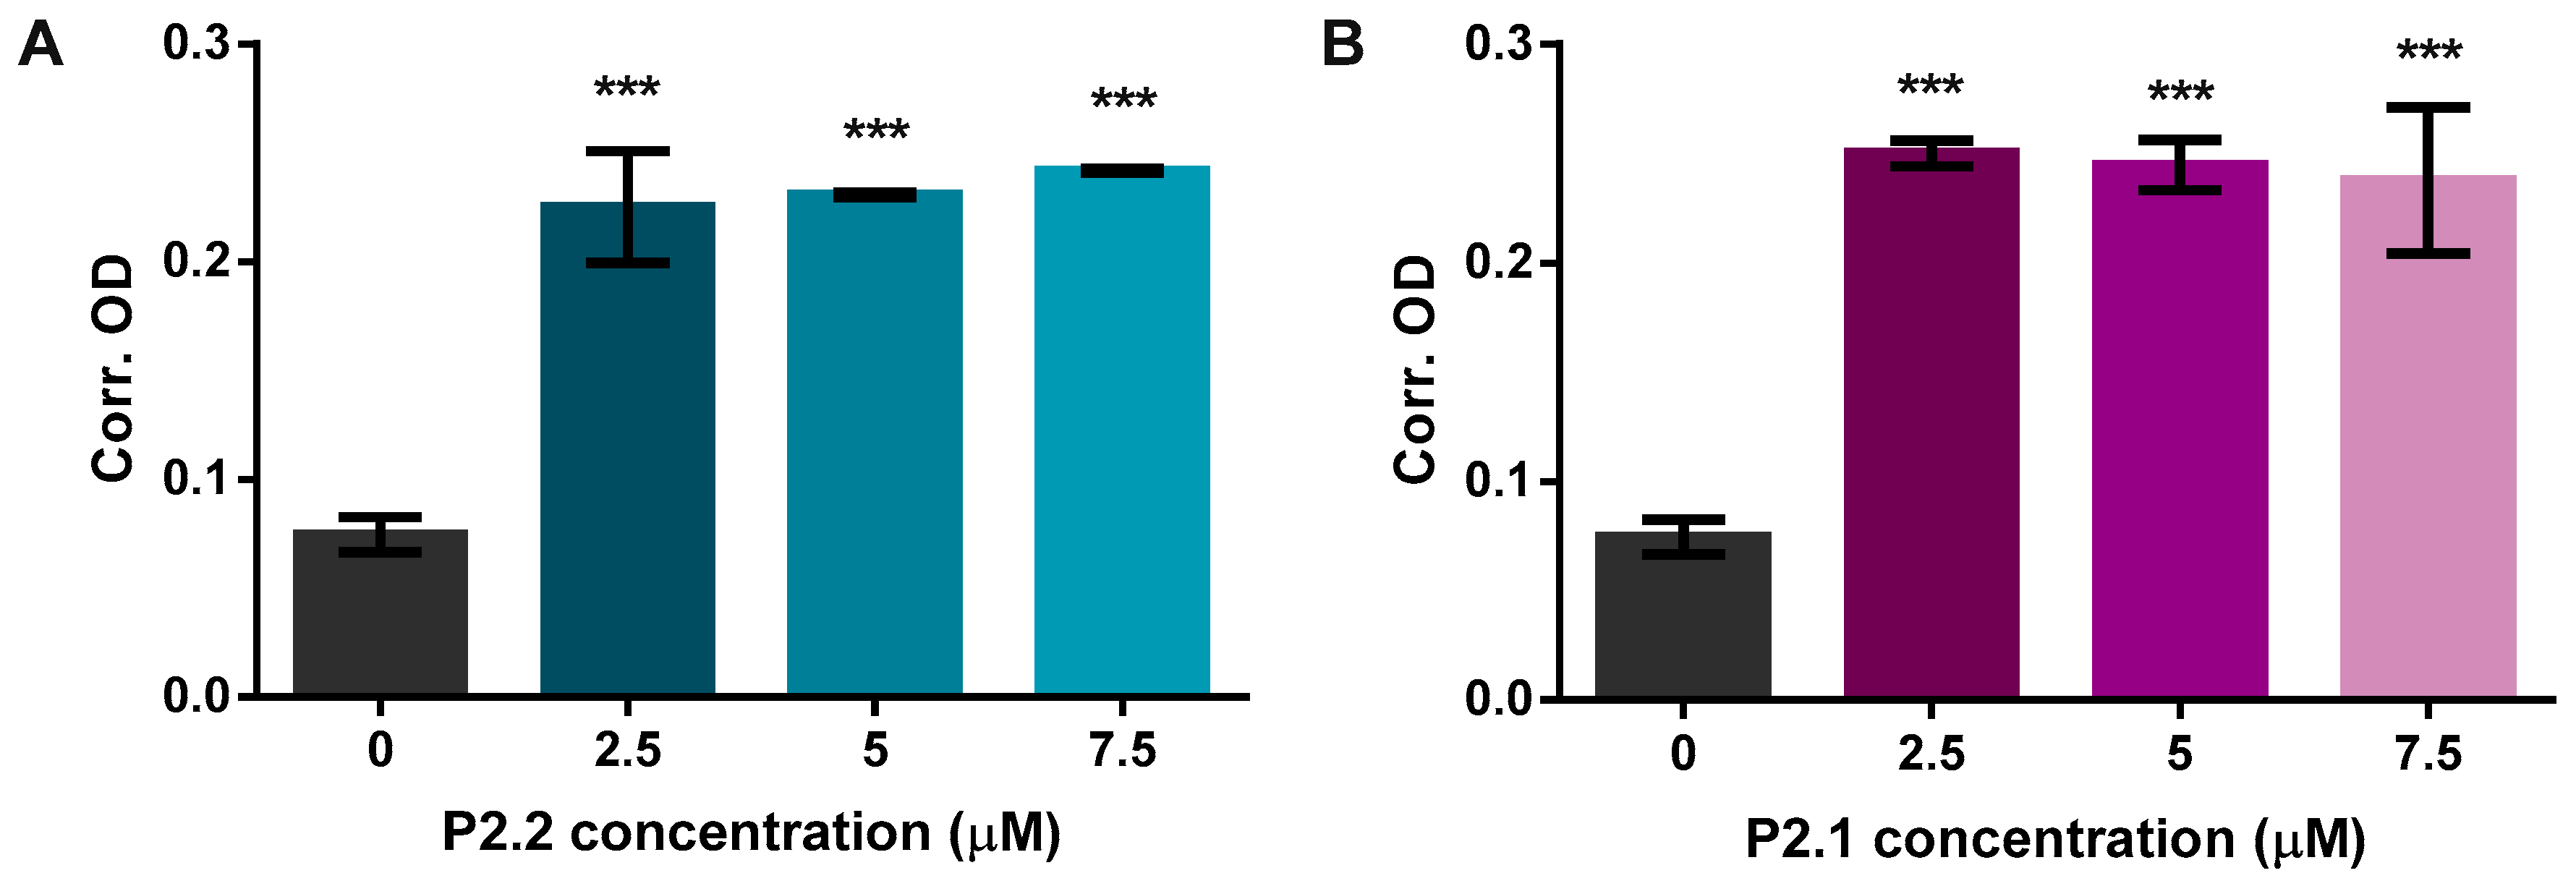
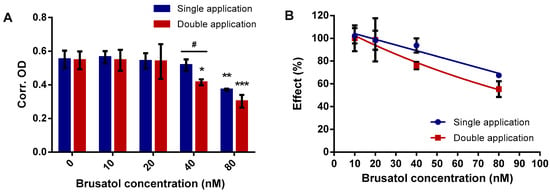
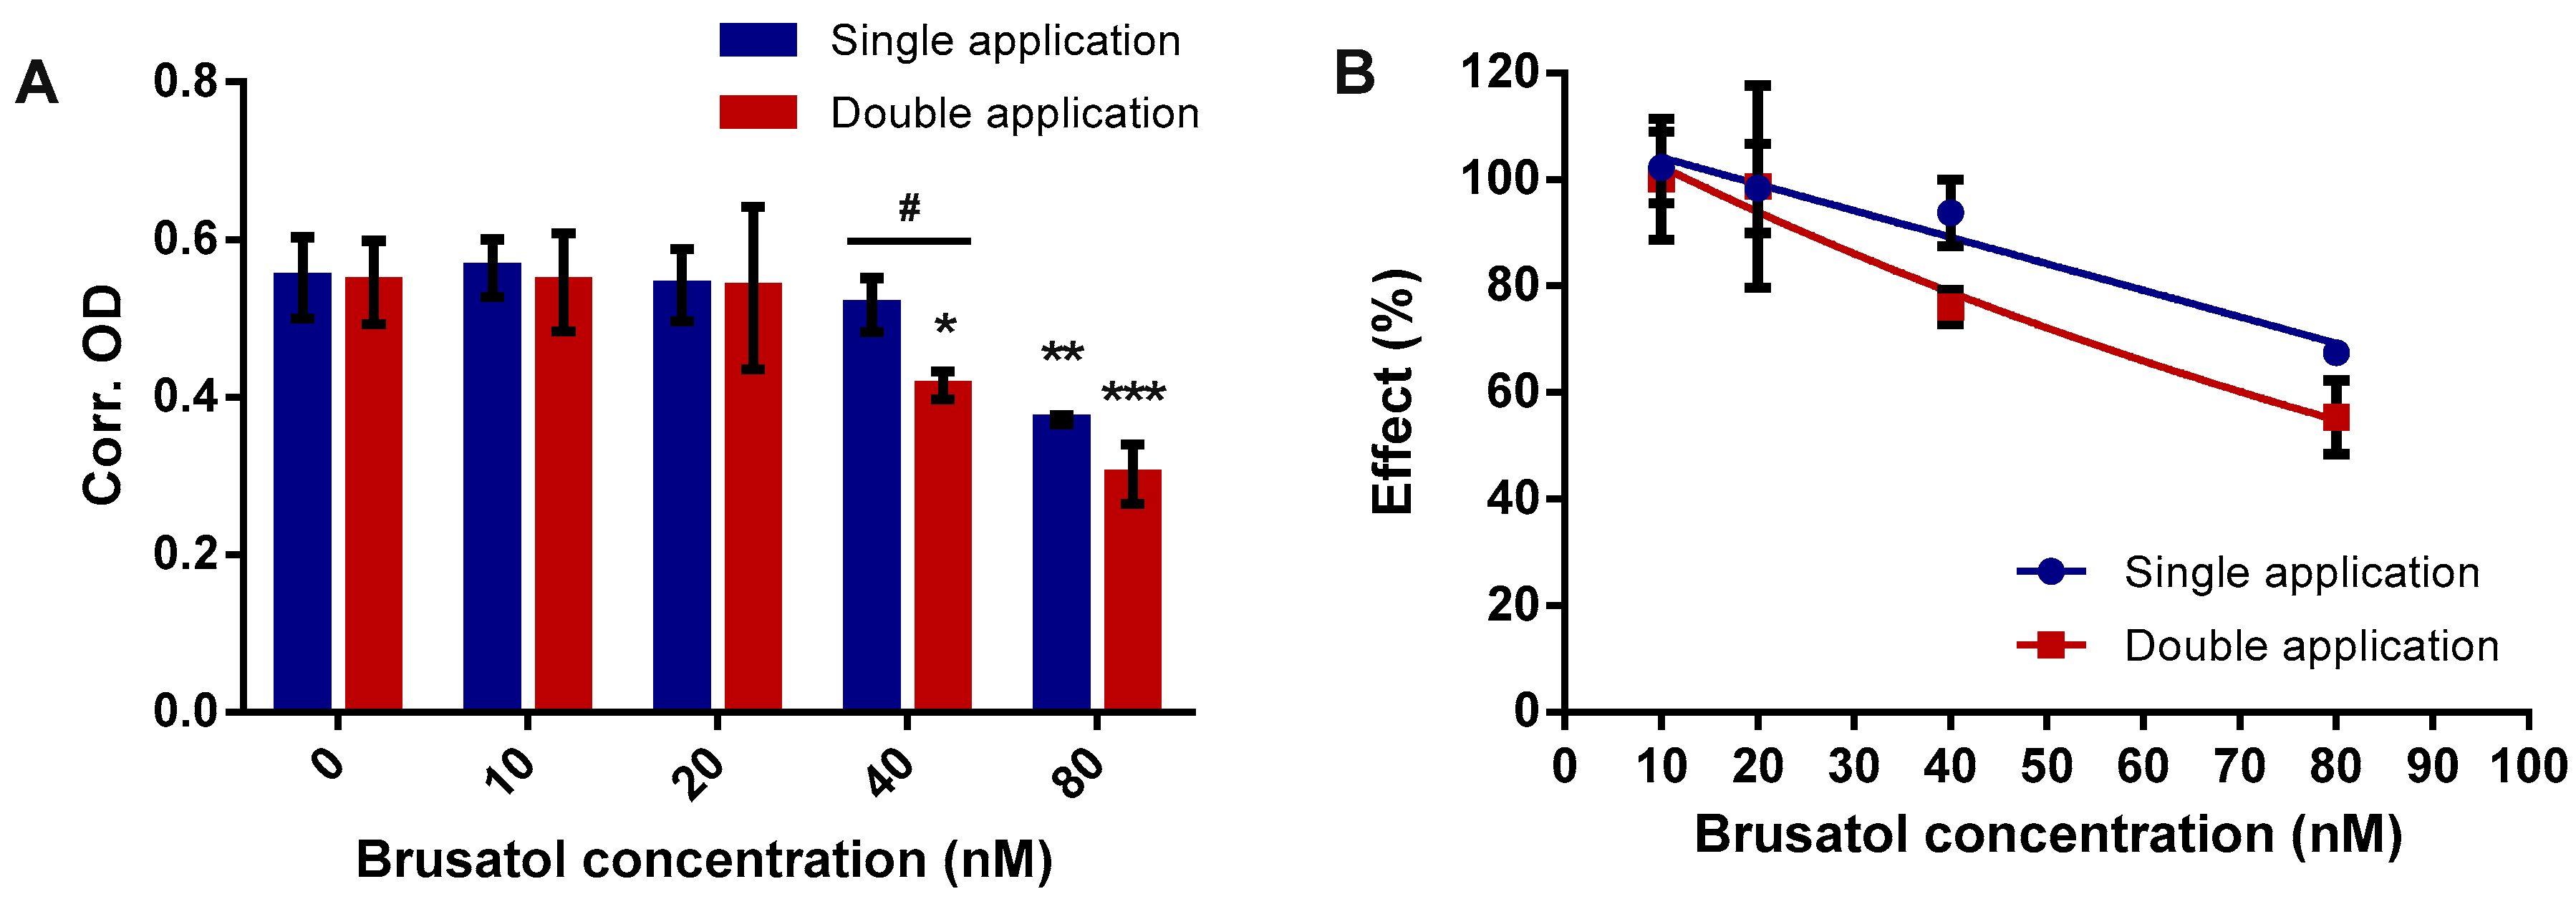
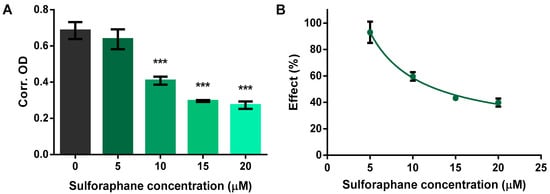
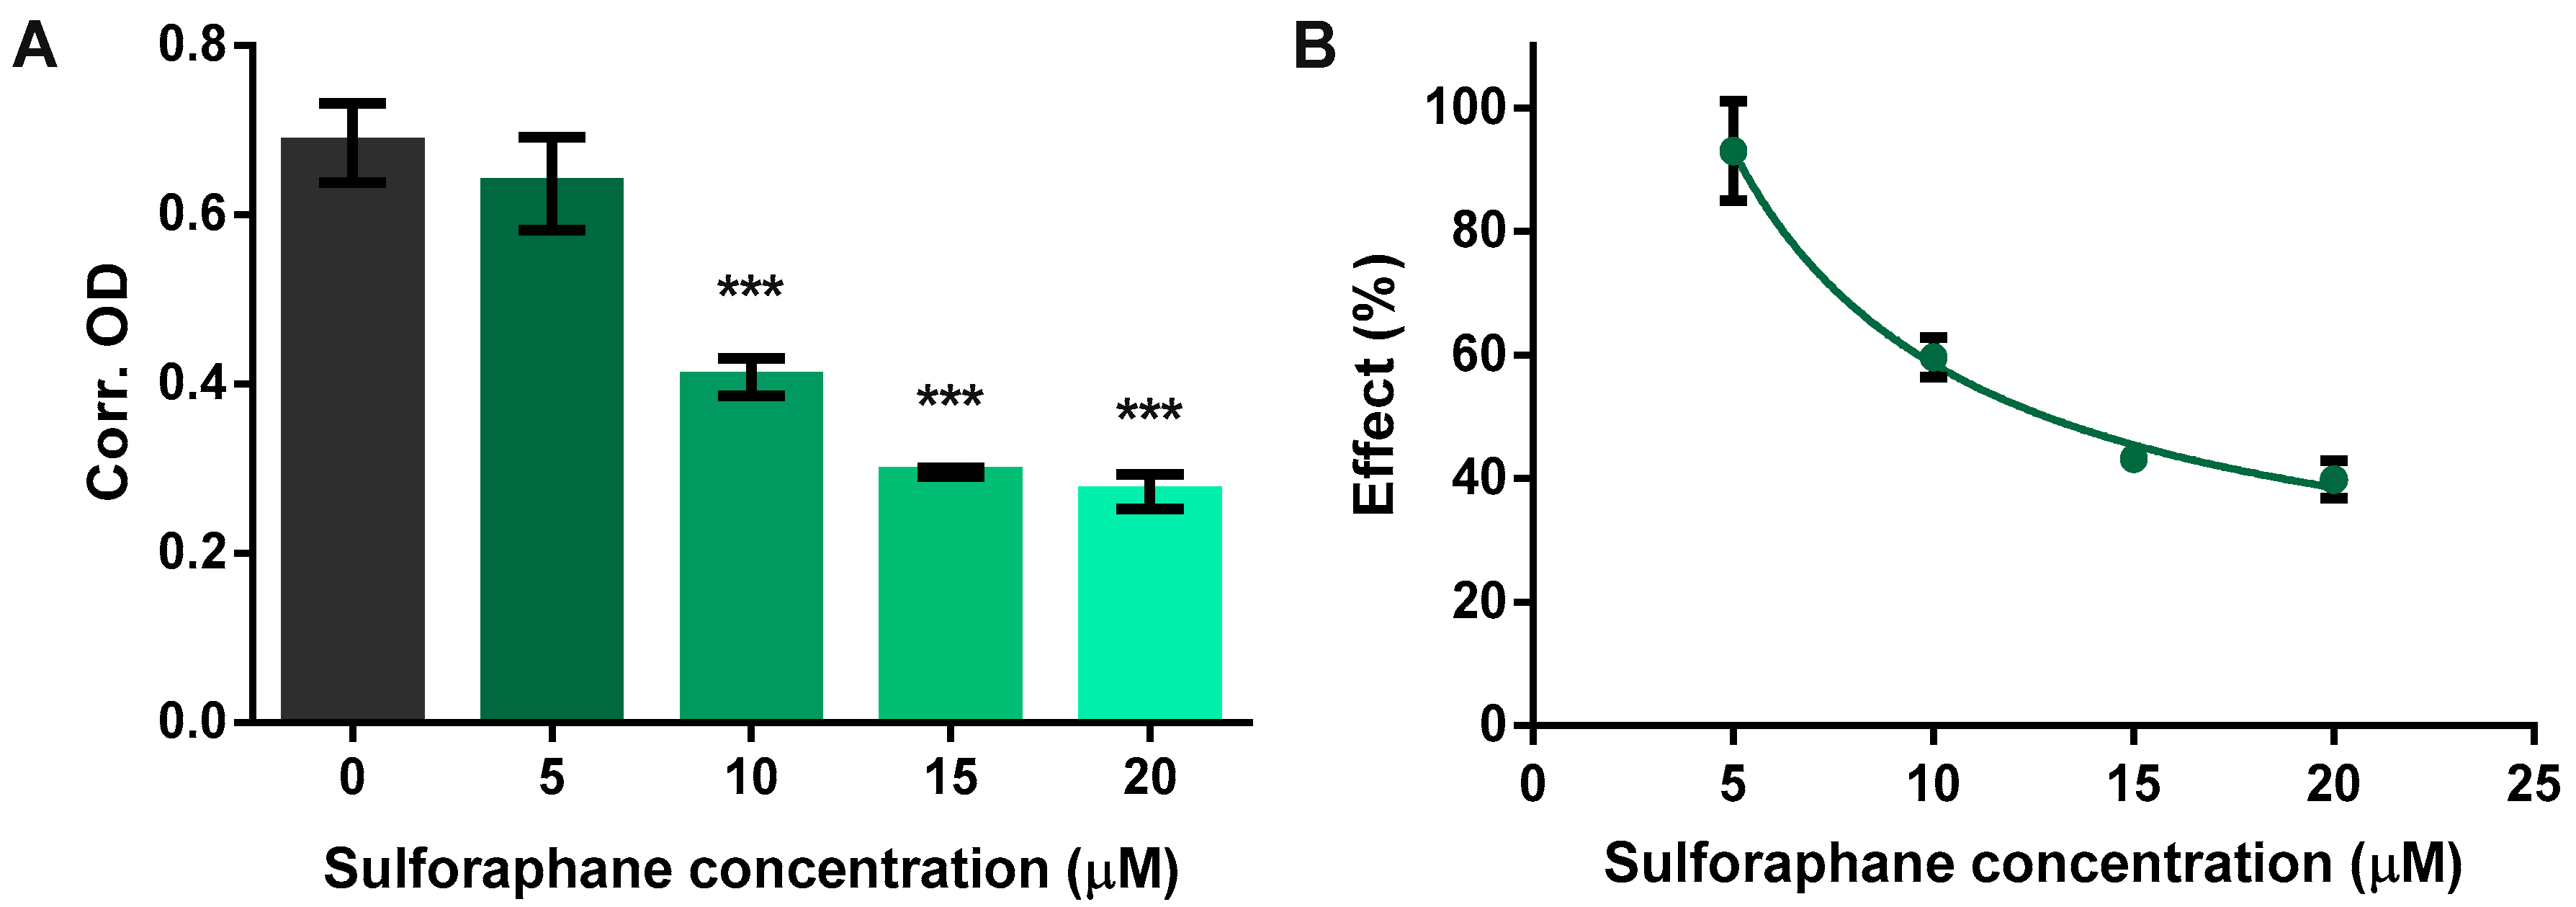
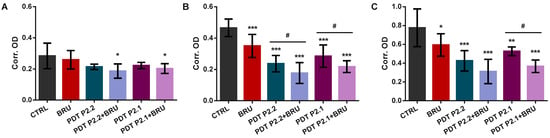
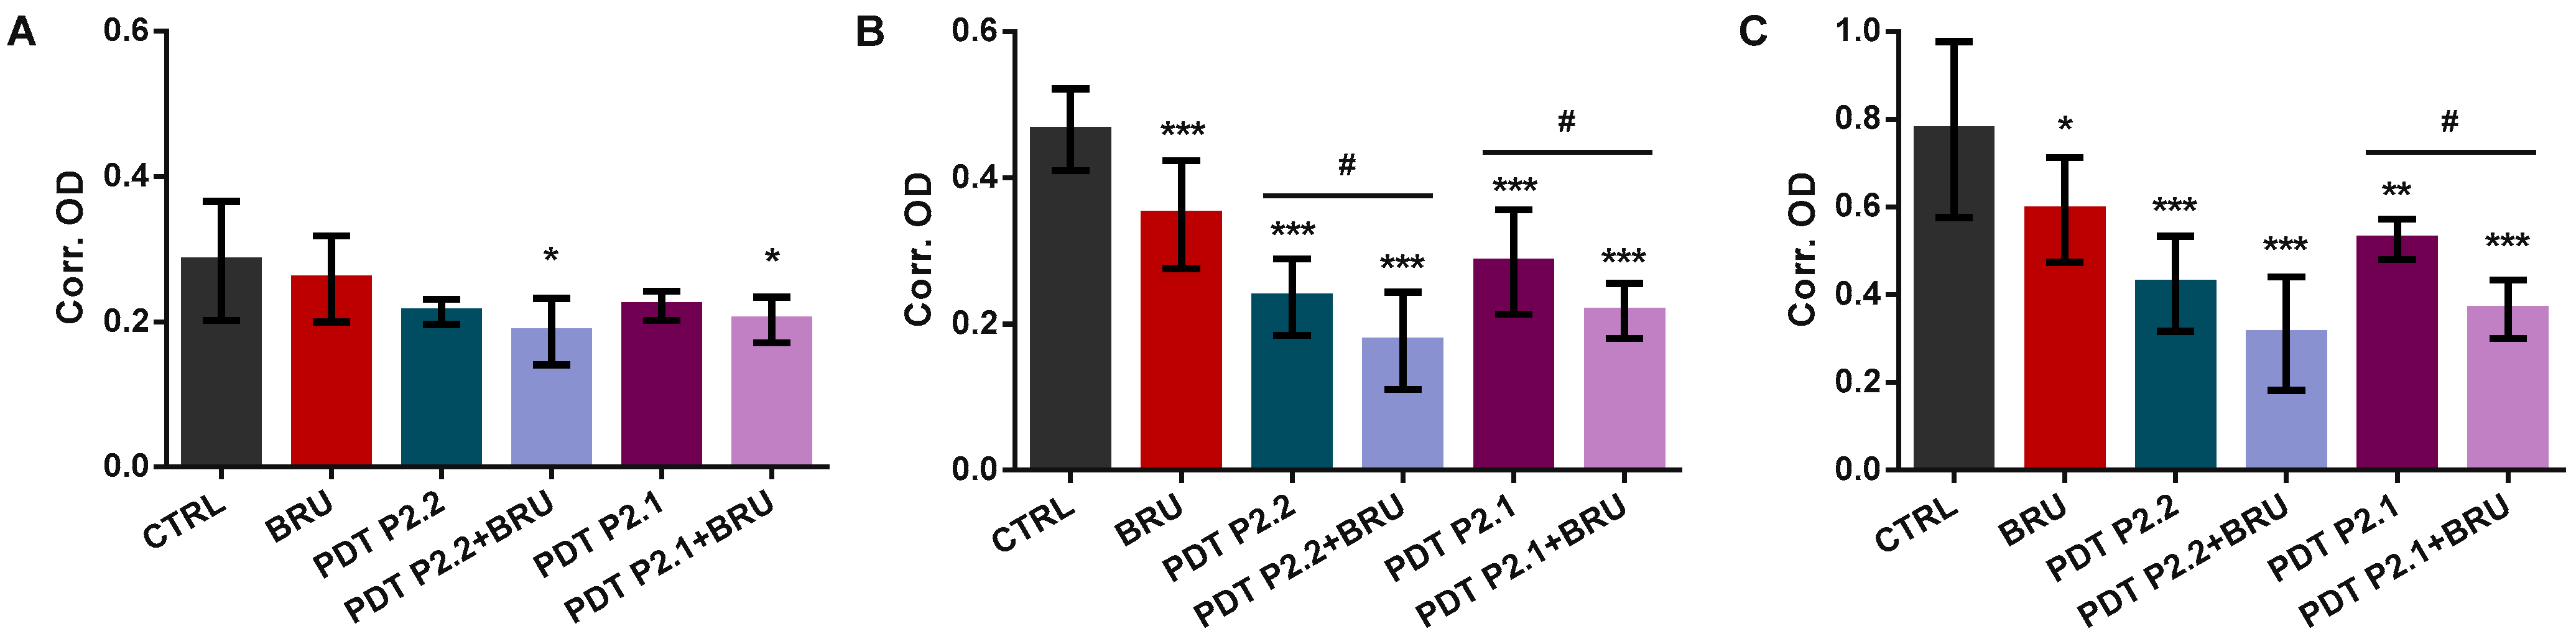
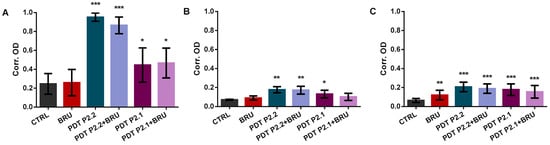
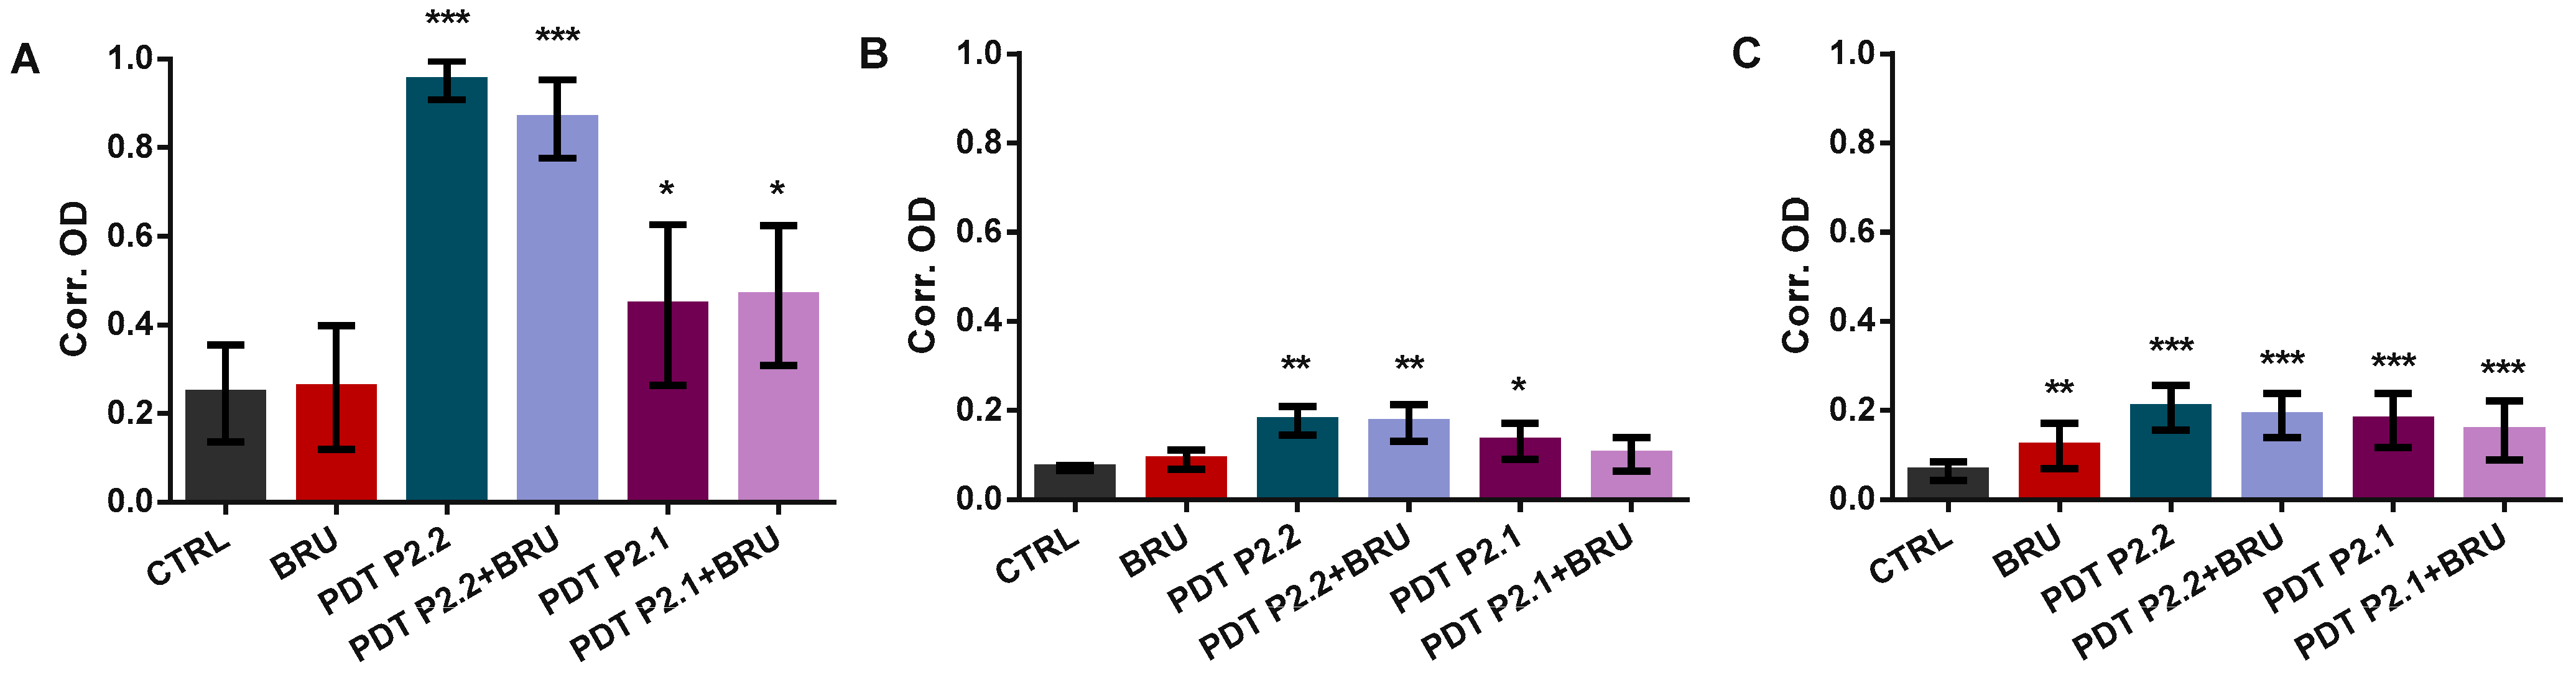
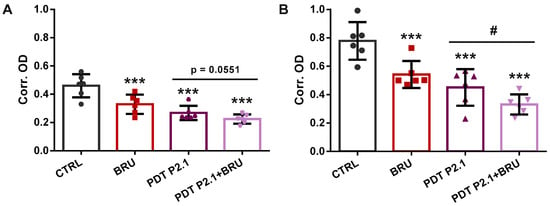
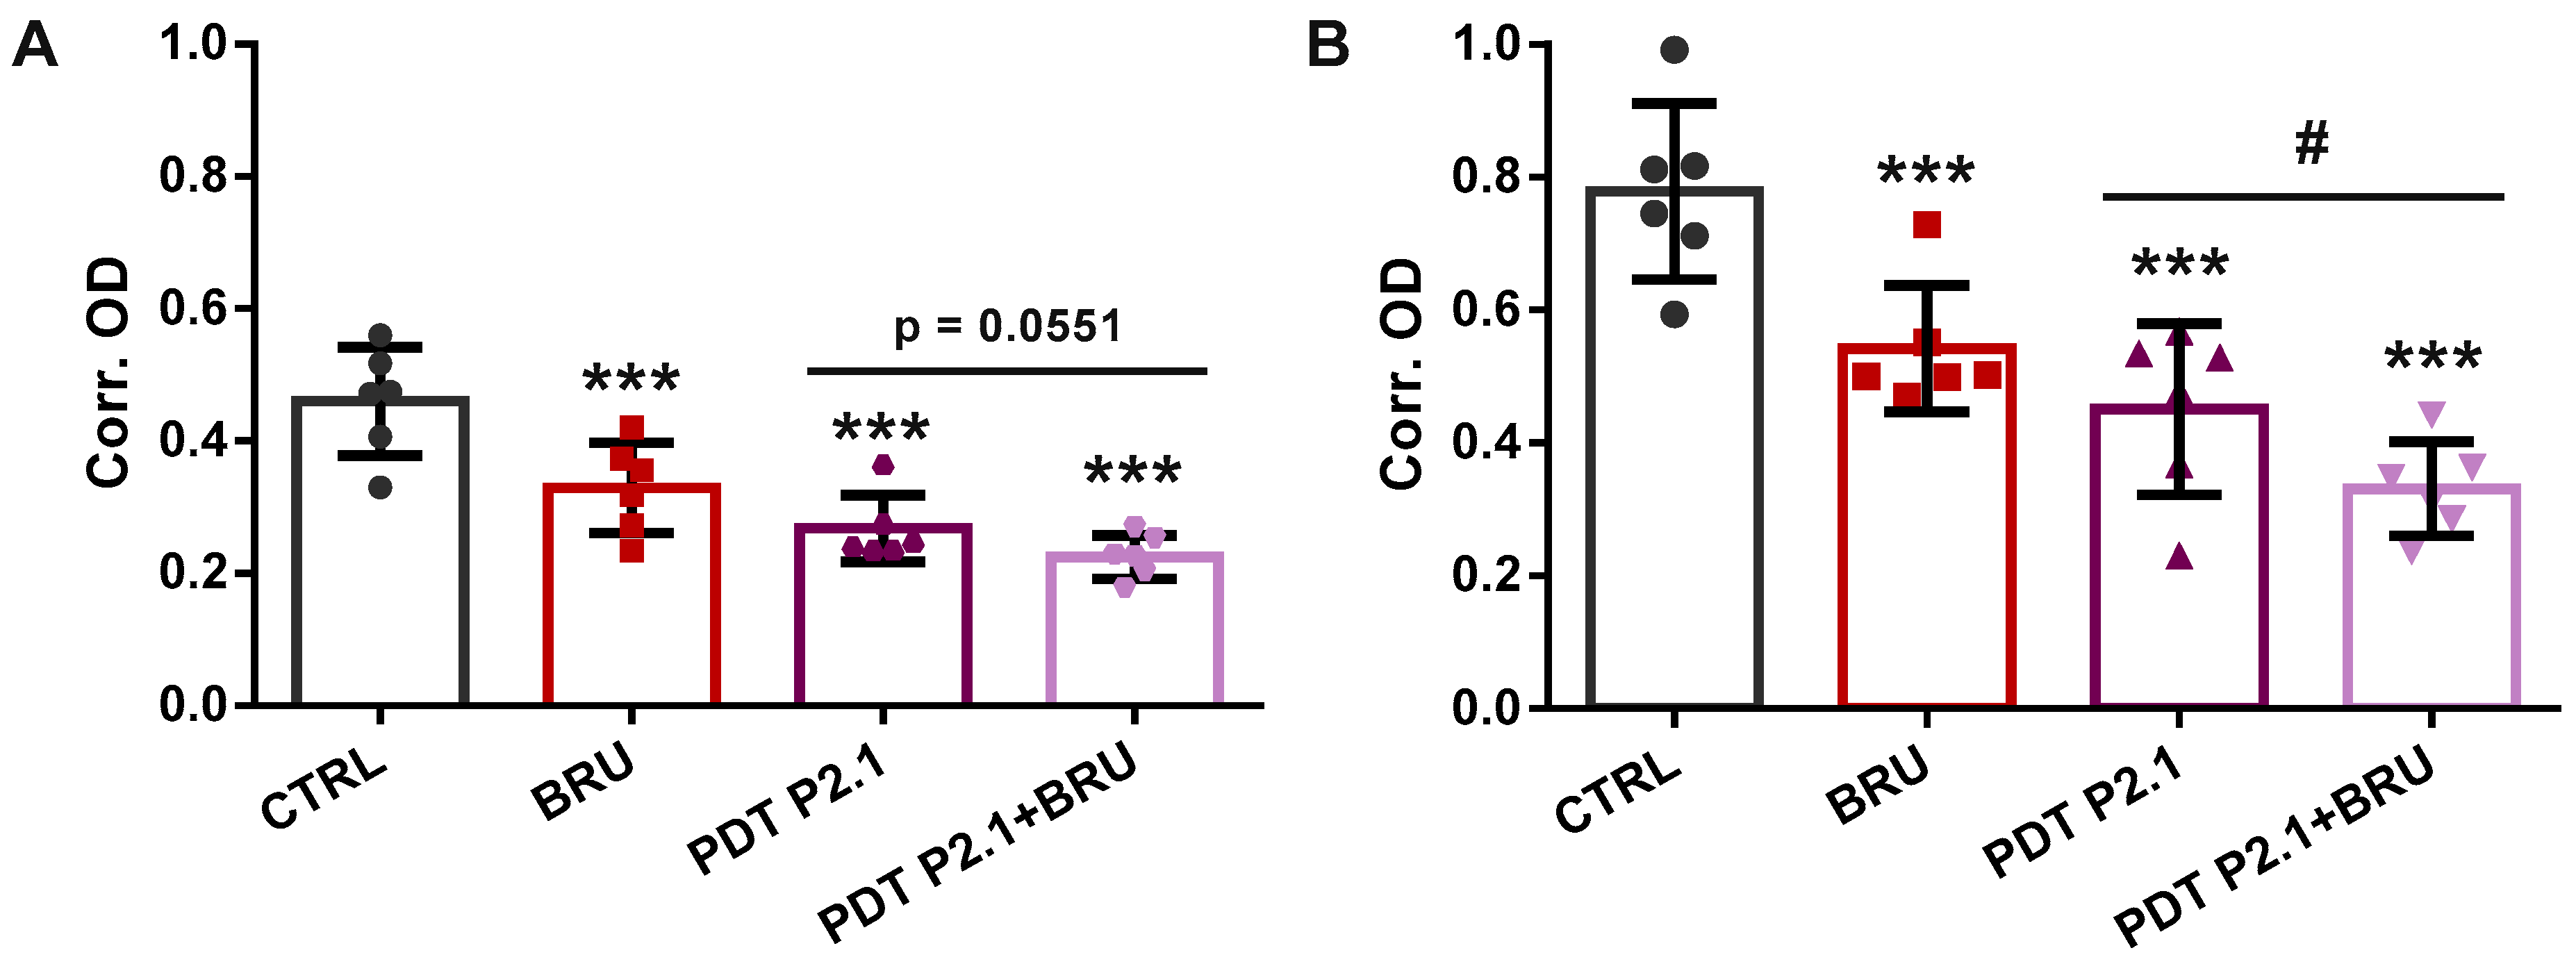
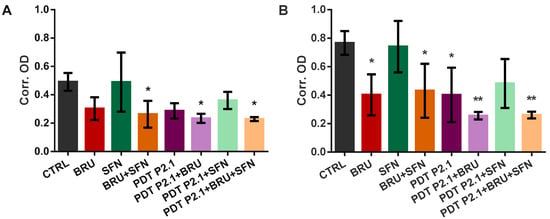
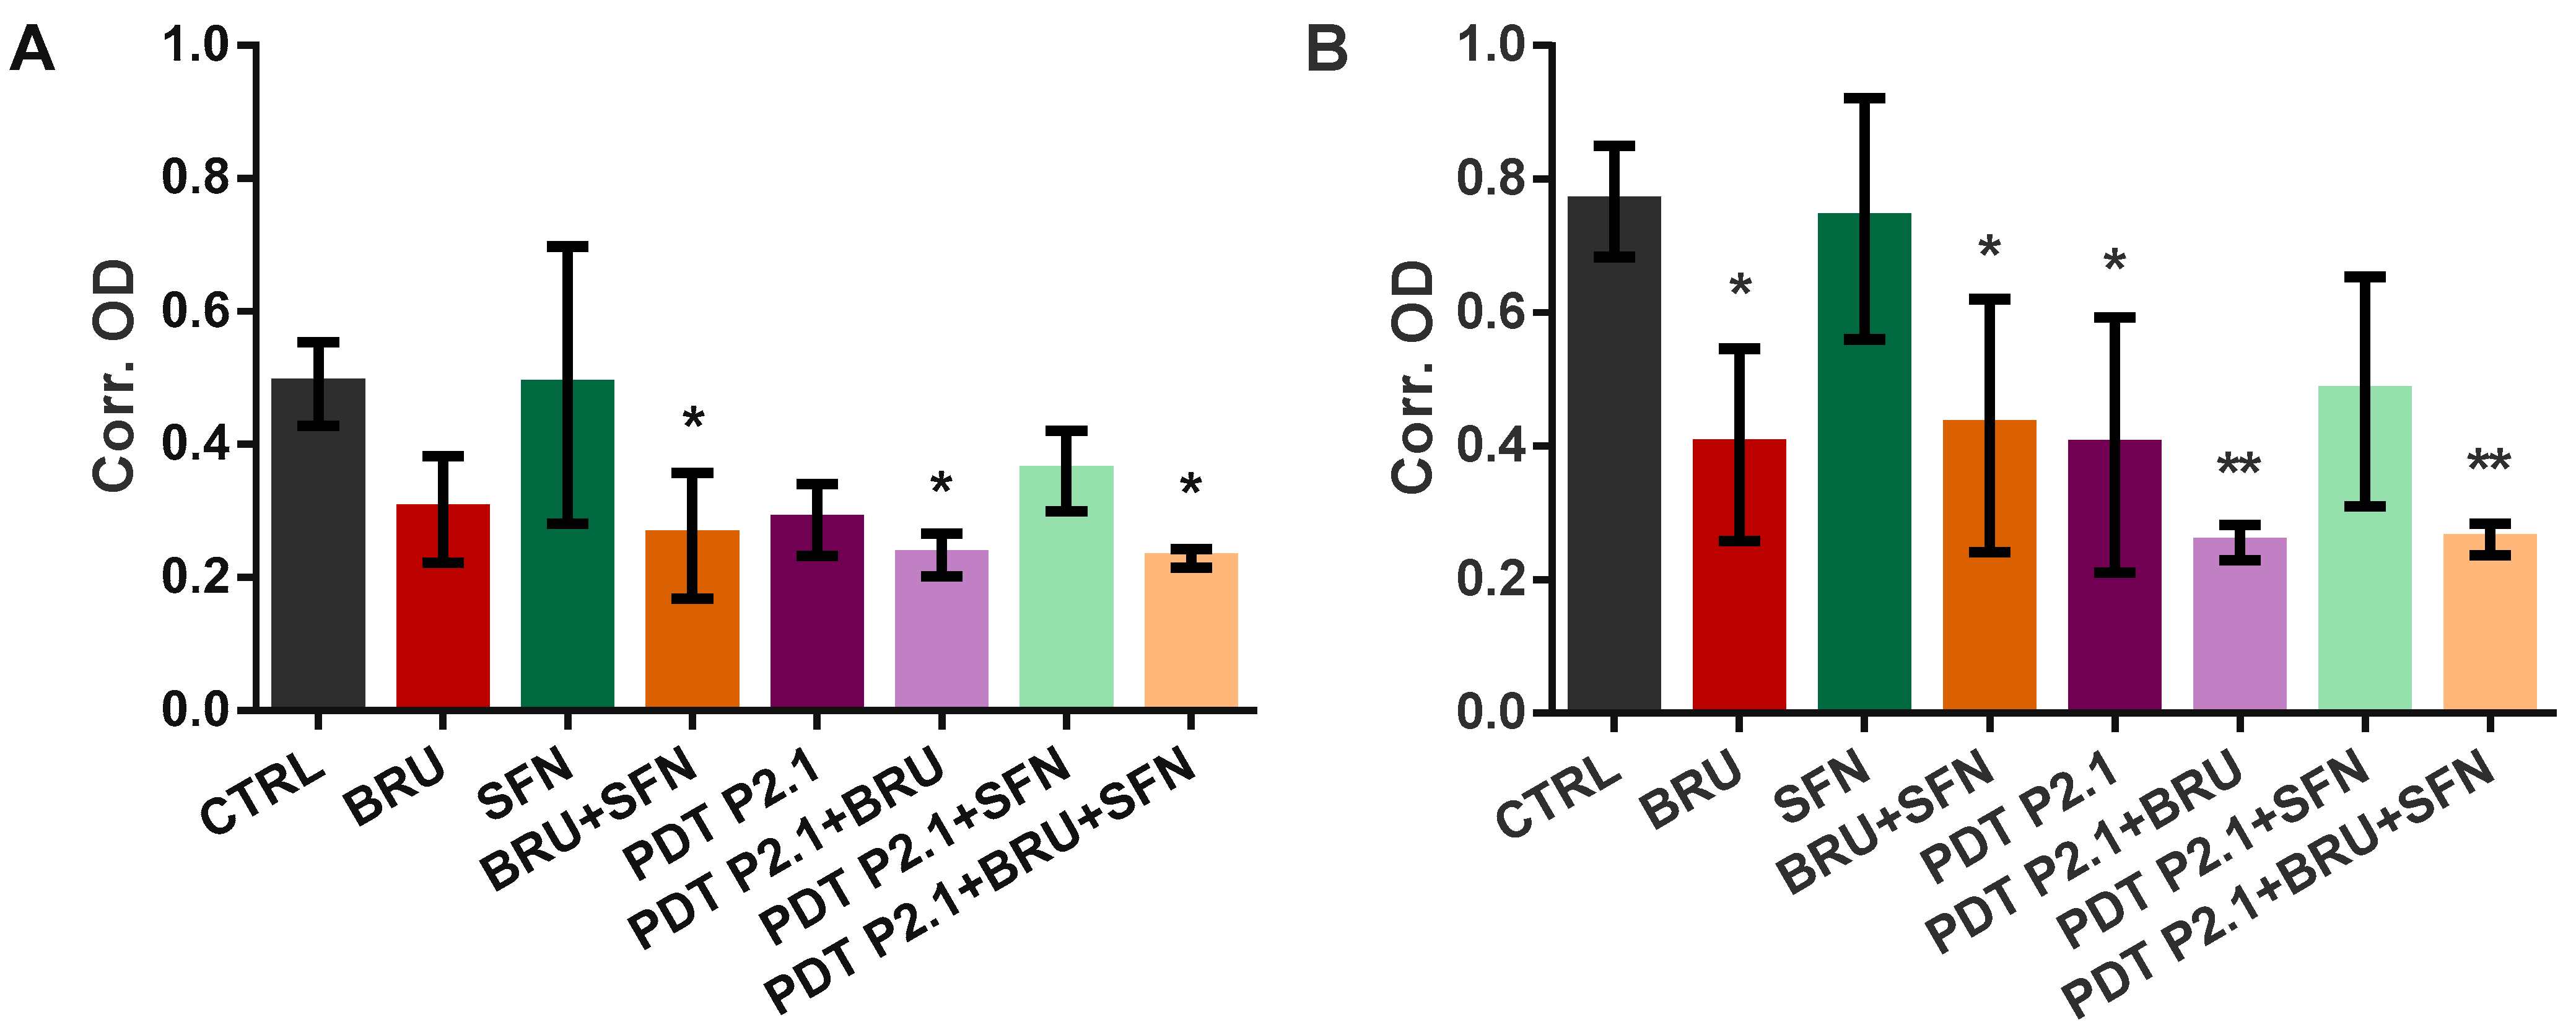
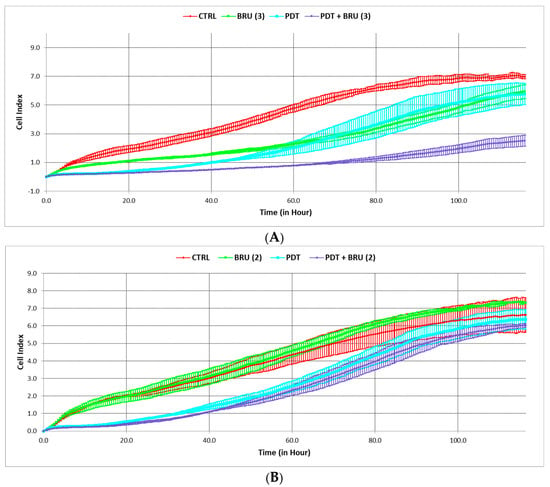
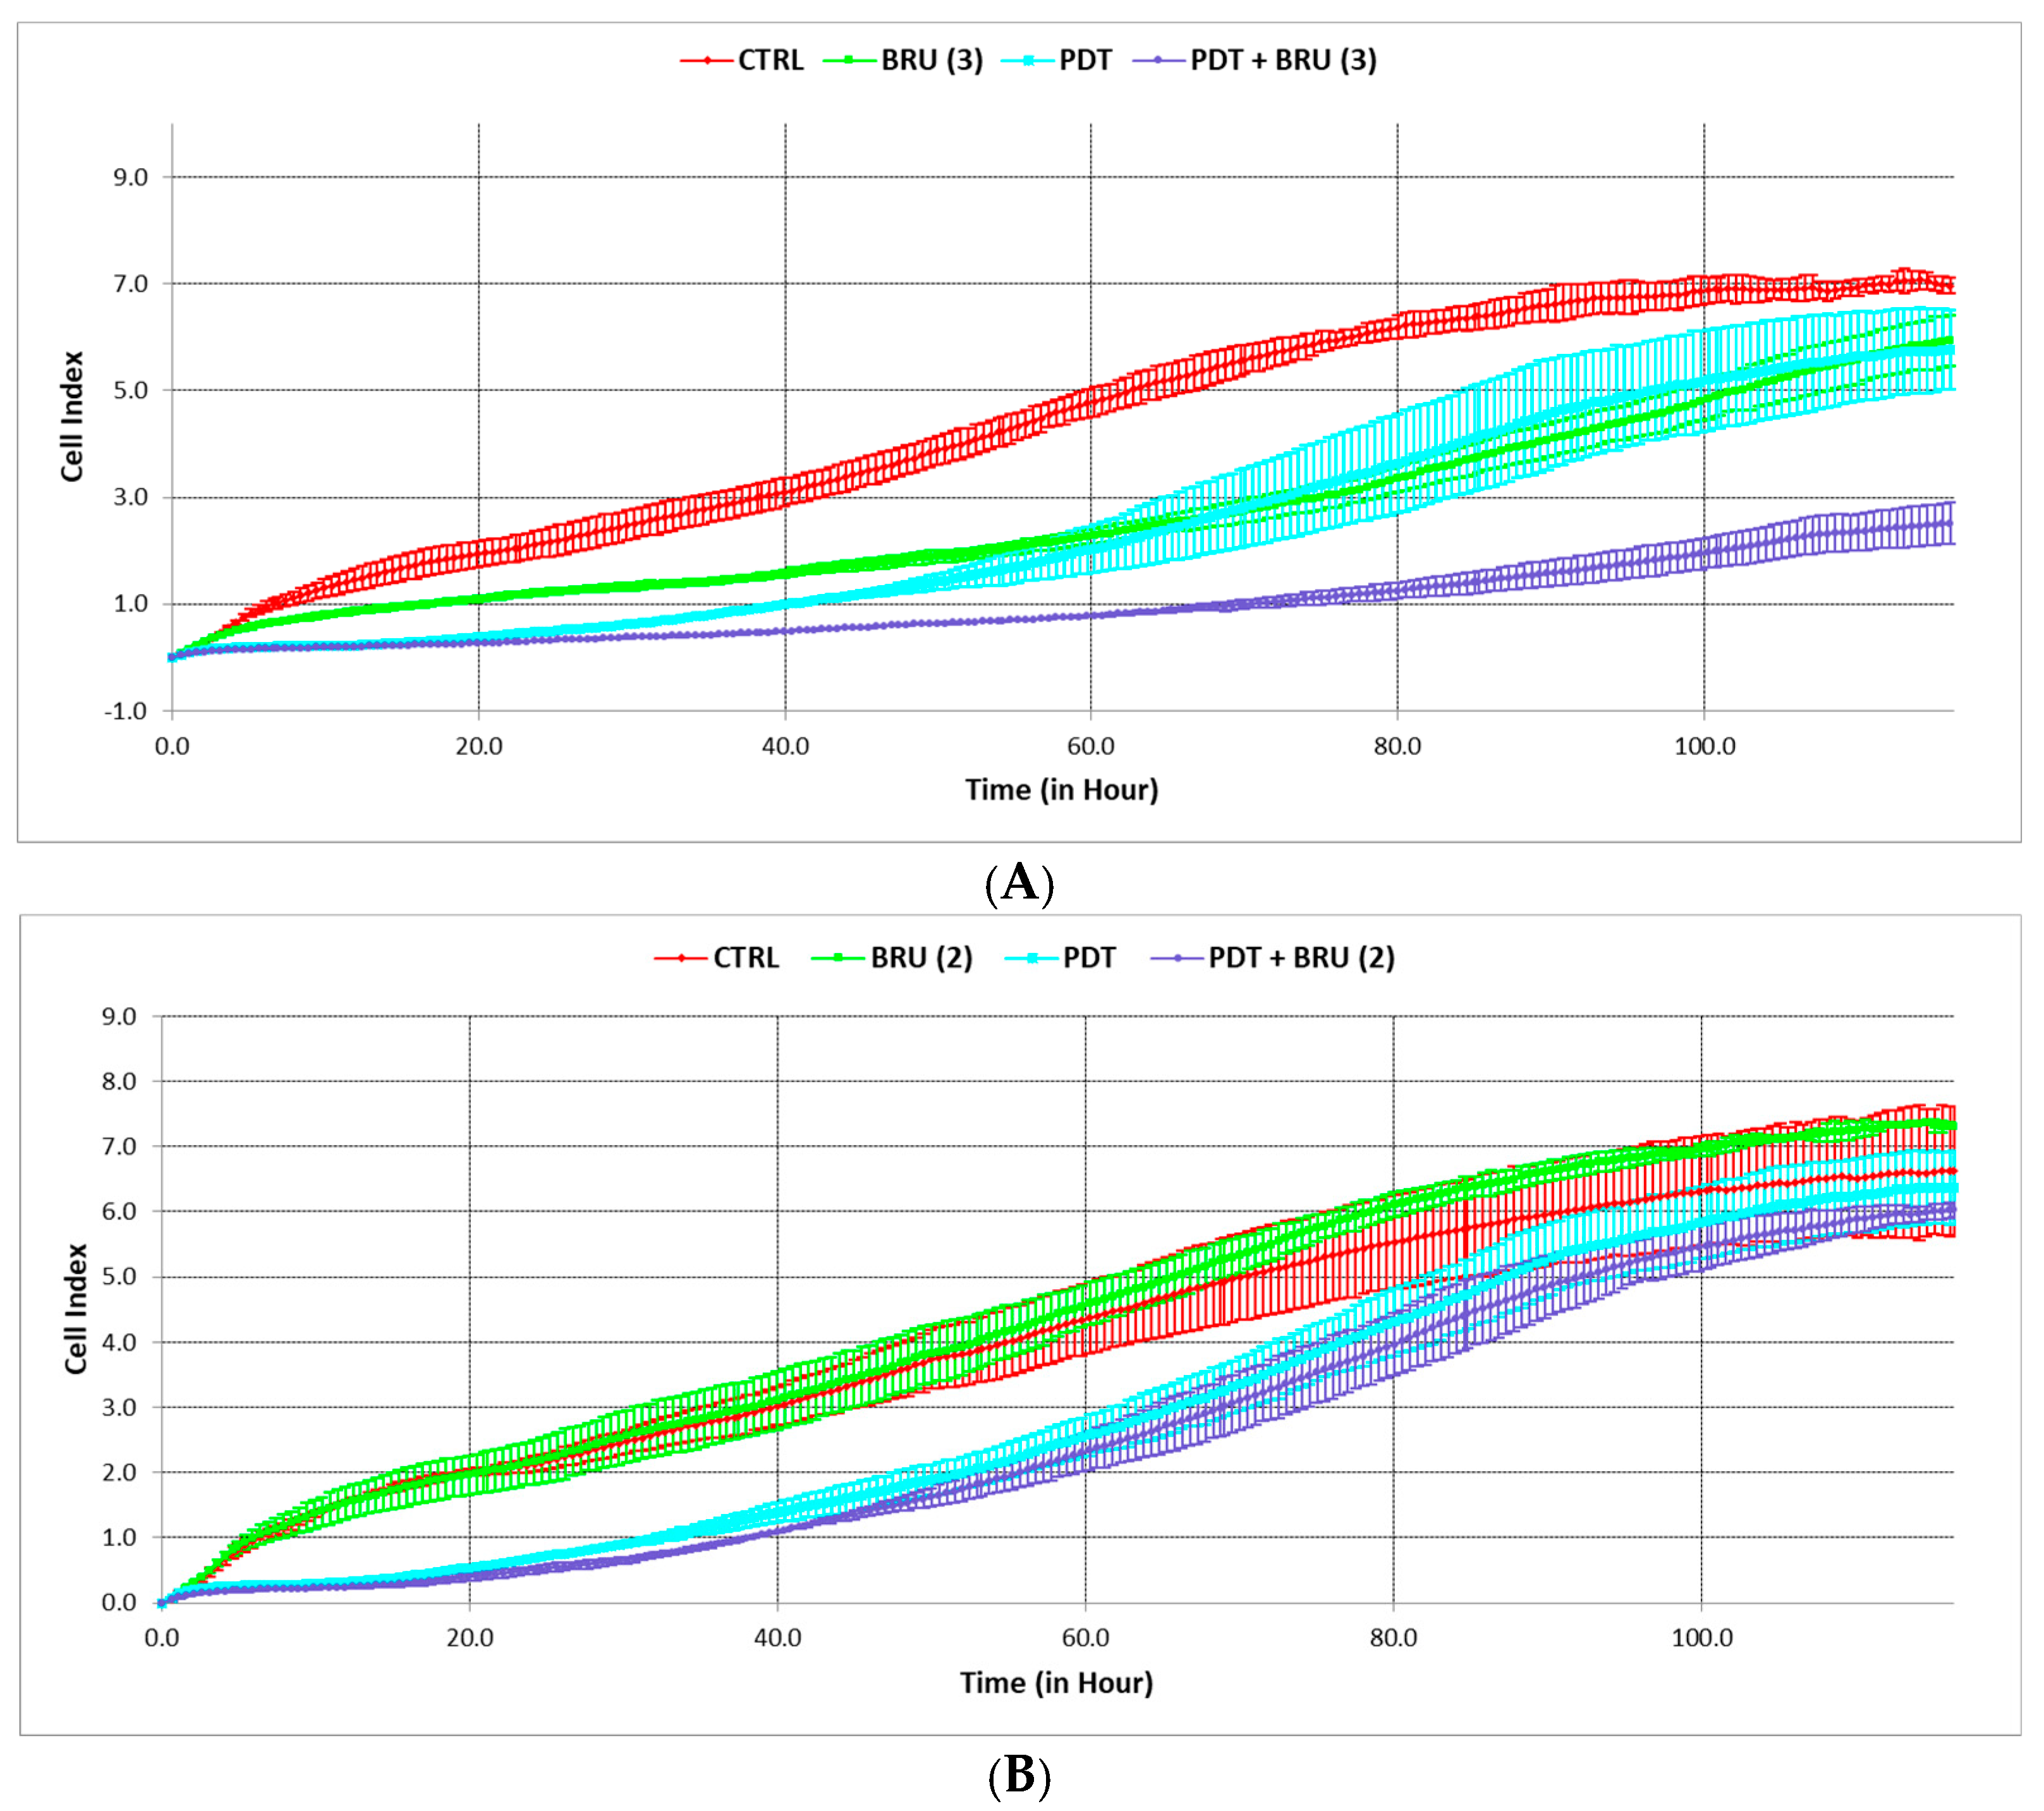
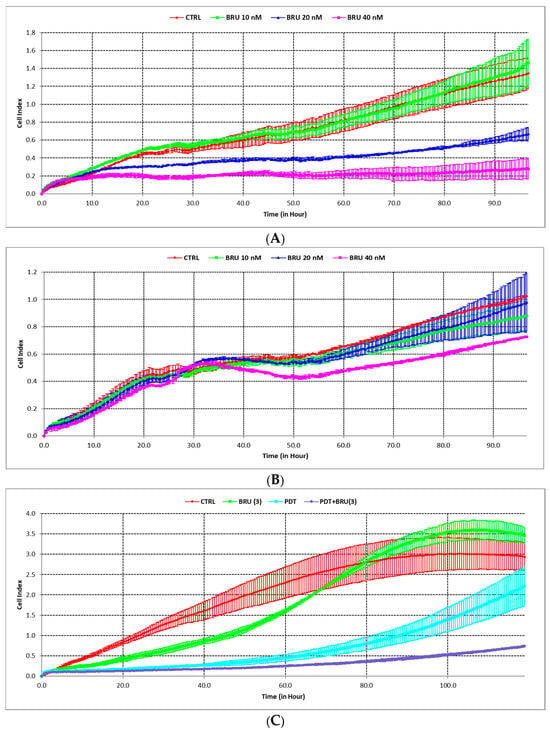
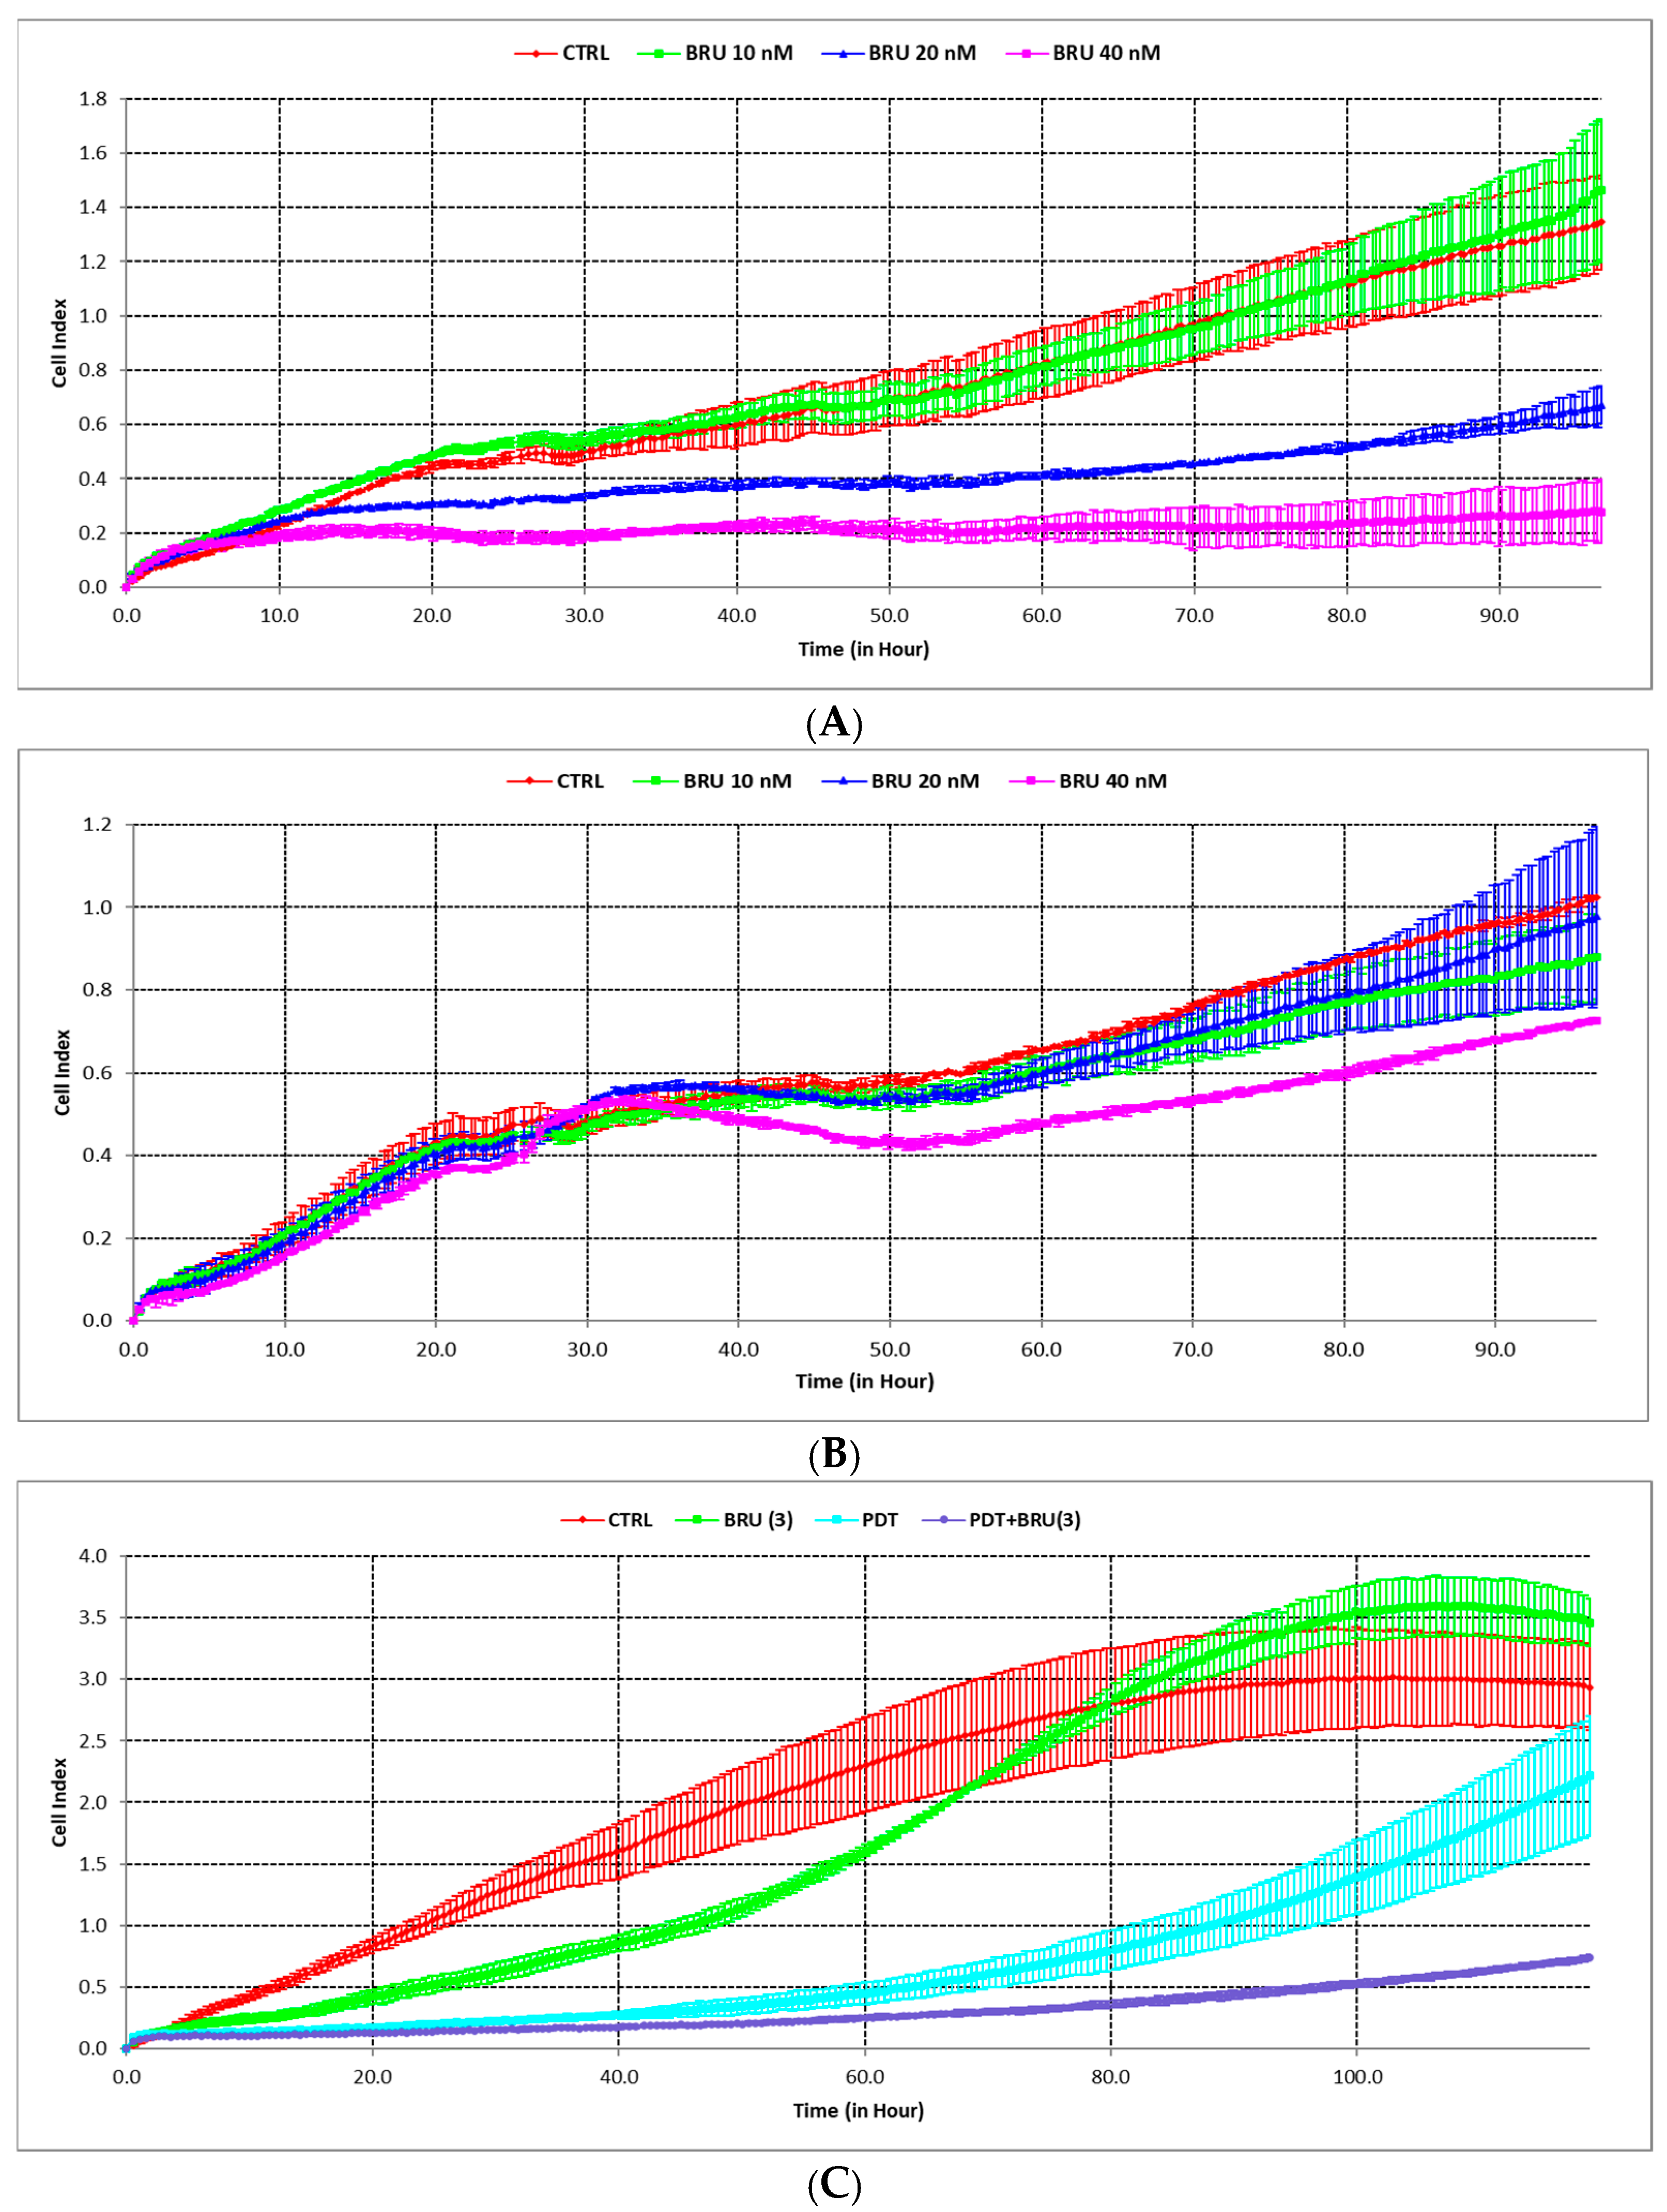
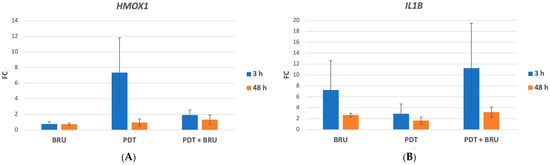
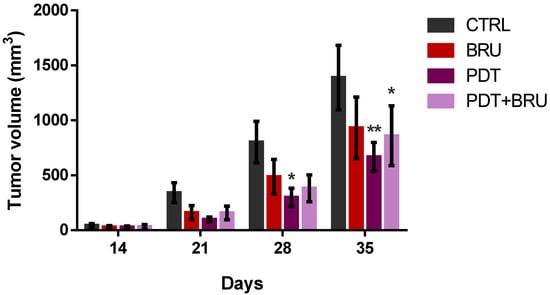
Disclaimer/Publisher’s Note: The statements, opinions and data contained in all publications are solely those of the individual author(s) and contributor(s) and not of MDPI and/or the editor(s). MDPI and/or the editor(s) disclaim responsibility for any injury to people or property resulting from any ideas, methods, instructions or products referred to in the content. |
© 2026 by the authors. Licensee MDPI, Basel, Switzerland. This article is an open access article distributed under the terms and conditions of the Creative Commons Attribution (CC BY) license.