


Abstract
Background: Wolfram syndrome (WFS) is a rare neurodegenerative disease that is genetically determined and inherited in an autosomal recessive manner. Although the first clinical symptom appearing in early childhood is diabetes mellitus, subsequent symptoms are associated with optic nerve atrophy, followed by central nervous system atrophy. Methods: The aim of the study was to analyse magnetic resonance images (MRI) of the brain in combination with single-voxel magnetic resonance spectroscopy (MRS) and to assess the copy number of mitochondrial DNA (mtDNA-CN) in 10 patients with WFS compared with a control group of 17 healthy individuals. Results: A significant decrease in the amount of selected metabolites was observed in WFS patients compared to controls in all assessed brain regions (pons, cerebellum, white matter, thalamus, and hippocampus). For three metabolites, Glutamate (Glu), Glutamate + Glutamine (Glx) and total N-acetylaspartate (TNAA), significant differences in concentrations were found between the study groups in almost all matrices evaluating specific areas of the brain (p < 0.011), with the exception of a trend toward reduced TNAA in the hippocampus (p = 0.065). In addition, patients with WFS had a significant decrease in the mitochondrial-to-nuclear DNA ratio compared to controls (p < 0.0003). Some metabolites, such as N-acetylaspartate and total N-acetylaspartate, showed strong correlations with specific regions of the visual pathway on MRI scans in patients with WFS. Conclusions: Selected brain metabolites and mtDNA-CN may become potential markers of WFS, and the results of this study may be used to define indicators for future therapeutic strategies.
1. Introduction
Wolfram syndrome (WFS) is an ultra-rare neurodegenerative disorder with autosomal recessive inheritance, with an estimated prevalence of 1 in 770,000 [1,2]. Two causative mutations in the WFS1 gene lead to the loss of wolframin protein function, resulting first in insulin-dependent diabetes in children around 5–7 years of age, followed by a wide spectrum of neurodegenerative disorders, ranging from optic nerve atrophy and cerebellar ataxia to premature death in patients [3,4,5]. These symptoms are also accompanied by other disorders, such as urological, endocrine and psychiatric problems [5,6,7]. In addition, animal models have shown that mice with Wfs1 deficiency exhibit altered serotonergic system function [8]. Efforts are ongoing to identify markers of the clinical course of this syndrome and effective causal treatments for WFS patients [9,10,11,12]. So far, parameters assessed during the optical coherence tomography (OCT) and brain magnetic resonance imaging (MRI) studies have been recognized as important clinical markers of disease progression [13,14,15,16]. New studies using qualitative MRI analysis in WFS patients have expanded the spectrum of white matter changes to include progressive inflammatory demyelination [17]. Longitudinal neuroimaging studies in patients with WFS have identified brain regions that show reductions across various stages of neurodegeneration, including the brainstem, cerebellum, thalamus, and white matter [15,16,17]. Moreover, the LC-MS (Liquid chromatography–Mass spectrometry) method was used to obtain a serum metabolic fingerprint of WFS patients, indicating that sphinganine derivatives may be a marker of ongoing neurodegeneration in these patients [18]. Furthermore, through metabolomic analysis of gingival crevicular fluid (GCF) collected from the oral cavity, metabolites distinguishing WFS patients from those with type 1 diabetes and healthy controls were identified [19]. Therefore, there was still a need for research to identify brain metabolites associated with neurodegeneration in affected brain regions of patients with WFS.
On the other hand, single-voxel magnetic resonance spectroscopy (MRS) is useful both for identifying markers of various neurodegenerative diseases and for monitoring the effectiveness of their treatment [20,21,22]. This relationship also applies to mitochondrial DNA copy number (mtDNA-CN), which is increasingly recognised as a potential marker of various neurodegenerative disorders [23,24]. In the case of WFS, it is particularly interesting that we are dealing with both insulin-dependent diabetes, where the copy number of mtDNA has already been described as an indicator of this disorder, as well as the progression of neurodegeneration [25].
The aim of this study was to compare magnetic resonance images of the brain with spectroscopic assessment (MRS) in patients with Wolfram syndrome and a control group. In addition, in the study group, MRS results were correlated with clinical parameters and recognized neuroimaging parameters, as well as mtDNA-CN.
2. Materials and Methods
The study group comprised 10 patients with Wolfram syndrome who participated in the clinical trial “TreatWolfram” (NCT03717909). The study was approved by the relevant bioethics committee (RNN/379/19/KE and RNN/191/19/KE), and all participants and/or their parents signed an informed consent form. The WFS diagnosis in all participants was confirmed by Sanger sequencing to identify causative variants in the WFS1 gene, as previously described [26]. All WFS patients had insulin-dependent diabetes mellitus diagnosed based on WHO criteria, coexisting with optic nerve atrophy supported by the OCT method. Clinical parameters assessed in patients with WFS included: indicators of glucose metabolism (glucose level and glycated hemoglobin—HbA1c), patients’ age at diagnosis, body weight, and BMI (body mass index).
Data obtained from patients with WFS were compared with data from a control group of healthy individuals (n = 17) matched for gender (p = 0.41) and age (p = 0.36); the mean age of patients was 24.6 ± 4.12 years, whilst in the control group it was 22.6 ± 6.82 years.
Brain MRI with spectroscopic evaluation was performed on individuals from the study and control groups, and a buccal mucosa swab was collected to assess mtDNA-CN.
2.1. Magnetic Resonance Spectroscopy (MRS) Analysis
All scans were conducted on a 3.0 T Achieva dSTREAM scanner (Philips, Cambridge, MA, USA). Initially, a three-dimensional T1-weighted turbo field echo (3D TFE) sequence was acquired to enable precise planning of the MRS voxels. Proton MRS measurements were then performed using a single-voxel (SV) acquisition technique. The following SV PRESS sequence parameters were implemented in the examinations of our patients: TE = 35 ms, TR = 2000 ms, NSA = 128, flip angle: 90°, spectral resolution: 1.95 Hz/point, spectral bandwidth: 2000 Hz, samples: 1024. The voxel geometry was adapted to the anatomical region and comprised cubic, cuboidal or trapezoidal shapes. The minimum voxel edge length was 10 mm, and the maximum was 20 mm. Voxel volumes ranged from 1 to 8 mL.
For each participant, one voxel was positioned in each of the following brain regions: pons, cerebellar hemisphere white matter (cerebellum), cerebral hemisphere white matter (white matter), hippocampus and thalamus.
For anatomically symmetrical structures, voxel placement was performed primarily on the left side of the brain and cerebellum. If left-sided placement was prevented by technical or anatomical constraints, the voxel was positioned on the contralateral side. Each MRS sequence was performed twice per patient, with and without water saturation. Following data acquisition, the raw MRS spectra were exported to Tarquin (version 4.3.10), an open-source software package for automated spectral analysis. Quantification of neural tissue metabolites was carried out fully automatically using the default Tarquin processing pipeline, as described previously [27].
To assess visual pathway atrophy, two experienced radiologists independently measured the transverse diameter of the intracranial and intraorbital portions of the optic nerves, the optic chiasm, and the optic tract on volumetric T1-weighted images in axial, coronal, and sagittal planes, as described earlier [28].
2.2. Analysis of the mtDNA Copy Number
From patients and the control group, cheek mucosal swab samples were collected non-invasively during routine dental examinations performed by two experienced dentists. Samples for molecular analysis were collected in sterile vials with screw caps and then stored at −20 °C.
Total DNA (from both the nuclear and mitochondrial genomes) was extracted from swabs using QIAamp DNA kits (QIAGEN, Hilden, Germany) according to the manufacturer’s protocol. The copy number of mtDNA was quantified using quantitative PCR (qPCR) assay performed on a LightCycler 480 instrument (Roche Diagnostics, Rotkreuz, Switzerland) with TaqMan probes (Thermo Fisher Scientific, Waltham, MA, USA). The MT-TL1 gene was amplified as the mtDNA target, as previously described by Rooney et al. [29]. The beta-globin gene was used as an internal reference and was also detected using a TaqMan probe. Both targets were amplified in the same reaction using different dyes, in triplicate, under the manufacturer’s standard cycling conditions for the TaqMan™ Genotyping Master Mix (Thermo Fisher Scientific, Waltham, MA, USA). The primers and conditions are shown in Supplementary Table S1. The relative abundance of mitochondrial DNA was calculated using the ΔCt method, where ΔCt = Ct_mtDNA − Ct_nDNA, and the relative quantities were derived as R = 2−ΔCt.
2.3. Statistical Analysis
Prior to statistical analysis, the data matrix of brain metabolites was filtered to include only metabolites measured in at least 80% of patients. All metabolites were normalized to TCr (total creatine) prior to analysis. Where values were missing, the k-Nearest Neighbors (KNN) method was used to impute the data. Clustering with a heat map and a violin plot was performed for each brain region, indicating statistically significant values (Mann–Whitney U test) adjusted by the false discovery rate (FDR) correction. Cohen’s d method was used to estimate the effect size in the post hoc power analysis. Statistical analysis for mtDNA-CN assessment was performed using the Shapiro–Wilk test to assess the normality of each group and Levene’s test to assess homogeneity of variance. Due to unequal variances, group comparisons were performed using Welch’s t-test. Next, for the group of patients with WFS, Spearman’s correlation analysis was performed between the metabolites measured in MRS, clinical and neuroimaging parameters, and mtDNA-CN. Statistical significance was defined as p < 0.05.
3. Results
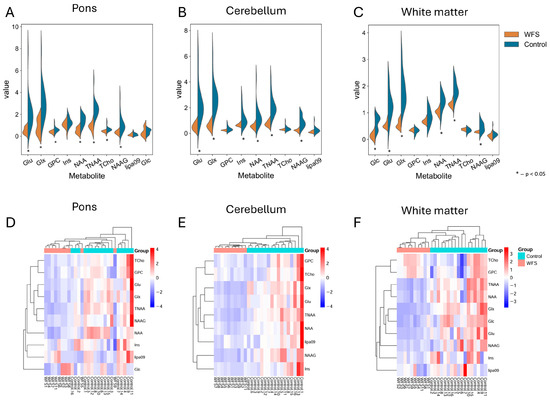
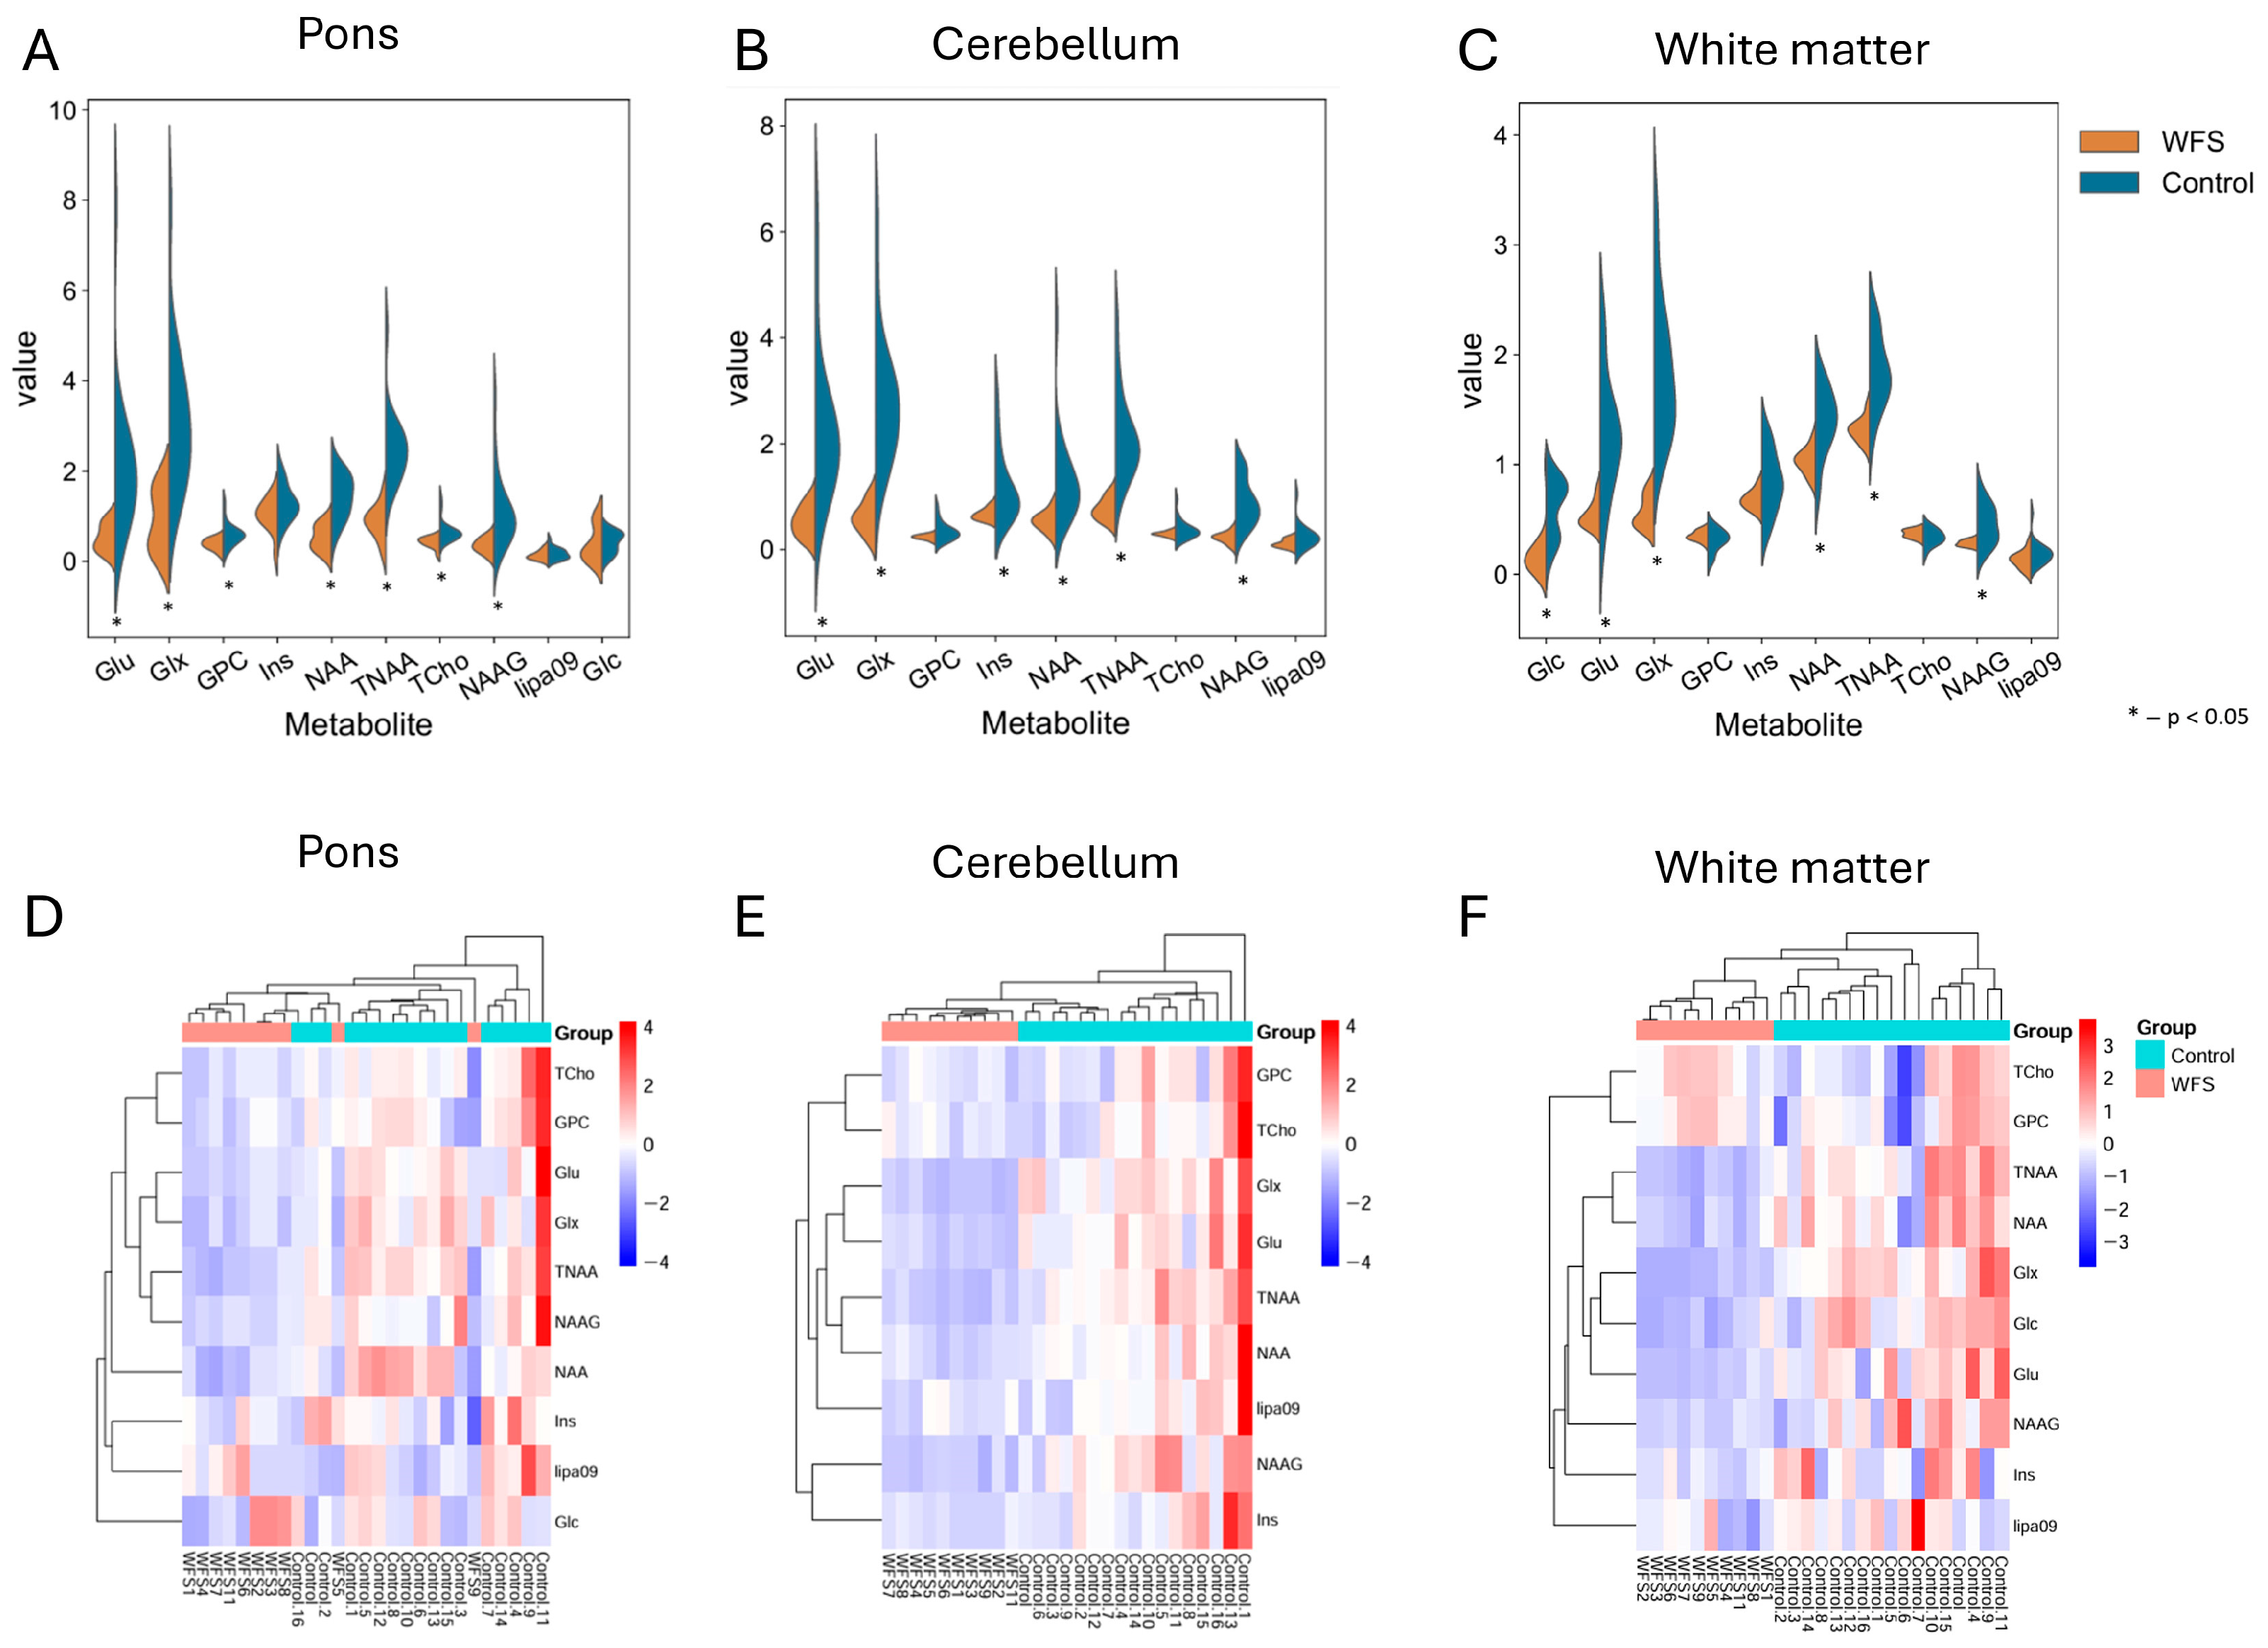
Figure 1A shows that the concentrations of eight metabolites—Glu (Glutamate), Glx (Glutamate + Glutamine), GPC (glycerophosphocholines), Ins (myo-inositol), NAA (N-acetylaspartate), TNAA (total N-acetylaspartate), Tcho (total Choline) and NAAG (N-acetylaspartylglutamate)—in the pons were lower in the WFS group than in the control group (all p values < 0.012). No significant differences were observed for Glc (Glucose) and Lipa09 (mobile lipids) in this brain region (all p values p > 0.143).
Figure 1.
The figure shows metabolite concentrations on violin plots (A–C) and heatmaps for the same data (C–E). Graphs (A,D) present values for the pons; graphs (B,E) present values for the cerebellum and graphs (C,F) present values for the white matter of the brain in both analyzed groups. The graphs only include metabolites for which at least 80% of the MRS data were obtained. An asterisk indicates differences in metabolites where p < 0.05; WFS—Wolfram syndrome.
Six out of nine metabolites in the cerebellum (Figure 1B) showed significant differences (Glu, Glx, Ins, NAA and TNAA, as well as NAAG), with concentrations that were higher in the control group than in the WFS group (all p values < 0.005). No such differences were shown for three metabolites: GPC, Tcho and Lipa09 (all p values p > 0.128).
However, six out of ten metabolites in white matter (Figure 1C) showed significant differences (Glu, Glx, NAA, TNAA, NAAG and Glc), with concentrations also higher in the control group than in the WFS group (all p values < 0.012). No such differences were shown for four metabolites: GPC, Ins, Tcho and Lipa09 (all p values p > 0.116).
It should be emphasized that NAAG showed a significant reduction in WFS patients compared to the control group in all three brain regions (pons, cerebellum and white matter), as shown in Figure 1 (all p < 0.012) (Figure 1A–C, and Supplementary Table S2). One of the key metabolites in diabetes, Glc, showed significant differences (p = 0.002) in the white matter (Figure 1C), whilst no such difference (p = 0.459) was observed in the pons (Figure 1A). A post hoc statistical power analysis yielded values > 0.5 for the vast majority of metabolites. In addition, looking at the heatmaps clustering, we observe that the control group is almost perfectly separated from the study group, based on metabolites measured in the cerebellum and white matter (Figure 1E,F), which cannot be stated in relation to the pons region (Figure 1D).
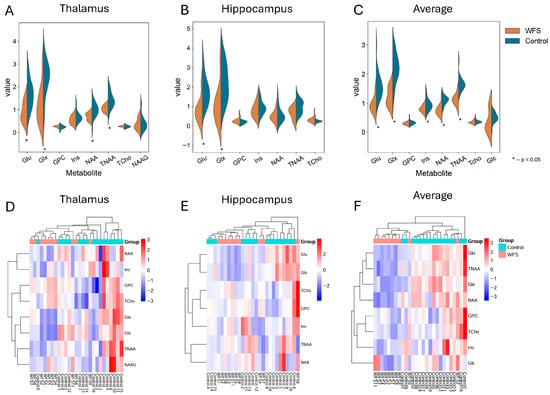
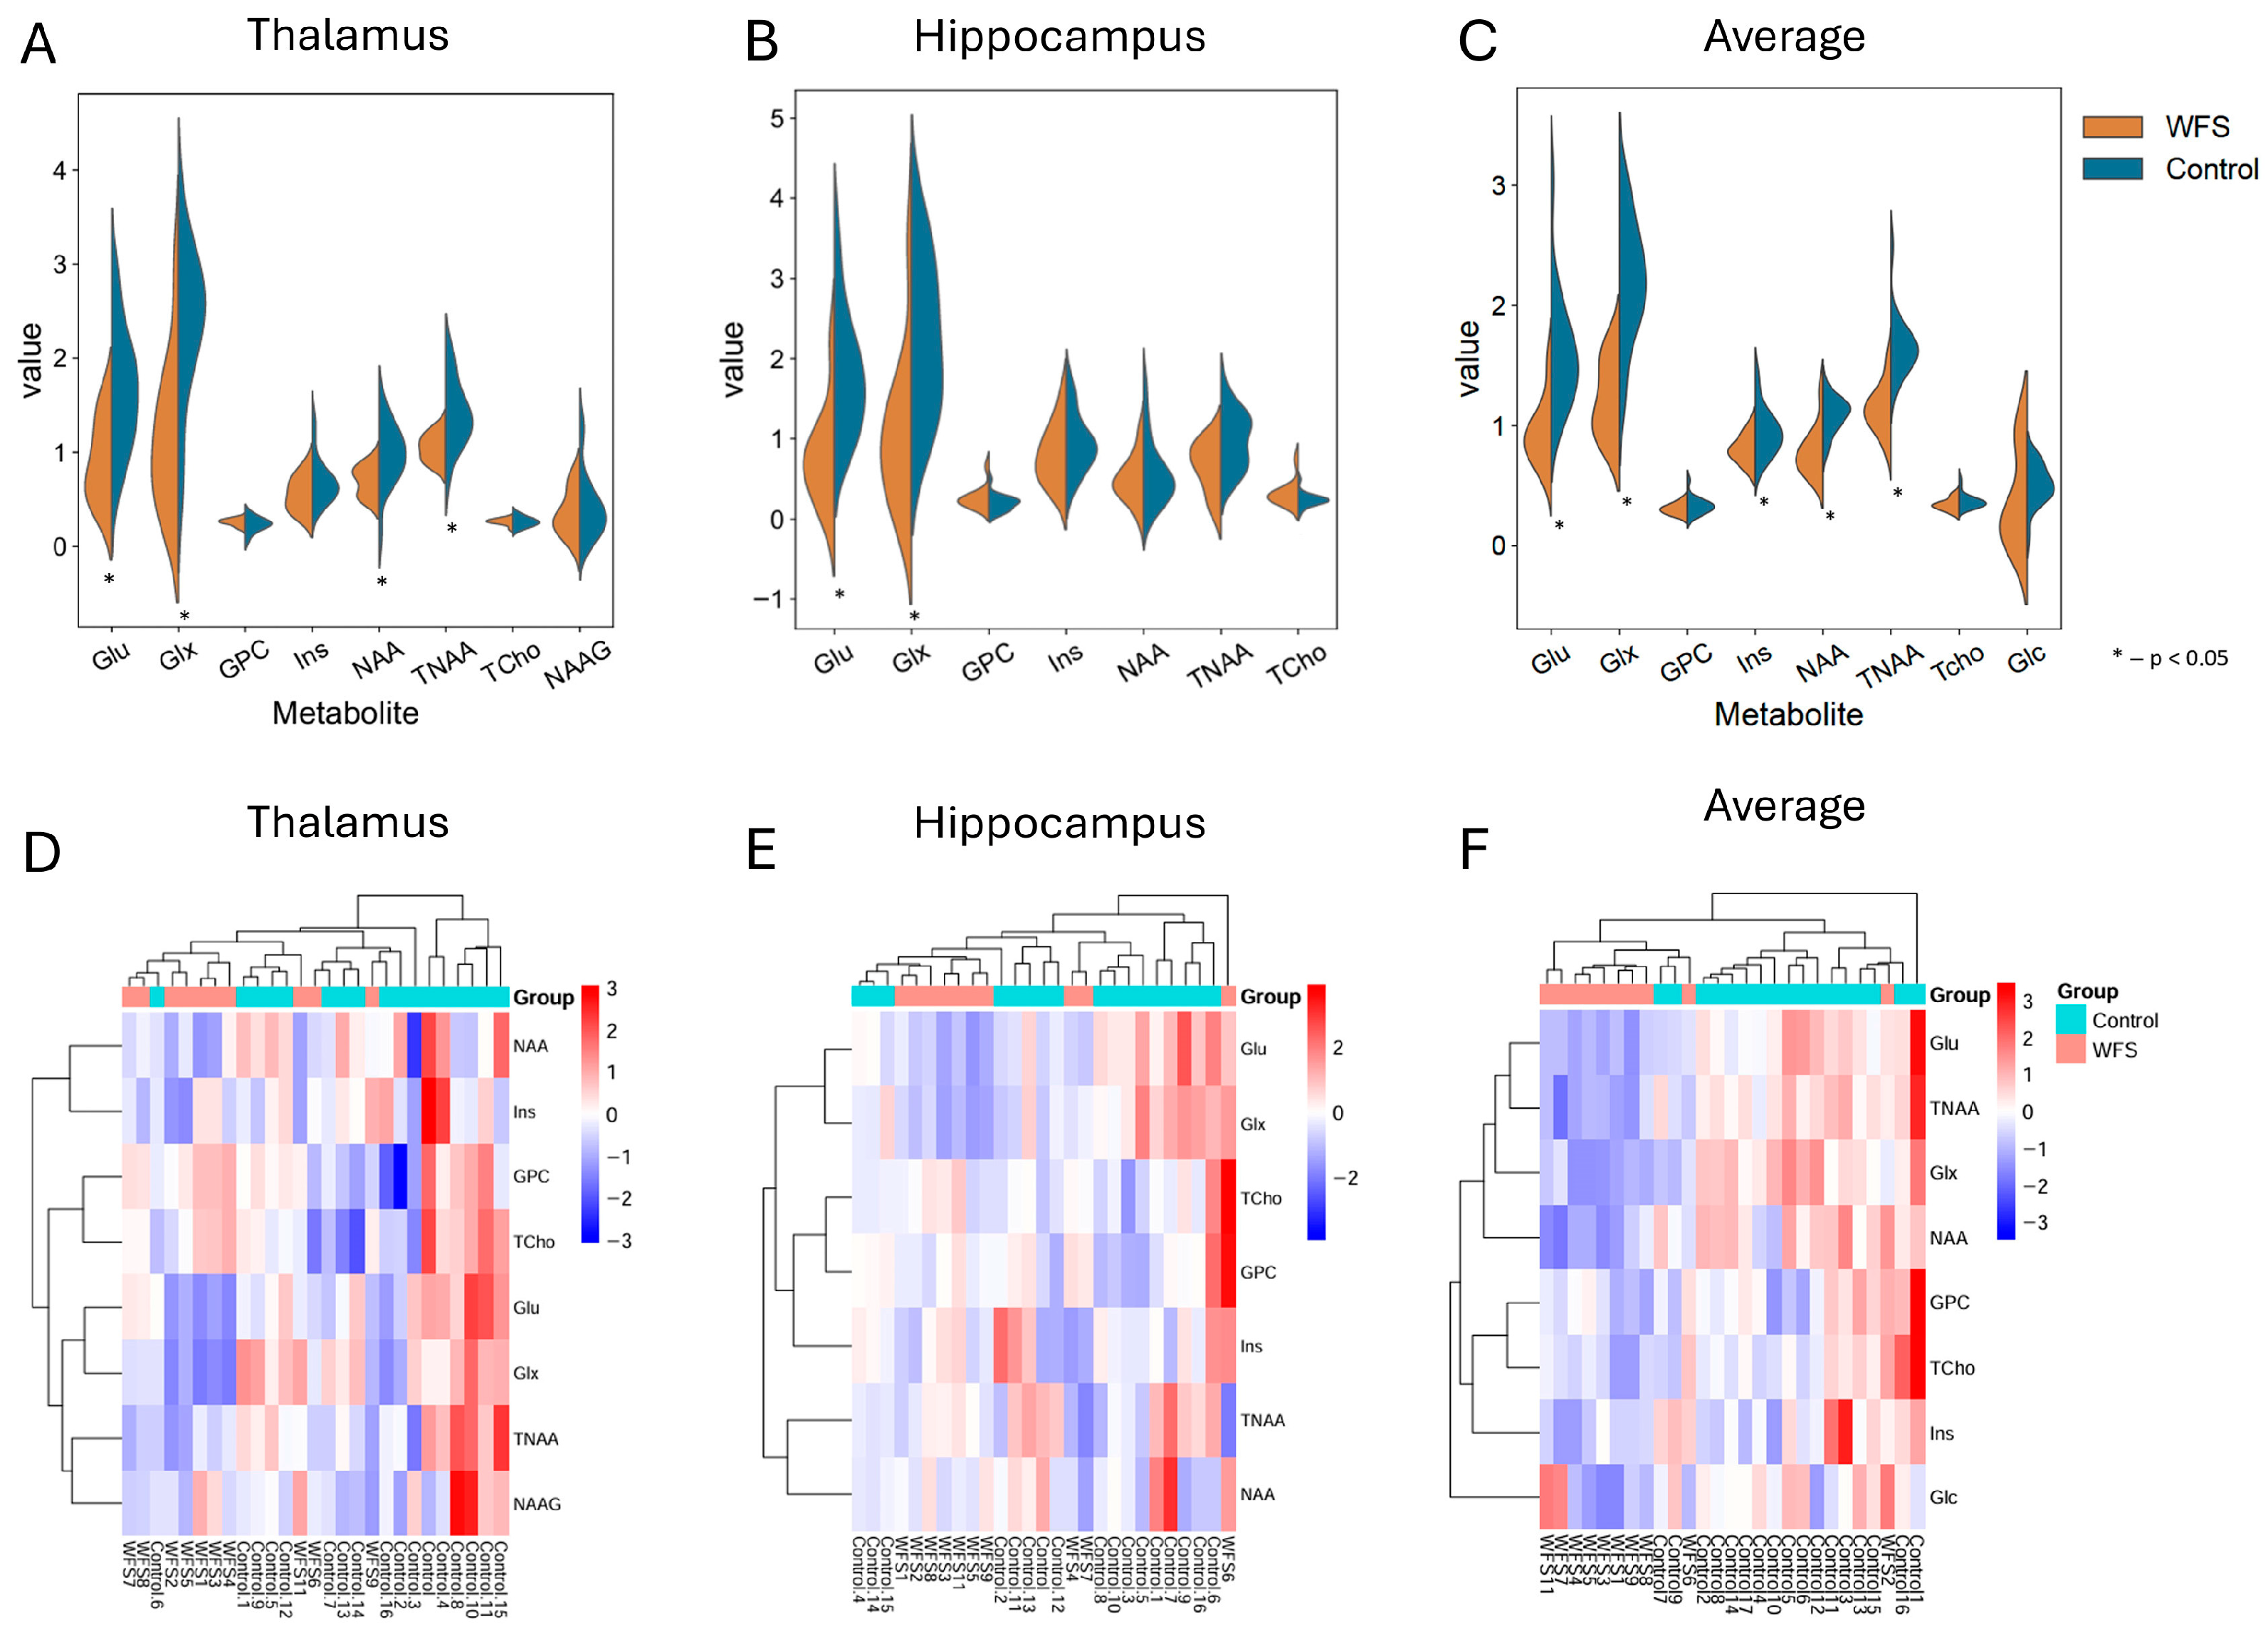
Figure 2 shows the values for two regions, the hippocampus and the thalamus, as well as the mean values for all brain regions. Four of eight metabolites in the thalamus (Figure 2A) showed significant differences (Glu, Glx, NAA, and TNAA), with higher concentrations in the control group than in the WFS group (all p values < 0.015). No such differences were shown for four metabolites: Ins, GPC, NAAG and Tcho (all p values > 0.206).
Figure 2.
The figure shows metabolite concentrations on violin plots (A–C) and heatmaps for the same data (C–E). Graphs (A,D) present values for the thalamus; graphs (B,E) present values for the hippocampus and graphs (C,F) present average data obtained for all brain regions in both analyzed groups. The graphs only include metabolites for which at least 80% of the MRS data were obtained. An asterisk indicates differences in metabolites where p < 0.05; WFS—Wolfram syndrome.
In the hippocampus (Figure 2B), two of the seven metabolites (Glu/Glx) exhibited significantly higher concentrations in the control group than in the WFS group (all p values < 0.011). However, no such differences were observed for GPC, Ins, NAA, TCho and 8TNAA (all p values p > 0.065).
Significant differences in Glu and Glx metabolites were observed in both brain regions (thalamus and hippocampus), as shown in Figure 2A,B (all p values < 0.011). The mean values for all brain regions (Figure 2C) indicated that five of the eight metabolites (Glu, Glx, Ins, NAA, and TNAA) were present in lower concentrations in the WFS group (all p values < 0.009). No differences were observed in the mean concentrations for GPC, Tcho, and Glc (all p values > 0.122).
The heatmaps in Figure 2D,E suggest that these brain regions do not differ perfectly between the study groups. Figure 2F shows a comprehensive heat map of mean values that separates the WFS group from the control group, but this separation is not perfect.
In summary, significant differences in the concentrations of three metabolites (Glu/Glx and TNAA) were found in almost all matrices when evaluating specific brain areas between the study group and the control group (p < 0.011), except for TNAA in the hippocampus, where the p-value was slightly above the 0.05 threshold (p = 0.065). In contrast, no significant changes were observed for the metabolite Lipa09 (all p-values > 0.128) (see Figure 1 and Figure 2 and Supplementary Table S2).
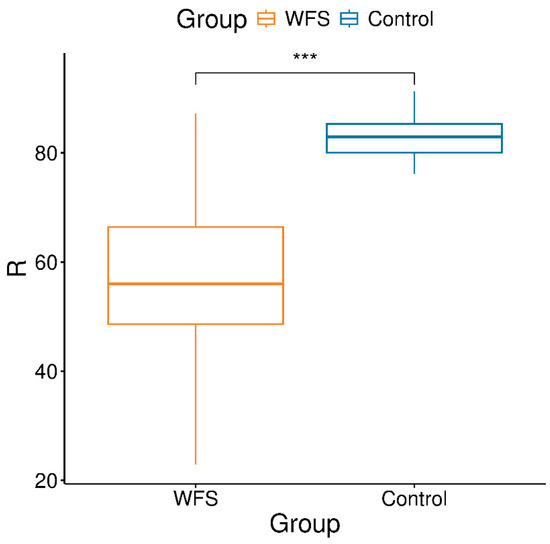
Next, an analysis comparing mitochondrial DNA copy numbers between groups showed a significant reduction in the mitochondrial-to-nuclear DNA ratio in patients with WFS (Welch’s t = −5.04, df = 12.67, p = 2.45 × 10⁻⁴). The mean R value in the study group was lower than in the control group, indicating a greater depletion of mitochondrial genome copies relative to the nuclear genome (Figure 3).
Figure 3.
Distribution of R values (mitochondrial-to-nuclear DNA ratio) in WFS and control groups (*** p < 0.0003).
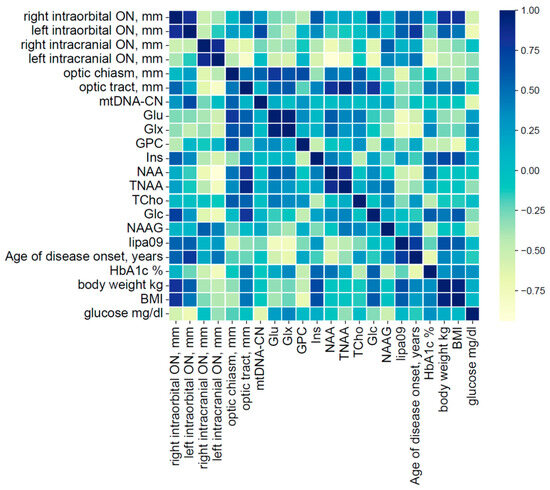
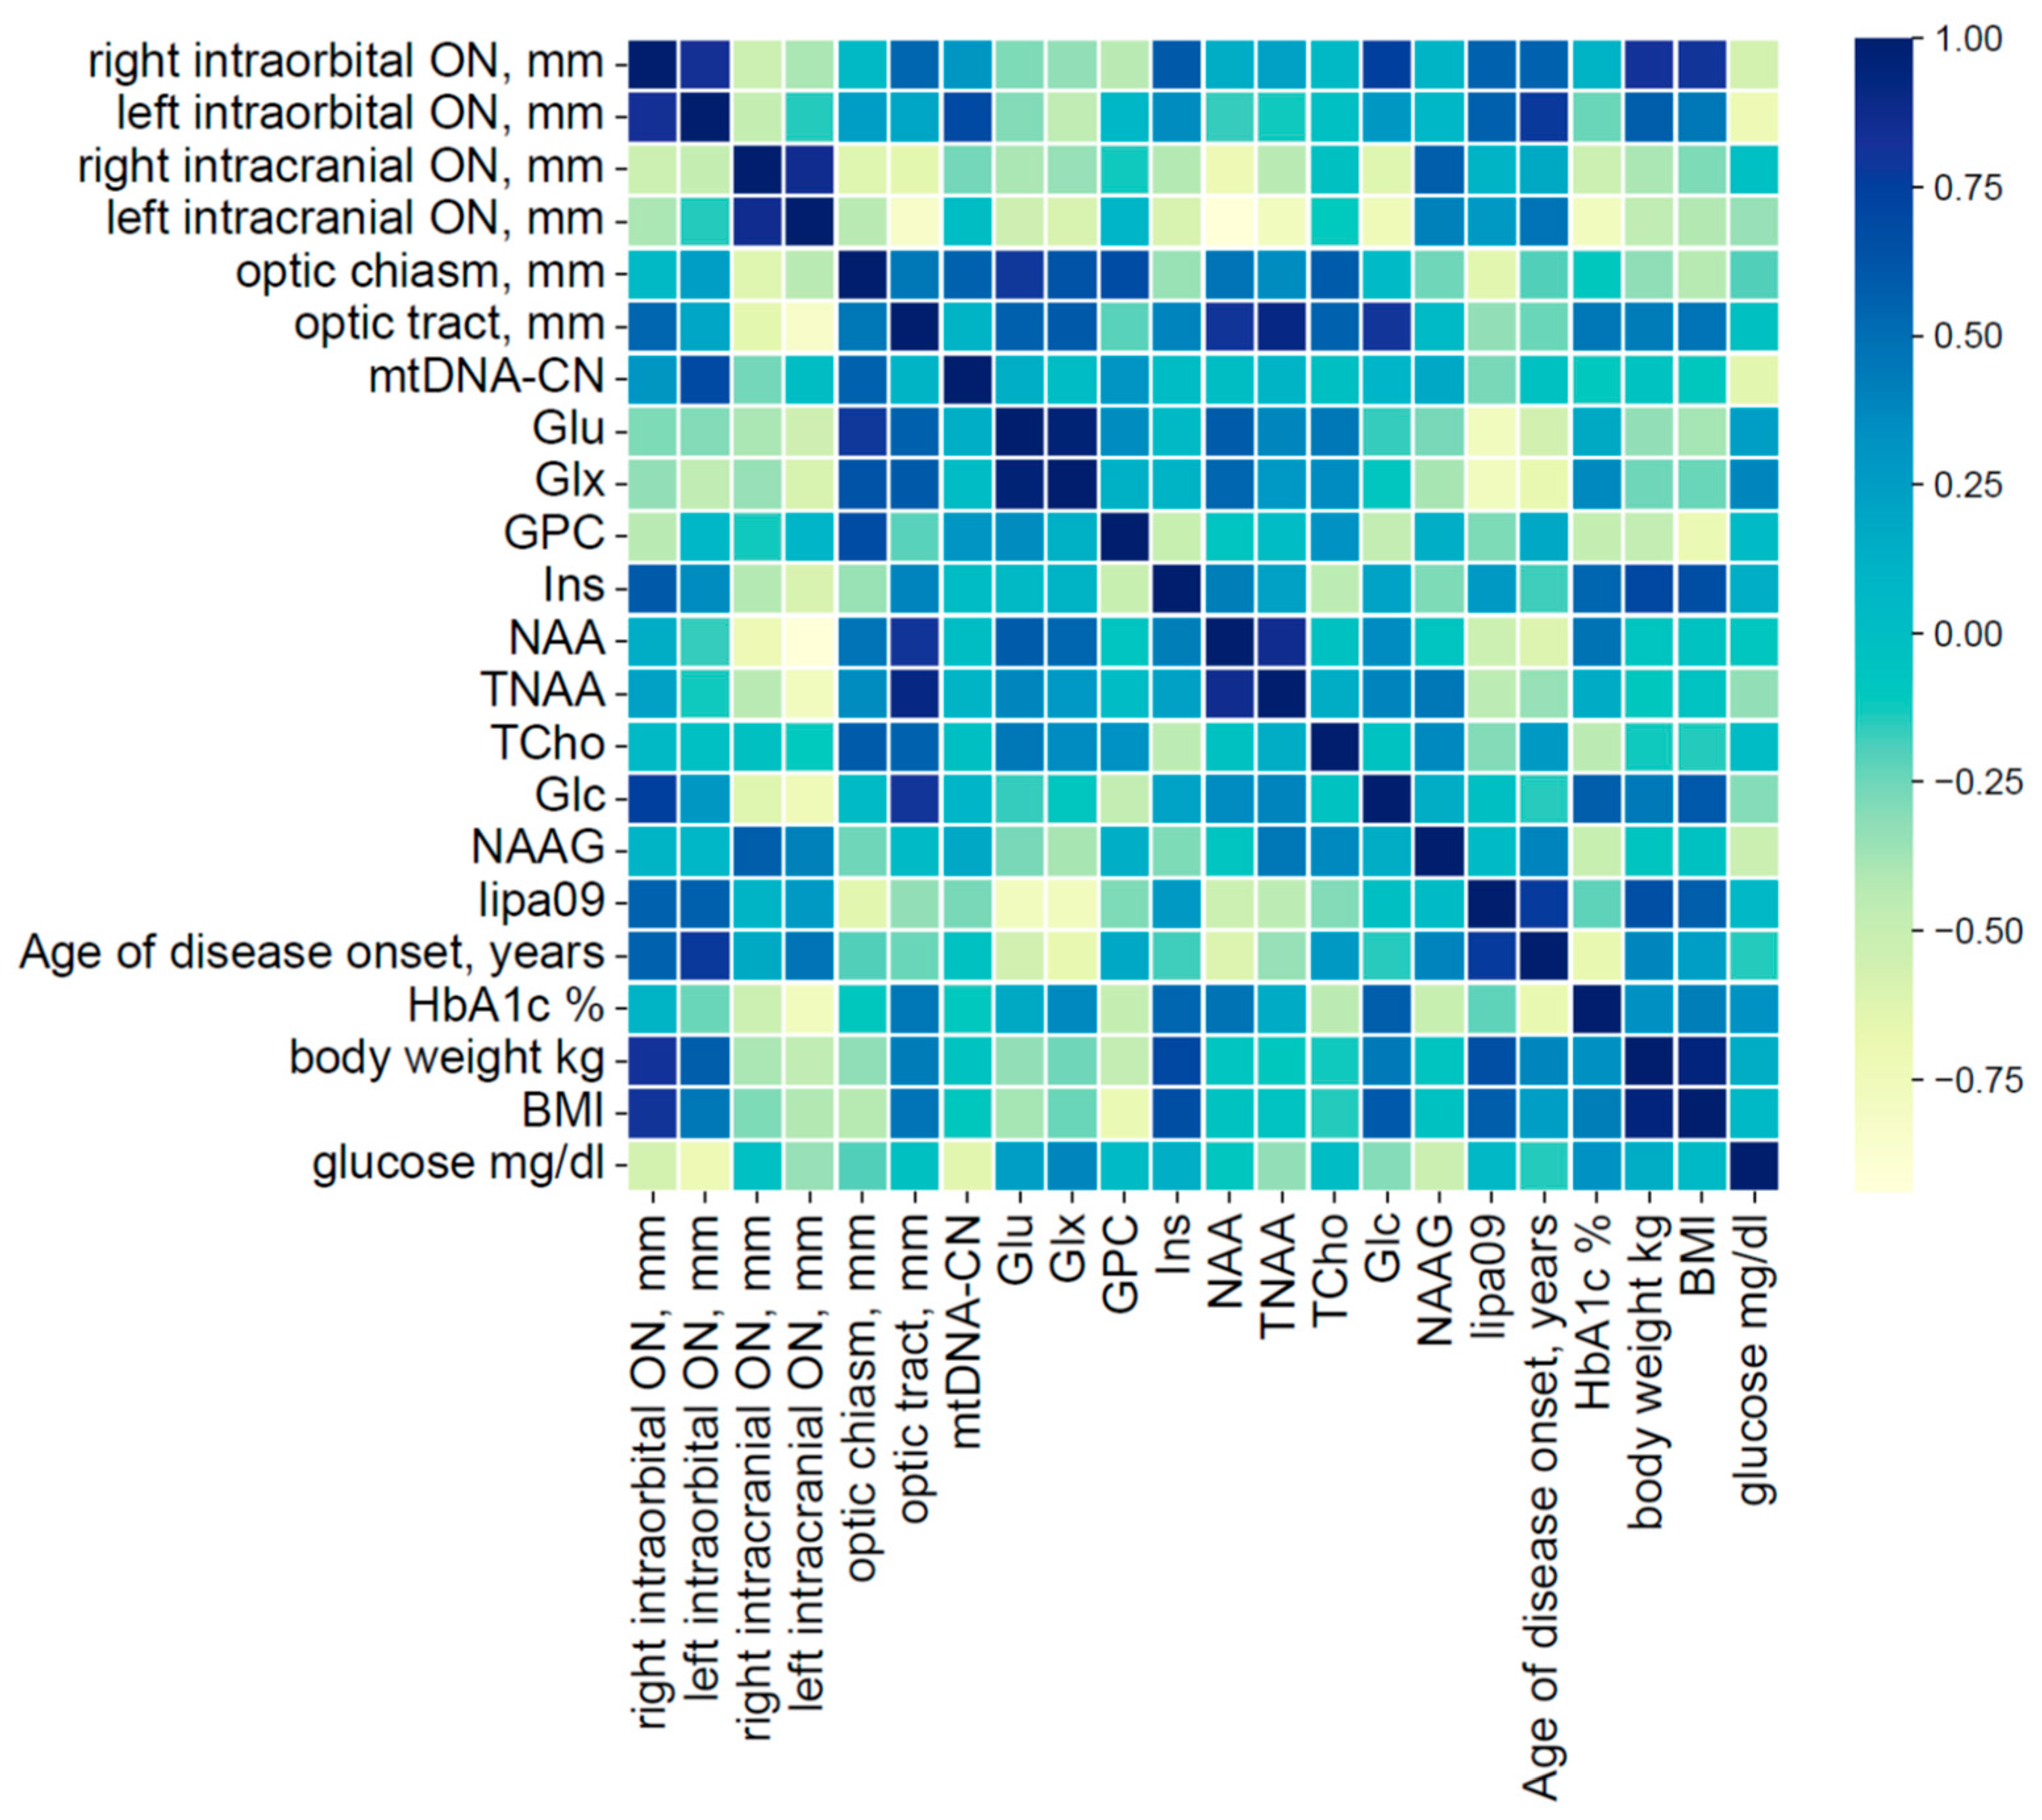
Furthermore, correlations between brain MRS metabolites and mtDNA-CN, as well as both MRI markers of neurodegeneration (Figure 4 and Table 1) and clinical parameters (Figure 4 and Table 2), were assessed in patients with WFS.
Figure 4.
Correlation coefficient plot for mean metabolite concentrations, mtDNA copy number, MRI-optic pathway measurements and clinical data in WFS patients’ group.
Table 1.
Correlations between MRI indicators of neurodegeneration and brain MRS metabolites and mtDNA-CN in patients with Wolfram syndrome. MRI—magnetic resonance imaging; MRS—magnetic resonance spectroscopy; mtDNA-CN—copy number of mitochondrial DNA; ON—optic nerve. Significant values of p and R are indicated in bold.
Table 2.
Correlations between brain MRS metabolites and mtDNA-CN and clinical parameters in patients with Wolfram syndrome. MRS—magnetic resonance spectroscopy; mtDNA-CN—copy number of mitochondrial DNA; HbA1c—glycated haemoglobin; BMI—body mass index. Significant values of p and R are indicated in bold.
Statistically significant strong correlations were found between NAA level and the left intracranial part of the optic nerve and between TNAA and optic tract thickness (respectively, p = 0.005 and p = 0.011; Table 1). Significant correlations were also found between the age of disease diagnosis (diabetes mellitus as the first symptom of Wolfram syndrome) and Glx and lipa09 (p = 0.042 and p = 0.015, respectively) (Table 2). Furthermore, the body weight of patients with WFS correlated strongly with Ins (p = 0.036) and BMI with GPC levels (p = 0.032) (Table 2).
Unfortunately, mtDNA-CN did not correlate significantly with MRI or clinical parameters of the visual pathway, but a tendency toward correlation was observed with the left intraorbital portion of the optic nerve (p = 0.126).
4. Discussion
This study was the first to evaluate MRS in patients with WFS. The analysis revealed lower levels of several metabolites in neural tissue in patients with WFS compared to the control group. Importantly, most of the changes in metabolite concentrations were found in the cerebellum, pons, and white matter, which correspond with the neurodegenerative process specific to WFS. A common and early symptom of neurodegeneration observed in patients with WFS is ataxia [6,30].
Interestingly, Glx and Glu levels were decreased in all five regions studied. Glu is a well-known neurotransmitter, and the entire Glx component has been called a “marker of neuro-excitotoxicity”, while Glu is mainly involved in Glx synthesis [31,32]. A decrease in Glx levels in nervous tissue has been observed in patients with Alzheimer’s disease (AD) and Parkinson’s disease, but also in healthy elderly individuals. It has been suggested that lower Glx levels may be associated with cognitive decline [31]. Moreover, a decrease in the Glx/tCr ratio was reported in the hypothalamus in patients with multiple sclerosis and was associated with worsening of cognitive processes [33].
Our study observed lower levels of NAA and TNAA in the pons, cerebellum, white matter, and thalamus, and reduced levels of NAAG in the cerebellum, white matter, and pons. NAA is a marker indicating neuronal integrity and has also been linked to mitochondrial function [34,35]. The decrease in the NAA/Cr (NAA/creatinine) ratio was described in the cerebellum in spinocerebellar ataxia type 27B (SCA27B), and in the pre-central area in Hereditary Spastic Paraplegias [22,36]. It has also been found that NAA levels slowly decline with age [32]. The reduction in TNAA, Glx, and Glu was also observed in patients with Parkinson’s disease [21]. Furthermore, patients with WFS have been observed to have decreased Ins levels in the cerebellum. Ins is a known marker for glial function and immunological processes [31,36]. Additionally, Kara et al. associated a decrement in the Ins/Cr ratio in the posterior cingulate gyrus and left hippocampus in AD patients with lower Mini-Mental State Examination scores, and the reduction in TNAA/mIns (myo-inositol) was linked to a decline in cognitive function [20].
Moreover, correlation analysis in our study revealed relationships between NAA levels and the left intracranial optic nerve, and between TNAA and optic tract thickness. Both of these parameters have already been reported as reduced in WFS, becoming recognised markers of neurodegeneration in these patients [28], further supporting the possibility of using NAA and TNAA to predict neurodegeneration in patients with WFS. It is also worth noting that optic nerve atrophy in WFS patients does not occur symmetrically at the same time; rather, the loss is gradual and affects different quadrants of the optic nerves at different times in individual patients [28,37]. The negative correlation between NAA and optic nerve thickness may be somewhat surprising. However, because optic nerve atrophy in Wolfram syndrome does not progress in a linear, continuous manner, this may, in our opinion, lead to an ambiguous effect on the direction of the correlation. Thus, NAA can be considered a marker of an ongoing neurodegenerative process rather than a process that has already ended. The analysis also revealed correlations between Ins and body weight in patients with WFS. Interestingly, a link between higher BMI and elevated Ins/Cr ratio has already been observed in obese individuals [38]. Moreover, our study found a correlation between GPC and BMI. Another study mentioned an increase in the GPC + PCh (phosphocholine)/Cr ratio in obese children with ADHD compared to children with ADHD of normal weight [39].
Next, the mitochondrial-to-nuclear DNA ratio was lower in our patients with WFS compared to healthy controls. Reduced mtDNA-CN levels have been reported in various neurodegenerative diseases, including AD, Parkinson’s disease, and Huntington’s disease, suggesting their role as prognostic biomarkers [24,40,41]. Decrease in mtDNA-CN was linked with a greater risk of AD development and transition from mild cognitive impairment to AD, making it a potential marker of disease progression [23]. Although a reduction in mtDNA copy number in WFS patients does not appear to be specific to this disease, it is worth noting that mitochondrial abnormalities in Wolfram syndrome may result from loss of function of the WFS1 gene. This impairment disrupts interactions between the endoplasmic reticulum and mitochondria, a process shown to lead to mitochondrial dysfunction in cellular models of this syndrome [42]. On the other hand, reduced mtDNA-CN has also been reported in type 1 and type 2 diabetes, as well as in gestational diabetes [25,43,44]. In patients with long-standing type 1 diabetes, a reduction in mtDNA-CN was observed compared to controls, along with an association with treatment regimen and the presence of chronic diabetes complications [25]. Thus, given the decline in mtDNA-CN in both processes, the lower mtDNA-CN levels observed in WFS may reflect the cumulative effect of diabetes and accompanying neurodegeneration. Therefore, given this biological variability and the lack of significant correlations in our study between mtDNA-CN and MRI findings or clinical parameters, it is currently not possible, without a study that controls for the influence of diabetes itself, to identify mtDNA-CN as a marker of neurodegeneration in WFS.
The limitations of the study include the small study group size, due to the rarity of WFS, and the inability to perform correlation analysis in the control group. Unfortunately, we were unable to provide clinical data on healthy participants. Therefore, this study should be regarded as preliminary and exploratory. Further longitudinal studies involving larger patient cohorts, including patients with isolated type 1 diabetes, are needed to determine the usefulness of MRS and mtDNA-CN for predicting and monitoring neurodegeneration in patients with WFS.
5. Conclusions
In summary, the study provides a detailed MRS analysis showing reduced levels of selected metabolites across several brain regions and demonstrating decreased mtDNA-CN in WFS patients compared to healthy controls. However, our study is exploratory in nature and has allowed us to identify changes in neural tissue metabolites which—once validated and their translational significance established—may in the future serve as prognostic markers of neurodegeneration in patients with WFS. This would be of great significance for establishing and monitoring the course of clinical trials aimed at inhibiting neurodegeneration in these patients.
Supplementary Materials
The following supporting information can be downloaded at: https://www.mdpi.com/article/10.3390/metabo16040281/s1, Supplementary Table S1. Sequences of primers and probes used for quantitative PCR analysis of mitochondrial and nuclear DNA., Supplementary Table S2. Mean metabolite values and p values adjusted by the false discovery rate (FDR) correction for each brain region. and Supplementary Figure S1. Noise-free fits to the spectral peaks from all regions of interest: cerebellum, hippocampus, pons, thalamus and white matter. Supplementary Figure S2. Spectral fitting results of cerebellum. The baseline and metabolite fits are shown in green, the model signal in red, and the residual water signal (uppermost signal in the plot) together with the processed signal in black. Supplementary Figure S3. Spectral fitting results of cerebellum. The baseline and metabolite fits are shown in green, the model signal in red, and the residual water signal (uppermost signal in the plot) together with the processed signal in black. The baseline is suppressed. Supplementary Figure S4. Spectral fitting results of hippocampus. The baseline and metabolite fits are shown in green, the model signal in red, and the residual water signal (uppermost signal in the plot) together with the processed signal in black. Supplementary Figure S5. Spectral fitting results of hippocampus. The baseline and metabolite fits are shown in green, the model signal in red, and the residual water signal (uppermost signal in the plot) together with the processed signal in black. The baseline is suppressed. Supplementary Figure S6. Spectral fitting results of pons. The baseline and metabolite fits are shown in green, the model signal in red, and the residual water signal (uppermost signal in the plot) together with the processed signal in black. Supplementary Figure S7. Spectral fitting results of pons. The baseline and metabolite fits are shown in green, the model signal in red, and the residual water signal (uppermost signal in the plot) together with the processed signal in black. The baseline is suppressed. Supplementary Figure S8. Spectral fitting results of thalamus. The baseline and metabolite fits are shown in green, the model signal in red, and the residual water signal (uppermost signal in the plot) together with the processed signal in black. Supplementary Figure S9. Spectral fitting results of thalamus. The baseline and metabolite fits are shown in green, the model signal in red, and the residual water signal (uppermost signal in the plot) together with the processed signal in black. The baseline is suppressed. Supplementary Figure S10. Spectral fitting results of white matter. The baseline and metabolite fits are shown in green, the model signal in red, and the residual water signal (uppermost signal in the plot) together with the processed signal in black. Supplementary Figure S11. Spectral fitting results of white matter. The baseline and metabolite fits are shown in green, the model signal in red, and the residual water signal (uppermost signal in the plot) together with the processed signal in black. The baseline is suppressed.
Author Contributions
Conceptualization, E.Z.-P.; molecular analysis, T.P. and S.S.; radiological analysis D.B. and K.M.; data curation, E.Z.-P., J.G.-A., A.P.-U., and W.M.; writing—original draft preparation, E.Z.-P.; writing—review and editing, A.Z.; supervision, W.M. and M.C. All authors have read and agreed to the published version of the manuscript.
Funding
This research received no external funding.
Institutional Review Board Statement
The study was conducted in accordance with the Declaration of Helsinki. The study is a sub-study on patients with Wolfram syndrome within the clinical trial “TreatWolfram” (NCT03717909). The study was approved by the Ethics Committee of the Medical University of Lodz, Poland (RNN/379/19/KE dated 15 October 2019, and RNN/191/19/KE dated 12 March 2019).
Informed Consent Statement
Informed consent was obtained from all participants and/or their parents involved in the study.
Data Availability Statement
The data presented in this study are available on request from the corresponding author due to patients’ privacy.
Acknowledgments
We thank all patients and their families for participating in this study.
Conflicts of Interest
The authors declare no conflicts of interest.
Abbreviations
The following abbreviations are used in this manuscript:
| AD | Alzheimer’s disease |
| BMI | body mass index |
| Cr | creatinine |
| GCF | gingival crevicular fluid |
| Glc | Glucose |
| GPC | glycerophosphocholines |
| Glu | Glutamate |
| Glx | Glutamate and Glutamine |
| HbA1c | glycated hemoglobin |
| Ins | myo-inositol |
| KNN | k-Nearest Neighbors |
| LC-MS | Liquid chromatography–Mass spectrometry |
| Lipa09 | mobile lipids |
| MRI | magnetic resonance images |
| MRS | magnetic resonance spectroscopy |
| mtDNA-CN | copy number of mitochondrial DNA |
| NAA | N-acetylaspartate |
| NAAG | N-acetylaspartylglutamate |
| OCT | optical coherence tomography |
| PCh | phosphocholine |
| SCA27B | spinocerebellar ataxia type 27B |
| Tcho | total Choline |
| TCr | total creatine |
| TNAA | total N-acetylaspartate |
| WFS | Wolfram syndrome |
References
- Rigoli, L.; Caruso, V.; Salzano, G.; Lombardo, F. Wolfram Syndrome 1: From Genetics to Therapy. Int. J. Environ. Res. Public Health 2022, 19, 3225. [Google Scholar] [CrossRef] [Scilit] [PubMed]
- Barrett, T.G.; Bundey, S.E.; Macleod, A.F. Neurodegeneration and diabetes: UK nationwide study of Wolfram (DIDMOAD) syndrome. Lancet 1995, 346, 1458−1463. [Google Scholar] [CrossRef] [Scilit]
- Inoue, H.; Tanizawa, Y.; Wasson, J.; Behn, P.; Kalidas, K.; Bernal-Mizrachi, E.; Mueckler, M.; Marshall, H.; Donis-Keller, H.; Crock, P.; et al. A gene encoding a transmembrane protein is mutated in patients with diabetes mellitus and optic atrophy (Wolfram syndrome). Nat. Genet. 1998, 20, 143–148. [Google Scholar] [CrossRef] [Scilit]
- de Heredia, M.L.; Clèries, R.; Nunes, V. Genotypic classification of patients with Wolfram syndrome: Insights into the natural history of the disease and correlation with phenotype. Genet. Med. 2013, 15, 497–506. [Google Scholar] [CrossRef] [Scilit]
- Lee, E.M.; Verma, M.; Palaniappan, N.; Pope, E.M.; Lee, S.; Blacher, L.; Neerumalla, P.; An, W.; Campbell, T.; Brown, C.; et al. Genotype and clinical characteristics of patients with Wolfram syndrome and WFS1-related disorders. Front. Genet. 2023, 14, 1198171. [Google Scholar] [CrossRef] [Scilit]
- Marshall, B.A.; Permutt, M.A.; Paciorkowski, A.R.; Hoekel, J.; Karzon, R.; Wasson, J.; Viehover, A.; White, N.H.; Shimony, J.S.; Manwaring, L.; et al. Phenotypic characteristics of early Wolfram syndrome. Orphanet J. Rare Dis. 2013, 8, 64. [Google Scholar] [CrossRef] [Scilit]
- Farmer, A.; Aymé, S.; de Heredia, M.L.; Maffei, P.; McCafferty, S.; Młynarski, W.; Nunes, V.; Parkinson, K.; Paquis-Flucklinger, V.; Rohayem, J.; et al. EURO-WABB: An EU rare diseases registry for Wolfram syndrome, Alstrom syndrome and Bardet-Biedl syndrome. BMC Pediatr. 2013, 13, 130. [Google Scholar] [CrossRef] [Scilit]
- Reimets, R.; Raud, S.; Loomets, M.; Visnapuu, T.; Volke, V.; Reimets, A.; Plaas, M.; Vasar, E. Variability in the effect of antidepressants upon Wfs1-deficient mice is dependent on the drugs’ mechanism of actions. Behav. Brain Res. 2016, 308, 53–63. [Google Scholar] [CrossRef] [Scilit] [PubMed]
- Zmyslowska, A.; Stanczak, M.; Nowicka, Z.; Waszczykowska, A.; Baranska, D.; Fendler, W.; Borowiec, M.; Młynarski, W. Serum microRNA as indicators of Wolfram syndrome’s progression in neuroimaging studies. BMJ Open Diabetes Res. Care 2020, 8, e001379. [Google Scholar] [CrossRef] [Scilit]
- Abreu, D.; Stone, S.I.; Pearson, T.S.; Bucelli, R.C.; Simpson, A.N.; Hurst, S.; Brown, C.M.; Kries, K.; Onwumere, C.; Gu, H.; et al. A phase Ib/IIa clinical trial of dantrolene sodium in patients with Wolfram syndrome. JCI Insight 2021, 6, e145188. [Google Scholar] [CrossRef] [Scilit]
- Wang, G.; Li, Z.A.; Chen, L.; Lugar, H.; Hershey, T. Clinical trials for Wolfram syndrome neurodegeneration: Novel design, endpoints, and analysis models. PLoS ONE 2025, 20, e0321598. [Google Scholar] [CrossRef] [Scilit]
- Dias, R.P.; Brock, K.; Hu, K.; Gupta, R.; Martin, U.; Peet, A.; Wilson, M.; Yu-Wai-Man, P.; Wright, B.; Mollan, S.; et al. Sodium valproate, a potential repurposed treatment for the neurodegeneration in Wolfram syndrome (TREATWOLFRAM): Trial protocol for a pivotal multicentre, randomised double-blind controlled trial. BMJ Open 2025, 15, e091495. [Google Scholar] [CrossRef] [Scilit] [PubMed]
- Zmyslowska, A.; Fendler, W.; Niwald, A.; Ludwikowska-Pawlowska, M.; Borowiec, M.; Antosik, K.; Szadkowska, A.; Mlynarski, W. Retinal thinning as a marker of disease progression in patients with Wolfram syndrome. Diabetes Care 2015, 38, e36–e37. [Google Scholar] [CrossRef] [Scilit] [PubMed]
- O’Bryhim, B.E.; Samara, A.; Chen, L.; Hershey, T.; Tychsen, L.; Hoekel, J. Longitudinal Changes in Vision and Retinal Morphology in Wolfram Syndrome. Am. J. Ophthalmol. 2022, 243, 10–18. [Google Scholar] [CrossRef] [Scilit]
- Hershey, T.; Lugar, H.M.; Shimony, J.S.; Rutlin, J.; Koller, J.M.; Perantie, D.C.; Paciorkowski, A.R.; Eisenstein, S.A.; Permutt, M.A.; Washington University Wolfram Study Group. Early brain vulnerability in Wolfram syndrome. PLoS ONE 2012, 7, e40604. [Google Scholar] [CrossRef] [Scilit]
- Samara, A.; Lugar, H.M.; Hershey, T.; Shimony, J.S. Longitudinal Assessment of Neuroradiologic Features in Wolfram Syndrome. Am. J. Neuroradiol. 2020, 41, 2364–2369. [Google Scholar] [CrossRef] [Scilit]
- Simo, J.; Lugar, H.M.; Miller, E.; Wilf-Yarkoni, A.; Goldberg, Y.; Kocaağa, A.; Ito, S.; Cocozza, S.; Frontino, G.; Baldoli, C.; et al. Expanding the spectrum of white matter abnormalities in Wolfram syndrome: A retrospective review. Front. Neurol. 2025, 16, 1623314. [Google Scholar] [CrossRef] [Scilit]
- Zmyslowska, A.; Ciborowski, M.; Borowiec, M.; Fendler, W.; Pietrowska, K.; Parfieniuk, E.; Antosik, K.; Pyziak, A.; Waszczykowska, A.; Kretowski, A.; et al. Serum Metabolic Fingerprinting Identified Putatively Annotated Sphinganine Isomer as a Biomarker of Wolfram Syndrome. J. Proteome Res. 2017, 16, 4000–4008. [Google Scholar] [CrossRef] [Scilit]
- Zmysłowska-Polakowska, E.; Płoszaj, T.; Skoczylas, S.; Mojsak, P.; Ciborowski, M.; Kretowski, A.; Lukomska-Szymanska, M.; Szadkowska, A.; Mlynarski, W.; Zmysłowska, A. Evaluation of the Oral Bacterial Genome and Metabolites in Patients with Wolfram Syndrome. Int. J. Mol. Sci. 2023, 24, 5596. [Google Scholar] [CrossRef] [Scilit] [PubMed]
- Kara, F.; Joers, J.M.; Przybelski, S.A.; Algeciras-Schimnich, A.; Gunter, J.L.; Jack, C.R.; Petersen, R.C., Jr.; Öz, G.; Kantarci, K. 1H-MR spectroscopy biomarkers are associated with plasma-derived biomarkers of amyloid-β and tau in the early phase of AD continuum. Neurobiol. Aging 2026, 158, 18–27. [Google Scholar] [CrossRef] [Scilit]
- Kumari, S.; Kumaran, S.S.; Rajan, R.; Arora, S.; Chaudhary, S.; Srivastava, A.K.; Edden, R.A.E. Neurobiochemical alterations in patients with idiopathic Parkinson’s disease in sensorimotor cortex using 1H-MRS. Neuroscience 2025, 588, 1–10. [Google Scholar] [CrossRef] [Scilit] [PubMed]
- Chukwuocha, I.; Pellerin, D.; Shanmugarajah, P.; Tsironis, T.; Foster, E.; Hoggard, N.; Beauchamp, N.; Turton, L.; McNeill, A.; Brais, B.; et al. Clinical characteristics, cerebellar MR spectroscopy and response to 3,4-diaminopyridine in spinocerebellar ataxia 27B: The Sheffield Ataxia Centre experience. J. Neurol. 2025, 272, 681. [Google Scholar] [CrossRef] [Scilit]
- Tong, T.; Zhu, C.; Farrell, J.J.; Khurshid, Z.; Alzheimer’s Disease Sequencing Project; Alzheimer’s Disease Neuroimaging Initiative; Martin, E.R.; Pericak-Vance, M.A.; Wang, L.S.; Bush, W.S.; et al. Blood-derived mitochondrial DNA copy number is associated with Alzheimer disease, Alzheimer-related biomarkers and serum metabolites. Alzheimer’s Res. Ther. 2024, 16, 234. [Google Scholar] [CrossRef] [Scilit]
- Cerantonio, A.; Citrigno, L.; Greco, B.M.; De Benedittis, S.; Passarino, G.; Maletta, R.; Qualtieri, A.; Montesanto, A.; Spadafora, P.; Cavalcanti, F. The Role of Mitochondrial Copy Number in Neurodegenerative Diseases: Present Insights and Future Directions. Int. J. Mol. Sci. 2024, 25, 6062. [Google Scholar] [CrossRef] [Scilit]
- Jenkins, A.J.; Carroll, L.M.; Huang, M.L.H.; Wen-Loh, Y.; Mangani, A.; O’Neal, D.N.; Januszewski, A.S. Mitochondrial DNA copy number in adults with and without Type 1 diabetes. Diabetes Res. Clin. Pract. 2023, 203, 110877. [Google Scholar] [CrossRef] [Scilit] [PubMed]
- Zmyslowska, A.; Borowiec, M.; Antosik, K.; Szalecki, M.; Stefanski, A.; Iwaniszewska, B.; Jedrzejczyk, M.; Pietrzak, I.; Mlynarski, W. Wolfram syndrome in the Polish population: Novel mutations and genotype-phenotype correlation. Clin. Endocrinol. 2011, 75, 636–641. [Google Scholar] [CrossRef] [Scilit] [PubMed]
- Waszczykowska, A.; Jeziorny, K.; Barańska, D.; Matera, K.; Pyziak-Skupien, A.; Ciborowski, M.; Zmysłowska, A. Searching for Effective Methods of Diagnosing Nervous System Lesions in Patients with Alström and Bardet-Biedl Syndromes. Genes 2023, 14, 1784. [Google Scholar] [CrossRef] [Scilit]
- Zmyslowska, A.; Waszczykowska, A.; Baranska, D.; Stawiski, K.; Borowiec, M.; Jurowski, P.; Fendler, W.; Mlynarski, W. Optical coherence tomography and magnetic resonance imaging visual pathway evaluation in Wolfram syndrome. Dev. Med. Child Neurol. 2019, 61, 359–365. [Google Scholar] [CrossRef] [Scilit]
- Rooney, J.P.; Ryde, I.T.; Sanders, L.H.; Howlett, E.H.; Colton, M.D.; Germ, K.E.; Mayer, G.D.; Greenamyre, J.T.; Meyer, J.N. PCR based determination of mitochondrial DNA copy number in multiple species. In Mitochondrial Regulation; Methods in Molecular Biology; Springer Nature: Berlin/Heidelberg, Germany, 2015; Volume 1241, pp. 23–38. [Google Scholar] [CrossRef] [Scilit]
- Barrett, T.; Tranebjærg, L.; Gupta, R.; McCarthy, L.; Rendtorff, N.D.; Williams, D.; Wright, B.; Dias, R. WFS1 Spectrum Disorder. In GeneReviews®; Adam, M.P., Bick, S., Mirzaa, G.M., Eds.; University of Washington: Seattle, WA, USA, 2009. [Google Scholar]
- Hnilicova, P.; Kantorova, E.; Sutovsky, S.; Grofik, M.; Zelenak, K.; Kurca, E.; Zilka, N.; Parvanovova, P.; Kolisek, M. Imaging Methods Applicable in the Diagnostics of Alzheimer’s Disease, Considering the Involvement of Insulin Resistance. Int. J. Mol. Sci. 2023, 24, 3325. [Google Scholar] [CrossRef] [Scilit]
- Rae, C.D. A guide to the metabolic pathways and function of metabolites observed in human brain 1H magnetic resonance spectra. Neurochem. Res. 2014, 39, 1–36. [Google Scholar] [CrossRef] [Scilit] [PubMed]
- Grossmann, J.; Grendár, M.; Hnilicová, P.; Kováčiková, N.; Kotul’ová, L.; Bogner, W.; Kurča, E.; Kantorová, E. Digit Span Tests Are More Sensitive than SDMT for Detecting Working Memory Impairment and Correlate with Metabolic Alterations in White Matter and Deep Gray Matter Nuclei in Multiple Sclerosis: A GABA-Edited Magnetic Resonance Spectroscopy Study. Int. J. Mol. Sci. 2025, 26, 8842. [Google Scholar] [CrossRef] [Scilit] [PubMed]
- Kara, F.; Neyal, N.; Kamykowski, M.G.; Schwarz, C.G.; Kendall-Thomas, J.; Morrison, H.A.; Senjem, M.L.; Przybelski, S.A.; Fought, A.J.; Port, J.D.; et al. Decoding Thalamic Glial Interplay in Multiple Sclerosis Through Proton Magnetic Resonance Spectroscopy and Positron Emission Tomography. Int. J. Mol. Sci. 2025, 26, 8656. [Google Scholar] [CrossRef] [Scilit] [PubMed]
- Oz, G.; Alger, J.R.; Barker, P.B.; Bartha, R.; Bizzi, A.; Boesch, C.; Bolan, P.J.; Brindle, K.M.; Cudalbu, C.; Dinçer, A.; et al. Clinical proton MR spectroscopy in central nervous system disorders. Radiology 2014, 270, 658–679. [Google Scholar] [CrossRef] [Scilit] [PubMed] [PubMed Central]
- Montanaro, D.; Vavla, M.; Frijia, F.; Coi, A.; Baratto, A.; Pasquariello, R.; Stefan, C.; Martinuzzi, A. Metabolite profile in hereditary spastic paraplegia analyzed using magnetic resonance spectroscopy: A cross-sectional analysis in a longitudinal study. Front. Neurosci. 2024, 18, 1416093. [Google Scholar] [CrossRef] [Scilit] [PubMed] [PubMed Central]
- Hoekel, J.; Chisholm, S.A.; Al-Lozi, A.; Hershey, T.; Tychsen, L.; Washington University Wolfram Study Group. Ophtalmologic correlates of disease severity in children and adolescents with Wolfram syndrome. J. AAPOS 2014, 18, 461–465. [Google Scholar] [CrossRef] [Scilit]
- Haley, A.P.; Gonzales, M.M.; Tarumi, T.; Tanaka, H. Dyslipidemia links obesity to early cerebral neurochemical alterations. Obesity 2013, 21, 2007–2013. [Google Scholar] [CrossRef] [Scilit]
- Ben Amor, L.; Lachal, J. Rôle de l’impulsivité dans la relation entre surpoids et TDAH chez l’enfant: étude exploratoire des caractéristiques cliniques, neuropsychologiques et neurobiochimiques [Impulsivity and obesity in children with Attention Deficit Hyperactivity Disorder: A clinical, neuropsychological and magnetic resonance spectroscopy exploratory study]. L’Encephale 2019, 45, 494–500. [Google Scholar] [CrossRef] [Scilit]
- Gui, Y.X.; Xu, Z.P.; Lv, W.; Zhao, J.J.; Hu, X.Y. Evidence for polymerase gamma, POLG1 variation in reduced mitochondrial DNA copy number in Parkinson’s disease. Park. Relat. Disord. 2015, 21, 282–286. [Google Scholar] [CrossRef] [Scilit]
- Petersen, M.H.; Budtz-Jørgensen, E.; Sørensen, S.A.; Nielsen, J.E.; Hjermind, L.E.; Vinther-Jensen, T.; Nielsen, S.M.; Nørremølle, A. Reduction in mitochondrial DNA copy number in peripheral leukocytes after onset of Huntington’s disease. Mitochondrion 2014, 17, 14–21. [Google Scholar] [CrossRef] [Scilit]
- Liiv, M.; Vaarmann, A.; Safiulina, D.; Choubey, V.; Gupta, R.; Kuum, M.; Janickova, L.; Hodurova, Z.; Cagalinec, M.; Zeb, A.; et al. ER calcium depletion as a key driver for impaired ER-to-mitochondria calcium transfer and mitochondrial dysfunction in Wolfram syndrome. Nat. Commun. 2024, 15, 6143. [Google Scholar] [CrossRef] [Scilit]
- Luo, Q.; Zhou, J.; Wu, H.; Qiu, X.; Xian, C.; Zhan, X.; Liu, J. Associations between peripheral blood mitochondrial genomic variants and gestational diabetes mellitus and postpartum abnormal glucose metabolism. J. Diabetes Investig. 2025, 16, 2092–2100. [Google Scholar] [CrossRef] [Scilit] [PubMed] [PubMed Central]
- Fazzini, F.; Lamina, C.; Raftopoulou, A.; Koller, A.; Fuchsberger, C.; Pattaro, C.; Del Greco, F.M.; Döttelmayer, P.; Fendt, L.; Fritz, J.; et al. Association of mitochondrial DNA copy number with metabolic syndrome and type 2 diabetes in 14 176 individuals. J. Intern. Med. 2021, 290, 190–202. [Google Scholar] [CrossRef] [Scilit] [PubMed] [PubMed Central]

Disclaimer/Publisher’s Note: The statements, opinions and data contained in all publications are solely those of the individual author(s) and contributor(s) and not of MDPI and/or the editor(s). MDPI and/or the editor(s) disclaim responsibility for any injury to people or property resulting from any ideas, methods, instructions or products referred to in the content. |
© 2026 by the authors. Licensee MDPI, Basel, Switzerland. This article is an open access article distributed under the terms and conditions of the Creative Commons Attribution (CC BY) license.