


Abstract
Background: Cytosolic prostaglandin E synthase (cPGES/PTGES3), also known as the HSP90 cochaperone p23, participates in glucocorticoid receptor (GR) maturation and function. Whether cPGES contributes to GR protein homeostasis during metabolic liver injury remains unclear. Methods: We investigated hepatocyte- and Lyz2-directed Ptges3 deletion in mouse models of diet-induced metabolic liver injury and examined the effects of CYP7B1 or SERPINA1E restoration in hepatocyte-directed knockout mice. Results: Both deletion models exhibited reduced GR protein abundance and increased GR ubiquitination despite unchanged Nr3c1 mRNA levels and whole-liver PGE2 concentrations. Nuclear GR abundance was also reduced following hepatocyte-directed deletion. Under high-fat diet (HFD) feeding, hepatocyte cPGES deletion exacerbated steatosis and cholesterol accumulation, accompanied by reduced CYP7B1 and SERPINA1E expression. Restoration of either protein attenuated these metabolic abnormalities. Hepatocyte-directed deletion had no detectable effect on short-term methionine- and choline-deficient (MCD) diet-induced steatohepatitis, whereas Lyz2-directed deletion aggravated hepatic inflammation and fibrosis, accompanied by reduced MT1 expression and increased nuclear phospho-NF-κB. Conclusions: This study identifies reduced GR protein abundance and increased ubiquitination as shared molecular alterations following cell-directed cPGES deletion, accompanied by distinct metabolic and inflammatory phenotypes depending on cellular context. These findings suggest a role for cPGES/p23 in GR protein homeostasis during metabolic liver injury, although the causal contribution of GR reduction to the downstream phenotypes remains to be established.
1. Introduction
Metabolic dysfunction-associated steatotic liver disease (MASLD) comprises a spectrum ranging from simple steatosis to metabolic dysfunction-associated steatohepatitis (MASH) [1,2], fibrosis [3,4], and cirrhosis [5,6]. Disease progression reflects coordinated metabolic and inflammatory disturbances across hepatic cell populations [7,8]. In hepatocytes, disruption of lipid and cholesterol homeostasis contributes to lipotoxic stress and cellular injury [9,10,11], whereas activation of hepatic macrophages amplifies inflammatory and fibrogenic responses during MASH [12,13,14]. Defining cell-context-specific regulators of these processes remains important for understanding why metabolic injury progresses to inflammatory liver disease.
Cytosolic prostaglandin E synthase (cPGES), encoded by PTGES3, is commonly recognized as a terminal enzyme involved in PGE2 synthesis [15,16]. cPGES is also identical to p23 [17,18], an HSP90 cochaperone that participates in the maturation of steroid receptors [19,20], including GR [21]. GR controls transcriptional programs involved in hepatic metabolism [22,23,24], cellular stress responses [25,26,27], and inflammation [28,29,30,31]. Because HSP90 cochaperones can influence both receptor maturation and signaling competence [32,33,34], loss of cPGES could affect metabolic liver disease through mechanisms that are distinct from altered prostaglandin production.
Although there is an established biochemical relationship between p23/cPGES and GR, the in vivo consequences of cell-directed cPGES loss during MASLD remain poorly defined. In particular, whether cPGES deficiency alters GR protein abundance or protein stability in liver cells has not been established. Defining this proximal molecular effect is important because a defect in GR protein maintenance could generate different downstream consequences across hepatocyte metabolic and myeloid inflammatory programs.
Here, we used hepatocyte- and Lyz2-directed Ptges3 deletion to test whether cPGES is required for GR protein homeostasis during metabolic liver injury and to determine the cell-context-specific consequences of its loss. We found that cPGES deficiency was consistently associated with reduced GR abundance and enhanced GR ubiquitination, followed by distinct metabolic and inflammatory phenotypes in hepatocyte and Lyz2-expressing compartments.
2. Materials and Methods
2.1. Animal Models and Experimental Design
Ptges3flox/+ mice were produced by GemPharmatech Co., Ltd. (Nanjing, China) using CRISPR/Cas9 and inter-crossed to obtain Ptges3flox/flox mice. For hepatocyte-directed cPGES deletion in the MASLD model, male Ptges3flox/flox mice were started on an HFD at 6 weeks of age and received AAV-TBG-Cre-GFP (8 × 10¹¹ vg in 100 μL) or AAV-TBG-GFP control at 8 weeks of age. Mice were maintained on the HFD for 20 weeks. For the hepatocyte-directed MASH experiment, Ptges3flox/flox mice were started on an MCD diet at 10 weeks of age and received AAV-TBG-Cre-GFP or control virus 2 days later; the MCD intervention lasted 5 weeks. For Lyz2-directed deletion, Ptges3flox/flox mice received AAV-Lyz2-Cre-GFP or AAV-Lyz2-GFP and were studied under MCD feeding. For the rescue experiments, male Ptges3flox/flox mice were started on an HFD at 6 weeks of age. AAV-TBG-Cre was administered at 8 and 16 weeks, whereas AAV vectors expressing CYP7B1 or SERPINA1E, or the corresponding control vector, were administered at 12 and 20 weeks. Mice were sacrificed at 22 weeks of age. Animals were maintained under specific pathogen-free conditions with a 12 h light/dark cycle at 22 °C and 50% humidity with ad libitum access to food and water. All procedures were approved by the Animal Ethics Committee of Xuzhou Medical University (202306T010). The HFD contained 60 kcal% fat (D12492, Research Diets, New Brunswick, NJ, USA), and the MCD diet was A02082002B (Research Diets).
2.2. Histology and Immunostaining
Liver tissues were fixed in 4% paraformaldehyde and processed for H&E staining. Frozen sections were used for Oil red O, Nile red, and Filipin III staining. For immunohistochemistry, antibodies included TGF-β (sc-130348, Santa Cruz, Dallas, TX, USA), CD68 (GB113109-100, Servicebio, Wuhan, China), F4/80 (MF48000, Thermo Fisher, Waltham, MA, USA), and COL1A1 (sc-293182, Santa Cruz, Dallas, TX, USA). For immunofluorescence, antibodies included CD86 (A1199, ABclonal, Wuhan, China), CD206 (24595, Cell Signaling Technology, Danvers, MA, USA), and metallothionein (ab12228, Abcam, Cambridge, UK). Images were acquired using light or confocal microscopy and quantified using ImageJ 1.44p or Image-Pro Plus 6.0 as appropriate.
2.3. Biochemical and Molecular Assays
Hepatic PGE2 was measured using ELISA (514010, Cayman Chemical, Ann Arbor, MI, USA) after homogenization in RIPA buffer containing 10 μM indomethacin. RNA was isolated with TRIzol, reverse-transcribed, and analyzed using SYBR-based qRT-PCR with β-actin as the internal control. Nuclear and cytoplasmic proteins were separated using a commercial extraction kit (P0028, Beyotime Biotechnology, Shanghai, China).
2.4. Western Blotting and Co-Immunoprecipitation
Protein lysates were analyzed using SDS-PAGE and immunoblotting. The primary antibodies included cPGES (15216-1-AP, Proteintech, Rosemont, IL, USA), mPGES-1 (sc-365844, Santa Cruz, Dallas, TX, USA), mPGES-2 (10881-1-AP, Proteintech, Rosemont, IL, USA), GR (24050-1-AP, Proteintech, Rosemont, IL, USA), CYP7B1 (24889-1-AP, Proteintech, Rosemont, IL, USA), CYP7A1 (18054-1-AP, Proteintech, Rosemont, IL, USA), ubiquitin (10201-2-AP, Proteintech, Rosemont, IL, USA), MT1 (ab12228, Abcam, Cambridge, UK), phospho-NF-κB (3039, Cell Signaling Technology, Danvers, MA, USA), NF-κB (8242, Cell Signaling Technology, Danvers, MA, USA), and IL-1β (AF5103, Affinity, Changzhou, China). For GR immunoprecipitation, clarified lysates were incubated with Protein A/G magnetic beads pre-bound to anti-GR antibody (12041, Cell Signaling Technology, Danvers, MA, USA) or control rabbit IgG, washed, eluted, and then analyzed via immunoblotting. Ubiquitination signals were quantified by densitometry and normalized to the amount of immunoprecipitated GR (Ub/IP-GR).
2.5. Oil Red O Staining
After rewarming, frozen liver sections were washed with PBS and fixed with 4% paraformaldehyde. Oil red O staining was performed using a modified Oil red O staining solution (G1261, Beijing Solarbio Science & Technology Co., Ltd., Beijing, China). Positively stained areas were quantified using Image Pro Plus 6.0, and the results were expressed as the percentage of the positively stained area relative to the total area.
2.6. Nile Red Staining
The frozen sections were rewarmed at room temperature for 30 min and washed with double-distilled water. After fixation with paraformaldehyde for 20 min, Nile red staining solution was prepared by dissolving 1 mg of Nile red (7385-67-3, Aladdin, Shanghai, China) in 1 mL of methanol, followed by a 20 fold dilution with double-distilled water to obtain the working solution. Sections were stained with Nile red for 20 min in the dark, and the nuclei were counterstained with DAPI in the dark. Confocal images were captured using a Leica STELLARIS 5 microscope (Leica Microsystems, Wetzlar, Germany) with Leica Application Suite X (LAS X) imaging (3.7.1.21655) software. Images were quantified using ImageJ software.
2.7. Filipin III Cholesterol Assay
Frozen liver sections were washed with PBS after rewarming and then stained with freshly prepared 50 μg/mL filipin III (HY-N6718, MCE, Monmouth Junction, NJ, USA) in PBS for 2 h at room temperature. Nuclei were counterstained with PI. Image Pro Plus 6.0 was used to quantify the corresponding positively stained areas, and the results were expressed as the percentage of the positively stained area relative to the total area.
2.8. Proteomic Analysis
Liver tissue samples from hepatocyte-directed Ptges3 knockout and control mice were lysed in SDT buffer (4% SDS, 100 mM Tris-HCl, pH 7.6). Protein concentrations were determined using a BCA assay, and protein samples were assessed by Coomassie Brilliant Blue staining. Proteins were digested with trypsin using the filter-aided sample preparation (FASP) method described by Wiśniewski et al. LC-MS/MS analysis was performed using a Q Exactive mass spectrometer (Thermo Scientific, Waltham, MA, USA) coupled to an Easy-nLC system (Thermo Fisher Scientific, Waltham, MA, USA). Raw mass spectrometry data were processed using MaxQuant software (version 1.6.14). Protein abundances were obtained from the software-generated normalized quantitative output without additional normalization. Missing values were not imputed, and no filtering based on missing-value frequency was applied.
Four independent biological replicates were included per group. Differentially abundant proteins were identified using a fold-change threshold of >2.0 or <0.5 and a p value < 0.05. Functional enrichment analysis was performed using Fisher’s exact test, with all quantified proteins as the background dataset. The resulting p values were adjusted for multiple testing using the Benjamini–Hochberg procedure, and an adjusted p value < 0.05 was considered statistically significant. The proteomic dataset was deposited in iProX under accession number PXD085610.
2.9. Isolation of Hepatic Macrophages and Hepatocyte-Enriched Fractions
Hepatocyte-enriched and hepatic macrophage-enriched fractions were isolated from MCD-fed mice subjected to Lyz2-directed Ptges3 deletion and their corresponding controls. Perfusion and digestion buffers were prewarmed to 37 °C. Mice were anesthetized with isoflurane, and the portal vein was catheterized for liver perfusion. The inferior vena cava was transected to allow blood drainage. The liver was subsequently perfused with digestion buffer until the tissue exhibited a honeycomb-like appearance. The digested liver was collected, cleared of surrounding tissues, and passed through a 100 μm cell strainer.
The resulting cell suspension was centrifuged at 500× g for 6 min at 4 °C, and the supernatant was discarded. The cell pellet was resuspended in culture medium and subjected to two rounds of low-speed centrifugation at 50× g for 2 min at 4 °C. The hepatocyte-enriched pellet was collected for RT-qPCR analysis of Ptges3 expression. The supernatants were pooled and centrifuged at 500× g for 8 min at 4 °C to collect liver non-parenchymal cells. The resulting pellet was resuspended and layered onto a discontinuous Percoll gradient (30% over 70%), followed by centrifugation at 1500× g for 30 min at 4 °C, with acceleration and deceleration settings of 1 and 0, respectively. Cells at the 30%/70% interface were collected, washed with PBS, and centrifuged at 500× g for 5 min at 4 °C. The resulting hepatic macrophage-enriched fraction was collected for RT-qPCR analysis of Ptges3 expression.
2.10. Statistical Analysis
Statistical analyses were performed using GraphPad Prism 8. Data are presented as mean ± SEM. Normality was assessed using the Shapiro–Wilk test. For comparisons between two independent groups, a two-tailed unpaired Student’s t-test was used when no significant deviation from normality was detected. The data presented in Figure 1C, which did not meet the normality assumption, were analyzed using the Mann–Whitney U test. Comparisons involving more than two groups were performed using one-way ANOVA followed by Tukey’s post hoc test. A p value < 0.05 was considered statistically significant. Exact sample sizes are provided in the corresponding figure legends.
Figure 1.
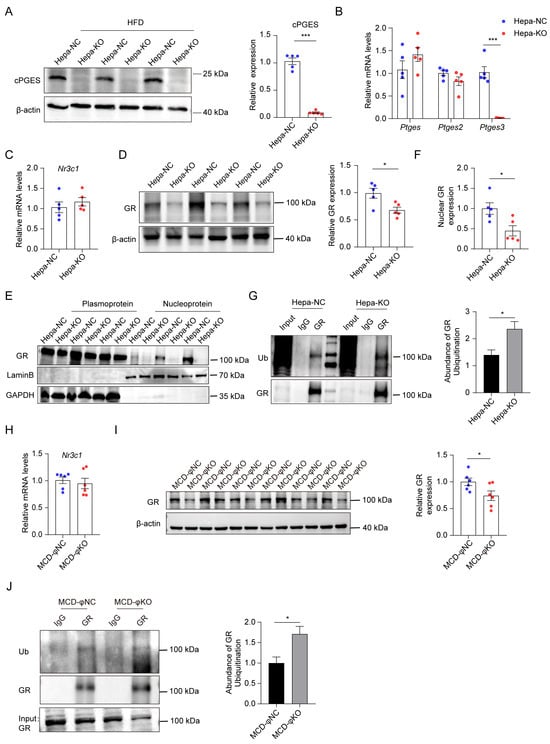
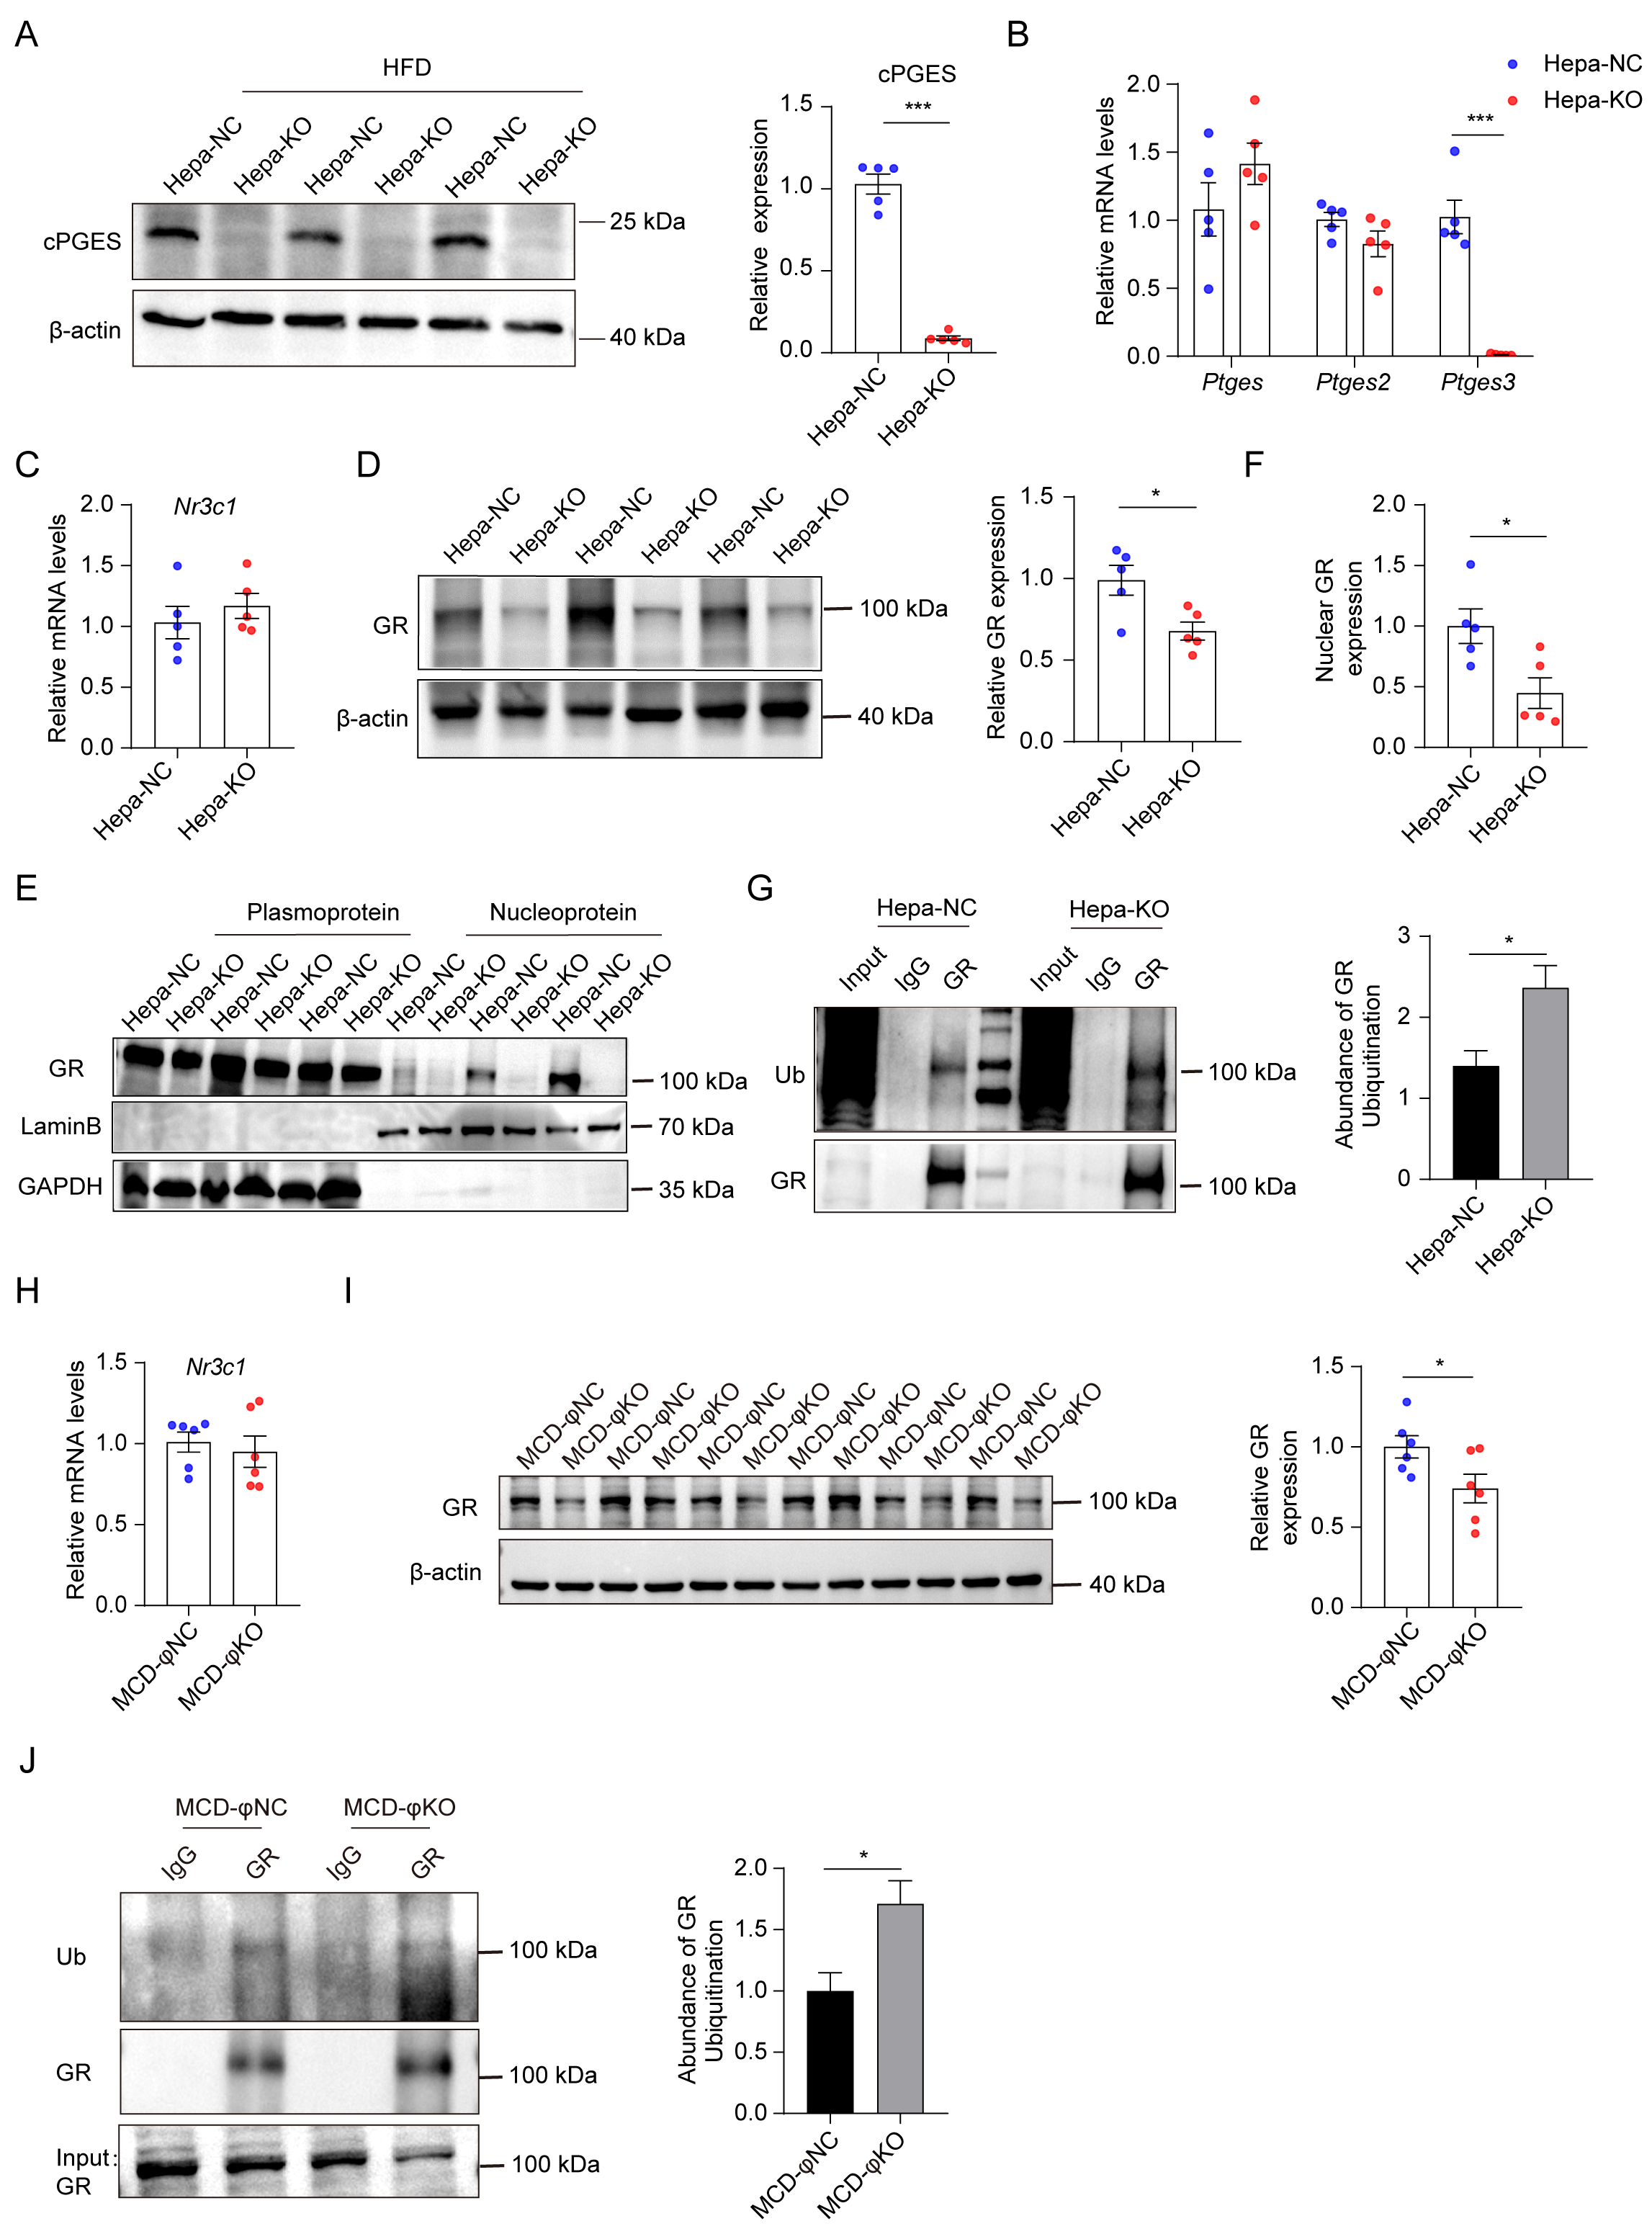
Cell-directed cPGES loss is associated with reduced GR abundance and enhanced GR ubiquitination. (A) Validation and quantification of hepatocyte-specific Ptges3 knockout, n = 5; Ptges3: cPGES-encoding gene; (B) qRT-PCR of PGE2 synthases in the livers from normal control and hepatocyte-specific Ptges3-knockout mice, n = 5; (C) mRNA levels of Nr3c1 in mice with or without hepatocyte-specific Ptges3 knockout, n = 5; (D) Western blotting and quantification of GR expression levels, n = 5; (E) GR localization in the cytoplasmic and nuclear fractions of liver tissue from mice with hepatocyte-specific Ptges3 knockout; (F) Quantification of nuclear GR protein levels, n = 5; (G) IP-GR from liver tissues of hepatocyte-specific Ptges3 knockout and control mice, followed by analysis and quantification of GR ubiquitination levels; (H) mRNA levels of Nr3c1 in mice with Lyz2-directed Ptges3 deletion, n = 6; (I) Western blotting and quantification of GR expression levels, n = 6; (J) IP-GR from liver tissues of Lyz2-directed Ptges3 deletion and control mice, followed by analysis and quantification of GR ubiquitination levels. The data are presented as mean ± Standard Error of the Mean (mean ± SEM). * p < 0.05, and *** p < 0.001.
3. Results
3.1. cPGES Loss Reduces GR Protein Abundance and Increases GR Ubiquitination
To determine whether cPGES/p23 is required to maintain GR protein homeostasis in vivo, we examined the GR abundance and ubiquitination after cell-directed Ptges3 deletion. In hepatocyte-directed Ptges3 knockout mice (Ptges3-HKO), cPGES protein and Ptges3 mRNA were nearly eliminated in the liver, whereas mPGES-1 and mPGES-2 were not detectably changed (Figure 1A,B and Figure S1A–C). Nr3c1 mRNA was unchanged, but the total GR protein was reduced, and the nuclear GR abundance was markedly decreased (Figure 1C–F). GR immunoprecipitation followed by ubiquitin immunoblotting showed increased ubiquitinated GR after hepatocyte cPGES deletion (Figure 1G). A similar molecular pattern was observed in the Lyz2-directed Ptges3 deletion model: Nr3c1 transcript abundance was not detectably altered, whereas the GR protein was reduced and GR ubiquitination was increased (Figure 1H–J). The hepatic PGE2 levels were unchanged in both models (Figure S2A–D). Together, these data show that cPGES deficiency reduces GR protein abundance and increases GR ubiquitination without altering Nr3c1 transcription, identifying a shared post-transcriptional alteration of GR across hepatocyte- and Lyz2-directed deletion models.
To further assess the clinical relevance of our findings, we analyzed the publicly available human liver transcriptomic dataset GSE126848. Compared with healthy controls, CYP7B1 and SERPINA1 mRNA levels were significantly reduced in the fatty liver subgroup, whereas NR3C1 expression showed no significant difference (Figure S3A). Pearson correlation analysis revealed a significant positive association between PTGES3 and NR3C1 expression across the analyzed samples and within the fatty liver subgroup (Figure S3B,C). These findings provide complementary human transcriptomic evidence of disease-associated gene expression changes. However, these associations do not establish a direct regulatory relationship between PTGES3 and NR3C1 or reflect GR protein abundance and activity.
3.2. Hepatocyte cPGES Deletion Aggravates HFD-Induced Steatosis and Cholesterol Accumulation
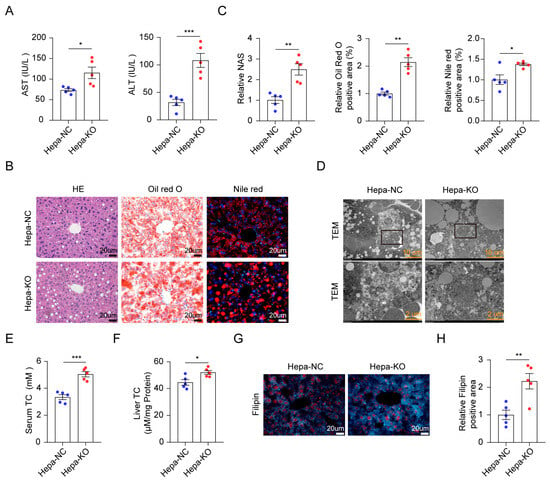
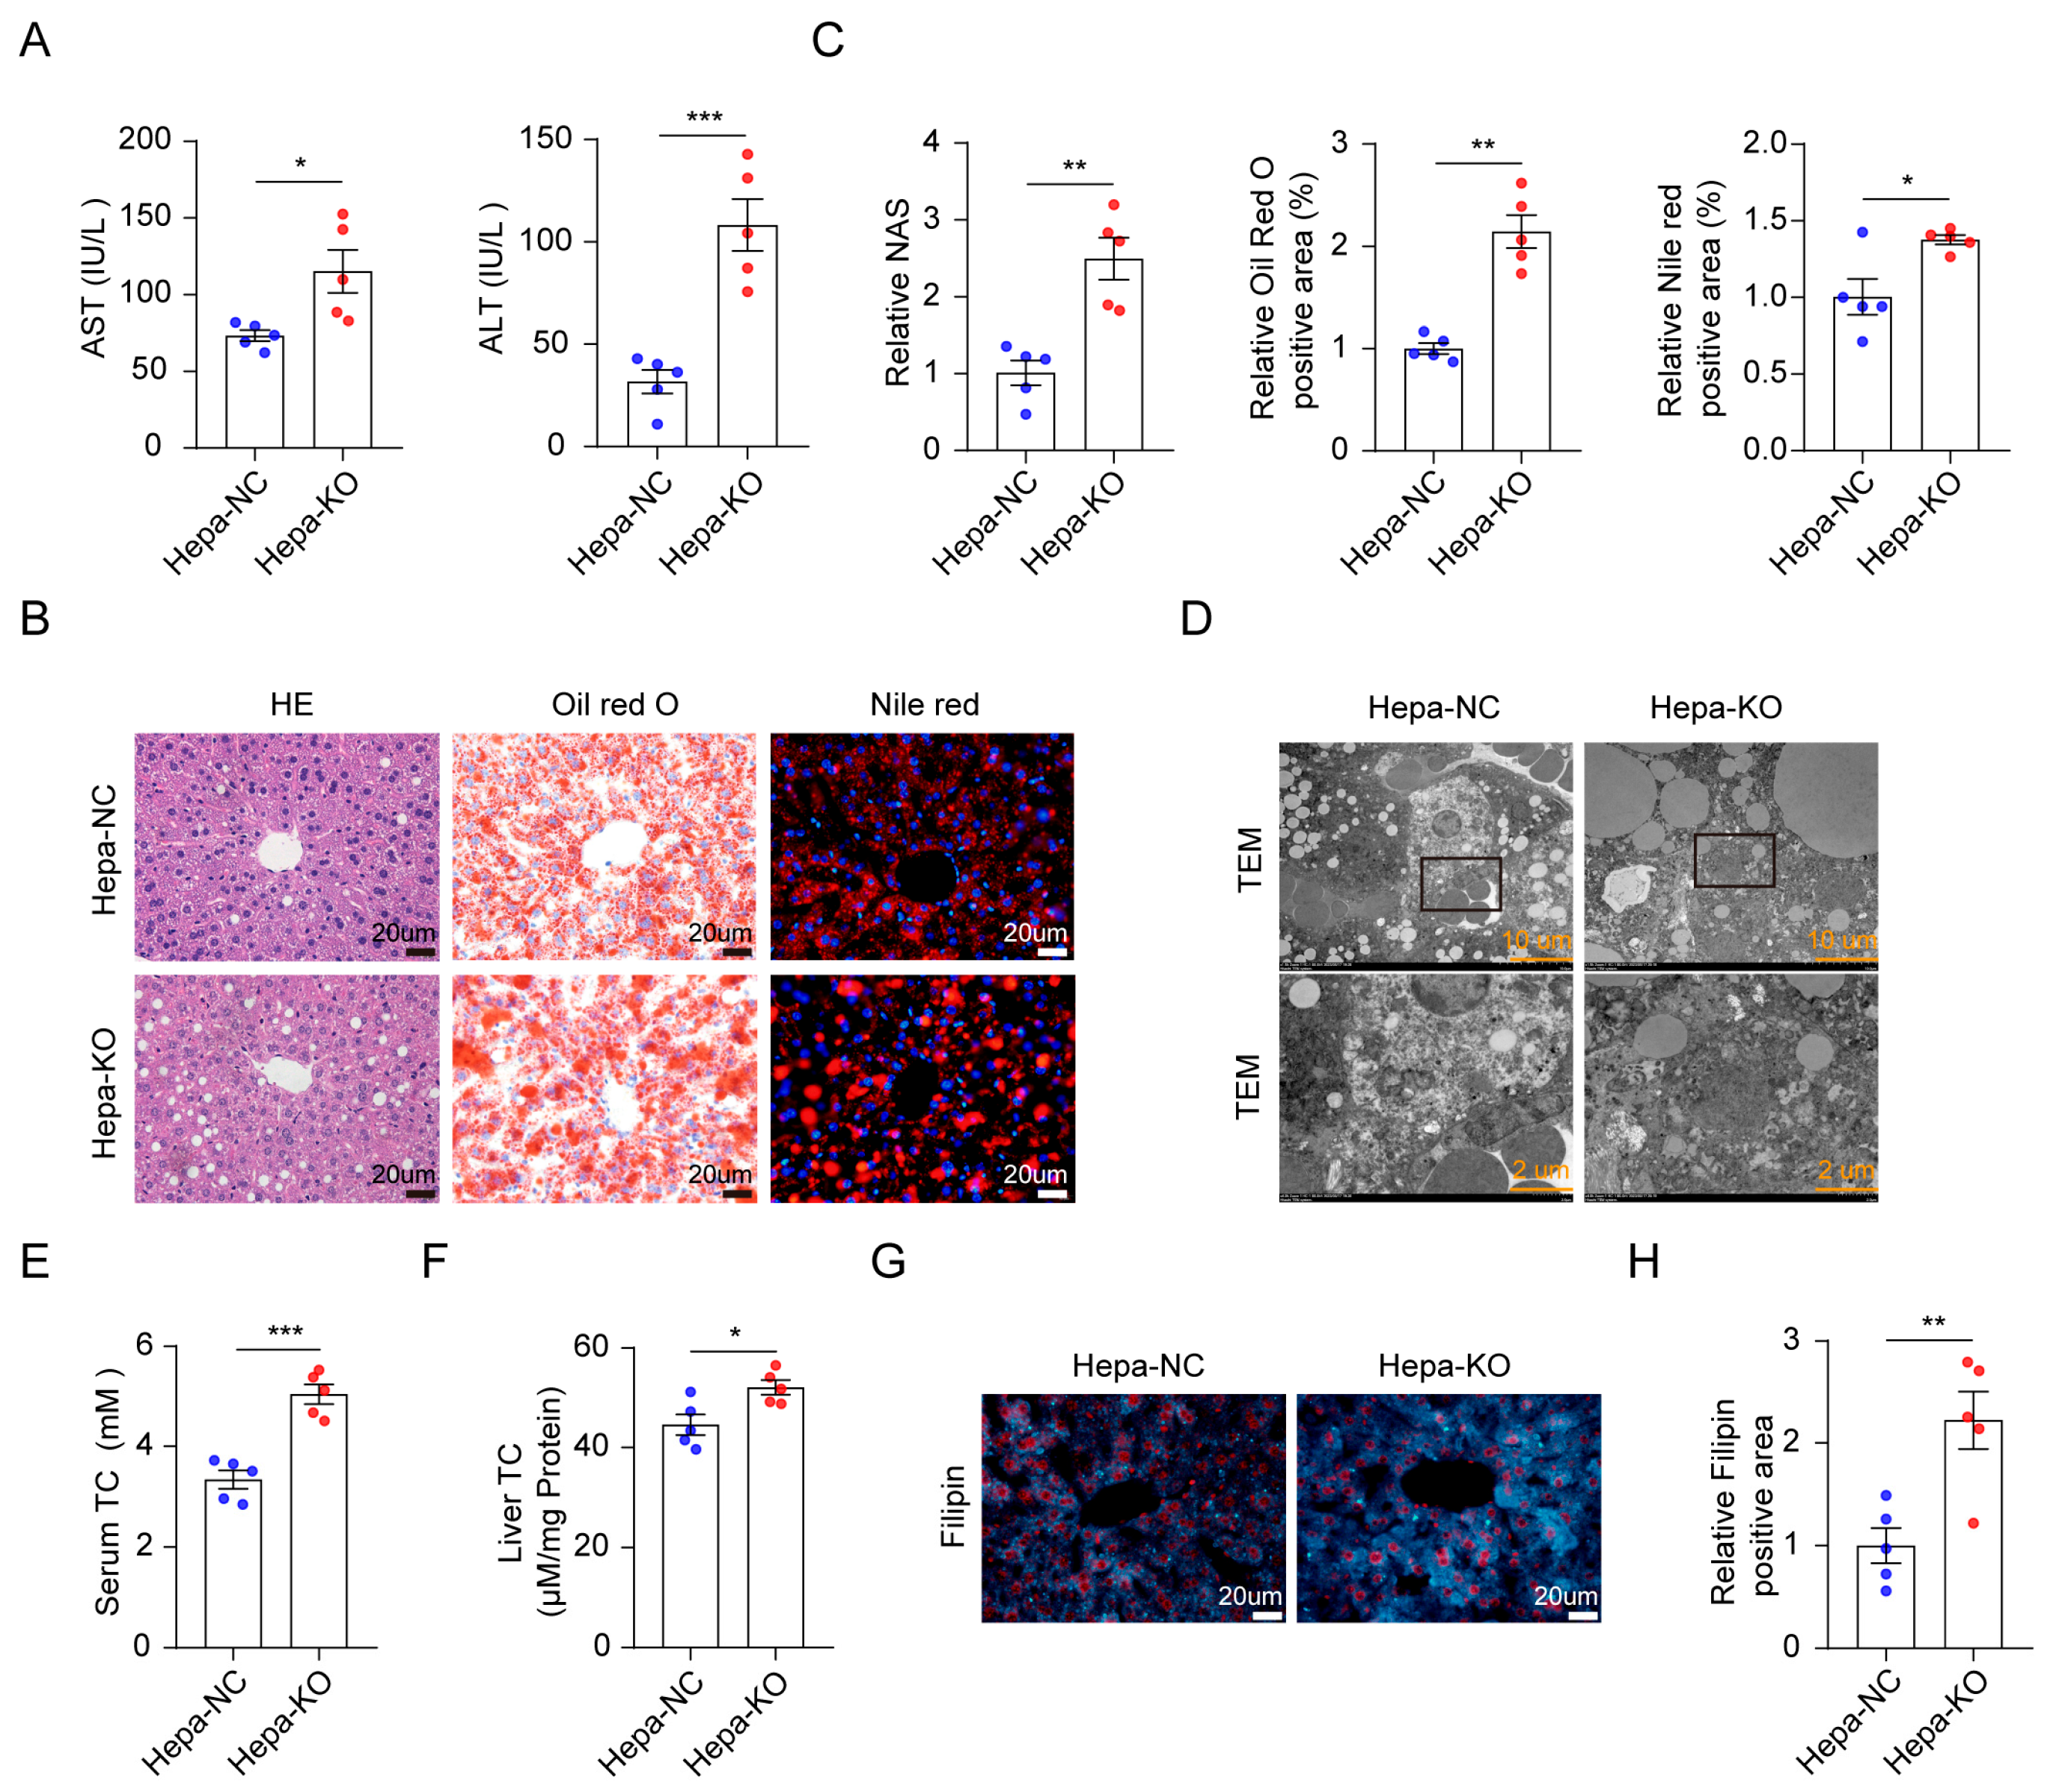
Having identified a shared GR protein defect after cPGES loss, we next examined its pathological consequences in hepatocytes in mice with an HFD. Ptges3-HKO mice showed an altered liver-to-body weight ratio and significantly higher serum ALT and AST levels than floxed controls (Figure 2A and Figure S4A). Histological analysis revealed increased hepatic steatosis and lipid accumulation using H&E, Oil Red O, and Nile red staining, and transmission electron microscopy showed markedly enlarged lipid droplets in Ptges3-HKO livers (Figure 2B–D). The serum and hepatic total cholesterol were increased, whereas triglyceride concentrations were not significantly changed (Figure 2E,F and Figure S4B,C). Filipin staining likewise demonstrated increased unesterified cholesterol in the Ptges3-HKO liver (Figure 2G,H). Thus, hepatocyte cPGES deficiency aggravates HFD-induced steatosis with a prominent disturbance in cholesterol homeostasis.
Figure 2.
Hepatocyte cPGES deletion aggravates HFD-induced steatosis and cholesterol accumulation. (A) Serum concentration of alanine aminotransferase (ALT) and aspartate aminotransferase (AST), n = 5; (B) Representative images of hematoxylin and eosin (H&E), Oil Red O and Nile red staining in mice with hepatocyte-specific Ptges3 knockout, n = 5; (C) Quantification of MASLD activity score (NAS) from H&E staining, lipid droplet-positive area from Oil red O staining, and positive Nile red staining in mice knockout Ptges3 in hepatocytes, n = 5; (D) Lipid changes shown by TEM; (E) Effects of hepatocyte-specific Ptges3 knockout on serum total cholesterol (TC) levels, n = 5; (F) Effects of hepatocyte-specific Ptges3 knockout on liver TC levels, n = 5; (G) Representative images of Filipin staining in mice with hepatocyte-specific Ptges3 knockout; (H) Quantification of Filipin staining in mice knockout Ptges3 in hepatocytes, n = 5. The data are presented as mean ± Standard Error of the Mean (mean ± SEM). * p < 0.05, ** p < 0.01, and *** p < 0.001.
3.3. CYP7B1 and SERPINA1E Contribute Functionally to the Hepatocyte Knockout Phenotype
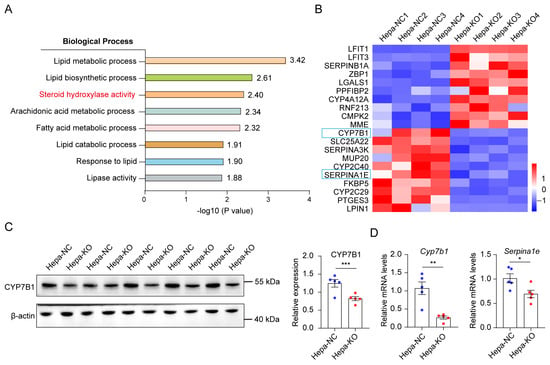
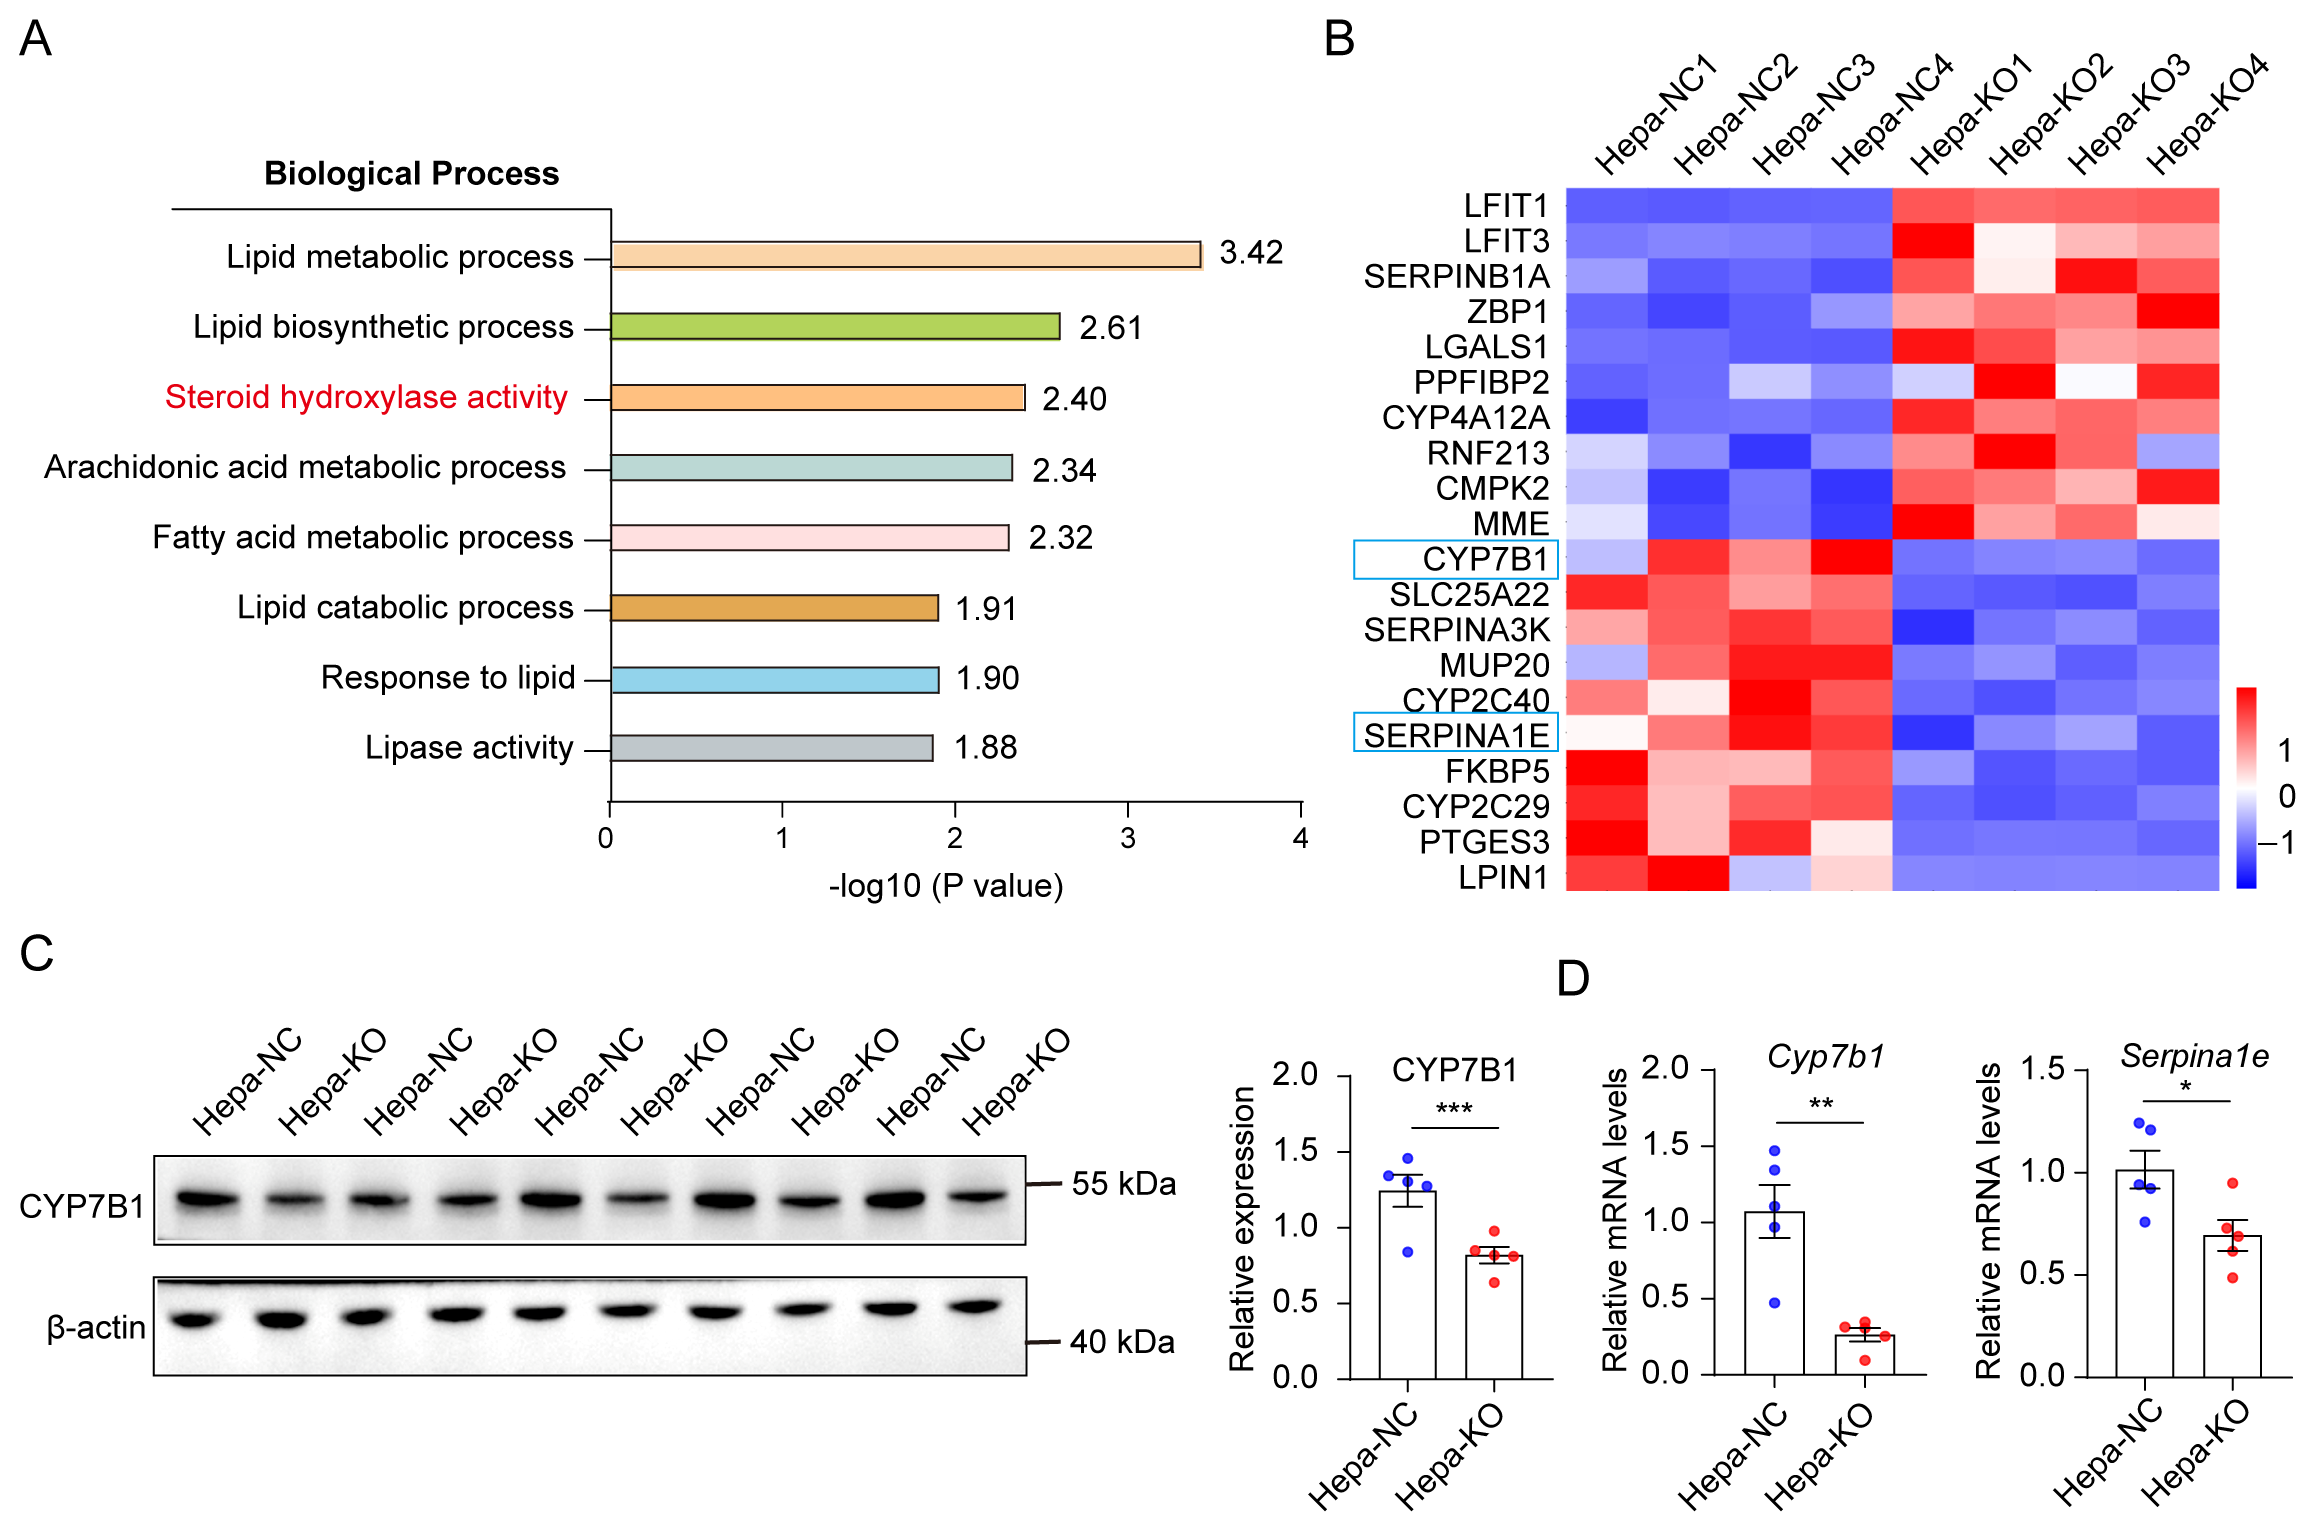
To define downstream metabolic changes associated with hepatocyte cPGES deficiency, we performed unbiased liver proteomics. Cholesterol-related metabolic processes were among the prominently altered pathways (Figure 3A). CYP7B1 and SERPINA1E were among the strongly reduced proteins and were independently validated at the protein and/or transcript level (Figure 3B–D), whereas CYP7A1 was not detectably altered (Figure S5A,B). Consistently, our previously published study showed that GR regulates Cyp7b1 and Serpina1e transcription through promoter-reporter assays, ChIP-qPCR, and glucocorticoid-response experiments [35].
Figure 3.
Hepatocyte cPGES regulates MASLD by modulating cholesterol metabolism. (A) GO analysis of differentially abundant proteins in the liver of hepatocyte- specific Ptges3 knockout mice compared with control mice; (B) Heatmap showing the top upregulated and downregulated proteins identified by proteomic analysis in hepatocyte-specific Ptges3 knockout mice; (C) Protein levels and quantification of CYP7B1 in mice with or without hepatocyte-specific Ptges3 knockout; (D) mRNA levels of Cyp7b1 and Serpina1e, n = 5. The data are presented as mean ± Standard Error of the Mean (mean ± SEM). * p < 0.05, ** p< 0.01, and *** p < 0.001.
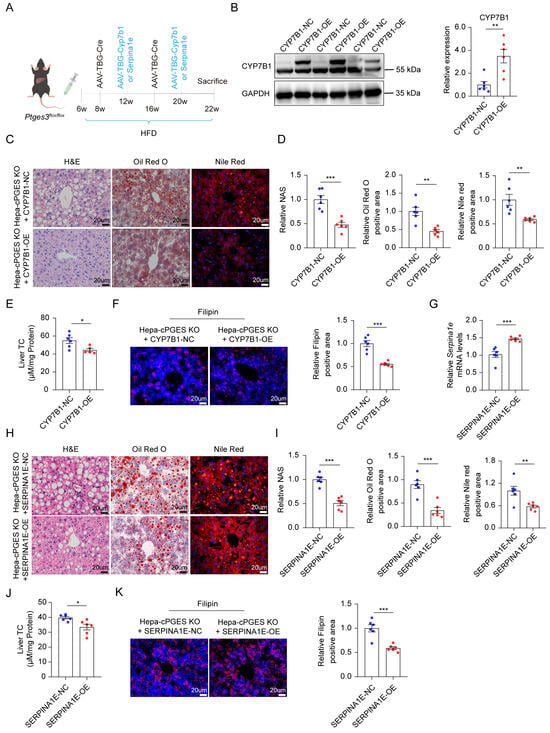
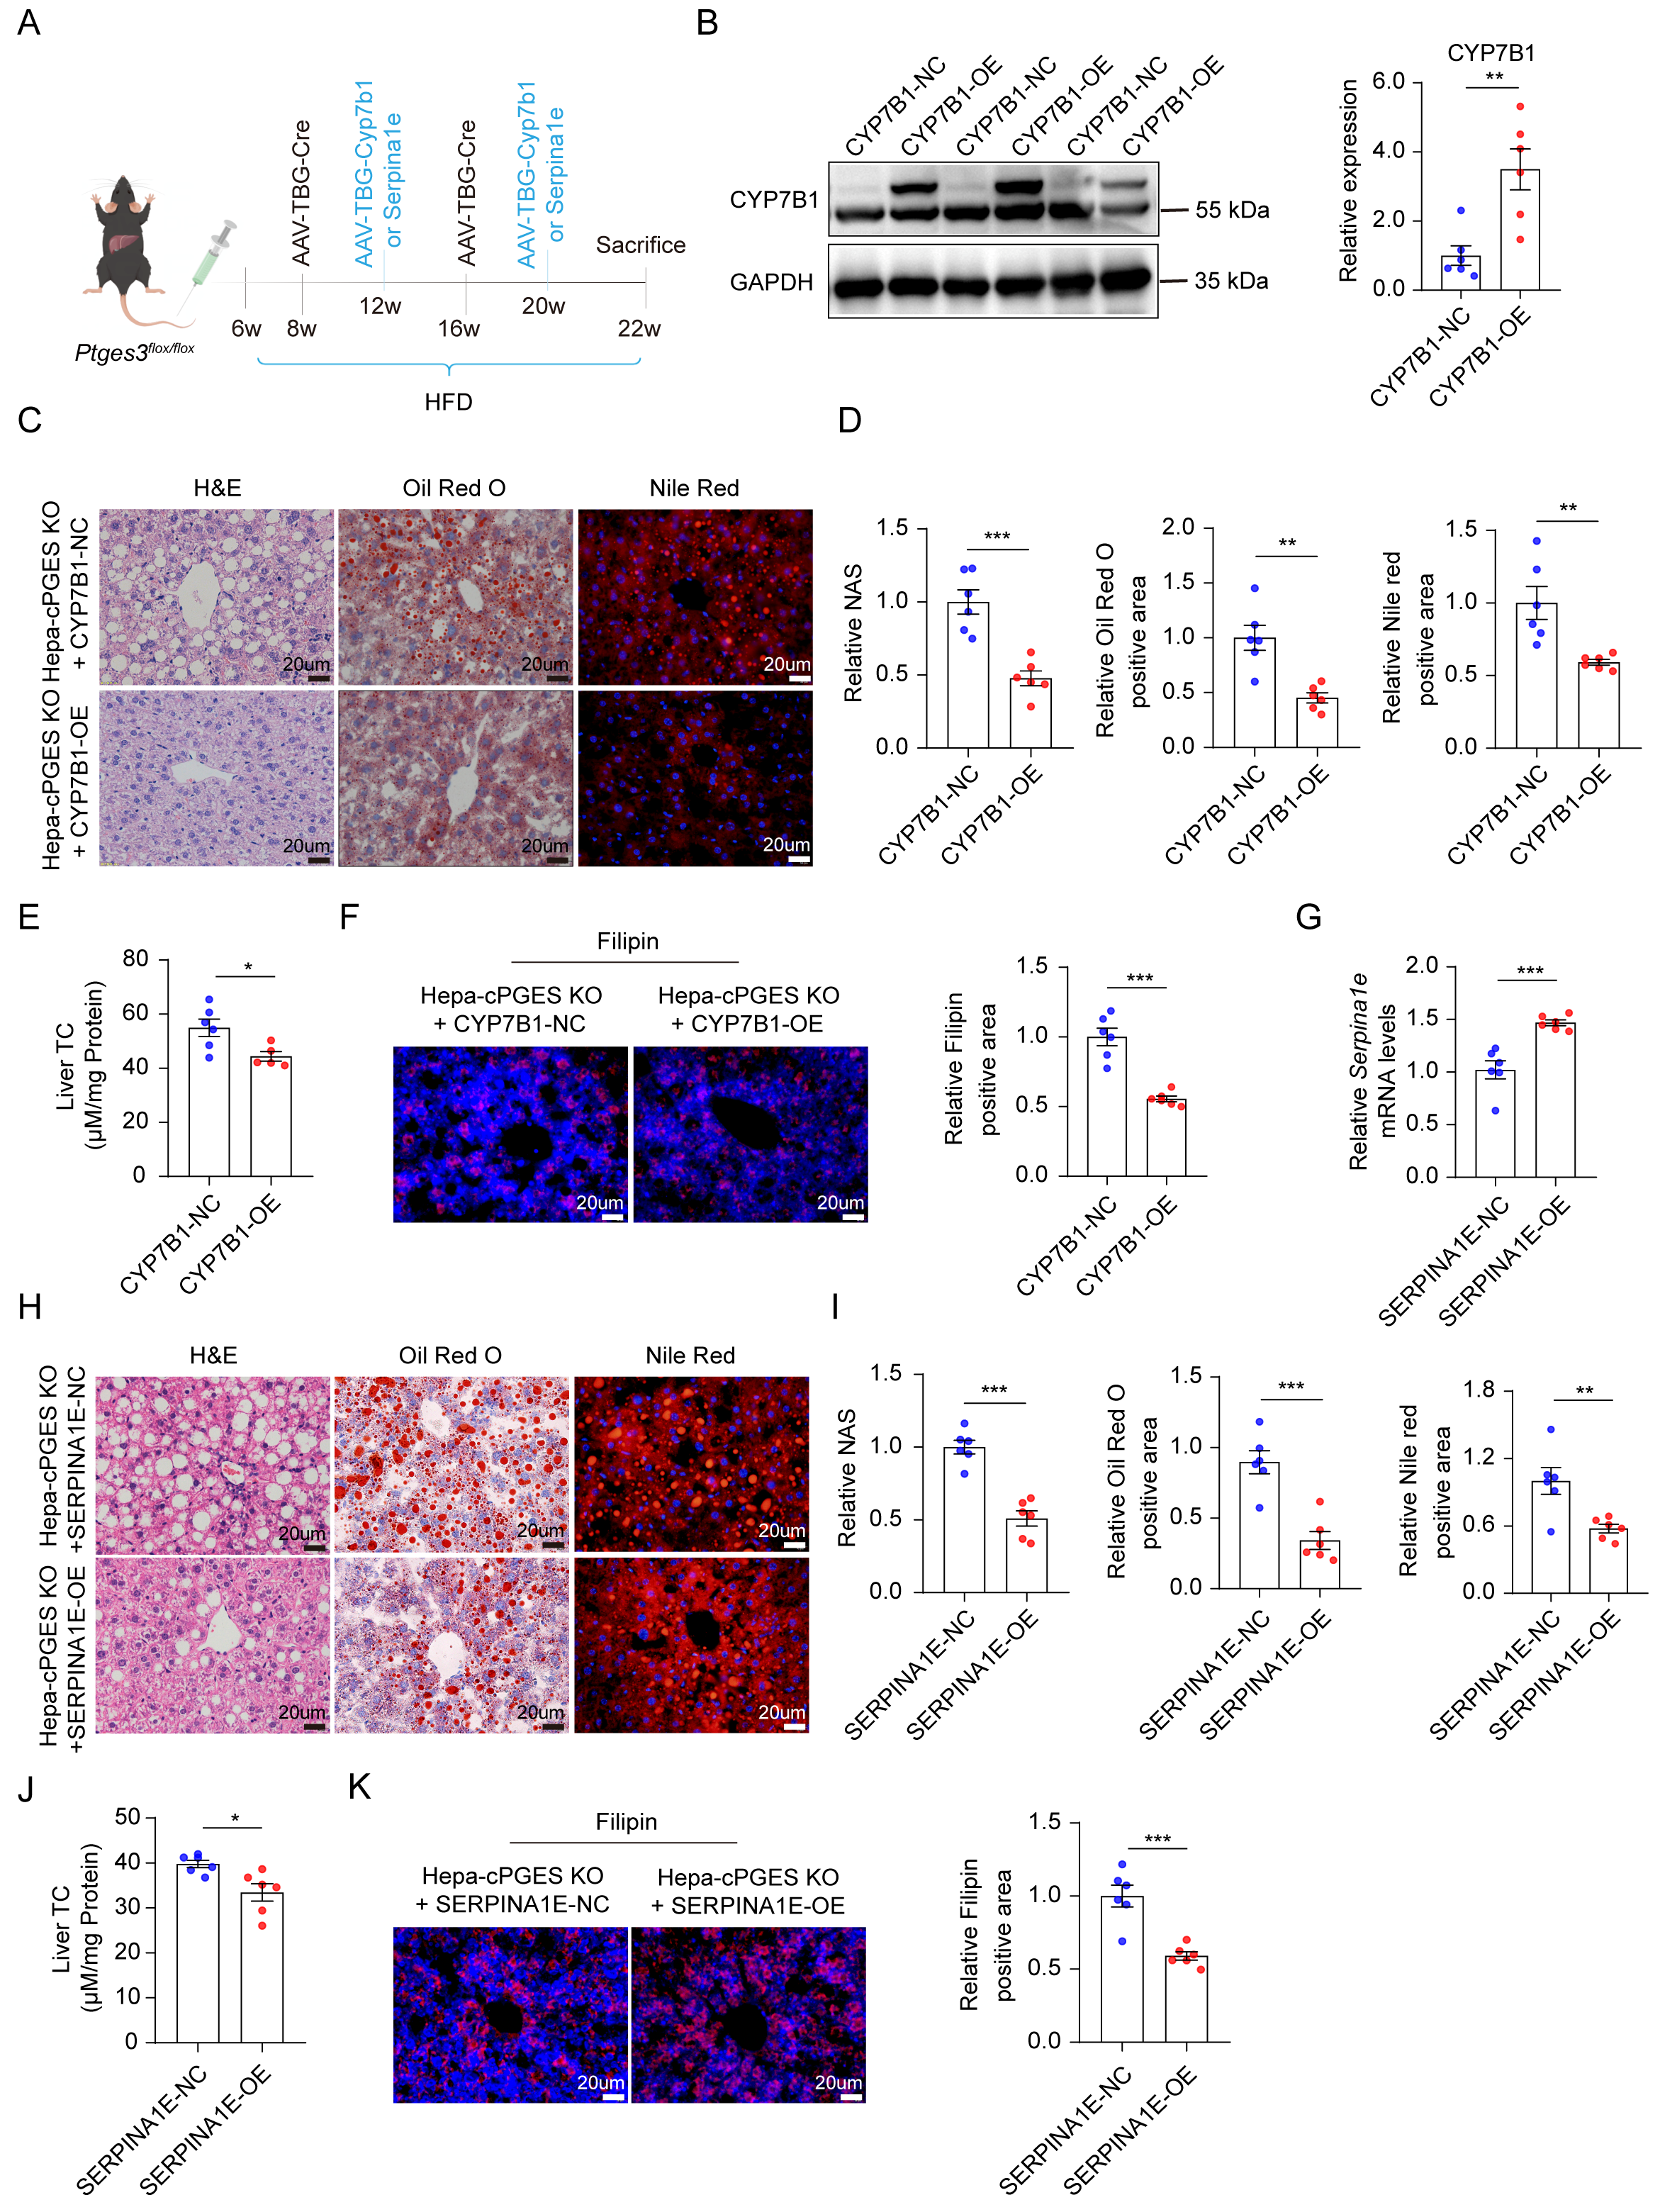
To test the functional relevance, we restored either CYP7B1 or SERPINA1E in Ptges3-HKO mice using AAV vectors (Figure 4A). Restoration of CYP7B1 reduced hepatic lipid deposition and abnormal cholesterol accumulation (Figure 4B–F), and SERPINA1E restoration produced a comparable improvement (Figure 4G–K). These rescue experiments demonstrate that reduced CYP7B1 and SERPINA1E materially contribute to the metabolic phenotype caused by hepatocyte Ptges3 deletion.
Figure 4.
Restoration of CYP7B1 or SERPINA1E attenuates the hepatocyte Ptges3 knockout phenotype. (A) Schematic diagram of AAV-mediated expression of CYP7B1 or SERPINA1E in hepatocyte-specific Ptges3-knockout mice fed an HFD. (B–F) CYP7B1 restoration in hepatocyte-specific Ptges3-knockout mice. (B) Confirmation of CYP7B1 rescue. (C) Representative images of H&E, Oil red O and Nile red staining. (D) Quantification of NAS, lipid droplet-positive rates (Oil Red O) and Nile red staining, n = 6. (E) liver TC, n = 5–6. (F) Representative images and quantification of Filipin staining, n = 6. (G–K) SERPINA1E restoration in hepatocyte-specific Ptges3-knockout mice. (G) Confirmation of SERPINA1E rescuing expression. (H) Representative H&E, Oil Red O and Nile red staining. (I) Quantification of NAS, relative positive rates of lipid droplets and Nile red staining, n = 6. (J) liver TC, n = 6. (K) Representative images and quantification of Filipin staining, n = 6. The data are presented as mean ± Standard Error of the Mean (mean ± SEM). * p < 0.05, ** p < 0.01, and *** p < 0.001.
3.4. Hepatocyte cPGES Deletion Has Limited Impact on MCD-Induced Steatohepatitis
We next asked whether the hepatocyte phenotype extended from HFD-induced steatosis to the inflammatory MASH model. After 5 weeks of MCD feeding, Ptges3-HKO and control mice showed no significant differences in the liver-to-body weight ratio, serum ALT or AST, hepatic lipid staining, or fibrosis assessed using Masson and Sirius red staining (Figure S6A–I). Under these experimental conditions, hepatocyte cPGES deletion therefore did not measurably modify the inflammatory fibrotic phenotype induced by short-term MCD feeding.
3.5. Lyz2-Directed cPGES Deletion Aggravates Inflammatory and Fibrotic Liver Injury
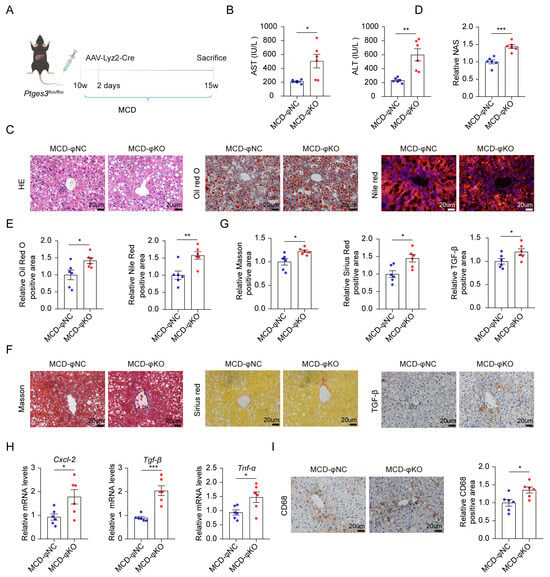
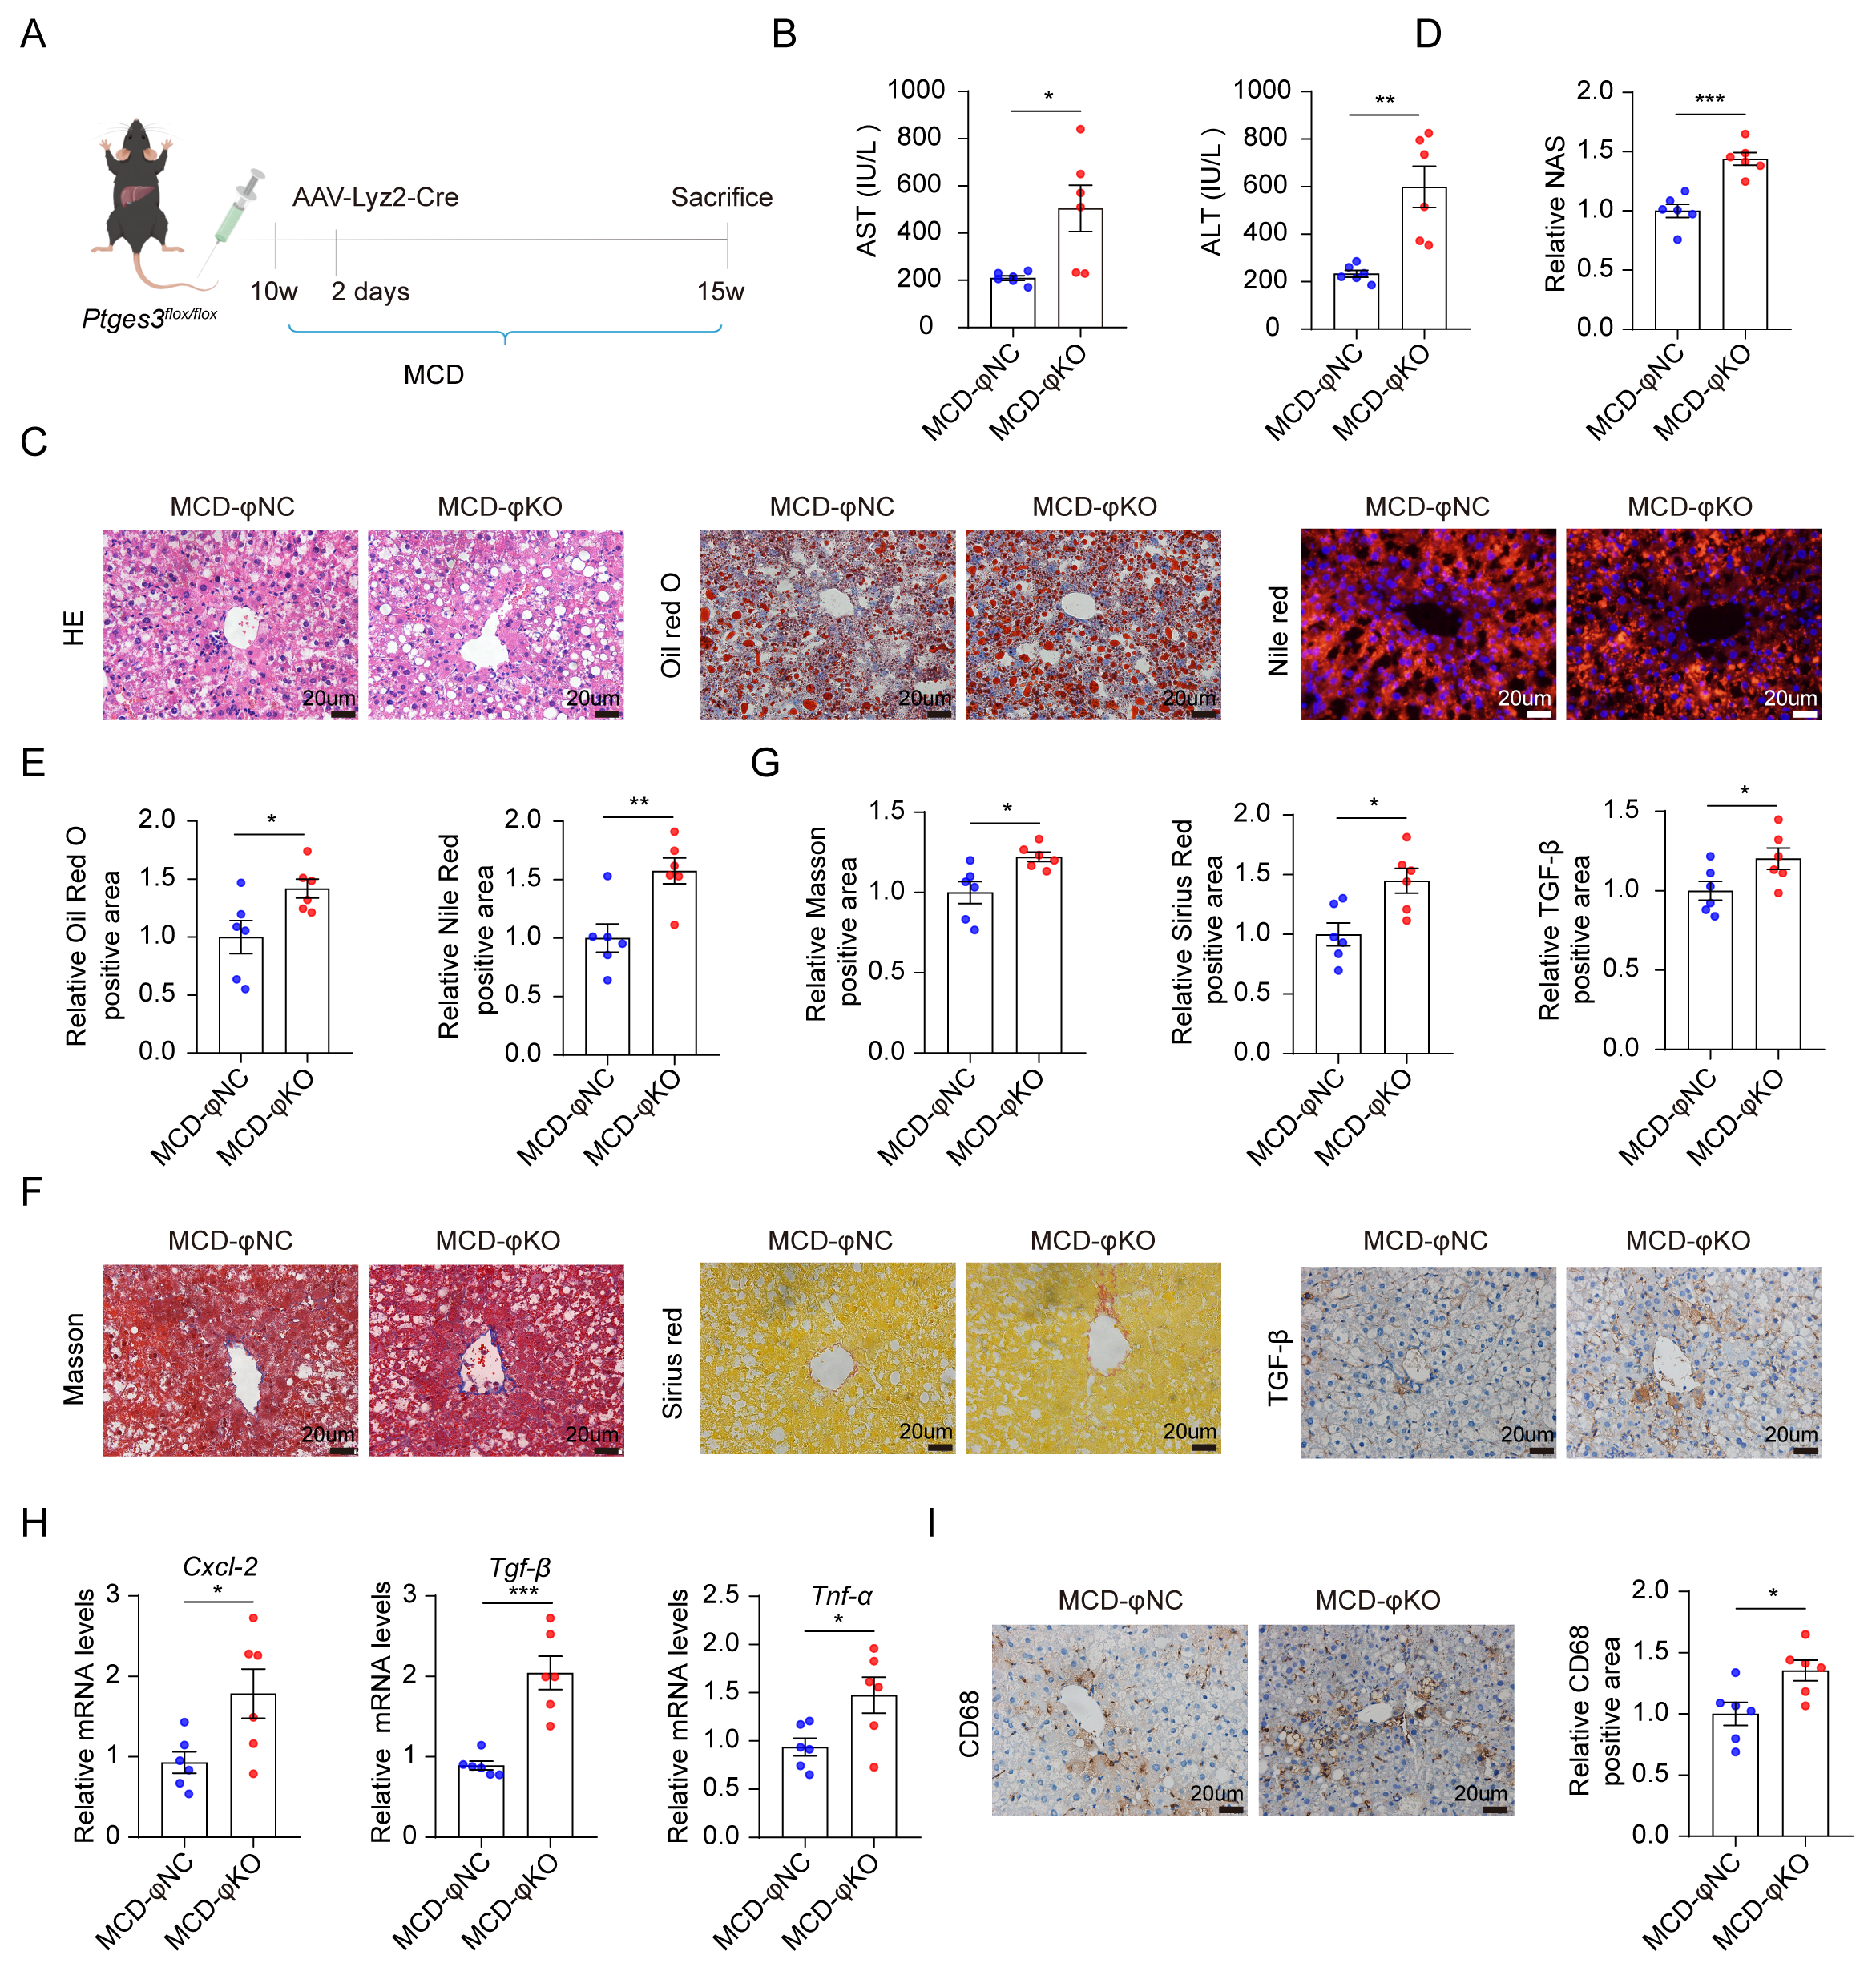
Subsequently, we generated myeloid-specific Ptges3-deficient mice to determine the pathological consequences of cPGES loss within the Lyz2-expressing compartment during MCD-induced steatohepatitis (Figure 5A and Figure S7A). Compared with the controls, Ptges3-deficient mice exhibited higher serum ALT and AST levels, together with more severe liver injury and lipid accumulation (Figure 5B–E). Histologic and molecular measures of inflammation and fibrosis, including macrophage-associated and extracellular-matrix markers, were also increased (Figure 5F–I and Figure S7B–E). These findings indicate that Lyz2-directed cPGES deletion aggravates inflammatory and fibrotic liver injury in the MCD model.
Figure 5.
Lyz2-directed cPGES deletion aggravates MCD-induced steatohepatitis and fibrosis. (A) Schematic diagram of tail vein injection of AAV-Lyz2-Cre virus in Ptges3flox/flox mice fed an MCD. (B) Effects of Lyz2-directed Ptges3 deletion on liver function, n = 6. (C) Representative H&E, Oil Red O and Nile red staining, n = 6. (D) Quantification of NAS, n = 6. (E) Quantification of positive area of lipid droplets, n = 6. (F) Representative images of Masson’s trichrome, Sirius red, and TGF-β staining in the liver from the MCD model. (G) Quantification of Masson’s trichrome, Sirius red, and TGF-β staining, n = 6. (H) mRNA levels of Cxcl-2, Tgf-β and Tnf-α in mice with Lyz2-directed Ptges3 deletion, n = 6. (I) CD68 expression detected by IHC in mice with or without Lyz2-directed Ptges3 deletion, n = 6. The data are presented as mean ± Standard Error of the Mean (mean ± SEM). * p < 0.05, ** p < 0.01, and *** p < 0.001.
3.6. Lyz2-Directed cPGES Loss Is Accompanied by Reduced MT1 and Enhanced NF-κB Activation
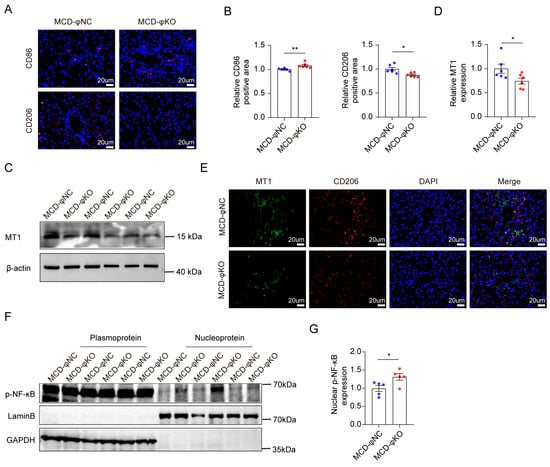
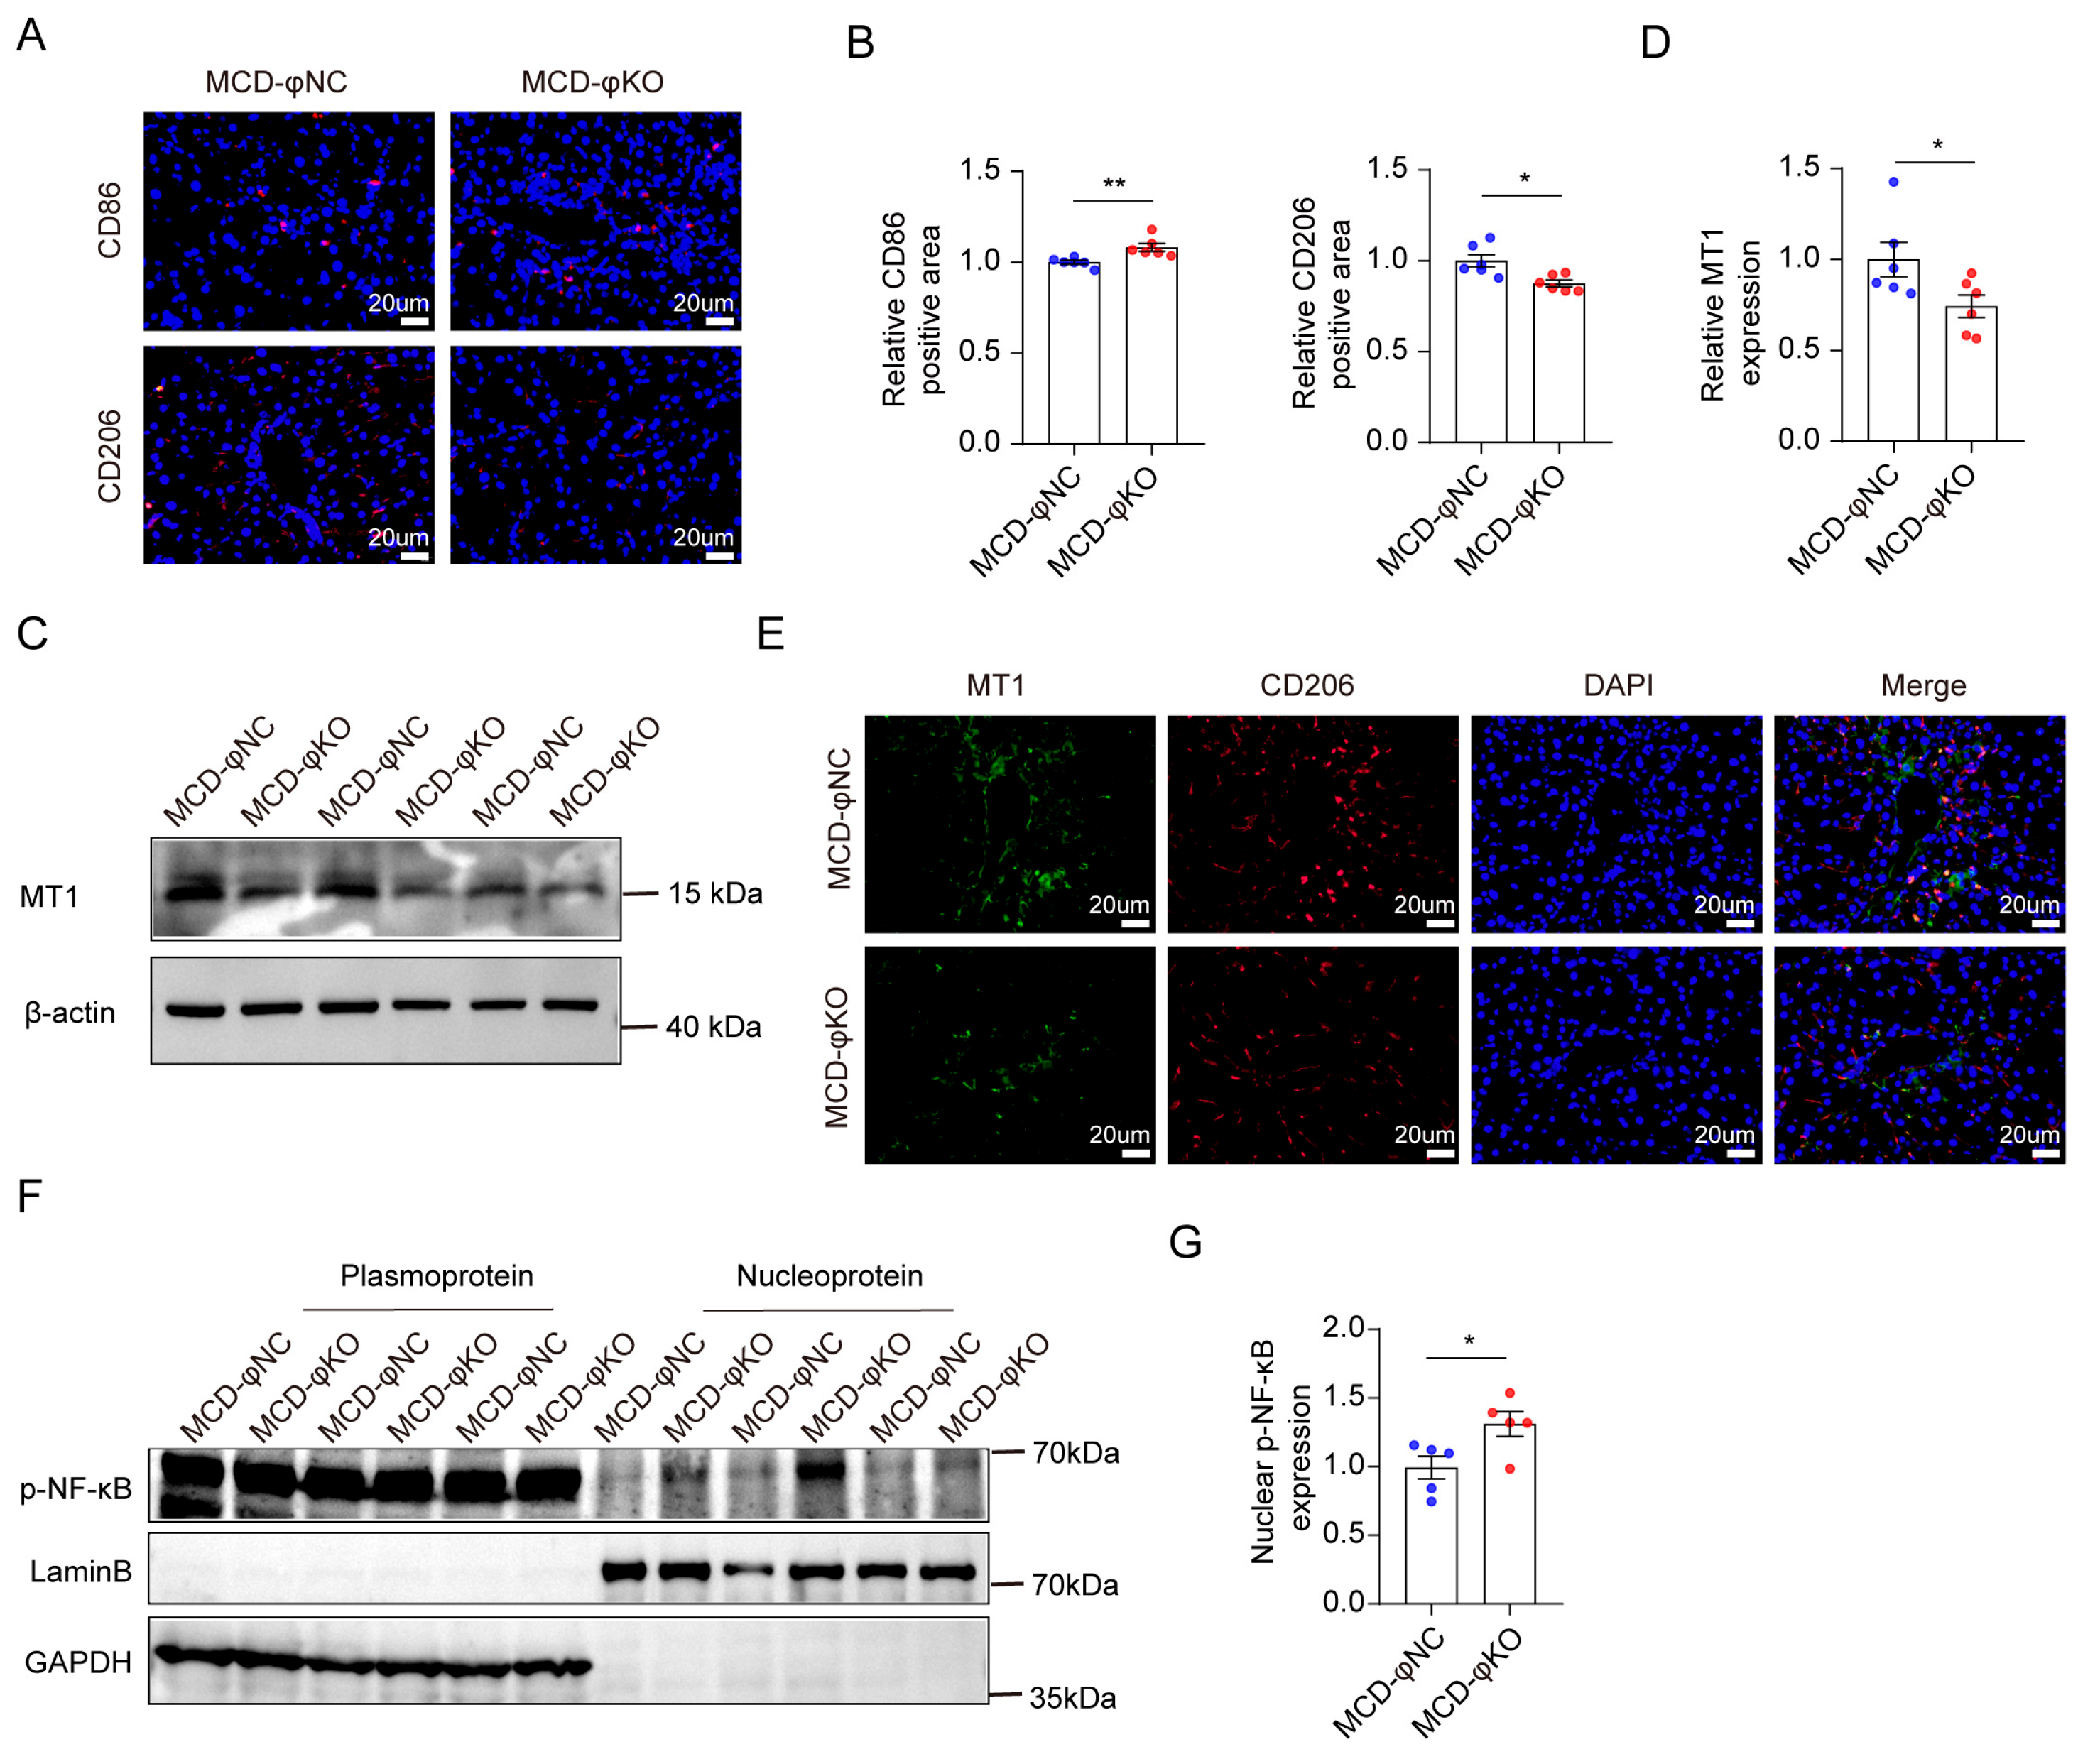
Because metallothionein 1 (MT1) is implicated in the regulation of macrophage inflammation, and our previous study provided evidence for GR-dependent transcriptional regulation of Mt1 and implicated cPGES in macrophage inflammatory signaling [35], we examined MT1 expression, macrophage polarization markers, and NF-κB activation after Lyz2-directed cPGES deletion. Ptges3 deletion increased the M1-associated marker CD86 and reduced the M2-associated marker CD206 (Figure 6A,B). The MT1 protein was reduced and colocalized with CD206-positive cells in liver sections (Figure 6C–E). The total NF-κB abundance was unchanged, but the nuclear phospho-NF-κB was increased (Figure 6F,G and Figure S8A). These findings indicate that Lyz2-mediated cPGES deficiency is associated with reduced MT1 expression, a shift toward pro-inflammatory macrophage markers, and enhanced nuclear NF-κB phosphorylation.
Figure 6.
Lyz2-directed cPGES loss is accompanied by reduced MT1 and enhanced NF-κB activation. (A) Effect of Lyz2-directed Ptges3 deletion on the expression of CD86 (M1 macrophage marker) and CD206 (M2 macrophage marker). (B) Quantification of CD86 and CD206 following Lyz2-directed Ptges3 deletion, n = 6. (C) Western blotting of MT1 expression levels, n = 6. (D) Quantification of MT1 expression levels, n = 6. (E) Co-localization of MT1 with CD206, a marker of M2 macrophages. (F) p-NF-κB localization in the cytoplasmic and nuclear fractions of liver tissue from mice with Lyz2-directed Ptges3 deletion, n = 5; (G) Quantification of nuclear p-NF-κB protein levels, n = 5. The data are presented as mean ± Standard Error of the Mean (mean ± SEM). * p < 0.05, and ** p < 0.01.
4. Discussion
GR is a key nuclear receptor that regulates systemic glucose [36,37,38,39], lipid, and protein metabolism and is closely associated with metabolic diseases such as diabetes and obesity [40,41,42,43]. Both the excessive activation and inhibition of GR exacerbate MASLD progression [41,44,45]. The present study identified altered GR protein homeostasis as a shared molecular consequence of cPGES deficiency during metabolic liver injury. In both hepatocyte- and Lyz2-directed Ptges3 deletion models, Nr3c1 transcription was preserved while GR protein abundance declined, and GR ubiquitination increased. This shared proximal molecular signature is associated with cell-context-dependent outcomes: cholesterol-associated steatosis in hepatocytes and enhanced inflammatory-fibrotic injury in the Lyz2-expressing compartment. Framing the findings in this sequence separates the shared molecular consequence of cPGES loss from the downstream disease programs that differ across hepatic cell types.
The hepatocyte experiment provides the strongest functional evidence linking cPGES deficiency to metabolic pathology. Ptges3 deletion preferentially increased hepatic cholesterol rather than triglycerides, reduced CYP7B1 and SERPINA1E expression, and aggravated HFD-induced steatosis. Restoration of either CYP7B1 or SERPINA1E attenuated hepatic lipid accumulation and cholesterol abnormalities, supporting their functional contribution to the phenotype. However, without direct GR rescue, these changes cannot be attributed exclusively to reduced GR abundance. Although whole-liver PGE2 concentrations were unchanged following Ptges3 deletion, these findings do not exclude localized or transient alterations in prostaglandin signaling.
MT1 is a small cysteine-rich protein that plays an important role in cellular stress responses [46,47,48]. Altered MT1 expression can exacerbate alcohol-induced liver inflammation, damage, and oxidative stress [47,49,50]. In the Lyz2-directed model, cPGES deficiency was accompanied by reduced GR and MT1, increased GR ubiquitination, increased nuclear phospho-NF-κB, and a shift in macrophage polarization markers toward a more inflammatory state. These changes were associated with more severe steatohepatitis and fibrosis. The absence of GR or MT1 rescue means that the GR-MT1-NF-κB relationship should be interpreted as a coherent mechanistic framework rather than a fully proven linear pathway in the knockout setting.
The reduction in GR protein despite unchanged Nr3c1 mRNA is consistent with the established role of p23/cPGES in the HSP90 steroid-receptor chaperone cycle. Increased GR ubiquitination further supports a post-transcriptional effect on receptor maintenance. Direct measurements of GR half-life, proteasome dependence, and the responsible ubiquitin ligase will be required to define the degradation mechanism and to determine whether cPGES loss accelerates proteasomal turnover directly or perturbs GR maturation upstream of degradation.
The present results can be briefly compared with our previously published cPGES manipulation study [35]. Partial cPGES suppression in that work preserved the total GR abundance while increasing the nuclear GR, whereas the current deletion models show reduced GR protein together with enhanced ubiquitination. One possible explanation is that partial suppression alters GR nuclear trafficking while preserving sufficient cPGES/p23 cochaperone activity to maintain GR abundance, whereas near-complete deletion may compromise GR protein homeostasis. Thus, partial suppression and near-complete loss may not represent equivalent biological states. Because these interventions were not tested as a graded series within the same experimental system, this comparison should be viewed as a mechanistic hypothesis rather than evidence for a defined biphasic dose response relationship.
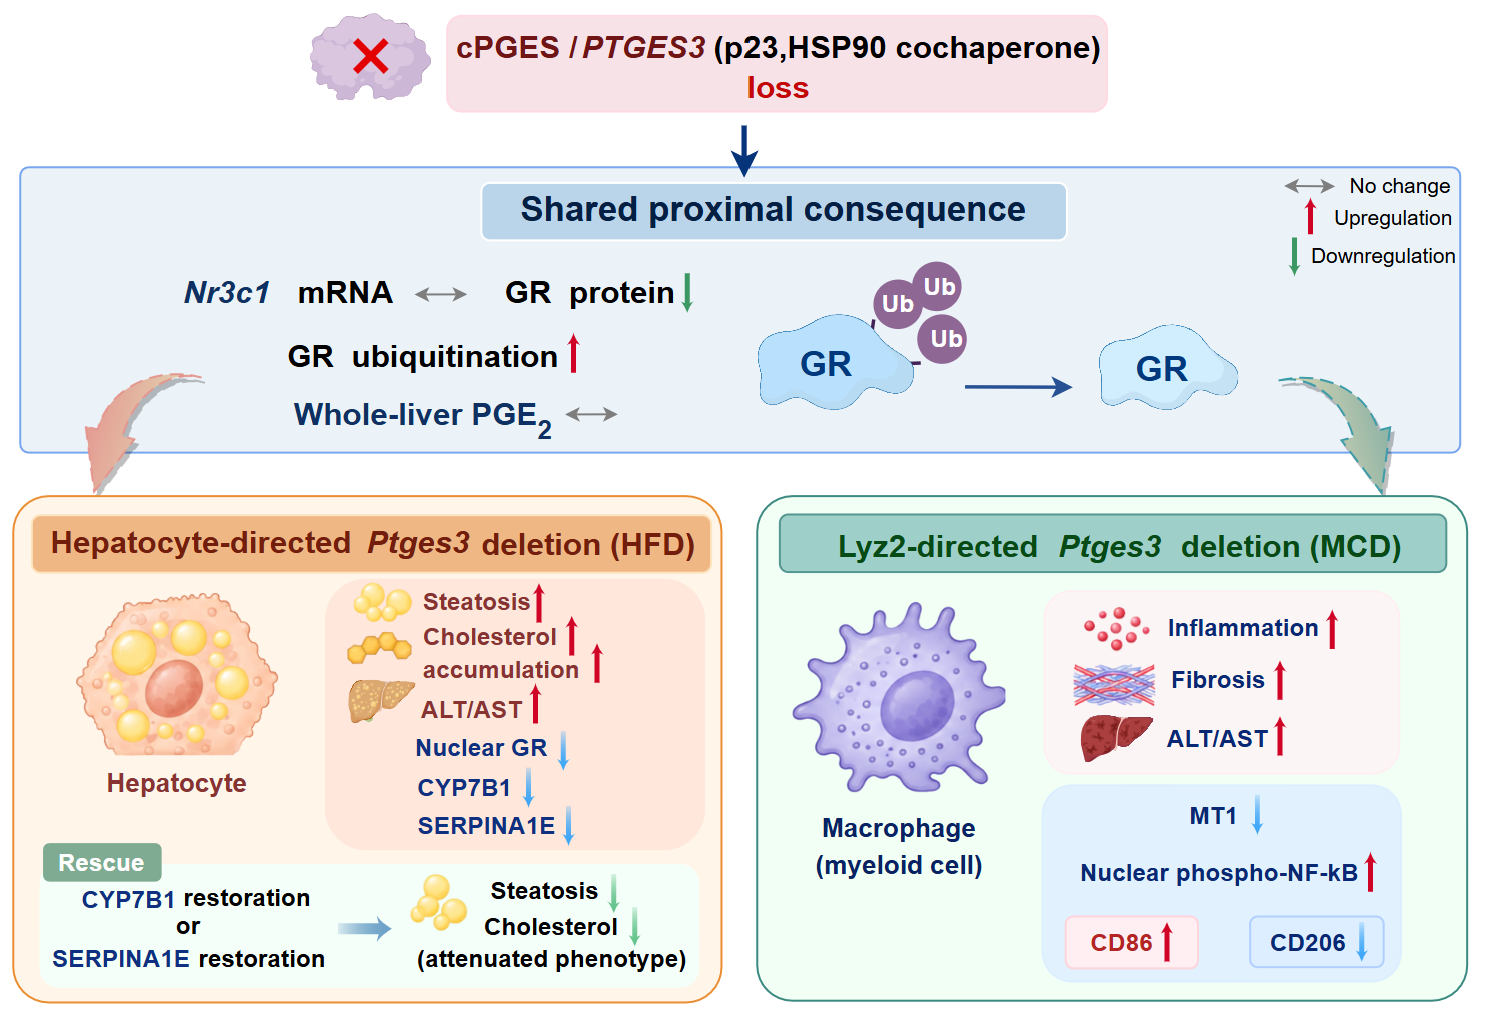
In summary, cPGES deficiency is associated with a shared defect in GR protein homeostasis across hepatic cell compartments, followed by distinct downstream consequences in hepatocytes and Lyz2-expressing cells (Figure 7). These findings reposition cPGES from a disease-stage regulator to a potential determinant of GR protein maintenance during metabolic liver stress and provide an independent mechanistic framework for understanding the metabolic and inflammatory consequences of Ptges3 loss.
Figure 7.
Schematic summary of cell-context-dependent effects of cPGES deficiency on metabolic liver injury. Hepatocyte- and Lyz2-directed Ptges3 deletion are both associated with reduced GR protein abundance and increased GR ubiquitination, suggesting altered GR protein homeostasis. Hepatocyte-directed deletion exacerbates HFD-induced steatosis and cholesterol accumulation, which are attenuated by CYP7B1 or SERPINA1E restoration. In contrast, Lyz2-directed deletion aggravates MCD-induced inflammation and fibrosis, accompanied by reduced MT1 expression and enhanced nuclear phospho-NF-κB. The proposed connections between altered GR protein homeostasis and downstream pathological changes remain to be established in the knockout models.
5. Conclusions
This study demonstrates that cPGES deficiency is associated with impaired glucocorticoid receptor (GR) protein homeostasis in both hepatocyte- and Lyz2-expressing compartments, characterized by reduced GR protein abundance and increased GR ubiquitination without detectable changes in Nr3c1 mRNA expression. The consequences of cPGES deficiency varied with the cellular and disease context. Hepatocyte-directed deletion aggravated HFD-induced steatosis and cholesterol accumulation, whereas Lyz2-directed deletion exacerbated inflammation and fibrosis in the MCD model. Restoration of CYP7B1 or SERPINA1E attenuated the hepatocyte metabolic phenotype, while reduced MT1 expression and increased nuclear phospho-NF-κB accompanied the inflammatory response. These findings suggest that the cochaperone function of cPGES contributes to the maintenance of GR abundance and may influence how different hepatic cell populations respond to metabolic stress. Preserving GR protein homeostasis may therefore be an important consideration in the modulation of cPGES.
6. Limitations of the Study
Several limitations should be considered. First, although cPGES deletion reduced the GR protein and increased GR ubiquitination, GR half-life, proteasome dependence, and the E3 ubiquitin ligase involved were not directly defined. Second, the hepatocyte rescue experiments support functional roles for CYP7B1 and SERPINA1E, but the absence of GR rescue prevents us from establishing whether the downstream metabolic effects are mediated by reduced GR abundance. Third, although reduced Ptges3 expression was confirmed in the hepatic macrophage-enriched fraction, the cellular specificity of deletion was not established by purified cell sorting, and contributions from other Lyz2-expressing myeloid populations cannot be excluded. Fourth, the MCD model reproduces features of steatohepatitis and fibrosis but does not fully reflect the metabolic context of human MASH. Finally, comparisons with previously reported partial cPGES suppression were made across separate experimental systems and do not establish a dose-dependent relationship.
Supplementary Materials
The following supporting information can be downloaded at https://www.mdpi.com/article/10.3390/metabo16110907/s1, Figure S1: Hepatocyte-specific knockout of Ptges3 has no effect on the expression changes of other two PGE2 synthases. Figure S2: Effects of Ptges3 knockout on the PGE2 pathway. Figure S3: Identification of differentially expressed genes and correlation analysis between patients with fatty liver disease and healthy controls based on the GSE126848 dataset. Figure S4: Hepatocyte-specific deletion of Ptges3 does not alter triglyceride levels. Figure S5: Effects of hepatocyte-specific deletion of cPGES on CYP7A1 expression. Figure S6: Knockout of Ptges3 in hepatocytes did not detectably alter the MASH phenotype. Figure S7: Lyz2-directed Ptges3 contributes to the exacerbation of MASH process. Figure S8: Lyz2-directed Ptges3 deletion does not alter total NF-κB protein abundance.
Author Contributions
Conceptualization, Y.S., D.Z. and B.C.; methodology, R.Q., G.Q., J.L. and Z.Q.; validation, R.Q.; formal analysis, R.Q.; investigation, R.Q., G.Q., J.L., Z.Q. and C.S.; resources, L.Y.; data curation, R.Q., G.Q. and L.Z.; writing—review and editing, D.Z., and B.C.; visualization, R.Q. and D.Z.; supervision, Y.Z., D.Z., B.C., and Y.S.; funding acquisition, D.Z. and Y.S. All authors have read and agreed to the published version of the manuscript.
Funding
This research was supported by Natural Science Research in Jiangsu Universities grant 21KJA350002 (Y.S.), Basic Research Program of Jiangsu grant BK20240050 (Y.S.), Basic Research Program of Jiangsu grant BK20250158 (D.Z.); Jiangsu Government Scholarship for Overseas Studies (D.Z.); Jiangsu Qinglan Project (D.Z.), Jiangsu Research Innovation Program for College Graduates grant KYCX24-3119 (L.Z.) KYCX25_3257 (S.N.), and Construction Project of High Level Hospital of Jiangsu Province grant LCZX202403 (Y.S.).
Institutional Review Board Statement
This study was approved by the Animal Ethics Committee of Xuzhou Medical University (202306T010).
Informed Consent Statement
Not applicable.
Data Availability Statement
The raw hepatic proteomic sequencing data generated in this study have been deposited in the iProX database under the dataset identifier PXD085610. All data presented in this study are available upon request to the corresponding author.
Conflicts of Interest
The authors declare no conflicts of interest.
Abbreviations
The following abbreviations are used in this manuscript:
| AAV | Adeno-associated virus serotype |
| ALT | Alanine aminotransferase |
| AST | Aspartate Aminotransferase |
| cPGES | Cytosolic prostaglandin E synthase |
| CYP7B1 | cytochrome P450 7B1 enzyme |
| FBS | Fetal Bovine Serum |
| GR | glucocorticoid receptor |
| HFD | high-fat diet |
| MASLD | Metabolic dysfunction-associated steatotic liver disease |
| MASH | Metabolic dysfunction-associated steatohepatitis |
| MCD | Methionine-Choline Deficient Diet |
| mPGES-1 | Microsomal prostaglandin E synthase-1 |
| mPGES-2 | Microsomal prostaglandin E synthase-2 |
| MT1 | Metallothionein 1 |
| PGE2 | Prostaglandin E2 |
| qRT-PCR | Quantitative Reverse Transcription Polymerase Chain Reaction |
| SERPINA1E | Serine protease inhibitor A1e |
| TC | Total cholesterol |
| TG | Triglyceride |
References
- Wang, X.; Zhang, L.; Dong, B. Molecular mechanisms in MASLD/MASH-related HCC. Hepatology 2025, 82, 1303–1324. [Google Scholar] [CrossRef] [Scilit] [PubMed]
- Yang, X.; Yang, N.; Cheng, Z.; Zhang, R.; Fan, H.; Liu, D.; Aa, J.; Wang, G.; Xie, Y. Hepatic GPR75 exacerbates MASH through GNAI2-dependent signaling. Hepatology 2026, 84, 1469–1485. [Google Scholar] [CrossRef] [Scilit] [PubMed]
- European Association for the Study of the Liver (EASL); European Association for the Study of Diabetes (EASD); European Association for the Study of Obesity (EASO). EASL-EASD-EASO Clinical Practice Guidelines on the Management of Metabolic Dysfunction-Associated Steatotic Liver Disease (MASLD). Obes. Facts 2024, 17, 374–444. [Google Scholar] [CrossRef] [Scilit] [PubMed]
- Horn, P.; Tacke, F. Metabolic reprogramming in liver fibrosis. Cell Metab. 2024, 36, 1439–1455. [Google Scholar] [CrossRef] [Scilit] [PubMed]
- Hagström, H.; Shang, Y.; Hegmar, H.; Nasr, P. Natural history and progression of metabolic dysfunction-associated steatotic liver disease. Lancet Gastroenterol. Hepatol. 2024, 9, 944–956. [Google Scholar] [CrossRef] [Scilit] [PubMed]
- Zhong, Q.; Zhou, R.; Huang, Y.N.; Huang, R.D.; Li, F.R.; Chen, H.W.; Wei, Y.F.; Liu, K.; Cao, B.F.; Liao, K.Y.; et al. Frailty and risk of metabolic dysfunction-associated steatotic liver disease and other chronic liver diseases. J. Hepatol. 2025, 82, 427–437. [Google Scholar] [CrossRef] [Scilit] [PubMed]
- Sun, Y. Macrophages in MASLD: From inflammatory and metabolic crosstalk to exercise intervention. Front. Immunol. 2026, 17, 1894884. [Google Scholar] [CrossRef] [Scilit] [PubMed]
- Vecchio, C.; Sheferaw, A.N.; Kivumbi, E.; Stoppa, I.; Pantham, D.; Christaki, F.; Provera, A.; Dianzani, U.; Sutti, S. When the Liver Flares: Inflammatory and Immunometabolic Mechanisms Driving the Transition from MASLD to MASH. Inflammation 2026, 49, 179. [Google Scholar] [CrossRef] [Scilit] [PubMed]
- Syed-Abdul, M.M. Lipid Metabolism in Metabolic-Associated Steatotic Liver Disease (MASLD). Metabolites 2023, 14, 12. [Google Scholar] [CrossRef] [Scilit] [PubMed]
- Steinberg, G.R.; Carpentier, A.C.; Wang, D. MASH: The nexus of metabolism, inflammation, and fibrosis. J. Clin. Investig. 2025, 135, e186420. [Google Scholar] [CrossRef] [Scilit] [PubMed]
- Li, C.; Yang, D.; Wang, X.; Zhang, S.; Dai, W.; Zhao, S.; Zhao, W. ApoA5-CIDEC axis regulates hepatic lipid metabolism, inflammation, and fibrosis in MASLD. J. Mol. Med. 2025, 104, 3. [Google Scholar] [CrossRef] [Scilit] [PubMed]
- De Ponti, F.F.; Liu, Z.; Scott, C.L. Understanding the complex macrophage landscape in MASLD. JHEP Rep. 2024, 6, 101196. [Google Scholar] [CrossRef] [Scilit] [PubMed]
- Newsome, P.N.; Loomba, R. Therapeutic horizons in metabolic dysfunction-associated steatohepatitis. J. Clin. Investig. 2025, 135, e186425. [Google Scholar] [CrossRef] [Scilit] [PubMed]
- Kisseleva, T.; Ganguly, S.; Murad, R.; Wang, A.; Brenner, D.A. Regulation of Hepatic Stellate Cell Phenotypes in Metabolic Dysfunction-Associated Steatohepatitis. Gastroenterology 2025, 169, 797–812. [Google Scholar] [CrossRef] [Scilit] [PubMed]
- Tanioka, T.; Nakatani, Y.; Semmyo, N.; Murakami, M.; Kudo, I. Molecular identification of cytosolic prostaglandin E2 synthase that is functionally coupled with cyclooxygenase-1 in immediate prostaglandin E2 biosynthesis. J. Biol. Chem. 2000, 275, 32775–32782. [Google Scholar] [CrossRef] [Scilit] [PubMed]
- Kobayashi, T.; Nakatani, Y.; Tanioka, T.; Tsujimoto, M.; Nakajo, S.; Nakaya, K.; Murakami, M.; Kudo, I. Regulation of cytosolic prostaglandin E synthase by phosphorylation. Biochem. J. 2004, 381, 59–69. [Google Scholar] [CrossRef] [Scilit] [PubMed]
- Tanioka, T.; Nakatani, Y.; Kobayashi, T.; Tsujimoto, M.; Oh-ishi, S.; Murakami, M.; Kudo, I. Regulation of cytosolic prostaglandin E2 synthase by 90-kDa heat shock protein. Biochem. Biophys. Res. Commun. 2003, 303, 1018–1023. [Google Scholar] [CrossRef] [Scilit] [PubMed]
- Nakatani, Y.; Hokonohara, Y.; Tajima, Y.; Kudo, I.; Hara, S. Involvement of the constitutive prostaglandin E synthase cPGES/p23 in expression of an initial prostaglandin E2 inactivating enzyme, 15-PGDH. Prostaglandins Other Lipid Mediat. 2011, 94, 112–117. [Google Scholar] [CrossRef] [Scilit] [PubMed]
- Pratt, W.B.; Toft, D.O. Regulation of signaling protein function and trafficking by the hsp90/hsp70-based chaperone machinery. Exp. Biol. Med. 2003, 228, 111–133. [Google Scholar] [CrossRef] [Scilit] [PubMed]
- Dittmar, K.D.; Demady, D.R.; Stancato, L.F.; Krishna, P.; Pratt, W.B. Folding of the glucocorticoid receptor by the heat shock protein (hsp) 90-based chaperone machinery. The role of p23 is to stabilize receptor.hsp90 heterocomplexes formed by hsp90.p60.hsp70. J. Biol. Chem. 1997, 272, 21213–21220. [Google Scholar] [CrossRef] [Scilit] [PubMed]
- Noddings, C.M.; Wang, R.Y.; Johnson, J.L.; Agard, D.A. Structure of Hsp90-p23-GR reveals the Hsp90 client-remodelling mechanism. Nature 2022, 601, 465–469. [Google Scholar] [CrossRef] [Scilit] [PubMed]
- Wang, D.; Jabile, M.J.T.; Di Pastena, F.; Townsend, L.K.; Ahmadi, E.; Hoegl, A.; Payne, A.; Lavoie, D.C.T.; Batchuluun, B.; Gautam, J.; et al. GDF15 suppresses liver inflammation independently of weight loss through neuroendocrine glucocorticoid signaling. Cell Metab. 2026, 38, 2128–2142.e2126. [Google Scholar] [CrossRef] [Scilit] [PubMed]
- Chen, M.; Bai, M.; Yi, Y.; Lu, S.; Luo, J.; Li, P.; Zhang, H.; Jiang, H.; Zhou, H. Upregulation of hepatic CD36 via glucocorticoid receptor activation contributes to dexamethasone-induced liver lipid metabolism disorder in mice. Toxicol. Lett. 2022, 363, 1–10. [Google Scholar] [CrossRef] [Scilit] [PubMed]
- Shu, M.; Wang, P. Cedrol mitigates hepatic lipid accumulation and adipocyte hypertrophy induced by corticosteroids through the inhibition of glucocorticoid receptor activity. Sci. Rep. 2025, 16, 3006. [Google Scholar] [CrossRef] [Scilit] [PubMed]
- Kokkinopoulou, I.; Moutsatsou, P. Mitochondrial Glucocorticoid Receptors and Their Actions. Int. J. Mol. Sci. 2021, 22, 6054. [Google Scholar] [CrossRef] [Scilit] [PubMed]
- Lu, C.L.; Ren, J.; Mo, J.W.; Fan, J.; Guo, F.; Chen, L.Y.; Wen, Y.L.; Li, S.J.; Fang, Y.Y.; Wu, Z.F.; et al. Glucocorticoid Receptor-Dependent Astrocytes Mediate Stress Vulnerability. Biol. Psychiatry 2022, 92, 204–215. [Google Scholar] [CrossRef] [Scilit] [PubMed]
- Kim, S.; Yang, S.; Kim, J.; Chung, K.W.; Jung, Y.S.; Chung, H.Y.; Lee, J. Glucocorticoid Receptor Down-Regulation Affects Neural Stem Cell Proliferation and Hippocampal Neurogenesis. Mol. Neurobiol. 2024, 61, 3198–3211. [Google Scholar] [CrossRef] [Scilit] [PubMed]
- Chen, L.; Ding, L.; Wang, X.; Huang, Y.; Gao, S.J. Activation of glucocorticoid receptor signaling inhibits KSHV-induced inflammation and tumorigenesis. mBio 2024, 15, e0301123. [Google Scholar] [CrossRef] [Scilit] [PubMed]
- Baschant, U.; Tuckermann, J. The role of the glucocorticoid receptor in inflammation and immunity. J. Steroid Biochem. Mol. Biol. 2010, 120, 69–75. [Google Scholar] [CrossRef] [Scilit] [PubMed]
- Auger, J.P.; Zimmermann, M.; Faas, M.; Stifel, U.; Chambers, D.; Krishnacoumar, B.; Taudte, R.V.; Grund, C.; Erdmann, G.; Scholtysek, C.; et al. Metabolic rewiring promotes anti-inflammatory effects of glucocorticoids. Nature 2024, 629, 184–192. [Google Scholar] [CrossRef] [Scilit] [PubMed]
- Zhan, X.; Song, B.; Xu, S.; Zhou, H. Glucocorticoid receptor signaling: Crosstalk with inflammation. Immunopharmacol. Immunotoxicol. 2026, 48, 67–78. [Google Scholar] [CrossRef] [Scilit] [PubMed]
- Noddings, C.M.; Johnson, J.L.; Agard, D.A. Cryo-EM reveals how Hsp90 and FKBP immunophilins co-regulate the glucocorticoid receptor. Nat. Struct. Mol. Biol. 2023, 30, 1867–1877. [Google Scholar] [CrossRef] [Scilit] [PubMed]
- Kirschke, E.; Goswami, D.; Southworth, D.; Griffin, P.R.; Agard, D.A. Glucocorticoid receptor function regulated by coordinated action of the Hsp90 and Hsp70 chaperone cycles. Cell 2014, 157, 1685–1697. [Google Scholar] [CrossRef] [Scilit] [PubMed]
- Wang, R.Y.; Noddings, C.M.; Kirschke, E.; Myasnikov, A.G.; Johnson, J.L.; Agard, D.A. Structure of Hsp90-Hsp70-Hop-GR reveals the Hsp90 client-loading mechanism. Nature 2022, 601, 460–464. [Google Scholar] [CrossRef] [Scilit] [PubMed]
- Zhong, D.; Qiao, R.; Quan, G.; Song, C.; Fu, K.; Zou, Y.; Qi, X.; Su, W.; Liu, Y.; Li, F.; et al. Cell-specific cPGES control of glucocorticoid receptor function drives MASLD progression. Cell Rep. 2026, 45, 117901. [Google Scholar] [CrossRef] [Scilit] [PubMed]
- Cirstea, I.C.; Moll, H.P.; Tuckermann, J. Glucocorticoid receptor and RAS: An unexpected couple in cancer. Trends Cell Biol. 2023, 33, 594–604. [Google Scholar] [CrossRef] [Scilit] [PubMed]
- Liu, B.; Zhang, T.N.; Knight, J.K.; Goodwin, J.E. The Glucocorticoid Receptor in Cardiovascular Health and Disease. Cells 2019, 8, 1227. [Google Scholar] [CrossRef] [Scilit] [PubMed]
- Kassel, O.; Herrlich, P. Crosstalk between the glucocorticoid receptor and other transcription factors: Molecular aspects. Mol. Cell Endocrinol. 2007, 275, 13–29. [Google Scholar] [CrossRef] [Scilit] [PubMed]
- Fadel, L.; Dacic, M.; Fonda, V.; Sokolsky, B.A.; Quagliarini, F.; Rogatsky, I.; Uhlenhaut, N.H. Modulating glucocorticoid receptor actions in physiology and pathology: Insights from coregulators. Pharmacol. Ther. 2023, 251, 108531. [Google Scholar] [CrossRef] [Scilit] [PubMed]
- Kadmiel, M.; Cidlowski, J.A. Glucocorticoid receptor signaling in health and disease. Trends Pharmacol. Sci. 2013, 34, 518–530. [Google Scholar] [CrossRef] [Scilit] [PubMed]
- Quagliarini, F.; Makris, K.; Friano, M.E.; Uhlenhaut, N.H. EJE Prize 2023: Genes on steroids-genomic control of hepatic metabolism by the glucocorticoid receptor. Eur. J. Endocrinol. 2023, 188, R111–R130. [Google Scholar] [CrossRef] [Scilit] [PubMed]
- Oakley, R.H.; Cidlowski, J.A. The biology of the glucocorticoid receptor: New signaling mechanisms in health and disease. J. Allergy Clin. Immunol. 2013, 132, 1033–1044. [Google Scholar] [CrossRef] [Scilit] [PubMed]
- Whirledge, S.; DeFranco, D.B. Glucocorticoid Signaling in Health and Disease: Insights From Tissue-Specific GR Knockout Mice. Endocrinology 2018, 159, 46–64. [Google Scholar] [CrossRef] [Scilit] [PubMed]
- Polyzos, S.A.; Targher, G. Role of Glucocorticoids in Metabolic Dysfunction-Associated Steatotic Liver Disease. Curr. Obes. Rep. 2024, 13, 242–255. [Google Scholar] [CrossRef] [Scilit] [PubMed]
- Hu, M.; Han, T.; Pan, Q.; Ni, D.; Gao, F.; Wang, L.; Ren, H.; Zhang, X.; Jiao, H.; Wang, Y.; et al. The GR-gp78 Pathway is involved in Hepatic Lipid Accumulation Induced by Overexpression of 11β-HSD1. Int. J. Biol. Sci. 2022, 18, 3107–3121. [Google Scholar] [CrossRef] [Scilit] [PubMed]
- Yang, R.; Roshani, D.; Gao, B.; Li, P.; Shang, N. Metallothionein: A Comprehensive Review of Its Classification, Structure, Biological Functions, and Applications. Antioxidants 2024, 13, 825. [Google Scholar] [CrossRef] [Scilit] [PubMed]
- Kim, H.G.; Huang, M.; Xin, Y.; Zhang, Y.; Zhang, X.; Wang, G.; Liu, S.; Wan, J.; Ahmadi, A.R.; Sun, Z.; et al. The epigenetic regulator SIRT6 protects the liver from alcohol-induced tissue injury by reducing oxidative stress in mice. J. Hepatol. 2019, 71, 960–969. [Google Scholar] [CrossRef] [Scilit] [PubMed]
- Andrews, G.K. Regulation of metallothionein gene expression by oxidative stress and metal ions. Biochem. Pharmacol. 2000, 59, 95–104. [Google Scholar] [CrossRef] [Scilit] [PubMed]
- Zhou, Z.; Sun, X.; Lambert, J.C.; Saari, J.T.; Kang, Y.J. Metallothionein-independent zinc protection from alcoholic liver injury. Am. J. Pathol. 2002, 160, 2267–2274. [Google Scholar] [CrossRef] [Scilit] [PubMed]
- Ma, J.; Cao, H.; Rodrigues, R.M.; Xu, M.; Ren, T.; He, Y.; Hwang, S.; Feng, D.; Ren, R.; Yang, P.; et al. Chronic-plus-binge alcohol intake induces production of proinflammatory mtDNA-enriched extracellular vesicles and steatohepatitis via ASK1/p38MAPKα-dependent mechanisms. JCI Insight 2020, 5, e136496. [Google Scholar] [CrossRef] [Scilit] [PubMed]
Disclaimer/Publisher’s Note: The statements, opinions and data contained in all publications are solely those of the individual author(s) and contributor(s) and not of MDPI and/or the editor(s). MDPI and/or the editor(s) disclaim responsibility for any injury to people or property resulting from any ideas, methods, instructions or products referred to in the content. |
© 2026 by the authors. Licensee MDPI, Basel, Switzerland. This article is an open access article distributed under the terms and conditions of the Creative Commons Attribution (CC BY) license.