


Abstract
Objectives: The objective of this study was to compare the effects of time-restricted eating (TRE) alone and TRE combined with resistance exercise on inflammatory responses and oxidative stress levels in adults with obesity. Methods: Sixty adults who met the diagnostic criteria for obesity were randomly assigned to a control group (n = 20), a TRE group (n = 20), or a TRE plus resistance exercise group (n = 20). The TRE group underwent a 12-week TRE intervention, with an eating window from 08:00 to 16:00. Dietary composition was not modified, and total daily energy intake was maintained at baseline levels. During the remaining hours, participants strictly abstained from consuming energy-containing foods and beverages. In addition to the same TRE protocol, the combined intervention group performed elastic-band resistance exercise three times per week for 30–45 min per session. Those in the control group were instructed to maintain their usual sedentary behavior patterns and dietary habits, including food types and quantities, and to strictly avoid regular physical exercise throughout the trial. In all three groups, inflammatory markers (TNF-α, IL-4, IL-6, IL-10, sICAM-1, CRP, and IFN-γ) and oxidative stress markers (MDA, SOD, 8-OHdG, CAT, and TAC) were assessed before the intervention and after its completion. Changes in these markers were compared across the three groups, with TNF-α and MDA designated as the primary outcome measures. After completion of the trial, three participants were excluded from each group, leaving 17 participants per group for the final data analysis. Results: Before the intervention, no significant between-group differences were observed in TNF-α, IL-4, IL-6, IL-10, sICAM-1, CRP, IFN-γ, MDA, SOD, 8-OHdG, CAT, TAC, or energy intake (all p > 0.05). Compared with their respective baseline values, the TRE group showed significant reductions in TNF-α, MDA, and 8-OHdG levels and a significant increase in TAC levels (all p < 0.05). The combined intervention group showed significant reductions in TNF-α, IL-6, sICAM-1, MDA, and 8-OHdG levels and significant increases in IL-10, IL-4, SOD, and TAC levels (all p < 0.05). After the intervention, compared with the control group, the TRE and combined intervention groups had significantly lower levels of TNF-α, IL-6, sICAM-1, MDA, and 8-OHdG (all p < 0.05), whereas the combined intervention group had significantly higher levels of IL-10, IL-4, SOD, and TAC (all p < 0.05). In addition, IL-4 and SOD levels were significantly higher in the combined intervention group than in the TRE group after the intervention (both p < 0.05). No significant within- or between-group differences were observed for CRP, IFN-γ, CAT, or energy intake (all p > 0.05). Conclusions: TRE alone and TRE combined with elastic-band resistance exercise improved inflammatory responses and oxidative stress levels in people with obesity after 12 weeks; however, the overall effects of the two interventions did not differ significantly.
1. Introduction
A recent study published in The Lancet reported that China has 402 million adults with overweight or obesity, with 41% of adults having a high body mass index (BMI), making it the country with the largest population of people with obesity in the world [1]. These findings indicate that Chinese residents are facing a serious obesity problem. A major report published in The Lancet Diabetes & Endocrinology states that obesity is an independent chronic disease characterized by excessive body fat that causes damage to organs and systems and may ultimately lead to dysfunction [2]. In this process, persistent chronic low-grade inflammation is a major pathological basis for organ damage [3]. Excessive adipose tissue not only directly promotes the release of large amounts of inflammatory markers but also further exacerbates inflammatory responses through the production of reactive oxygen species (ROS). Excessive accumulation of adipose tissue promotes excessive ROS production, activating inflammatory signaling pathways such as toll-like receptor 4, NOD-like receptor family pyrin domain-containing 3 inflammasome, nuclear factor kappa B, and c-Jun N-terminal kinase [4,5]. These signaling pathways can convert local metabolic risk signals into persistent systemic immune responses, resulting in a state of chronic inflammation [4]. In addition, ROS can regulate the expression of inflammatory genes through oxidative modification of protein kinases and transcription factors and can directly damage cell membranes, proteins, and DNA [6]. Persistent inflammation can severely damage vascular endothelial cells and accelerate the occurrence and progression of cardiovascular diseases such as hypertension, coronary heart disease, myocardial infarction, and cerebral stroke [7]. The American College of Cardiology has identified chronic inflammation as a major driver of cardiovascular diseases, alongside hypertension and high cholesterol [8]. Therefore, reducing oxidative stress and thereby inhibiting chronic inflammation in people with obesity is an important aspect of obesity treatment.
In recent years, time-restricted eating (TRE) has emerged as a promising weight-loss strategy. TRE can suppress inflammatory responses in people with obesity. Azemi et al. found that 6 weeks of time-restricted feeding (TRF) significantly reduced inflammatory marker levels in rats with diet-induced obesity [9]. Additionally, 12 weeks of TRE reduced inflammatory factor levels in people with obesity [10]. In addition, another study showed that 8 weeks of resistance exercise combined with isocaloric TRE effectively reduced interleukin-6 (IL-6) and tumor necrosis factor-alpha (TNF-α) levels in men with overweight or obesity, with greater effects than resistance exercise alone [11]. However, that study only compared the effects of TRE combined with resistance exercise and resistance exercise alone on inflammatory marker levels; it did not examine the effects of TRE combined with resistance exercise versus TRE alone. Accordingly, whether isocaloric TRE combined with resistance exercise is more effective than TRE alone remains unclear. TRE can be implemented using either an early-day or a late-day eating pattern. Previous research has indicated that early-day eating may reduce inflammatory marker levels more effectively than late-day eating [12]. Therefore, the present study recruited adults with obesity who did not engage in regular exercise and compared the effects of 12 weeks of early-day TRE with those of TRE combined with elastic-band resistance exercise on inflammatory and oxidative stress markers under an isocaloric design. Based on previous studies, we selected TNF-α, IL-6, interleukin-10 (IL-10), soluble intercellular adhesion molecule-1 (sICAM-1), C-reactive protein (CRP), interleukin-4 (IL-4), and interferon-gamma (IFN-γ) as inflammatory markers, and malondialdehyde (MDA), superoxide dismutase (SOD), catalase (CAT), total antioxidant capacity (TAC), and 8-hydroxy-2′-deoxyguanosine (8-OHdG) as oxidative stress markers [13,14,15]. TNF-α and MDA were the primary outcome measures.
2. Materials and Methods
2.1. Experimental Design
Based on previous studies [10,13], the intervention period was set at 12 weeks. Sixty eligible college students with obesity were enrolled and randomly assigned to a control, TRE, or combined intervention group, with 20 participants in each group. Changes in inflammatory markers (TNF-α, IL-4, IL-6, IL-10, sICAM-1, CRP, and IFN-γ) and oxidative stress markers (MDA, SOD, 8-OHdG, CAT, and TAC) before and after the 12-week intervention were compared to evaluate the effects of TRE alone and TRE combined with resistance exercise.
2.2. Research Participants
Participants with obesity were recruited from nonphysical-education-major students with low levels of physical activity at Hubei Minzu University through the official WeChat account of the Hubei Minzu University Center for Sports Science, campus posters, and on-site recruitment. Recruitment was conducted sequentially in three stages. First, potential participants underwent initial screening based on the following inclusion criteria: (1) nonsports-major students at Hubei Minzu University; (2) body fat percentage of ≥30% for women and ≥25% for men [16]; (3) less than 150 min of physical activity per week during the previous 3 months, which does not meet the amount of physical activity recommended for adults in the World Health Organization Guidelines on Physical Activity and Sedentary Behaviour [17]; (4) an eating window of ≥10 h/day; (5) no use of weight-control medications during the previous 3 months and no significant body weight fluctuations; (6) no history of digestive system or cardiovascular diseases; (7) no history of exercise-induced hypoglycemia; (8) no history of musculoskeletal injury or surgery and no current exercise-related injuries that could affect movement; (9) No habitual smoking; (10) availability of at least 2 h of free time in the evening on at least 4 days per week; (11) not currently enrolled in public physical education courses; (12) classified as eligible according to the AHA/ACSM Health/Fitness Facility Pre-participation Screening Questionnaire [18]; and (13) willingness to participate after being informed of the intervention procedures, outcome assessments, and use of research data, as documented by written informed consent.
Second, participants who passed the initial screening underwent routine electrocardiography, liver and kidney function tests, and screening for mental and psychological disorders at the Affiliated Hospital of Hubei Minzu University. The participants also completed body composition assessments, which were measured using a body composition analyzer based on bioelectrical impedance analysis (InBody 770, Republic of Korea), exercise tolerance testing, and evaluation of the basic exercise movements required for the intervention at the Hubei Minzu University Center for Sports Science. Finally, eligible participants were selected on the basis of the health examination, body composition assessment, and exercise capacity test results in combination with the exclusion criteria. The exclusion criteria were as follows: (1) body fat percentage not meeting the eligibility requirements; (2) current illness requiring medical treatment or medication; (3) abnormal electrocardiogram findings for any reason; (4) inability to complete the exercise movements specified in the study protocol; and (5) inability to tolerate the exercise intensity required by the intervention.
An a priori sample size calculation was performed using G*Power 3.1 based on a repeated measures analysis with a between-within interaction design. Based on previous research, the effect size was set at 0.25, α at 0.05 [19], and statistical power (1 − β) at 0.80, resulting in a minimum required sample size of 42 participants. Considering possible sample dropout, 60 college students with obesity who met the eligibility criteria were ultimately recruited, 24 were men and 36 were women. To ensure comparability of the intervention effects, stratified block randomization was used. First, a researcher who was not involved in the intervention or outcome assessments generated a random allocation sequence using a computer. Participants were then stratified by sex and, within each sex stratum, grouped into blocks of three according to baseline body fat percentage. This yielded eight male blocks and 12 female blocks, with similar baseline body fat percentages between participants within each block. Within each block, the three participants were assigned according to the pre-generated random allocation sequence, with one participant allocated to each of the control, TRE, and combined intervention groups. The allocation assignments were placed in sequentially numbered, sealed, opaque envelopes. The researcher responsible for group allocation opened the envelopes sequentially and informed the participants of their group assignments. Ultimately, 20 participants were assigned to each group, with 12 women and 8 men in each group. Outcome assessors and data analysts were blinded to group allocation. Laboratory staff responsible for dietary records and delivery of the exercise intervention were not blinded. All participants were informed of the study procedures, data collection methods, and use of blood samples and provided written informed consent before participation. The study protocol was conducted in accordance with the principles of the Declaration of Helsinki and was approved by the Ethics Committee of Hubei Minzu University for Scientific Research and Biomedical Ethics (approval number: 2025001). The study was registered with the Chinese Clinical Trial Registry (registration number: ChiCTR2500107528). The participants’ baseline characteristics and inflammatory and oxidative stress markers are presented in Table 1, Table 2 and Table 3, respectively.
Table 1.
Comparison of baseline characteristics among the study groups.
Table 2.
Comparison of baseline inflammatory marker levels among the study groups.
Table 3.
Comparison of baseline oxidative stress markers levels among the study groups.
2.3. Intervention Plan
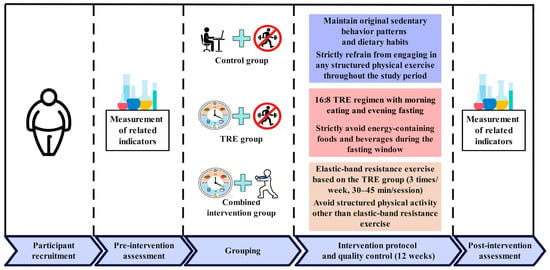
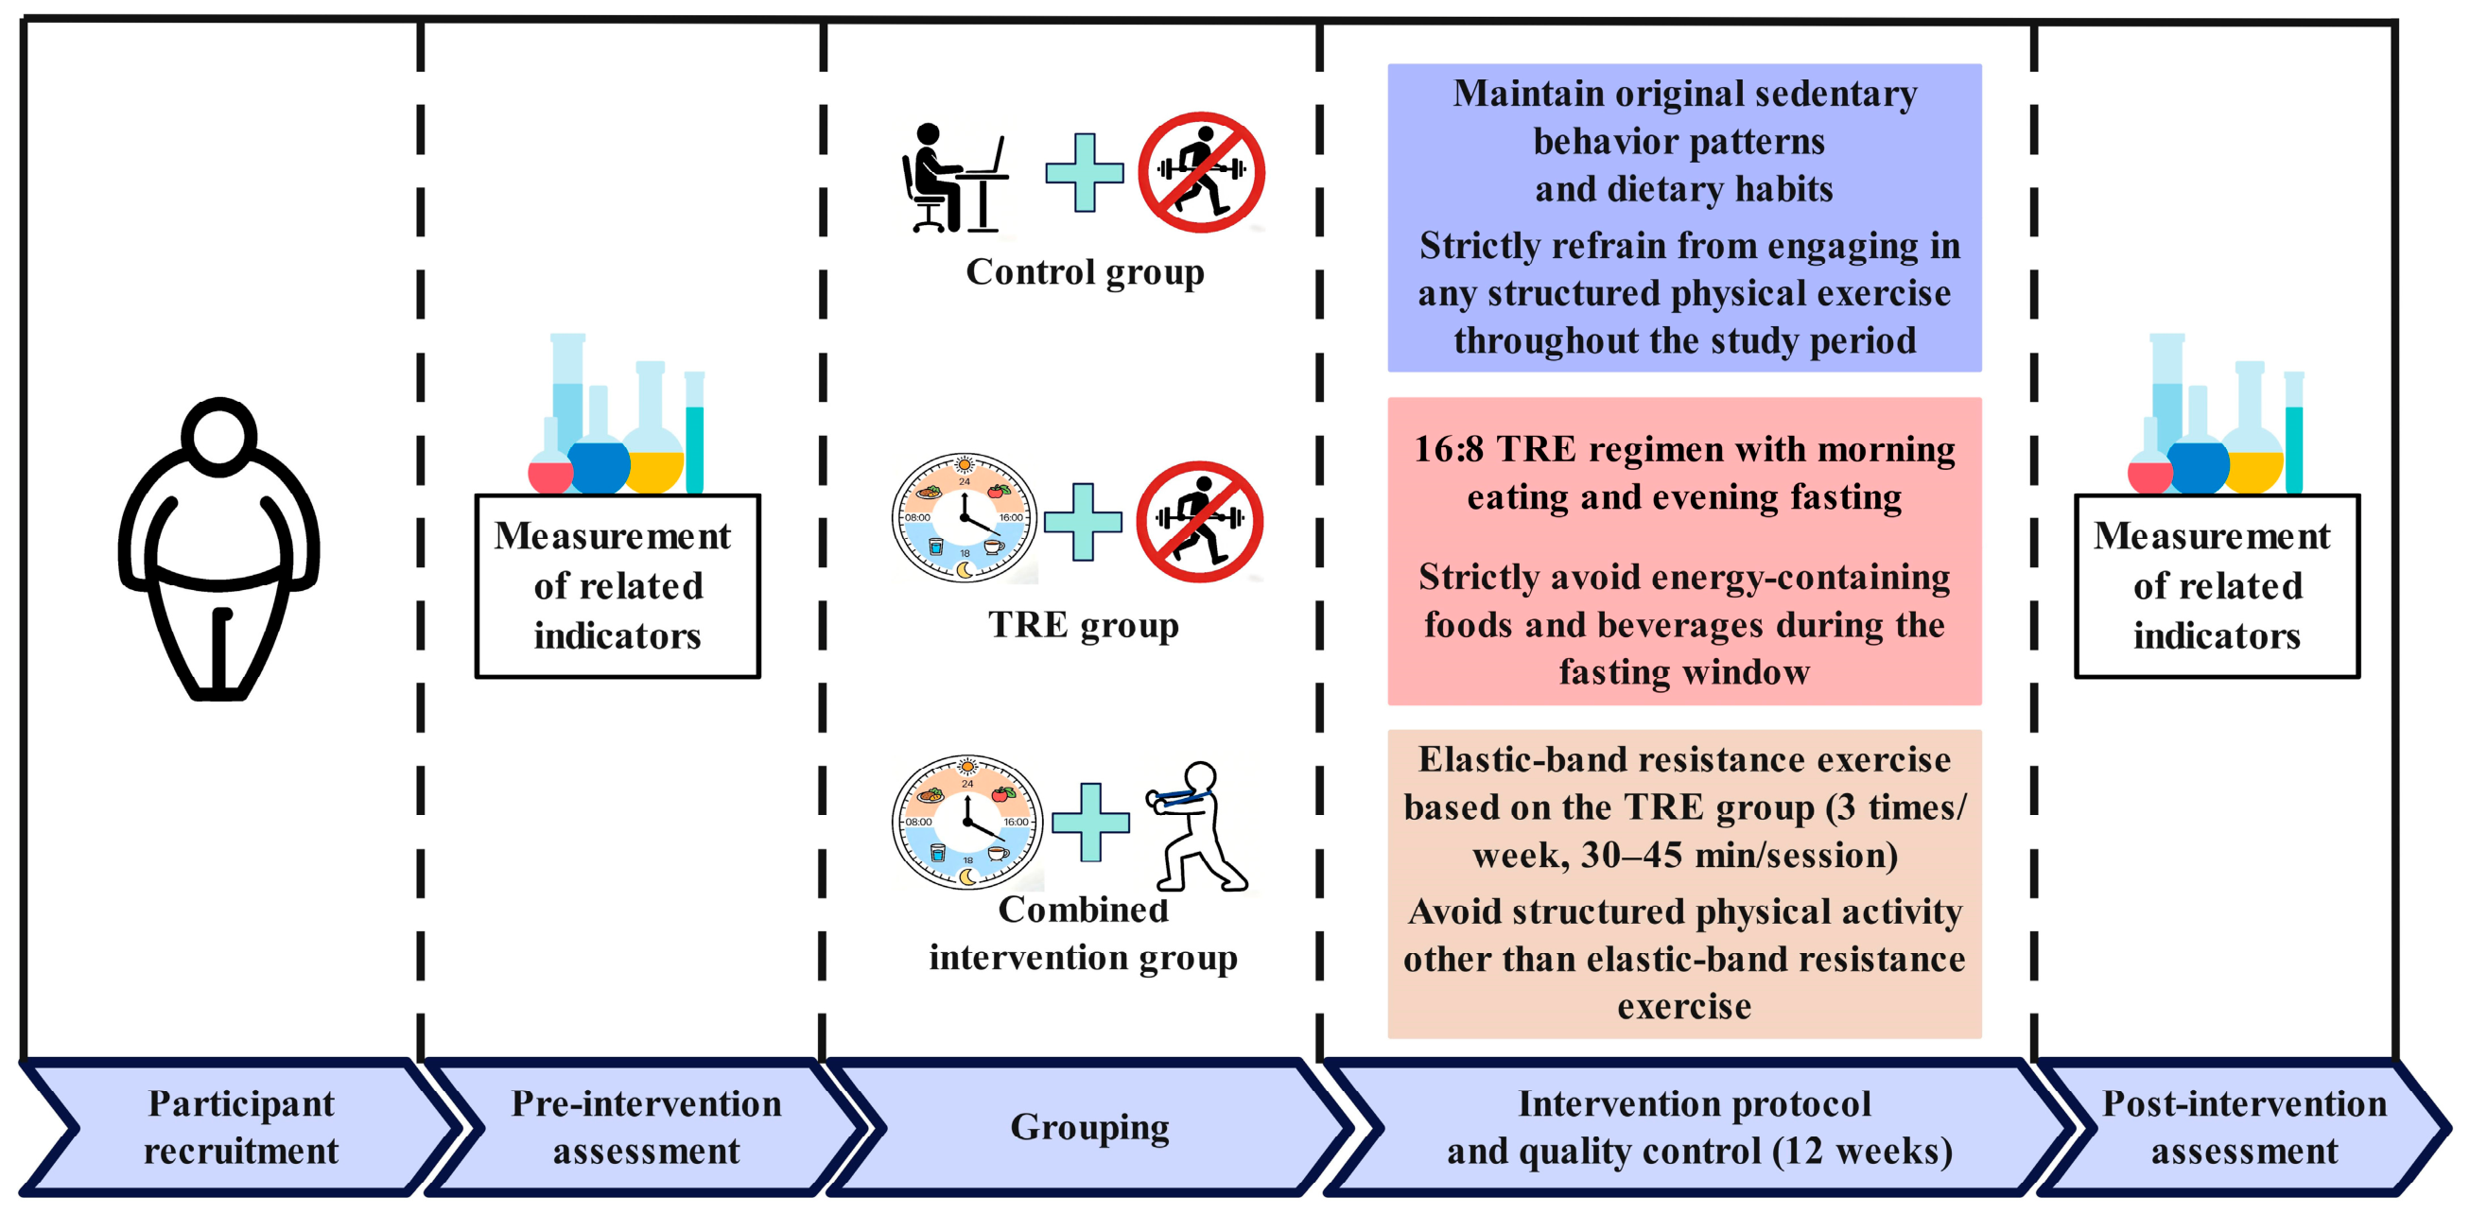
The experimental flowchart of the present study is shown in Figure 1. After completing the baseline assessment, all participants underwent a 12-week intervention and were reassessed at the end of the intervention. The control group maintained its usual lifestyle; the TRE and combined intervention groups received weekly dietary education and followed an eating schedule from 08:00 to 16:00, and fasted during the remaining hours. In addition, the combined intervention group performed elastic-band resistance training three times per week, with each session lasting 30–45 min.
Figure 1.
Experimental flowchart of the study.
2.3.1. Control Group
The participants in the control group were instructed to maintain their original sedentary behavior patterns and dietary habits (including the types and quantities of food consumed) as closely as possible and to strictly refrain from engaging in regular physical exercise throughout the trial period. To evaluate dietary intake during the intervention, participants’ habitual dietary behaviors (including food types, quantities and meal timing) were recorded for 2 weeks before the start of the study. All participants were required to use the Mint Health app to upload daily food photographs and record total energy intake and other relevant data. During the intervention period, participants were asked to maintain their habitual dietary patterns as closely as possible. To monitor physical activity, participants were required to wear an ActiGraph wGT3X-BT triaxial accelerometer, which recorded daily energy expenditure, step counts, activity intensity, and related parameters.
2.3.2. TRE Group
Participants followed a 16:8 TRE regimen based on an “eat early, fast later” schedule, with an eating window from 08:00 to 16:00 (8 h), during which food choices were self-selected [20]. Pre-intervention, the Mint Health app was used to record baseline dietary intake for 2 weeks. During the intervention period, participants were instructed to maintain their usual dietary composition within the eating window and to keep their daily energy intake consistent with baseline levels [20]. The fasting window lasted 16 h (from 16:00 to 08:00 the following day), during which participants were required to abstain from all energy-containing foods and beverages. Only noncaloric beverages (e.g., water and tea) and sugar-free chewing gum were permitted, and participants were encouraged to consume adequate amounts of water. Physical activity management was identical to that of the control group.
2.3.3. Combined Intervention Group
Participants in the combined intervention group followed the same TRE protocol as the TRE group and additionally completed a resistance exercise program. The 12-week resistance training intervention consisted of two phases: a general training phase and an intensive training phase. Progressive resistance exercises targeting major muscle groups of the upper limbs, trunk, and lower limbs were performed using elastic resistance bands. Training was conducted for 12 weeks, three times per week on nonconsecutive days, with each session lasting 30–45 min. To minimize the risk of adverse cardiovascular events [21], the training sessions were scheduled from 19:00 to 20:00 and included warm-up and cool-down activities. The elastic-band resistance training program used in this study was developed by our research team based on an exercise science outreach video produced during the 2024 National Physical Fitness Monitoring Program in Hubei Province, China.
During the first 6 weeks of the intervention (the general training phase), participants used resistance bands that provide 10–15 lb of resistance. The exercises included: (1) upper-limb exercises: resistance-band chest press, lateral raise, and biceps curl; (2) trunk exercises: resistance-band side crunch and bent-over row; and (3) lower-limb exercises: resistance-band lunge and wide-stance standing exercise. Each exercise was performed for 2–3 sets of 8–12 repetitions, with a 3 min rest interval between sets. During the final 6 weeks of the intervention (the intensive training phase), the exercises, number of sets, and repetitions were the same as those in the general training phase, but the resistance was increased to 20–25 lb.
2.3.4. Experimental Quality Control
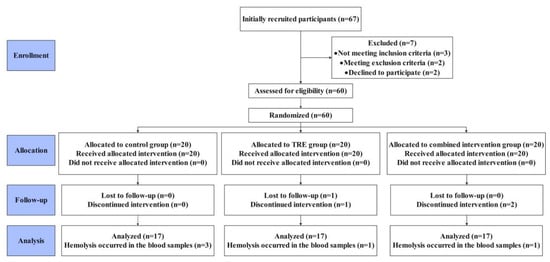
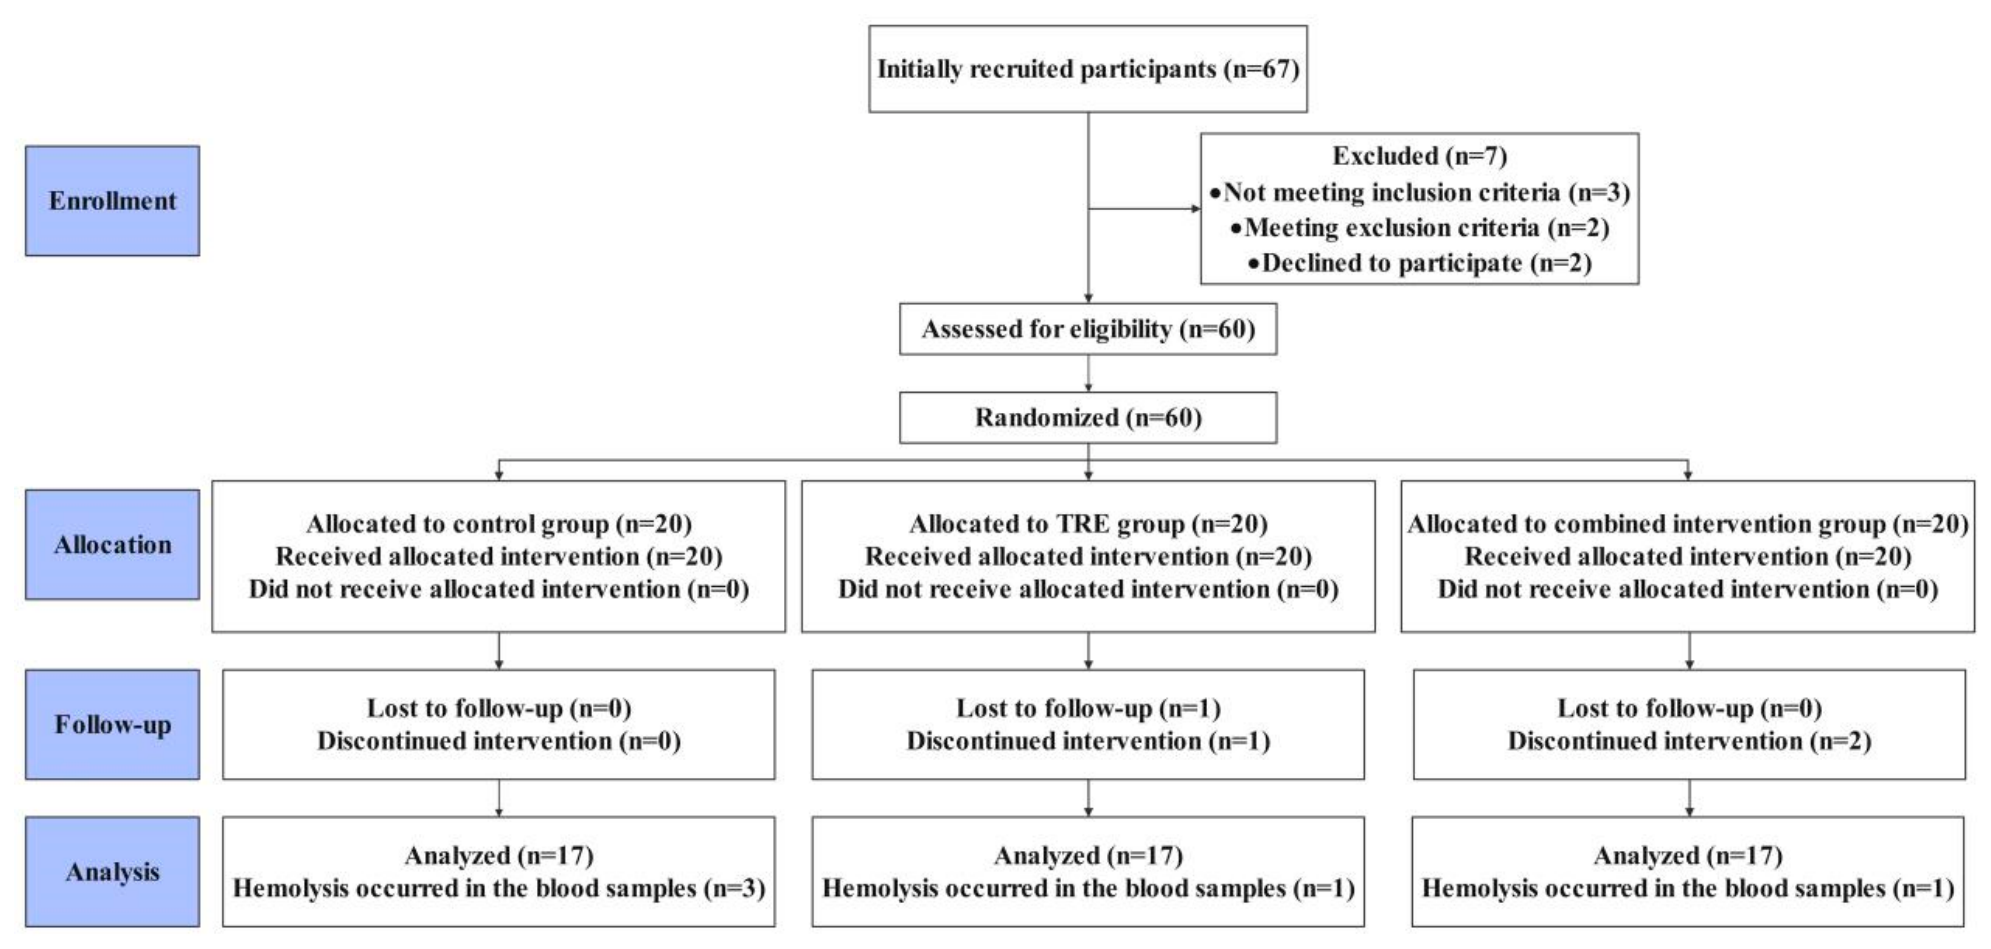
(1) During the intervention period, trained researchers conducted weekly follow-up assessments with participants through WeChat, face-to-face communication, and other means. These follow-ups were used to monitor dietary intake and physical activity, identify any adverse events that occurred during the study, and provide appropriate guidance and recommendations when necessary to ensure participant compliance and maintain study quality. (2) Exercise supervision for the combined intervention group was jointly conducted by trained researchers to ensure consistency in the implementation and quality of the exercise intervention across participants. (3) Criteria for participant withdrawal or dropout were as follows: ① The participants in the intervention group did not eat according to the requirements for 3 consecutive days or did not adhere to the designated eating window. ② Serious adverse events or illnesses occurred during the study period that prevented continuation of the fasting or exercise intervention. ③ Physical activity requirements were not met. Specifically, participants in the control group, TRE group, and combined intervention group (during periods without prescribed exercise) accumulated more than 30 min of moderate-to-vigorous physical activity on a single day or failed to wear the ActiGraph wGT3X-BT triaxial accelerometer as required for an extended period. The participants in the combined intervention group who completed less than 90% of the prescribed exercise training volume during the intervention period or missed three consecutive training sessions were withdrawn from the study. Because only a limited number of devices were available, participants were randomly selected to wear them for spot checks. To obtain a comprehensive understanding of participants’ physical activity, we collected daily physical activity logs from all participants to assess whether their activity met the study requirements. In addition, we conducted weekly follow-ups with participants through conversations and other forms of communication to obtain information on their physical activity and dietary intake. ④ Participants used weight-loss products, medications for cardiovascular diseases, nutritional supplements intended to enhance metabolism or exercise performance, or any medications that could affect exercise safety during the study period. (4) For female participants, if a scheduled training session fell within the first 3 days of menstruation, the training intensity was reduced as appropriate based on menstrual discomfort and exercise tolerance. The CONSORT flow diagram of this study is shown in Figure 2.
Figure 2.
CONSORT flow diagram for study. In the TRE group, one participant violated the fasting protocol and another refused to report food intake, resulting in the exclusion of these two participants. In the combined intervention group, one participant violated the fasting protocol and another missed three consecutive exercise sessions, and thus, also resulting in the exclusion of two participants from this group. During post-intervention assessments, serum samples from five additional participants showed hemolysis visible to the naked eye. These samples were used exclusively to measure the study biomarkers. Because hemolysis rendered the biomarker measurements unreliable, the corresponding data were excluded from the biomarker analyses (3, 1, and 1 participant in the control, TRE, and combined intervention groups, respectively). Adherence to dietary guidance was 90% in the TRE group, while dietary adherence was 95% in the combined intervention group. Exercise adherence in the combined intervention group was 95%.
2.4. Test Indicators
Venous blood samples (5 mL) were collected at the hospital at 08:00 after a 10 h fast on two occasions: the day before the intervention began (baseline) and the second day after its completion. Blood samples were centrifuged immediately after collection to separate the serum, which was then aliquoted and stored at −80 °C. Baseline serum samples were stored until post-intervention sample collection was completed, and samples from both time points were analyzed together. The serum collected at both time points was used exclusively to measure the following markers.
2.4.1. Inflammatory Response Indicators
Inflammatory markers included TNF-α, IL-4, IL-6, IL-10, sICAM-1, CRP, and IFN-γ. TNF-α was designated as the primary outcome measure, while the remaining measures were designated as secondary outcomes. All markers were measured by enzyme-linked immunosorbent assay (ELISA) using kits from Nanjing Jiancheng Bioengineering Institute (Nanjing, China), according to the manufacturer’s instructions.
The kit catalog numbers and detection ranges were as follows: TNF-α (H052-1, 2–600 ng/L), IL-4 (H005-1, 2–600 ng/L), IL-6 (H007-1, 3–900 ng/L), IL-10 (H009-1, 4–1200 ng/L), sICAM-1 (H065-2, 5–1500 ng/mL), CRP (E023-1-1, 1–75 mg/L), and IFN-γ (H025-1, 4–1000 ng/L). All assays were performed using undiluted serum, and pre- and post-intervention samples were analyzed on the same assay plate. For all kits except the CRP kit, the intra-assay and inter-assay coefficients of variation (CVs) were ≤10% and ≤12%, respectively. For the CRP kit, the intra-assay and inter-assay CVs were ≤6% and ≤10%, respectively.
2.4.2. Oxidative Stress Indicators
Oxidative stress markers included MDA, SOD, 8-OHdG, CAT, and TAC. MDA was designated as the primary outcome measure, while the remaining measures were designated as secondary outcomes. MDA was measured using the TBA method, SOD was measured using the hydroxylamine method, 8-OHdG was measured using ELISA, CAT was measured using the ammonium molybdate method, and TAC was measured using the ABTS method. All assay kits were from Nanjing Jiancheng Bioengineering Institute (Nanjing, China), and all measurements were performed according to the manufacturer’s instructions.
The kit catalog numbers and detection ranges were as follows: MDA (A003-1, 0–113.0 nmol/mL), SOD (A001-1, 5.0–122.1 U/mL), 8-OHdG (H165-1, 0.5–150 ng/mL), CAT (A007-1, 0.2–24.8 U/mL), and TAC (A015-2, 0.01–1.0 mmol/L). Undiluted serum was used for all assays except TAC, for which serum samples were diluted fourfold. Pre- and post-intervention samples were analyzed on the same assay plate. The intra-assay/inter-assay CVs for the kits were as follows: 3.5%/4.11% for MDA, 1.7%/3.52% for SOD, ≤10%/≤12% for 8-OHdG, 1.9%/4.94% for CAT, and 3.7%/4.43% for TAC.
2.5. Data Processing
Statistical analyses were performed using SPSS version 27.0 and Microsoft Excel. The Shapiro–Wilk test was used to assess data normality, and Levene’s test was used to verify homogeneity of variances. Mauchly’s test was used to assess sphericity, and when the assumption of sphericity was violated, the Greenhouse–Geisser correction was applied. One-way analysis of variance was used to compare baseline characteristics between the three groups. A 3 (group: combined intervention, TRE, and control) × 2 (time: preintervention and postintervention) repeated-measures analysis of variance was performed to examine differences in outcome variables across groups and time points. When significant group × time interactions were detected, simple-effects analyses were performed at each time point to examine between-group differences. Pairwise comparisons between groups were conducted using Fisher’s least significant difference (LSD) test. Effect sizes for interaction effects were estimated using partial eta squared (η2p), with values < 0.01 considered very small, 0.01 to <0.06 small, 0.06 to <0.14 medium, and ≥0.14 large. For within-group comparisons, 95% confidence intervals (CIs) were calculated for changes defined as post-intervention minus pre-intervention values. For between-group comparisons at both time points, CIs were calculated for the following contrasts: control group minus TRE group, control group minus combined intervention group, and TRE group minus combined intervention group. Given the exploratory nature of this study, no adjustment was made for multiple comparisons. Data are presented as mean ± standard deviation (mean ± SD), and statistical significance was set at p < 0.05.
3. Results
3.1. Changes in Inflammatory Markers in the Three Groups Pre- and Post-Intervention
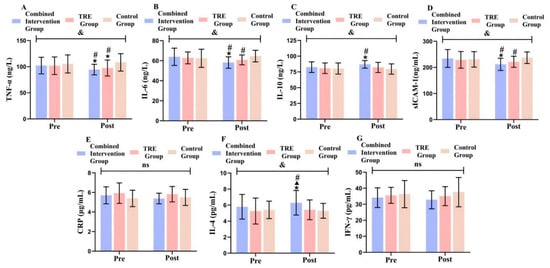
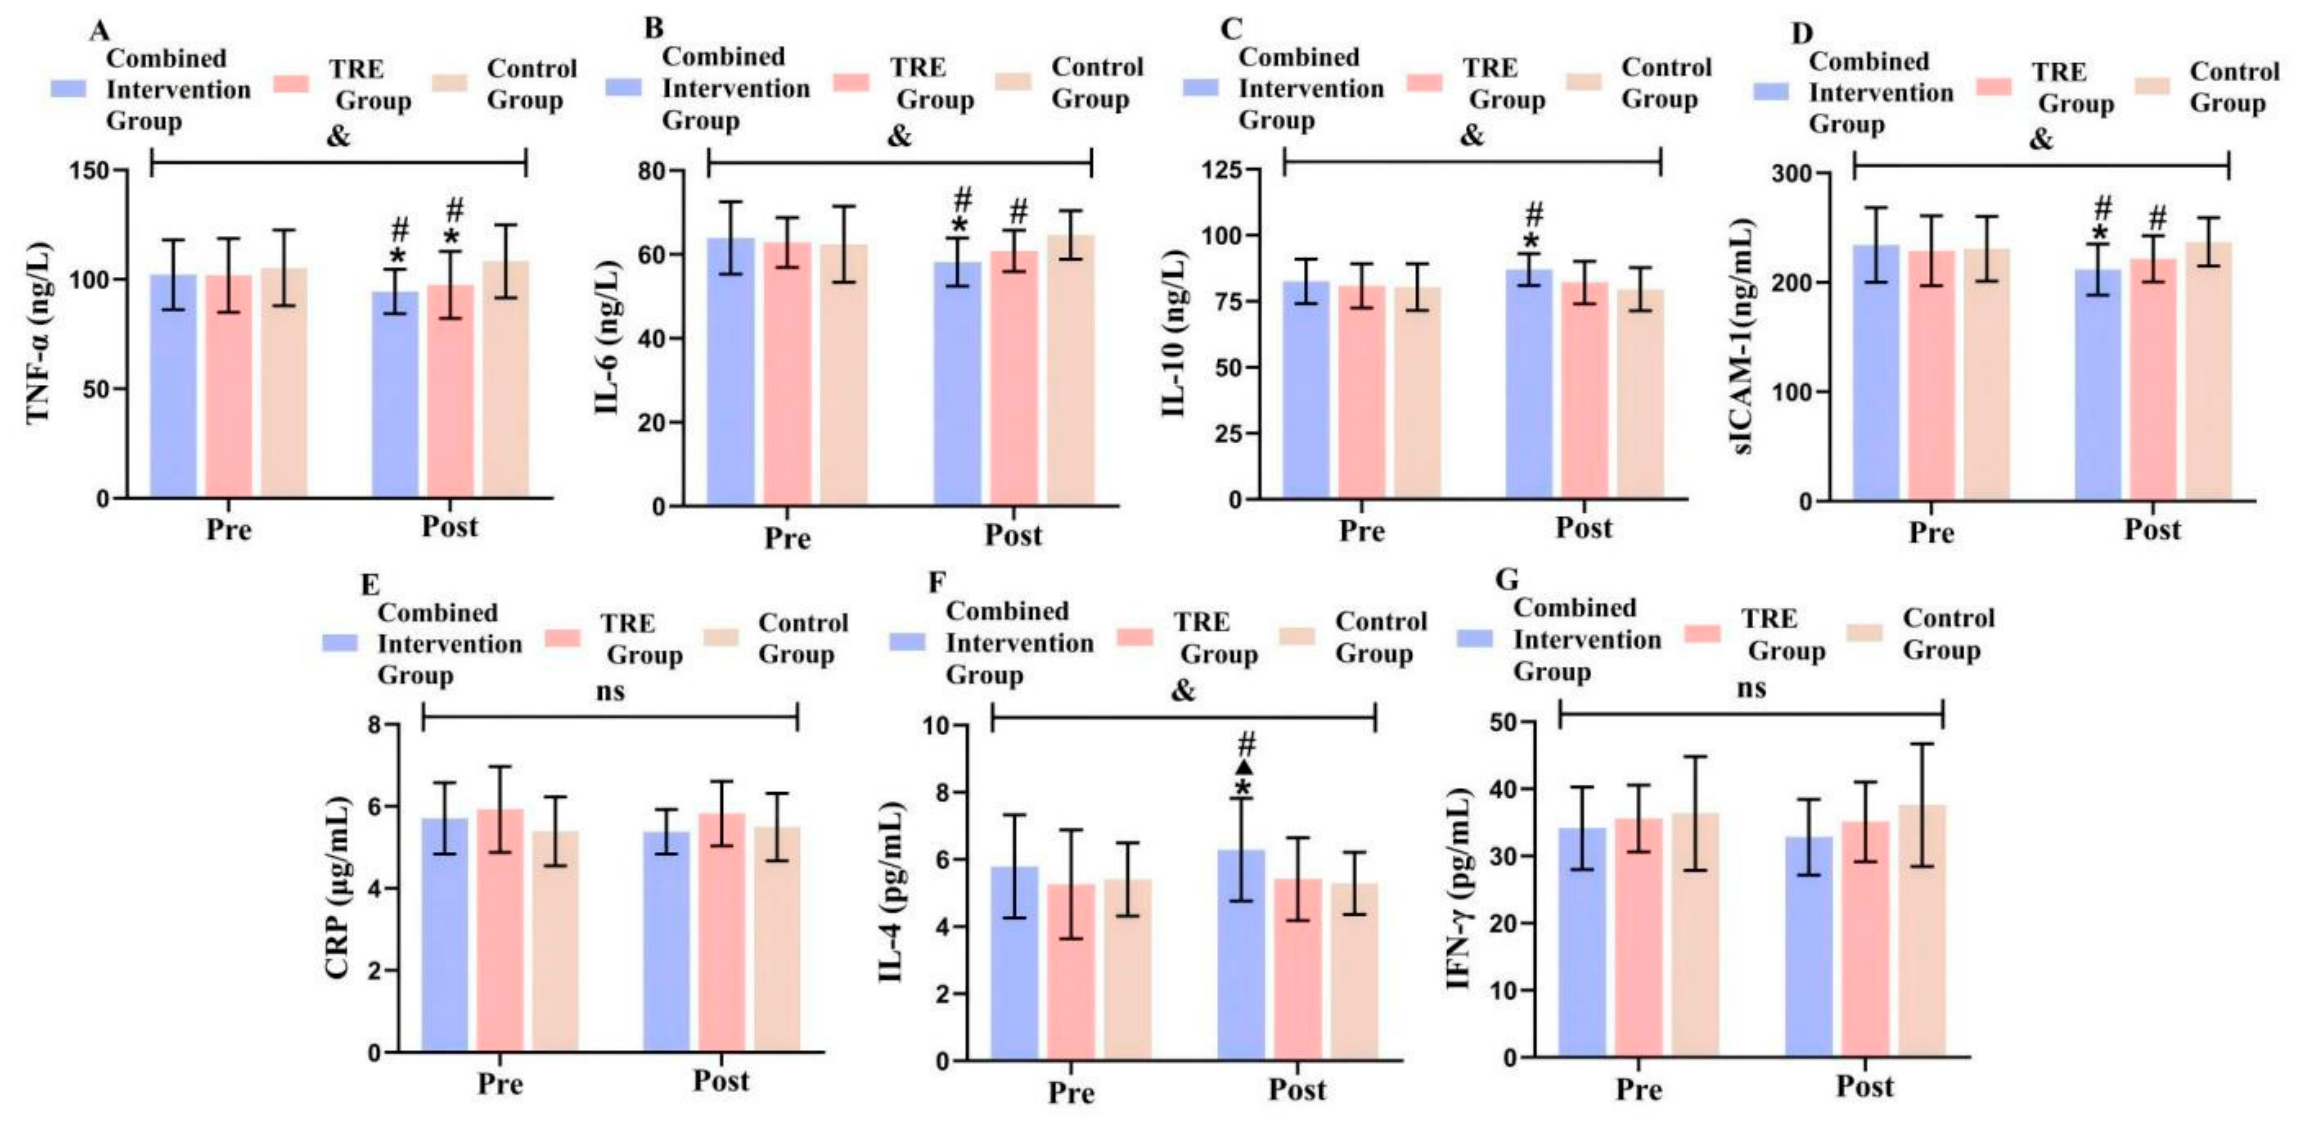
As shown in Figure 3, baseline TNF-α levels did not differ significantly between the control and TRE groups (95% CI: −8.14 to 14.95, p = 0.556), between the control and combined intervention groups (95% CI: −8.45 to 14.64, p = 0.592), or between the TRE and combined intervention groups (95% CI: −11.86 to 11.24, p = 0.957). Within-group comparisons showed that TNF-α levels decreased significantly after the intervention in the combined intervention (95% CI: −11.56 to −3.80, p < 0.001, η2p = 0.248) and TRE groups (95% CI: −8.23 to −0.47, p = 0.029, η2p = 0.096), whereas no significant change was observed in the control group (95% CI: −0.85 to 6.91, p = 0.122, η2p = 0.049). The simple effect of group was significant after the intervention (F = 4.379, p = 0.018, η2p = 0.154). Between-group comparisons showed that TNF-α levels were significantly higher in the control group than in the TRE (95% CI: 0.92 to 20.65, p = 0.033) and combined intervention groups (95% CI: 3.95 to 23.68, p = 0.007). No significant difference was observed between the TRE and combined intervention groups (95% CI: −6.84 to 12.89, p = 0.541).
Figure 3.
Comparison of inflammatory marker levels between the three groups. (A) Comparison of TNF-α levels among the three groups; (B) Comparison of IL-6 levels among the three groups; (C) Comparison of IL-10 levels among the three groups; (D) Comparison of sICAM-1 levels among the three groups; (E) Comparison of CRP levels among the three groups; (F) Comparison of IL-4 levels among the three groups; (G) Comparison of IFN-γ levels among the three groups. Note: & indicates a significant group × time interaction effect (p < 0.05); * indicates a significant within-group difference pre- and post-intervention (p < 0.05); # indicates a significant difference compared with the control group (p < 0.05); ▲ indicates a significant difference compared with the TRE group (p < 0.05); ns indicates no significant difference (p > 0.05).
Baseline IL-6 levels did not differ significantly between the control and TRE groups (95% CI: −5.92 to 5.11, p = 0.884), between the control and combined intervention groups (95% CI: −7.00 to 4.03, p = 0.592), or between the TRE and combined intervention groups (95% CI: −6.60 to 4.43, p = 0.695). Within-group comparisons showed that IL-6 levels decreased significantly after the intervention in the combined intervention group (95% CI: −8.83 to −2.71, p < 0.001, η2p = 0.230), whereas no significant changes were observed in the TRE (95% CI: −5.07 to 1.05, p = 0.193, η2p = 0.035) or control group (95% CI: −0.85 to 5.27, p = 0.154, η2p = 0.042). The simple effect of group was significant after the intervention (F = 5.977, p = 0.005, η2p = 0.199). Between-group comparisons showed that IL-6 levels were significantly higher in the control group than in the TRE (95% CI: 0.02 to 7.61, p = 0.049) and combined intervention groups (95% CI: 2.70 to 10.29, p = 0.001). No significant difference was observed between the TRE and combined intervention groups (95% CI: −1.12 to 6.48, p = 0.162).
Baseline IL-10 levels did not differ significantly between the control and TRE groups (95% CI: −6.34 to 5.47, p = 0.882), between the control and combined intervention groups (95% CI: −8.07 to 3.74, p = 0.464), or between the TRE and combined intervention groups (95% CI: −7.63 to 4.17, p = 0.558). Within-group comparisons showed that IL-10 levels increased significantly after the intervention in the combined intervention group (95% CI: 1.58 to 7.40, p = 0.003, η2p = 0.167), whereas no significant changes were observed in the TRE (95% CI: −1.60 to 4.23, p = 0.369, η2p = 0.017) or control group (95% CI: −3.72 to 2.10, p = 0.579, η2p = 0.006). The simple effect of group was significant after the intervention (F = 4.367, p = 0.018, η2p = 0.154). Between-group comparisons showed that IL-10 levels were significantly lower in the control group than in the combined intervention group (95% CI: −12.63 to −2.30, p = 0.005). No significant differences were observed between the control and TRE groups (95% CI: −7.72 to 2.60, p = 0.323) or between the TRE and combined intervention groups (95% CI: −10.06 to 0.26, p = 0.062).
Baseline sICAM-1 levels did not differ significantly between the control and TRE groups (95% CI: −20.21 to 23.96, p = 0.865), between the control and combined intervention groups (95% CI: −25.53 to 18.64, p = 0.755), or between the TRE and combined intervention groups (95% CI: −27.40 to 16.77, p = 0.631). Within-group comparisons showed that sICAM-1 levels decreased significantly after the intervention in the combined intervention group (95% CI: −35.54 to −9.22, p = 0.001, η2p = 0.196), whereas no significant changes were observed in the TRE (95% CI: −20.56 to 5.76, p = 0.264, η2p = 0.026) or control group (95% CI: −7.04 to 19.28, p = 0.354, η2p = 0.018). The simple effect of group was significant after the intervention (F = 5.485, p = 0.007, η2p = 0.186). Between-group comparisons showed that sICAM-1 levels were significantly higher in the control group than in the TRE (95% CI: 0.05 to 30.74, p = 0.049) and combined intervention groups (95% CI: 9.71 to 40.40, p = 0.002). No significant difference was observed between the TRE and combined intervention groups (95% CI: −5.68 to 25.01, p = 0.211).
Baseline CRP levels did not differ significantly between the control and TRE groups (95% CI: −1.17 to 0.11, p = 0.100), between the control and combined intervention groups (95% CI: −0.95 to 0.32, p = 0.325), or between the TRE and combined intervention groups (95% CI: −0.42 to 0.85, p = 0.498). Within-group comparisons showed no significant changes in CRP levels after the intervention in the combined intervention (95% CI: −0.69 to 0.04, p = 0.078, η2p = 0.063), TRE (95% CI: −0.46 to 0.27, p = 0.598, η2p = 0.006), or control group (95% CI: −0.26 to 0.47, p = 0.571, η2p = 0.007). The simple effect of group was not significant after the intervention (F = 1.728, p = 0.188, η2p = 0.067). Between-group comparisons showed no significant differences in CRP levels between the control and TRE groups (95% CI: −0.83 to 0.17, p = 0.191), between the control and combined intervention groups (95% CI: −0.39 to 0.62, p = 0.645), or between the TRE and combined intervention groups (95% CI: −0.06 to 0.95, p = 0.080).
Baseline IL-4 levels did not differ significantly between the control and TRE groups (95% CI: −0.85 to 1.13, p = 0.771), between the control and combined intervention groups (95% CI: −1.38 to 0.60, p = 0.434), or between the TRE and combined intervention groups (95% CI: −1.52 to 0.46, p = 0.285). Within-group comparisons showed that IL-4 levels increased significantly after the intervention in the combined intervention group (95% CI: 0.21 to 0.79, p = 0.001, η2p = 0.198), whereas no significant changes were observed in the TRE (95% CI: −0.14 to 0.45, p = 0.297, η2p = 0.023) or control group (95% CI: −0.41 to 0.18, p = 0.435, η2p = 0.013). The simple effect of group was significant after the intervention (F = 3.220, p = 0.049, η2p = 0.118). Between-group comparisons showed that IL-4 levels were significantly lower in the control (95% CI: −1.87 to −0.14, p = 0.024) and TRE groups (95% CI: −1.75 to −0.01, p = 0.047) than in the combined intervention group. No significant difference was observed between the control and TRE groups (95% CI: −0.99 to 0.74, p = 0.776).
Baseline IFN-γ levels did not differ significantly between the control and TRE groups (95% CI: −3.84 to 5.39, p = 0.737), between the control and combined intervention groups (95% CI: −2.40 to 6.84, p = 0.339), or between the TRE and combined intervention groups (95% CI: −3.18 to 6.06, p = 0.534). Within-group comparisons showed no significant changes in IFN-γ levels after the intervention in the combined intervention (95% CI: −2.88 to 0.23, p = 0.093, η2p = 0.058), TRE (95% CI: −2.04 to 1.07, p = 0.533, η2p = 0.008), or control group (95% CI: −0.32 to 2.79, p = 0.117, η2p = 0.050). The simple effect of group was not significant after the intervention (F = 1.926, p = 0.157, η2p = 0.074). Between-group comparisons showed no significant differences in IFN-γ levels between the control and TRE groups (95% CI: −2.40 to 7.39, p = 0.310), between the control and combined intervention groups (95% CI: −0.12 to 9.67, p = 0.056), or between the TRE and combined intervention groups (95% CI: −2.62 to 7.17, p = 0.354).
3.2. Changes in Oxidative Stress Markers and Energy Intake in the Three Groups Pre- and Post-Intervention
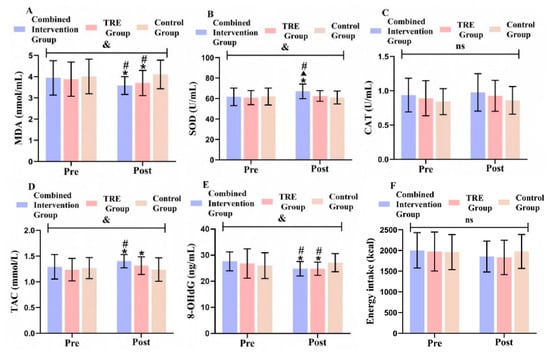
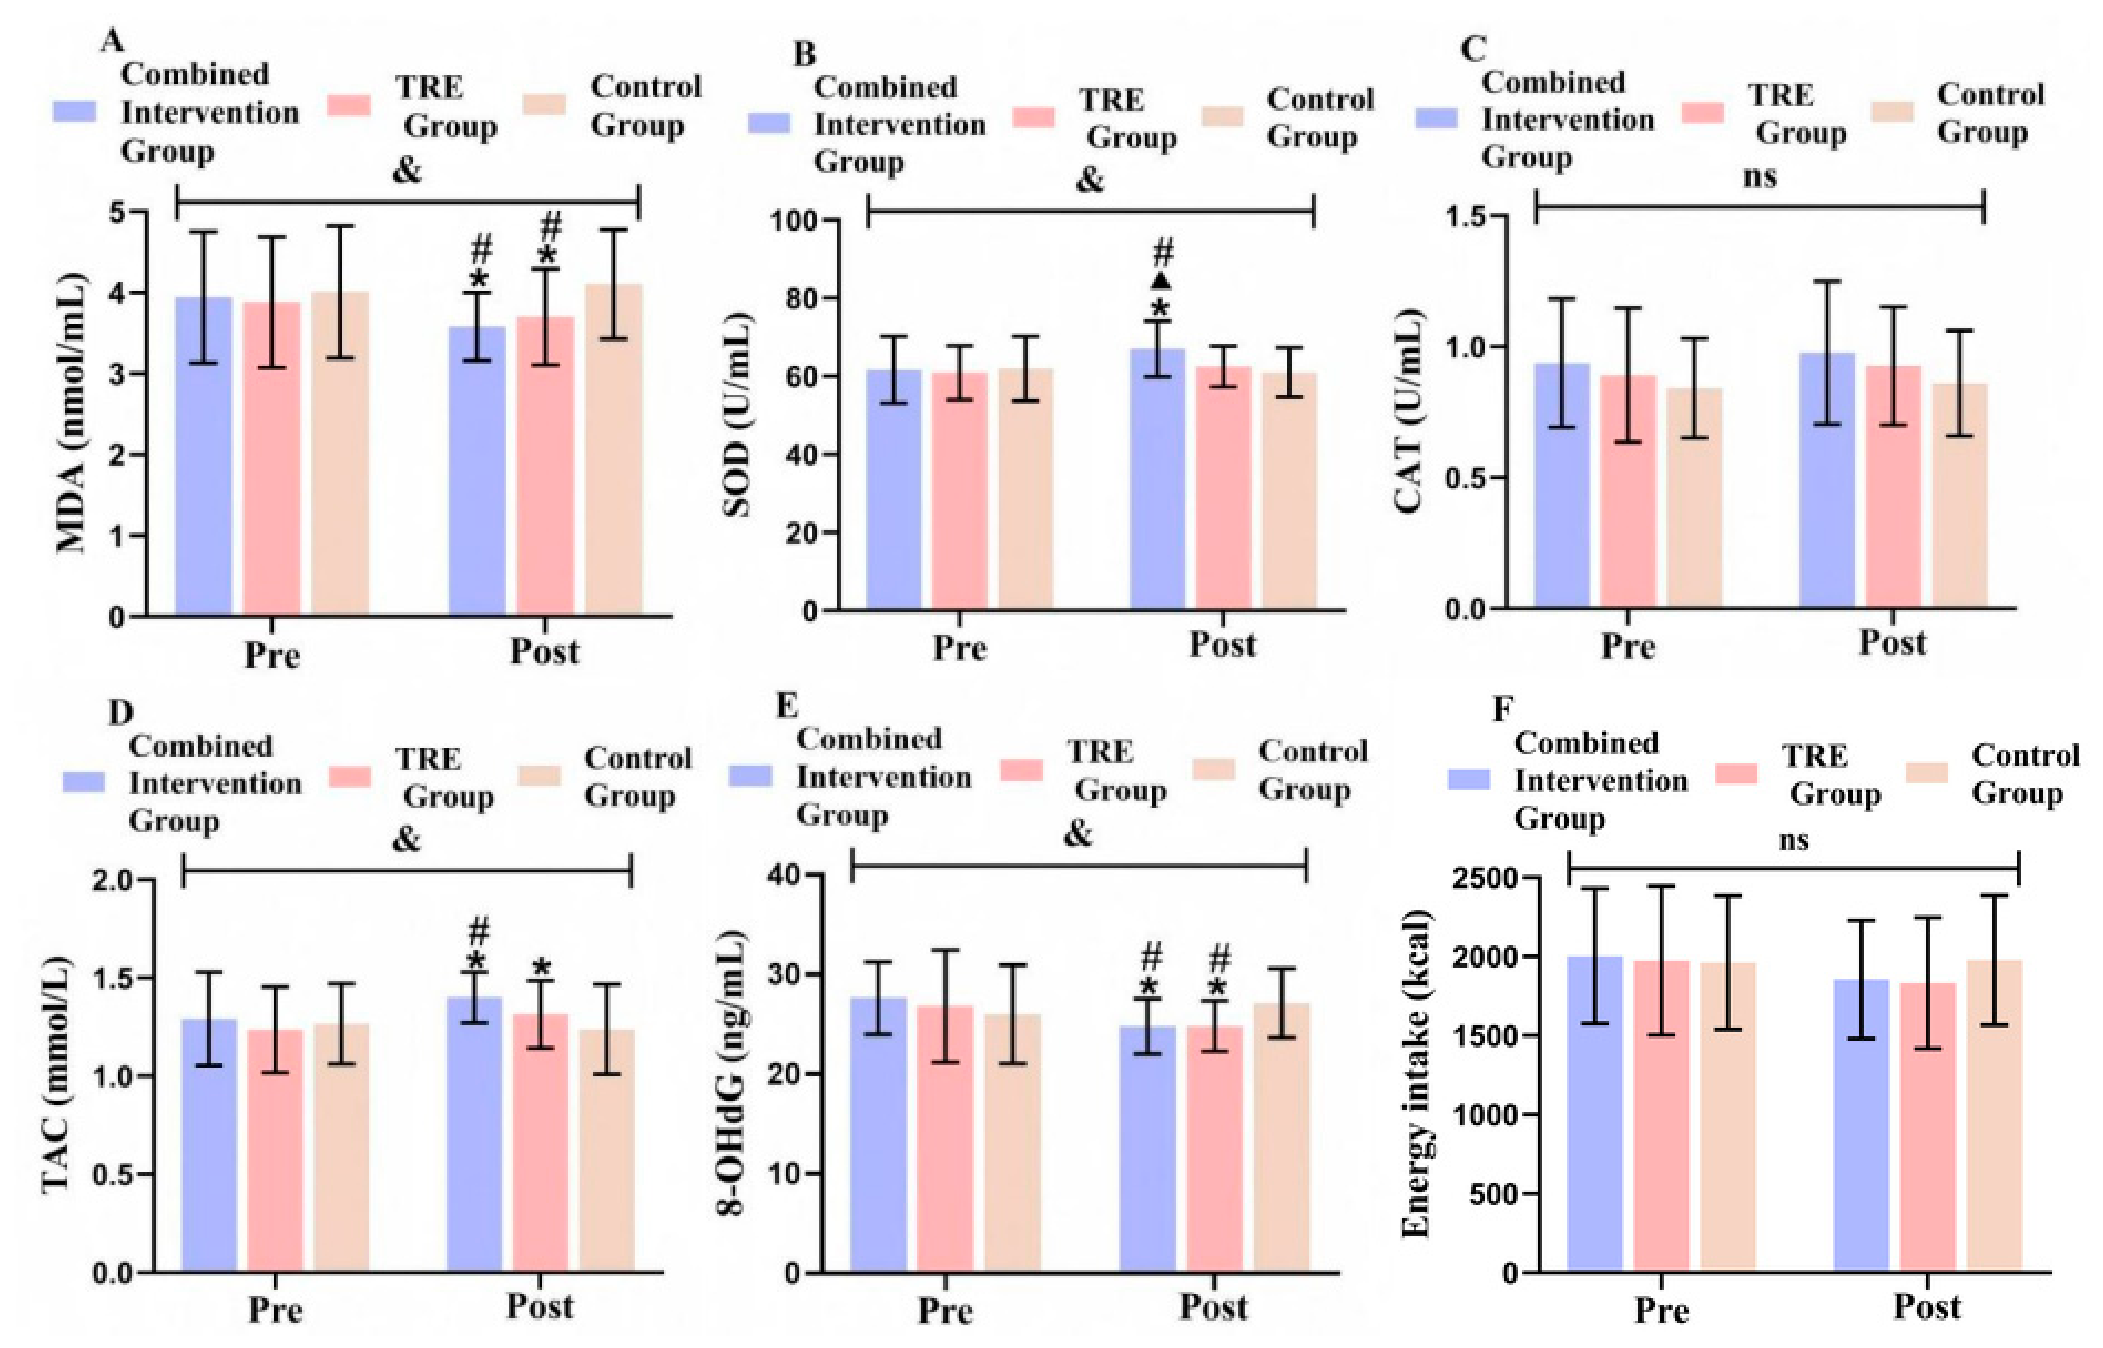
As shown in Figure 4, Baseline MDA levels did not differ significantly between the control and TRE groups (95% CI: −0.43 to 0.69, p = 0.645), between the control and combined intervention groups (95% CI: −0.49 to 0.63, p = 0.810), or between the TRE and combined intervention groups (95% CI: −0.62 to 0.50, p = 0.825). Within-group comparisons showed that MDA levels decreased significantly after the intervention in the combined intervention (95% CI: −0.53 to −0.19, p < 0.001, η2p = 0.281) and TRE groups (95% CI: −0.35 to −0.01, p = 0.035, η2p = 0.089), whereas no significant change was observed in the control group (95% CI: −0.07 to 0.26, p = 0.258, η2p = 0.027). The simple effect of group was significant after the intervention (F = 3.916, p = 0.027, η2p = 0.140). Between-group comparisons showed that MDA levels were significantly higher in the control group than in the TRE (95% CI: 0.01 to 0.80, p = 0.045) and combined intervention groups (95% CI: 0.13 to 0.92, p = 0.010). No significant difference was observed between the TRE and combined intervention groups (95% CI: −0.28 to 0.51, p = 0.548).
Figure 4.
Comparison of oxidative stress marker levels and energy intake between the three groups. (A) Comparison of MDA among the three groups; (B) Comparison of SOD among the three groups; (C) Comparison of CAT among the three groups; (D) Comparison of TAC among the three groups; (E) Comparison of 8-OHdG among the three groups; (F) Comparison of energy intake among the three groups. Note: & indicates a significant group × time interaction effect (p < 0.05); * indicates a significant within-group difference pre- and post-intervention (p < 0.05); # indicates a significant difference compared with the control group (p < 0.05); ▲ indicates a significant difference compared with the TRE group (p < 0.05); ns indicates no significant difference (p > 0.05).
Baseline SOD levels did not differ significantly between the control and TRE groups (95% CI: −4.41 to 6.52, p = 0.700), between the control and combined intervention groups (95% CI: −5.16 to 5.77, p = 0.911), or between the TRE and combined intervention groups (95% CI: −6.21 to 4.72, p = 0.785). Within-group comparisons showed that SOD levels increased significantly after the intervention in the combined intervention group (95% CI: 2.62 to 8.09, p < 0.001, η2p = 0.245), whereas no significant changes were observed in the TRE (95% CI: −1.17 to 4.30, p = 0.255, η2p = 0.027) or control group (95% CI: −3.72 to 1.74, p = 0.469, η2p = 0.011). The simple effect of group was significant after the intervention (F = 4.298, p = 0.019, η2p = 0.152). Between-group comparisons showed that SOD levels were significantly lower in the control (95% CI: −10.35 to −1.73, p = 0.007) and TRE groups (95% CI: −8.85 to −0.22, p = 0.040) than in the combined intervention group. No significant difference was observed between the control and TRE groups (95% CI: −5.82 to 2.81, p = 0.487).
Baseline CAT levels did not differ significantly between the control and TRE groups (95% CI: −0.21 to 0.11, p = 0.543), between the control and combined intervention groups (95% CI: −0.25 to 0.07, p = 0.240), or between the TRE and combined intervention groups (95% CI: −0.21 to 0.11, p = 0.567). Within-group comparisons showed no significant changes in CAT levels after the intervention in the combined intervention (95% CI: −0.01 to 0.09, p = 0.149, η2p = 0.043), TRE (95% CI: −0.02 to 0.09, p = 0.196, η2p = 0.035), or control group (95% CI: −0.04 to 0.07, p = 0.501, η2p = 0.009). The simple effect of group was not significant after the intervention (F = 1.038, p = 0.362, η2p = 0.041). Between-group comparisons showed no significant differences in CAT levels between the control and TRE groups (95% CI: −0.23 to 0.10, p = 0.418), between the control and combined intervention groups (95% CI: −0.28 to 0.05, p = 0.157), or between the TRE and combined intervention groups (95% CI: −0.21 to 0.11, p = 0.538).
Baseline TAC levels did not differ significantly between the control and TRE groups (95% CI: −0.12 to 0.18, p = 0.687), between the control and combined intervention groups (95% CI: −0.18 to 0.13, p = 0.745), or between the TRE and combined intervention groups (95% CI: −0.21 to 0.10, p = 0.468). Within-group comparisons showed that TAC levels increased significantly after the intervention in the combined intervention (95% CI: 0.05 to 0.17, p < 0.001, η2p = 0.207) and TRE groups (95% CI: 0.02 to 0.14, p = 0.014, η2p = 0.119), whereas no significant change was observed in the control group (95% CI: −0.09 to 0.03, p = 0.363, η2p = 0.017). The simple effect of group was significant after the intervention (F = 3.391, p = 0.042, η2p = 0.124). Between-group comparisons showed that TAC levels were significantly lower in the control group than in the combined intervention group (95% CI: −0.29 to −0.04, p = 0.012). No significant differences were observed between the control and TRE groups (95% CI: −0.20 to 0.05, p = 0.228) or between the TRE and combined intervention groups (95% CI: −0.21 to 0.04, p = 0.173).
Baseline 8-OHdG levels did not differ significantly between the control and TRE groups (95% CI: −4.13 to 2.51, p = 0.625), between the control and combined intervention groups (95% CI: −4.93 to 1.72, p = 0.336), or between the TRE and combined intervention groups (95% CI: −4.11 to 2.53, p = 0.634). Within-group comparisons showed that 8-OHdG levels decreased significantly after the intervention in the combined intervention (95% CI: −4.51 to −1.15, p = 0.001, η2p = 0.193) and TRE groups (95% CI: −3.69 to −0.33, p = 0.020, η2p = 0.107), whereas no significant change was observed in the control group (95% CI: −0.56 to 2.81, p = 0.185, η2p = 0.036). The simple effect of group was significant after the intervention (F = 3.535, p = 0.037, η2p = 0.128). Between-group comparisons showed that 8-OHdG levels were significantly higher in the control group than in the TRE (95% CI: 0.28 to 4.36, p = 0.027) and combined intervention groups (95% CI: 0.31 to 4.39, p = 0.025). No significant difference was observed between the TRE and combined intervention groups (95% CI: −2.01 to 2.07, p = 0.975).
The baseline energy intake did not differ significantly between the control and TRE groups (95% CI: −316.95 to 291.06, p = 0.932), between the control and combined intervention groups (95% CI: −346.94 to 261.08, p = 0.778), or between the TRE and combined intervention groups (95% CI: −334.00 to 274.02, p = 0.844). Within-group comparisons showed no significant changes in energy intake after the intervention in the combined intervention (95% CI: −317.94 to 19.59, p = 0.082, η2p = 0.062), TRE (95% CI: −309.70 to 27.84, p = 0.100, η2p = 0.055), or control group (95% CI: −152.23 to 185.30, p = 0.845, η2p = 0.001). The simple effect of group was not significant after the intervention (F = 0.646, p = 0.529, η2p = 0.026). Between-group comparisons showed no significant differences in energy intake between the control and TRE groups (95% CI: −131.26 to 420.30, p = 0.297), between the control and combined intervention groups (95% CI: −153.00 to 398.56, p = 0.375), or between the TRE and combined intervention groups (95% CI: −297.52 to 254.04, p = 0.875).
4. Discussion
Previous studies have primarily focused on changes in body composition, blood glucose, and blood lipids following interventions in patients with obesity. Changes in inflammation and oxidative stress following interventions have received insufficient attention, and research on these outcomes remains limited in depth. To address this gap, the present study focused on changes in inflammatory and oxidative stress in patients with obesity to examine the effects of TRE combined with resistance exercise and TRE alone on inflammatory and oxidative stress markers. By examining changes in primary and secondary outcome measures before and after the intervention in the three groups, we found that TRE alone and TRE combined with resistance exercise effectively reduced inflammatory responses and oxidative stress levels in patients with obesity. Although the combined intervention produced greater improvements in IL-4 and SOD than TRE alone, no significant differences in the primary outcome measures were observed between the two groups.
4.1. Effects of Different Interventions on Inflammatory Response in People with Obesity
People with obesity often experience a persistent state of chronic low-grade inflammation, and the severity of inflammation generally increases with the progression of obesity [22]. As inflammatory responses intensify, the risk of various obesity-related health problems also increases. In addition, chronic inflammation also exacerbates adipose tissue metabolic dysfunction, promotes fat accumulation, and contributes to a self-perpetuating cycle. Therefore, controlling inflammatory responses in patients with obesity is of considerable clinical importance. The present study showed that, after 12 weeks of TRE, serum TNF-α levels, the primary outcome measure, decreased significantly in college students with obesity. Among the secondary outcome measures, IL-6 and sICAM-1 showed decreasing trends, whereas IL-10 and IL-4 showed increasing trends, indicating that TRE can suppress systemic inflammatory responses and enhance anti-inflammatory capacity in people with obesity. The results are consistent with previous studies. Haskey et al. reported that a 12-week 16:8 TRE regimen increased the expression of the anti-inflammatory markers IL-1 receptor antagonist and IL-4 in people with obesity [10]. Moreover, Manoogian et al. found that 12 weeks of TRE reduced high-sensitivity CRP levels by 7.8% in people with obesity [23]. In addition, Ezzati et al. reported that even a 4-week TRE intervention using a 16:8 schedule reduced TNF-α and IL-1β levels in older adults with overweight [24]. Therefore, long-term TRE is an effective strategy for reducing inflammatory responses in people with obesity.
However, not all studies have reported similar findings. De Souza Santos et al. found that 12 weeks of TRE failed to improve serum IL-6 and IL-10 levels in people with obesity [25]. As an anti-inflammatory factor, IL-10 can reduce inflammation by inhibiting inhibitor of kappa B kinase activity and thereby suppressing the production of pro-inflammatory factors such as TNF-α and IL-6. Consequently, the absence of changes in IL-10 levels may limit the ability of TRE to reduce TNF-α and IL-6 production. Similarly, Lin et al. reported that a 12-month TRE intervention did not significantly affect TNF-α, IL-6, or CRP levels in people with obesity [26]. Under conditions of obesity, pathological adipocyte hypertrophy contributes to local microcirculatory dysfunction and the development of a hypoxic microenvironment. Hypoxia not only induces the expression of hypoxia-inducible factor 1-alpha but also promotes macrophage polarization within adipose tissue from the anti-inflammatory M2 phenotype to the proinflammatory M1 phenotype. These M1 macrophages secrete large amounts of TNF-α and IL-6 through paracrine and endocrine mechanisms, thereby exacerbating obesity-associated inflammation [27]. Therefore, when designing TRE protocols, the intervention period should be extended where feasible to achieve greater reductions in inflammation and stronger anti-inflammatory effects.
Preventing participant dropout is a key challenge during TRE interventions. If the fasting regimen substantially reduces daily energy intake, participants may experience pronounced hunger, prompting them to eat outside the prescribed protocol. Therefore, participant adherence and dropout are primary considerations in TRE interventions. In this study, energy intake was not strictly restricted during the eating window, allowing participants to maintain their basic daily energy intake. Under these conditions, only two participants dropped out of or withdrew from the TRE group, indicating high adherence to the fasting regimen used in this study. However, the effects of TRE on study outcomes are related not only to changes in energy intake from baseline to the end of the intervention but also to changes in dietary nutrient intake. Because dietary nutrient intake was not precisely measured during the intervention, we could not determine how changes in nutrient intake from before to after the intervention influenced the study outcomes.
The present study further showed that the combined intervention was also effective in reducing inflammatory responses in patients with obesity. However, the combined intervention produced greater improvements than TRE alone only regarding IL-4 levels. For TNF-α, the primary outcome measure, the combined intervention did not show a greater effect than TRE alone, which is inconsistent with the findings of previous studies. Damasceno de Lima et al. reported that compared with TRF alone or resistance exercise alone, resistance exercise combined with TRF for 8 weeks produced greater improvements in markers such as TNF-α and IL-6 in mice fed a high-fat diet [28]. Domingos et al. reported similar findings, showing that 10 weeks of resistance exercise combined with TRF reduced TNF-α and IL-6 levels in mice with obesity, with greater benefits than either TRF or resistance exercise alone [29]. These studies confirmed that TRE combined with resistance exercise has greater anti-inflammatory effects than either TRE or resistance exercise alone. The discrepancies between our findings and those of the studies cited above may be related to factors such as the TRE regimen and changes in energy intake from baseline to post-intervention. In addition, those studies were conducted in animal models, whereas the present study involved human participants. In addition, constraints related to participant numbers and research funding prevented the inclusion of a separate exercise-only group in the present study. Consequently, the specific contribution of resistance exercise to the effects observed in the combined intervention group remains unclear. This represents a limitation of our study design that we will address in future research.
4.2. Effects of Different Interventions on Oxidative Stress in People with Obesity
In people with obesity, oxidative stress and inflammation exhibit a bidirectional relationship. Oxidative stress can trigger chronic low-grade inflammation through the activation of multiple signaling pathways. In turn, chronic inflammation activates infiltrating macrophages and other immune cells, leading to the release of large amounts of proinflammatory factors [30]. These factors further stimulate intracellular oxidase systems and contribute to insulin resistance and dysregulated glucose and lipid metabolism, resulting in mitochondrial dysfunction, excessive ROS production, and further amplification of inflammatory responses. In addition, persistent oxidative stress can directly impair adipocyte function through mechanisms including lipid peroxidation, protein carbonylation, and oxidative damage [31], thereby establishing a vicious cycle of oxidative stress, metabolic dysregulation, and adipose tissue dysfunction that further aggravates obesity and its associated complications. Obesity-associated defects in hepatic coenzyme Q synthesis drive excessive ROS generation through reverse electron transport at mitochondrial complex I, thereby disrupting systemic metabolic homeostasis [32]. Therefore, reducing oxidative stress in people with obesity may not only alleviate inflammatory responses but also improve metabolic function. At the same time, a higher oxidative balance score can reduce the risk of cardiovascular and all-cause mortality among individuals with overweight or obesity [33].
The present study showed that, after 12 weeks of TRE, serum MDA levels, the primary outcome measure, decreased significantly in college students with obesity. Among the secondary outcome measures, 8-OHdG levels decreased significantly, TAC levels increased significantly, and SOD levels showed an increasing trend. These findings suggest that TRE can effectively improve oxidative stress status, which is consistent with previous studies. Madkour et al. found that 23–30 days of TRE increased SOD2 levels in people with overweight or obesity [34]. SOD2 is the mitochondrial subtype of SOD and plays a critical role in maintaining redox homeostasis by scavenging superoxide radicals within the mitochondrial matrix. Moreover, Tavakoli et al. found that 8 weeks of TRE increased CAT levels and reduced MDA levels in postmenopausal women with obesity and rheumatoid arthritis [35]. Related animal studies have reported similar findings, reported that 6 weeks of TRF increased serum SOD activity and reduced the MDA levels in rats with obesity [9]. As a key antioxidant enzyme, SOD reduces the degree of oxidative stress damage by catalyzing the conversion of superoxide radicals into hydrogen peroxide and oxygen, while MDA is a stable end product of lipid peroxidation and is widely used as a marker of oxidative damage. The simultaneous increase in SOD activity and reduction in MDA levels suggests that TRF may alleviate oxidative damage by enhancing antioxidant defense mechanisms. Overall, the results of this study suggest that TRE interventions lasting approximately 3–12 weeks can improve oxidative stress status in people with obesity. However, Peters et al. reported that 2 weeks of TRE did not significantly reduce MDA levels in women with overweight or obesity [36]. This discrepancy may be attributable to the relatively short intervention period, which may have been insufficient to effectively suppress ROS production. Consequently, lipid peroxidation may not have been adequately alleviated, preventing a significant reduction in MDA levels.
The mechanisms through which TRE may reduce oxidative stress in people with obesity are likely multifactorial. First, TRE may suppress excessive ROS production at its metabolic source by improving insulin sensitivity and stabilizing blood glucose levels, thereby reducing the accumulation of advanced glycation end products [37]. Second, TRE may activate the Nrf2/ARE signaling pathway, upregulate the expression of endogenous antioxidant enzymes such as SOD, and enhance overall antioxidant capacity, thereby improving the body’s ability to eliminate free radicals [35]. In addition, TRE may promote mitophagy through activation of the AMPK-signaling pathway, facilitating the removal of dysfunctional mitochondria, reducing ROS overproduction caused by electron leakage, and alleviating oxidative damage at the subcellular level [38]. These mechanisms may contribute to the beneficial effects of TRE on obesity-associated oxidative stress. However, because the present study did not evaluate these signaling pathways, the underlying biological mechanisms remain speculative and require further experimental verification.
The present study further demonstrated that the combined intervention significantly decreased serum MDA and 8-OHdG levels while significantly increasing SOD and TAC levels in people with obesity. These findings indicate that TRE combined with resistance exercise is an effective approach for reducing oxidative stress in people with obesity. However, the combined intervention produced greater improvements than TRE alone only regarding SOD levels. For MDA, the primary outcome measure, the combined intervention did not show a greater effect than TRE alone. Therefore, this study could not establish that the combined intervention was more effective than TRE alone in reducing oxidative stress in people with obesity. Because no group receiving resistance exercise alone was included, we were also unable to determine the specific contribution of resistance exercise to the effects observed in the combined intervention group.
4.3. Limitations
This study has limitations in its design: (1) Owing to various constraints, we were unable to include a resistance exercise-only group. We acknowledge that including such a group would have made the study design more standardized and scientifically rigorous. Consequently, this study could not determine the specific contribution of resistance exercise to the effects observed in the combined intervention group. This issue will be explored in future research. (2) Although the total energy intake was recorded, changes in dietary nutrient intake were not further assessed during the intervention. Therefore, the potential influence of changes in dietary composition on inflammatory and oxidative stress markers cannot be ruled out. Consequently, we could not determine whether the effects of TRE on participants were primarily attributable to reduced energy intake or changes in nutrient intake. (3) Post-intervention body weight, body fat percentage, skeletal muscle mass, and other related measures were not reported for the three groups, which limited the interpretation of body composition outcomes to some extent. (4) Because only a limited number of ActiGraph wGT3X-BT triaxial accelerometers were available, participants were randomly selected to wear the devices for spot checks. Consequently, precise ActiGraph data could not be provided. To address this issue, we collected daily physical activity logs and conducted regular follow-ups to obtain information on participants’ physical activity. However, we acknowledge that these measures did not fully resolve this limitation, which affected the rigor of this study to some extent, and we will seek to address it in future studies. Nevertheless, we believe that the study results remain meaningful and valuable. This study provided two intervention approaches for people with obesity, both of which showed beneficial effects.
5. Conclusions
TRE alone and TRE combined with elastic-band resistance exercise improved inflammatory responses and oxidative stress levels in people with obesity after 12 weeks; however, the overall effects of the two interventions did not differ significantly.
Supplementary Materials
The following supporting information can be downloaded at: https://www.mdpi.com/article/10.3390/metabo16110883/s1, Table S1: Baseline characteristics among the study groups (mean ± SD); Table S2: Inflammatory marker levels before and after the intervention (mean ± SD); Table S3: Oxidative stress marker levels and energy intake before and after the intervention (mean ± SD).
Author Contributions
Conceptualization, Q.L.; methodology, Q.L. and Y.T.; software, Q.L. and M.L.; validation, Q.L.; formal analysis, Q.L. and Y.L. (Ya Luo); investigation, Q.L.; resources, H.Z.; data curation, Q.L. and H.Z.; writing—original draft preparation, Q.L. and H.Z.; writing—review and editing, Q.L. and H.Z.; visualization, Q.L., Y.L. (Yifan Liu) and H.Z.; supervision, H.Z.; project administration, Q.L., J.H. and H.Z.; funding acquisition, J.H. and H.Z. All authors have read and agreed to the published version of the manuscript.
Funding
This research was supported by the 2025 Hubei Provincial Natural Science Foundation Joint Fund for Sports Innovation and Development (funding institution: Department of Science and Technology of Hubei Province; grant number: 2025AFD659) and the 2026 Graduate Research Innovation Project of Hubei Minzu University (funding institution: Hubei Minzu University; grant number: MYK2026005).
Institutional Review Board Statement
The study was conducted in accordance with the Declaration of Helsinki and approved by the Hubei Minzu University for Scientific Research and Biomedical Ethics (protocol code 2025001 and date of 21 February 2025).
Informed Consent Statement
Informed consent was obtained from all subjects involved in the study.
Data Availability Statement
The raw data supporting the conclusions of this study are included in the article or Supplementary Materials. For further inquiries, please contact the corresponding author.
Acknowledgments
We would like to thank the Center for Sports Science Research at Hubei Minzu University for its support in providing the necessary experimental conditions.
Conflicts of Interest
The authors declare no conflicts of interest.
References
- GBD 2021 Adult BMI Collaborators. Global, regional, and national prevalence of adult overweight and obesity, 1990–2021, with forecasts to 2050: A forecasting study for the global burden of disease study 2021. Lancet 2025, 405, 813–838, Erratum in Lancet 2025, 406, 810. [Google Scholar] [CrossRef] [Scilit]
- Rubino, F.; Cummings, D.E.; Eckel, R.H.; Cohen, R.V.; Wilding, J.P.H.; Brown, W.A.; Stanford, F.C.; Batterham, R.L.; Farooqi, I.S.; Farpour-Lambert, N.J.; et al. Definition and diagnostic criteria of clinical obesity. Lancet Diabetes Endocrinol. 2025, 13, 221–262, Erratum in Lancet Diabetes Endocrinol. 2025, 13, e6. [Google Scholar] [CrossRef] [Scilit]
- Liu, D.; Zhou, C.; Wang, X.; Luo, Z.; Xu, R.; Huo, S.; Guo, L.; Luo, X.; Yang, S.; Click, A.; et al. Nucleotide metabolic rewiring enables NLRP3 inflammasome hyperactivation in obesity. Science 2026, 391, eadq9006. [Google Scholar] [CrossRef] [Scilit]
- Liang, W.; Qi, Y.; Yi, H.; Mao, C.; Meng, Q.; Wang, H.; Zheng, C. The roles of adipose tissue macrophages in human disease. Front. Immunol. 2022, 13, 908749–908759. [Google Scholar] [CrossRef] [Scilit]
- Zhou, B.; Chen, X.; Ding, R.; Bi, Z.; Zhao, T.; Zhou, R.; Xu, M.; Li, J.; Jiang, X.; Li, H. Biosilica nanoparticulate scavengers for the therapy of hepatic ischemia–reperfusion injury in preclinical models. Nat. Commun. 2025, 16, 7650–7669. [Google Scholar] [CrossRef] [Scilit]
- Leyane, T.S.; Jere, S.W.; Houreld, N.N. Oxidative stress in ageing and chronic degenerative pathologies: Molecular mechanisms involved in counteracting oxidative stress and chronic inflammation. Int. J. Mol. Sci. 2022, 23, 7273–7300. [Google Scholar] [CrossRef] [Scilit]
- Liu, M.; Chen, R.; Zheng, Z.W.; Xu, S.L.; Hou, C.Y.; Ding, Y.; Zhang, M.; Bao, M.; He, B.; Li, S. Mechanisms of inflammatory microenvironment formation in cardiometabolic diseases: Molecular and cellular perspectives. Front. Cardiovasc. Med. 2025, 11, 1529903–1529912. [Google Scholar] [CrossRef] [Scilit]
- Mensah, G.A.; Arnold, N.; Prabhu, S.D.; Ridker, P.M.; Welty, F.K. Inflammation and cardiovascular disease: 2025 ACC scientific statement. J. Am. Coll. Cardiol. 2026, 87, 1381–1404. [Google Scholar] [CrossRef] [Scilit]
- Azemi, A.K.; Mokhtar, S.S.; Zin, A.A.M.; Leung, S.W.S.; Rasool, A.H.G. The effects of time-restricted feeding on early vascular, liver, and renal structural changes, oxidative stress, and inflammation in obese rats. Sci. Rep. 2025, 15, 36115–36129. [Google Scholar] [CrossRef] [Scilit]
- Haskey, N.; Ye, J.; Lewis, A.; Yousuf, M.; Reimer, R.A.; Raman, M. Time-restricted feeding reduces body mass index, visceral adiposity, systemic inflammation, and clinical disease activity in adults with Crohn’s disease: A randomized controlled study. Gastroenterology 2026, 170, 1051–1054. [Google Scholar] [CrossRef] [Scilit]
- Moro, T.; Tinsley, G.; Bianco, A.; Marcolin, G.; Pacelli, Q.; Battaglia, G.; Palma, A.; Gentil, P.; Neri, M.; Paoli, A. Effects of eight weeks of time-restricted feeding (16/8) on basal metabolism, maximal strength, body composition, inflammation, and cardiovascular risk factors in resistance-trained males. J. Transl. Med. 2016, 14, 290–299. [Google Scholar] [CrossRef] [Scilit]
- Xie, Z.; Sun, Y.; Ye, Y.; Hu, D.; Zhang, H.; He, Z.; Zhao, H.; Yang, H.; Mao, Y. Randomized controlled trial for time-restricted eating in healthy volunteers without obesity. Nat. Commun. 2022, 13, 1003–1012. [Google Scholar] [CrossRef] [Scilit]
- Bagheri, N.; Bagheri, R.; Mesinovic, J.; Ghobadi, H.; Scott, D.; Kargarfard, M.; Dutheil, F. Effects of resistance training on muscular adaptations and inflammatory markers in overweight and obese men. Med. Sci. Sports Exerc. 2025, 57, 600–612. [Google Scholar] [CrossRef] [Scilit]
- Idiz, C.; Idiz, U. Illuminating insights: Exploring the effect of 16/8 intermittent fasting on serum cytokine levels in overweight adults. Adv. Clin. Exp. Med. 2024, 33, 909–914. [Google Scholar] [CrossRef] [Scilit]
- Dantas, F.; Brasileiro-Santos, M.; Batista, R.; do Nascimento, L.; Castellano, L.; Ritti-Dias, R.; Lima, K.; Santos, A. Effect of strength training on oxidative stress and the correlation of the same with forearm vasodilatation and blood pressure of hypertensive elderly women: A randomized clinical trial. PLoS ONE 2016, 11, e0161178. [Google Scholar] [CrossRef] [Scilit]
- Shi, L.; Li, D.; Li, Y. Obesity: Current developments in mechanisms, diagnosis, classification and the evolution of personalized management. Med. Rev. 2026, 6, 1–13. [Google Scholar] [CrossRef] [Scilit]
- Bull, F.C.; Al-Ansari, S.S.; Biddle, S.; Borodulin, K.; Buman, M.P.; Cardon, G.; Carty, C.; Chaput, J.P.; Chastin, S.; Chou, R.; et al. World Health Organization 2020 guidelines on physical activity and sedentary behaviour. Br. J. Sports Med. 2020, 54, 1451–1462. [Google Scholar] [CrossRef] [Scilit]
- Thompson, P.D.; Baggish, A.L.; Franklin, B.; Jaworski, C.; Riebe, D. American College of Sports Medicine expert consensus statement to update recommendations for screening, staffing, and emergency policies to prevent cardiovascular events at health fitness facilities. Curr. Sports Med. Rep. 2020, 19, 223–231. [Google Scholar] [CrossRef] [Scilit]
- Cooke, M.; Deasy, W.; Ritenis, E.; Wilson, R.; Stathis, C. Effects of Intermittent Energy Restriction Alone and in Combination with Sprint Interval Training on Body Composition and Cardiometabolic Biomarkers in Individuals with Overweight and Obesity. Int. J. Environ. Res. Public Health 2022, 19, 7969–7984. [Google Scholar] [CrossRef] [Scilit]
- Peters, B.; Koppold-Liebscher, D.A.; Schuppelius, B.; Steckhan, N.; Pfeiffer, A.F.H.; Kramer, A.; Michalsen, A.; Pivovarova-Ramich, O. Effects of early vs. late time-restricted eating on cardiometabolic health, inflammation, and sleep in overweight and obese women: A study protocol for the ChronoFast trial. Front. Nutr. 2021, 8, 765543. [Google Scholar] [CrossRef] [Scilit]
- Sabag, A.; Ahmadi, M.N.; Francois, M.E.; Postnova, S.; Cistulli, P.A.; Fontana, L.; Stamatakis, E. Timing of moderate to vigorous physical activity, mortality, cardiovascular disease, and microvascular disease in adults with obesity. Diabetes Care 2024, 47, 890–897. [Google Scholar] [CrossRef] [Scilit]
- Balderas-Peña, L.M.A.; Sat-Muñoz, D.; Mireles-Ramírez, M.A.; Martínez-Herrera, B.E.; Nava-Zavala, A.H.; Cervantes-González, L.M.; Muñoz-García, M.G.; Rubio-Jurado, B.; Salazar Páramo, M.; Gómez Sánchez, E.; et al. Influence of chronic low-grade inflammation (obesity) on the systemic inflammatory response. In Multisystem Inflammatory Syndrome—Natural History; IntechOpen: London, UK, 2023; pp. 1–20. [Google Scholar] [CrossRef] [Scilit]
- Manoogian, E.N.C.; Wilkinson, M.J.; O’Neal, M.; Laing, K.; Nguyen, J.; Van, D.; Rosander, A.; Pazargadi, A.; Gutierrez, N.R.; Fleischer, J.G.; et al. Time-restricted eating in adults with metabolic syndrome. Ann. Intern. Med. 2024, 177, 1462–1470. [Google Scholar] [CrossRef] [Scilit]
- Ezzati, A.; Tamargo, J.A.; Golberg, L.; Haub, M.D.; Anton, S.D. The effects of time-restricted eating on inflammation and oxidative stress in overweight older adults: A pilot study. Nutrients 2025, 17, 322–330. [Google Scholar] [CrossRef] [Scilit]
- De Souza Santos, K.E.; Attu, S.S.; Kamman-Cummings, L.; Romana, C.K.; Baum, J.I. Protein supplementation during time restricted feeding decreases body fat but does not improve cardiometabolic or inflammatory markers in adults with overweight or obesity. Curr. Dev. Nutr. 2025, 9, 106591. [Google Scholar] [CrossRef] [Scilit]
- Lin, S.; Cienfuegos, S.; Ezpeleta, M.; Pavlou, V.; Corapi, S.; Runchey, M.C.; Alexandria, S.J.; Tussing-Humphreys, L.; Varady, K.A. Time-restricted eating versus daily calorie restriction: Effects on inflammatory markers over 12 months in adults with obesity. Nutrients 2025, 17, 1130–1141. [Google Scholar] [CrossRef] [Scilit]
- Sakers, A.; De Siqueira, M.K.; Seale, P.; Villanueva, C.J. Adipose-tissue plasticity in health and disease. Cell 2022, 185, 419–446. [Google Scholar] [CrossRef] [Scilit]
- Damasceno de Lima, R.; Fudoli Lins Vieira, R.; Rosetto Muñoz, V.; Chaix, A.; Azevedo Macedo, A.P.; Calheiros Antunes, G.; Felonato, M.; Rosseto Braga, R.; Castelo Branco Ramos Nakandakari, S.; Calais Gaspar, R.; et al. Time-restricted feeding combined with resistance exercise prevents obesity and improves lipid metabolism in the liver of mice fed a high-fat diet. Am. J. Physiol. Endocrinol. Metab. 2023, 325, E513–E528. [Google Scholar] [CrossRef] [Scilit]
- Domingos Brisque, G.; Macêdo, A.P.A.; Erlich, G.S.; Iasniswski, G.A.; Muñoz, V.R.; Brunelli, D.; da Rocha, A.L.; Antonio, G.C.F.; Dias, L.M.; Ropelle, E.R.; et al. Combination of time-restricted feeding with resistance exercise ameliorates MAFLD and improves glycemic homeostasis in obese mice. Life Metab. 2025, 4, loaf023. [Google Scholar] [CrossRef] [Scilit]
- Khanna, D.; Khanna, S.; Khanna, P.; Kahar, P.; Patel, B.M. Obesity: A chronic low-grade inflammation and its markers. Cureus 2022, 14, e22711. [Google Scholar] [CrossRef] [Scilit]
- Hauck, A.K.; Huang, Y.; Hertzel, A.V.; Bernlohr, D.A. Adipose oxidative stress and protein carbonylation. J. Biol. Chem. 2019, 294, 1083–1088. [Google Scholar] [CrossRef] [Scilit]
- Goncalves, R.L.S.; Wang, Z.B.; Riveros, J.K.; Parlakgül, G.; Inouye, K.E.; Lee, G.Y.; Fu, X.; Saksi, J.; Rosique, C.; Hui, S.T.; et al. CoQ imbalance drives reverse electron transport to disrupt liver metabolism. Nature 2025, 643, 1057–1065. [Google Scholar] [CrossRef] [Scilit]
- Ying, S.; Ding, H.; Chen, Y.; Zheng, S. Association of oxidative balance score with all-cause and cardiovascular mortality in overweight and obese. Front. Nutr. 2025, 12, 1536024. [Google Scholar] [CrossRef] [Scilit]
- Madkour, M.I.; Hassan, R.E.; Sherif, N.M.; Awadallah, S.; Farahat, N.M.; Abdelrahim, D.N.; AlHasan, F.A.; Taneera, J.; Faris, M.E. Changes in haptoglobin genotype-based gene expressions upon the observance of dawn-to-dusk intermittent fasting: A prospective cohort study on overweight and obese individuals. Front. Nutr. 2024, 11, 1409344. [Google Scholar] [CrossRef] [Scilit]
- Tavakoli, A.; Akhgarjand, C.; Ansar, H.; Houjaghani, H.; Khormani, A.; Djafarian, K.; Rostamian, A.; Ranjbar, M.; Farsani, G.M. The effects of intermittent fasting on antioxidant and inflammatory markers and liver enzymes in postmenopausal, overweight and obese women with rheumatoid arthritis: A randomized controlled trial. Sci. Rep. 2025, 15, 2357–2366. [Google Scholar] [CrossRef] [Scilit]
- Peters, B.; Schwarz, J.; Schuppelius, B.; Ottawa, A.; Koppold, D.A.; Weber, D.; Steckhan, N.; Mai, K.; Grune, T.; Pfeiffer, A.F.H.; et al. Intended isocaloric time-restricted eating shifts circadian clocks but does not improve cardiometabolic health in women with overweight. medRxiv 2024. [Google Scholar] [CrossRef] [Scilit]
- Pinaffi-Langley, A.C.d.C.; Pinto, C.B.; Mukli, P.; Peterfi, A.; Kaposzta, Z.; Owens, C.D.; Szarvas, Z.; Muranyi, M.; Adams, C.; Shahriari, A.; et al. Energy metabolism dysregulation, cerebrovascular aging, and time-restricted eating: Current evidence and proof-of-concept findings. PNAS Nexus 2024, 3, pgae505. [Google Scholar] [CrossRef] [Scilit]
- Milan, M.; Troyano-Rodriguez, E.; Ihuoma, J.; Negri, S.; Rudraboina, R.; Kosmider, A.; Awasthi, S.; Balasubramanian, P.; Conley, S.; Yabluchanskiy, A.; et al. Fasting as medicine: Mitochondrial and endothelial rejuvenation in vascular aging. Aging Cell 2026, 25, e70372. [Google Scholar] [CrossRef] [Scilit]

Disclaimer/Publisher’s Note: The statements, opinions and data contained in all publications are solely those of the individual author(s) and contributor(s) and not of MDPI and/or the editor(s). MDPI and/or the editor(s) disclaim responsibility for any injury to people or property resulting from any ideas, methods, instructions or products referred to in the content. |
© 2026 by the authors. Licensee MDPI, Basel, Switzerland. This article is an open access article distributed under the terms and conditions of the Creative Commons Attribution (CC BY) license.