


Highlights
What are the main findings?
- Multi-omics profiling identified dysregulated lipid metabolism, altered apolipoproteins, reduced adiponectin, and inflammatory proteins as key molecular signatures of metabolic syndrome (MetS).
- Integration of metabolomic and proteomic data identified a latent factor that clearly distinguished MetS cases from controls, while archetypal analysis revealed extreme molecular phenotypes associated with MetS heterogeneity.
What are the implications of the main findings?
- These findings highlight the interplay of lipid dysregulation, insulin resistance, and chronic low-grade inflammation in MetS, providing potential targets for cardiometabolic risk reduction and a foundation for future omics-based risk stratification and precision prevention strategies.
Abstract
Background/Objectives: Metabolic syndrome (MetS) is a heterogeneous cluster of cardiometabolic risk factors whose underlying molecular heterogeneity remains incompletely understood. Methods: Targeted metabolomics (388 metabolites) and untargeted proteomics (842 proteins) were analyzed in the KORA FF4 study (n = 1921). Multivariable regression, LASSO, and Multi-Omics Factor Analysis (MOFA) were applied to identify MetS-associated signatures. As a secondary analysis, soft-clustering archetypal analysis based on 22 clinical variables was performed within the MetS subgroup (n = 582) to identify extreme clinical subphenotypes. Results: A total of 117 metabolites and 70 proteins were associated with MetS, including five metabolites and eight proteins shared across all MetS traits. Key metabolomic features comprised diacylglycerols, triglyceride score, hexoses, and branched-chain amino acids. Prominent proteins included APOC4, APOE, APOB, APOD, APOF, adiponectin, LBP, and SHBG, reflecting alterations in lipid metabolism, inflammation, and metabolic regulation. MOFA identified a latent factor strongly linked to MetS, integrating signatures of lipid metabolism, insulin resistance, and inflammation. Archetypal analysis identified extreme MetS profiles and associated with metabolites and proteins shared across all Mets. Conclusions: Integrated multi-omics analysis revealed MetS-associated molecular signatures characterized primarily by dysregulated lipid metabolism, insulin resistance, and chronic low-grade inflammation. Secondary archetypal analysis highlighted clinical heterogeneity at the extreme boundaries of MetS while supporting a shared molecular foundation. These findings highlight the value of combining clinical, metabolomics and proteomics to improve characterization of MetS heterogeneity and inform future precision risk stratification.
1. Introduction
Metabolic syndrome (MetS) is a cluster of interrelated cardiometabolic abnormalities, including central obesity, elevated blood pressure, dyslipidemia, hyperglycemia, and insulin resistance, that collectively increase the risk of type 2 diabetes mellitus (T2D), cardiovascular disease (CVD), and all-cause mortality. As the prevalence of obesity and sedentary lifestyles continues to rise globally, MetS has become a major public health concern, affecting approximately one-quarter of the adult population worldwide. The incidence of MetS is on the rise; for instance, in the United States, its prevalence, defined by the NCEP-ATP III criteria, rose from 37.6% in 2011–2012 to 41.8% in 2017–2018 [1,2]. The pathogenesis of MetS involves complex interactions among metabolic, inflammatory, endocrine, and genetic pathways that collectively contribute to insulin resistance, adipose tissue dysfunction, and systemic metabolic dysregulation. The current binary definition of MetS does not adequately capture its pathophysiological heterogeneity and offers limited ability to predict future metabolic trajectories and the inconsistent efficacy of standardized metabolic treatments [3,4,5].
Advances in high-throughput molecular profiling technologies have enabled comprehensive characterization of biological systems and have facilitated the investigation of disease processes beyond conventional clinical biomarkers. Among these technologies, metabolomics and proteomics provide complementary insights into metabolic health and disease. Metabolomics provides a quantitative assessment of low molecular weight metabolites that represent the end products of cellular processes and offer a direct snapshot of metabolic activity. Previous studies have demonstrated associations between alterations in amino acids, acylcarnitines, phospholipids, and other lipid species with insulin resistance, obesity, and incident MetS, highlighting the potential of metabolomic signatures as biomarkers of cardiometabolic risk [6,7].
Proteomics complements metabolomics by enabling the large-scale characterization of proteins that mediate cellular signaling, inflammation, lipid transport, and metabolic regulation. Proteomic studies have identified dysregulation of pathways related to immune response, extracellular matrix remodeling, and energy metabolism in individuals with metabolic disorders, providing mechanistic insights into disease progression. Furthermore, combined metabolomic and proteomic investigations have demonstrated that coordinated perturbations across multiple molecular layers contribute to the development of MetS [8].
While single-omics analyses provide valuable insights, metabolic diseases arise from interconnected molecular networks that span multiple biological levels. Integrative multi-omics approaches therefore offer a more comprehensive understanding of disease biology. Multi-Omics Factor Analysis (MOFA) is an unsupervised statistical framework specifically developed for the integration of heterogeneous omics datasets. MOFA identifies latent factors that capture both shared and modality-specific sources of variation across multiple molecular layers, facilitating the discovery of biologically meaningful patterns associated with disease phenotypes [9].
Clustering methods are widely utilized for data stratification, allowing the identification of uncharacterized patterns and underlying structures. Hard clustering methods, such as K-means, are commonly used in subtyping studies [10,11,12]. In contrast to hard clustering, where each data point is assigned to only one cluster, soft clustering allows for overlapping memberships, reflecting the uncertainty/ambiguity in the assignment of data points to clusters. Archetypal analysis is a soft clustering data-mining approach that identifies extreme pure patterns at the boundaries of data, representing distinct combinations in mixed etiology. It quantifies the contribution of various etiological processes by calculating “archetype scores,” numerical values that reflect how strongly an individual aligns with each archetype [13].
The Cooperative Health Research in the Region of Augsburg (KORA) study provides a well-characterized population-based framework for investigating the molecular determinants of metabolic diseases. In the present study, we analyzed participants from the KORA FF4 cohort to identify molecular signatures associated with MetS. To comprehensively characterize the molecular landscape of MetS, we integrated targeted metabolomics data comprising 388 metabolites and untargeted proteomics data comprising 842 proteins. We first applied multivariable regression analyses associated with MetS and its individual traits. Subsequently, we employed MOFA to integrate the metabolomic and proteomic datasets and derive latent factors representing coordinated molecular variation across omics layers. Additionally, recognizing the substantial clinical heterogeneity among individuals with MetS, we performed soft-clustering archetypal analysis using 22 clinical traits to identify phenotypic profiles’ heterogeneity within the MetS subgroup. By combining statistical association analyses, this study aims to uncover molecular signatures and latent biological processes underlying MetS and to improve our understanding of the heterogeneity of cardiometabolic disease.
2. Materials and Methods
2.1. Study Population, Definitions, and Selection Criteria
The KORA S4 study (1999–2001) was conducted in Augsburg (Germany) and, (KORA) F4 (2006–2008) and FF4 studies (2013–2014) are follow-up examinations of this population-based cohort. All investigations were conducted in accordance with the Declaration of Helsinki, and all participants provided written informed consent. Study procedures were approved by the Ethics Committee of the Bavarian Chamber of Physicians, Munich (EC No. 06068). Details of the study design, sampling strategy, and data collection have been described previously [14].
In this cross-sectional study, we leveraged data from the KORA FF4 participants (n = 2279). Initially, we reviewed the clinical variables utilized in the IMI DIRECT study [8,15] and identified those available in KORA FF4, including demographics, anthropometric, blood pressure, glucose and diabetes-related markers, lipids, inflammatory markers, and insulin resistance/sensitivity indices (Appendix A). Principal component analysis (PCA) was performed in R using the prcomp () function to assess the overall structure and variation of the metabolic phenotypes and to visualize the distribution of participants according to MetS status.
MetS status was defined according to the International Diabetes Federation (IDF) 2009 criteria as it represented the most recent criteria and had the highest prevalence among the study population [3]. According to the IDF definition, a diagnosis requires the presence of any 3 of 5 of the following components: (1) elevated waist circumference (waist circumference ≥ 94 cm in men or ≥80 cm in women), (2) elevated fasting triglyceride levels (≥150 mg/dL or 1.7 mmol/L) or use of drug treatment for elevated triglyceride, (3) reduced HDL-cholesterol (<1.0 mmol/L or 40 mg/dL in males, <1.3 mmol/L or <50 mg/dL in females) or use of drug treatment for reduced HDL-cholesterol, (4) elevated blood pressure (systolic ≥ 130 mmHg or diastolic ≥ 85 mmHg) or treatment with antihypertensive medication, being aware of having hypertension (elevated blood pressure), and (5) elevated fasting plasma glucose (≥100 mg/dL or 5.6 mmol/L) or intake of antidiabetic medication (elevated fasting glucose). Subsequently, participants with missing covariates were excluded, resulting in the removal of missing values (n = 358). Finally, 1921 participants remained for analysis for the whole population including 582 with MetS status and 1339 without MetS (Supplementary Figure S1). The figure summarizes participant selection and missing data across the clinical, proteomic, and metabolomic datasets, showing the numbers included in each analysis and their MetS/non-MetS composition. It also highlights the reduction in sample size due to missing data and the final cohorts used for the respective analyses.
2.2. Untargeted Proteomics
Proteomics analysis was performed at OmicEra Diagnostics GmbH, Planegg, Germany, in 2021–2022, with samples prepared for LC-MS/MS as described by Geyer et al. [16] and data acquired on an EASY-nLC 1000 ultra-high-pressure system coupled via a nano-electrospray ion source to a Q Exactive HF Orbitrap mass spectrometer (all Thermo Fisher Scientific, Waltham, MA, USA). In brief, a detergent-free lysis buffer (100 mM Tris pH 8, 10 mM TCEP, 40 mM CAA) was utilized as a substitute for the SDC buffer. An automated Agilent Bravo platform with the 96ST pipetting head was used for tasks which included pipetting of liquids. Sample preparation and instrument performance was monitored by using a standardized sample, consisting of one pool of human plasma (distributed into five positions on a 96-well plate). 1 µL per sample was used. Denaturation together with alkylation was executed at 95 °C, followed by digestion using both trypsin and lysC in a 1:100 enzyme–protein ratio at 37 °C for 4 h. Peptides were loaded directly onto activated Evotips for the purpose of purification and subsequent downstream LC-MS/MS analysis. To reduce technical batch effects, all samples from one individual, i.e., up to 3 measurements, were spread on the same 96-well plate. The raw dataset contained 2132 participants and 2371 proteins and proteins with 60% or more missing values were excluded in the first run (794 proteins removed). Secondly, only those proteins with at least one reference value per plate were retained (664 proteins removed). All proteins with the coefficient of variation (CV) > 10% of the reference values (log2-transformed data) were excluded (71 proteins). Median normalization was implemented on the remaining 842 protein dataset. To address the technical variability among different plates, a normalization factor was computed for each protein on every plate using the reference samples. Subsequently, each KORA FF4 sample was corrected accordingly for the factor. In the next step, GSIMP imputation [17] for missing data was performed using the normalized sample data, followed by data log2- and z-transformation for all proteins. Finally, we checked proteins’ available gene names, protein names, and UniProt_ID in UniProt [18]. Final checks on UniProt IDs yielded 842 proteins for 2045 participants in KORA FF4 available for further analysis. Proteomic data were unavailable for 454 participants; therefore, the final proteomics dataset comp rised 842 proteins measured in 1825 participants, including 549 with MetS and 1276 without MetS.
2.3. Targeted Metabolomics
Metabolomics was analyzed using the MxP® Quant 500 Kit (biocrates Life Sciences, Innsbruck, Austria) via liquid chromatography–triple quadrupole mass spectrometry [19]. In brief, 10 µL each of plasma (samples and reference plasma), calibration solutions, quality controls, and zero samples (PBS) were applied to the kit plate. Sample processing (derivatization and extraction) was performed, and the resulting, diluted extracts were analyzed by applying liquid chromatographic triple quadrupole mass spectrometric methods. From the initially measured 620 metabolites, we excluded those that did not pass the following three quality control (QC) criteria: 1. The value of three times the global median of cleaned PBS samples is not allowed to surpass the mean of the uncleaned main sample for each metabolite. 2. The median of the 3 values (a) coefficient of variation value of all reference values, (b) the CV value of the NIST samples and (c) the median of the coefficient of variation values of QC Samples 1, 2 and 3 is not allowed to surpass the value of 30%. 3. The main local plate limit of detection (LOD) percentage is not allowed to surpass 50%. This resulted in 232 deletions of metabolites, leaving 388 remaining metabolites. After cleaning QC-failed metabolites, main samples with more than 10% outlier metabolites (i.e., “39” outliers for the remaining 388 metabolites) are removed; this resulted in 8 exclusions, resulting in 1095 individuals/samples. Outlier metabolites include missing, lower outliers (mean minus five times the standard deviation), and upper outliers (mean plus five times the standard deviation). Because of the 78 exclusions of the samples in plate 48, this study resulted in 1017 samples at the end. Normalization was done using the “TIGER” R-package [20]. In the next step, GSIMP imputation [17] for missing data was performed using the normalized sample data, followed by data log2- and z-transformation for all metabolites (mean = 0, SD = 1) to ensure comparability between the metabolites. After data export, lower and upper outliers were defined as samples with >33% of metabolite concentrations below 25% quantile (±1.5 × IQR). Metabolomics data was missing for 154 individuals; therefore, the final dataset comprised 388 metabolites measured in 863 KORA FF4 participants available for further analysis, including 261 with MetS and 602 without MetS.
2.4. Statistical Analysis
Baseline data are reported as mean ± standard deviation (SD), median (interquartile range Q1, Q3) for continuous measures and as percentages (%) for categorical data. Continuous variables were transformed using rank-based inverse normal transformation (INT) prior to statistical analysis. The initial analyses were exploratory and aimed to investigate associations between individual metabolites and proteins and MetS status, as well as individual MetS traits. Associations between individual metabolites, proteins, and MetS status (MetS traits, including BMI, triglycerides (TG), HDL cholesterol, hypertension, fasting glucose) were assessed using multivariable linear/logistic regression models adjusted for age, sex, lifestyle alcohol intake, physical activity, smoking status and medication. Multiple testing was controlled using the Benjamini–Hochberg false discovery rate (FDR). To identify latent axes of variation shared across and specific to each data modality, we applied Multi-Omics Factor Analysis (MOFA2; [9]) to participants with both proteomic and metabolomic data available from n = 847 participants (590 without MetS and 257 MetS). Each omics layer was provided as a separate view, with features as rows and subjects as columns; continuous variables were scaled to unit variance within each view prior to model fitting, and views were assumed to follow a Gaussian noise model. The model was trained to infer 15 latent factors using the mofapy2 backend (via the MOFA2 R package), with default convergence criteria (ELBO deltaR2 < 0.0002 stopping tolerance) and a random seed set as 42 for reproducibility. For each factor, we quantified the percentage of variance explained per omics layer to characterize whether the factor captured shared cross-omics signal or layer-specific variation. To test whether factors captured biological variation related to MetS, factor scores were associated with MetS status using linear regression, with p-values corrected for multiple testing across all 15 factors using the Benjamini–Hochberg false discovery rate (FDR); factors with q < 0.05 were considered significantly associated with subgroup. For significant factors, the top-weighted features per omics view were examined to characterize the underlying biological signal. All statistical analyses were performed using R version 4.3.2.
2.5. Archetypes Analysis to Study Extreme MetS Cases
We applied soft clustering to the KORA FF4 MetS population (n = 582) using the “archetypes” R package, in accordance with IMI-DIRECT study [15], based on 22 clinical variables. We utilized the stepArchetypes () function from the “archetypes” package, specifically using the robustArchetypes () function, with 100 iterations for k values ranging from 1 to 10. Subsequently, bar plots based on the residual sum of squares (RSS) for all k values were generated using functions from the package [13,15].
Archetype stability was assessed using the adjusted Rand index (ARI) based on randomized subsampling of 90% of the original dataset repeated 100 times. We selected the archetype model that demonstrated both high stability and the lowest RSS based on the elbow method (three archetypes). In parallel, to specify the threshold for defining the extreme archetypes and mixed etiology, we evaluated archetypes’ stability ranging from 0.0 to 1.0 in the intervals of 0.05 following the approach used in the IMI DIRECT study [15]. Based on the various membership stability results, we observed that all archetypes plateaued at a threshold of 0.7. We therefore selected this cut-off for defining the extreme archetypes (membership ≥ 0.7) and all the individuals with the membership < 0.7 were assigned as mixed etiology. Associations between archetype scores and continuous cardiometabolic traits were assessed using multivariable linear regression. Pairwise group comparisons were performed using the Mann–Whitney U test (comparisons between each group and the remaining individuals), whereas comparisons across multiple groups were conducted using the Kruskal–Wallis test (archetypes and mixed etiology). For omics analysis, metabolomics and proteomics were normalized (log2, normalized) prior to the analysis. Then we tested each metabolite (388) and proteins (842 proteins) individually with each continuous archetype’s score using linear regression. An FDR < 0.05 was considered statistically significant. To further investigate the groups in mixed etiology, participants were classified according to their highest and second-highest archetype scores. This resulted in six distinct mixed groups: M1M2, M1M3, M2M1, M2M3, M3M1, and M3M2.
3. Results
3.1. Descriptive Statistics
Among 1921 participants, 582 (30.3%) had MetS as shown in Table 1. The PCA plot, presented in the graphical abstract, illustrates the distribution of participants according to their overall metabolic phenotypes, with participants without MetS shown in green and those with MetS in red. Participants with MetS were older (64 vs. 55 years) and more likely to be male (61.9% vs. 41.5%) than those without MetS (both p-value < 0.001). Individuals with MetS exhibited significantly greater adiposity. They had higher body weight (86.6 vs. 73.5 kg), BMI (29.6 vs. 25.6 kg/m2), and waist-to-hip ratio (WHR) (0.96 vs. 0.87). Height did not differ significantly between groups (p-value = 0.086).
Table 1.
Descriptive statistics of KORA FF4.
Cardiometabolic risk factors were markedly worse among participants with MetS. Both systolic (127 vs. 113 mmHg) and diastolic blood pressure (76.5 vs. 71 mmHg) were significantly higher in the MetS group (both p-value < 0.001). Similarly, fasting glucose (5.88 vs. 5.22 mmol/L), 2 h glucose (7.02 vs. 5.38 mmol/L), fasting insulin (79.5 vs. 45.0 pmol/L), and 2 h insulin concentrations (437.6 vs. 228.0 pmol/L) were substantially elevated in participants with MetS (all p-value < 0.001).
Markers of insulin resistance and sensitivity differed significantly between groups. Participants with MetS had lower QUICKI scores (0.32 vs. 0.35), higher HOMA2-IR values (1.55 vs. 0.85), lower HOMA2-S values (64.6 vs. 117.0), and higher HOMA2-B values (88.1 vs. 78.3), indicating greater insulin resistance and compensatory β-cell activity.
Regarding lipid parameters, participants with MetS had slightly higher total cholesterol (5.66 vs. 5.58 mmol/L, p-value = 0.049), higher LDL-C (3.64 vs. 3.44 mmol/L, p-value < 0.001), markedly lower HDL-C (1.38 vs. 1.77 mmol/L, p-value < 0.001), and substantially higher triglyceride concentrations (1.75 vs. 1.03 mmol/L, p-value < 0.001). Creatinine, HbA1c, and hsCRP levels were also significantly higher among participants with MetS (all p-value < 0.001).
The distribution of obesity categories differed significantly between groups. Among participants with MetS, 45.8% were obese (WHO obesity grades 1–3) compared with 16.1% of those without MetS. Conversely, normal weight status was more common among participants without MetS (42.9% vs. 7.4%).
Overall, MetS was associated with substantial differences in anthropometric, metabolic, and cardiometabolic risk factors. To further investigate the heterogeneity underlying these differences, we examined the associations of metabolomic and proteomic profiles with MetS using supervised regression and unsupervised latent factor analysis. We then used soft clustering to identify individuals with extreme MetS phenotypes and examined their molecular profiles to further characterise the biological features associated with these extreme cases.
3.2. Multi-Omics Association with MetS
3.2.1. Metabolomics Association with MetS
Logistic regression identified a strong metabolomic signature of MetS, with 117 metabolites significantly associated with disease status (Figure 1, Supplementary Table S1). We identified distinct metabolomic signatures associated with MetS traits, including BMI, triglycerides (TG), HDL cholesterol, hypertension, fasting glucose, and MetS status. We found 5 common metabolites, including cholesteryl ester CE(16:1), ceramide Cer(d18:1/18:0), diacylglycerols DG(16:0/18:1), DG(17:0/18:1), and phosphatidylcholine PC aa C36:4, were associated with MetS traits. Comparison with a previously reported KORA F4 study using the Biocrates p150 kit showed that 35 metabolites had replicated significant associations with MetS in the present analysis. Notably, lysoPC a C18:2, previously reported to be negatively associated with MetS and all five of its components, was also significantly associated with MetS in our study, further supporting the consistency of this metabolomic signature across KORA cohorts and analytical platforms [21].
Figure 1.
Circular heatmap of metabolite associations with metabolic syndrome (MetS) traits. Each sector represents a metabolite, and each ring represents a MetS trait. Green and red indicate significant positive and negative associations, respectively, while gray indicates no significant association. The plot summarizes shared and trait-specific metabolite–MetS trait relationships.
Among BMI-associated metabolites, the strongest positive associations were observed for glutamate (β = 0.42, q = 7.8 × 10⁻³¹), valine (β = 0.42, q = 1.5 × 10⁻¹⁹), isoleucine (β = 0.41, q = 6.8 × 10⁻¹⁷), tyrosine (β = 0.37, q = 2.7 × 10⁻¹⁷), and PC aa C38:3 (β = 0.36, q = 8.2 × 10⁻²²). In contrast, lysoPC a C18:2 (β = −0.38, q = 4.9 × 10⁻²⁵), lysoPC a C18:1 (β = −0.34, q = 1.3 × 10⁻²⁰), and lysoPC a C17:0 (β = −0.33, q = 3.0 × 10⁻¹⁹) exhibited the strongest inverse associations.
The strongest associations were observed for triglyceride levels, which were highly correlated with diacylglycerol species, including DG 16:0/18:1, DG 18:1/18:1, DG 16:0/18:2, and DG 16:1/18:2 (all q < 1 × 10−148), highlighting a prominent role of glycerolipid metabolism in circulating triglyceride variation. HDL cholesterol was positively associated with multiple phosphatidylcholine species, particularly ether-linked and diacyl phosphatidylcholines (PC ae C40:1, PC aa C38:5, PC ae C38:0, PC aa C36:3, and PC ae C38:6; all q < 1 × 10⁻²⁹), suggesting a strong relationship between HDL status and phospholipid composition.
Hypertension exhibited comparatively weaker metabolic associations. After FDR correction, only a limited number of metabolites remained significant, including CE(16:1) (OR = 1.42, q = 0.0055), Cer(d18:1/18:0) (OR = 1.29, q = 0.038), DG(16:0/18:1) (OR = 1.34, q = 0.016), Cer(d18:0/24:0) (OR = 1.35, q = 0.014), and tyrosine (OR = 1.41, q = 0.026). Fasting glucose showed strong positive associations with hexose levels (H1; β = 0.94, q = 2.26 × 10−96) and glutamate (β = 0.28, q = 7.18 × 10⁻¹³), together with inverse associations with lysophosphatidylcholine species.
Metabolic syndrome exhibited the most pronounced disease-associated metabolomic alterations, with markedly elevated odds associated with H1 (OR = 6.18, q = 2.09 × 10⁻²⁰), TG_score (OR = 4.61, q = 1.26 × 10⁻²⁵), DG 16:0/18:1 (OR = 4.00, q = 8.23 × 10⁻²⁸), DG 16:0/18:2 (OR = 3.40, q = 7.11 × 10⁻²⁴), and DG 18:1/18:1 (OR = 2.96, q = 2.67 × 10⁻²¹).
Overall, these findings demonstrate that MetS traits are characterized by coordinated alterations in glycerolipid metabolism, glucose homeostasis, amino acid metabolism, sphingolipid metabolism, and phospholipid remodeling. Common metabolite signatures, including diacylglycerols, ceramides, cholesteryl esters, phosphatidylcholines, and hexoses, highlight dysregulated lipid metabolism as a central feature of metabolic syndrome, with diacylglycerol accumulation and hexose elevation emerging as important metabolite markers of metabolic dysfunction.
3.2.2. Proteomics Association with MetS
Multivariable regression analysis identified 70 strong protein signatures associated with MetS status (Figure 2, Supplementary Table S2). Protein profiling revealed distinct circulating protein signatures associated with MetS traits, including BMI, triglycerides (TG), HDL cholesterol, hypertension, fasting glucose, and MetS cases. We found 8 proteins (APOB, CO3, CFAH, SAMP, VTNC, AFAM, LG3BP, K7ER74) are significant (q < 0.05) in all 5 traits.
Figure 2.
Circular heatmap of protein associations with metabolic syndrome (MetS) traits. Each sector represents a protein, and each ring represents a metabolic trait. Green and red indicate significant positive and negative associations, respectively, while gray indicates no significant association. The plot summarizes shared and trait-specific protein–metabolic trait relationships.
For BMI, the strongest associations were observed for sex hormone-binding globulin (SHBG), which showed a marked inverse relationship with BMI (β = −1.16, q = 5.95 × 10⁻¹⁴). In contrast, C-reactive protein (CRP) was positively associated with BMI (β = 0.27, q = 1.92 × 10⁻¹³), consistent with increased inflammatory activity in individuals with higher adiposity. Additional BMI-associated proteins included apolipoprotein F (APOF; β = −0.58, q = 4.33 × 10⁻¹³), galectin-3-binding protein (LG3BP; β = 0.36, q = 2.11 × 10⁻¹¹), and apolipoprotein D (APOD; β = −0.26, q = 3.91 × 10⁻¹¹), highlighting alterations in lipid transport and inflammatory pathways.
Triglyceride levels showed the strongest protein associations, particularly with lipid metabolism-related proteins. Apolipoprotein C-IV (APOC4) demonstrated a highly significant positive association with TG (β = 1.35, q = 2.67 × 10−57), followed by GPC1-related proteins (β = 2.44, q = 8.01 × 10−40), apolipoprotein B (APOB; β = 0.47, q = 6.19 × 10−39), and apolipoprotein C-III (APOC3; β = 0.35, q = 1.23 × 10⁻²²). These findings indicate a strong involvement of apolipoprotein-mediated lipid transport pathways in circulating triglyceride regulation.
HDL cholesterol was positively associated with multiple proteins involved in lipid metabolism and transport. The strongest associations were observed for opsin B (OPSB; β = 2.19, q = 6.46 × 10⁻²⁸), G protein subunit alpha z (GNAZ; β = 4.13, q = 1.31 × 10⁻¹⁹), and apolipoprotein M (APOM; β = 0.34, q = 2.92 × 10⁻¹⁷). Additional HDL-associated proteins included DOS and HS12B-related proteins, further supporting a role for circulating protein composition in HDL metabolism and function.
Associations with hypertension were weaker and did not remain significant after multiple testing correction. Nominal associations were observed for carbonic anhydrase 1 (CAH1; OR = 0.56, p = 4.50 × 10⁻⁴), an UNC13B-related protein (OR = 0.22, p = 5.37 × 10⁻⁴), complement C1q subunit A (C1QA; OR = 1.91, p = 0.0015), serum amyloid P component (SAMP; OR = 1.31, p = 0.0020), and complement component 3 (C3; OR = 1.29, p = 0.0025), suggesting potential involvement of inflammatory and complement pathways.
Fasting glucose was associated with several proteins involved in metabolic regulation. Alpha-2-HS-glycoprotein (AFAM) showed a positive association with glucose levels (β = 0.22, q = 1.39 × 10⁻⁷), whereas APOF (β = −0.39, q = 5.35 × 10⁻⁶) and adiponectin (ADIPO; β = −0.37, q = 6.81 × 10⁻⁴) showed inverse associations. Additional positive associations were observed for pigment epithelium-derived factor (PEDF) and coagulation factor IX (FA9), suggesting links between glucose homeostasis, adipokine signaling, and coagulation-related pathways.
Metabolic syndrome showed the most pronounced protein associations, characterized by strong alterations in apolipoprotein and metabolic proteins. APOC4 was associated with substantially increased MetS risk (OR = 4.15, q = 3.33 × 10⁻⁷), while GPC1-related proteins demonstrated the largest effect size (OR = 16.04, q = 3.60 × 10⁻⁶). Conversely, APOD (OR = 0.59, q = 3.60 × 10⁻⁶) and adiponectin (ADIPO; OR = 0.30, q = 3.99 × 10⁻⁶) were inversely associated with MetS, indicating protective associations. Apolipoprotein E (APOE) was positively associated with MetS risk (OR = 1.72, q = 3.99 × 10⁻⁶).
Overall, these findings demonstrate that cardiometabolic traits are strongly characterized by alterations in circulating proteins involved in lipid transport (APOC4, APOB, APOC3, APOE), inflammation (CRP, CO3, CFAH complement proteins), adipokine signaling (ADIPO), and metabolic regulation (SHBG, APOF). The consistent enrichment of apolipoproteins among TG and MetS-associated proteins highlights dysregulated lipoprotein metabolism as a central molecular feature of cardiometabolic dysfunction.
3.3. Multi-Omics Factor Analysis
To integrate metabolomic and proteomic data, we performed Multi-Omics Factor Analysis (MOFA2), which identified 15 latent factors capturing shared and layer-specific sources of biological variation (Figure 3A; Supplementary Table S3a,b). Variance explained is reported for all 15 factors across both omics views and was additionally bootstrapped across 10 additional random seeds used for the robustness analysis. Factor 1 was largely metabolomics-specific, explaining 20.4% of the variance in the metabolomics layer, whereas Factor 2 was predominantly proteomics-specific, explaining 13.3% of the variance in the proteomics layer. To determine whether any latent factors were associated with MetS, factor scores were compared between MetS cases and non-cases (Supplementary Table S3c). Among all factors, Factor 1 showed the strongest association with MetS status (FDR-adjusted p < 2 × 10⁻¹⁶) and clearly separated cases from controls (Figure 3B). The association between Factor 1 and MetS was highly consistent across independent MOFA runs using different random seeds (Supplementary Table S3c). MetS cases displayed substantially lower Factor 1 scores than non-cases, indicating that this factor captures a major axis of molecular variation underlying metabolic dysfunction. We correlated MOFA Factor 1 scores with available clinical markers. Factor 1 was significantly associated with HOMA-IR (Spearman r = −1.054, FDR-adjusted p = 2.84 × 10−39) and hsCRP (r = −0.516, FDR-adjusted p = 8.63 × 10−09; n = 847), supporting its association with insulin resistance and inflammation. Factor 1 was also strongly associated with triglycerides (r = −2.43, FDR-adjusted p = 1.37 × 10−284) and HDL (r = 1.185, FDR-adjusted p = 2.25 × 10−52).
Figure 3.
MOFA factor variance explained and association with MetS status. (A) Percentage of variance explained by each of the 15 MOFA factors across the metabolomic and proteomic views, evaluated across 11 independent model fits using different random seeds. Points/boxplots represent the variance explained for the same factor matched across model runs, demonstrating the contribution and stability of each factor within the full MOFA model. (B) Distribution of Factor 1 scores according to MetS status, showing the separation of participants with MetS (MetS cases) from non-cases. Each point represents an individual participant.
The distributions of the top MOFA-contributing features were compared between MetS cases and controls using Wilcoxon tests for exploratory characterization of the factor. These comparisons were not intended as independent statistical confirmation of the MOFA factor–MetS association. The top 10 metabolomic features driving Factor 1 were dominated by diacylglycerol (DG) species (7 of 10 features), alongside the branched-chain amino acids isoleucine and leucine and a composite triglyceride score (TG_score) (Figure 4). All ten metabolites were significantly elevated in MetS cases relative to non-cases. This pattern is consistent with established metabolic syndrome pathophysiology: diacylglycerols are known mediators of hepatic and skeletal muscle insulin resistance via PKC activation, while elevated circulating branched-chain amino acids are among the most robust and reproducible metabolomic correlates of insulin resistance and obesity [22,23,24]. Together with the complement/inflammation and apolipoprotein signature identified among the top proteomic drivers of the same factor, these results suggest that Factor 1 captures a coordinated axis of lipid-driven insulin resistance, dyslipidemia, and low-grade inflammation underlying metabolic syndrome.
Figure 4.
Top 10 metabolomic features driving Factor1, stratified by MetS case status. Z-scored metabolite levels for the ten metabolites with the highest loadings on Factor 1, compared between non-cases (green) and MetS cases (red). Each point represents an individual sample; boxplots show median and interquartile range. Statistical significance of between-group differences was assessed by Wilcoxon rank-sum test.
To identify the proteomic drivers underlying the latent factor most strongly associated with metabolic syndrome (Factor 1), we examined the top 10 contributing proteins and compared their expression between MetS cases and non-cases (Figure 5). All 10 proteins differed significantly between groups (Wilcoxon test, p < 0.01 for all; p < 0.0001 for 9 of 10 proteins), confirming their robust contribution to this factor.
Figure 5.
Top 10 proteomic features driving Factor 1, stratified by MetS case status. Z-scored protein expression levels for the ten proteins with the highest loadings on Factor 1, compared between non-cases (green) and MetS cases (red). Each point represents an individual sample; boxplots show median and interquartile range. Statistical significance of between-group differences was assessed by Wilcoxon rank-sum test.
Seven proteins were significantly elevated in MetS cases relative to non-cases, including apolipoprotein B (APOB), apolipoprotein C4 (APOC4), glypican-1 (GPC1), serum amyloid P component (SAMP), pigment epithelium-derived factor (PEDF), and two additional features (K7ER74, CC150). In contrast, three proteins were significantly reduced in MetS cases: adiponectin (ADIPO), apolipoprotein F (APOF), and I3L145.
The direction of these associations was consistent with established MetS pathophysiology. Reduced circulating adiponectin, a well-characterized adipokine with insulin-sensitizing and anti-inflammatory properties, is a hallmark of insulin resistance and visceral adiposity, and its downregulation here recapitulates this known biology [25,26]. Conversely, elevated APOB and APOC4 reflect the atherogenic dyslipidemia characteristic of MetS, consistent with increased triglyceride-rich lipoprotein production and impaired lipid clearance [27,28]. The elevation of SAMP, an acute-phase reactant, further supports a low-grade chronic inflammatory state accompanying MetS, while increased PEDF is consistent with prior reports linking this factor to obesity and insulin resistance [29].
Collectively, the proteins driving Factor 1 span lipid metabolism, adipokine signaling, and inflammatory pathways, suggesting that this factor captures a coordinated axis of metabolic and inflammatory dysregulation central to metabolic syndrome pathophysiology.
3.4. Study of Extreme Mets Cases
Clinical heterogeneity within the MetS cohort was independently characterized using soft clustering to identify interpretable phenotypic patterns, separately from the MOFA analysis.
3.4.1. Clustering Using Archetypal Analysis and Stability of Archetypes
The residual sum of squares (RSS) curve obtained from the soft clustering (archetypal analysis) of the MetS subgroup showed a progressive decrease with an increasing number of archetypes (Figure 6a). The RSS declined markedly up to k = 3, after which further increases in the number of archetypes resulted in only marginal improvements in model fit, indicating an elbow at three archetypes.
Figure 6.
RSS elbow method and archetype stability analyses for the MetS subgroup. (a) Bar plot showing the residual sum of squares (RSS) for archetype models ranging from k = 1 to k = 10, based on 100 iterations. (b) Archetype stability assessed using the adjusted Rand index (ARI) across different membership thresholds for models with k = 1–10. The three-archetype solution demonstrated the best balance between model fit and clustering stability.
The stability of the archetypal solution was evaluated using the adjusted Rand index (ARI) across a range of membership thresholds (Figure 6b). The three-archetype solution showed the highest stability after the k = 2 solution across the different membership thresholds. Stability increased progressively with more stringent membership thresholds, with particularly high agreement observed for the three-archetype solution (k = 3) at thresholds ≥ 0.65, where the median ARI approached 1.0. A membership threshold of 0.70 was therefore selected to define extreme archetype membership, as stability for most of archetypes was already high and had largely reached a plateau at this cutoff. Together, the RSS and ARI analyses support the selection of three archetypes for the MetS subgroup, providing an optimal balance between model fit, clustering stability, and biological interpretability.
3.4.2. Archetypes Associated with Clinical Variables
Within the MetS subgroup (n = 582), archetypal analysis identified three clinically interpretable extreme archetypes (M1, n = 47; M2, n = 38; M3, n = 68) and a mixed-etiology group (n = 429) (Figure 7). MetS participants had a median age of 64 years and were predominantly male (62%) (Supplementary Table S4). Significant differences were observed across the key clinical variables among the archetypal groups (p < 0.001). Radar plots (Figure 7a) illustrate variation in the clinical and cardiometabolic characteristics across the three archetypes, highlighting their differing and clinically interpretable metabolic profiles. These differences were further supported by the heatmap analysis (Figure 7b), which illustrates associations between the archetypes and clinical variables based on pairwise Mann–Whitney U tests, showing both the direction and magnitude of differences across archetypes. The distribution of participants across the archetypal profiles (Figure 7c) showed that most individuals with MetS were classified within the mixed-etiology group (73.7%), whereas smaller proportions exhibited extreme archetypal profiles: M1 (8.1%), M2 (6.5%), and M3 (11.7%). Collectively, these findings highlight substantial cardiometabolic heterogeneity within the MetS population, with a predominance of mixed profiles alongside smaller, clinically interpretable extreme phenotypes. The characteristics of the three archetypes are summarized below.
Figure 7.
(a) Radar plots illustrate clinical variable profiles across three extreme archetypes and mix etiology in the MetS (n = 582). (b) The heatmap of archetypes and clinical variables among MetS (pairwise comparison using Mann-Whitney U test). In this heatmap, red indicates higher values and blue indicates lower values for each clinical variable, while asterisks denote statistically significant differences (* p < 0.05, ** p < 0.01, *** p < 0.001). Estimate corresponds to the regression coefficient (β), with its sign indicating the direction of association with archetypal membership. (c) Pie chart showing the distribution of archetypes within the MetS group.
- Archetype M1 (8.1%) represented the most adverse obesity–hyperglycemic phenotype. It was predominantly male and characterized by insulin resistance, hyperinsulinemia, obesity grades 1–3, impaired glycemia or newly diagnosed diabetes, inflammation, dyslipidemia (high TG, low HDL), and mostly optimal/normal blood pressure.
- Archetype M2 (6.5%) represented an older, female profile with relatively favorable MetS features, including normal weight/preadipose, mostly normal glycemia with some IFG/IGT, optimal/normal blood pressure, dyslipidemia (high LDL/cholesterol), high HDL, and relatively preserved insulin sensitivity.
- Archetype M3 (11.7%) represented a male-predominant, hypertension-dominant phenotype characterized by high-normal blood pressure/hypertension grade 1, greater height, elevated creatinine, dyslipidemia (high TG/LDL), preadipose/obesity grade 1, and largely normal glycemia.
- The mixed-etiology group showed an intermediate, heterogeneous profile, with mostly preadipose/obesity grade 1, mainly normal glycemia, and blood-pressure categories ranging from optimal/normal to high-normal or hypertension grade 1. This group was further characterized by classifying participants according to their highest and second-highest archetype membership weights, as shown in Figure 8.
Figure 8.
A heatmap of clinical associations across 6 mixed etiology groups, each categorized by their respective primary and secondary archetypes groups (pairwise comparison using Mann–Whitney U test). The heatmap colors represent both the direction and strength of the group differences where red denotes higher values and blue indicates lower values in the respective group (* p < 0.05, ** p < 0.01, *** p < 0.001). Estimate corresponds to the regression coefficient (β), with its sign indicating the direction of association with archetypal membership. By comparing different intermediate combinations, we found that participants with M1 as the primary archetype, such as M1M2 or M1M3, showed higher 2 h glucose, 2 h insulin, BMI, fasting insulin, HOMA-IR, and HOMA-B, along with lower insulin sensitivity indices. Participants with M2 (M2M1/M2M3) as the primary archetype showed higher HDL and lower weight, WHR, and creatinine. Participants with M3 as the primary archetype, such as M3M1 or M3M2, showed lower 2 h glucose and 2 h insulin, but higher SBP. The mixed groups also reflected the key characteristics of their corresponding extreme archetypes.
3.4.3. Metaboloite and Proteiomics Association with MetS
The extreme archetypes captured a gradient of metabolic and inflammatory profiles, as shown in Figure 9. Detailed results are presented in Supplementary Tables S5 and S6. Archetype 1 was characterized by a triglyceride-rich, inflammatory metabolic state, with higher levels of amino acids (glutamate, isoleucine, and valine), triglycerides, and inflammatory proteins (LBP, CRP, and LG3BP), accompanied by lower levels of several lysophosphatidylcholines (lysoPCaC18:1, lysoPCaC17:0, and lysoPCaC16:0) and apolipoproteins (APOF, APOM, and APOD). Archetype 2 showed lower triglyceride levels together with higher PSD1, NUFP2, IL3L145, APOF, APOM, and APOD, suggesting an apolipoprotein-enriched lipid-remodeling profile. Archetype 3 was characterized by higher levels of lysophosphatidylcholines (lysoPCaC18:0, lysoPCaC16:1, lysoPCaC14:0, and lysoPCaC18:2) and apolipoproteins (APOF and APOM), together with lower levels of amino acids (glutamate and isoleucine) and inflammatory markers (LBP, LG3BP, and H1). Overall, the archetypes were primarily distinguished by differences in triglyceride, phospholipid, apolipoprotein, and inflammatory profiles. Notably, PSD1, NUFP2 and LG3BP were elevated in Archetyps; given that the biological role of these protein in MetS remains poorly characterized, their potential relevance warrants further investigation.
Figure 9.
Molecular features associated with the three archetypes. Associations between continuous archetype membership scores and individual omics features were assessed using linear regression. The figure presents the top 10 molecular features (metabolites and proteins) for each archetype, selected based on the largest absolute regression coefficients among statistically significant associations (FDR < 0.05). The reported estimate represents the regression coefficient (β), with its sign indicating the direction of association with archetype membership. Colors indicate the direction and magnitude of differences across archetypes, with red representing higher and blue lower values in the respective group, based on pairwise Mann–Whitney U tests. Significance levels are indicated as (* p < 0.05, ** p < 0.01, *** p < 0.001).
4. Discussion
In this population-based analysis of the KORA FF4 cohort, we combined targeted metabolomics, untargeted proteomics, integrative multi-omics modeling and soft-clustering to characterize the molecular architecture and clinical heterogeneity of MetS. Three major findings emerged. First, MetS was associated with widespread alterations across metabolomic and proteomic profiles, with dysregulated lipid metabolism representing the dominant molecular signature. Second, MOFA identified a latent molecular factor strongly associated with MetS that was characterized by elevated diacylglycerols, branched-chain amino acids, atherogenic apolipoproteins, and inflammatory proteins, indicating a coordinated axis of insulin resistance, dyslipidemia, and low-grade inflammation. Third, archetypal analysis of individuals with MetS phenotypes revealed interpretable clinical and molecular profiles, with a subset of the metabolites and proteins contributing to the MOFA factor associated with archetypal weights, providing evidence of molecular heterogeneity within clinically defined MetS [3,10].
Dysregulated lipid metabolism as a central feature of MetS: The most consistent finding across both metabolomic and proteomic analyses was the central role of lipid metabolism. Among metabolites, diacylglycerol species, triglyceride-related measures, ceramides, phosphatidylcholines, and cholesteryl esters showed the strongest associations with MetS and its individual components [30,31]. Similarly, the strongest protein associations involved apolipoproteins including APOB, APOC3, APOC4, APOE, APOF, and APOM [32,33].
These findings are consistent with the concept that impaired lipid handling represents a fundamental mechanism linking obesity to insulin resistance and cardiometabolic disease [4,34]. The strong enrichment of diacylglycerol species is particularly noteworthy because diacylglycerols are not only biomarkers but also active mediators of insulin resistance through activation of protein kinase C signaling pathways [35,36]. Elevated intracellular and circulating diacylglycerols have been repeatedly linked to impaired insulin signaling in liver and skeletal muscle [22]. The concurrent elevation of triglyceride-associated metabolites and atherogenic apolipoproteins further suggests increased hepatic lipid flux and altered lipoprotein metabolism as key components of the metabolic syndrome phenotype [37,38].
Branched-chain amino acids and insulin resistance: In addition to lipid-related metabolites, leucine, isoleucine, glutamate, tyrosine, and other amino acid metabolites were strongly associated with MetS-related traits. Elevated circulating branched-chain amino acids (BCAAs) have emerged as one of the most reproducible metabolomic signatures of obesity, insulin resistance, and future type 2 diabetes [39,40,41]. The enrichment of BCAAs within the MetS-associated molecular signature likely reflects impaired amino acid catabolism, mitochondrial dysfunction, and altered nutrient sensing pathways. Furthermore, the simultaneous elevation of BCAAs and diacylglycerol species observed in our study supports accumulating evidence that perturbations in amino acid and lipid metabolism are closely interconnected processes contributing to insulin resistance [24,42].
The metabolic signatures identified in this study may also have relevance to hepatic metabolic dysfunction. Diacylglycerols are closely linked to hepatic lipid accumulation and insulin resistance [36], while alterations in BCAA metabolism have been associated with impaired hepatic mitochondrial function and metabolic dysfunction [23]. APOB reflects hepatic lipoprotein production and lipid export, and alterations in PEDF have been linked to hepatic steatosis and metabolic inflammation [27]. Together, these signals suggest potential involvement of hepatic lipid handling and insulin-resistant pathways in the observed MetS phenotype. However, as direct measures of liver function or steatosis were not available, these findings do not establish hepatic steatosis or non-alcoholic fatty liver disease (NAFLD), or metabolic dysfunction-associated steatotic liver disease (MASLD) and should be further evaluated in studies incorporating liver-specific measures.
Integration of metabolomic and proteomic signals identifies a latent cardiometabolic axis: A major strength of this study was the application of MOFA to integrate metabolomic and proteomic datasets [9]. Although Factor 1 explained the largest proportion of overall variance and Factor 2 was largely proteome-specific, Factor 1 showed the strongest association with MetS status and clearly discriminated cases from controls.
Interestingly, Factor 1 was driven predominantly by metabolomic variation, explaining approximately 20.4% of metabolomic variance compared with only 0.29% of proteomic variance. Nevertheless, the proteins contributing to this factor converged on biologically coherent pathways involved in atherogenic lipoprotein metabolism, adipose dysfunction, and inflammation. This suggests that the factor represents a biologically meaningful molecular program rather than a statistical artifact.
The metabolomic component of Factor 1 was dominated by diacylglycerols, triglyceride-related measures, and BCAA, while the proteomic component was characterized by elevated APOB, APOC4, PEDF, SAMP, and reduced adiponectin and APOF. Collectively, these molecules define a molecular continuum linking excess lipid accumulation, insulin resistance, dyslipidemia, and inflammation. Rather than representing independent disease mechanisms, our findings suggest that these processes occur as coordinated components of a shared pathophysiological axis underlying MetS. Within this axis, adipose tissue dysfunction and low-grade inflammation emerged as important molecular features.
Adipose tissue dysfunction and low-grade inflammation: Several proteins identified in both the association analyses and MOFA support the role of adipose tissue dysfunction and chronic inflammation in MetS. The strongest inverse association was observed for adiponectin, a well-established insulin-sensitizing adipokine. Reduced adiponectin levels are characteristic of visceral obesity and contribute to impaired glucose regulation, endothelial dysfunction, and inflammation [25,26,43].
Conversely, elevated levels of SAMP, C-reactive protein, complement-related proteins, and PEDF indicate activation of inflammatory pathways. Although MetS has traditionally been viewed as a metabolic disorder, increasing evidence suggests that chronic low-grade inflammation is a critical contributor to disease progression [29,44,45]. The integration of inflammatory proteins with lipid-related metabolites within Factor 1 further supports the concept of “metaflammation” as a unifying mechanism linking obesity to cardiometabolic disease [34,46].
Clinical and molecular heterogeneity within metabolic syndrome: Although MetS is defined by a relatively simple set of clinical criteria, our archetypal analysis revealed substantial clinical heterogeneity, with three archetypes representing obesity-hyperglycemic, lipid-dominant, and hypertension-dominant phenotypes. These archetypes capture clinical extremes along the MetS continuum and were associated with interpretable patterns in the core metabolomic and proteomic signatures. The obesity–hyperglycemic archetype (M1) displayed the most adverse cardiometabolic profile, characterized by higher BCAAs and several triglyceride species, reduced lysoPCs, and a proteomic pattern consistent with greater inflammatory and metabolic disturbance, including higher LBP, LG3BP, CRP, and AFAM and lower ADIPO and APOF. In contrast, the lipid-dominant archetype (M2) showed a distinct lipid-related molecular profile, including lower levels of several triglyceride species and differences in proteins related to lipid metabolism and metabolic regulation, such as ADIPO, APOF, PEDF, PSD1, NUFP2, I3L145 and AFAM. The hypertension-dominant archetype (M3) showed a predominantly blood-pressure-related profile, characterized by higher lysoPCs, lower Glu and Ile, higher APOF, APOM, HPTR, and ZA2G, and lower levels of inflammatory-related proteins including LG3BP, CRP, LBP, and AFAM. These findings reinforce the growing recognition that MetS is not a homogeneous entity. Individuals fulfilling identical diagnostic criteria may differ considerably in underlying mechanisms, risk trajectories, and potentially treatment responses. Similar heterogeneity has been observed in data-driven diabetes subclassification studies, where clinically meaningful subgroups exhibit different disease progression and complication risks [1,47,48]. Such heterogeneity may partly explain the limited success of one-size-fits-all preventive strategies.
Clinical implications: Our findings suggest that multi-omics approaches may enhance the biological characterization of MetS beyond traditional clinical definitions. The identification of latent molecular factors and distinct archetypal subgroups raises the possibility of more precise risk stratification approaches. Diacylglycerols, BCAA, adiponectin, APOB, and APOC4 emerged as candidate biomarkers that may help identify individuals with metabolically adverse forms of the syndrome before overt disease develops.
Strengths and limitations: The strengths of this study include the large population-based cohort, the comprehensive characterization of participants, the simultaneous assessment of 388 metabolites and 842 proteins, and the use of complementary analytical approaches including regression modeling, MOFA, and archetypal clustering. The integration of molecular and clinical data enabled investigation of both biological and phenotypic heterogeneity within MetS.
Several limitations should also be acknowledged. The cross-sectional design precludes causal inference and assessment of temporal relationships between molecular signatures, MetS development, and whether mixed profiles represent transitional stages toward specific archetypes. Soft clustering revealed structured phenotypic variation that was most clearly expressed at the archetypal extremes. Nevertheless, the mixed-etiology group was substantially larger and more heterogeneous, limiting its interpretation as a single clinically meaningful profile. Replication in independent cohorts is currently limited because the metabolomic and proteomic measurements in KORA FF4 were generated using newer assay kits and measurement methods that are not directly comparable with those used in the F4 study. Furthermore, although MOFA successfully identified a MetS-associated latent factor, the variance explained within the proteomic layer was relatively modest, indicating that additional omics layers may provide further biological insights. Medication data were available only as binary indicators (yes/no), limiting assessment of treatment effects. More detailed medication data will be important in future studies. ALT and AST were not available in our cohort, limiting the assessment of liver-specific clinical characteristics and potential hepatic contributions to the identified metabolic profiles.
5. Conclusions
In conclusion, integrated metabolomic and proteomic profiling revealed coordinated alterations in lipid and branched-chain amino acid metabolism, adipokine signaling, and inflammatory pathways in MetS. MOFA further identified a latent molecular factor characterized by elevated diacylglycerols, triglyceride-related metabolites, and atherogenic apolipoproteins, together with reduced adiponectin, highlighting a molecular axis associated with insulin resistance and cardiometabolic dysfunction. Furthermore, archetypal analysis of clinically MetS cases revealed three extreme clinically interpretable profiles, with selected metabolites and proteins contributing to the MOFA factor also showing significant associations with archetypal weights. These findings suggest that shared molecular signatures may underlie clinically heterogeneous MetS presentations. Overall, our results provide insight into the molecular and clinical heterogeneity of MetS and support the value of multi-omics approaches for improved characterization and future stratification of cardiometabolic risk.
Supplementary Materials
The following supporting information can be downloaded at: https://www.mdpi.com/article/10.3390/metabo16110821/s1, Figure S1: Flowchart of study participants and handling of missing data in clinical variables, proteomics and metabolomics, Supplementary Table: Supplementary Table S1: Logistic and linear regression models were used to evaluate associations between circulating metabolite levels and MetS status (n = 810). Shown are the metabolite name, metabolite class, regression coefficient (β), standard error (SE), odds ratio (OR), nominal p-value, and FDR-adjusted q-value. Supplementary Table S2: Logistic and linear regression models were used to evaluate associations between circulating protein levels and MetS status (n = 1825). Shown are the metabolite name, metabolite class, regression coefficient (β), standard error (SE), odds ratio (OR), nominal p-value, and FDR-adjusted q-value. Supplementary Table S3a: Variance explained by metabolomic, and proteomic layers across MOFA factors. Supplementary Table S3b: Omics features weights indicate the relative contribution of each metabolite to the latent factor, with larger absolute values reflecting stronger influence. Supplementary Table S3c: Factor association with MetS Cases. Supplementary Table S4: Clinical and cardiometabolic characteristics of MetS participants stratified by archetypal phenotypes. Supplementary Table S5. Association between archetype scores and metabolomic profiles using linear regression. Supplementary Table S6. Association between archetype scores and proteomic profiles using linear regression.
Author Contributions
Conceptualization, S.S. (Sapna Sharma) and H.G.; methodology, S.S. (Sapna Sharma), H.G., H.B. and A.P.; software, H.B., E.E.E., J.A. (Jonathan Adam), R.W.-S., K.S., J.A. (Jerzy Adamski), J.L., S.S. (Sabrina Schlesinger), A.C., M.W., W.K., M.V.S., A.P., H.G., and S.S. (Sapna Sharma); validation, S.S. (Sabrina Schlesinger), H.G., H.B. and A.P.; formal analysis, H.B., E.E.E., J.A. (Jonathan Adam), R.W.-S., K.S., J.A. (Jerzy Adamski), J.L., S.S. (Sabrina Schlesinger), A.C., M.W., W.K., M.V.S., H.S. and A.P.; investigation, all authors; resources, S.S. (Sabrina Schlesinger) and H.G.; data curation, J.A. (Jonathan Adam), R.W.-S., K.S., J.A. (Jerzy Adamski), J.L., S.S. (Sabrina Schlesinger), A.C., M.W., W.K., M.V.S., H.S. and A.P.; writing—original draft preparation, H.B., E.E.E., J.A. (Jonathan Adam), R.W.-S., K.S., J.A. (Jerzy Adamski), J.L., S.S. (Sabrina Schlesinger), A.C., M.W., W.K., M.V.S., A.P., H.G., and S.S. (Sapna Sharma); writing—review and editing, S.S. (Sapna Sharma), H.G., H.B. and A.P.; visualization, H.B., and S.S. (Sapna Sharma); supervision, S.S. (Sapna Sharma), H.G. and A.P.; project administration, S.S. (Sapna Sharma), H.G. and A.P. All authors contributed to the interpretation of the results. All authors have read and agreed to the published version of the manuscript.
Funding
The KORA study was initiated and financed by the Helmholtz Zentrum München—German Research Center for Environmental Health, which is funded by the German Federal Ministry of Education and Research (BMBF) and by the State of Bavaria. Data collection in the KORA study is done in cooperation with the University Hospital of Augsburg. This study is also funded by the Bavarian State Ministry of Health, Care and Prevention through the research project DigiMed Bayern (www.digimed-bayern.de). This work also was supported by the German Research Foundation (DFG) under grant number 514060894.
Institutional Review Board Statement
All investigations were conducted in accordance with the Declaration of Helsinki, and all participants provided written informed consent. Study procedures were approved by the Ethics Committee of the Bavarian Chamber of Physicians, Munich (EC No. 06068, approval date 25 October 2012).
Informed Consent Statement
Informed consent was obtained from all subjects involved in the study.
Data Availability Statement
Access to the molecular and clinical raw data, as well as the processed data, is restricted. This is in accordance with the informed consent provided by study participants, the various national ethical approvals obtained for the study, and compliance with the European General Data Protection Regulation (GDPR). Individual-level clinical and molecular data cannot be transferred from the KORA repository. Requests for access will receive guidance on accessing data through the KORA secure analysis platform (https://helmholtz-muenchen.managed-otrs.com/external/, accessed on 30 May 2026) after submit-ting an appropriate application.
Acknowledgments
This work is dedicated to the memory of my late supervisor, Christian Gieger, whose guidance, kindness, encouragement, and scientific insight profoundly shaped this research and continue to inspire my academic journey. We also thank all participants for their long-term commitment to the KORA study, the staff for data collection and research data management and the members of the KORA Study Group (https://www.helmholtz-munich.de/en/epi/cohort/kora, accessed on 30 May 2026) who are responsible for the design and conduct of the study. We also thank the members of the AME MEDART group at Helmholtz Zentrum München-German Research Center for Environmental Health for their extensive support.
Conflicts of Interest
The authors declare no conflicts of interest.
Abbreviations
| ADIPO | Adiponectin |
| AFAM | Afamin |
| APOB | Apolipoprotein B |
| APOC4 | Apolipoprotein C-IV |
| APOD | Apolipoprotein D |
| APOE | Apolipoprotein E |
| APOF | Apolipoprotein F |
| APOM | Apolipoprotein M |
| ARI | Adjusted Rand Index |
| BMI | Body Mass Index |
| BCAA | Branched-chain amino acid |
| OPSB | Opsin B |
| CAH1 | Carbonic anhydrase 1 |
| CC150 | Coiled-coil domain-containing protein 150 |
| CE | Cholesteryl esters |
| CO3 | Complement C3 |
| CRP | C-reactive protein |
| CV | Coefficient of Variation |
| DBP | Diastolic Blood Pressure |
| DG | Diglycerides |
| FA83H | Protein FAM83H |
| FA9 | Coagulation factor IX |
| FDR | False Discovery Rate |
| GPC1 | Glypican 1 |
| GNAZ | G protein subunit alpha z |
| HbA1c | Glycated Hemoglobin A1c |
| HOMA2-B | Homeostasis Model Assessment of Beta Cell Function |
| HOMA2-IR | Homeostasis Model Assessment of Insulin Resistance |
| HOMA2-S | Homeostasis Model Assessment of Insulin Sensitivity |
| HPTR | Haptoglobin-Related Protein |
| hsCRP | High Sensitivity C-Reactive Protein |
| I3L145/SHBG | Sex Hormone-Binding Globulin |
| IDF | International Diabetes Federation |
| IFT46 | Intraflagellar Transport Protein 46 Homolog |
| IMI-DIRECT | Innovative Medicines Initiative—Diabetes Research on Patient Stratification |
| INT | Inverse-Normal Transformation |
| K7ER74 | Apolipoprotein C-II |
| KORA | Cooperative Health Research in the Region of Augsburg |
| LBP | Lipopolysaccharide-Binding Protein |
| LC-MS | Liquid Chromatography–Mass Spectrometry |
| LG3BP | Galectin-3-Binding Protein |
| LOD | Limit of Detection |
| LPS | Lipopolysaccharide |
| LysoPC | Lysophosphatidylcholines |
| LysoPE | Lysophosphatidylethanolamine |
| MetS | Metabolic Syndrome |
| NUFP2 | FMR1-Interacting Protein NUFIP2 |
| PC | Phosphatidylcholines |
| PCA | Principal Component Analysis |
| PEDF | Pigment Epithelium-Derived Factor |
| PSD1 | PH and SEC7 domain-containing protein 1 |
| QC | Quality Control |
| QUICKI | Quantitative Insulin Sensitivity Check Index |
| RSS | Residual Sum of Squares |
| SAMP | Serum Amyloid P-Component |
| SBP | Systolic Blood Pressure |
| SM | Sphingomyelins |
| TG | Triglycerides |
| WHR | Waist-Hip Ratio |
| ZA2G | Zinc-Alpha-2-Glycoprotein |
Appendix A. Methods
As shown in the flowchart (Figure S1), 28 clinical variables were used in this study. The KORA FF4 cohort initially comprised 2279 individuals. Participants with missing values were excluded (n = 358), and the pattern of missing data is illustrated in the flowchart (Figure S1). After data cleaning, 1921 participants remained, of whom 582 were classified as having MetS and 1339 as controls according to the IDF 2009 definition (Figure S1).
Continuous variables included age, weight, height, Body Mass Index (BMI), Waist-Hip-Ratio (WHR), HbA1c, hsCRP, 2 h insulin, fasting serum insulin, fasting glucose, 2 h glucose, HOMA2-IR, HOMA2-B, HOMA2-S, Quantitative Insulin Sensitivity Check Index (QUICKI), total cholesterol, creatinine, triglycerides (TG), High-Density Lipoprotein (HDL), Low-Density Lipoprotein (LDL), systolic blood pressure (SBP), and diastolic blood pressure (DBP). Categorical variables included sex, Obesity based on BMI categories, WHR categories, hypertension status, metabolic syndrome status, and diabetes status.
Definition of homeostasis model
Insulin resistance, beta cell function, and insulin sensitivity were estimated using the Homeostasis Model Assessment 2 (HOMA2). HOMA2-IR, HOMA2-B, and HOMA2-S were calculated from fasting glucose and fasting insulin values using the HOMA2 Calculator (version 2.2.3; Diabetes Trials Unit, University of Oxford, Oxford, UK [49].
Definition of categorical variables
BMI categories (WHO): According to the World Health Organization (WHO), body mass index (BMI) was categorized as underweight (<18.5 kg/m2), normal weight (≥18.5–<25 kg/m2), overweight (≥25–<30 kg/m2), obese, grade 1 (≥30–<35 kg/m2), obese, grade 2 (≥35–<40 kg/m2), obese, grade 3 (≥40 kg/m2) [50].
WHR categories: Waist-to-hip ratio (WHR) was classified as elevated when up = Men >= 1(m/m)/Women >= 0.85(m/m), down = Men < 1(m/m)/Women < 0.85(m/m).
Hypertension status (WHO): Hypertension status was classified following WHO 1999 criteria as optimal (<120/80 mmHg), normal (≥120/80–<130/85 mmHg), high normal (≥130/85–<140/90 mmHg), Hyp.grade 1 (≥140/90–<160/100 mmHg), Hyp.Grade 2 (≥160/100–<180/110 mmHg), Hyp.Grade 3 (≥180/110 mmHg) [51].
Diabetes status (WHO): Diabetes status was determined using the 1999/2006 WHO criteria, classifying individuals as normoglycaemic (fasting glucose <6.1 mmol/L and 2 h glucose <7.8 mmol/L), prediabetic [isolated impaired fasting glucose (IFG): fasting glucose 6.1–6.9 mmol/L and 2 h glucose <7.8 mmol/L; isolated impaired glucose tolerance (IGT): fasting glucose <6.1 mmol/L and 2 h glucose 7.8–11.0 mmol/L; or combined IFG and IGT], or newly diagnosed diabetes (fasting glucose ≥7.0 mmol/L or 2 h glucose ≥11.1 mmol/L) [52].
References
- Lim, A.M.W.; Lim, E.U.; Chen, P.L.; Fann, C.S.J. Unsupervised Clustering Identified Clinically Relevant Metabolic Syndrome Endotypes in UK and Taiwan Biobanks. iScience 2024, 27, 109815. [Google Scholar] [CrossRef] [Scilit] [PubMed]
- Neeland, I.J.; Lim, S.; Tchernof, A.; Gastaldelli, A.; Rangaswami, J.; Ndumele, C.E.; Powell-Wiley, T.M.; Despres, J.P. Metabolic Syndrome. Nat. Rev. Dis. Primers 2024, 10, 77. [Google Scholar] [CrossRef] [Scilit] [PubMed]
- Alberti, K.G.M.M.; Eckel, R.H.; Grundy, S.M.; Zimmet, P.Z.; Cleeman, J.I.; Donato, K.A.; Fruchart, J.C.; James, W.P.T.; Loria, C.M.; Smith, S.C. Harmonizing the Metabolic Syndrome: A Joint Interim Statement of the International Diabetes Federation Task Force on Epidemiology and Prevention; National Heart, Lung, and Blood Institute; American Heart Association; World Heart Federation; International Atherosclerosis Society; And International Association for the Study of Obesity. Circulation 2009, 120, 1640–1645. [Google Scholar] [CrossRef] [Scilit] [PubMed]
- Eckel, R.H.; Grundy, S.M.; Zimmet, P.Z. The Metabolic Syndrome. Lancet 2005, 365, 1415–1428. [Google Scholar] [PubMed]
- Cornier, M.A.; Dabelea, D.; Hernandez, T.L.; Lindstrom, R.C.; Steig, A.J.; Stob, N.R.; Van Pelt, R.E.; Wang, H.; Eckel, R.H. The Metabolic Syndrome. Endocr. Rev. 2008, 29, 777–822. [Google Scholar] [CrossRef] [Scilit] [PubMed]
- Monnerie, S.; Comte, B.; Ziegler, D.; Morais, J.A.; Pujos-Guillot, E.; Gaudreau, P. Metabolomic and Lipidomic Signatures of Metabolic Syndrome and Its Physiological Components in Adults: A Systematic Review. Sci. Rep. 2020, 10, 669. [Google Scholar] [CrossRef] [Scilit] [PubMed]
- Wu, Q.; Li, J.; Sun, X.; He, D.; Cheng, Z.; Li, J.; Zhang, X.; Xie, Y.; Zhu, Y.; Lai, M. Multi-Stage Metabolomics and Genetic Analyses Identified Metabolite Biomarkers of Metabolic Syndrome and Their Genetic Determinants. EBioMedicine 2021, 74, 103707. [Google Scholar] [CrossRef] [Scilit] [PubMed]
- Chen, M.; Yang, Z.; Gan, H.; Wang, Y.; Li, C.; Gao, Y. Investigation into Potential Mechanisms of Metabolic Syndrome by Integrative Analysis of Metabolomics and Proteomics. PLoS ONE 2022, 17, e0270593. [Google Scholar] [CrossRef] [Scilit] [PubMed]
- Argelaguet, R.; Velten, B.; Arnol, D.; Dietrich, S.; Zenz, T.; Marioni, J.C.; Buettner, F.; Huber, W.; Stegle, O. Multi-Omics Factor Analysis-a Framework for Unsupervised Integration of Multi-Omics Data Sets. Mol. Syst. Biol. 2018, 14, e8124. [Google Scholar] [CrossRef] [Scilit] [PubMed]
- Ahlqvist, E.; Storm, P.; Karajamaki, A.; Martinell, M.; Dorkhan, M.; Carlsson, A.; Vikman, P.; Prasad, R.B.; Aly, D.M.; Almgren, P.; et al. Novel Subgroups of Adult-Onset Diabetes and Their Association with Outcomes: A Data-Driven Cluster Analysis of Six Variables. Lancet Diabetes Endocrinol. 2018, 6, 361–369. [Google Scholar] [CrossRef] [Scilit] [PubMed]
- Hwang, Y.-C.; Ahn, H.-Y.; Jun, J.E.; Jeong, I.-K.; Ahn, K.J.; Chung, H.Y. Subtypes of Type 2 Diabetes and Their Association with Outcomes in Korean Adults-a Cluster Analysis of Community-Based Prospective Cohort. Metabolism 2023, 141, 155514. [Google Scholar] [CrossRef] [Scilit] [PubMed]
- Xue, Q.; Li, X.; Wang, X.; Ma, H.; Heianza, Y.; Qi, L. Subtypes of Type 2 Diabetes and Incident Cardiovascular Disease Risk: UK Biobank and All of Us Cohorts. In Proceedings of the Mayo Clinic Proceedings; Elsevier: Amsterdam, The Netherlands, 2023; Volume 98, pp. 1192–1204. [Google Scholar]
- Eugster, M.J.A.; Leisch, F. Weighted and Robust Archetypal Analysis. Comput. Stat. Data Anal. 2011, 55, 1215–1225. [Google Scholar] [CrossRef] [Scilit]
- Linkohr, B.; Heier, M.; Gieger, C.; Thorand, B.; Grallert, H.; Holle, R.; Karrasch, S.; Koenig, W.; Ladwig, K.H.; Laxy, M.; et al. Cohort Profile: Cooperative Health Research in the Region of Augsburg (KORA) 1984–2024. Int. J. Epidemiol. 2025, 54. [Google Scholar] [CrossRef] [Scilit] [PubMed]
- Wesolowska-Andersen, A.; Brorsson, C.A.; Bizzotto, R.; Mari, A.; Tura, A.; Koivula, R.; Mahajan, A.; Vinuela, A.; Tajes, J.F.; Sharma, S.; et al. Four Groups of Type 2 Diabetes Contribute to the Etiological and Clinical Heterogeneity in Newly Diagnosed Individuals: An IMI DIRECT Study. Cell Rep. Med. 2022, 3, 100477. [Google Scholar] [CrossRef] [Scilit] [PubMed]
- Geyer, P.E.; Kulak, N.A.; Pichler, G.; Holdt, L.M.; Teupser, D.; Mann, M. Plasma Proteome Profiling to Assess Human Health and Disease. Cell Syst. 2016, 2, 185–195. [Google Scholar] [CrossRef] [Scilit] [PubMed]
- Wei, R.; Wang, J.; Jia, E.; Chen, T.; Ni, Y.; Jia, W. GSimp: A Gibbs Sampler Based Left-Censored Missing Value Imputation Approach for Metabolomics Studies. PLoS Comput. Biol. 2018, 14, e1005973. [Google Scholar] [CrossRef] [Scilit] [PubMed]
- Consortium, U. UniProt: A Worldwide Hub of Protein Knowledge. Nucleic Acids Res. 2019, 47, D506–D515. [Google Scholar] [CrossRef] [Scilit] [PubMed]
- Zararsiz, G.E.; Lintelmann, J.; Cecil, A.; Kirwan, J.; Poschet, G.; Gegner, H.M.; Schuchardt, S.; Guan, X.L.; Saigusa, D.; Wishart, D. Interlaboratory Comparison of Standardised Metabolomics and Lipidomics Analyses in Human and Rodent Blood Using the MxP® Quant 500 Kit. bioRxiv 2024. [Google Scholar] [CrossRef] [Scilit] [PubMed]
- Han, S.; Huang, J.; Foppiano, F.; Prehn, C.; Adamski, J.; Suhre, K.; Li, Y.; Matullo, G.; Schliess, F.; Gieger, C. TIGER: Technical Variation Elimination for Metabolomics Data Using Ensemble Learning Architecture. Brief. Bioinform. 2022, 23, bbab535. [Google Scholar] [CrossRef] [Scilit] [PubMed]
- Shi, M.; Han, S.; Klier, K.; Fobo, G.; Montrone, C.; Yu, S.; Harada, M.; Henning, A.-K.; Friedrich, N.; Bahls, M. Identification of Candidate Metabolite Biomarkers for Metabolic Syndrome and Its Five Components in Population-Based Human Cohorts. Cardiovasc. Diabetol. 2023, 22, 141. [Google Scholar] [CrossRef] [Scilit] [PubMed]
- Erion, D.M.; Shulman, G.I. Diacylglycerol-Mediated Insulin Resistance. Nat. Med. 2010, 16, 400–402. [Google Scholar] [CrossRef] [Scilit] [PubMed]
- Lo, E.K.K.; Felicianna; Xu, J.-H.; Zhan, Q.; Zeng, Z.; El-Nezami, H. The Emerging Role of Branched-Chain Amino Acids in Liver Diseases. Biomedicines 2022, 10, 1444. [Google Scholar] [CrossRef] [Scilit] [PubMed]
- Zhao, X.; Han, Q.; Liu, Y.; Sun, C.; Gang, X.; Wang, G. The Relationship between Branched-Chain Amino Acid Related Metabolomic Signature and Insulin Resistance: A Systematic Review. J. Diabetes Res. 2016, 2016, 2794591. [Google Scholar] [CrossRef] [Scilit] [PubMed]
- Blazejewska, W.; Dabrowska, J.; Michalowska, J.; Bogdanski, P. The Role of Adiponectin and ADIPOQ Variation in Metabolic Syndrome: A Narrative Review. Genes 2025, 16, 699. [Google Scholar] [CrossRef] [Scilit] [PubMed]
- Clemente-Suarez, V.J.; Redondo-Florez, L.; Beltran-Velasco, A.I.; Martin-Rodriguez, A.; Martinez-Guardado, I.; Navarro-Jimenez, E.; Laborde-Cardenas, C.C.; Tornero-Aguilera, J.F. The Role of Adipokines in Health and Disease. Biomedicines 2023, 11, 1290. [Google Scholar] [CrossRef] [Scilit] [PubMed]
- Shinozaki, K.; Honda, T.; Yamaji, K.; Nishijima, E.; Ichi, I.; Yamane, D. Impaired ApoB Secretion Triggers Enhanced Secretion of ApoE to Maintain Triglyceride Homeostasis in Hepatoma Cells. J. Lipid Res. 2025, 66, 100795. [Google Scholar] [CrossRef] [Scilit] [PubMed]
- Hsu, C.-C.; Kanter, J.E.; Kothari, V.; Bornfeldt, K.E. Quartet of APOCs and the Different Roles They Play in Diabetes. Arterioscler. Thromb. Vasc. Biol. 2023, 43, 1124–1133. [Google Scholar] [CrossRef] [Scilit] [PubMed]
- Jakobsen, T.S.; Adsersen, R.L.; Askou, A.L.; Corydon, T.J. Functional Roles of Pigment Epithelium-Derived Factor in Retinal Degenerative and Vascular Disorders: A Scoping Review. Investig. Ophthalmol. Vis. Sci. 2024, 65, 41. [Google Scholar] [CrossRef] [Scilit] [PubMed]
- Yu, S.; Han, S.; Shi, M.; Harada, M.; Ge, J.; Li, X.; Cai, X.; Heier, M.; Karstenmuller, G.; Suhre, K.; et al. Prediction of Myocardial Infarction Using a Combined Generative Adversarial Network Model and Feature-Enhanced Loss Function. Metabolites 2024, 14, 258. [Google Scholar] [CrossRef] [Scilit] [PubMed]
- Yu, Z.; Zhai, G.; Singmann, P.; He, Y.; Xu, T.; Prehn, C.; Romisch-Margl, W.; Lattka, E.; Gieger, C.; Soranzo, N.; et al. Human Serum Metabolic Profiles Are Age Dependent. Aging Cell 2012, 11, 960–967. [Google Scholar] [CrossRef] [Scilit] [PubMed]
- Cai, X.; Xue, Z.; Zeng, F.F.; Tang, J.; Yue, L.; Wang, B.; Ge, W.; Xie, Y.; Miao, Z.; Gou, W.; et al. Population Serum Proteomics Uncovers a Prognostic Protein Classifier for Metabolic Syndrome. Cell Rep. Med. 2023, 4, 101172. [Google Scholar] [CrossRef] [Scilit] [PubMed]
- Zaghlool, S.B.; Sharma, S.; Molnar, M.; Matias-Garcia, P.R.; Elhadad, M.A.; Waldenberger, M.; Peters, A.; Rathmann, W.; Graumann, J.; Gieger, C.; et al. Revealing the Role of the Human Blood Plasma Proteome in Obesity Using Genetic Drivers. Nat. Commun. 2021, 12, 1279. [Google Scholar] [CrossRef] [Scilit] [PubMed]
- Dong, Q.; Sidra, S.; Gieger, C.; Wang-Sattler, R.; Rathmann, W.; Prehn, C.; Adamski, J.; Koenig, W.; Peters, A.; Grallert, H.; et al. Metabolic Signatures Elucidate the Effect of Body Mass Index on Type 2 Diabetes. Metabolites 2023, 13, 227. [Google Scholar] [CrossRef] [Scilit] [PubMed]
- Bergman, B.C.; Hunerdosse, D.M.; Kerege, A.; Playdon, M.C.; Perreault, L. Localisation and Composition of Skeletal Muscle Diacylglycerol Predicts Insulin Resistance in Humans. Diabetologia 2012, 55, 1140–1150. [Google Scholar] [CrossRef] [Scilit] [PubMed]
- Petersen, M.C.; Shulman, G.I. Roles of Diacylglycerols and Ceramides in Hepatic Insulin Resistance. Trends Pharmacol. Sci. 2017, 38, 649–665. [Google Scholar] [CrossRef] [Scilit] [PubMed]
- Luciani, L.; Pedrelli, M.; Parini, P. Modification of Lipoprotein Metabolism and Function Driving Atherogenesis in Diabetes. Atherosclerosis 2024, 394, 117545. [Google Scholar] [CrossRef] [Scilit] [PubMed]
- Gugliucci, A. Triglyceride-Rich Lipoprotein Metabolism: Key Regulators of Their Flux. J. Clin. Med. 2023, 12, 4399. [Google Scholar] [CrossRef] [Scilit] [PubMed]
- Ling, Z.N.; Jiang, Y.F.; Ru, J.N.; Lu, J.H.; Ding, B.; Wu, J. Amino Acid Metabolism in Health and Disease. Signal Transduct. Target. Ther. 2023, 8, 345. [Google Scholar] [CrossRef] [Scilit] [PubMed]
- Wang-Sattler, R.; Yu, Z.; Herder, C.; Messias, A.C.; Floegel, A.; He, Y.; Heim, K.; Campillos, M.; Holzapfel, C.; Thorand, B.; et al. Novel Biomarkers for Pre-Diabetes Identified by Metabolomics. Mol. Syst. Biol. 2012, 8, 615. [Google Scholar] [CrossRef] [Scilit] [PubMed]
- Sharma, S.; Dong, Q.; Haid, M.; Adam, J.; Bizzotto, R.; Fernandez-Tajes, J.J.; Jones, A.G.; Tura, A.; Artati, A.; Prehn, C. Role of Human Plasma Metabolites in Prediabetes and Type 2 Diabetes from the IMI-DIRECT Study. Diabetologia 2024, 67, 2804–2818. [Google Scholar] [CrossRef] [Scilit] [PubMed]
- Sun, S.; He, D.; Luo, C.; Lin, X.; Wu, J.; Yin, X.; Jia, C.; Pan, Q.; Dong, X.; Zheng, F.; et al. Metabolic Syndrome and Its Components Are Associated with Altered Amino Acid Profile in Chinese Han Population. Front. Endocrinol. 2021, 12, 795044. [Google Scholar] [CrossRef] [Scilit] [PubMed]
- Frankenberg, A.D.V.; Reis, A.F.; Gerchman, F. Relationships between Adiponectin Levels, the Metabolic Syndrome, and Type 2 Diabetes: A Literature Review. Arch. Endocrinol. Metab. 2017, 61, 614–622. [Google Scholar] [CrossRef] [Scilit] [PubMed]
- Hamooya, B.M.; Siame, L.; Muchaili, L.; Masenga, S.K.; Kirabo, A. Metabolic Syndrome: Epidemiology, Mechanisms, and Current Therapeutic Approaches. Front. Nutr. 2025, 12, 1661603. [Google Scholar] [CrossRef] [Scilit] [PubMed]
- Wang, H.; Nie, Y.; Sun, Z.; He, Y.; Yang, J. Serum Amyloid P Component: Structure, Biological Activity, and Application in Diagnosis and Treatment of Immune-Associated Diseases. Mol. Immunol. 2024, 172, 1–8. [Google Scholar] [CrossRef] [Scilit] [PubMed]
- Schleh, M.W.; Caslin, H.L.; Garcia, J.N.; Mashayekhi, M.; Srivastava, G.; Bradley, A.B.; Hasty, A.H. Metaflammation in Obesity and Its Therapeutic Targeting. Sci. Transl. Med. 2023, 15, eadf9382. [Google Scholar] [CrossRef] [Scilit] [PubMed]
- Gudmundsdottir, V.; Pedersen, H.K.; Mazzoni, G.; Allin, K.H.; Artati, A.; Beulens, J.W.; Banasik, K.; Brorsson, C.; Cederberg, H.; Chabanova, E.; et al. Whole Blood Co-Expression Modules Associate with Metabolic Traits and Type 2 Diabetes: An IMI-DIRECT Study. Genome Med. 2020, 12, 109. [Google Scholar] [CrossRef] [Scilit] [PubMed]
- Onthoni, D.D.; Chen, Y.-E.; Lai, Y.-H.; Li, G.-H.; Zhuang, Y.-S.; Lin, H.-M.; Hsiao, Y.-P.; Onthoni, A.I.; Chiou, H.-Y.; Chung, R.-H. Clustering-Based Risk Stratification of Prediabetes Populations: Insights from the Taiwan and UK Biobanks. J. Diabetes Investig. 2025, 16, 25–35. [Google Scholar] [CrossRef] [Scilit] [PubMed]
- Kristensen, F.P.B.; Christensen, D.H.; Callaghan, B.C.; Stidsen, J.V.; Nielsen, J.S.; Højlund, K.; Beck-Nielsen, H.; Jensen, T.S.; Andersen, H.; Vestergaard, P. The Prevalence of Polyneuropathy in Type 2 Diabetes Subgroups Based on HOMA2 Indices of β-Cell Function and Insulin Sensitivity. Diabetes Care 2023, 46, 1546–1555. [Google Scholar] [CrossRef] [Scilit] [PubMed]
- World Health Organization Consultation. Obesity: Preventing and Managing the Global Epidemic. World Health Organ. Tech. Rep. Ser. 2000, 894, 1–253. [Google Scholar]
- Guideline, S. 1999 World Health Organization-International Society of Hypertension Guidelines for the Management of Hypertension. J. Hypertens. 1999, 17, 151. [Google Scholar] [CrossRef] [Scilit]
- World Health Organization (WHO). Diabetes Programme. Definition and Diagnosis of Diabetes Mellitus and Intermediate Hyperglycaemia. Report of a WHO/IDF Consultation. References—Scientific Research Publishing. 2006. Available online: https://www.scirp.org/reference/ReferencesPapers?ReferenceID=1959074 (accessed on 18 February 2026).
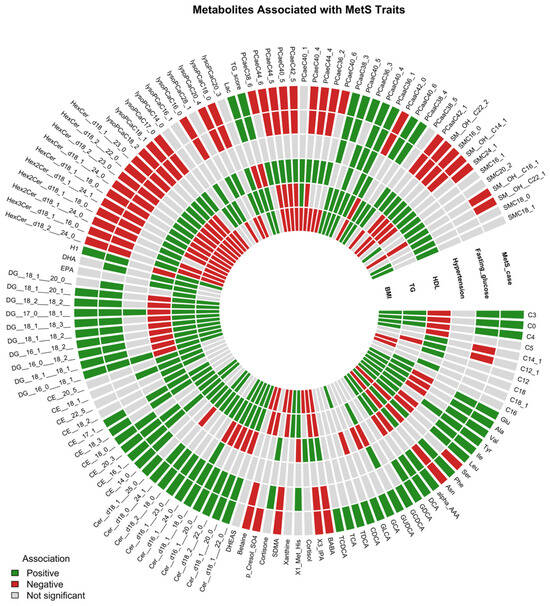
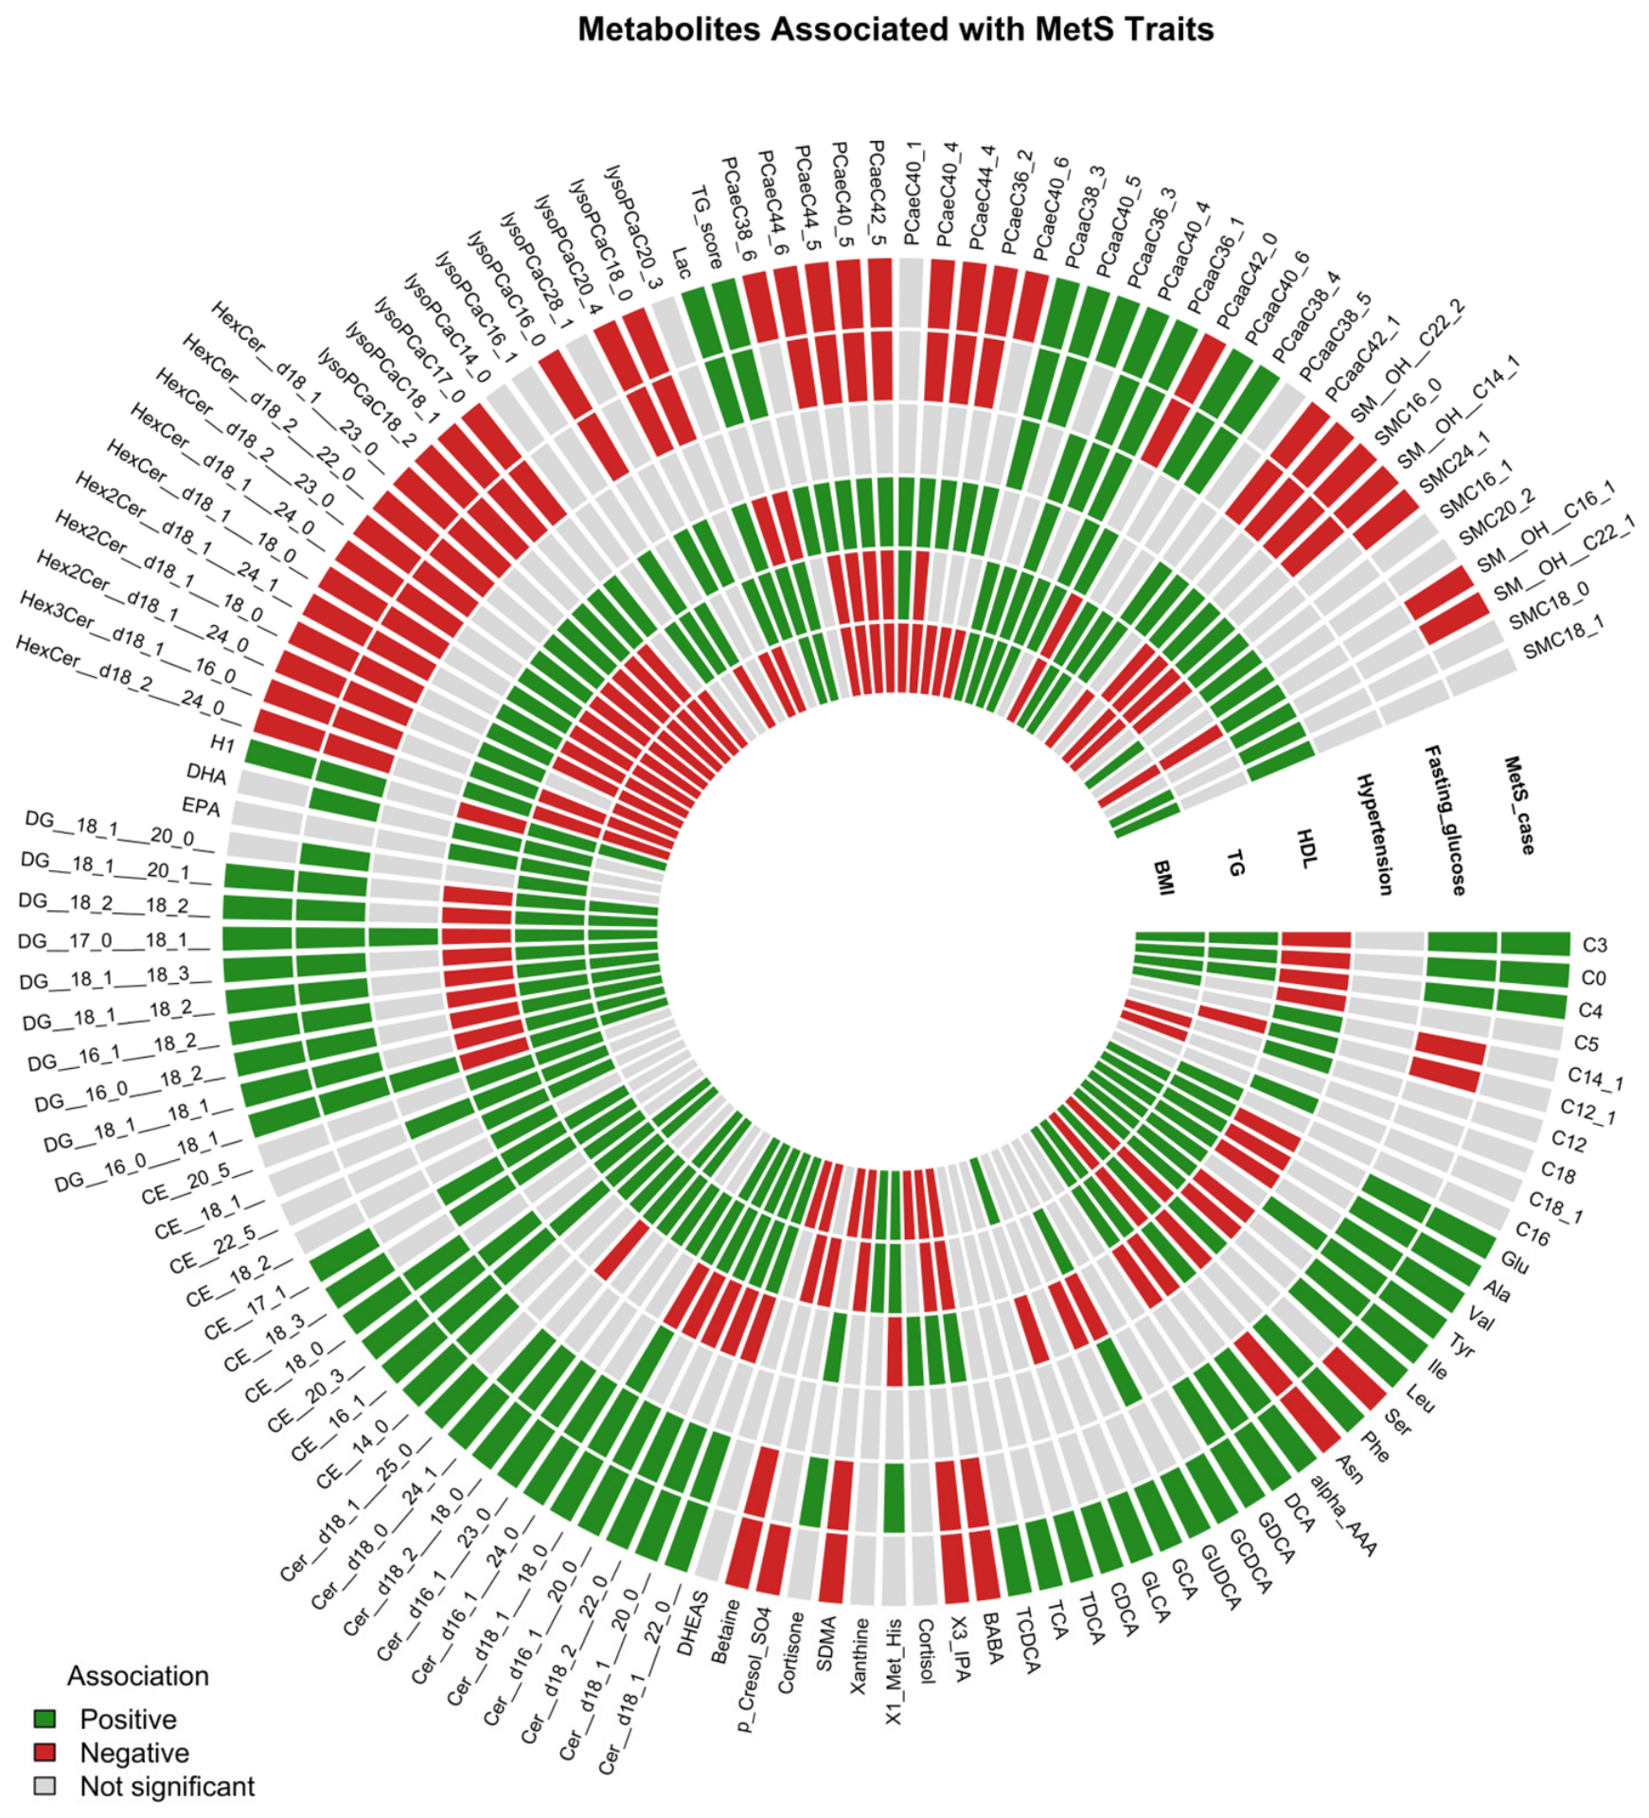
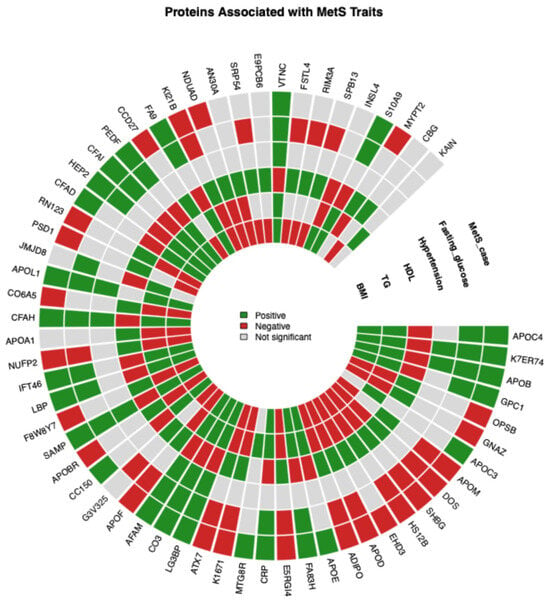
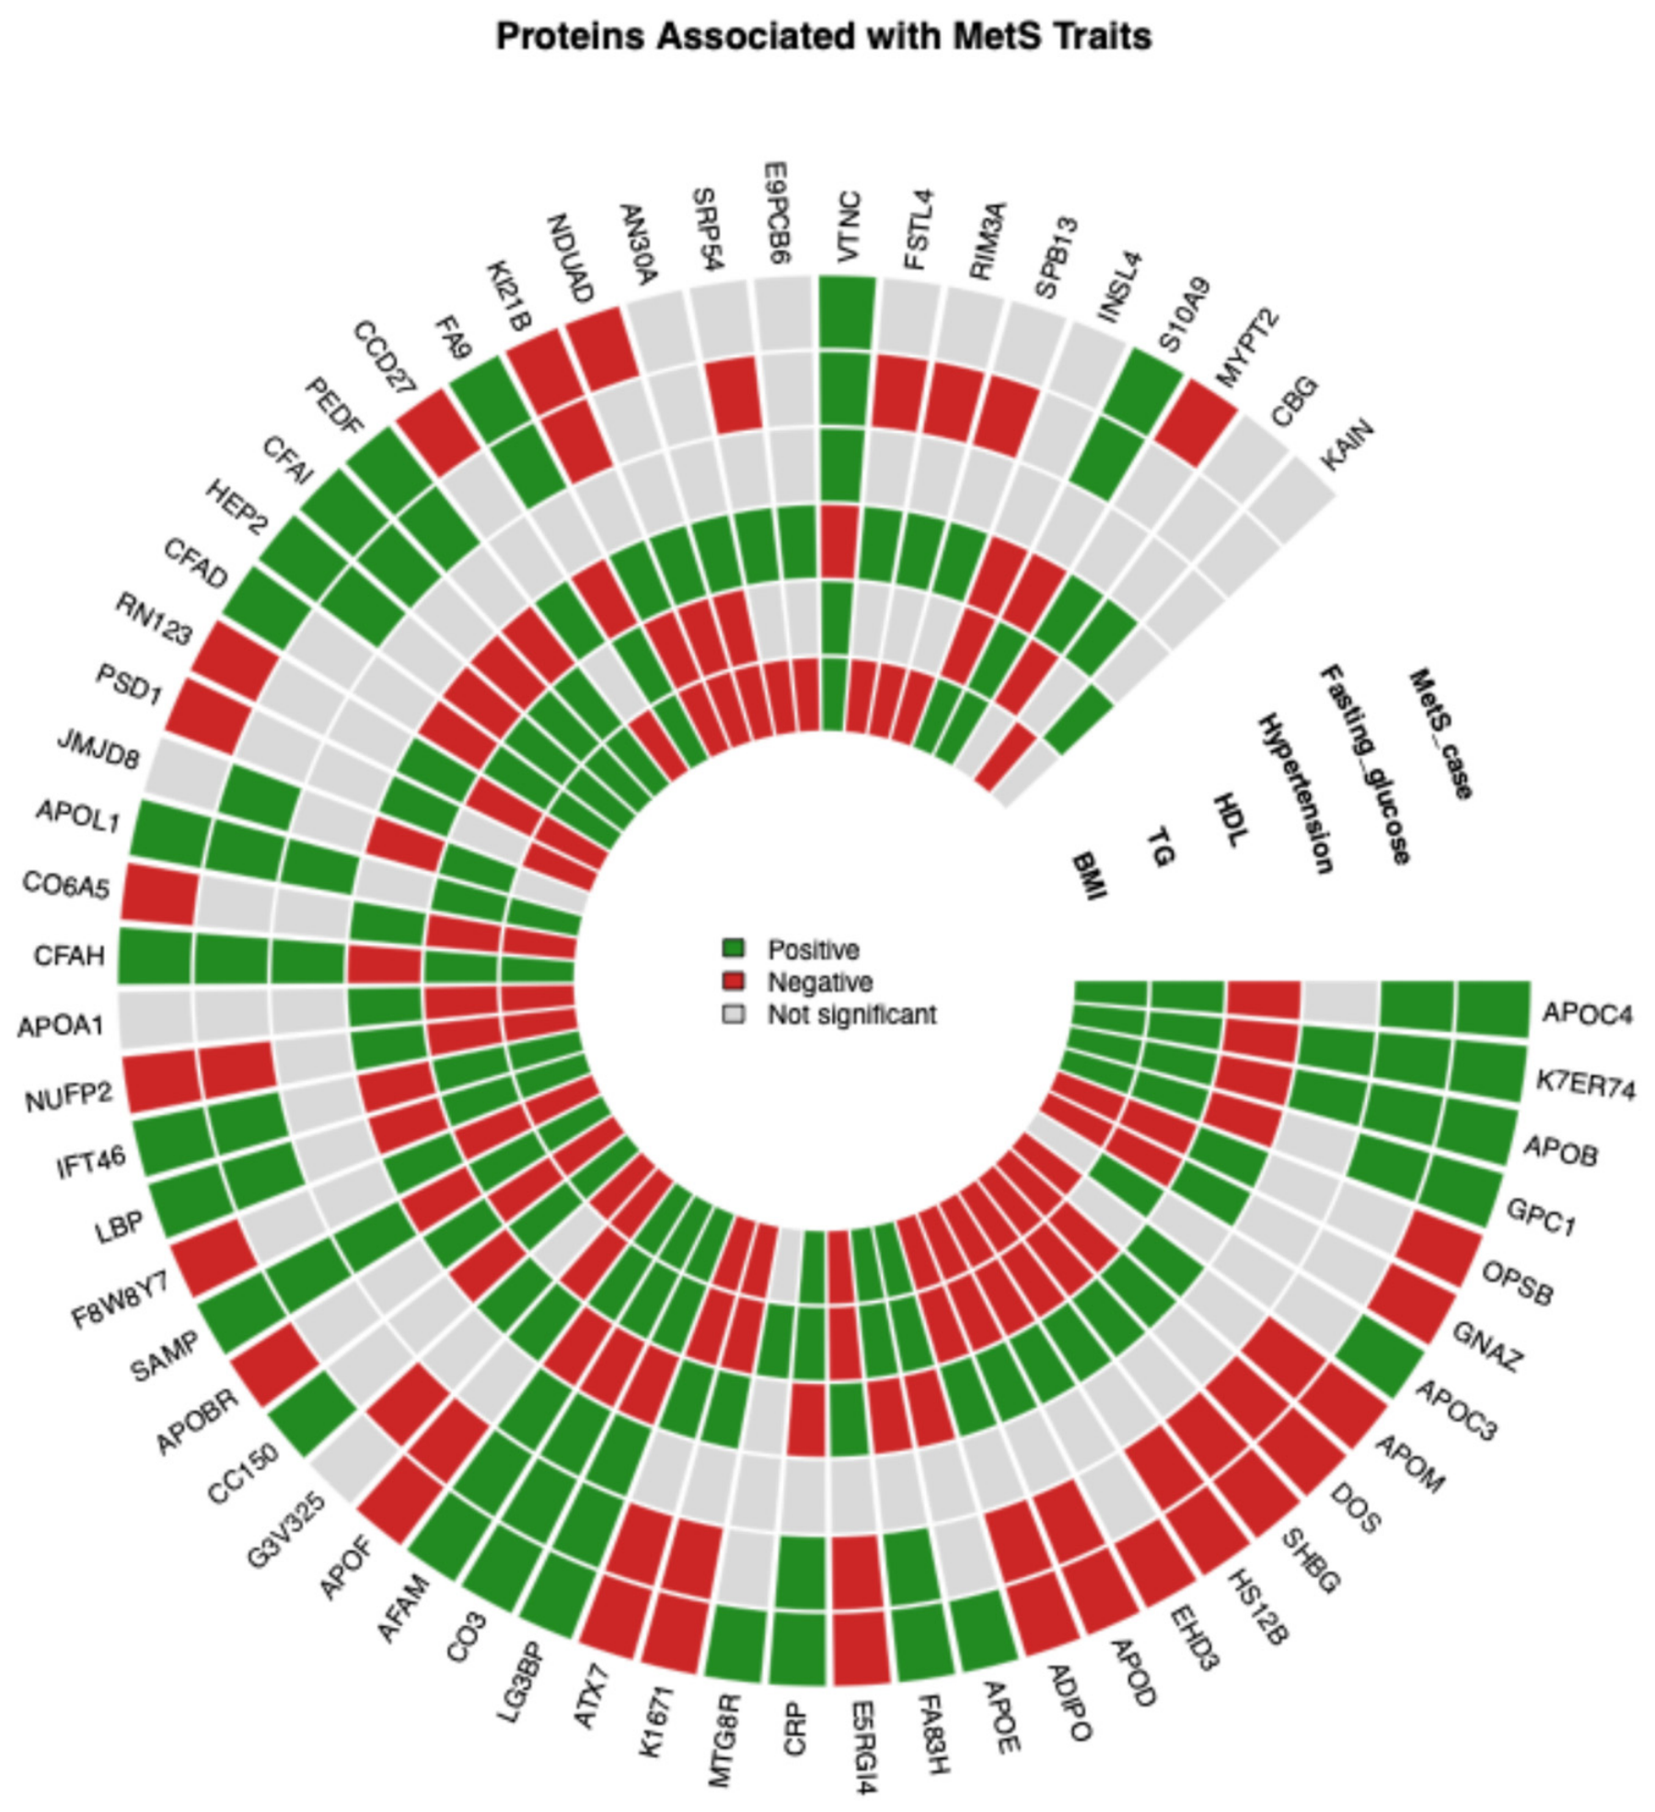
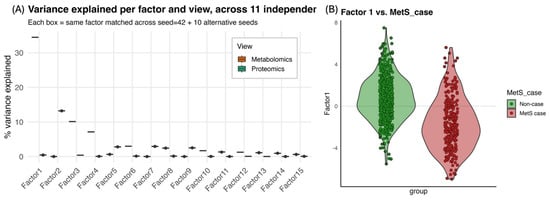
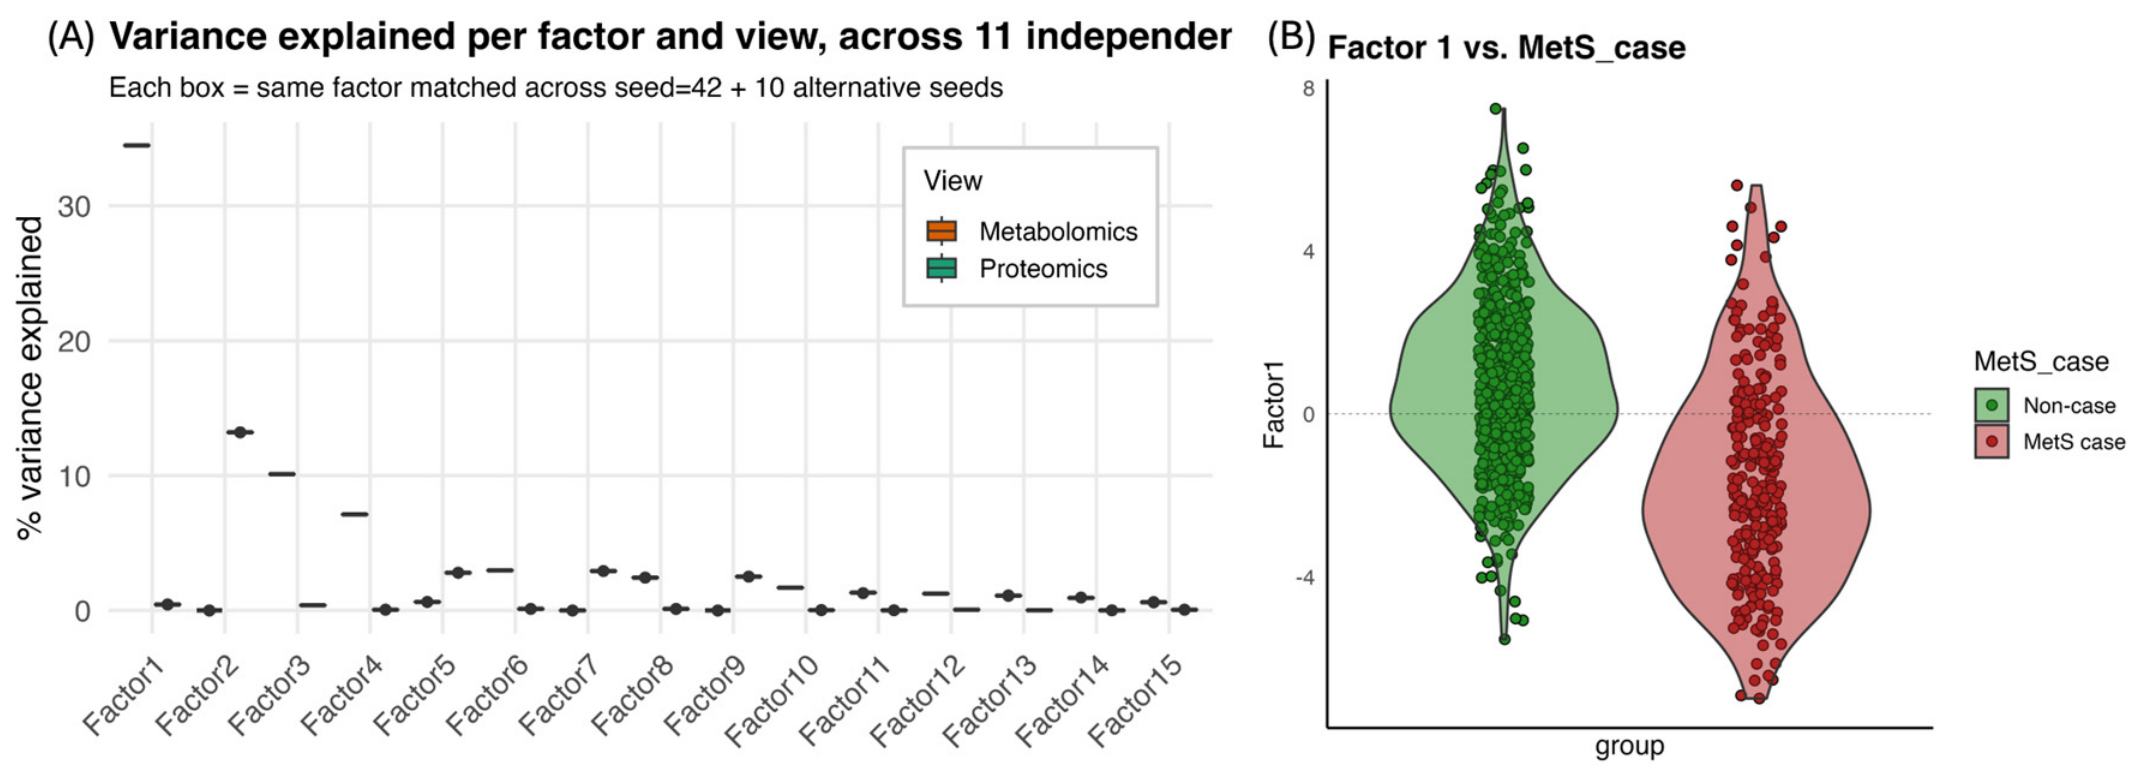
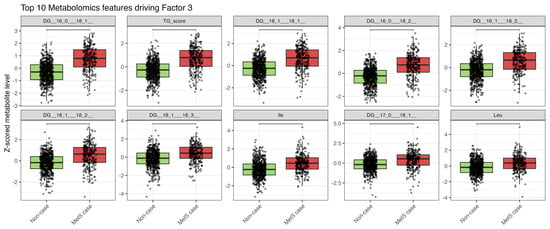
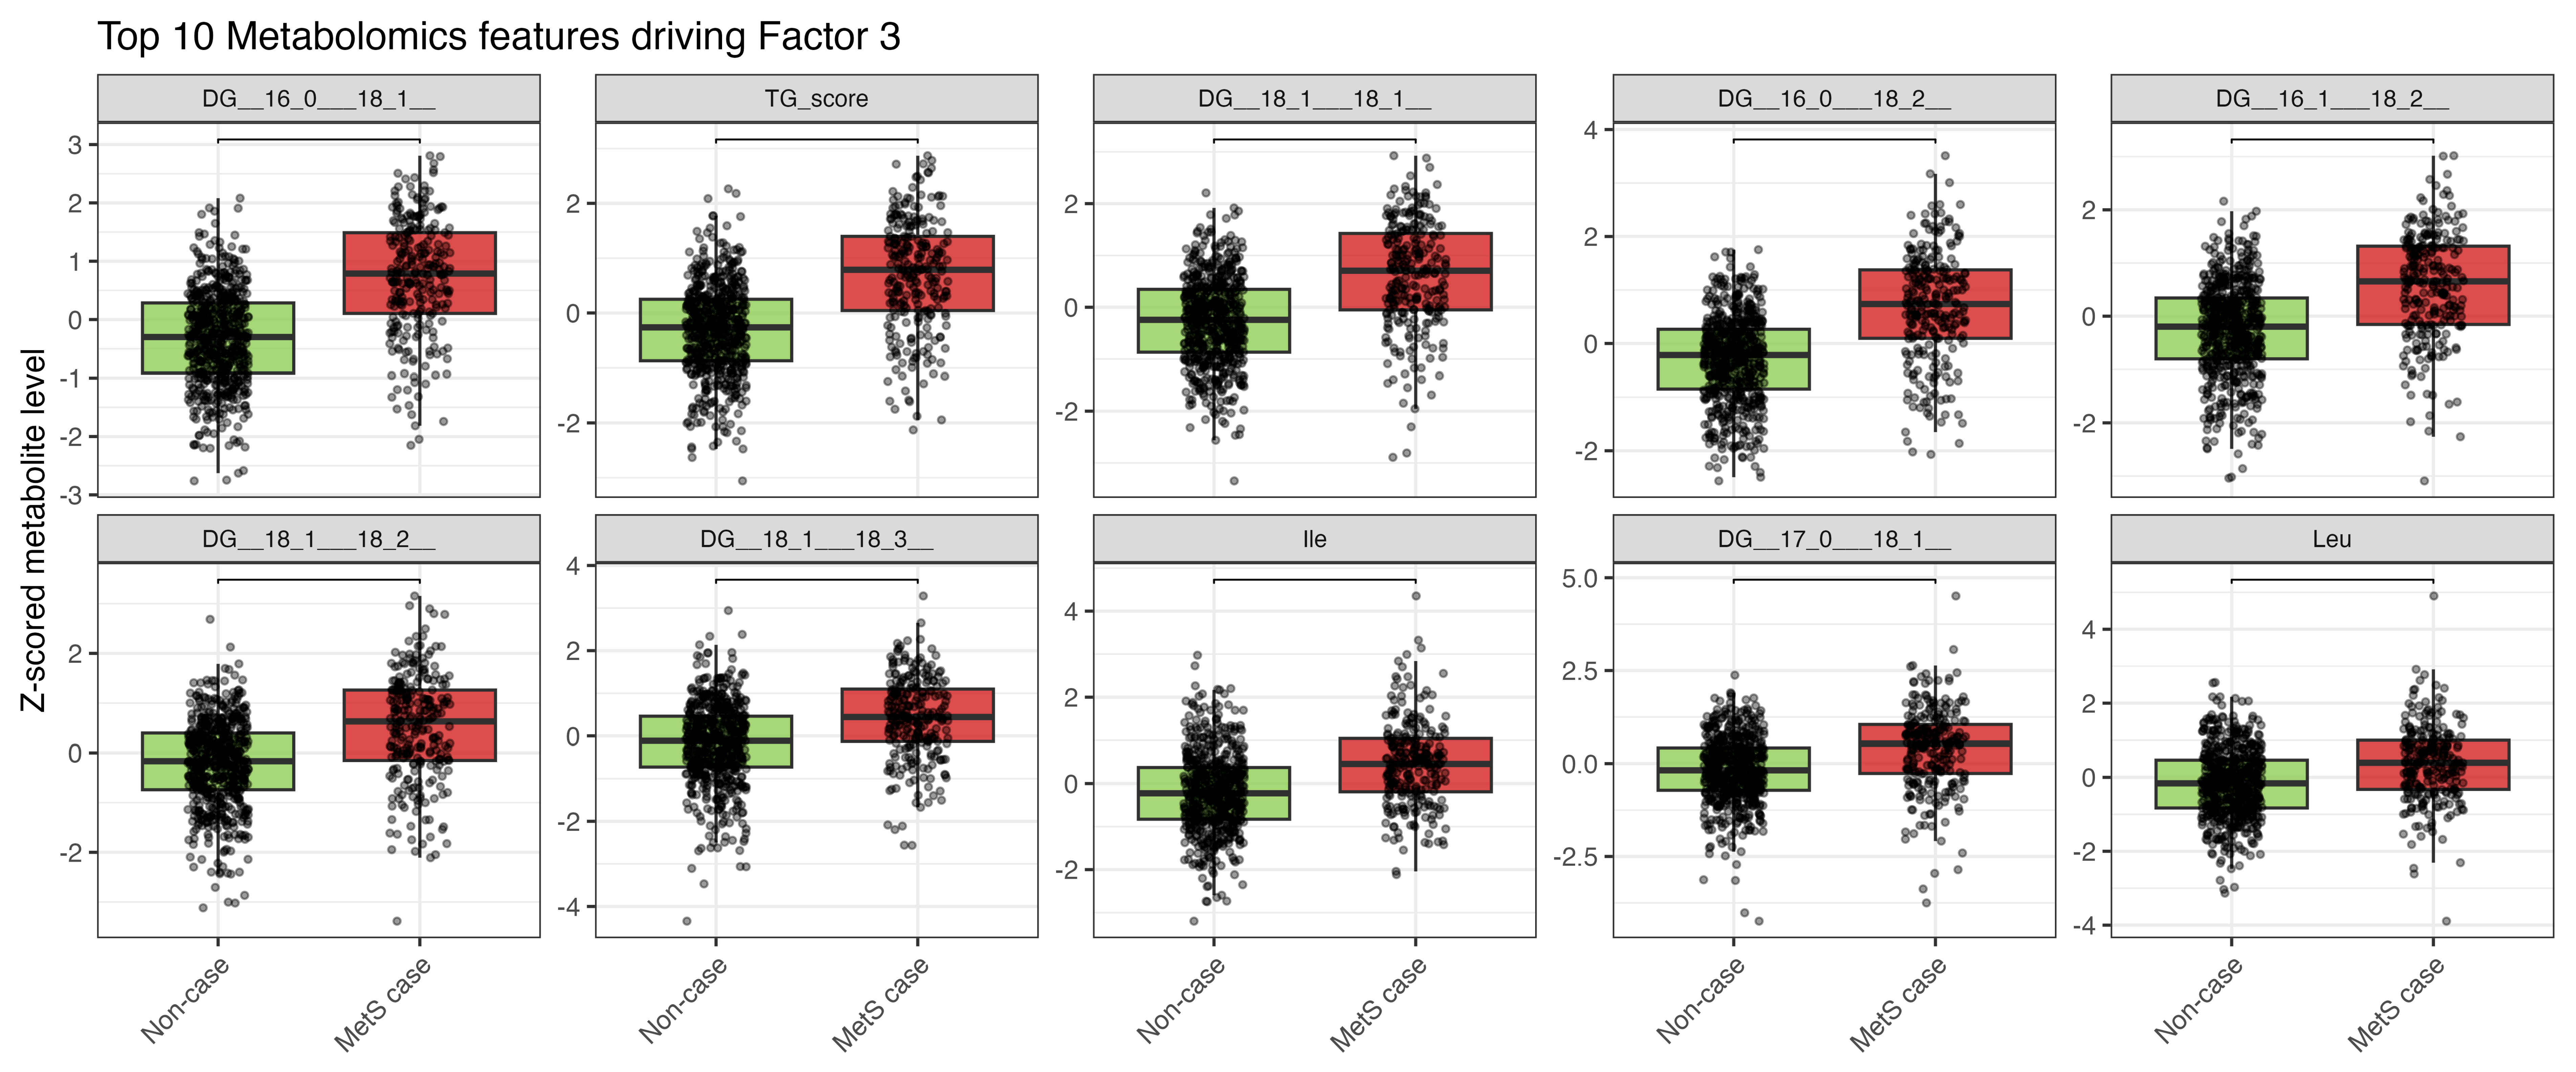
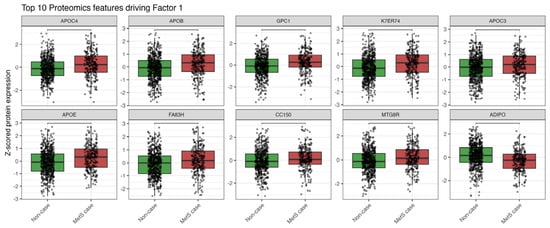
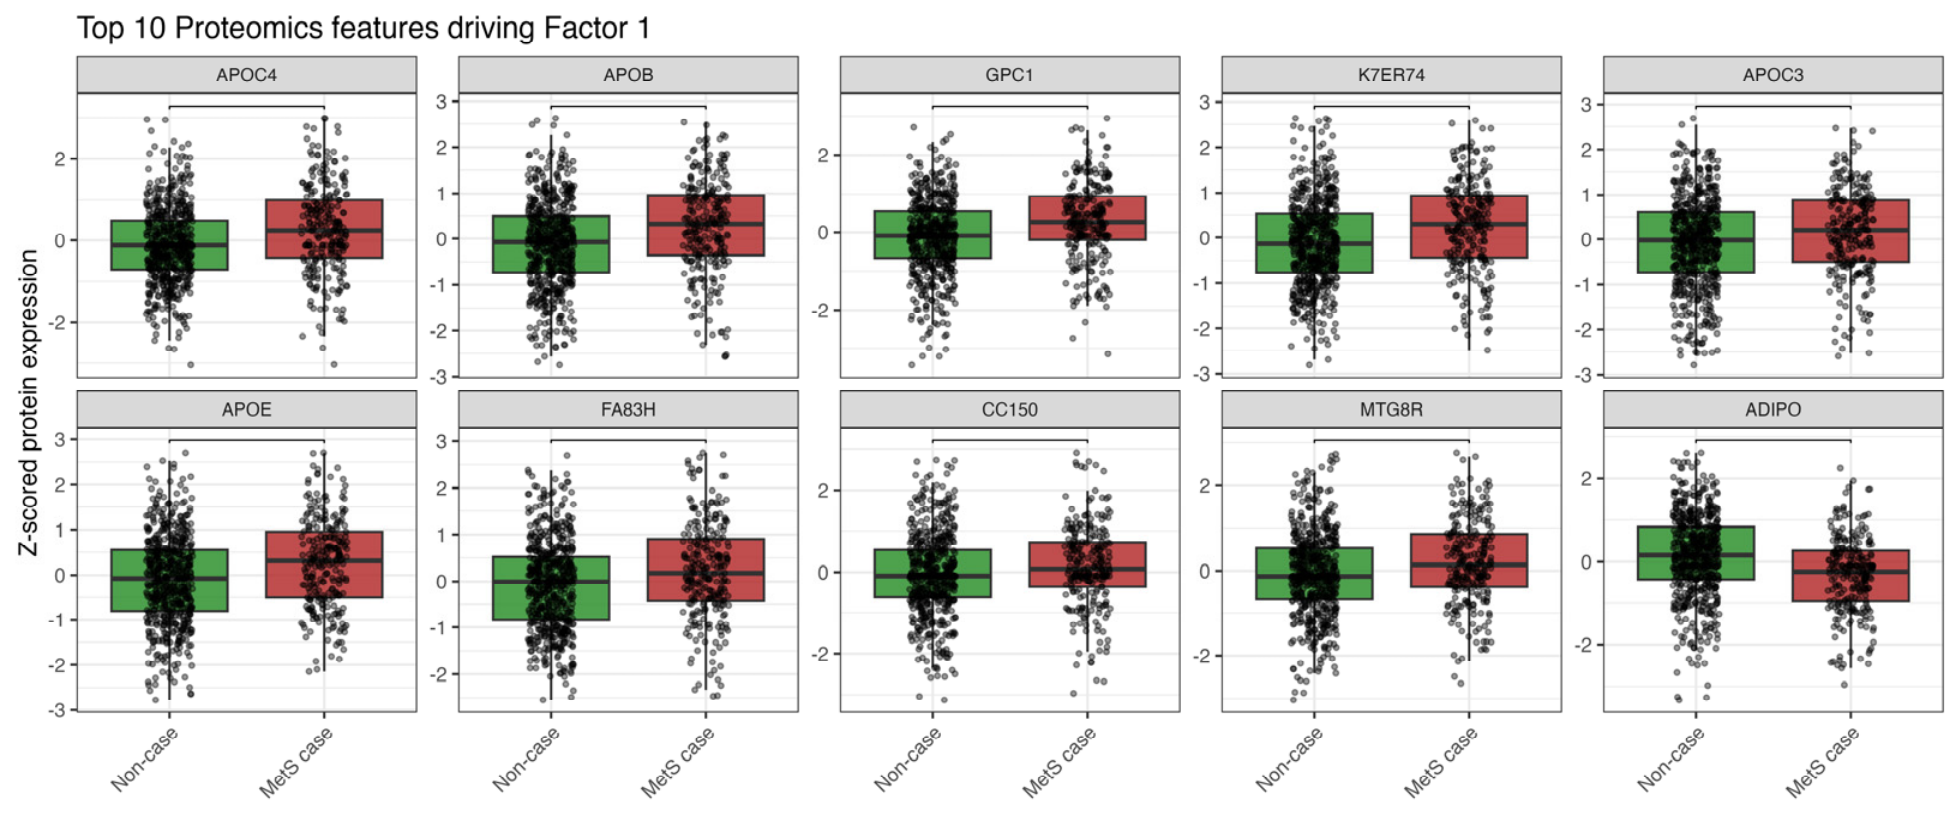
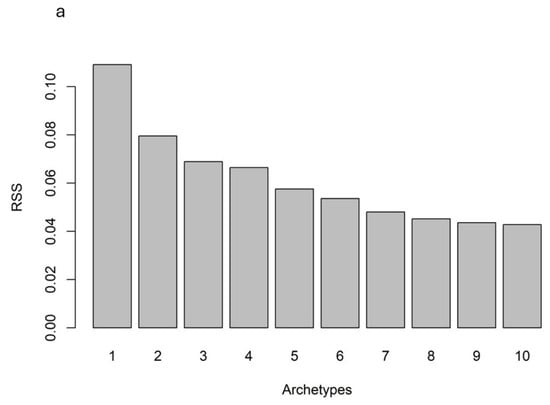
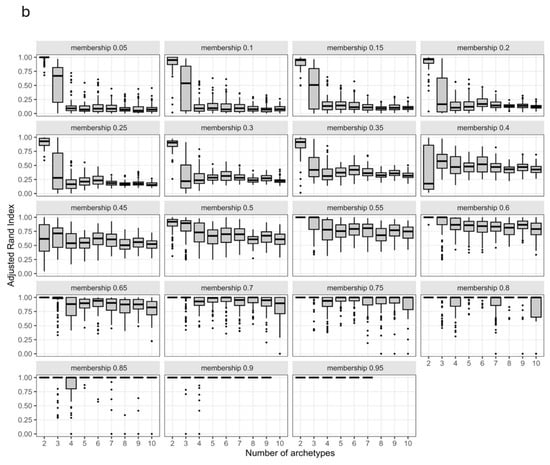
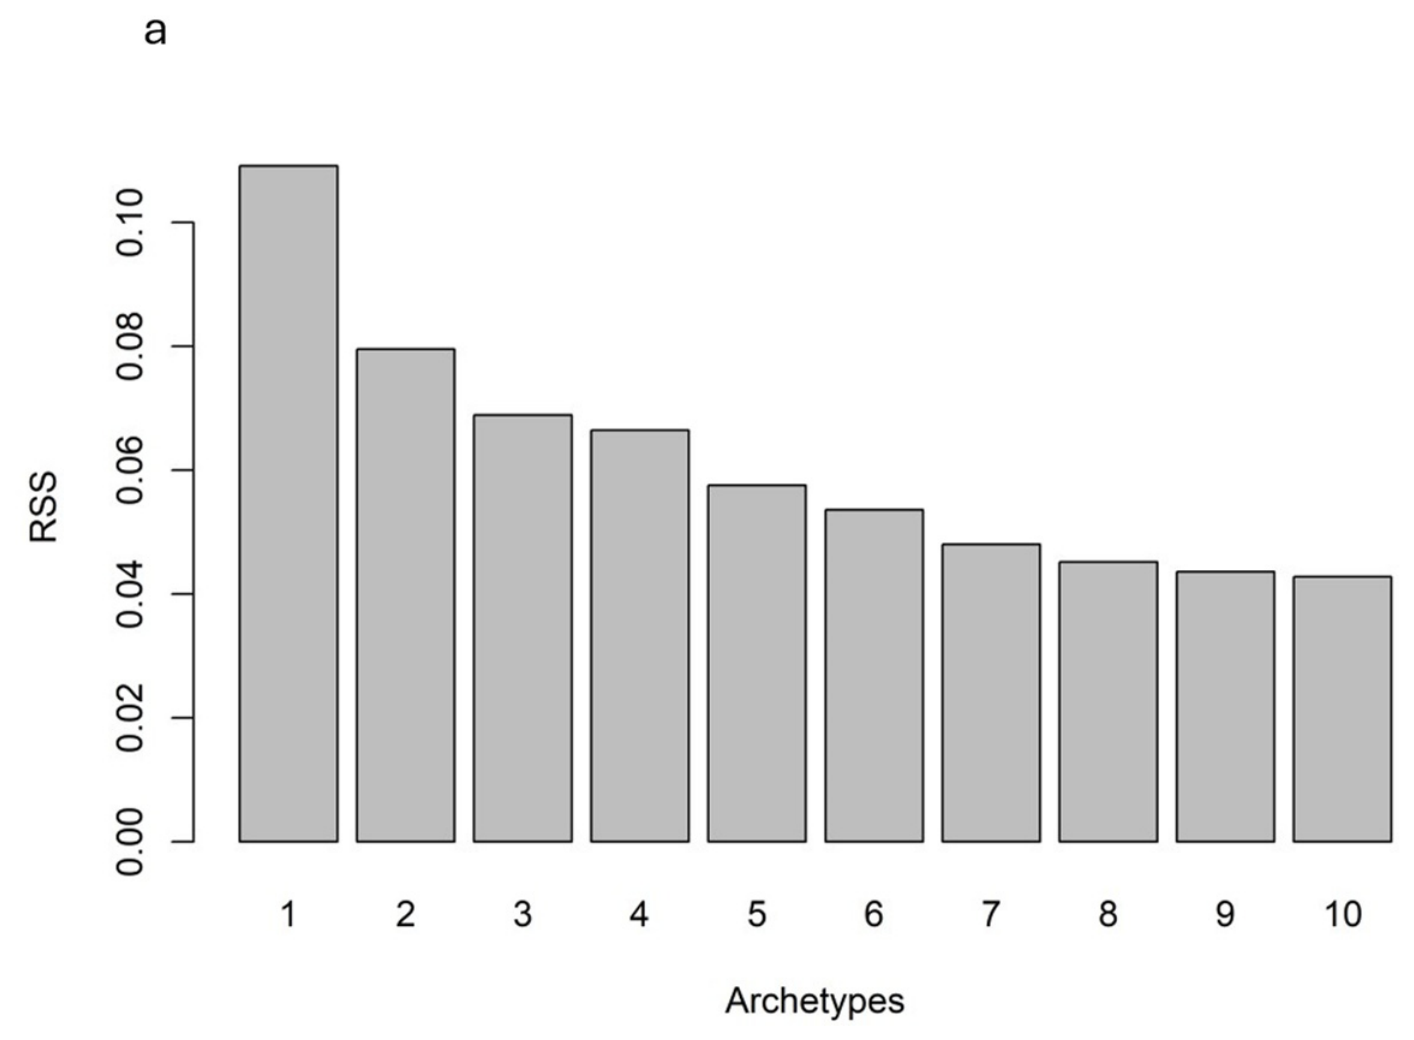
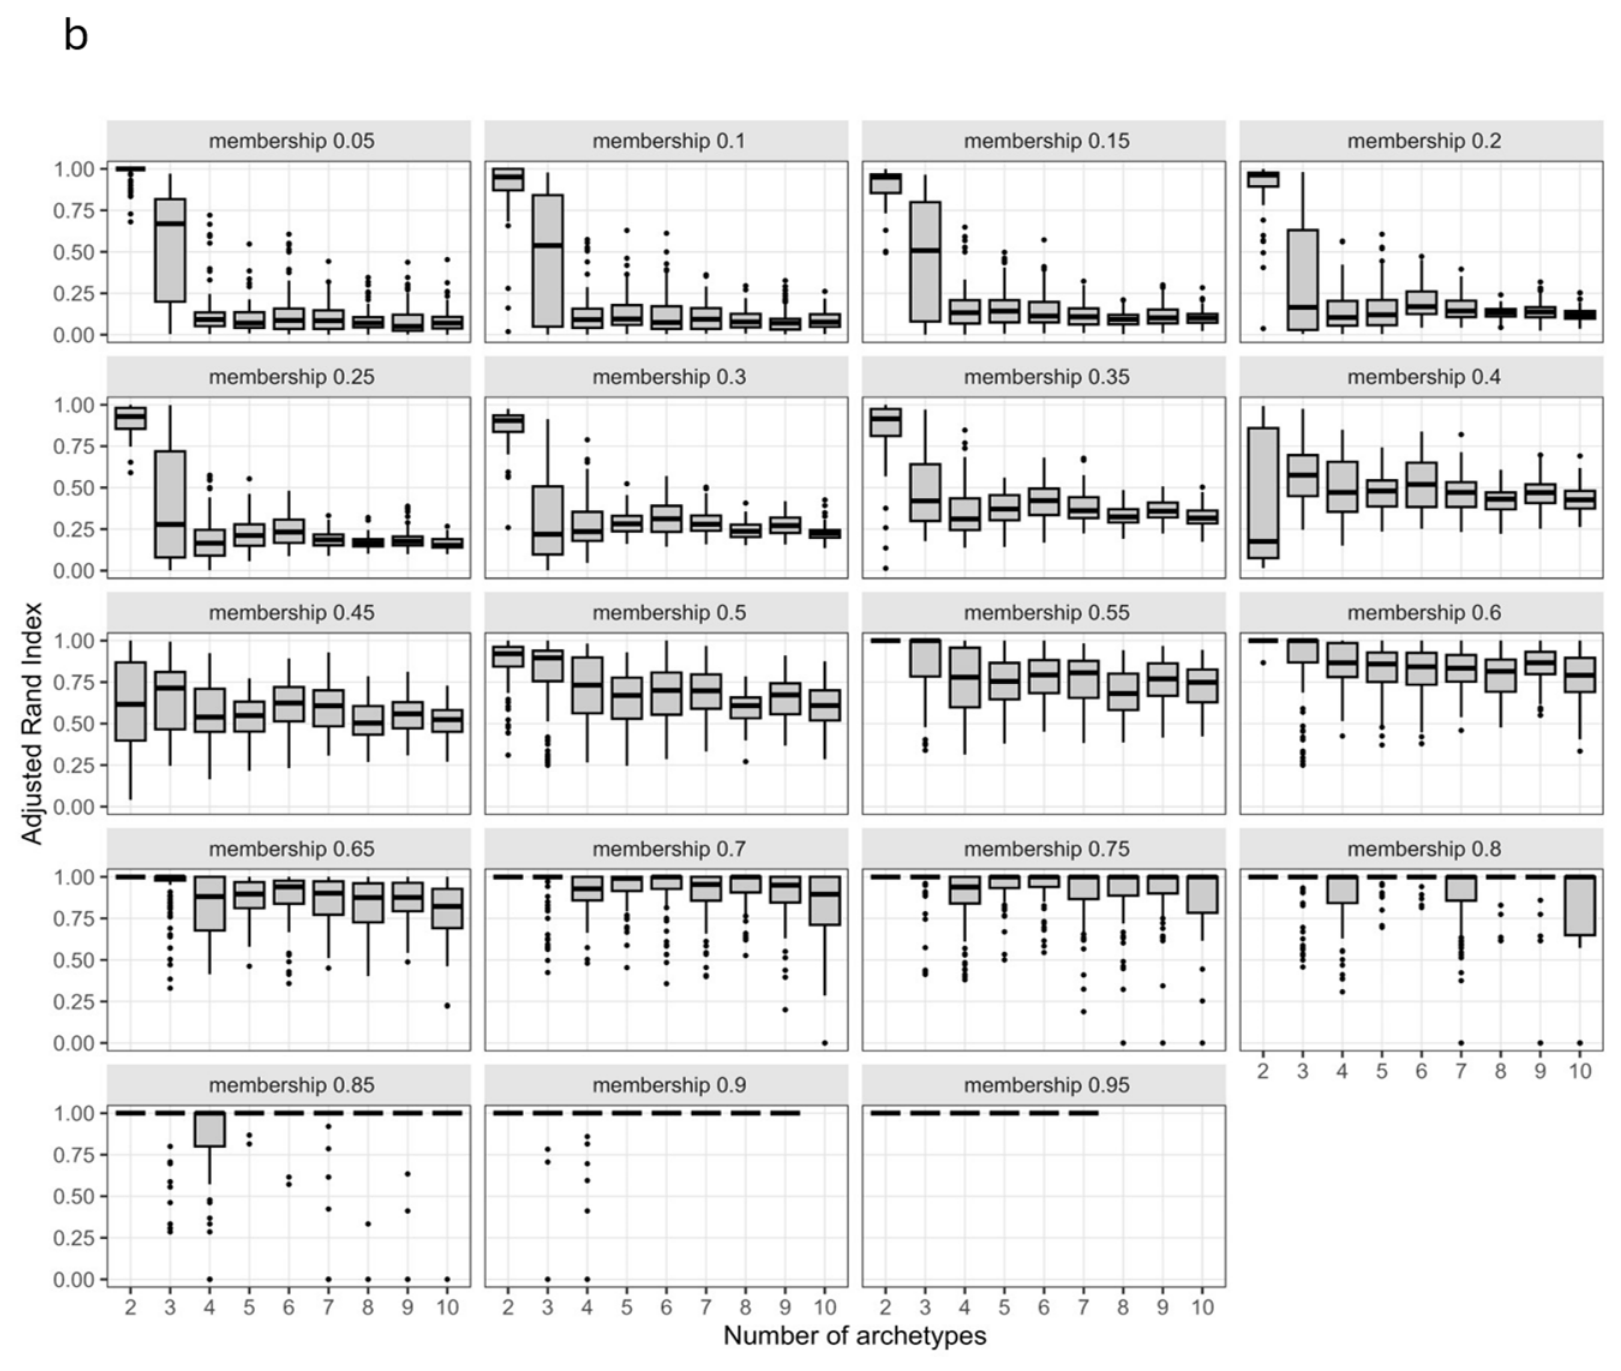
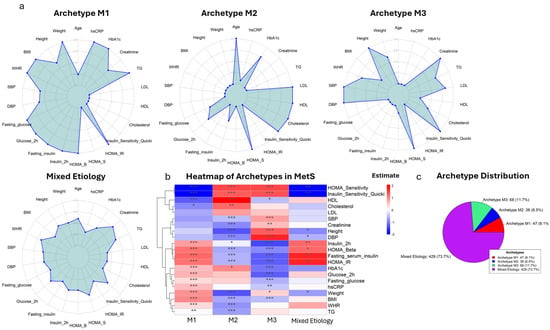
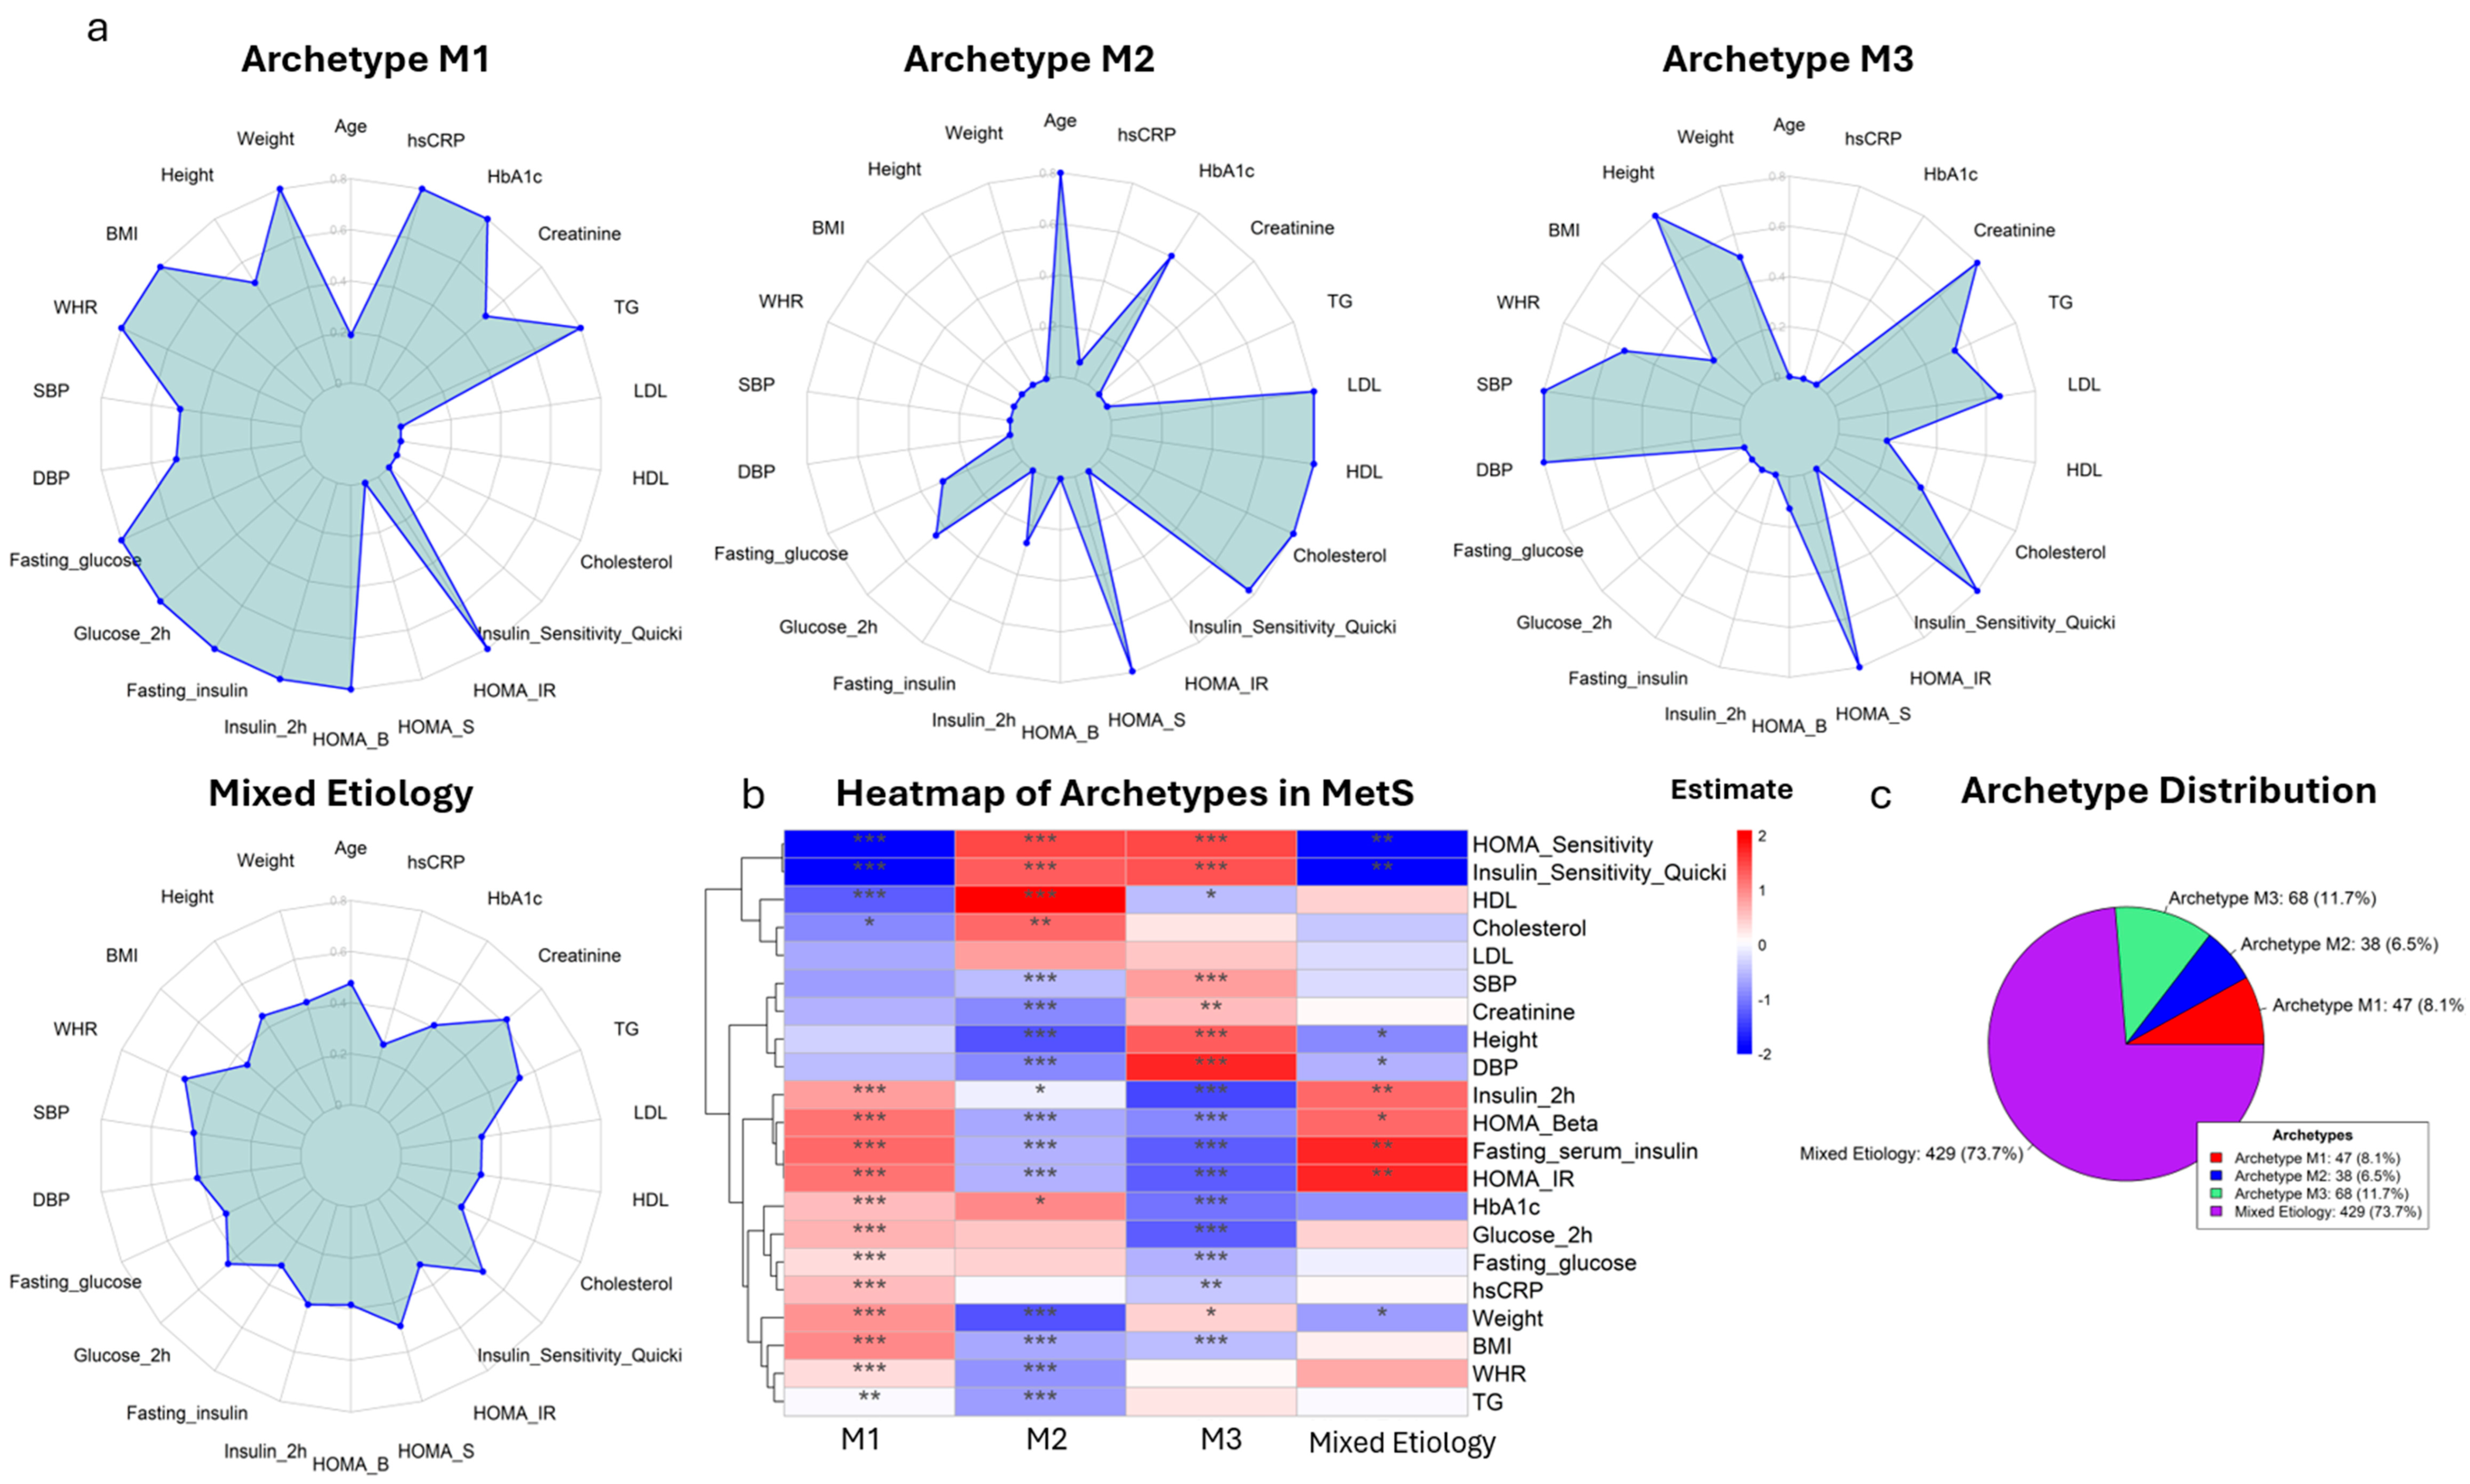
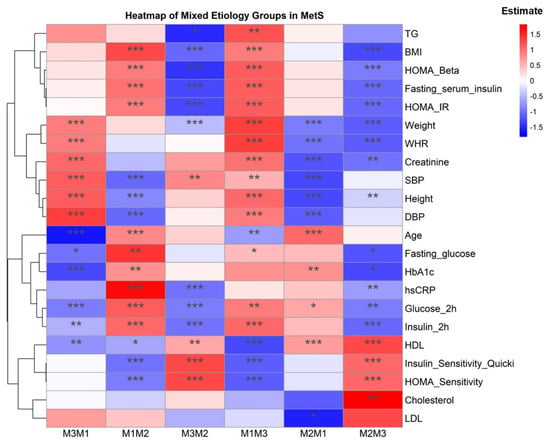
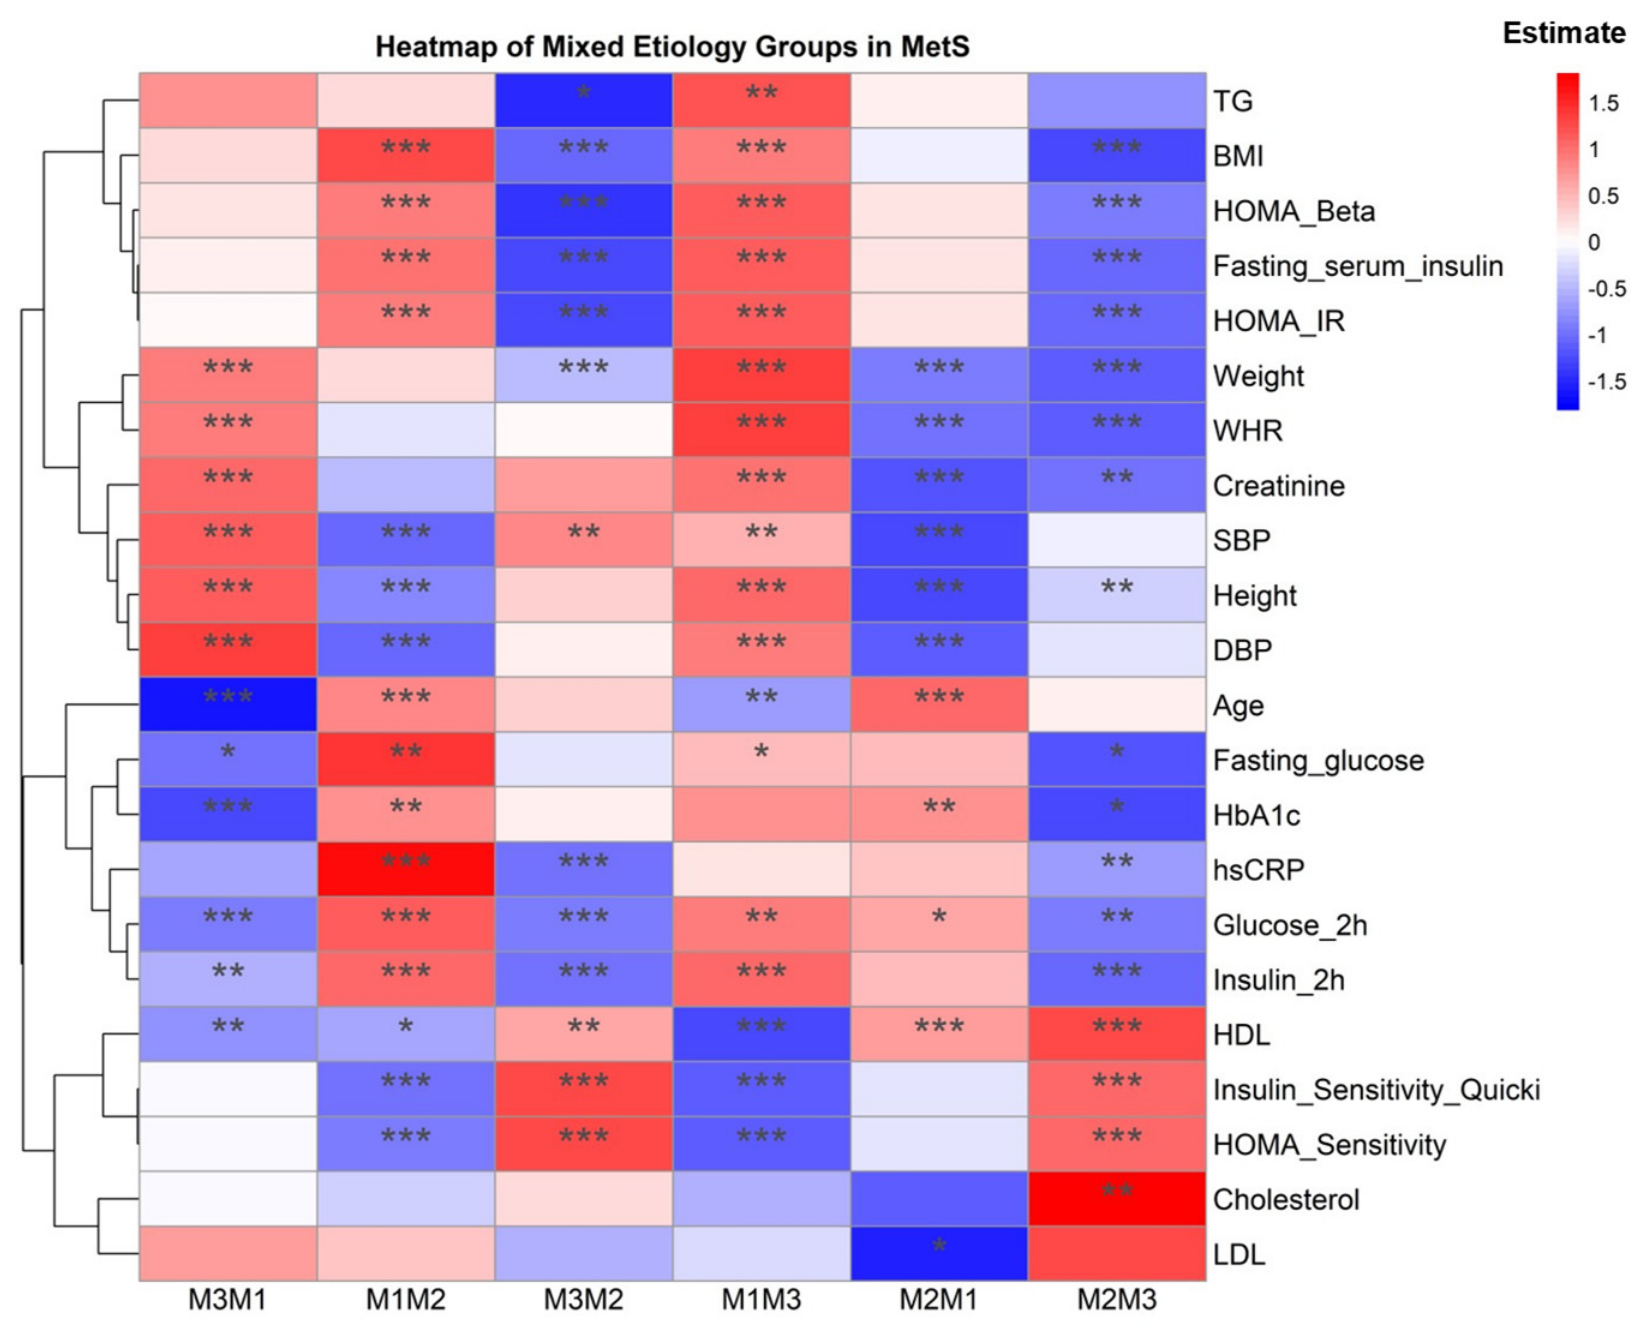
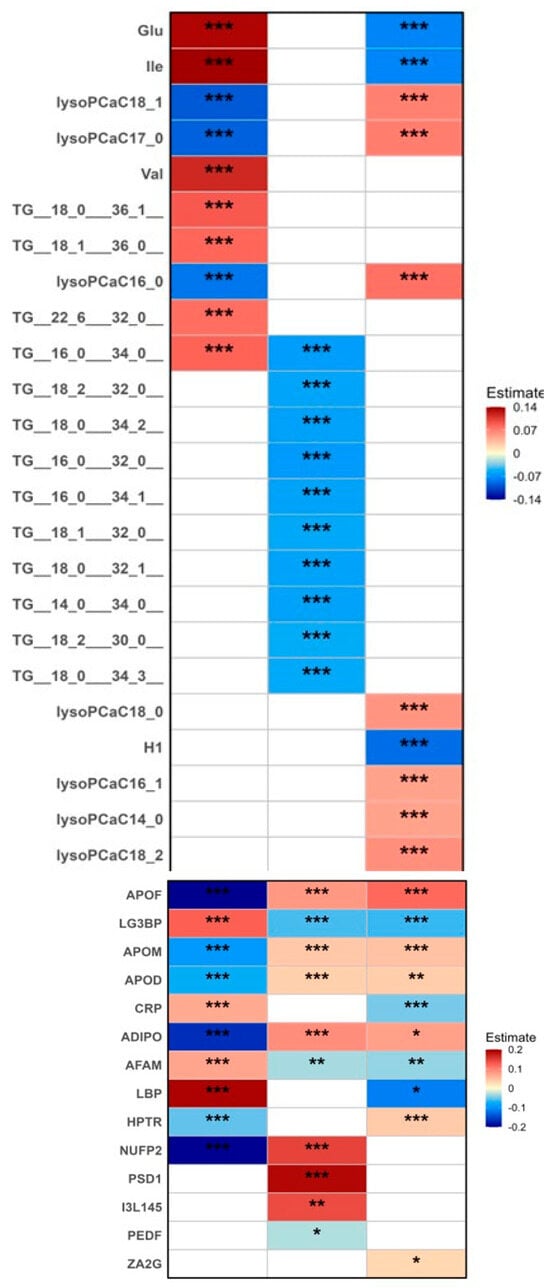
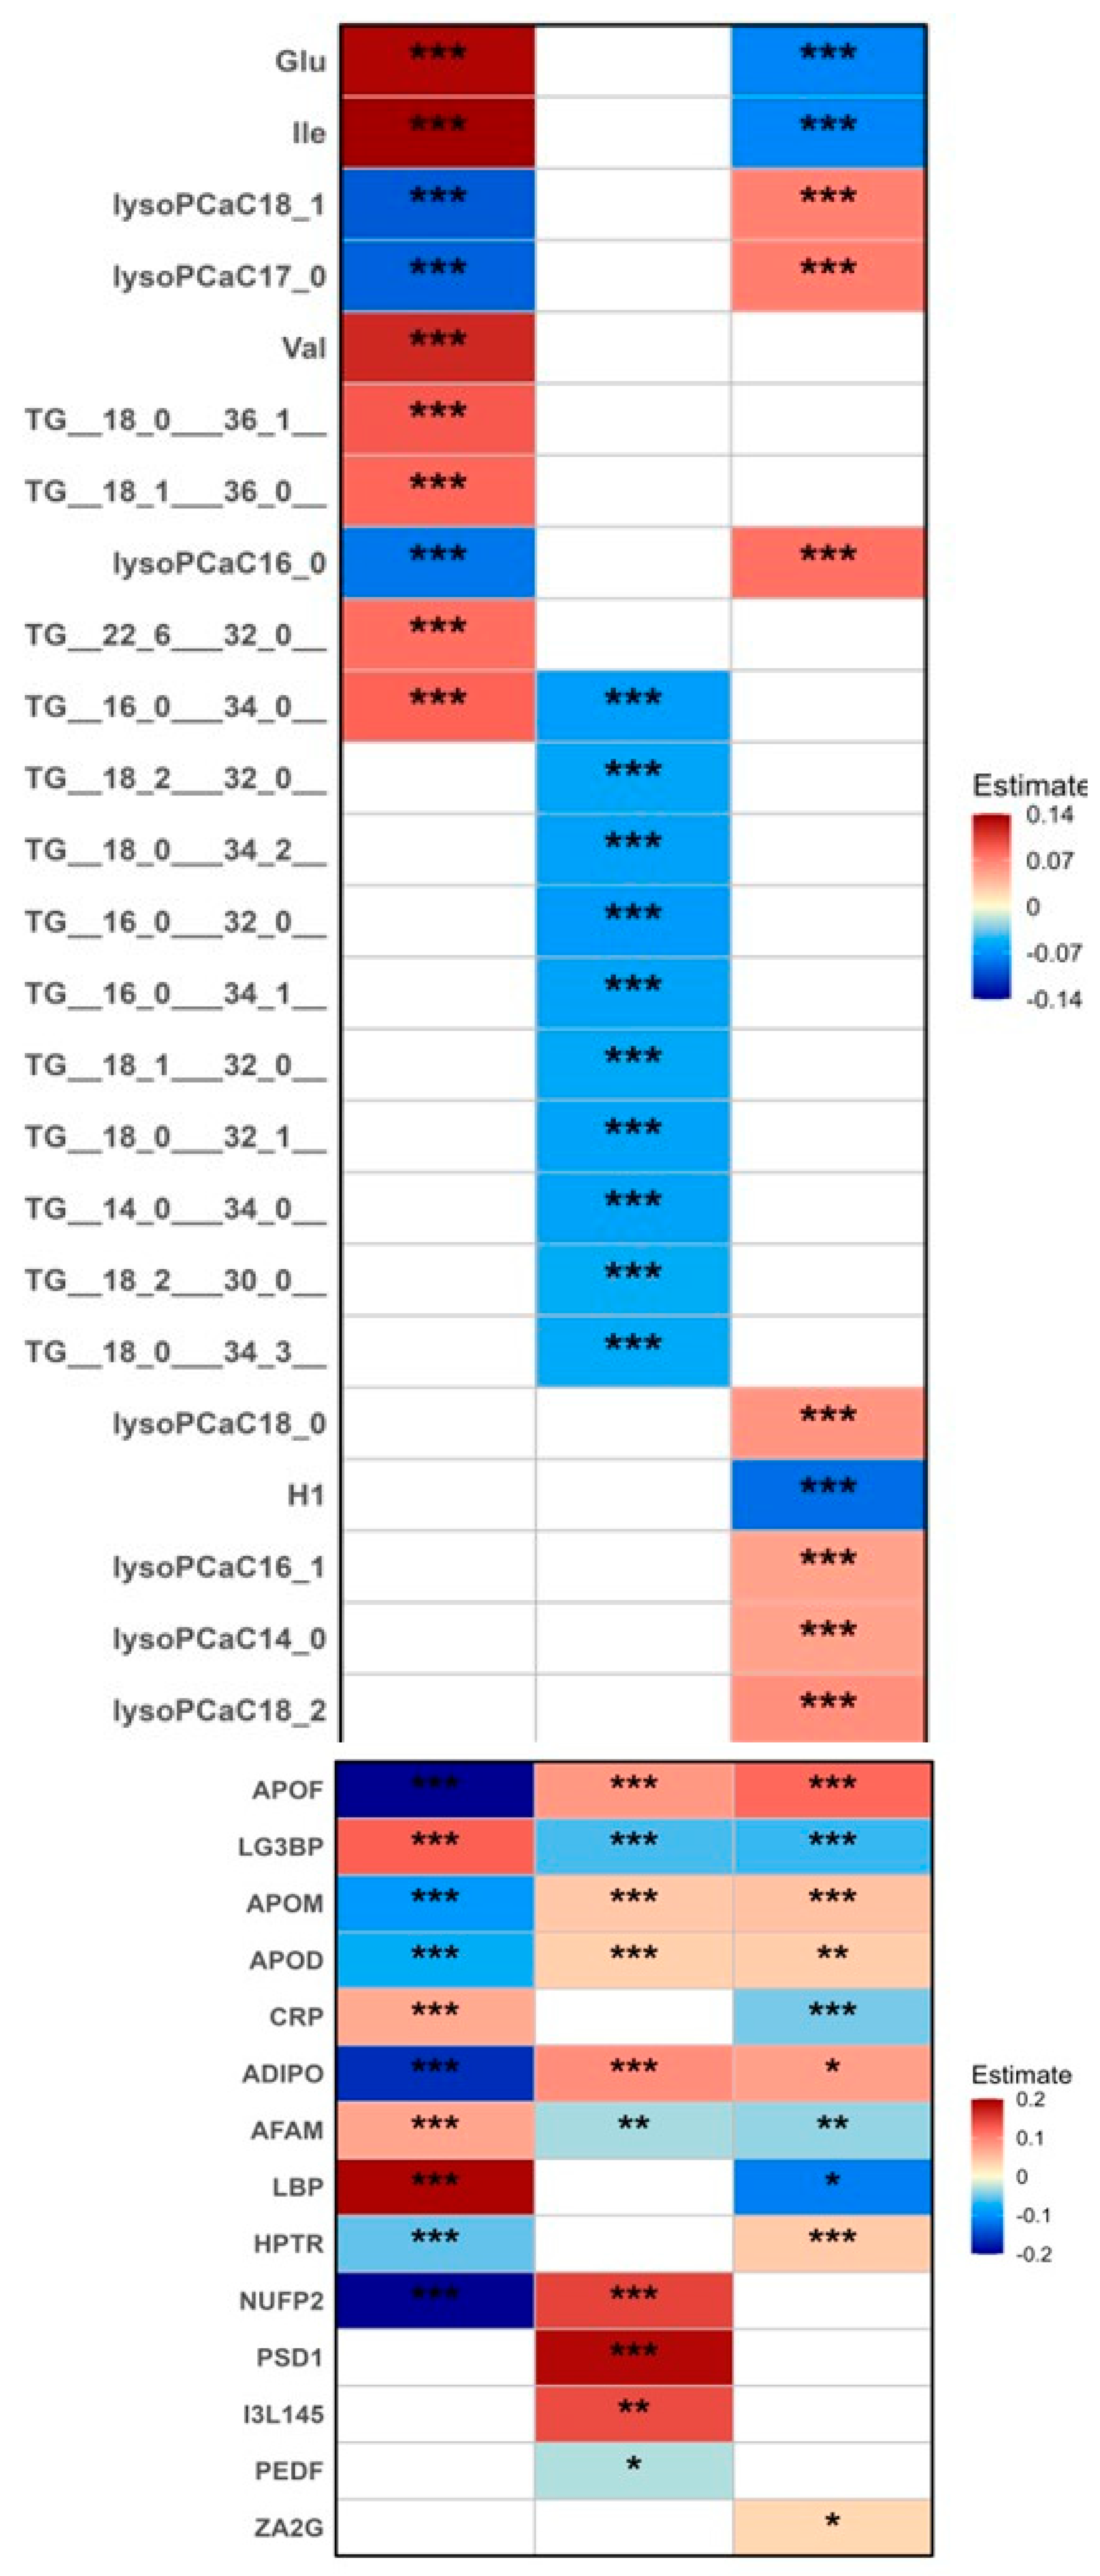

Disclaimer/Publisher’s Note: The statements, opinions and data contained in all publications are solely those of the individual author(s) and contributor(s) and not of MDPI and/or the editor(s). MDPI and/or the editor(s) disclaim responsibility for any injury to people or property resulting from any ideas, methods, instructions or products referred to in the content. |
© 2026 by the authors. Licensee MDPI, Basel, Switzerland. This article is an open access article distributed under the terms and conditions of the Creative Commons Attribution (CC BY) license.