


Abstract
Cucurbitacin B (CucB) has anti-inflammatory potential, but poor aqueous solubility and permeability limit its oral development. This study developed and evaluated a Soluplus®-stabilized CucB nanosuspension (CucB-NS). The formulation was prepared by antisolvent precipitation, optimized using a Box–Behnken design, and evaluated for physicochemical properties, dissolution, ex vivo permeation, pharmacokinetics, anti-arthritic efficacy, safety, and stability. The optimized formulation had a particle size of 201.12 ± 2.21 nm, polydispersity index of 0.115 ± 0.023, zeta potential of −19.89 ± 1.89 mV, and desirability of 0.981. Compared with pure CucB, it increased saturation solubility from 5.6 ± 1.3 to 18.5 ± 1.5 µg/mL, 24 h dissolution from 29.89 ± 4.32% to 61.93 ± 2.45%, and 16 h permeation from 26.5 ± 3.4% to 48.9 ± 5.8%. Oral administration increased Cmax from 35.55 ± 2.66 to 116.59 ± 5.25 ng/mL and AUC0–∞ from 184.46 ± 10.49 to 1266.79 ± 54.24 ng·h/mL, yielding 686.75 ± 8.01% relative bioavailability without altering Tmax. In FCA-induced arthritis, CucB-NS reduced clinical and synovial inflammatory outcomes and improved joint histology. No overt toxicity was observed, and physical stability was maintained for 3 months at 4 ± 2 °C. CucB-NS improved oral exposure and anti-arthritic activity, supporting further preclinical development.
1. Introduction
Rheumatoid arthritis (RA) is a systemic, immune-mediated inflammatory disease in which persistent synovial inflammation progressively damages cartilage, bone, and periarticular tissues. It is one of the most prevalent autoimmune joint diseases worldwide: an estimated 17.6 million people were living with RA in 2020, and the affected population is projected to approach 31.7 million by 2050 because of population growth and aging. The global age-standardized prevalence in 2020 was estimated to be 208.8 per 100,000 people, an increase of 14.1% since 1990. Rheumatoid arthritis is more common in women. The age-standardized female-to-male prevalence ratio is about 2.45. From a therapeutic point of view, these epidemiological trends are important as rheumatoid arthritis is a chronic disease in general, which needs continuous treatment and can cause cumulative physical, social and economic problems even if disease activity is controlled to a certain degree [1].
At the tissue level, RA is characterized by a self-reinforcing inflammatory microenvironment within the synovium. Macrophages, fibroblast-like synoviocytes, autoreactive T cells, and B cells interact through cytokines, cell-contact signals, and tissue-remodelling processes. Activated fibroblast-like synoviocytes acquire an aggressive phenotype, contribute to synovial hyperplasia, and participate in the formation of pannus, an invasive inflammatory tissue that can extend over and erode adjacent cartilage and bone. The inflammatory network is coordinated by mediators and signalling pathways that include tumor necrosis factor-α (TNF-α), interleukin-6 (IL-6), nuclear factor kappa B (NF-κB), Janus kinase/signal transducer and activator of transcription (JAK/STAT), and STAT3. Their convergence helps explain why RA is not sustained by a single molecular defect and why interruption of one pathway may not fully suppress disease activity in every patient [2,3].
Biologic and targeted synthetic disease-modifying antirheumatic drugs (DMARDs) have changed the clinical course of RA by targeting defined inflammatory mediators or intracellular signalling pathways. Nevertheless, treatment remains constrained by cost, unequal access, the need for prolonged administration, safety monitoring, and variable response between patients. Incomplete response and loss of response also mean that treatment often requires escalation, switching, or combination therapy. These limitations support continued investigation of complementary or alternative agents that can act on inflammatory mechanisms while remaining suitable for practical oral administration. A formulation that improves exposure to a poorly soluble anti-inflammatory compound could therefore be relevant not only to dissolution testing but also to the broader problem of making candidate therapies more accessible and consistently effective [4,5].
Cucurbitacin B (CucB) is a highly oxygenated tetracyclic triterpenoid of the cucurbitacin family. It is of interest as a potential anti-inflammatory phytoconstituent because its reported pharmacological profile extends beyond a single target and includes anti-inflammatory, immunomodulatory, antiproliferative, and anticancer activities [6,7]. In models relevant to inflammatory disease, CucB has been reported to suppress NF-κB- and JAK/STAT-associated signalling, reduce production of pro-inflammatory cytokines, and inhibit the proliferation of fibroblast-like synoviocytes [8,9]. These activities provide a pharmacological rationale for investigating CucB in RA, where persistent cytokine signalling and expansion of activated synovial fibroblasts contribute to disease progression. However, biological activity alone does not establish an orally useful therapy. The amount of active compound that dissolves, remains available for absorption, crosses the intestinal barrier, and reaches the systemic circulation is equally important.
CucB is classified as a Biopharmaceutics Classification System (BCS) Class IV compound, combining very low aqueous solubility with limited membrane permeability [10]. This combination creates two linked barriers to oral delivery. Poor solubility restricts the concentration of dissolved drug available at the absorption surface, whereas limited permeability can constrain transport of the dissolved molecule across the intestinal epithelium. Increasing the administered dose alone may therefore be an inefficient solution and may introduce additional formulation or safety concerns. The development problem is consequently to improve the drug’s dissolution and effective absorption without compromising its chemical integrity or therapeutic activity. This biopharmaceutical context makes CucB a suitable model compound for evaluating a formulation strategy that explicitly connects particle properties with dissolution, permeation, systemic exposure, and anti-arthritic efficacy.
Nanosuspension technology addresses the dissolution component of this problem by dispersing the drug as very small crystalline or amorphous particles in a liquid medium with the aid of suitable stabilizers. Particle-size reduction increases the specific surface area available for contact with the dissolution medium and can improve the rate at which drug enters solution; the resulting increase in dissolved drug may also increase the amount available for intestinal absorption [11,12,13]. This mechanism is especially relevant to compounds whose oral performance is dissolution limited. It should not, however, be interpreted as an automatic solution to low permeability: the formulation must be evaluated across the sequence of particle-size distribution, physical stability, dissolution, membrane permeation, and pharmacokinetic exposure.
Unlike carrier-based systems such as solid lipid nanoparticles or liposomes, a nanosuspension can maintain the active pharmaceutical ingredient as the principal particulate phase rather than embedding it within a separate matrix. This can simplify composition, reduce the number of material-dependent variables, and preserve the possibility of studying the drug’s own solid-state behaviour. The approach is therefore attractive for a BCS Class IV compound such as CucB because it primarily targets the solubility and dissolution constraint while allowing permeability-related effects to be assessed separately. Antisolvent precipitation is also compatible with relatively direct and scalable preparation, although the process must be controlled to obtain reproducible particle size, prevent aggregation, and maintain the intended solid state during storage [14,15].
A previous solid-dispersion approach improved the oral pharmacokinetic profile of CucB relative to the unformulated drug, demonstrating that formulation can influence its systemic exposure [16]. Solid dispersions nevertheless require careful selection and control of the carrier matrix. Their performance may depend on maintaining the drug in an amorphous state, and low drug loading, recrystallization, and storage-related physical instability can limit their practical utility [17]. These considerations do not make solid dispersion unsuitable; rather, they define a formulation trade-off and provide a rationale for testing a matrix-free particulate alternative.
A CucB nanosuspension may offer that alternative by keeping the drug in a discrete nanoparticulate form without a bulk carrier matrix. This design can support a higher proportion of active ingredient and reduce dependence on matrix-mediated amorphous stabilization, while still requiring rigorous assessment of aggregation, crystal form, and long-term stability. Stabilizers may additionally influence wetting, interfacial properties, dissolution, and, in some systems, the effective interaction of drug with the intestinal barrier. For CucB, the formulation question is therefore broader than whether particle size can be reduced: it is whether the selected stabilizer and process produce a physically stable nanosuspension that converts particle-size reduction into measurable gains in dissolution, permeation, oral exposure, and therapeutic response [18,19].
Soluplus® is a rational stabilizer for this purpose because its molecular architecture combines polymeric and surfactant-like behaviour. It is an amphiphilic graft copolymer composed of polyethylene glycol, polyvinyl caprolactam, and polyvinyl acetate, and therefore contains hydrophilic and hydrophobic domains that can interact with both the aqueous medium and a poorly water-soluble drug [20]. The hydrophilic component can support wetting and aqueous dispersion, while the hydrophobic component can associate with the drug. Soluplus® may consequently contribute to particle stabilization and apparent solubilization through more than one interaction mechanism, including hydrogen bonding and micelle formation.
This combined interaction profile distinguishes Soluplus® from a conventional hydrophilic polymer such as Kollidon VA 64, for which hydrogen bonding is the principal interaction described in the cited comparison. The reported formulation comparison showed up to a 3.70-fold greater bioavailability enhancement over the crystalline drug and a 1.70-fold enhancement over a VA64-based system [21]. These values support the use of Soluplus® as a testable formulation variable, but they do not replace direct characterization of the CucB system. Its suitability must be established through measurements of particle size, polydispersity, surface charge, solid state, dissolution, permeation, pharmacokinetics, and stability. In this way, the study can distinguish a true improvement in oral performance from an isolated increase in dissolution or a transient dispersion effect.
Despite the anti-inflammatory potential of CucB and the formulation advantages proposed for nanosuspensions, the key translational question is whether these elements remain connected across the entire drug-development sequence. A smaller particle should first produce a reproducible physical dispersion and improved dissolution; the dissolved drug should then show improved permeation or intestinal availability; increased absorption should appear as greater systemic exposure; and the exposure change should ultimately be reflected in anti-inflammatory and anti-arthritic outcomes. A formulation may improve one stage without improving the next. For example, a rapid dissolution profile does not by itself demonstrate improved permeability, pharmacokinetics, or efficacy. An integrated evaluation is therefore needed to relate physicochemical optimization to dissolution–permeation behaviour, oral pharmacokinetics, therapeutic response, and safety in experimental RA.
Accordingly, this study was designed to develop and evaluate a Soluplus®-stabilized CucB nanosuspension as an oral formulation candidate for experimental RA. The central hypothesis was that antisolvent precipitation would produce a physically stable nanosuspension with improved dissolution and permeation, and that these improvements would increase oral exposure and strengthen the anti-inflammatory and anti-arthritic effects of CucB. The optimized formulation was therefore examined in a linked sequence rather than by a single performance test: physicochemical properties and storage stability were evaluated first; dissolution and dissolution–permeation behaviour were then characterized; oral pharmacokinetic performance was assessed next; and therapeutic efficacy was tested in a Freund’s Complete Adjuvant (FCA)-induced arthritic rat model.
The therapeutic assessment included paw volume, arthritis score, and joint diameter, together with inflammatory cytokines such as TNF-α, IL-6, and IL-1β; inflammatory mediators including COX-2 and C-reactive protein (CRP); and histopathological examination of affected tissues. Hematological and histopathological evaluations were also included to provide an initial assessment of systemic safety. By integrating these endpoints, the study was intended to determine whether formulation-mediated changes in particle properties and drug release were accompanied by improved permeation, oral bioavailability, and therapeutic activity. This framework positions the nanosuspension not simply as a solubility-enhancement device, but as a formulation platform whose physicochemical behaviour can be traced to pharmacokinetic and pharmacodynamic consequences in experimental RA.
2. Materials and Methods
Cucurbitacin B (CucB) was purchased from ChemFaces (Wuhan, China). Soluplus® was obtained from Clearsynth (Mumbai, India), ultrapure Milli-Q water was supplied by Sigma-Aldrich (New York, NY, USA), and ethanol (99.9% v/v) was obtained from Bio Liqua Research Pvt. Ltd. (Bengaluru, India). All other reagents were of analytical grade and were used as received unless otherwise stated).
2.1. Study Design
The study was structured as a formulation-development and preclinical evaluation program. CucB nanosuspensions were prepared by antisolvent precipitation, optimized using a three-factor Box–Behnken design, and evaluated sequentially for colloidal properties, solid state, morphology, drug content, dissolution, ex vivo permeation, pharmacokinetics, therapeutic activity, safety, and storage stability. The optimized formulation was compared with unformulated CucB and, where relevant, a CucB–Soluplus® physical mixture. The experimental unit, number of independent preparations, and number of analytical replicates are stated for each assay below.
2.2. Preparation of CucB Nanosuspension
CucB nanosuspensions were prepared by antisolvent precipitation using the procedure reported by Alshweiat et al. (2024) [22]. CucB (10 mg) was dissolved in ethanol (1.0 mL) to form the solvent phase. The optimized formulation contained 200 mg of Soluplus® dissolved in 20 mL of Milli-Q water, corresponding to a concentration of 1% (w/v). The ethanolic drug solution was rapidly injected into the stirred aqueous antisolvent to induce precipitation. Stirring was continued until evaporation of ethanol was complete. The resulting nanosuspension was then subjected to formulation and process optimization using the Box–Behnken design described below. The optimized formulation was subsequently characterized before pharmacokinetic and pharmacodynamic evaluation.
2.3. Box–Behnken Design and Formulation Optimization
A randomized three-factor, three-level Box–Behnken response-surface design was generated and analyzed using Design-Expert® version 13 (Stat-Ease Inc., Minneapolis, MN, USA). The independent variables were Soluplus® concentration (X1, % w/v), sonication time (X2, min), and sonication power (X3, W). The measured responses were particle size (Y1, nm), zeta potential (Y2, mV), and polydispersity index (Y3). The factor levels, coded values, experimental runs, and optimization constraints are provided in Table 1. The optimized composition and process conditions were selected using the desirability function implemented in the software. Unless otherwise stated, responses were obtained from independent formulation preparations and are reported as mean ± standard deviation.
Table 1.
Independent variables and coded levels in the BBD for CucB-NS preparation and constraints for optimization.
2.4. Physicochemical Characterization
2.4.1. Particle Size, Polydispersity, and Zeta Potential
Particle size, polydispersity index, and zeta potential were measured by dynamic light scattering using a Zetasizer Ultra (Malvern Panalytical, Worcestershire, UK). Samples were equilibrated at 25 °C and analyzed using backscatter detection at 173°, with Milli-Q water as the dispersant. Each formulation was measured in triplicate. Results are reported as mean ± standard deviation.
2.4.2. Equilibrium Solubility
The equilibrium solubility of CucB was determined using a modified shake-flask method based on Arslan et al. (2023) [23]. Equilibrium solubility was determined using ultrapure Milli-Q water as the test medium. Excess CucB was added to the test medium and agitated vigorously at 37 ± 0.5 °C for 24 h. The equilibrated suspension was filtered through a 0.45 µm membrane. The filtrate was suitably diluted and analyzed by HPLC, and solubility was expressed as the amount of CucB dissolved per unit volume of medium. Each determination was performed in triplicate.
2.4.3. Fourier-Transform Infrared Spectroscopy
Fourier-transform infrared (FTIR) spectra were recorded using an FT/IR-660 Plus spectrometer (JASCO International Co. Ltd., Tokyo, Japan) to examine the characteristic functional groups of CucB and potential drug–polymer interactions. The optimized CucB nanosuspension (F16) was analyzed in its liquid formulation state for FTIR without prior freeze-drying. The formulation sample was mixed directly with KBr and dried before FTIR analysis over the wavenumber range of 400–4000 cm−1. A KBr blank was recorded before sample analysis. Spectra were compared qualitatively to determine whether the characteristic CucB bands were retained or shifted after formulation [24].
2.4.4. Differential Scanning Calorimetry
Thermal behaviour was analyzed using a DSC-60 differential scanning calorimeter (Shimadzu, Kyoto, Japan). The optimized nanosuspension was freeze-dried prior to analysis. The nanosuspension was frozen at –40 °C (InKarp Instruments Pvt. Ltd. Chennai, India) and freeze-dried in a lyophilizer (Martin Christ Alpha 1–2 LD Plus, Osterode am Harz, Germany) using mannitol (5% w/v) as a cryoprotectant, for 8 h until a dry powder was obtained. Accurately weighed samples 10 mg of pure CucB, the physical mixture, and the lyophilized formulation were sealed in aluminium pans and heated from 50 to 400 °C at 10 °C/min under nitrogen [25]. The melting behaviour of CucB was compared among the pure CucB, physical mixture, and the optimized formulation. Relative crystallinity was calculated from the measured heat of fusion using CucB as the 100% crystalline reference (Equation (1)).
In this equation, ΔHm is the measured heat of fusion, ΔH°m is the heat of fusion of the crystalline CucB reference, and w is the drug weight fraction in the analyzed sample.
2.4.5. X-Ray Powder Diffraction
X-ray powder diffraction patterns were acquired for CucB, the CucB–Soluplus® physical mixture, and freeze-dried optimized CucB nanosuspension using a MiniFlex 600 diffractometer (Rigaku, Tokyo, Japan) equipped with a copper radiation source. The instrument was operated at 40 kV and 40 mA, and data were collected at a scanning speed of 0.5 s per step [16]. Changes in the characteristic diffraction peaks were used to assess formulation-associated changes in the crystalline state (Equation (2)).
Relative degree of crystallinity was calculated from the intensity of the highest characteristic peak in the sample (Isam) relative to the intensity at the same diffraction angle in the CucB reference (Iref).
2.4.6. Scanning Electron Microscopy
Particle morphology and aggregation were examined using a JSM-IT800 scanning electron microscope (JEOL Ltd., Tokyo, Japan), following the approach reported by Ahirrao et al. (2023) [26]. A small aliquot of nanosuspension was placed on a carbon-coated aluminum stub, air-dried in a desiccator, sputter-coated with gold–palladium, and imaged at an accelerating voltage of 5–15 kV. Representative micrographs were examined for particle shape, surface texture, and evidence of aggregation and were interpreted alongside the dynamic-light-scattering results.
2.5. HPLC Analysis of CucB
CucB was quantified by reverse-phase HPLC with photodiode-array detection using a Luna C18 column (250 × 4.6 mm, 5 µm; Phenomenex) maintained at 30 °C. The mobile phase comprised acetonitrile and water delivered using the following gradient: 15:85 from 0 to 10 min, 60:40 from 10 to 20 min, and 80:20 from 20 to 30 min, followed by re-equilibration to the initial composition until 35 min. The flow rate was 1.0 mL/min, and detection was performed at 230 nm. Calibration standards were prepared in ethanol over the range 5–250 µg/mL. Samples were sonicated for 10 min and filtered through a 0.45 µm membrane before injection. The method was adapted from Kim et al. (2022) [27].
2.6. In Vitro Dissolution
Dissolution was evaluated for pure CucB, the CucB–Soluplus® physical mixture, and optimized CucB nanosuspension using USP Apparatus II with paddle agitation, based on Shaikh et al. (2022) [28]. Samples equivalent to 10 mg of CucB were dispersed in 900 mL of dissolution medium maintained at 37 ± 0.5 °C and stirred at 50 rpm. After the initial 2 h dissolution period in 0.1 N HCl, the acidic medium was replaced with freshly prepared pH 6.8 phosphate buffer to simulate the transition from gastric to intestinal conditions. The phosphate buffer was not added directly to the HCl medium to adjust its pH. Samples of 5 mL were withdrawn at 0, 1, 2, 4, 6, 8, 10, 12, 14, 16, 18, 20, 22, and 24 h and replaced immediately with an equal volume of fresh medium maintained at the test temperature. Withdrawn samples were filtered through 0.22 µm membranes, diluted with ethanol, and analyzed by HPLC. Each experiment was performed in triplicate, and cumulative dissolution was expressed as the percentage of the nominal CucB dose released.
2.7. Release-Kinetic Analysis
The dissolution profile of the optimized CucB nanosuspension was fitted to zero-order, first-order, Higuchi, and Korsmeyer–Peppas models using GraphPad Prism version 10.3.1 (GraphPad Software, LLC, San Diego, CA, USA), as described previously [29,30]. The fitted relationships were Qt = Q0 + K0t for zero-order release, log Qt = log Q0 + K1t for first-order release, Qt = KHt1/2 for the Higuchi model, and Mt/M∞ = KPtn for the Korsmeyer–Peppas model.
Here, Qt is the amount released at time t, Q0 is the initial amount, K0, K1, KH, and KP are model constants, Mt/M∞ is the fraction released at time t, and n is the release exponent. The model with the highest coefficient of determination (R2) was considered the best empirical description of the observed profile. Model selection was interpreted together with the dissolution profile rather than from R2 alone.
2.8. Ex Vivo Permeation
Ex vivo permeation was evaluated using a Franz diffusion cell apparatus (Model EDC 07, Electrolab India Pvt. Ltd., Mumbai, India), with minor modifications to the method of Shastry et al. (2026) [31]. Fresh goat buccal mucosa was obtained from a local slaughterhouse, washed with saline, and equilibrated in phosphate buffer before mounting between the donor and receptor compartments with the epithelial surface facing the donor chamber. The receptor compartment contained pH 6.8 phosphate buffer maintained at 37 ± 0.5 °C under continuous stirring. The diffusion area was 1.767 cm2. The formulation was applied to the donor compartment, and receptor samples were withdrawn at predetermined intervals and replaced with equal volumes of fresh buffer. CucB in the receptor samples was quantified against a calibration curve using a Waters 2695 HPLC system (Waters Corporation, Milford, MA, USA).
2.9. Animals, Ethics, and Housing
All animal procedures were approved by the Institutional Animal Ethics Committee of KLE College of Pharmacy, Bengaluru, India (approval no. 04/HP/2025; approved 13 December 2025). Healthy female Wistar albino rats aged 8–10 weeks and weighing 200–250 g were used. Animals were acclimatized for four weeks under controlled conditions (25 ± 5 °C; 12 h light/dark cycle) with unrestricted access to standard pellet diet and drinking water. Experiment-specific group sizes and allocations are reported in the relevant subsections. The total number of animals should be reconciled across the toxicity, pharmacokinetic, and arthritis cohorts in the final submission so that the reported cohort size agrees with every group allocation.
2.10. Oral Toxicity Assessment
2.10.1. Acute Oral Toxicity
Acute oral toxicity of the optimized CucB nanosuspension was evaluated in healthy female Wistar rats, following the stepwise procedure of OECD Guideline 423 with a modification of the dose level. Animals were fasted overnight with free access to water, and food was withheld for a further 3–4 h after dosing. The guideline’s lowest recommended starting dose of 5 mg/kg (CucB equivalent) was administered first as a single oral gavage dose (n = 3). Because CucB is highly toxic orally, the dose was therefore reduced to 4 mg/kg, which was administered to 3 group of animals (n = 3). Animals were observed individually during the first 30 min, periodically during the first 24 h (with special attention during the first 4 h), and then daily for 14 days for changes in skin, fur, eyes, mucous membranes, respiration, locomotor activity and behaviour, and for tremors, convulsions, salivation, diarrhoea, lethargy and mortality. Body weight was recorded on days 0, 7, and 14. At the end of the observation period, animals were euthanized by overdose of inhalation anaesthesia and examined grossly for abnormalities of the major organs.
2.10.2. Subacute Oral Toxicity
Subacute toxicity was assessed in healthy female Wistar rats according to OECD Guideline 407. Animals were randomly assigned to 3 groups (n = 3 per group): vehicle control, pure CucB (4 mg/kg), and CucB-NS (4 mg/kg CucB equivalent). Clinical signs, behaviour, food and water intake, and mortality were monitored daily; behaviour, food and water intake, general appearance, and body weight were recorded weekly.
2.11. Pharmacokinetic Study
For pharmacokinetic comparison, animals were allocated to two treatment groups (n = 6 per group): pure CucB and optimized CucB nanosuspension, each administered orally at an equivalent CucB dose of 2 mg/kg. Blood samples (200 µL) were collected at 0.25, 1, 2, 3, 4, 8, 12, and 24 h after dosing. Samples were centrifuged at 10,000 rpm for 30 min at 4 °C, and plasma was stored at −80 °C until analysis [16,32]. Plasma CucB concentrations were determined using the HPLC method described above. Noncompartmental analysis was used to estimate Cmax, Tmax, area under the concentration–time curve, mean residence time, elimination half-life, and elimination rate. Relative bioavailability was calculated using Equation (3):
The pharmacokinetic analysis should report whether concentration values below the lower limit of quantification were excluded or assigned a predefined value and should identify the software used for noncompartmental analysis [33].
2.12. FCA-Induced Arthritis Model
The anti-inflammatory efficacy of pure CucB and optimized CucB nanosuspension was evaluated in female Wistar rats using Freund’s complete adjuvant (FCA)-induced arthritis. Arthritis was induced by a single intra-plantar injection of 0.1 mL FCA into the left hind paw on day 0. Animals were allocated to five groups (n = 6 per group): normal control, FCA control (positive control), methotrexate (standard), pure CucB, and CucB-NS. Treatments were administered by oral gavage at a dose of 4 mg/kg body weight via per oral route once daily throughout the treatment period [31]. CucB and CucB-NS were administered at 4 mg/kg body weight once daily for 28 days, starting on day 7 after FCA injection.
Disease progression was assessed by paw volume, joint diameter, and clinical arthritis score. Paw volume was measured using a digital plethysmometer and expressed in milliliters. Joint diameter was measured with a digital Vernier caliper and expressed in millimeters. Arthritis severity was scored for erythema, swelling, and joint deformity using a 0–4 scale for each paw, where 0 represented normal appearance and 4 represented severe inflammation. At the end of the study, animals were euthanized and tissues were collected for histopathology and biomarker analysis [34].
2.13. Synovial Inflammatory Biomarkers
At the end of the arthritis experiment, animals were anesthetized and synovial fluid was collected by needle aspiration through the stifle joint. Samples were stored at −80 °C until analysis. Concentrations of tumor necrosis factor-α, interleukin-6, interleukin-1β, C-reactive protein, and cyclooxygenase-2 were quantified using rat-specific enzyme-linked immunosorbent assay kits according to the manufacturers’ instructions. Standards and synovial-fluid samples were added to antibody-coated microplates and incubated under the kit-specified conditions. After washing, enzyme-conjugated detection antibodies and substrate were added sequentially, and absorbance was measured according to the kit protocol. Cytokine concentrations were expressed in pg/mL and CRP concentrations in ng/mL. Six biological samples were analyzed per treatment group, and group-level means were used for statistical analysis [35]. The manufacturer, catalog number, assay range, detection limit, and intra- and inter-assay precision should be reported for each kit.
2.14. Hematological Analysis
At the end of the experimental period, blood was collected from animals in the four arthritis groups into EDTA-coated tubes. Red blood cell count, white blood cell count, platelet count, and hemoglobin concentration were measured using standard hematological procedures. Hematological results were reported using the units generated by the analyzer or validated assay rather than as percentages of total leukocytes unless the measured variable was a leukocyte differential. Measurements were performed in technical triplicate where applicable, while the animal-not the technical replicate-was treated as the biological experimental unit.
2.15. Histopathology
For joint histopathology, knee joints were excised after euthanasia, fixed in 10% neutral-buffered formalin, decalcified in EDTA, processed routinely, and embedded in paraffin. Sections of knee joint were cut (4–5 µm thick), stained with hematoxylin and eosin, and examined by a blinded observer using light microscopy, following the method reported previously [36]. Joint sections were evaluated for synovial hyperplasia, inflammatory-cell infiltration, pannus formation, cartilage erosion, joint-space narrowing, and bone destruction.
Liver and spleen samples were fixed in 10% neutral-buffered formalin, processed for paraffin embedding, sectioned at 4–5 µm, and stained with hematoxylin and eosin. Liver sections were examined for hepatocellular degeneration, necrosis, inflammatory infiltration, and architectural changes. Spleen sections were assessed for changes in white- and red-pulp architecture, lymphoid depletion, and inflammatory alterations. Histological assessment was performed by an observer blinded to treatment allocation, and representative photomicrographs were acquired for group comparison. The scoring rubric, number of fields examined per tissue, and method used to select representative fields should be specified before submission.
2.16. Stability Study
The optimized CucB nanosuspension was filled into amber glass vials, sealed, and stored at 4 ± 2 °C. Samples were withdrawn at 0, 1, 2, and 3 months and evaluated for visible color change, aggregation, phase separation, redispersibility after gentle shaking, particle size, zeta potential, and polydispersity index. Changes from baseline were expressed as percentage change from the initial value. Measurements were performed in triplicate and are reported as mean ± standard deviation. Chemical stability should be confirmed by assaying CucB content at each time point; if chemical stability was not measured, the study should be described as a physical-stability assessment rather than a combined physical and chemical stability study.
2.17. Statistical Analysis
Design generation and response-surface analysis were performed using Design-Expert® version 13.0.5.0 (Stat-Ease Inc., Minneapolis, MN, USA). Raw-data visualization and additional statistical analyses were performed using Origin version 8.5 (OriginLab Corporation, Northampton, MA, USA) and GraphPad Prism version 10.3.1 (GraphPad Software, LLC, San Diego, CA, USA). Data are presented as mean ± standard deviation unless otherwise stated. The statistical test used for each comparison, the assumptions assessed before analysis, the multiple-comparison correction, and the definition of the biological and technical experimental units should be specified in the corresponding results or figure legends. Statistical significance was defined as a two-sided p value < 0.05.
For the Box–Behnken study, model adequacy should be reported using analysis of variance, lack-of-fit testing, coefficient estimates with confidence intervals, and residual diagnostics. For dissolution, permeation, pharmacokinetic, biomarker, hematological, and histopathological outcomes, statistical comparisons should be selected according to the experimental design rather than applying a single test to all endpoints. Repeated measurements from the same animal should be analyzed with a repeated-measures model or an equivalent method that accounts for within-animal correlation. The final report should state any exclusions, missing observations, and whether analyses were prespecified.
3. Results
3.1. Formulation Development and Optimization
CucB nanosuspensions were prepared by antisolvent precipitation using Soluplus® as the stabilizer. Fifteen experimental formulations (F1–F15) were evaluated for particle size, zeta potential, and polydispersity index (PDI) during the Box–Behnken optimization (Table 2). Particle size across the design space ranged from 201 ± 3.8 to 404 ± 3.2 nm. F2 produced the smallest particle size among the design batches. A numerical desirability function was subsequently used to identify the optimized formulation, designated F16. The optimized suspension was uniform and opalescent on visual inspection, with no visible aggregation or sedimentation during initial observation.
Table 2.
Physicochemical characterization of different CucB-NS.
3.2. Box–Behnken Model Performance
A three-factor Box–Behnken design was used to evaluate the effects of Soluplus® concentration, sonication time, and sonication power on particle size, zeta potential, and PDI (Table 2). The selected response models were statistically significant by analysis of variance, and their lack-of-fit tests were nonsignificant [37]. The optimized formulation was predicted at 1% w/v Soluplus®, 18.08 min sonication time, and 75 W sonication power. The predicted responses were 201.12 nm for particle size, −19.89 mV for zeta potential, and 0.115 for PDI. Experimental confirmation gave 201.12 ± 2.21 nm, −19.89 ± 1.89 mV, and 0.115 ± 0.023, respectively. Prediction errors for all three responses were below 5%, indicating agreement between the model predictions and confirmation batch.
3.3. Particle Size Response (Y1)
Particle size was described by a quadratic model. The model was significant (F = 7.12, p = 0.0297), with an adjusted R2 of 0.9863 and a predicted R2 of 0.9001. Lack of fit was not significant (p = 0.1889). The response-surface and contour plots showed that particle size decreased as Soluplus® concentration, sonication time, and sonication power increased within the investigated design space (Figure 1A,B). The curved response surfaces indicated nonlinear effects and interactions among the factors. The predicted-versus-actual plot showed close alignment of the experimental observations with the model estimates (Figure 1C).
Figure 1.
Response-surface analysis of particle size. (A) Three-dimensional response surface, (B) contour plot showing the interaction between Soluplus® concentration and sonication time, and (C) predicted-versus-actual plot. The color gradient represents particle size.
The mathematical model generated for PS is expressed by Equation (4):
PS (Y1) = 273 + 1.63X1 − 69.50X2 − 26.88X3 − 9.75X1X2 − 9.50X1X3 + 12.75X2X3 + 3.75X12 + 15.50X22 + 1.25X32
3.4. Zeta-Potential Response (Y2)
Zeta potential ranged from −11.5 ± 1.2 to −20.3 ± 2.5 mV across the 15 experimental runs (Table 2). A linear model provided the best fit for this response. The model was significant (F = 31.32, p < 0.0001), with R2 = 0.8952, adjusted R2 = 0.8666, and predicted R2 = 0.8139. Lack of fit was not significant (p = 0.8364), and the adequate-precision ratio was 16.62. All three investigated factors had negative coefficients; increasing Soluplus® concentration, sonication time, or sonication power therefore shifted the measured zeta potential toward more negative values. Soluplus® concentration showed the strongest effect (p < 0.0001). The response surfaces were approximately linear, and the predicted-versus-actual plot indicated agreement between predicted and observed values (Figure 2A–C).
Figure 2.
Response-surface analysis of zeta potential. (A) Three-dimensional response surface, (B) contour plot showing the interaction between Soluplus® concentration and sonication time, and (C) predicted-versus-actual plot.
The mathematical model generated for ZP (Y2) is expressed by Equation (5):
ZP (Y2) = −16.17 − 3.31X1 − 0.6875X2 − 0.2034X3
3.5. PDI Response and Numerical Optimization
PDI ranged from 0.166 ± 0.018 to 0.463 ± 0.024 across the design batches (Table 2). A two-factor interaction model was selected for PDI. The model was significant (F = 975.33, p < 0.0001), with R2 = 0.9986, adjusted R2 = 0.9976, and predicted R2 = 0.9964. Lack of fit was not significant (p = 0.6874), and the adequate-precision ratio was 116.9462. Soluplus® concentration had the strongest effect on PDI (p < 0.0001), whereas sonication time and power had smaller effects. The response surfaces were approximately linear, and the predicted-versus-actual plot showed close agreement between observed and predicted values (Figure 3A–C).
Figure 3.
Response-surface analysis of PDI. (A) Three-dimensional response surface, (B) contour plot, and (C) predicted-versus-actual plot.
The formulation was optimized by minimizing particle size and PDI while maximizing the magnitude of zeta potential. The selected conditions were 1% w/v Soluplus®, 18.08 min sonication time, and 75 W sonication power, with an overall desirability of 0.981. The confirmation batch, F16, produced 201.12 ± 2.21 nm particles, a PDI of 0.115 ± 0.023, and a zeta potential of −19.89 ± 1.89 mV. Particle size and zeta potential for F16 are shown in Figure 4.
Figure 4.
(A) Particle size and (B) zeta potential of the optimized CucB nanosuspension batch, F16.
3.6. Equilibrium Solubility
The optimized CucB nanosuspension exhibited higher aqueous saturation solubility than pure CucB (Figure 5). Solubility was 18.5 ± 1.5 µg/mL for CucB-NS and 5.6 ± 1.3 µg/mL for pure CucB, corresponding to an approximately 3.3-fold increase. The difference was statistically significant (p = 0.0003; unpaired two-tailed t-test; n = 3).
Figure 5.
Aqueous saturation solubility of pure CucB and optimized CucB nanosuspension after 24 h of shaking equilibration at 25 ± 2 °C. Data are mean ± SD (n = 3). Statistical significance was evaluated by an unpaired t-test (two-tailed); *** p = 0.0003 in comparison to pure CucB.
3.7. Structural and Morphological Characterization
3.7.1. FTIR Spectroscopy
FTIR spectra of pure CucB, the CucB–Soluplus® physical mixture, and F16 are shown in Figure 6A. Pure CucB showed characteristic bands at 3504 cm−1 for O–H stretching, 1720 and 1695 cm−1 for carbonyl stretching, and 1373 and 1251 cm−1 for C–H bending. The physical mixture retained these bands without an evident shift. In F16, the O–H band shifted to 3419 cm−1 and the carbonyl band shifted to 1737 cm−1; the bands at 1373 and 1251 cm−1 also showed reduced intensity.
Figure 6.
Structural characterization of pure CucB, the CucB–Soluplus® physical mixture, and lyophilized F16. (A) FTIR spectra recorded from 4000 to 500 cm−1. (B) DSC thermograms recorded from 50 to 400 °C. (C) PXRD patterns recorded over 2θ = 15–30°.
3.7.2. Differential Scanning Calorimetry
The DSC thermograms are shown in Figure 6B. Pure CucB exhibited a sharp endothermic melting event at approximately 173.5 °C. The physical mixture showed a lower-intensity thermal event in the same temperature region. The lyophilized CucB nanosuspension displayed broadening and a marked reduction in the melting endotherm.
3.7.3. Powder X-Ray Diffraction
Pure CucB produced multiple sharp, high-intensity diffraction reflections consistent with a crystalline structure (Figure 6C). The physical mixture retained the characteristic CucB reflections, although their intensity was reduced. In the lyophilized CucB nanosuspension, the crystalline reflections were markedly attenuated, and a broad amorphous halo was observed.
3.7.4. Scanning Electron Microscopy
SEM images of F16 showed predominantly near-spherical particles with rough, folded surface features and no prominent fused aggregates (Figure 7). Individual image-based particle dimensions ranged from 204.7 to 240.2 nm, broadly consistent with the hydrodynamic particle size measured by dynamic light scattering (approximately 201 nm).
Figure 7.
SEM micrographs of the optimized CucB nanosuspension. The left panel shows an individual particle; the right panel shows a representative field containing particles measured at 220.2, 230.9, and 240.2 nm.
3.8. HPLC Performance
The HPLC method produced a distinct CucB peak at a retention time of approximately 15.78 min, with no apparent co-eluting peaks within the analytical run (Figure 8A). The calibration curve was linear over 0.5–250 µg/mL, with R2 = 0.997. The regression equation was y = 2961.5x + 2108 (Figure 8B). The parameters of the previously reported method by Kim et al. (2022) [27] were verified and are summarized in Supplementary Table S3.
Figure 8.
HPLC analysis of CucB. (A) Representative chromatogram showing the CucB peak at 15.78 min. (B) Calibration curve over 0.5–250 µg/mL; regression equation y = 2961.5x + 2108, R2 = 0.997.
3.9. In Vitro Dissolution and Release Kinetics
The optimized CucB nanosuspension showed greater cumulative dissolution than pure CucB under the test conditions (Figure 9). At 24 h, cumulative release was 61.93 ± 2.45% from CucB-NS and 29.89 ± 4.32% from pure CucB. Data are presented as mean ± SD (n = 3).
Figure 9.
In vitro dissolution profiles of pure CucB and optimized CucB nanosuspension at 37 ± 0.5 °C. Data are mean ± SD (n = 3).
The dissolution profile of F16 was fitted to zero-order, first-order, Higuchi, and Korsmeyer–Peppas models (Table 3). The Korsmeyer–Peppas model gave the highest coefficient of determination (R2 = 0.982 ± 0.022), followed by the zero-order (R2 = 0.969 ± 0.014), first-order (R2 = 0.937 ± 0.022), and Higuchi (R2 = 0.786 ± 0.024) models. The release exponent was n = 0.3572. Within the applicable range of the model, this value was consistent with a predominantly Fickian diffusion-controlled release pattern; the result is interpreted as indicative rather than definitive evidence of mechanism.
Table 3.
Drug release kinetic parameters of optimized CucB-NS.
3.10. Ex Vivo Permeation
Permeation across excised goat buccal mucosa was evaluated using a Franz diffusion cell (Figure 10). Cumulative permeation at 16 h was 48.9 ± 5.8% for CucB-NS and 26.5 ± 3.4% for pure CucB (n = 3). The CucB nanosuspension showed higher cumulative permeation than pure CucB at the measured time points.
Figure 10.
Ex vivo cumulative permeation of pure CucB and optimized CucB nanosuspension across goat buccal mucosa over 16 h using a Franz diffusion cell. Data are mean ± SD (n = 3).
Permeation parameters are summarized in Table 4. The reported steady-state flux was 120.02 × 10⁻² µg·cm−2·h−1 for CucB-NS and 63.50 × 10⁻⁴ µg·cm−2·h−1 for pure CucB. The reported diffusivity coefficient increased from 0.951 × 10⁻¹ to 1.749 × 10⁻¹ mg·cm−2·h−1, and the apparent permeability coefficient increased from 0.653 × 10⁻¹ to 1.200 × 10⁻¹ cm·h−1 after formulation. The flux units and numerical values should be checked against the underlying calculations before submission because the stated values imply a larger ratio than the approximately 1.9-fold comparison previously reported. The experiment was intended only as a relative, qualitative comparison of how much CucB each formulation can deliver across a biological lipid barrier at pH 6.8, and not as a measure of absolute intestinal permeability. The evidence for improved oral absorption comes from the in vivo pharmacokinetic study in rats (6.87-fold higher AUC0–∞, 3.3-fold higher Cmax), not from the ex vivo data.
Table 4.
Ex vivo permeation parameters of pure CucB and optimized CucB-NS.
3.11. Oral Toxicity
3.11.1. Acute Toxicity
During the 14-day observation period after administration of CucB-NS, no treatment-related mortality or overt clinical signs were observed at 4 mg/kg body weight. No tremors, convulsions, salivation, diarrhea, respiratory distress, or abnormal locomotor behaviour were reported. Grooming, food and water intake, and body-weight progression were comparable with those of untreated animals.
3.11.2. Subacute Toxicity
Daily oral administration of CucB-NS at a dose of 4 mg/kg body weight for 28 days was not associated with mortality or reported treatment-related clinical abnormalities. Behaviour, food and water intake, and general appearance remained normal throughout the study. Body weight increased over time in all groups, with no apparent difference between CucB-NS-treated and control animals.
3.12. Pharmacokinetic Performance
Mean plasma CucB concentrations were higher after administration of the optimized nanosuspension than after pure CucB throughout the 24 H sampling period (Figure 11). Both formulations reached peak concentration at 3 h. Following the peak, concentrations declined more gradually after CucB-NS than after pure CucB.
Figure 11.
Plasma concentration–time profiles after oral administration of pure CucB and optimized CucB nanosuspension in Wistar rats. (A) Mean concentration–time profiles over 24 h, (B) Cmax, and (C) AUC0–∞. Data should be reported using the same biological replicate number as the pharmacokinetic analysis.
AUC0–24 was 183.08 ± 22.28 ng·h/mL for pure CucB and 1231.95 ± 57.09 ng·h/mL for CucB-NS. AUC0–∞ was 184.46 ± 10.49 and 1266.79 ± 54.24 ng·h/mL, respectively (p < 0.0001, unpaired two-tailed t-test). Cmax increased from 35.55 ± 2.66 ng/mL for pure CucB to 116.59 ± 5.25 ng/mL for CucB-NS (p < 0.0001). Tmax was 3.00 ± 0.00 h for both treatments. MRT0–24 was 6.11 ± 0.34 h for pure CucB and 7.84 ± 0.23 h for CucB-NS; MRT0–∞ was 6.27 ± 1.29 and 8.45 ± 0.16 h, respectively. The elimination half-life increased from 3.02 ± 0.44 to 4.09 ± 0.39 h, while the elimination rate constant decreased from 0.232 ± 0.03 to 0.1703 ± 0.01 h−1. Based on AUC0–∞, the reported relative bioavailability of CucB-NS was 686.75 ± 8.01% (Supplementary Table S1).
3.13. Anti-Inflammatory Efficacy in FCA-Induced Arthritis
FCA induction increased the arthritis index, joint diameter, and paw volume relative to the normal group (Figure 12A–C; p < 0.001). The arthritis index was not significantly reduced by pure CucB, whereas both methotrexate and CucB-NS reduced the index relative to the FCA control group (p < 0.001). Joint diameter was also higher in the FCA control group than in the normal group (p < 0.001). Pure CucB produced a smaller but significant reduction in joint diameter (p < 0.005), while methotrexate and CucB-NS produced larger reductions relative to the FCA control group (p < 0.001 for both).
Figure 12.
Effects of pure CucB, CucB nanosuspension, and methotrexate on FCA-induced arthritis. (A) Arthritis index, (B) joint diameter, and (C) paw volume measured on days 0, 7, 14, 21, and 28. Data are mean ± SD (n = 6). Comparisons were performed using one-way ANOVA with Tukey’s post hoc test. ### p < 0.001 versus normal control; * p < 0.01, ** p < 0.005, and *** p < 0.001 versus FCA control; ns, not significant.
Paw volume remained higher in the FCA control group than in the normal group at each assessed time point (p < 0.001). CucB-NS reduced paw volume relative to the FCA control group throughout the observation period (p < 0.001), as did methotrexate. Pure CucB produced a smaller reduction that reached statistical significance on day 0 (p < 0.01) and on days 7–28 (p < 0.005 or p < 0.001, as indicated in Figure 12).
3.14. Synovial Inflammatory Biomarkers
FCA induction increased synovial TNF-α, IL-6, IL-1β, CRP, and COX-2 relative to the normal group (p < 0.001; Figure 13). Methotrexate reduced TNF-α, IL-1β, CRP, and COX-2 relative to the FCA control group (p < 0.001 for each endpoint). Pure CucB reduced TNF-α, IL-1β, CRP, and COX-2 (p < 0.001) and produced a smaller reduction in IL-6 (p < 0.005). CucB-NS reduced all five measured biomarkers relative to the FCA control group (p < 0.001 for each endpoint).
Figure 13.
Synovial inflammatory biomarkers in FCA-induced arthritic rats treated with pure CucB, optimized CucB nanosuspension, or methotrexate. (A) TNF-α, (B) IL-6, (C) IL-1β, (D) CRP, and (E) COX-2. Data are mean ± SD (n = 6). ### p < 0.001 versus normal control; ** p < 0.005 and *** p < 0.001 versus FCA control; one-way ANOVA with Tukey’s post hoc test.
3.15. Hematological Findings
Compared with the normal group, FCA induction decreased RBC count and hemoglobin concentration (p < 0.001 for both) and increased WBC and platelet counts (p < 0.005 and p < 0.001, respectively; Figure 14). Methotrexate increased RBC count (p < 0.005) and hemoglobin concentration (p < 0.001) and reduced WBC count (p < 0.005) relative to the FCA control group; platelet count did not differ significantly from the FCA control group. Pure CucB improved RBC count, WBC count, hemoglobin concentration, and platelet count relative to the FCA control group (p < 0.001 for RBC count, hemoglobin, and platelets; p < 0.005 for WBC count). CucB-NS also improved all four parameters relative to the FCA control group (p < 0.001 for RBC count, hemoglobin, and platelets; p < 0.005 for WBC count), with RBC and hemoglobin values reported as comparable to the normal group.
Figure 14.
Hematological effects of pure CucB, optimized CucB nanosuspension, and methotrexate in FCA-induced arthritic rats. (A) RBC count, (B) WBC count, (C) hemoglobin concentration, and (D) platelet count. Data are mean ± SD (n = 6). Comparisons were performed using one-way ANOVA with Tukey’s post hoc test. ## p < 0.005 and ### p < 0.001 versus normal control; ** p < 0.005 and *** p < 0.001 versus FCA control; ns, not significant.
3.16. Histopathological Findings
3.16.1. Joint Tissue
Normal joints showed intact synovial architecture without evident inflammatory-cell infiltration, synovial hyperplasia, or cartilage degradation (Figure 15A). FCA control joints showed synovial hyperplasia, marked inflammatory-cell infiltration, pannus formation, cartilage degradation, and joint-space narrowing (Figure 15B). Methotrexate reduced inflammatory-cell infiltration and largely preserved joint architecture (Figure 15C). Pure CucB partially reduced inflammatory-cell infiltration and synovial hyperplasia, although pathological changes remained visible (Figure 15D). CucB-NS reduced pannus formation and inflammatory-cell infiltration relative to the FCA control group (Figure 15E). The total histopathological score was higher in the FCA control group than in the normal group (p < 0.001), and all three treatments reduced the score relative to FCA control (p < 0.001 for each). Scores were lowest after methotrexate, followed by CucB-NS and pure CucB.
Figure 15.
Joint histopathology in FCA-induced arthritic rats after H&E staining. (A) Normal, (B) FCA control, (C) methotrexate, (D) pure CucB, and (E) CucB-NS groups. Arrows indicate representative pathological features. (F) Total histopathological score. Data are mean ± SD (n = 6). ### p < 0.001 versus normal control; *** p < 0.001 versus FCA control; one-way ANOVA with Tukey’s post hoc test.
3.16.2. Liver Tissue
Normal liver sections showed preserved hepatocellular and lobular architecture without necrosis or inflammatory infiltration (Figure 16A). FCA control sections showed hepatocellular degeneration, sinusoidal congestion, inflammatory-cell infiltration, and disruption of lobular architecture (Figure 16B). Methotrexate largely preserved hepatic architecture (Figure 16C). Pure CucB reduced congestion and inflammatory infiltration but showed occasional mild hepatocellular changes (Figure 16D). CucB-NS showed near-normal architecture, minimal inflammatory infiltration, and no reported significant hepatocellular necrosis (Figure 16E). The total histopathological score was higher in the FCA control group than in the normal group (p < 0.001). Methotrexate, pure CucB, and CucB-NS each reduced the score relative to FCA control (p < 0.001 for each), with the lowest scores reported for methotrexate and CucB-NS.
Figure 16.
Liver histopathology in FCA-induced arthritic rats. (A) Normal, (B) FCA control, (C) methotrexate, (D) pure CucB, and (E) CucB-NS groups. (F) Total histopathological score. Data are mean ± SD (n = 6). ### p < 0.001 versus normal control; *** p < 0.001 versus FCA control; one-way ANOVA with Tukey’s post hoc test.
3.16.3. Spleen Tissue
Normal spleen sections showed preserved white-pulp and red-pulp architecture with normal lymphoid cellularity (Figure 17A). FCA control sections showed altered white-pulp–red-pulp organization, increased lymphoid cellularity, and inflammatory changes (Figure 17B). Methotrexate largely preserved splenic architecture (Figure 17C). Pure CucB was associated with sinusoidal congestion and areas of reduced lymphoid cellularity (Figure 17D), whereas CucB-NS showed comparatively preserved white-pulp–red-pulp organization with mild congestion (Figure 17E). The total histopathological score was higher in the FCA control group than in the normal group (p < 0.001), and all treatments reduced the score relative to FCA control (p < 0.001 for each). The lowest score was observed in the methotrexate group, followed by CucB-NS and pure CucB.
Figure 17.
Spleen histopathology in FCA-induced arthritic rats. (A) Normal, (B) FCA control, (C) methotrexate, (D) pure CucB, and (E) CucB-NS groups. (F) Total histopathological score. Data are mean ± SD; the biological replicate number should be stated consistently with the corresponding analysis. ### p < 0.001 versus normal control; *** p < 0.001 versus FCA control; one-way ANOVA with Tukey’s post hoc test.
3.17. Stability
The optimized CucB nanosuspension was stored under refrigerated conditions (4 ± 2 °C) for 3 months. No visible change in color or phase separation was observed at 0, 1, 2, or 3 months, and the formulation remained readily redispersible after gentle shaking. Particle size, zeta potential, and PDI values over the storage period are summarized in Supplementary Table S2. These findings support short-term physical stability under the tested refrigerated condition; chemical stability should be discussed only if CucB content was measured during storage.
4. Discussion
This study evaluated whether a Soluplus®-stabilized nanosuspension could overcome the biopharmaceutical limitations of CucB and improve its activity in FCA-induced arthritis. The formulation strategy produced a coherent sequence of changes: the optimized batch had a particle size of 201.12 ± 2.21 nm, PDI of 0.115 ± 0.023, and zeta potential of −19.89 ± 1.89 mV; aqueous solubility increased from 5.6 ± 1.3 to 18.5 ± 1.5 µg/mL; 24 h dissolution increased from 29.89 ± 4.32% to 61.93 ± 2.45%; and oral AUC0–∞ increased from 184.46 ± 10.49 to 1266.79 ± 54.24 ng·h/mL. This pattern supports improved formulation performance, but it does not by itself establish which absorption process caused the pharmacokinetic gain.
The Box–Behnken design identified Soluplus® concentration, sonication time, and sonication power as influential formulation variables. The particle-size response was adequately described by a significant quadratic model (F = 7.12, p = 0.0297; adjusted R2 = 0.9863; predicted R2 = 0.9001; nonsignificant lack of fit, p = 0.1889). Zeta potential was described by a significant linear model (F = 31.32, p < 0.0001; adjusted R2 = 0.8666), whereas PDI was described by a significant two-factor-interaction model (F = 975.33, p < 0.0001; adjusted R2 = 0.9976). The confirmation batch showed prediction errors below 5%, supporting internal agreement between the design model and the optimized preparation. This is evidence of model performance within the investigated design space, not evidence that the formulation will remain optimal after scale-up or under different manufacturing conditions [37,38,39].
The optimized nanosuspension produced approximately 3.3-fold higher equilibrium solubility and approximately two-fold greater 24 h dissolution than pure CucB. These changes are directionally consistent with the expected effects of particle-size reduction, increased surface area, improved wetting, and polymer-mediated stabilization [40]. The Korsmeyer–Peppas model gave the highest R2, and the release exponent (n = 0.3572) was compatible with a Fickian pattern within the applicable model range. Because the formulation is a nanosuspension rather than a classical polymeric matrix, this model result is best treated as an empirical description of the observed profile [41]. It should not be used alone to assign a definitive molecular release mechanism.
The optimized batch showed a narrow particle-size distribution and no visible aggregation during initial observation. FTIR band shifts indicated a changed molecular environment for CucB in the formulation, but they should not be interpreted as proof of a new covalent bond [42]. Attenuation of the CucB melting endotherm and reduced PXRD peak intensity, together with a broad amorphous halo, were consistent with reduced long-range crystallinity or increased structural disorder after processing. These solid-state findings provide a plausible explanation for the improved apparent solubility and dissolution, although quantitative solid-state measurements and post-storage PXRD/DSC would be needed to determine whether the physical state remains unchanged during storage [43]. SEM showed predominantly near-spherical particles without prominent fused aggregates; comparison with DLS should remain qualitative because DLS measures hydrodynamic diameter in dispersion whereas SEM measures dried particles.
CucB-NS also increased 16 h cumulative permeation across goat buccal mucosa from 26.5 ± 3.4% to 48.9 ± 5.8%. This experiment supports improved availability of CucB at the ex vivo membrane interface, but it is not a direct measurement of intestinal absorption. The model lacks the gastrointestinal anatomy, luminal environment, intestinal mucus, metabolic activity, and transporter processes that influence oral exposure. In addition, the reported flux values should be reconciled with the stated units and raw calculations before publication: the numerical values currently presented for the two groups do not yield the approximately 1.9-fold comparison stated in the manuscript. Resolving this discrepancy is necessary before the permeation data can be used to support a quantitative mechanistic claim [44,45,46].
The pharmacokinetic results provide the most direct evidence that the formulation improved oral systemic exposure. Cmax increased from 35.55 ± 2.66 to 116.59 ± 5.25 ng/mL, while AUC0–∞ increased approximately 6.87-fold. Tmax was unchanged at 3 h, suggesting that the principal effect was on the extent rather than the timing of exposure. The longer apparent half-life and mean residence time after CucB-NS are compatible with prolonged systemic exposure, but they may reflect altered absorption as well as changes in disposition. The study did not quantify intestinal permeability in vivo, presystemic metabolism, transporter activity, or lymphatic contribution. Accordingly, improved dissolution and absorption are plausible explanations, not experimentally isolated mechanisms [47].
In the FCA model, CucB-NS reduced arthritis index, paw volume, and joint diameter relative to the untreated arthritic group, and generally produced stronger effects than pure CucB. The formulation also reduced synovial TNF-α, IL-6, IL-1β, CRP, and COX-2. Joint histology was concordant with these functional and biochemical findings: CucB-NS reduced inflammatory-cell infiltration and pannus-related pathology and improved the composite histopathological score. Methotrexate remained the strongest comparator for the histopathological endpoint, so the results support improved performance of the CucB formulation relative to unformulated CucB but do not establish equivalence or superiority to standard therapy [48,49].
The alignment between higher exposure and greater efficacy is biologically plausible, but the study did not formally model exposure–response relationships. The observed pharmacodynamic advantage may therefore reflect increased systemic exposure, altered tissue distribution, local formulation effects, or a combination of these factors. Similarly, reductions in inflammatory biomarkers are consistent with attenuation of FCA-associated inflammation but do not demonstrate direct inhibition of a particular molecular pathway.
Acute dosing produced no reported mortality or overt clinical toxicity over 14 days, and 28-day dosing produced no reported treatment-related clinical abnormalities or adverse body-weight effects. Liver and spleen histology did not show major reported treatment-related injury in the CucB-NS group. These findings support short-term tolerability in this model; they do not establish safety during the chronic exposure likely to be required for rheumatoid arthritis [50,51].
Several limitations constrain the strength and generalizability of the conclusions. First, the study used a small preclinical sample and did not report a formal power calculation, prespecified exclusion criteria, allocation concealment, or complete blinding procedures for all outcome assessments. Second, the treatment duration, dose allocation for the arthritis groups, and methotrexate regimen should be stated consistently and reconciled across the Methods, Results, figures, and legends. Third, the current manuscript contains different reported replicate numbers for some pharmacokinetic and histological outputs; the biological experimental unit and the number of animals contributing to each endpoint should be verified from the raw dataset. Technical replicates should not be treated as independent animals.
Fourth, the goat buccal-mucosa assay is a surrogate permeation model and cannot establish enhanced intestinal absorption. Fifth, the FCA model captures acute inflammatory and joint-swelling features but does not reproduce the full autoimmune pathogenesis, chronicity, and heterogeneity of human RA. Sixth, the formulation study did not isolate the effects of particle size from those of Soluplus®, altered crystallinity, or other process-related changes. A stabilizer-only control, a physical-mixture control in each relevant assay, and mechanistic absorption studies would help address this issue. Seventh, three months of refrigerated storage establishes only short-term physical stability under one condition. Chemical assay, degradation-product profiling, redispersibility after storage, and accelerated and long-term stability studies are needed before shelf-life claims can be made. Finally, the reported permeation units and histopathological scoring framework require technical reconciliation before the conclusions are finalized.
These limitations define the next experimental steps rather than negate the present findings. Future work should include a preregistered or prespecified animal design with adequate power, randomized allocation, blinded outcome assessment, complete dose–response evaluation, and an independent confirmation cohort. Studies using an autoimmune arthritis model, intestinal permeability and absorption experiments, tissue-distribution analysis, and target-engagement measurements would determine whether the observed benefit is driven primarily by increased exposure or by additional formulation effects. Longer-term toxicology and stability studies are also required before clinical translation can be considered.
5. Conclusions
This Soluplus®-stabilized CucB nanosuspension improved the physicochemical and oral biopharmaceutical performance of CucB and enhanced its activity in FCA-induced arthritis relative to unformulated CucB. The optimized formulation combined nanoscale particle size, low PDI, increased aqueous solubility and dissolution, greater ex vivo mucosal permeation, and an approximately 6.87-fold increase in AUC0–∞. These formulation changes were accompanied by lower arthritis scores, reduced paw swelling and joint diameter, suppression of measured synovial inflammatory biomarkers, and improved joint histology. Methotrexate remained the stronger histopathological comparator, and the present data do not establish superiority over standard therapy.
The study therefore supports Soluplus®-stabilized CucB nanosuspension as a promising preclinical formulation strategy, though not yet as a clinically validated treatment. Its principal contribution is the demonstration of a plausible formulation–exposure–response chain that warrants independent confirmation. Translation will require reconciliation of the reported replicate numbers and permeation calculations, mechanistic absorption and tissue-distribution studies, adequately powered and blinded efficacy experiments, chronic toxicology, and long-term chemical and physical stability assessment. Subject to those validations, CucB nanosuspension merits further development as an oral delivery platform for improving the therapeutic performance of poorly soluble anti-inflammatory compounds.
Declaration of Generative AI
We hereby acknowledge the use of ChatGPT (OpenAI, San Francisco, CA, USA, GPT-5.3 web version, accessed 2026) and QuillBot (4.123.0 web version, accessed 2026) for language refinement, sentence restructuring, and paraphrasing to improve the clarity and readability of the manuscript. After paraphrasing, we have carefully reviewed and edited the content as needed and take full responsibility for the content of the published article.
Supplementary Materials
The following supporting information can be downloaded at: https://www.mdpi.com/article/10.3390/scipharm94040103/s1, Table S1: Pharmacokinetic parameters after administration of CucB and CucB-NS; Table S2: Physical stability parameters of the optimized CucB-NS stored at 4 ± 2 °C over 3 months (mean ± SD, n = 3); Table S3: Comparison of Verified values of HPLC from Kim et al. [27] to our findings.
Author Contributions
R.K.: Conceptualization, data curation, formal analysis, investigation, methodology, writing—original draft, writing—review and editing. K.M.: Conceptualization, project administration, data curation, supervision, writing—review and editing. S.K. (Sujeet Kumar): Formal analysis, writing—review and editing. R.S.: Software, validation, writing—review and editing. S.S.P.: Investigation, formal analysis. S.G.: Investigation, formal analysis. S.K. (Sai Kiran): Investigation, formal analysis. All authors have read and agreed to the published version of the manuscript.
Funding
This research received no external funding.
Institutional Review Board Statement
All animal procedures were approved by the Institutional Animal Ethics Committee of KLE College of Pharmacy, Bengaluru, India (approval no. 04/HP/2025; approved 13 December 2025).
Informed Consent Statement
Not applicable.
Data Availability Statement
Data will be available on request.
Acknowledgments
The authors are thankful to the Principal, KLE College of Pharmacy, Bengaluru, for providing the necessary facilities and infrastructure to conduct the research work.
Conflicts of Interest
The authors declare no conflicts of interest.
References
- Black, R.J.; Cross, M.; Haile, L.M.; Culbreth, G.T.; Steinmetz, J.D.; Hagins, H.; Kopec, J.A.; Brooks, P.M.; Woolf, A.D.; Ong, K.L.; et al. Global, regional, and national burden of rheumatoid arthritis, 1990–2020, and projections to 2050: A systematic analysis of the Global Burden of Disease Study 2021. Lancet Rheumatol. 2023, 5, e594–e610. [Google Scholar] [CrossRef] [Scilit] [PubMed]
- Edilova, M.I.; Akram, A.; Abdul-Sater, A.A. Innate immunity drives pathogenesis of rheumatoid arthritis. Biomed. J. 2021, 44, 172–182. [Google Scholar] [CrossRef] [Scilit] [PubMed]
- Kondo, N.; Kuroda, T.; Kobayashi, D. Cytokine Networks in the Pathogenesis of Rheumatoid Arthritis. Int. J. Mol. Sci. 2021, 22, 10922. [Google Scholar] [CrossRef] [Scilit] [PubMed]
- Laeeq, S.; Reghefaoui, T.; Zahoor, H.; Yook, J.H.; Rizwan, M.; Shahid, N.U.A.; Naguit, N.; Jakkoju, R.; Mohammed, L. Effectiveness of biologics and targeted synthetic disease-modifying anti-rheumatic drugs in conjunction with methotrexate for the treatment of early rheumatoid arthritis: A systematic review of randomized controlled trials. Musculoskelet. Care 2022, 20, 471–486. [Google Scholar] [CrossRef] [Scilit]
- Gerganov, G.; Georgiev, T.; Dimova, M.; Shivacheva, T. Vascular effects of biologic and targeted synthetic antirheumatic drugs approved for rheumatoid arthritis: A systematic review. Clin. Rheumatol. 2023, 42, 2651–2676. [Google Scholar] [CrossRef] [Scilit] [PubMed]
- Delgado-Tiburcio, E.E.; Cadena-Iñiguez, J.; Santiago-Osorio, E.; Ruiz-Posadas, L.D.M.; Castillo-Juárez, I.; Aguiñiga-Sánchez, I.; Soto-Hernández, M. Pharmacokinetics and Biological Activity of Cucurbitacins. Pharmaceuticals 2022, 15, 1325. [Google Scholar] [CrossRef] [Scilit] [PubMed]
- Yin, D.; Chen, H.; Lin, S.; Sun, Y.; Jing, X.; Chang, R.; Feng, Y.; Dong, X.; Qu, C.; Ni, J.; et al. Recent Advances in the Application of Cucurbitacin B as an Anticancer Agent. Int. J. Mol. Sci. 2025, 26, 8003. [Google Scholar] [CrossRef] [Scilit] [PubMed]
- Park, S.Y.; Kim, Y.H.; Park, G. Cucurbitacins attenuate microglial activation and protect from neuroinflammatory injury through Nrf2/ARE activation and STAT/NF-κB inhibition. Neurosci. Lett. 2015, 609, 129–136. [Google Scholar] [CrossRef] [Scilit] [PubMed]
- Kung, S.-P.; Umbreen, H.; Wang, J.-H.; Tsia, C.-M.; Lin, T.C.-C.; Chen, Y.-T. Cucurbitacin B inhibits Th17 cell differentiation via the suppression of the JAK/STAT pathway and alleviates collagen-induced arthritis in mice. Int. J. Immunopathol. Pharmacol. 2025, 39, 03946320251348715. [Google Scholar] [CrossRef] [Scilit] [PubMed]
- Xiao, Y.; Zhao, Q.; Wu, Q.; Chang, J.; Xue, H.; Liu, C.; Liu, X. A new sensitive UPLC-MS/MS method for the determination of cucurbitacin B in rat plasma: Application to an absolute bioavailability study. RSC Adv. 2018, 8, 30978–30985. [Google Scholar] [CrossRef] [Scilit] [PubMed]
- Jacob, S.; Kather, F.S.; Boddu, S.H.S.; Attimarad, M.; Nair, A.B. Nanosuspension Innovations: Expanding Horizons in Drug Delivery Techniques. Pharmaceutics 2025, 17, 136. [Google Scholar] [CrossRef] [Scilit] [PubMed]
- Tekade, A.; Kadam, P.; Jagdale, S.; Surwade, S.; Gaikwad, A.; Pawar, P.; Shinde, R. Exploring Potential of Nano-formulations in the Treatment of Alzheimer’s Disease through Nasal Route. Curr. Alzheimer Res. 2025, 21, 693–709. [Google Scholar] [CrossRef] [Scilit] [PubMed]
- Mok, Z.H. The Effect of Particle Size on Drug Bioavailability in Various Parts of the Body. Pharm. Sci. Adv. 2024, 2, 100031. [Google Scholar] [CrossRef] [Scilit] [PubMed]
- Jahan, N.; Kousar, F.; Rahman, K.U.; Touqeer, S.I.; Abbas, N. Development of Nanosuspension of Artemisia absinthium Extract as Novel Drug Delivery System to Enhance Its Bioavailability and Hepatoprotective Potential. J. Funct. Biomater. 2023, 14, 433. [Google Scholar] [CrossRef] [Scilit] [PubMed]
- Zafar, F.; Jahan, N.; Bhatti, H.; Khalil-Ur-Rahman. Increased Oral Bioavailability of Piperine from an Optimized Piper nigrum Nanosuspension. Planta Med. 2019, 85, 249–257. [Google Scholar] [CrossRef] [Scilit] [PubMed]
- Wu, Q.; Huang, Z.; Xiao, Y.; Chang, J.; Liu, P.; Liu, C.; Liu, X. Preparation, characterization and pharmacokinetics of Cucurbitacin B solid dispersion. OpenNano 2022, 8, 100088. [Google Scholar] [CrossRef] [Scilit]
- Kapourani, A.; Barmpalexis, P. High Drug-Loading Amorphous Solid Dispersions. In Amorphous Solid Dispersions, 2nd ed.; Nikolakakis, I., Partheniadis, I., Eds.; Springer Nature: Cham, Switzerland, 2026; Volume 5, pp. 239–267. [Google Scholar]
- Ma, Y.; Cong, Z.; Gao, P.; Wang, Y. Nanosuspensions technology as a master key for nature products drug delivery and In vivo fate. Eur. J. Pharm. Sci. 2023, 185, 106425. [Google Scholar] [CrossRef] [Scilit] [PubMed]
- Malode, T.D.; Pillare, S.B.; Shahi, A.K.; Lade, S.N.; Taksande, J.B.; Umekar, M.J. Cubosomes as Versatile Nanocarriers: Insights into Composition, Mechanisms, and Therapeutic Applications. Biomed. Mater. Devices. 2026, 4, 2810–2831. [Google Scholar] [CrossRef] [Scilit]
- Guembe-Michel, N.; Nguewa, P.; González-Gaitano, G. Soluplus®-Based Pharmaceutical Formulations: Recent Advances in Drug Delivery and Biomedical Applications. Int. J. Mol. Sci. 2025, 26, 1499. [Google Scholar] [CrossRef] [Scilit] [PubMed]
- Zi, P.; Zhang, C.; Ju, C.; Su, Z.; Bao, Y.; Gao, J.; Sun, J.; Lu, J.; Zhang, C. Solubility and bioavailability enhancement study of lopinavir solid dispersion matrixed with a polymeric surfactant—Soluplus. Eur. J. Pharm. Sci. 2019, 134, 233–245. [Google Scholar] [CrossRef] [Scilit] [PubMed]
- Alshweiat, A.; Abu-Alkebash, E.; Abuawad, A.; Athamneh, T.; Abukhamees, S.; Oqal, M. Preparation and characterization of soluplus-based nanosuspension for dissolution enhancement of indomethacin using ultrasonic assisted precipitation method for formulation and Box-Behnken design for optimization. Drug Dev. Ind. Pharm. 2024, 50, 878–891. [Google Scholar] [CrossRef] [Scilit] [PubMed]
- Arslan, A.; Yet, B.; Nemutlu, E.; Akdağ Çaylı, Y.; Eroğlu, H.; Öner, L. Celecoxib Nanoformulations with Enhanced Solubility, Dissolution Rate, and Oral Bioavailability: Experimental Approaches over In Vitro/In Vivo Evaluation. Pharmaceutics 2023, 15, 363. [Google Scholar] [CrossRef] [Scilit] [PubMed]
- Mamand, D.M.; Muhammad, D.S.; Aziz, S.B.; Hama, P.O.; Al-Asbahi, B.A.; Ahmed, A.A.; Hassan, J. Enhanced Optical Properties of Chitosan Polymer Doped with Orange Peel Dye Investigated via UV–Vis and FTIR Analysis. Sci. Rep. 2025, 15, 3232. [Google Scholar] [CrossRef] [Scilit] [PubMed]
- Akour, Y.A.; Aljaberi, A.; Hamed, S.H.; Altaher, A.; Migdadi, E.M. Preparation, Characterization and In Vitro Evaluation of Atorvastatin Nanosuspensions. PLoS ONE 2025, 20, e0335024. [Google Scholar] [CrossRef] [Scilit] [PubMed]
- Ahirrao, S.P.; Bhambere, D.S.; Ahire, E.D.; Dashputre, N.L.; Kakad, S.P.; Laddha, U.D. Formulation and evaluation of Olmesartan Medoxomil nanosuspension. Mater. Today Proc. 2023. [Google Scholar] [CrossRef] [Scilit]
- Kim, H.J.; Lee, J.Y.; Cheon, C.; Ko, S.-G. Development and Validation of a New Analytical HPLC-PDA Method for Simultaneous Determination of Cucurbitacins B and D from the Roots of Trichosanthes kirilowii. J. Chem. 2022, 2022, 2109502. [Google Scholar] [CrossRef] [Scilit]
- Shaikh, F.; Patel, M.; Patel, V.; Patel, A.; Shinde, G.; Shelke, S.; Pathan, I. Formulation and optimization of cilnidipine loaded nanosuspension for the enhancement of solubility, dissolution and bioavailability. J. Drug Deliv. Sci. Technol. 2022, 69, 103066. [Google Scholar] [CrossRef] [Scilit]
- Manu, G.P.; Narh, D.; Asimeng, B.; Kwakye, N.; Abusuapa, B.A.; Appuing, D.; Nyankson, E.; Efavi, J.K. Characterization of Chitosan/Zeolite drug delivery composite and curcumin release kinetics in a simulated pH environment. Sci. Afr. 2025, 28, e02668. [Google Scholar] [CrossRef] [Scilit]
- Palanisamy, P.; Crossia, W.F.; Prakash, D.; Antonyraj, A.P. Nanoformulation of Stavudine-Loaded Niosomes: Enhancing Drug Delivery, Entrapment Efficiency, and Controlled Release for Improved Antiretroviral Therapy. J. Orthop. Rep. 2026, 5, 100677. [Google Scholar] [CrossRef] [Scilit]
- Shastry, P.; Jose, J.; Khot, K.B.; Gopan, G.; Shetty, S.S.; Sangamesh, V.C. Nanostructured lipid carriers of lutein-based dissolving microneedle patch: A promising approach for the management of rheumatoid arthritis. Nanomedicine 2026, 76, 102985. [Google Scholar] [CrossRef] [Scilit] [PubMed]
- Suryawanshi, A.; Ratnaparkhi, M.; Shinde, R. Preclinical evaluation of cilnidipine nanosponges for enhanced oral bioavailability and sustained antihypertensive efficacy. Ann. Pharm. Fr. 2026. [Google Scholar] [CrossRef] [Scilit] [PubMed]
- Elmowafy, M.; Ibrahim, H.M.; Ahmed, M.A.; Shalaby, K.; Salama, A.; Hefesha, H. Atorvastatin-loaded nanostructured lipid carriers (NLCs): Strategy to overcome oral delivery drawbacks. Drug Deliv. 2017, 24, 932–941. [Google Scholar] [CrossRef] [Scilit] [PubMed]
- Mukherjee, S.; Ghosh, P.; Naskar, S.; Ehsan, I.; Roy, T.; Dutta, A.; Paul, S.; Jana, A.; Karati, D.; Paul, A.; et al. Design and optimization of diacerein loaded lipid nanocarriers: Characterization, in vitro and in vivo evaluation for anti-arthritic activity. Nanomedicine 2026, 73, 102914. [Google Scholar] [CrossRef] [Scilit] [PubMed]
- Gundogdu, K.; Gundogdu, G.; Demirkaya Miloglu, F.; Demirci, T.; Tascı, S.Y.; Abd El-Aty, A.M. Anti-Inflammatory Effects of Boric Acid in Treating Knee Osteoarthritis: Biochemical and Histopathological Evaluation in Rat Model. Biol. Trace Elem. Res. 2024, 202, 2744–2754. [Google Scholar] [CrossRef] [Scilit] [PubMed]
- Akhter, S.; Irfan, H.M.; Alamgeer; Jahan, S.; Shahzad, M.; Latif, M.B. Nerolidol: A potential approach in rheumatoid arthritis through reduction of TNF-α, IL-1β, IL-6, NF-kB, COX-2 and antioxidant effect in CFA-induced arthritic model. Inflammopharmacology 2022, 30, 537–548. [Google Scholar] [CrossRef] [Scilit] [PubMed]
- Kumar, R.; Thakur, A.K.; Chaudhari, P.; Banerjee, N. Particle Size Reduction Techniques of Pharmaceutical Compounds for the Enhancement of Their Dissolution Rate and Bioavailability. J. Pharm. Innov. 2022, 17, 333–352. [Google Scholar] [CrossRef] [Scilit]
- Khorasani, M.A.; Naghib, S.M.; Jafari, T.; Takdehghan, G. Recent Advances in Engineering Chitosan-Based Nanoplatforms in Biotherapeutic Multi-Delivery for Multi-Targeted Disease Treatments: Promises and Outlooks. Colloid Interface Sci. Commun. 2025, 69, 100861. [Google Scholar] [CrossRef] [Scilit]
- Pardhi, E.; Tomar, D.S.; Khemchandani, R.; Srivastava, V.; Pawar, A.; Yadav, R.; Goud, D.; Godugu, C.; Samanthula, G.; Mehra, N.K. Enhancing solubility, bioavailability and anti-cancer efficacy of aprepitant through a naringin-based co-amorphous system. J. Mol. Liq. 2025, 425, 127225. [Google Scholar] [CrossRef] [Scilit]
- Budiman, A.; Nurani, N.V.; Laelasari, E.; Muchtaridi, M.; Sriwidodo, S.; Aulifa, D.L. Effect of Drug–Polymer Interaction in Amorphous Solid Dispersion on the Physical Stability and Dissolution of Drugs: The Case of Alpha-Mangostin. Polymers 2023, 15, 3034. [Google Scholar] [CrossRef] [Scilit] [PubMed]
- Nedelkov, I.; Đuriš, J.; Dragašević Mišković, N.; Stojković Lalošević, M.; Cvijić, S. Patient-centric dissolution testing for oral drug products: From disease-specific gastrointestinal physiology to biopredictive in vitro methods. J. Drug Deliv. Sci. Technol. 2026, 126, 108774. [Google Scholar] [CrossRef] [Scilit]
- Liu, P.; Zhou, J.; Chang, J.; Liu, X.; Xue, H.; Wang, R.; Li, Z.; Li, C.; Wang, J.; Liu, C. Soluplus-Mediated Diosgenin Amorphous Solid Dispersion with High Solubility and High Stability: Development, Characterization and Oral Bioavailability. Drug Des. Dev. Ther. 2020, 14, 2959–2975. [Google Scholar] [CrossRef] [Scilit] [PubMed]
- Takbirgou, H.; Salami, M.; Askari, G.; Emam-Djomeh, Z.; Löbenberg, R.; Serpe, M.J.; Davies, N.M.; Lai, W.F. Development and Evaluation of Alginate-Based Gastroretentive Raft-Forming Systems Enabling Sustained Release of Propolis in Gastric Ulcer Treatment. Drug Deliv. 2026, 33, 2616887. [Google Scholar] [CrossRef] [Scilit] [PubMed]
- Skrdla, P.J.; Coscia, B.J.; Brock, C.; Hughes, T.; Giesen, D.; Winget, P. Molecular Dynamics Insights into Ibuprofen Nanocrystal Dissolution Put in the Context of Classical Nucleation Theory. Mol. Pharm. 2026, 23, 1089–1100. [Google Scholar] [CrossRef] [Scilit] [PubMed]
- Zaborenko, N.; Shi, Z.; Corredor, C.C.; Smith-Goettler, B.M.; Zhang, L.; Hermans, A.; Neu, C.M.; Alam, M.A.; Cohen, M.J.; Lu, X.; et al. First-Principles and Empirical Approaches to Predicting In Vitro Dissolution for Pharmaceutical Formulation and Process Development and for Product Release Testing. AAPS J. 2019, 21, 32. [Google Scholar] [CrossRef] [Scilit] [PubMed]
- Imono, M.; Uchiyama, H.; Ueda, H.; Kadota, K.; Tozuka, Y. In-situ dissolution and permeation studies of nanocrystal formulations with second-derivative UV spectroscopy. Int. J. Pharm. 2019, 558, 242–249. [Google Scholar] [CrossRef] [Scilit] [PubMed]
- Asenso, J.; Yu, J.; Xiao, F.; Zhao, M.; Wang, J.; Wu, Y.; Wang, C.; Wei, W. Methotrexate improves the anti-arthritic effects of Paeoniflorin-6′-O-benzene sulfonate by enhancing its pharmacokinetic properties in adjuvant-induced arthritis rats. Biomed. Pharmacother. 2019, 112, 108644. [Google Scholar] [CrossRef] [Scilit] [PubMed]
- Abdulkhaleq, L.A.; Assi, M.A.; Abdullah, R.; Zamri-Saad, M.; Taufiq-Yap, Y.H.; Hezmee, M.N.M. The crucial roles of inflammatory mediators in inflammation: A review. Vet. World 2018, 11, 627–635. [Google Scholar] [CrossRef] [Scilit] [PubMed]
- Ageeva, T.; Rizvanov, A.; Mukhamedshina, Y. NF-κB and JAK/STAT Signaling Pathways as Crucial Regulators of Neuroinflammation and Astrocyte Modulation in Spinal Cord Injury. Cells 2024, 13, 581. [Google Scholar] [CrossRef] [Scilit] [PubMed]
- Saluja, S.; Bansal, I.; Bhardwaj, R.; Beg, M.S.; Palanichamy, J.K. Inflammation as a driver of hematological malignancies. Front. Oncol. 2024, 14, 1347402. [Google Scholar] [CrossRef] [Scilit] [PubMed]
- Zhang, X.; Yuan, B.; Li, C.; Wang, H.; Wei, S.; Tian, J.; Duan, S. Preclinical Evaluation of the Oral Toxicity, Genotoxicity, and Safety Pharmacology of LPM4870108, a Novel Potent Tropomyosin Receptor Kinase Inhibitor. Pharmacol. Res. Perspect. 2025, 13, e70153. [Google Scholar] [CrossRef] [Scilit] [PubMed]
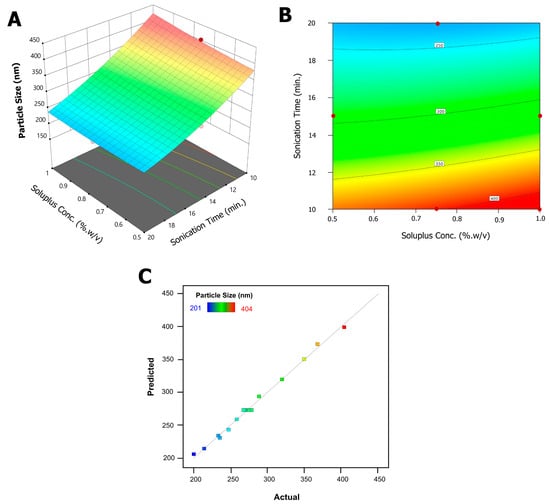
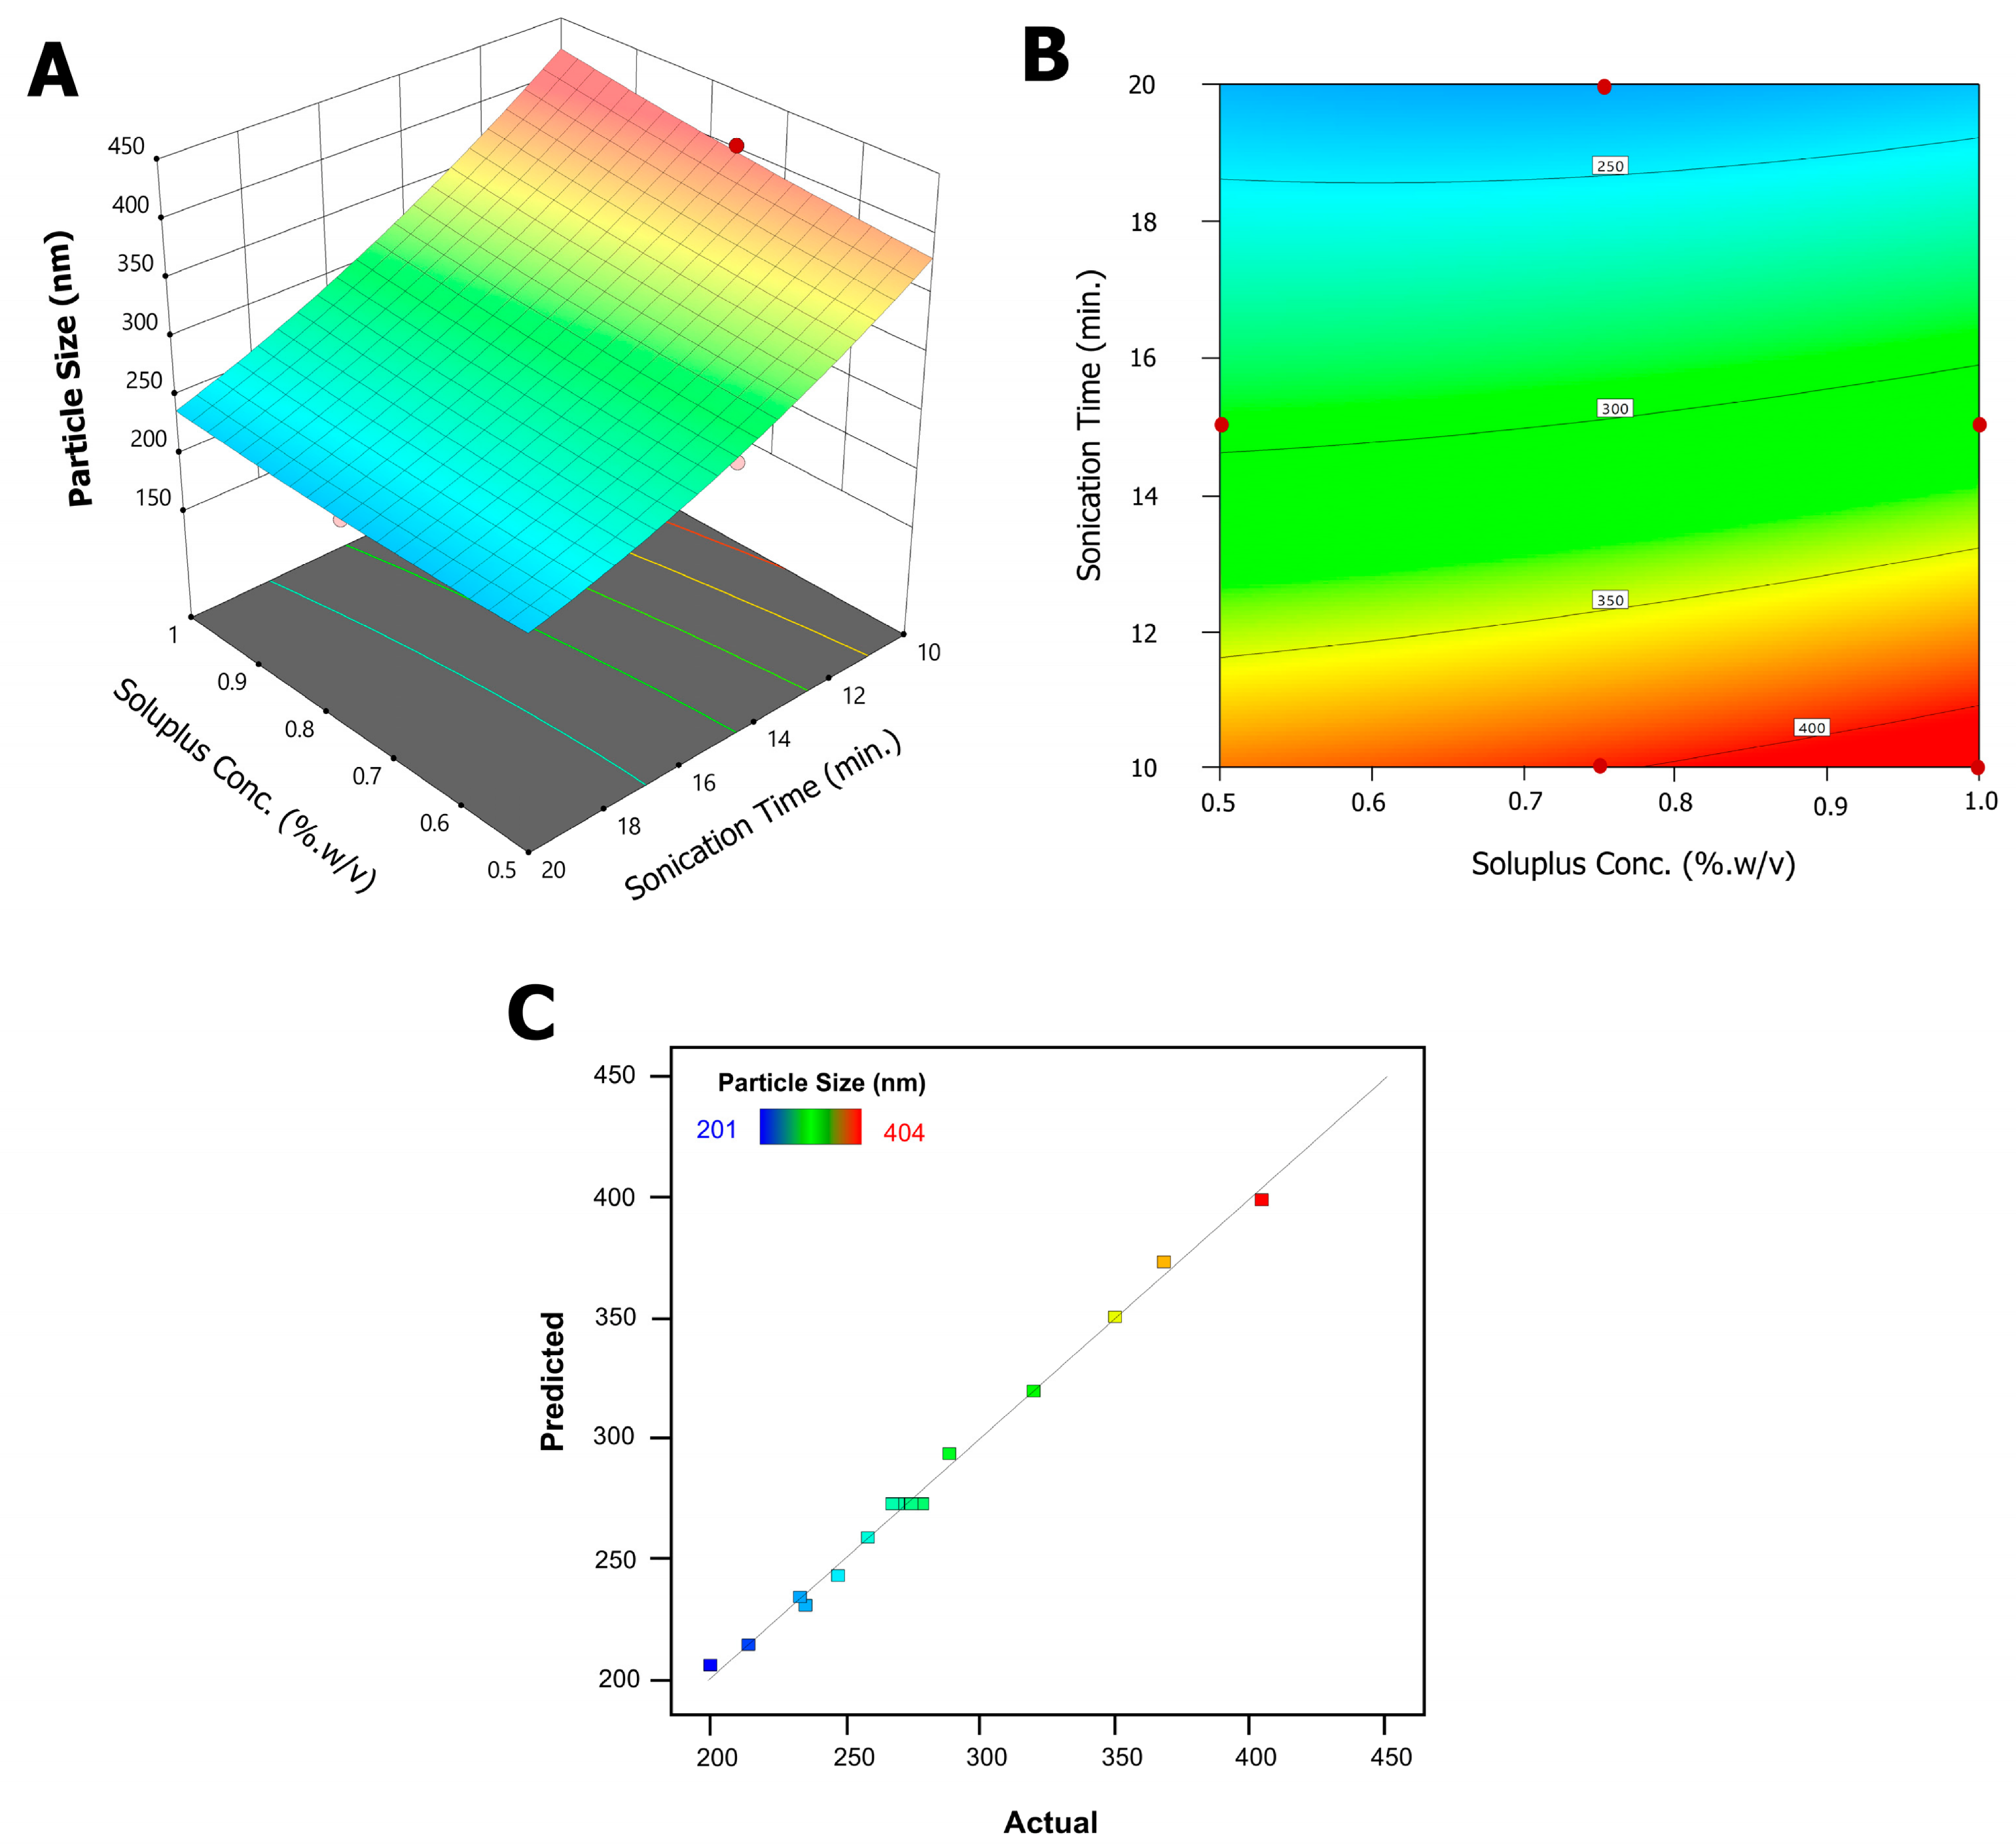
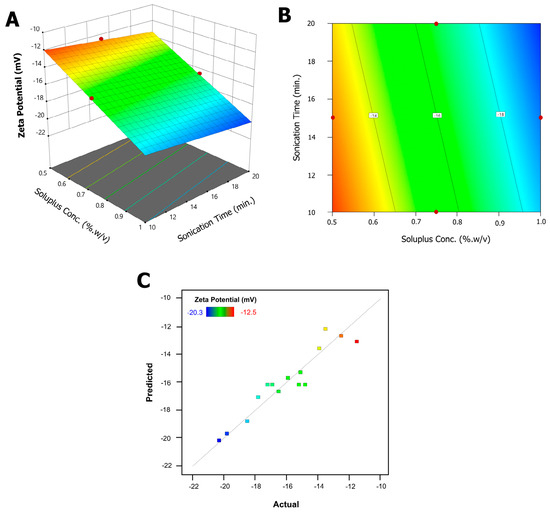
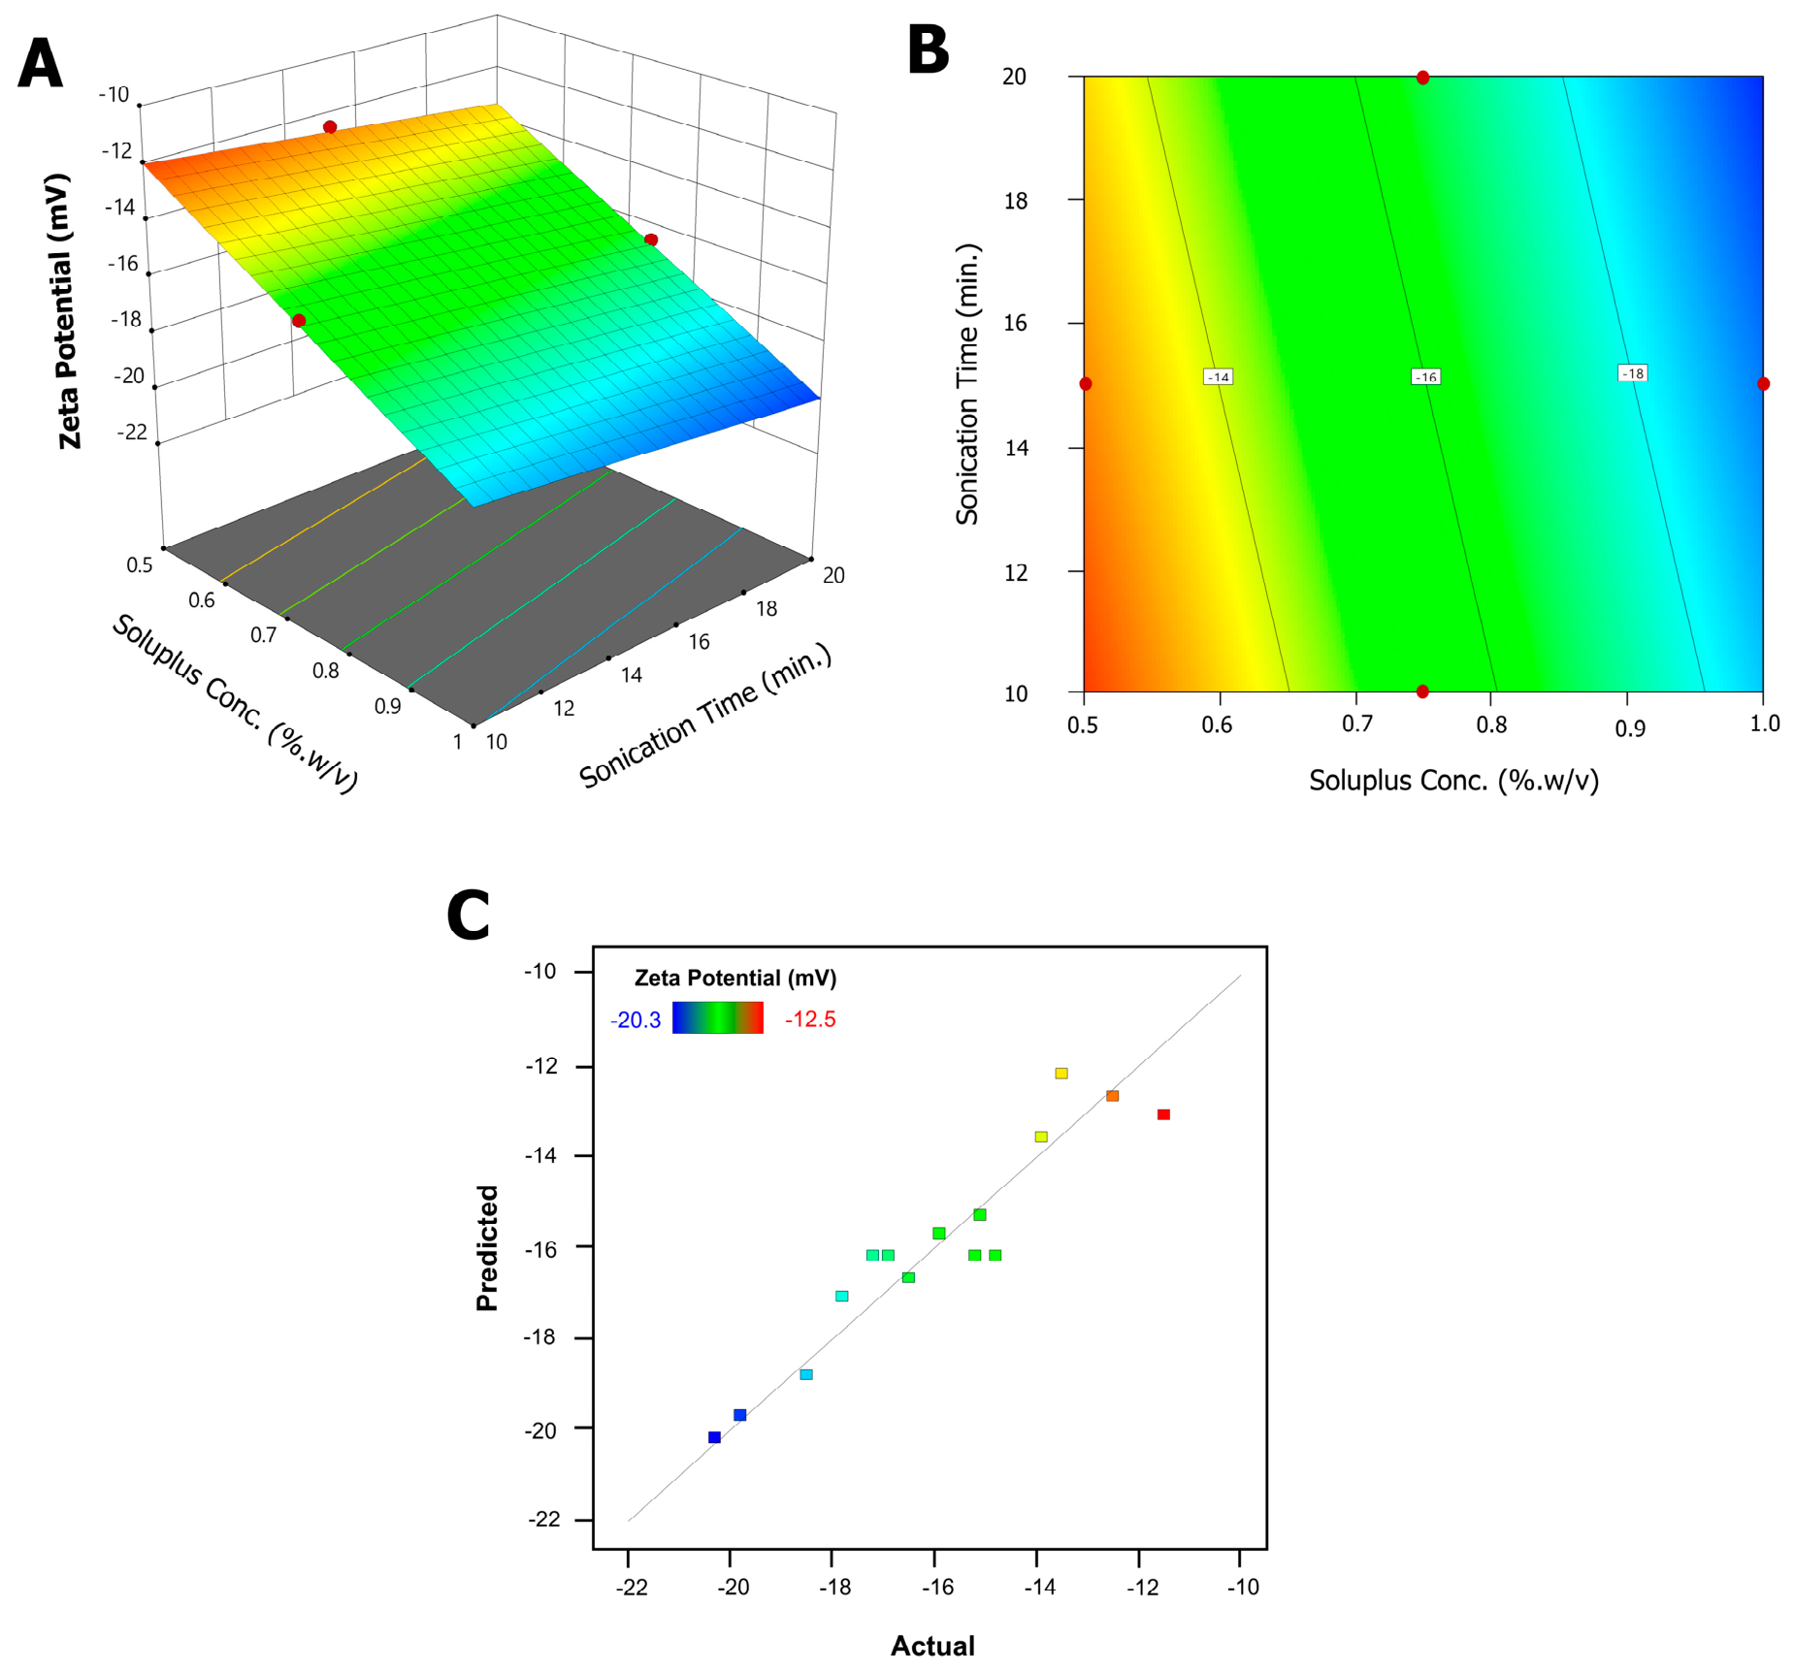
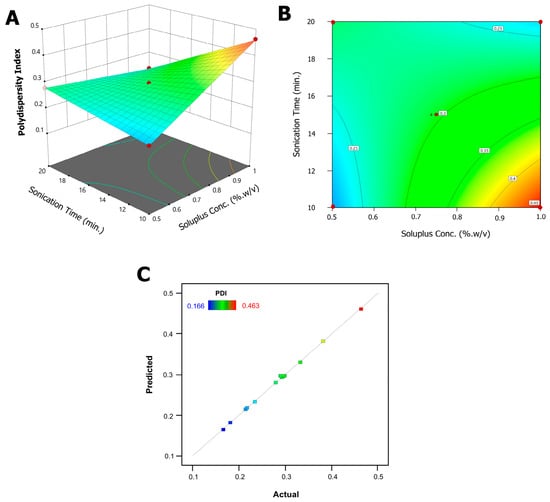
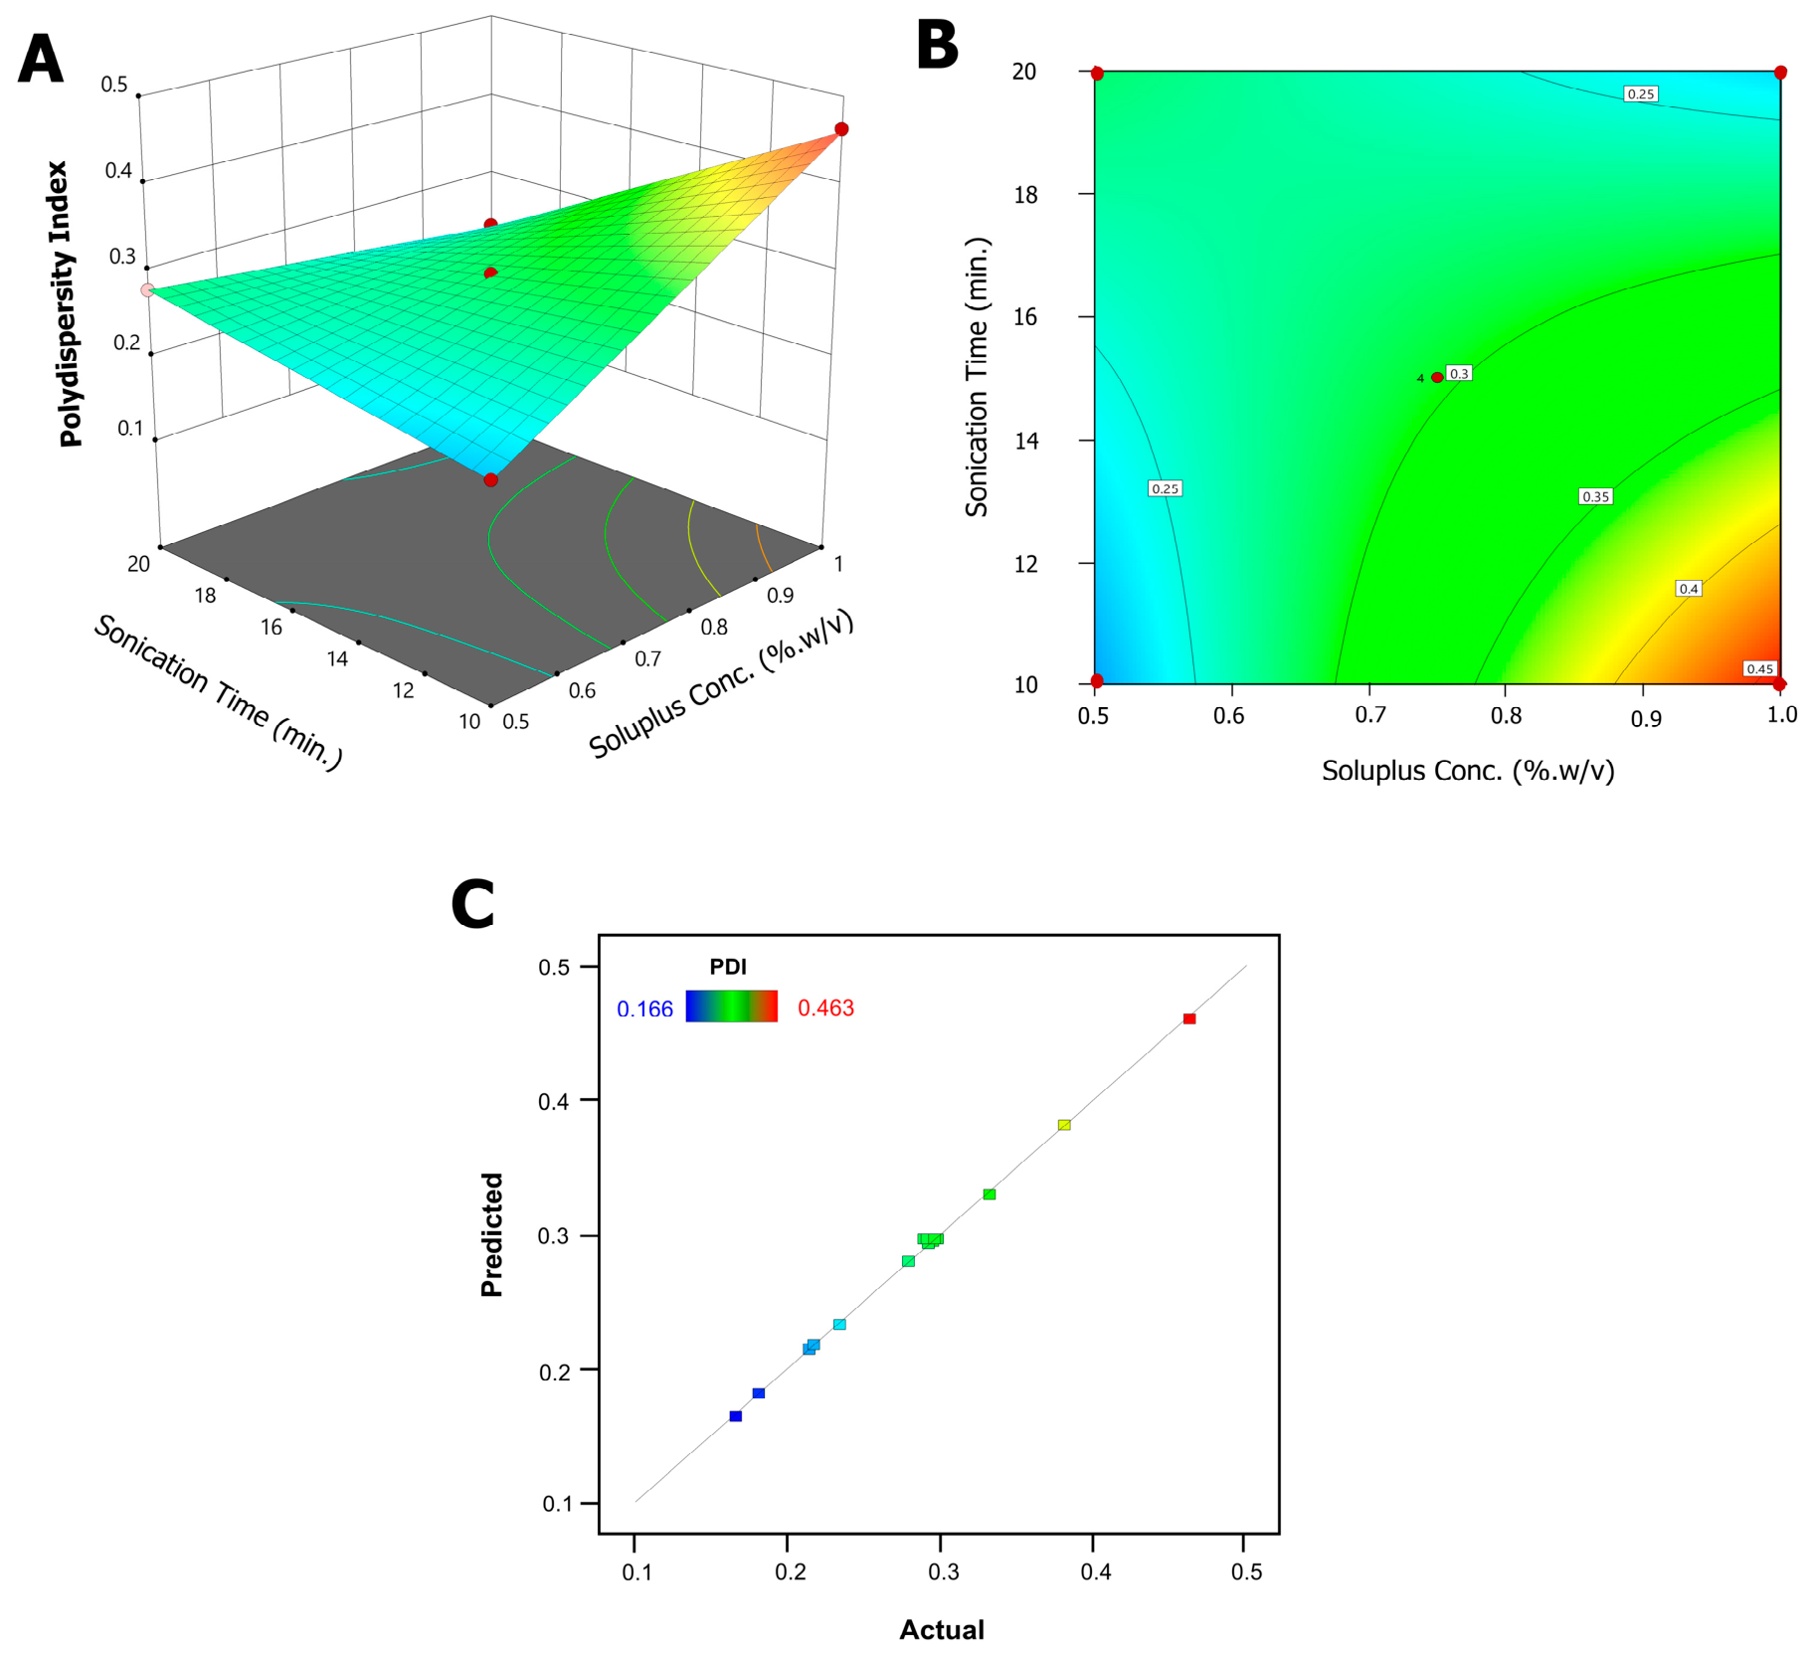
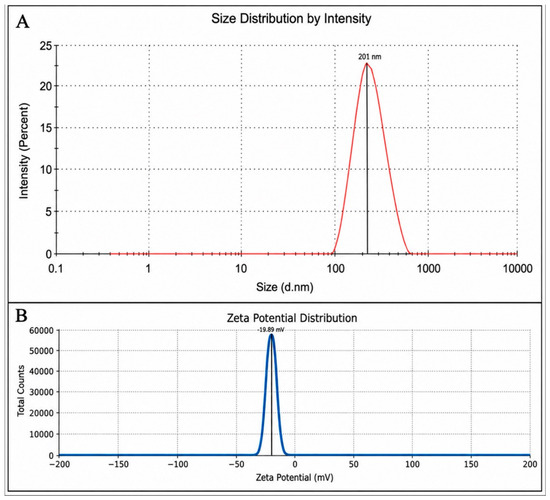
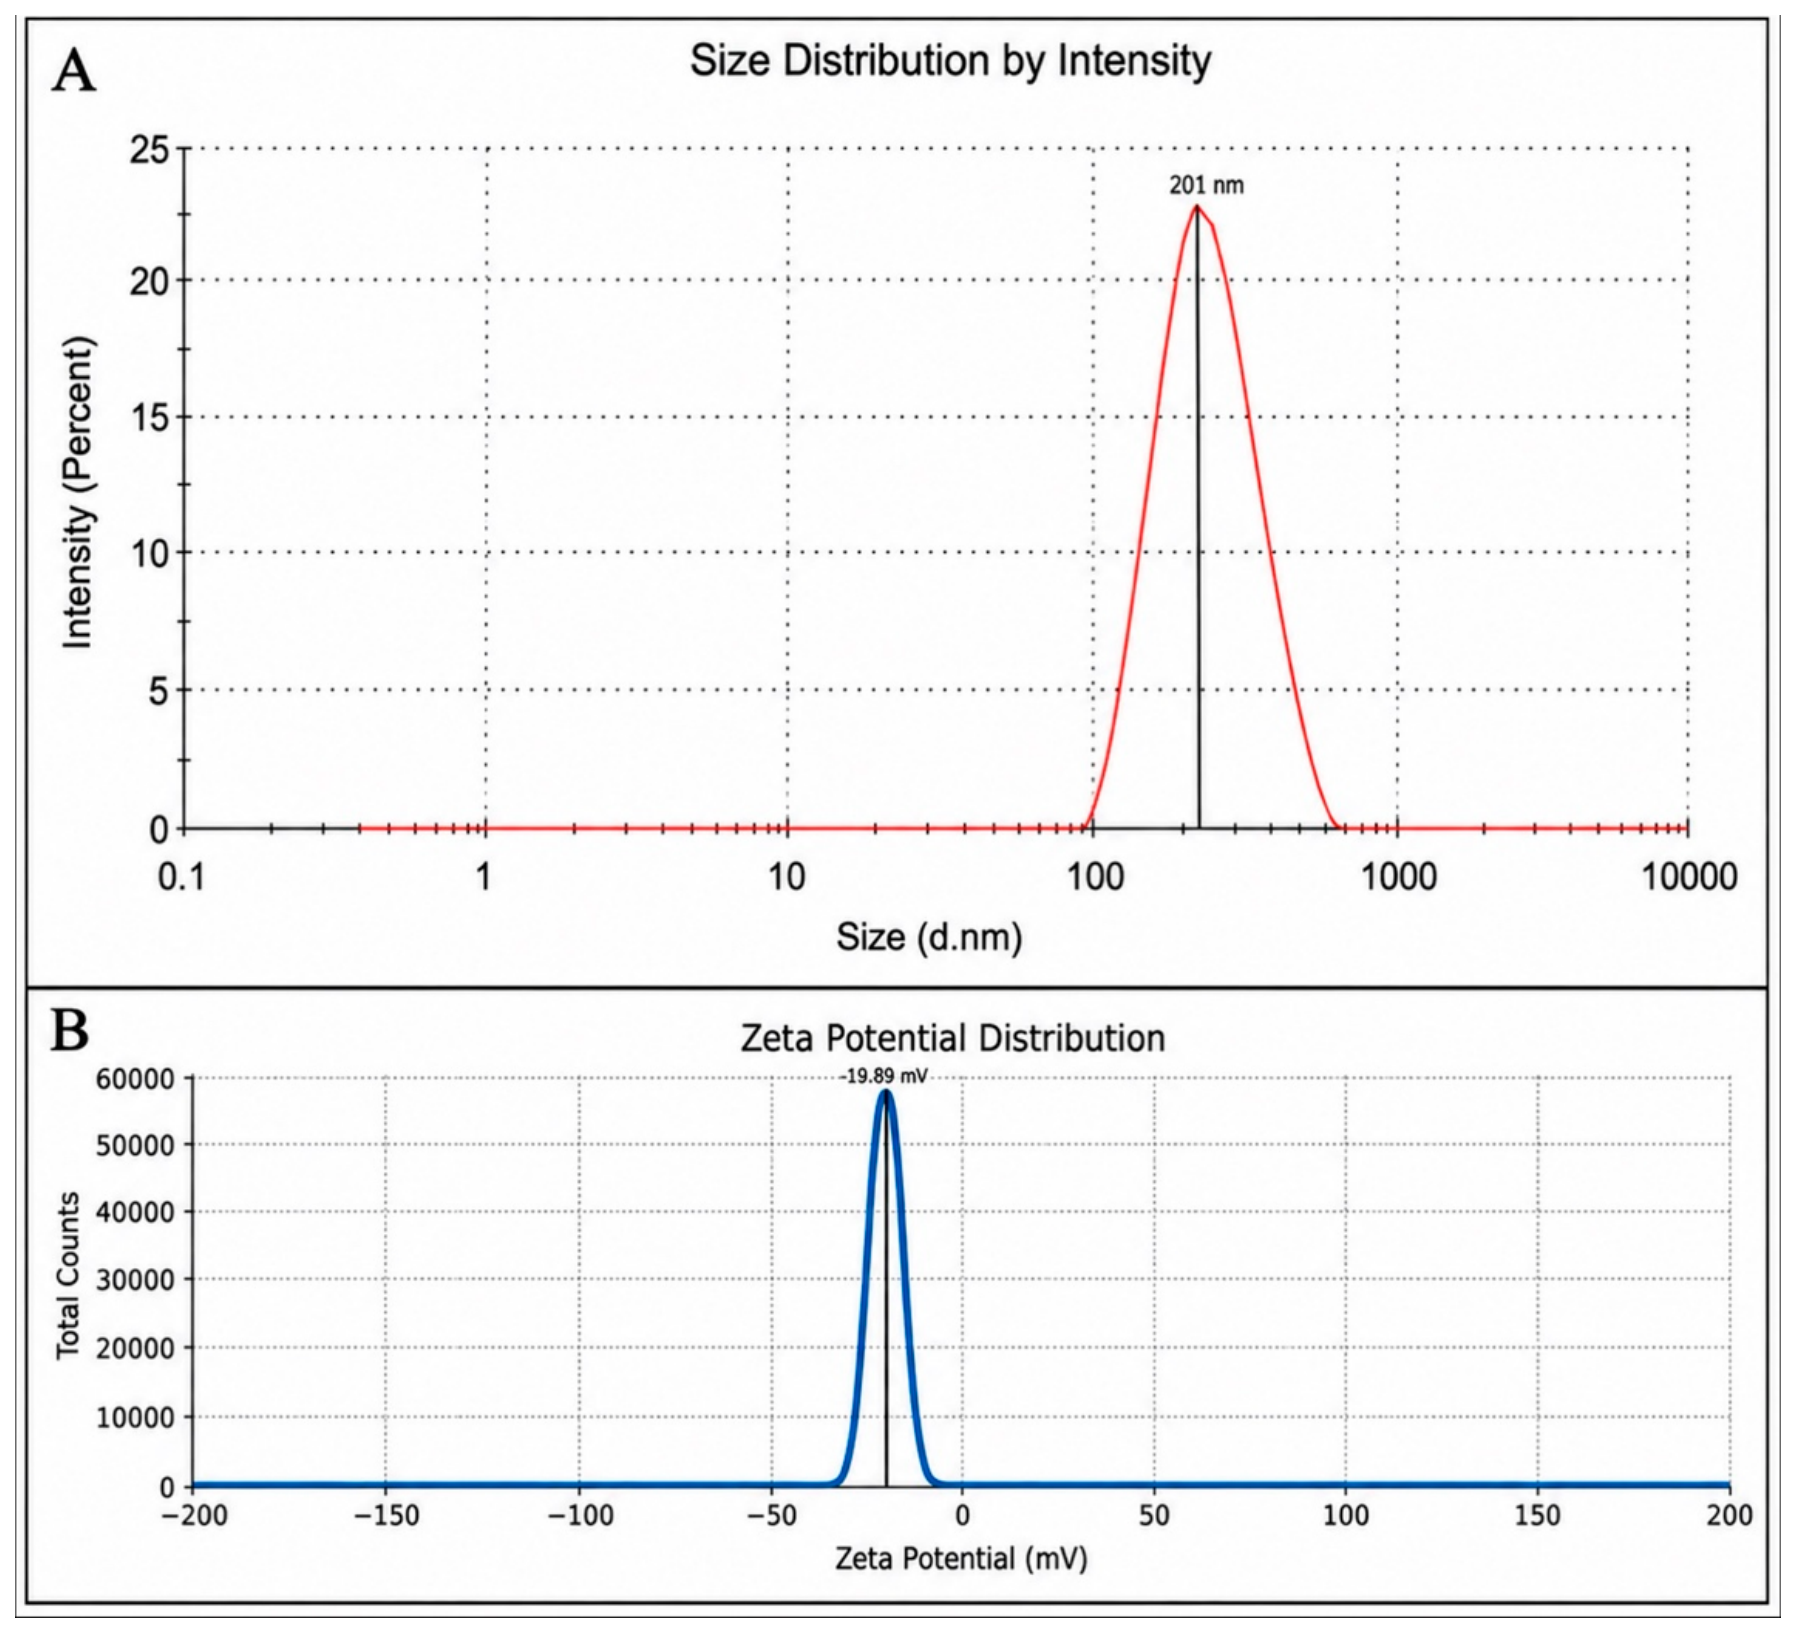
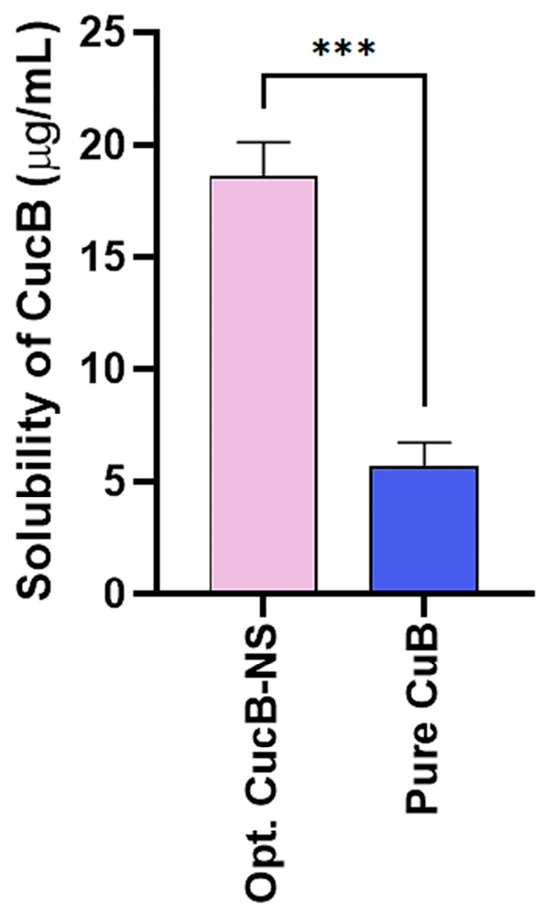
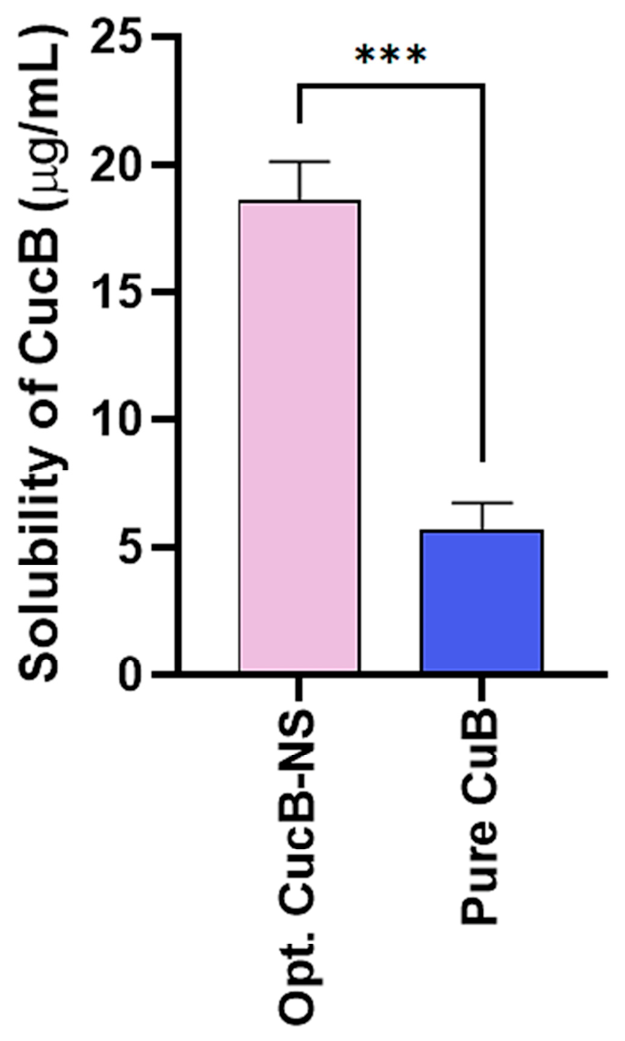
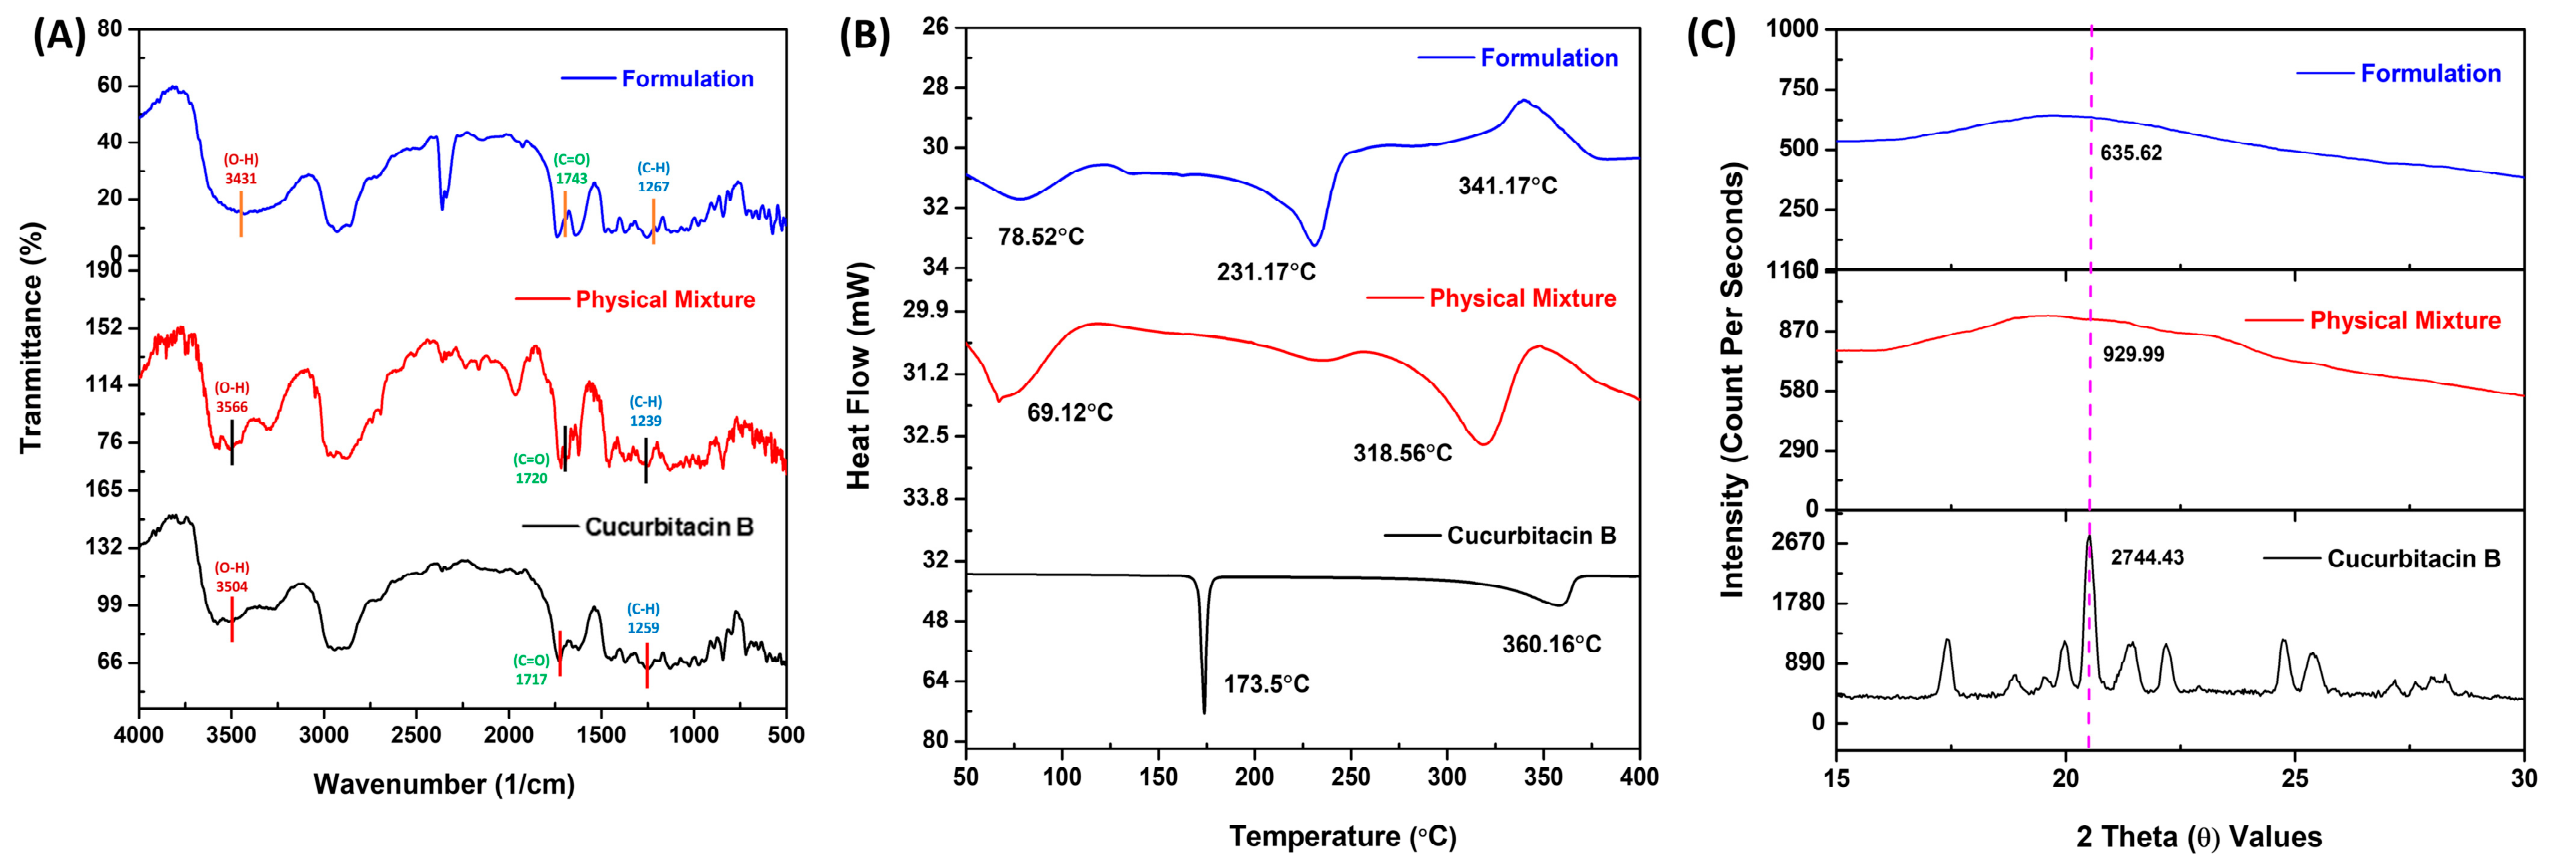
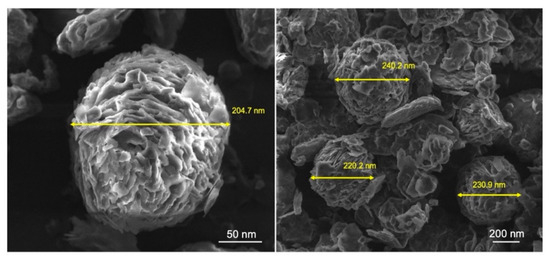
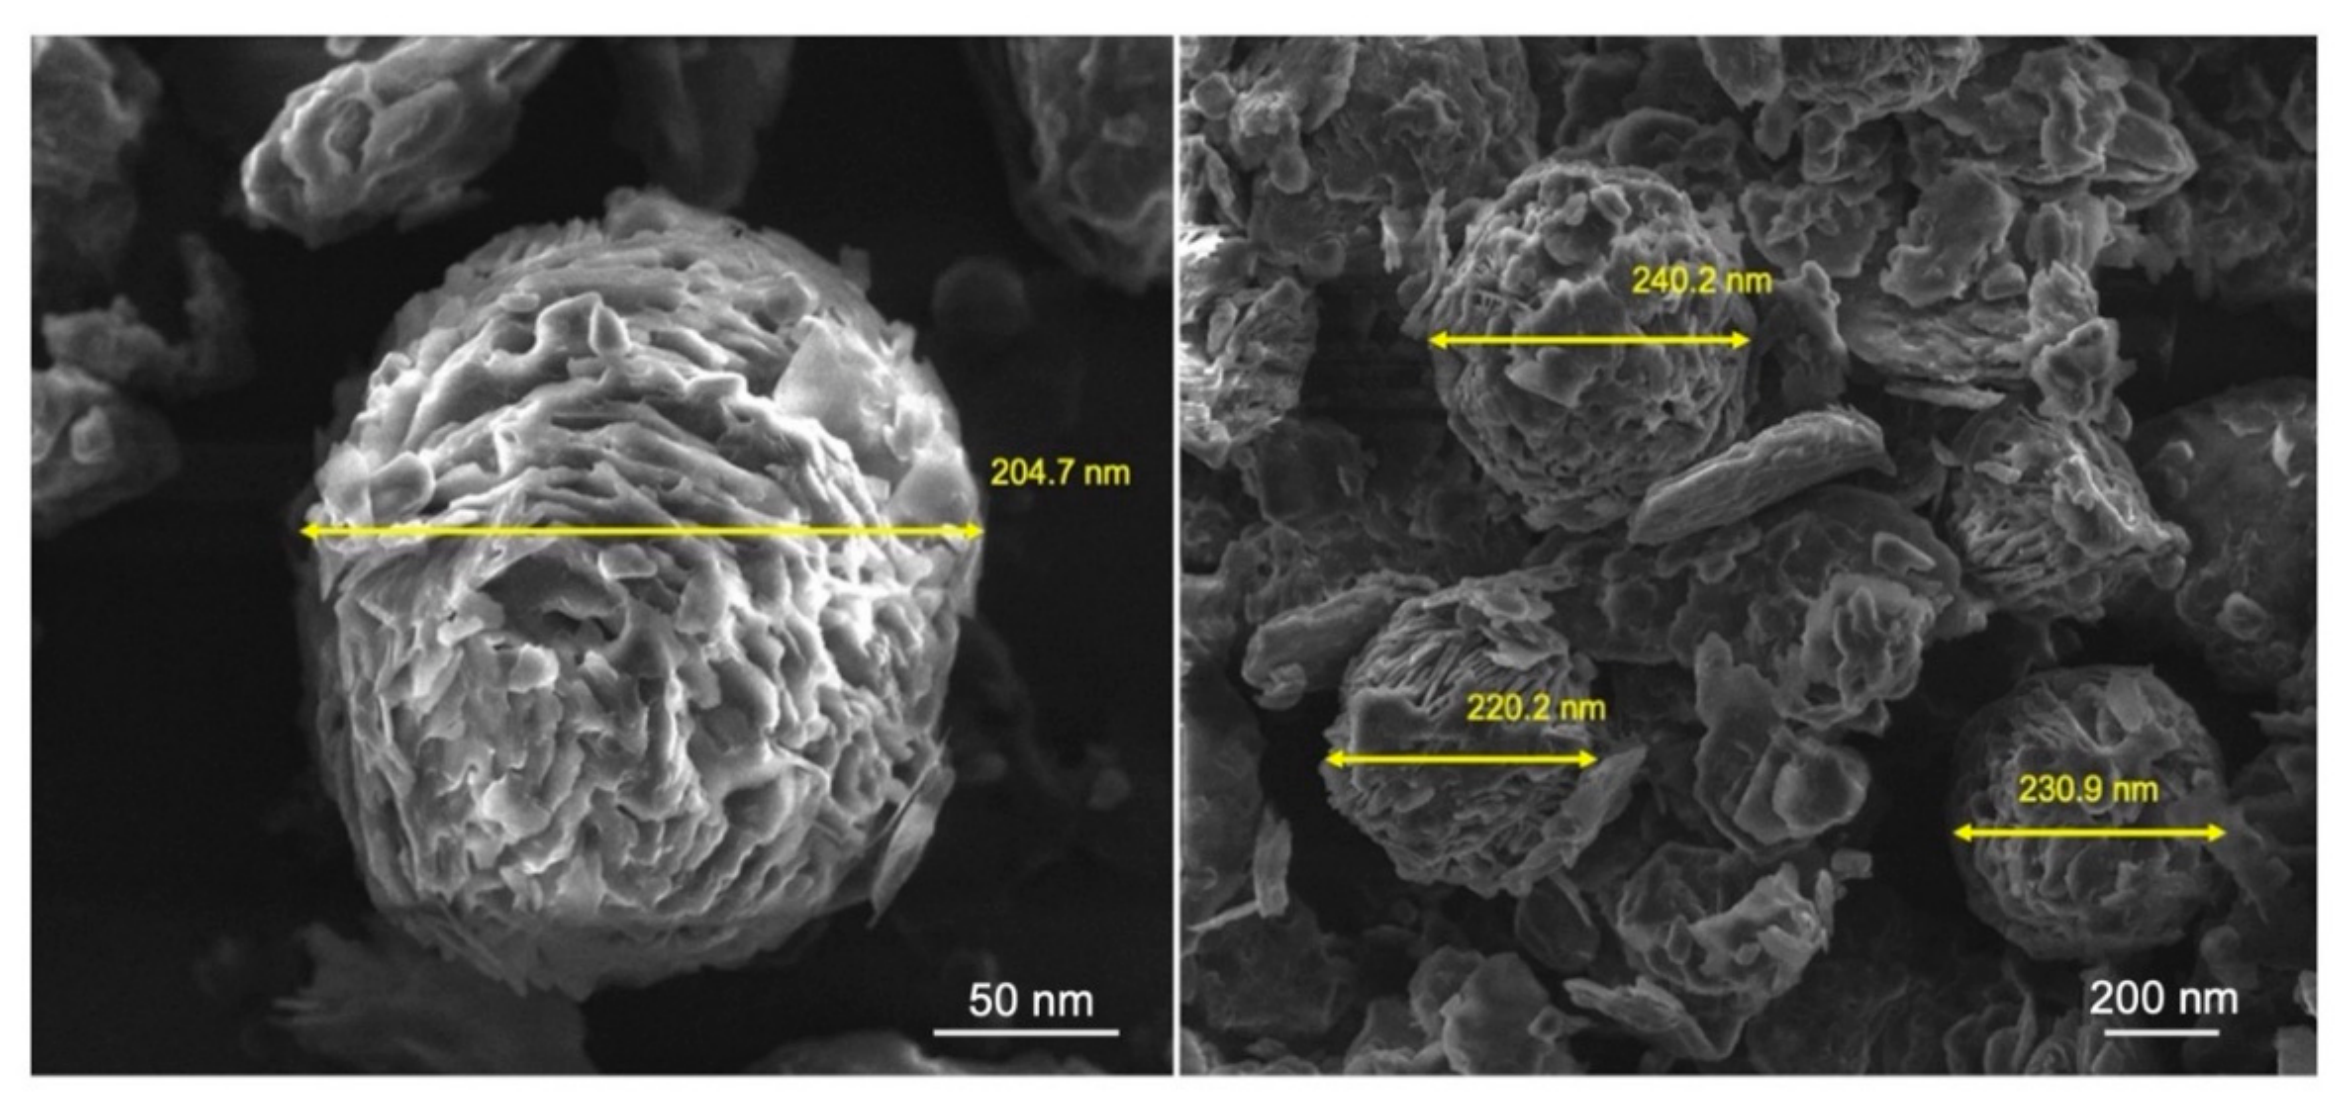
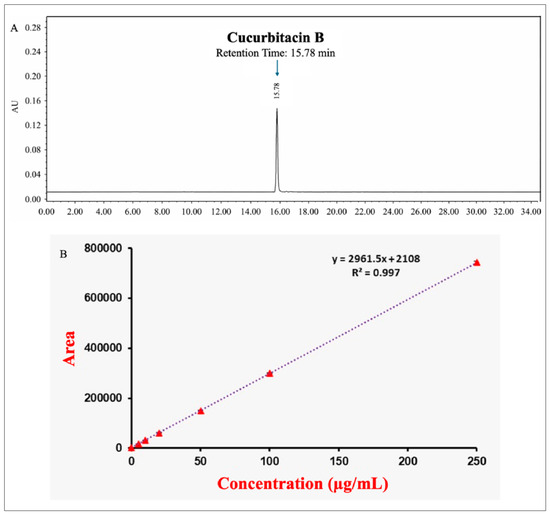
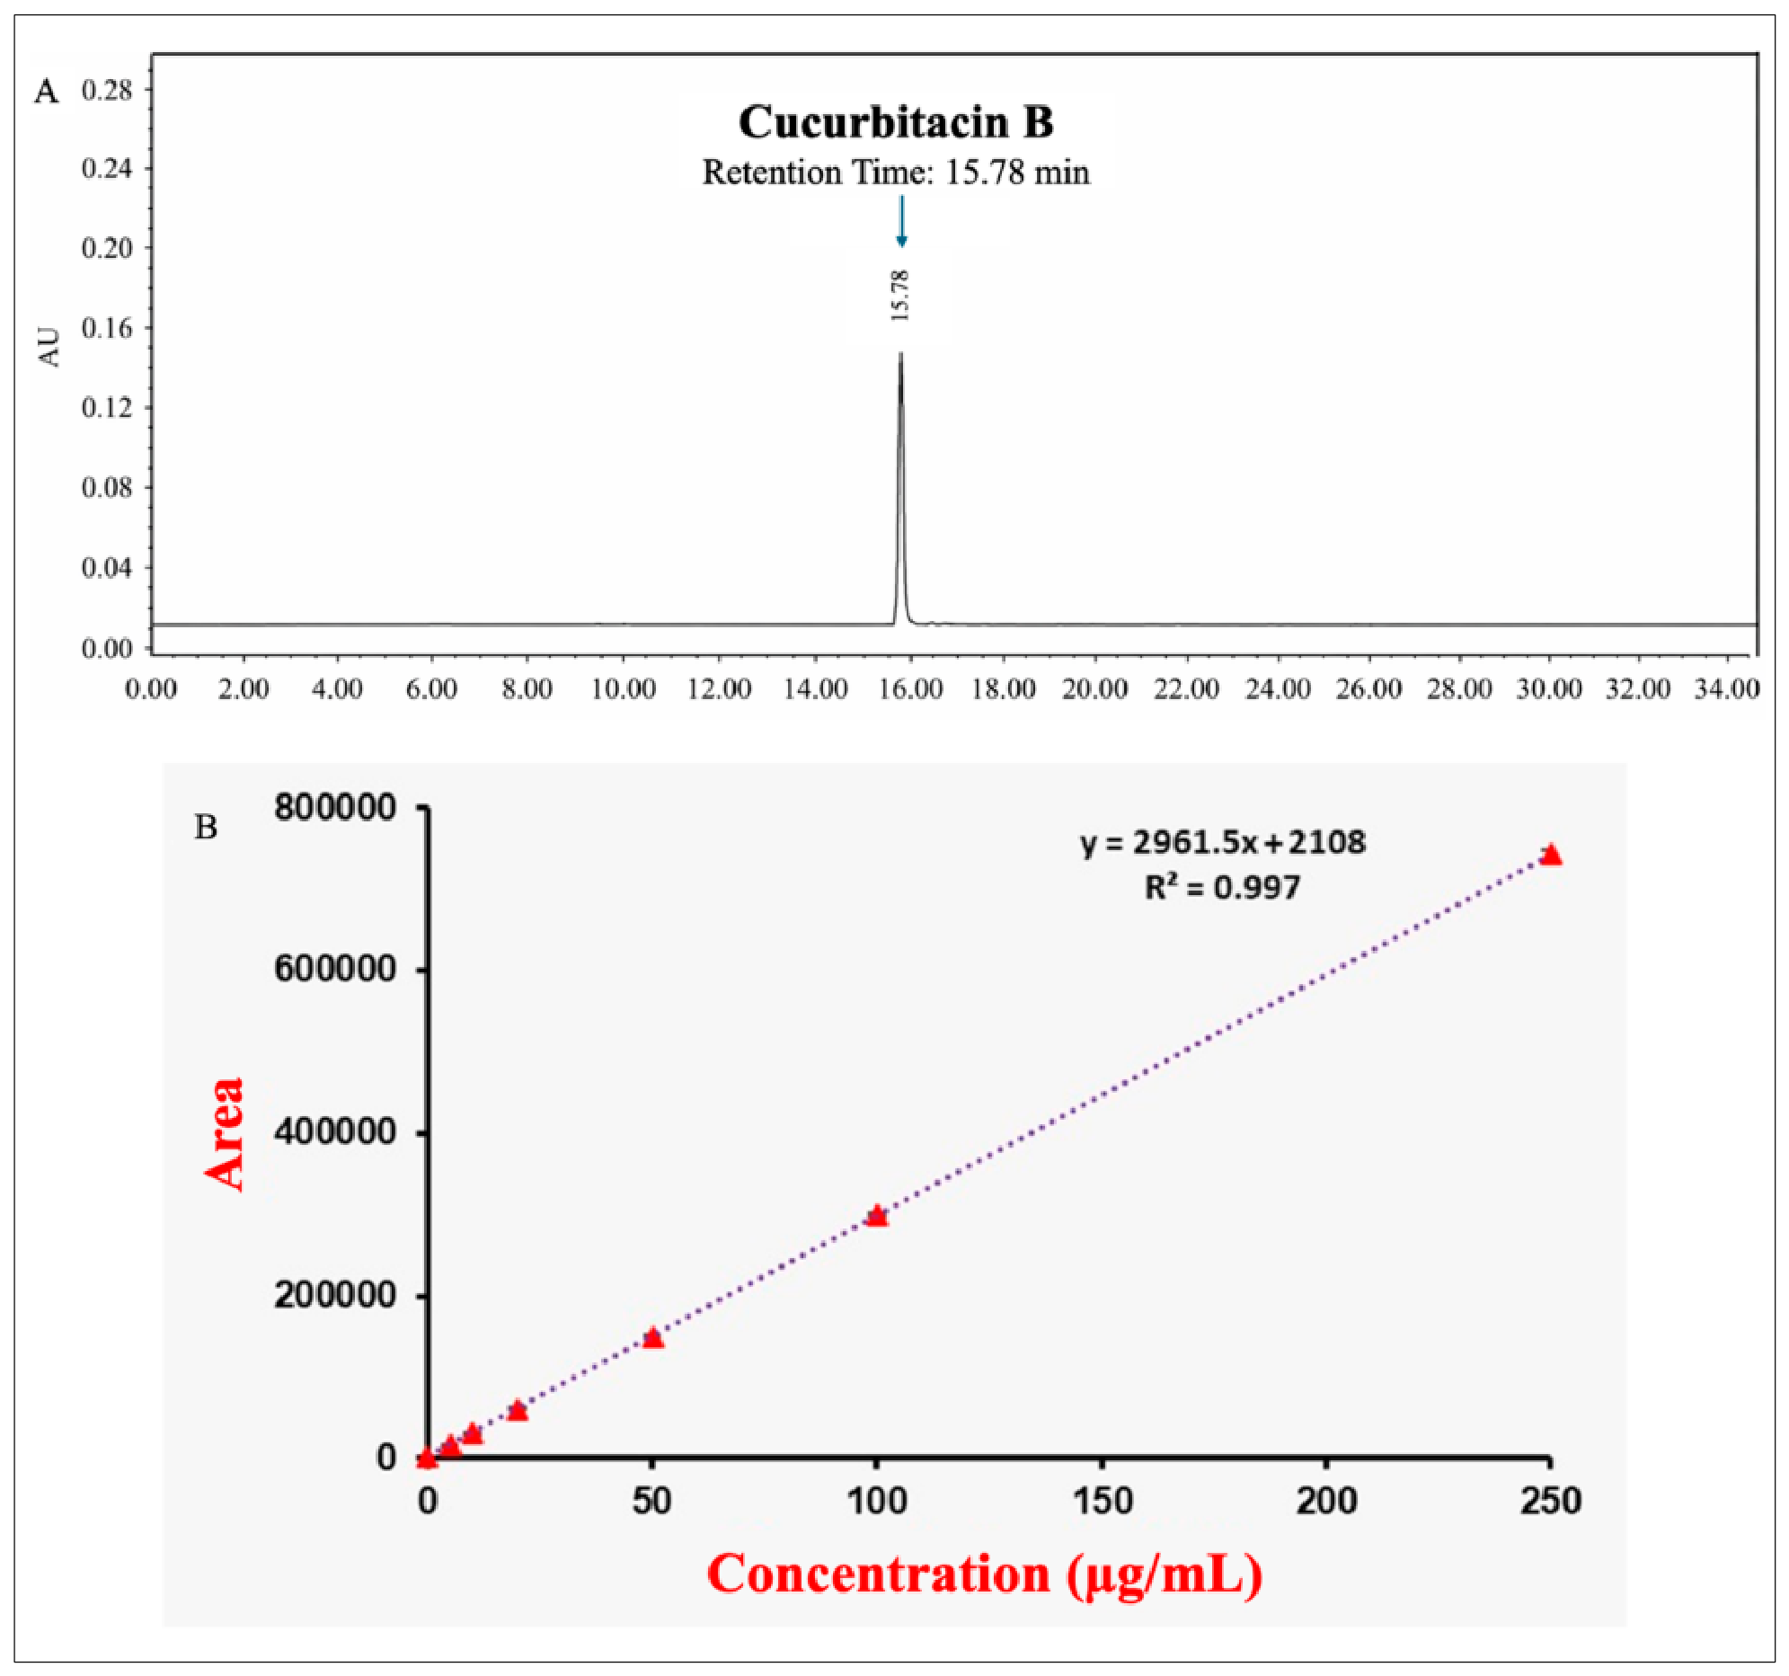
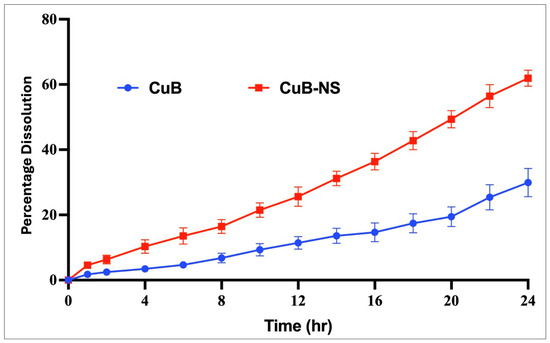
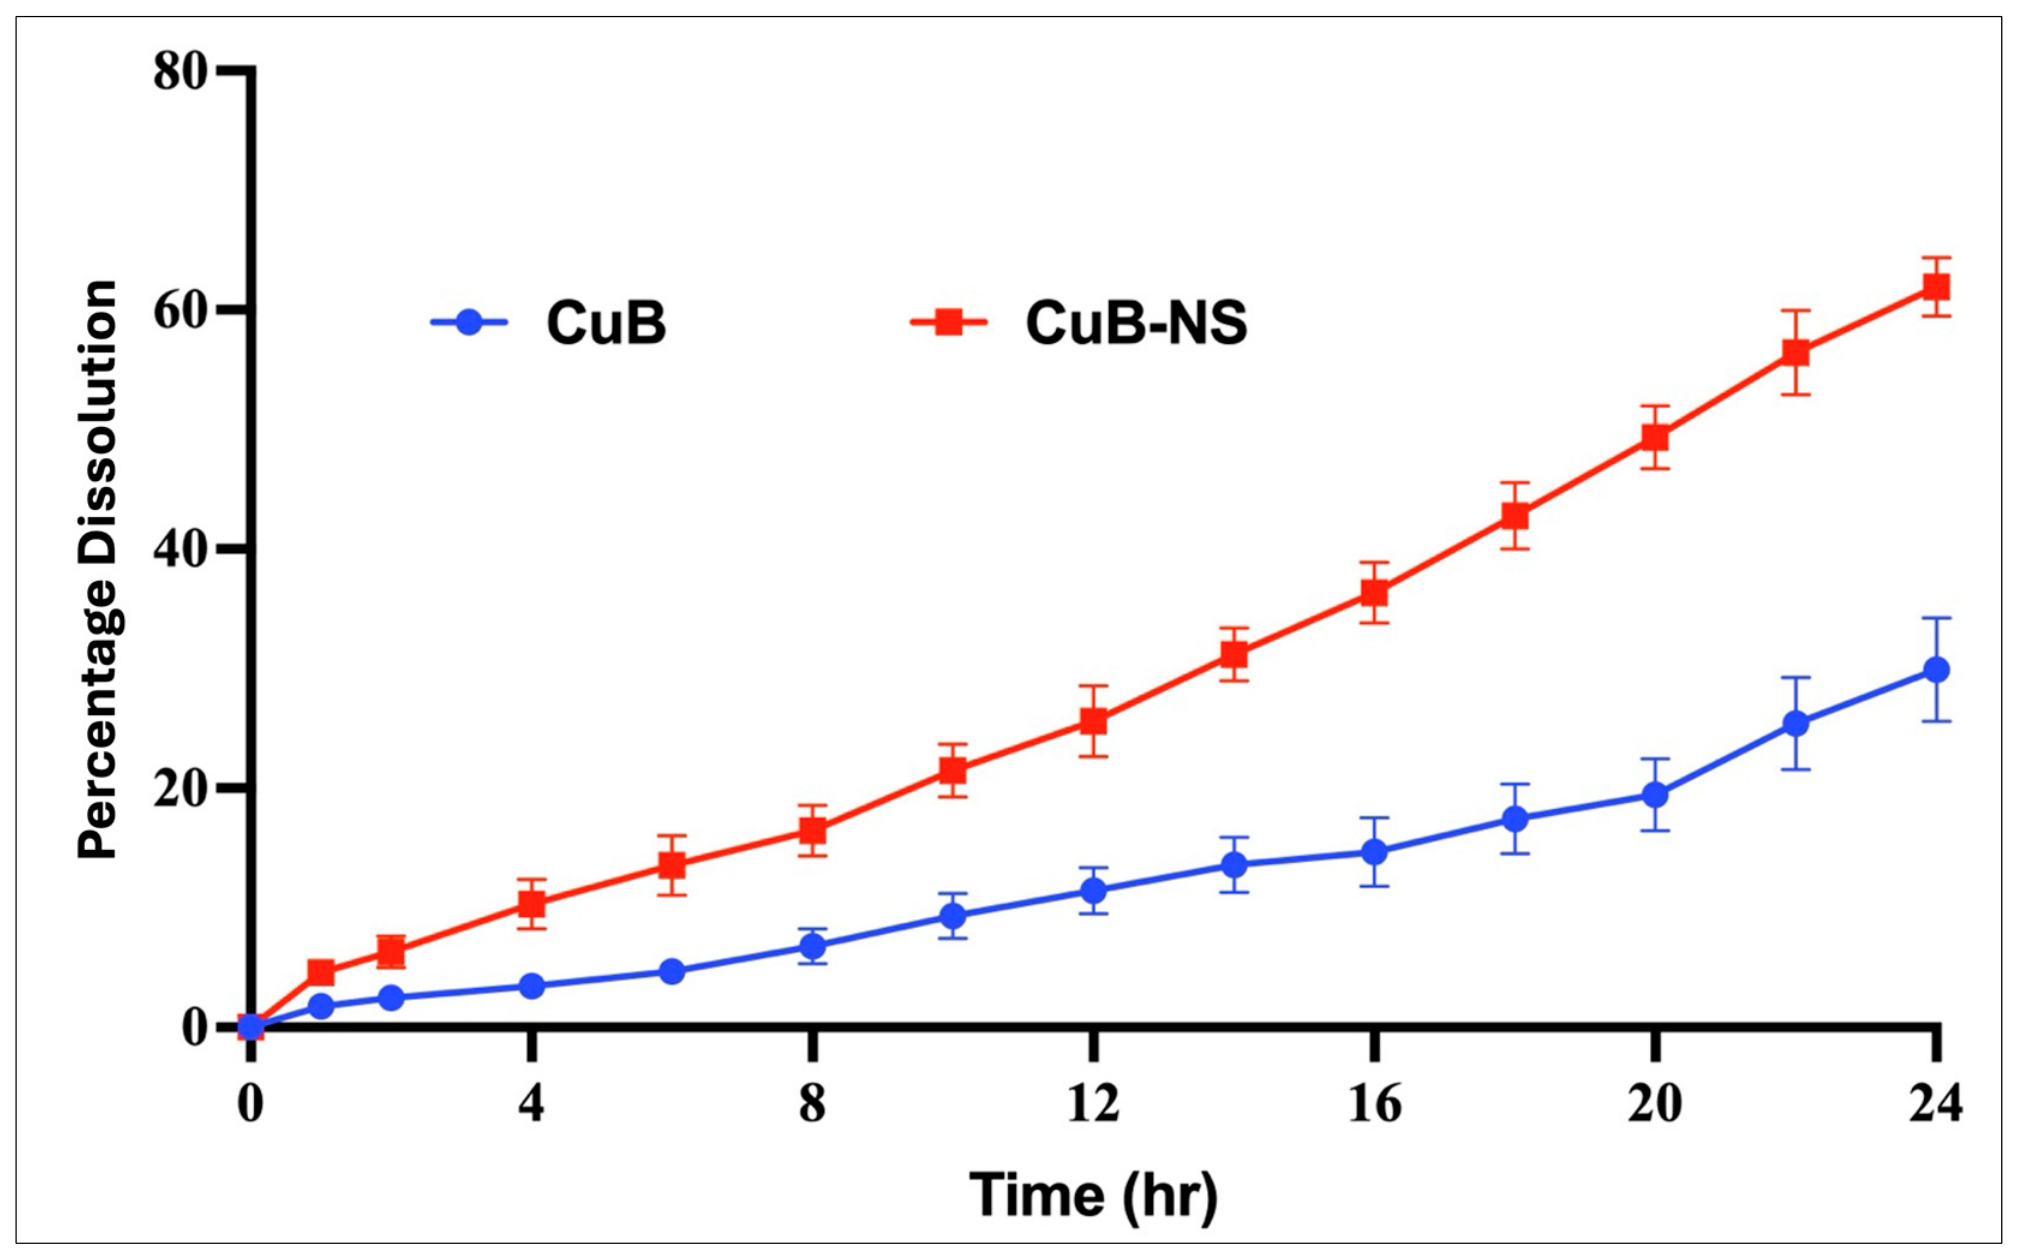
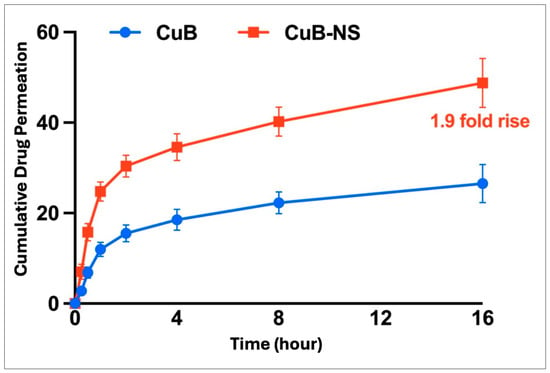
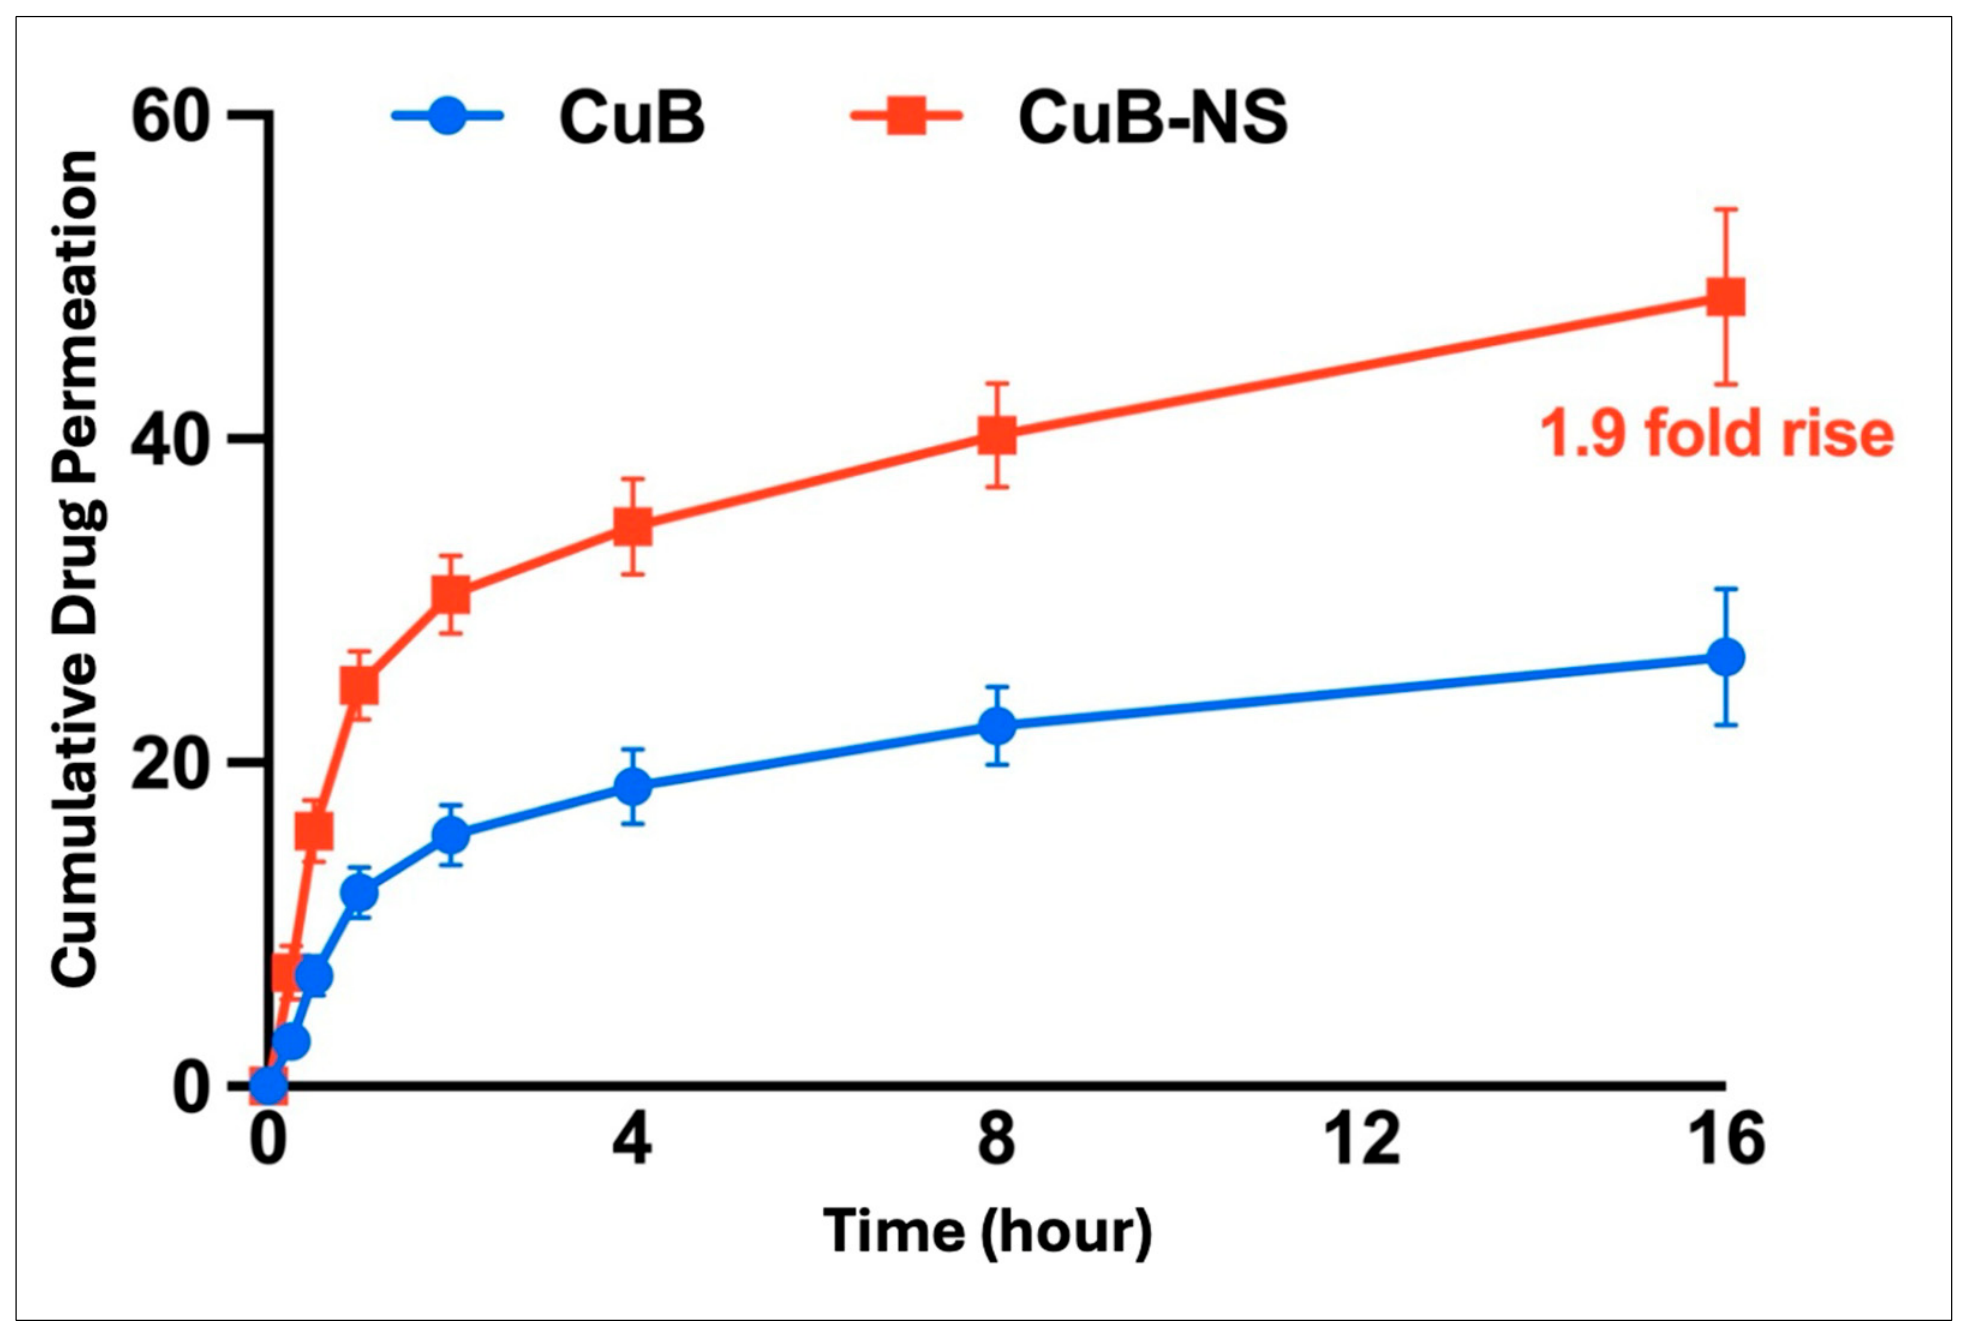
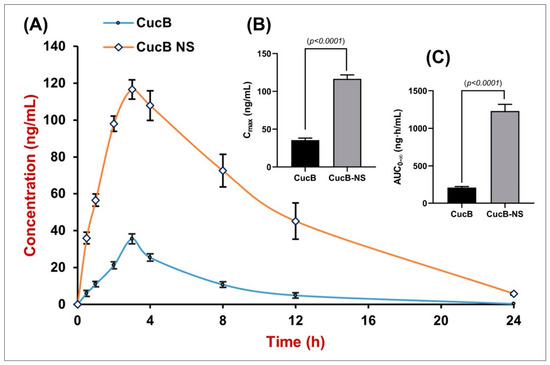
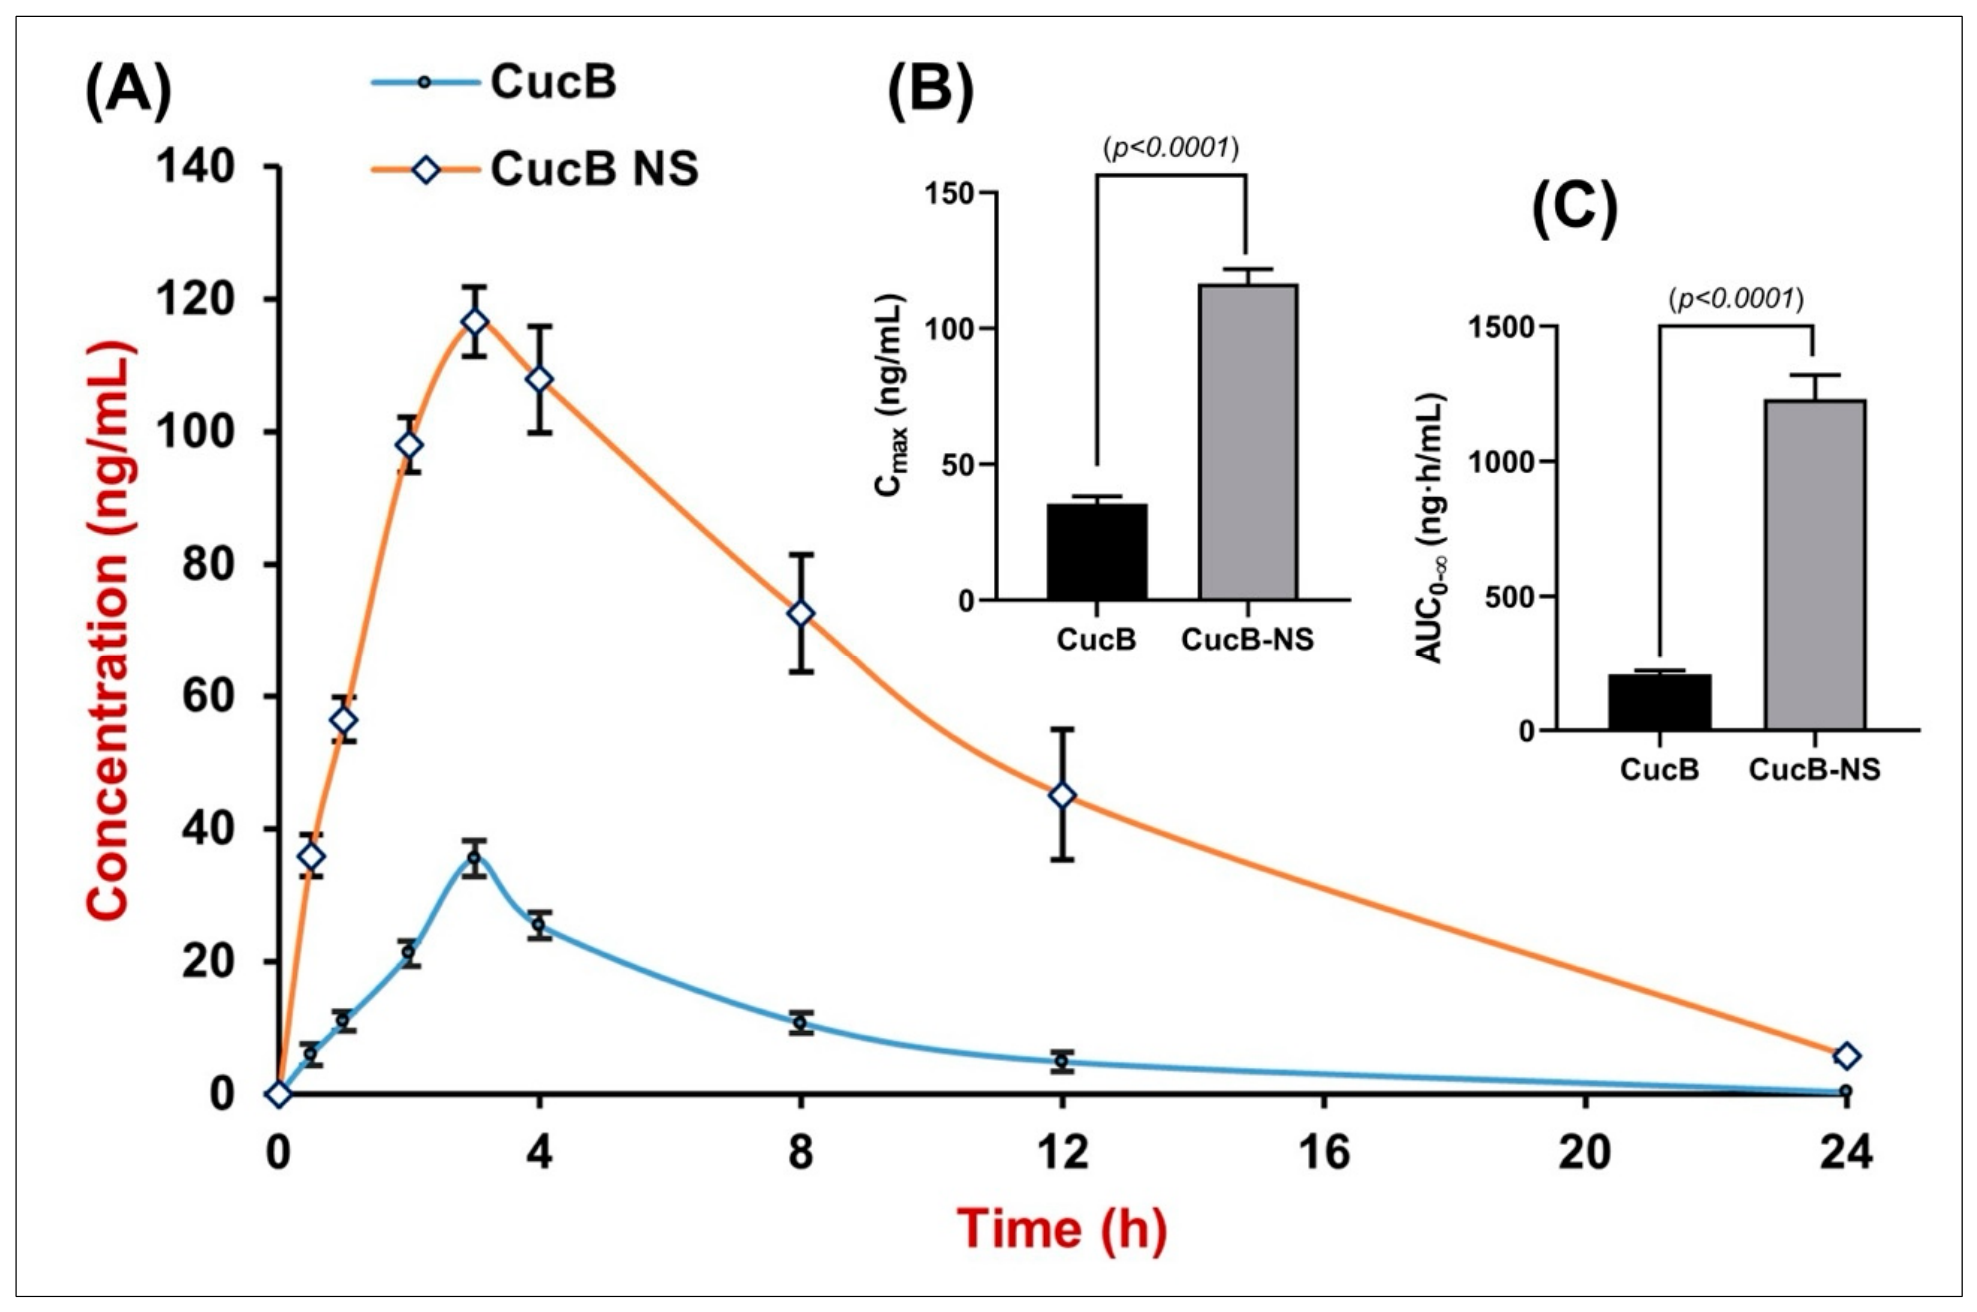
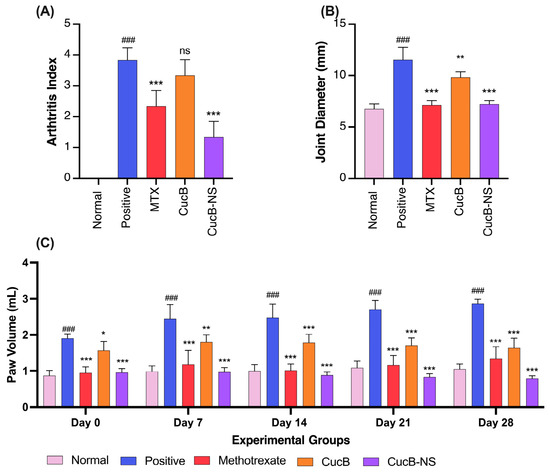
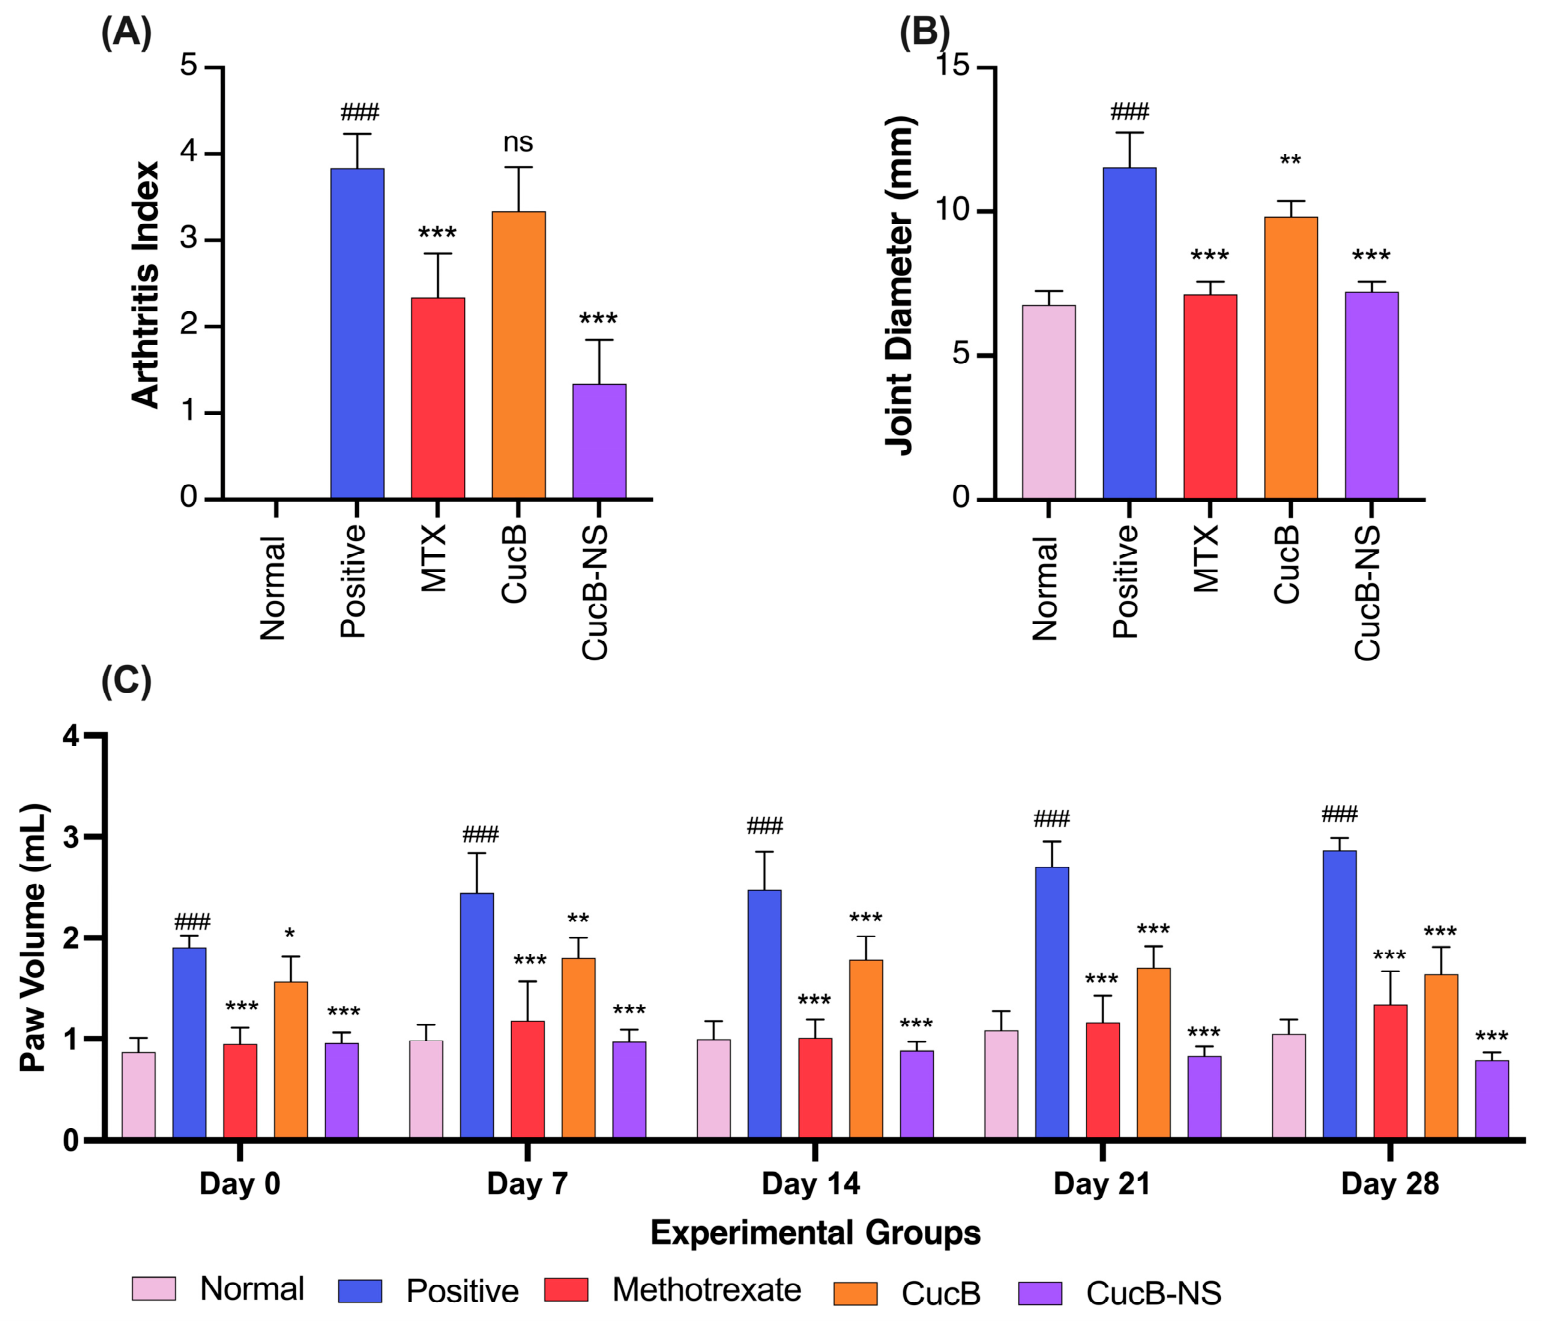
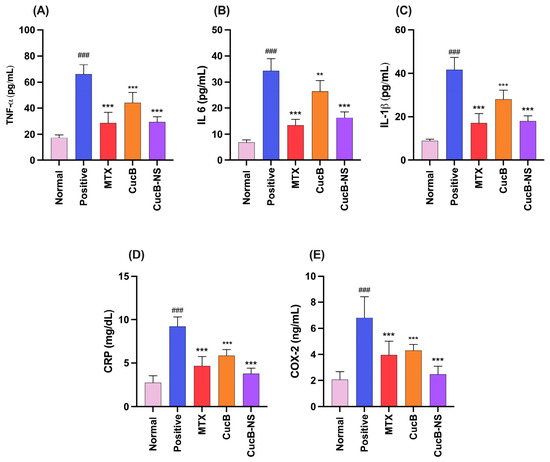
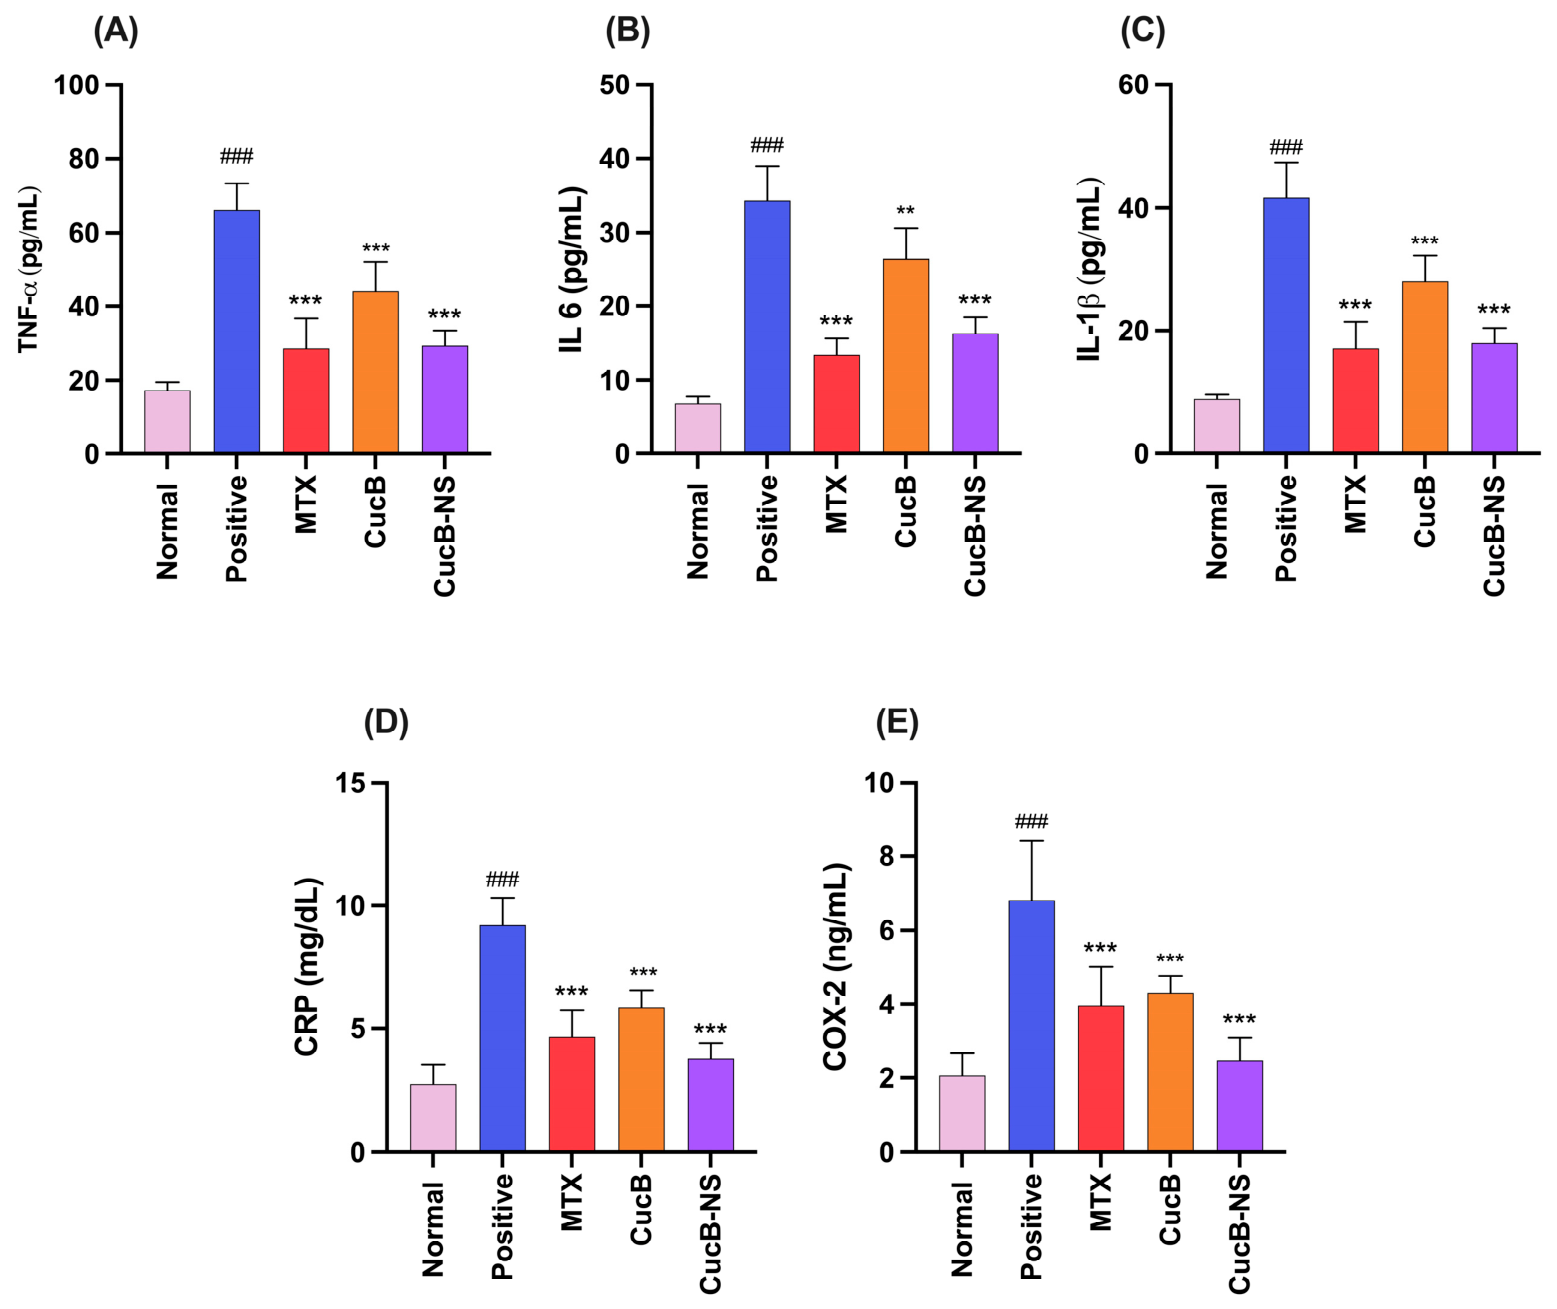
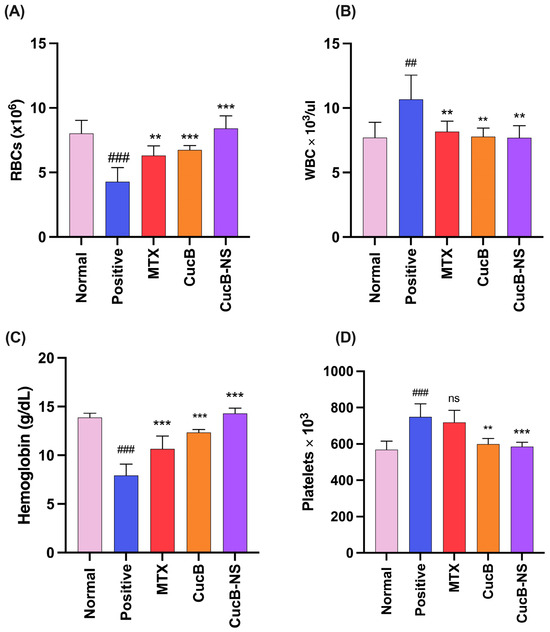
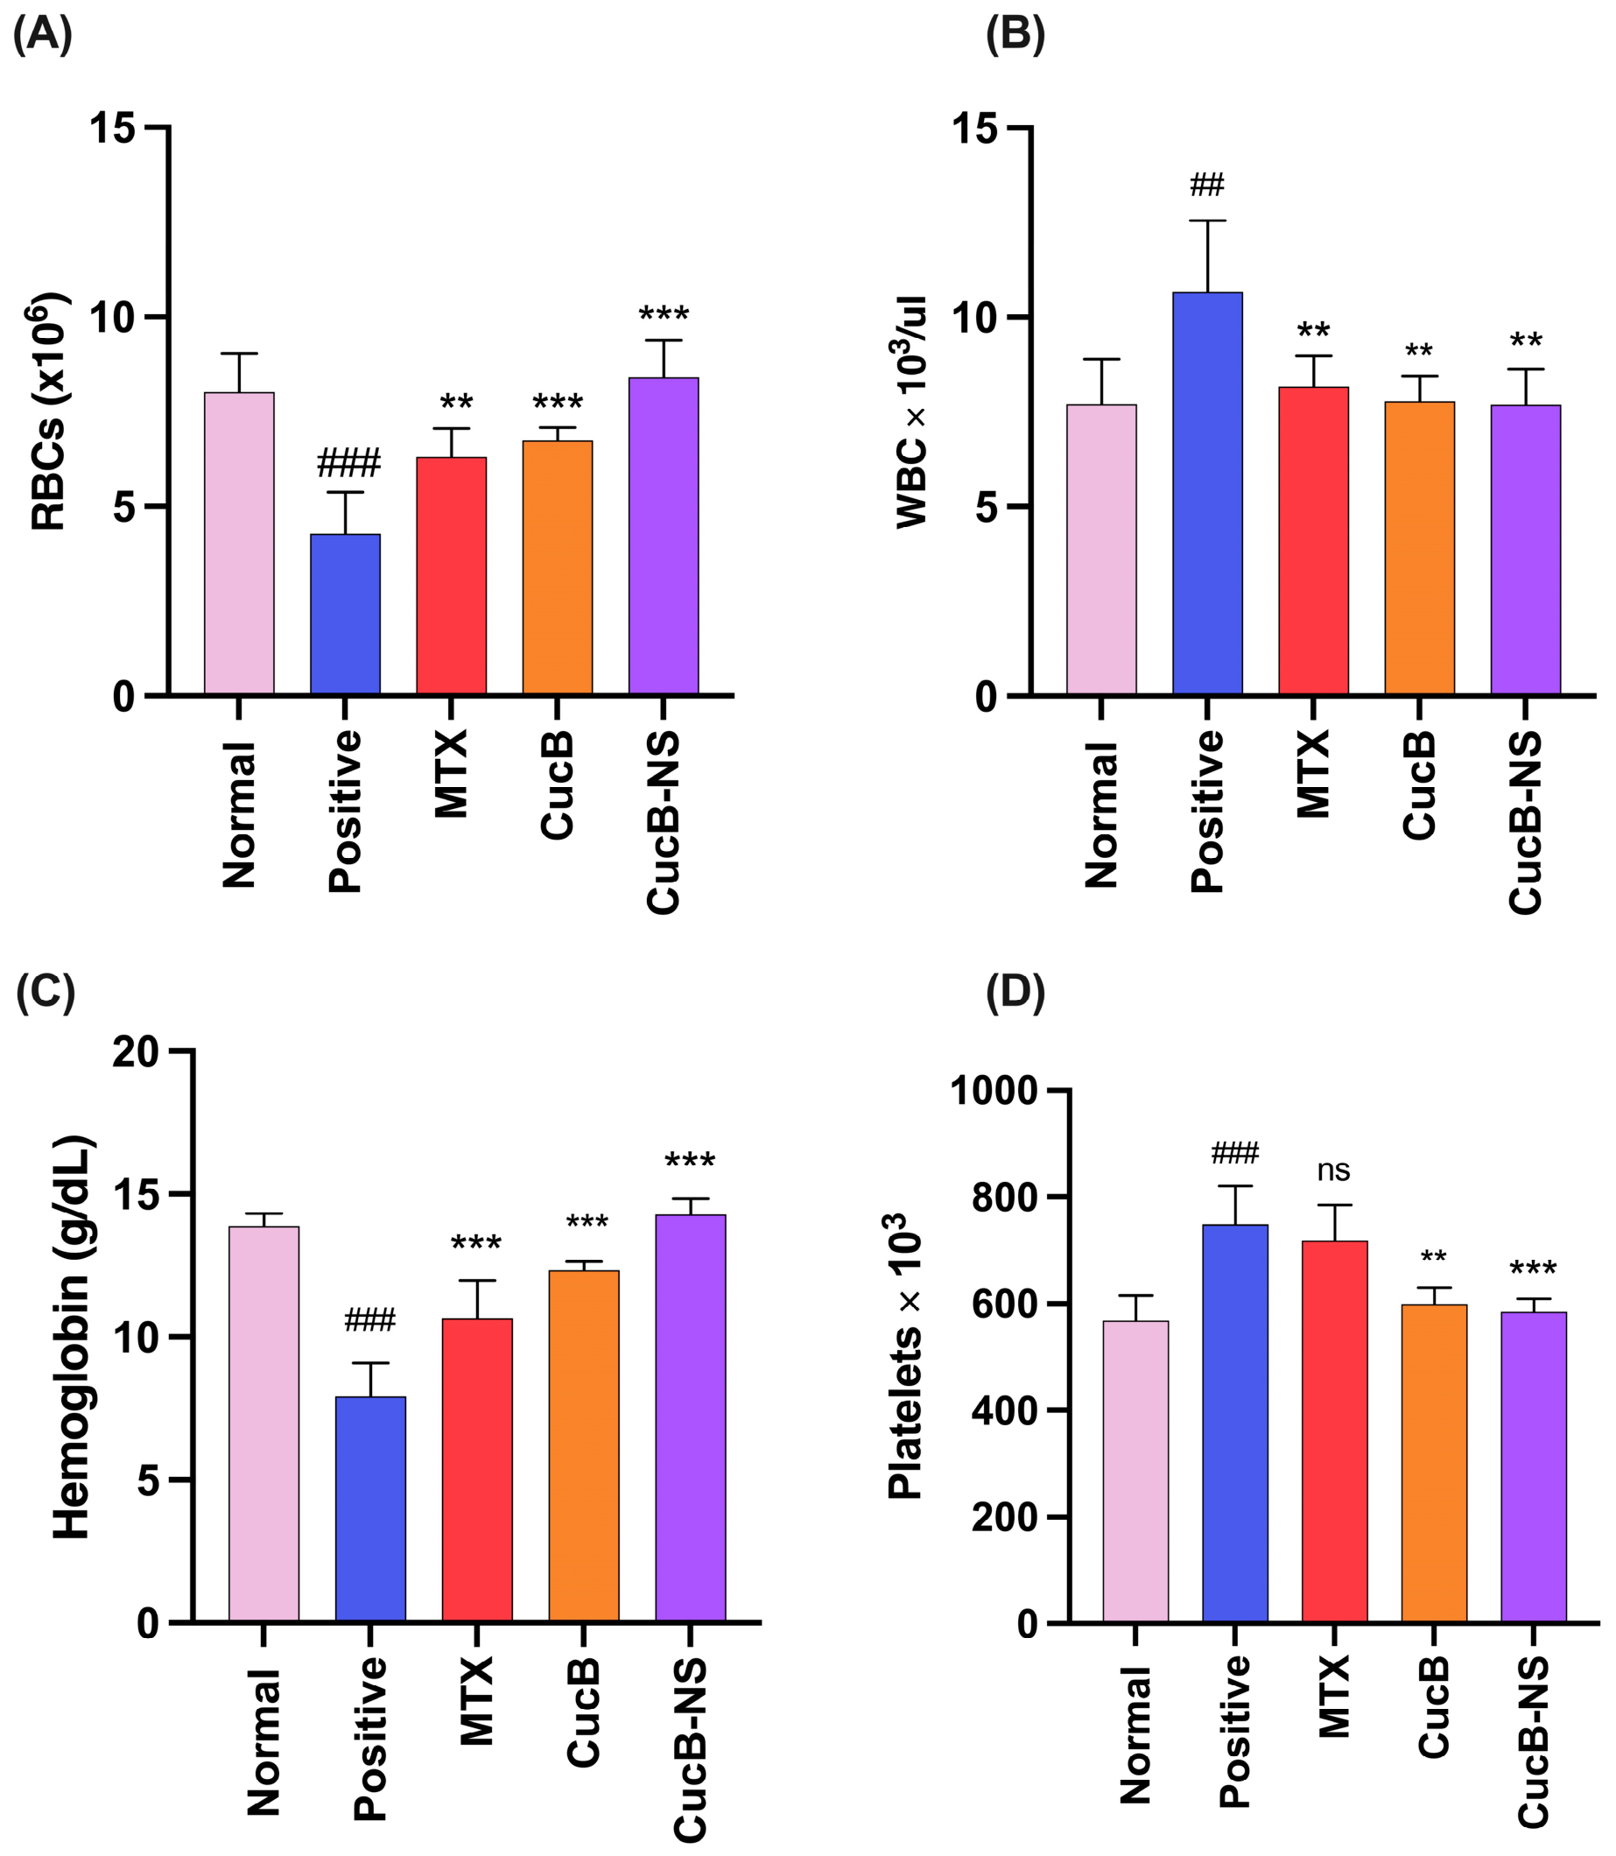
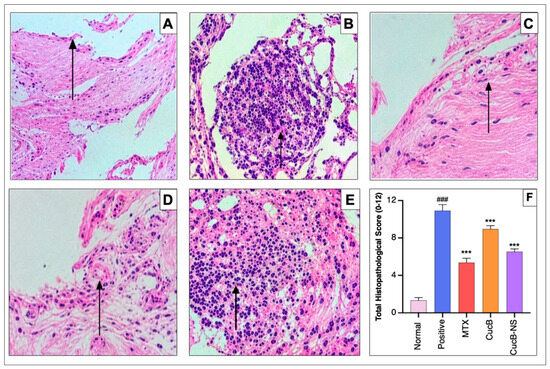
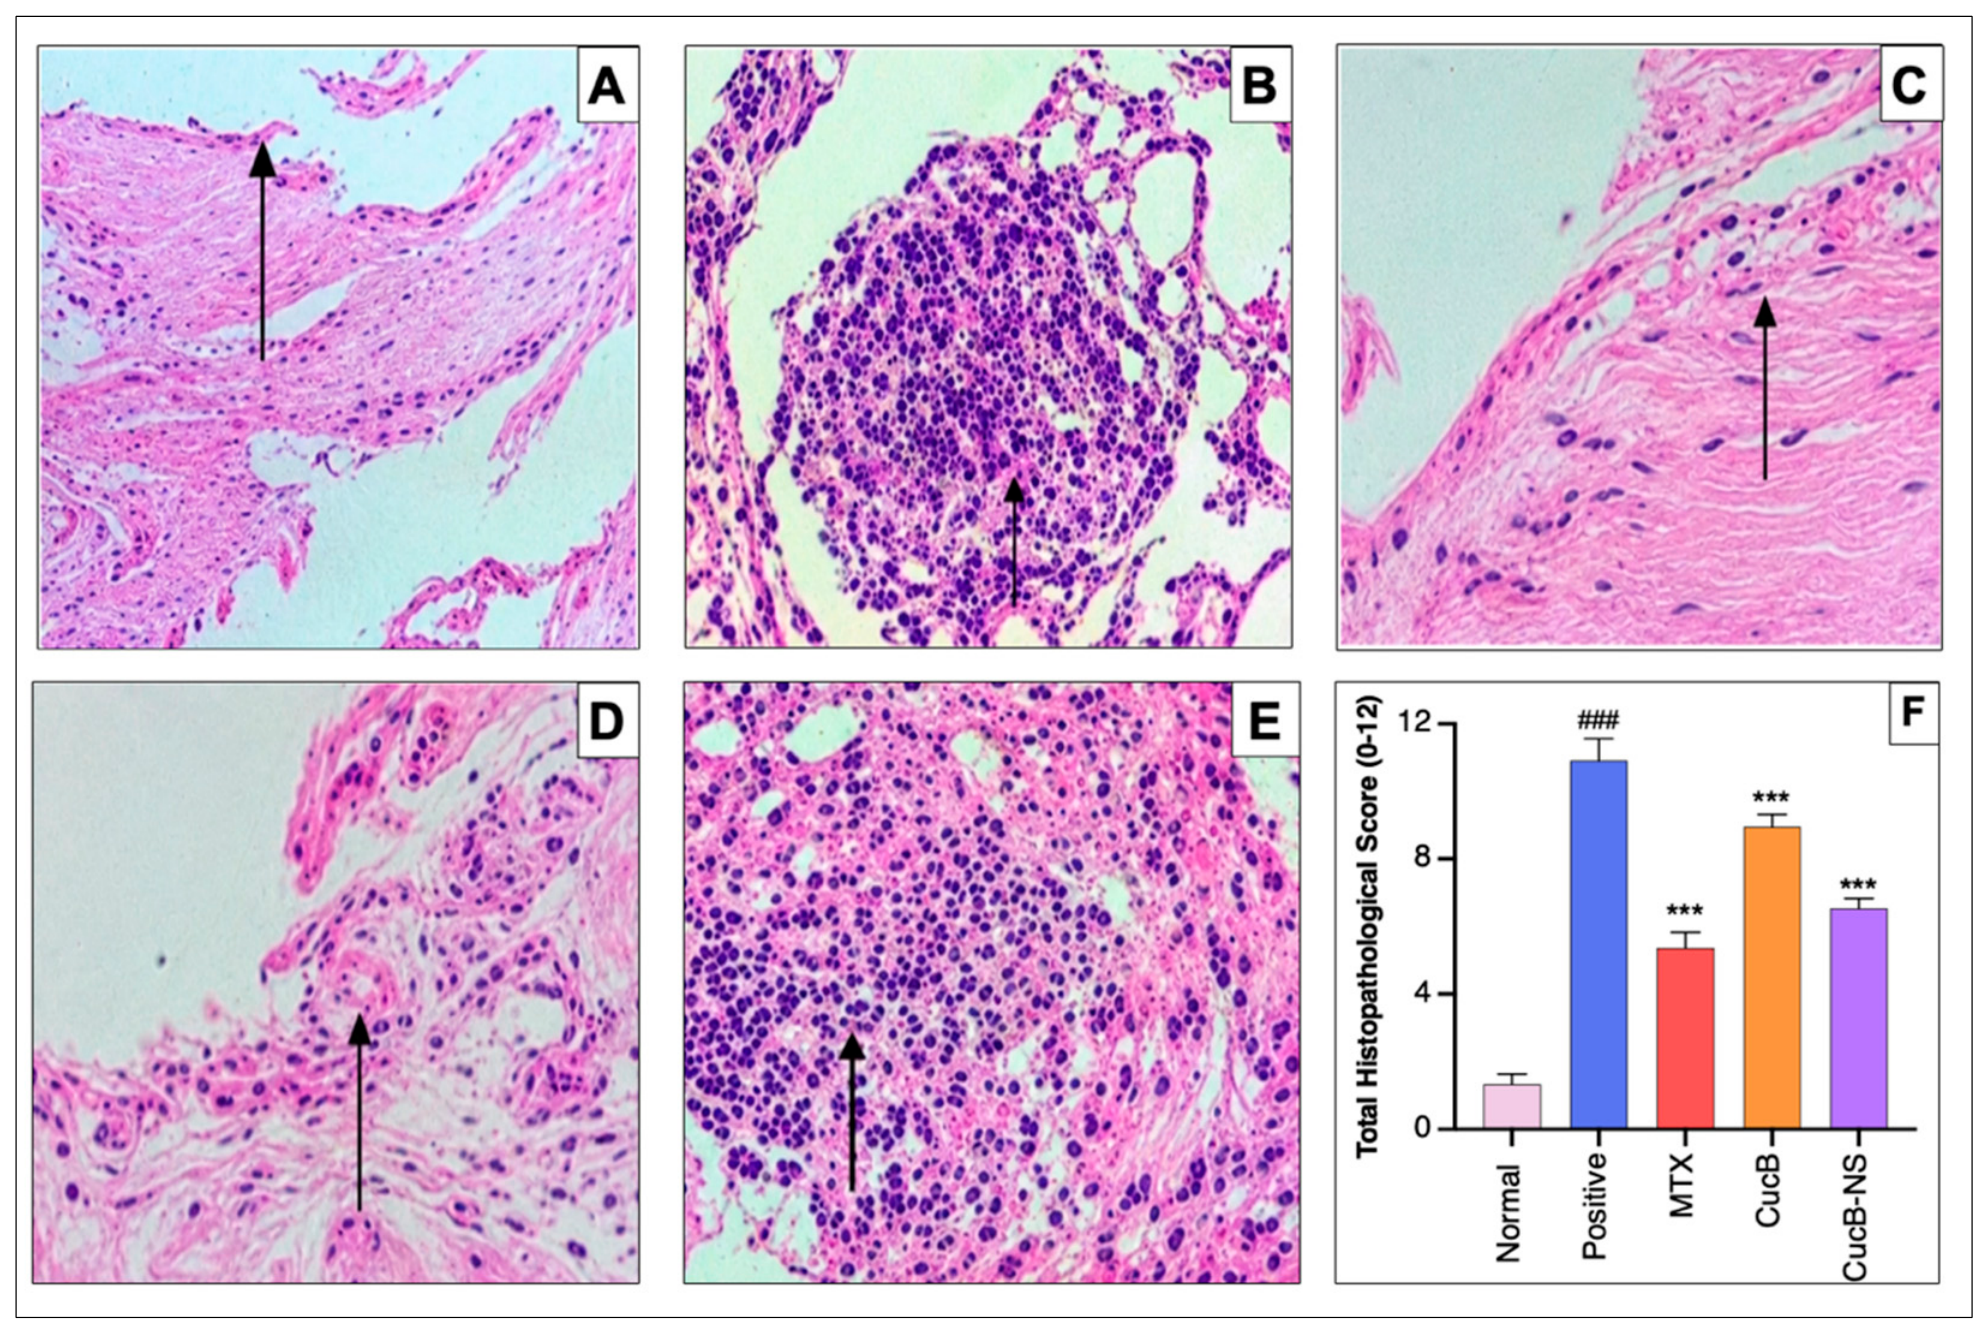
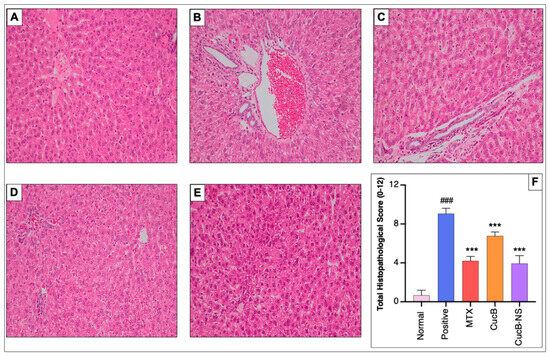
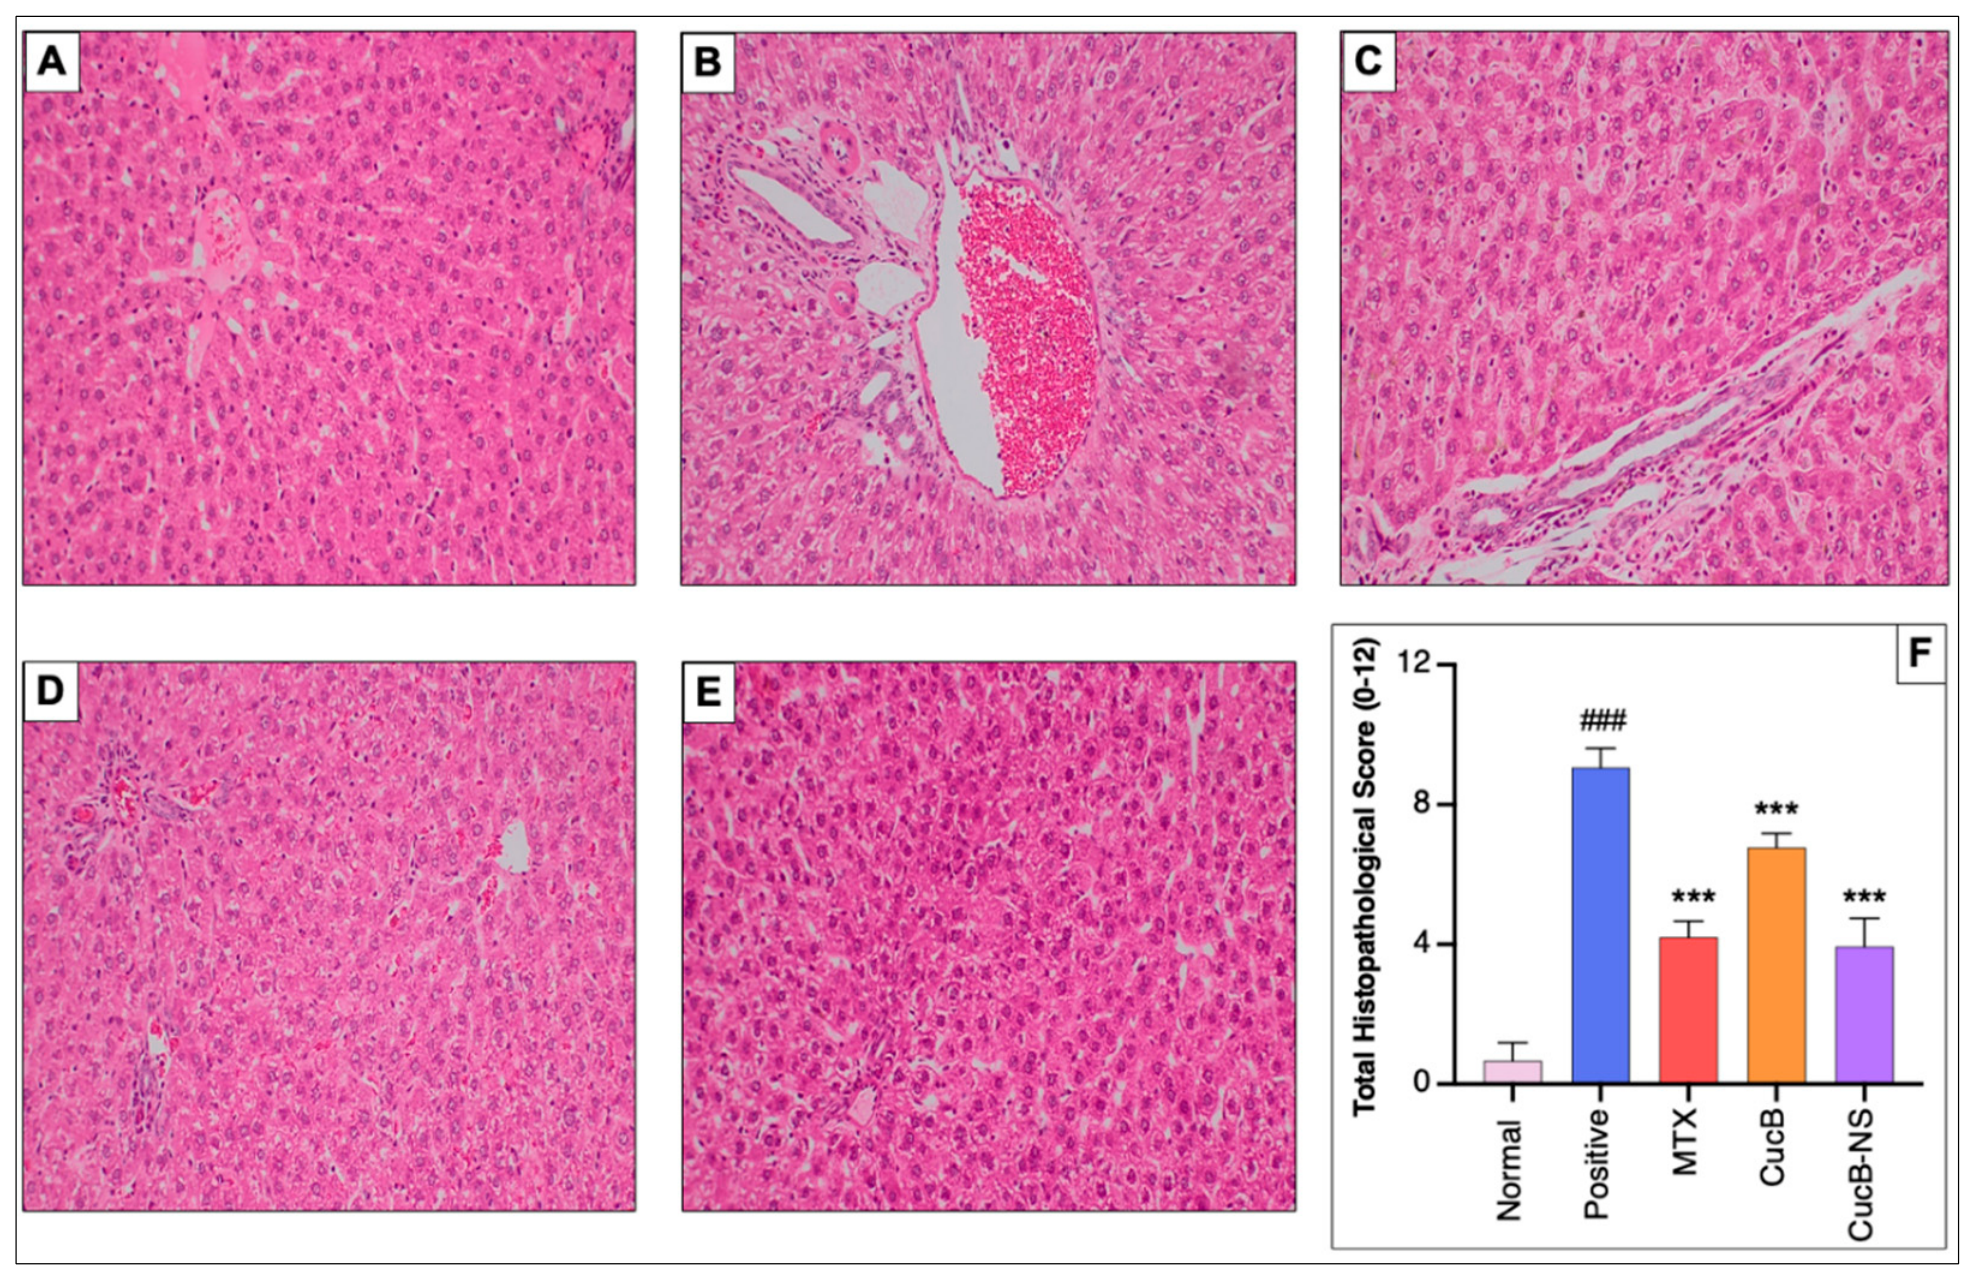
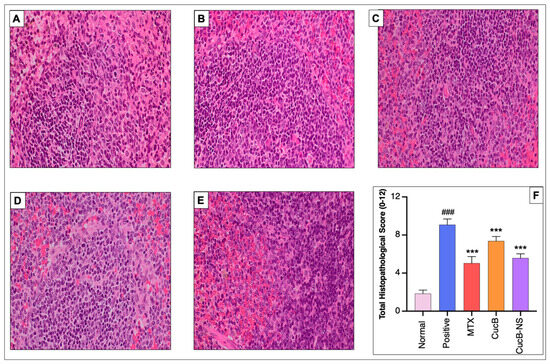
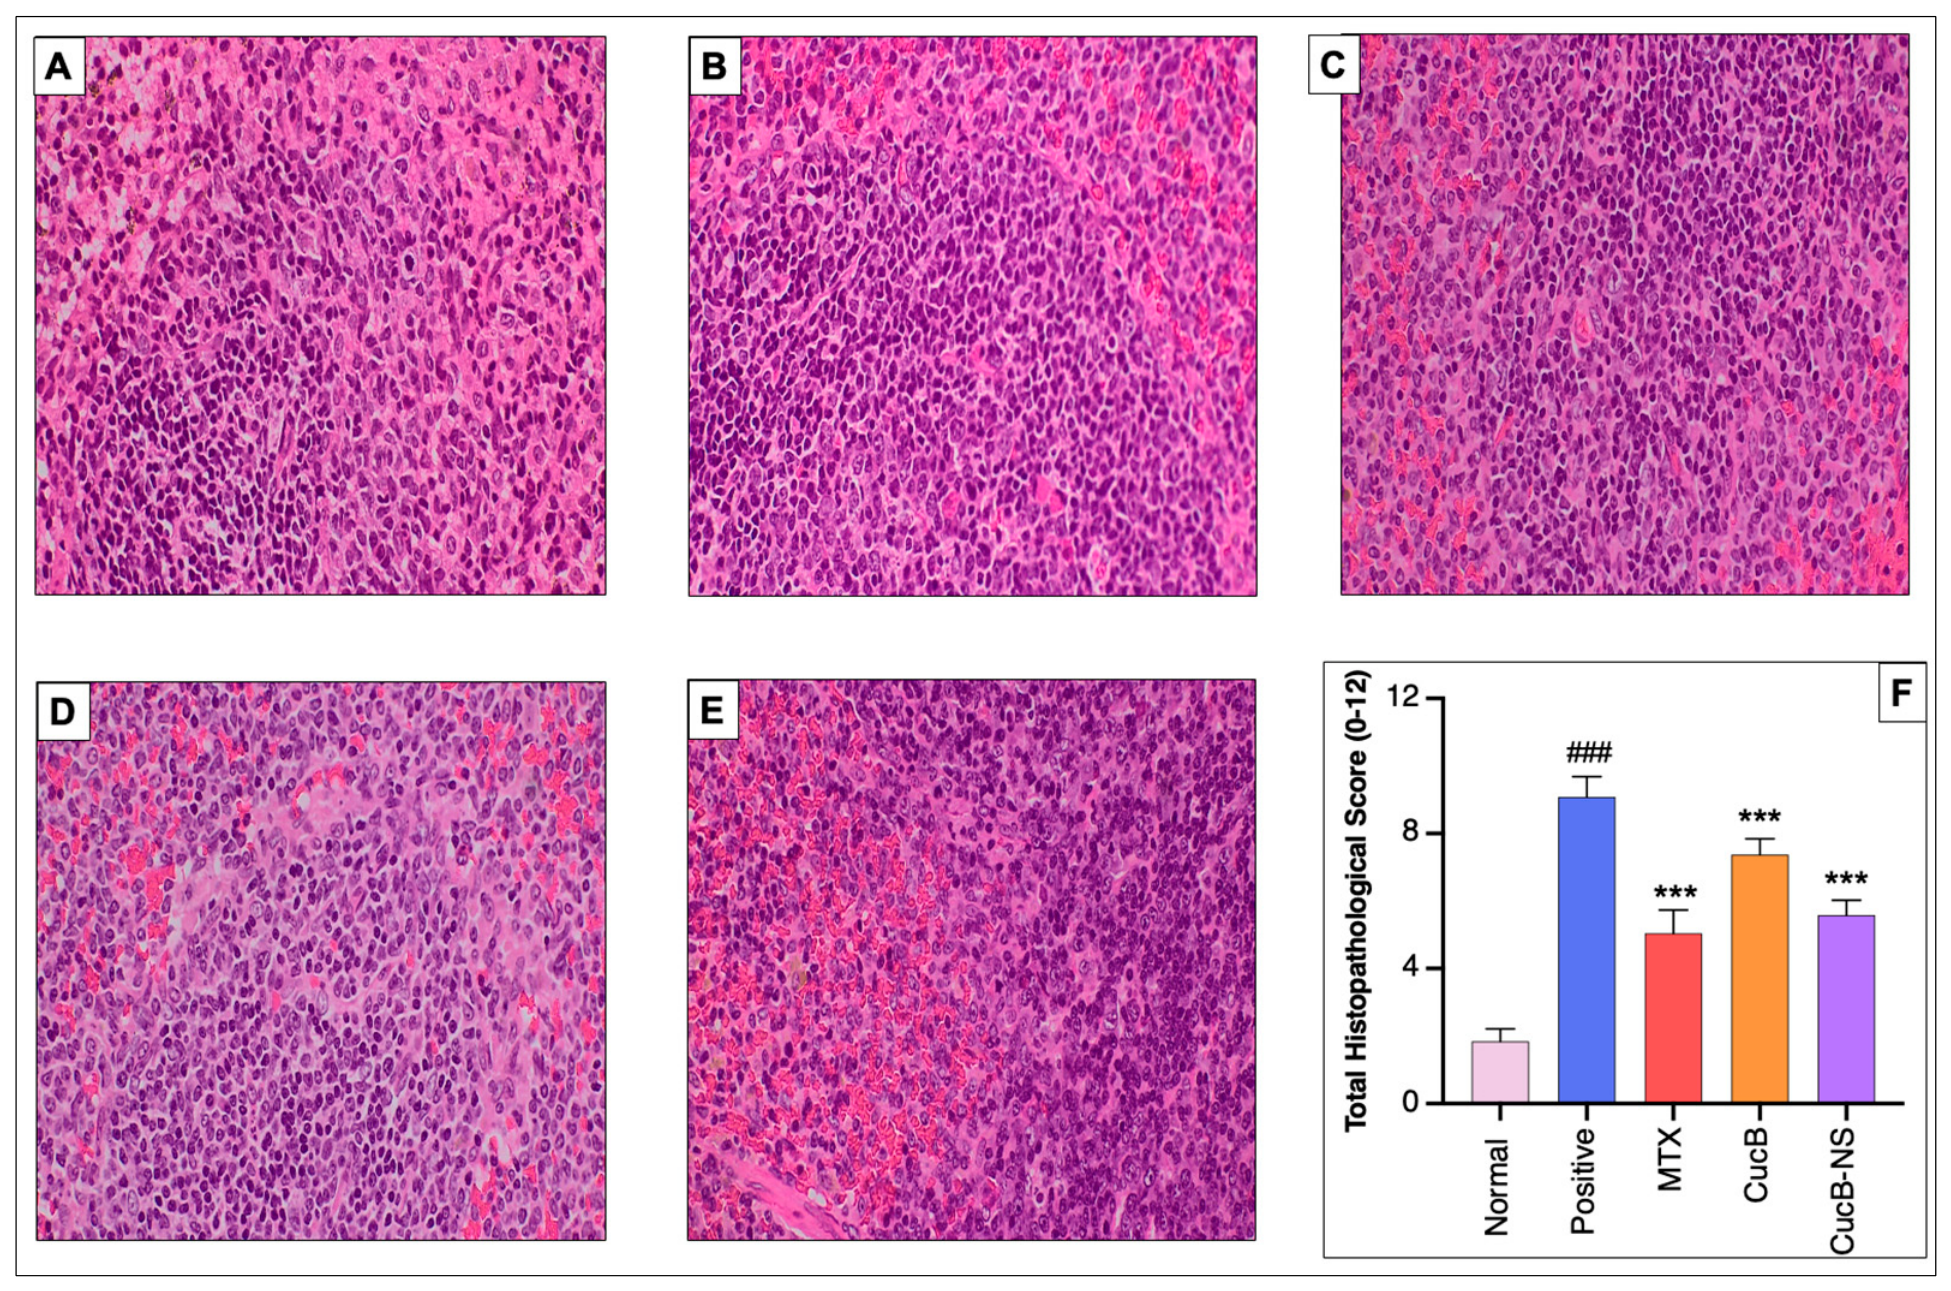

Disclaimer/Publisher’s Note: The statements, opinions and data contained in all publications are solely those of the individual author(s) and contributor(s) and not of MDPI and/or the editor(s). MDPI and/or the editor(s) disclaim responsibility for any injury to people or property resulting from any ideas, methods, instructions or products referred to in the content. |
© 2026 by the authors. Published by MDPI on behalf of the Österreichische Pharmazeutische Gesellschaft. Licensee MDPI, Basel, Switzerland. This article is an open access article distributed under the terms and conditions of the Creative Commons Attribution (CC BY) license.