


Abstract
Background/Objectives: Death certificates provide a population-level measure of mortality involving gastrointestinal hemorrhage (GIH) and liver cirrhosis. We examined trends in deaths with unspecified GIH and selected cirrhosis codes recorded among U.S. adults aged 45 years and older from 1999 through 2024. Methods: Centers for Disease Control and Prevention Wide-Ranging Online Data for Epidemiologic Research (CDC WONDER) mortality data were queried for K92.2 AND (K70.3 OR K74.6). Age-adjusted mortality rates (AAMRs) per 100,000 were standardized to the 2000 U.S. population. Joinpoint models evaluated national trends, alternative model restrictions, an expanded bleeding definition and overlapping cirrhosis-code strata. Results: There were 75,309 deaths, averaging 2897 annually. The mean annual AAMR was 2.27, with higher descriptive means among males and in the West. The primary full-period average annual percent change (AAPC) was 0.48% (95% confidence interval, −0.59 to 1.57; p = 0.381). A maximum-two-joinpoint model was also nonsignificant, whereas wider spacing yielded an AAPC of 1.14% (0.20–2.09; p = 0.018). Adding bleeding esophageal varices identified 105,000 deaths, with an AAPC of 0.26% (−0.52 to 1.05; p = 0.508). Cirrhosis-code analyses were exploratory; the K70.3 model included a three-observation initial segment, limiting interpretation. Conclusions: Mortality with unspecified GIH and selected co-recorded cirrhosis codes represents a defined death certificate endpoint, not all cirrhosis-related bleeding mortality. The identified burden depended on the bleeding codes included, and inference about full-period change and late trends depended on model restrictions.
1. Introduction
Liver cirrhosis is characterized by diffuse fibrosis and regenerative nodules that distort hepatic architecture. Clinical function varies from compensated disease to decompensation with serious complications; cirrhosis does not invariably imply a functionless liver [1]. Major causes include alcohol-associated liver disease, chronic viral hepatitis, and metabolic liver disease [2,3]. Gastrointestinal hemorrhage (GIH) in people with cirrhosis can have variceal or nonvariceal sources, which require different clinical assessments [4,5].
Portal hypertension is central to many cirrhosis complications. A hepatic venous pressure gradient above 5 mmHg indicates sinusoidal portal hypertension; a gradient of at least 10 mmHg defines clinically significant portal hypertension in viral- and alcohol-related cirrhosis [6]. Acute variceal hemorrhage remains associated with approximately 10–15% six-week mortality despite treatment [4]. Management includes stabilization, vasoactive treatment, antibiotic prophylaxis, and early endoscopy, with transjugular intrahepatic portosystemic shunt (TIPS) considered in selected high-risk patients [4,6,7,8]. These clinical mechanisms provide context but are not identified by the unspecified bleeding code used here.
Bleeding also imposes costs on patients and health systems. A U.S. inpatient analysis of nonvariceal upper GIH reported higher daily hospital costs among patients with cirrhosis than those without cirrhosis ($3114 versus $2810) [5]. These are study-specific historical cost estimates, not current costs or estimates from the present analysis. Cirrhosis is also associated with impaired quality of life and caregiver burden, as demonstrated in a study of 106 patient–caregiver pairs [9]. A separate study of patients with cirrhosis and their caregivers linked hepatic encephalopathy and cognitive dysfunction to financial strain, employment difficulties, and caregiver burden [10]. Mortality surveillance captures only one dimension of these consequences.
Related national analyses already exist. An American College of Gastroenterology (ACG) 2025 conference abstract reported 81,915 deaths during 1999–2023 using K92.2 with a broader cirrhosis code set that included K70.3, K71.7, and K74 [11]. Merza et al. examined U.S. upper gastrointestinal bleeding mortality using a broader bleeding definition through 2021 [12]. The present study is an incremental update through 2024 focused on adults aged 45 years and older and the narrower cirrhosis definition K70.3 or K74.6. Differences in code selection and population prevent direct comparison of absolute rates. Our objective was to describe deaths with unspecified GIH and these co-recorded cirrhosis codes, rather than estimate all cirrhosis-related bleeding deaths or treatment outcomes.
2. Materials and Methods
2.1. Study Design, Data Sources, and Population
We conducted a retrospective observational analysis of aggregate death-certificate data for U.S. residents aged 45 years and older. Data for 1999–2020 came from the Centers for Disease Control and Prevention Wide-ranging Online Data for Epidemiologic Research (CDC WONDER) Multiple Cause of Death, 1999–2020 database; data for 2021–2024 came from Multiple Cause of Death, 2018–2024, Single Race [13,14]. Both contain final mortality data. The national series and additional subgroup and sensitivity queries were extracted on 14 October 2026; the preserved sex and Census-region exports were dated 28 August 2026. Only the earlier database contributed 2018–2020 observations to the primary series. Ages were 45–54, 55–64, 65–74, 75–84, and 85 years or older. The age threshold defines a midlife-and-older population and aligns the analysis with the five reported age groups. It is a scope restriction, not a validated clinical threshold for cirrhosis or bleeding risk. The estimates therefore apply to adults aged 45 years and older and do not describe the burden or trends among younger adults.
The earlier database uses bridged-race categories and the later database uses single-race categories. In a comparison of overlapping years 2018–2020, national death counts, population denominators, and age-adjusted mortality rate (AAMR) point estimates were identical between databases. Confidence limits and standard errors differed, consistent with the later database’s updated calculations. Race-specific counts and population denominators differed; consequently, race-specific results were presented separately by database era without a continuous 26-year race-specific regression. The supplied population denominators were retained; no custom bridging was applied [13,14].
2.2. Case Definition and Data Abstraction
Eligible records contained International Classification of Diseases, Tenth Revision (ICD-10) code K92.2 (gastrointestinal hemorrhage, unspecified) AND at least one of K70.3 (alcoholic cirrhosis of liver) or K74.6 (other and unspecified cirrhosis of liver) in the multiple-cause fields. The preserved query criteria explicitly use the AND operator between the bleeding and cirrhosis selections. Neither condition was required to be the underlying cause. Co-recording does not establish that cirrhosis caused bleeding or that bleeding was the immediate cause of death. K92.2 does not specify the anatomical source and does not comprehensively capture specifically coded variceal or other gastrointestinal bleeding [13,14]. The selected cirrhosis codes explicitly identify alcoholic cirrhosis and other or unspecified cirrhosis, providing a focused, reproducible code-defined endpoint. Using the full K74 category would also include fibrosis and sclerosis categories and biliary cirrhosis, while K71.7 would extend the endpoint to toxic liver disease with fibrosis and cirrhosis. The narrower set therefore defines the scope of this analysis rather than a comprehensive or clinically validated cirrhosis definition. Deaths recorded only under excluded categories are not captured.
We evaluated a broader bleeding definition, (K92.2 OR I85.0) AND (K70.3 OR K74.6), as a sensitivity analysis. CDC WONDER identifies I85.0 as esophageal varices with bleeding in the mortality ICD-10 classification. The primary K92.2 endpoint was retained. Separate queries examined K92.2 with K70.3 and with K74.6. These are code-defined strata that may overlap, not mutually exclusive or clinically adjudicated etiologies. K74.6 was not interpreted as identifying metabolic dysfunction-associated steatotic liver disease (MASLD) or viral hepatitis. MASLD is a clinical designation incorporating hepatic steatosis and cardiometabolic criteria, rather than a synonym for unspecified cirrhosis [15].
We extracted year, sex, Census region, deaths, population, annual AAMR, its 95% confidence interval (CI), and standard error (SE). Census regions were Northeast, Midwest, South, and West. These aggregate records do not contain diagnostic confirmation, endoscopic findings, emergency department encounters, ward trajectories, treatment details, or patient-level follow-up. Place of death, where available in the underlying database, is not a substitute for an encounter history. Urban–rural differences were not analyzed.
Race/ethnicity was re-extracted as Hispanic or Latino of any race and non-Hispanic racial categories. American Indian/Alaska Native and Asian/Pacific Islander groups were retained rather than excluded. The older database combines Asian/Pacific Islander categories; the later database distinguishes Asian, Native Hawaiian/Other Pacific Islander, and multiracial categories. Unknown Hispanic origin was retained as a separate category where reportable. Suppression was preserved and no suppressed count was inferred. State counts and pooled rates with 95% CIs were obtained separately for 1999–2020 and 2021–2024. These rates use the complete selected period within each database and are not averages of available annual rates. The two era-specific adjusted rates were not combined into a full-period estimate. For states with all five age-specific death counts and population totals available in both periods, we also summed those quantities across periods and directly standardized the resulting age-specific rates. The 2000 projected standard population was normalized to ages 45 years and older. Calculations used unrounded age-specific rates and Fay–Feuer gamma confidence limits [16]. States with any suppressed or missing age cell received no full-period AAMR; no missing cell was reconstructed.
2.3. Statistical Analysis
Annual AAMRs were obtained from CDC WONDER per 100,000 population aged 45 years and older, using the 2000 U.S. standard population [17]. The denominator is the general population in the selected age range, not patients with cirrhosis or individuals admitted with bleeding. We summed deaths across years. For descriptive comparisons, the mean annual AAMR was the unweighted arithmetic mean of the 26 annual AAMRs. This is not a pooled-period rate. We did not average annual confidence limits or assign those averages to the descriptive mean. Annual CIs are presented with the annual rates in Supplementary Table S1.
For the new subgroup and sensitivity extracts, rates, limits, and standard errors were retained at five decimal places; the supplied sex and Census-region exports retain their original precision. We retained each database’s annual CI and SE calculations. CDC documents updated Fay–Feuer-based uncertainty calculations for the single-race database with the final-2024 release in February 2026. Suppressed or unreliable estimates were retained as such and not imputed. State pooled rates were directly supplied by CDC for each database period; neither annual confidence limits nor era-specific rates were averaged [13,14].
Temporal patterns were analyzed using Joinpoint Regression Program version 6.0.1 [18]. National, expanded-bleeding and cirrhosis-code series were fitted using log-transformed annual AAMRs, supplied standard errors and uncorrelated errors. Grid search considered zero to four joinpoints, with minimum-observation settings of two before the first and after the last joinpoint and two between joinpoints, and no additional grid points between observed years. Model selection used 4499 permutations at an overall significance level of 0.05 [19]. Parametric 95% CIs were used for annual percent changes (APCs) and the full-period average annual percent change (AAPC), covering 1999–2024 [20]. Sex and Census-region comparisons were descriptive. The Supplementary Materials include the analysis inputs, six saved output files and settings documentation (Tables S8 and S9).
Two additional national models evaluated sensitivity to restrictions on model complexity and segment spacing. One limited the maximum number of joinpoints to two while retaining both minimum-observation settings at two. The other retained a maximum of four joinpoints but increased both minimum-observation settings to four. Other specified settings were unchanged. These checks were undertaken in response to peer review, and all results are reported irrespective of statistical significance. Two-sided p values below 0.05 were considered statistically significant. Short segments and wide intervals were interpreted cautiously. No formal between-stratum trend comparison was performed. The descriptive plots show observed annual rates and their CIs, not fitted regression curves.
3. Results
3.1. National Mortality
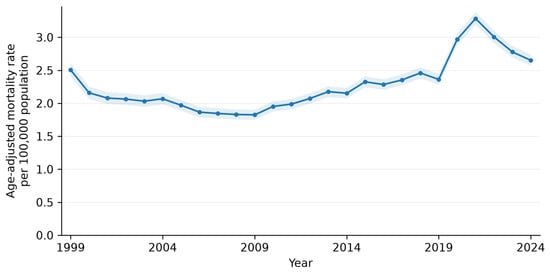
From 1999 through 2024, 75,309 death certificates recorded both unspecified GIH and selected cirrhosis codes, equivalent to 2896.5 deaths per year on average. Annual sex and Census-region death counts each reconciled exactly with the national total for every year. The mean annual AAMR was 2.27 per 100,000. Annual AAMRs were 2.51 (95% CI, 2.40–2.61) in 1999, 3.28 (3.19–3.38) in 2021, and 2.65 (2.57–2.74) in 2024 (Figure 1; Supplementary Table S1).
Figure 1.
Annual age-adjusted mortality rates for deaths with unspecified gastrointestinal hemorrhage (K92.2) and cirrhosis (K70.3 or K74.6) co-recorded, U.S. adults aged 45 years and older, 1999–2024. Shading indicates annual 95% confidence intervals. Rates are per 100,000 and standardized to the 2000 U.S. population. Source: Centers for Disease Control and Prevention Wide-ranging Online Data for Epidemiologic Research (CDC WONDER). Lines connect observed annual values; they are not fitted regression curves.
The primary model selected joinpoints in 2007, 2018 and 2021. The full-period AAPC was 0.48% (95% CI, −0.59 to 1.57; p = 0.381). APCs were −3.10% during 1999–2007 (95% CI, −4.18 to −2.00; p < 0.001), 2.58% during 2007–2018 (1.83–3.33; p < 0.001), 10.29% during 2018–2021 (1.80–19.49; p = 0.020), and −6.50% during 2021–2024 (−10.00 to −2.87; p = 0.002). The final two segments each contain four annual observations (Supplementary Table S8).
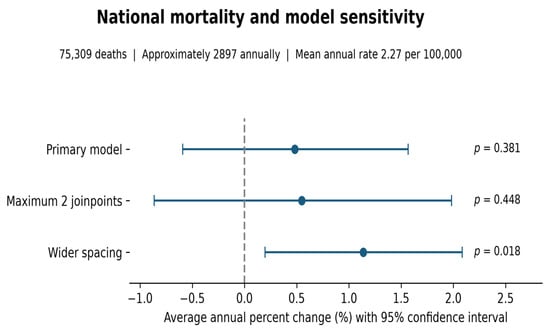
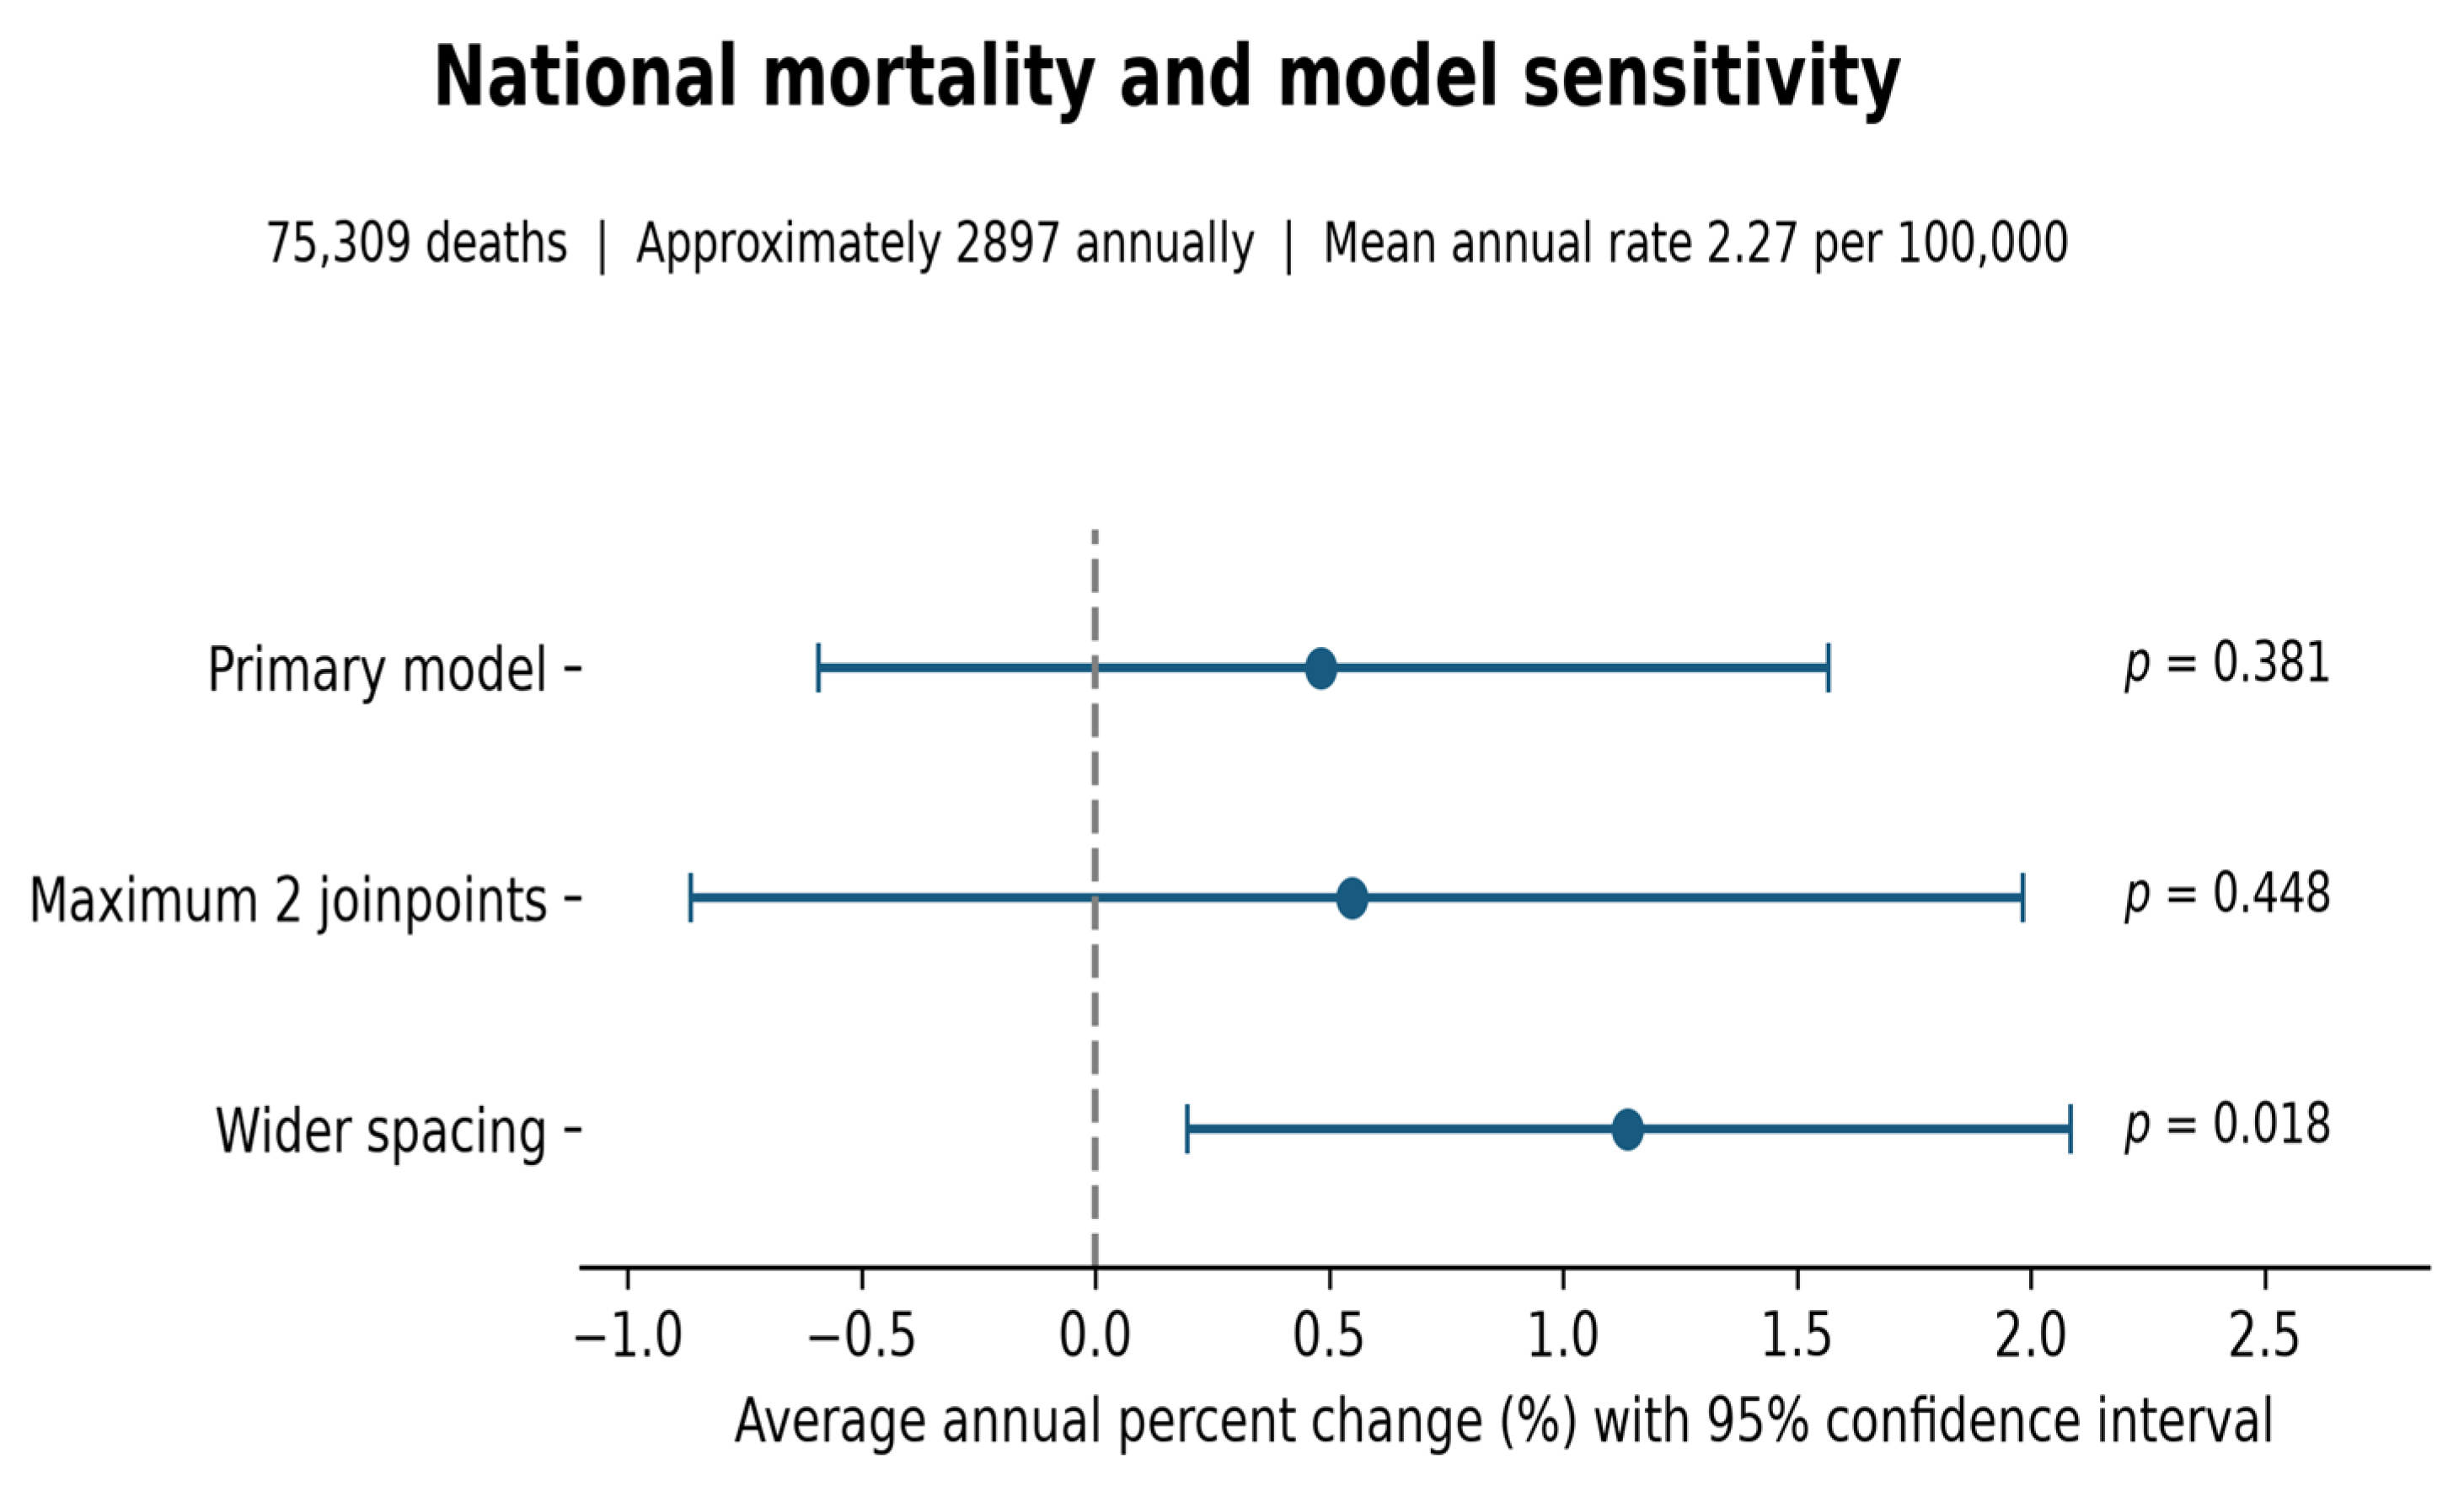
With a maximum of two joinpoints, the selected years were 2009 and 2022, and the AAPC was 0.55% (95% CI, −0.86 to 1.98; p = 0.448). The final 2022–2024 decline was not statistically significant (APC, −7.25%; 95% CI, −20.77 to 8.58; p = 0.329). Under wider minimum spacing, one joinpoint was selected in 2008. APCs were −2.66% during 1999–2008 (−4.90 to −0.36; p = 0.025) and 3.34% during 2008–2024 (2.49–4.19; p < 0.001), with a full-period AAPC of 1.14% (0.20–2.09; p = 0.018). Thus, full-period significance and the evidence for a distinct late decline were sensitive to the model restrictions.
3.2. Sex-Specific Mortality
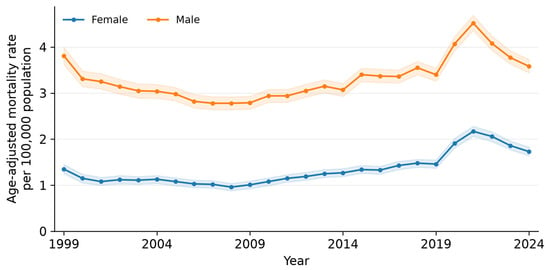
There were 51,621 deaths among males and 23,688 among females. Mean annual AAMRs were 3.31 and 1.34 per 100,000, respectively. Both annual series showed a rise approaching 2021 and a subsequent decline (Figure 2; Supplementary Tables S1 and S2). These population-level comparisons do not estimate sex-specific case fatality among patients with cirrhosis.
Figure 2.
Annual age-adjusted mortality rates by sex for deaths with unspecified gastrointestinal hemorrhage (K92.2) and cirrhosis (K70.3 or K74.6) co-recorded, U.S. adults aged 45 years and older, 1999–2024. Shading indicates annual 95% confidence intervals. Rates are per 100,000 and standardized to the 2000 U.S. population. Source: Centers for Disease Control and Prevention Wide-ranging Online Data for Epidemiologic Research (CDC WONDER). Lines connect observed values.
3.3. Regional Mortality
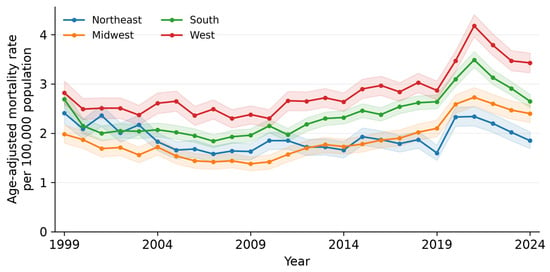
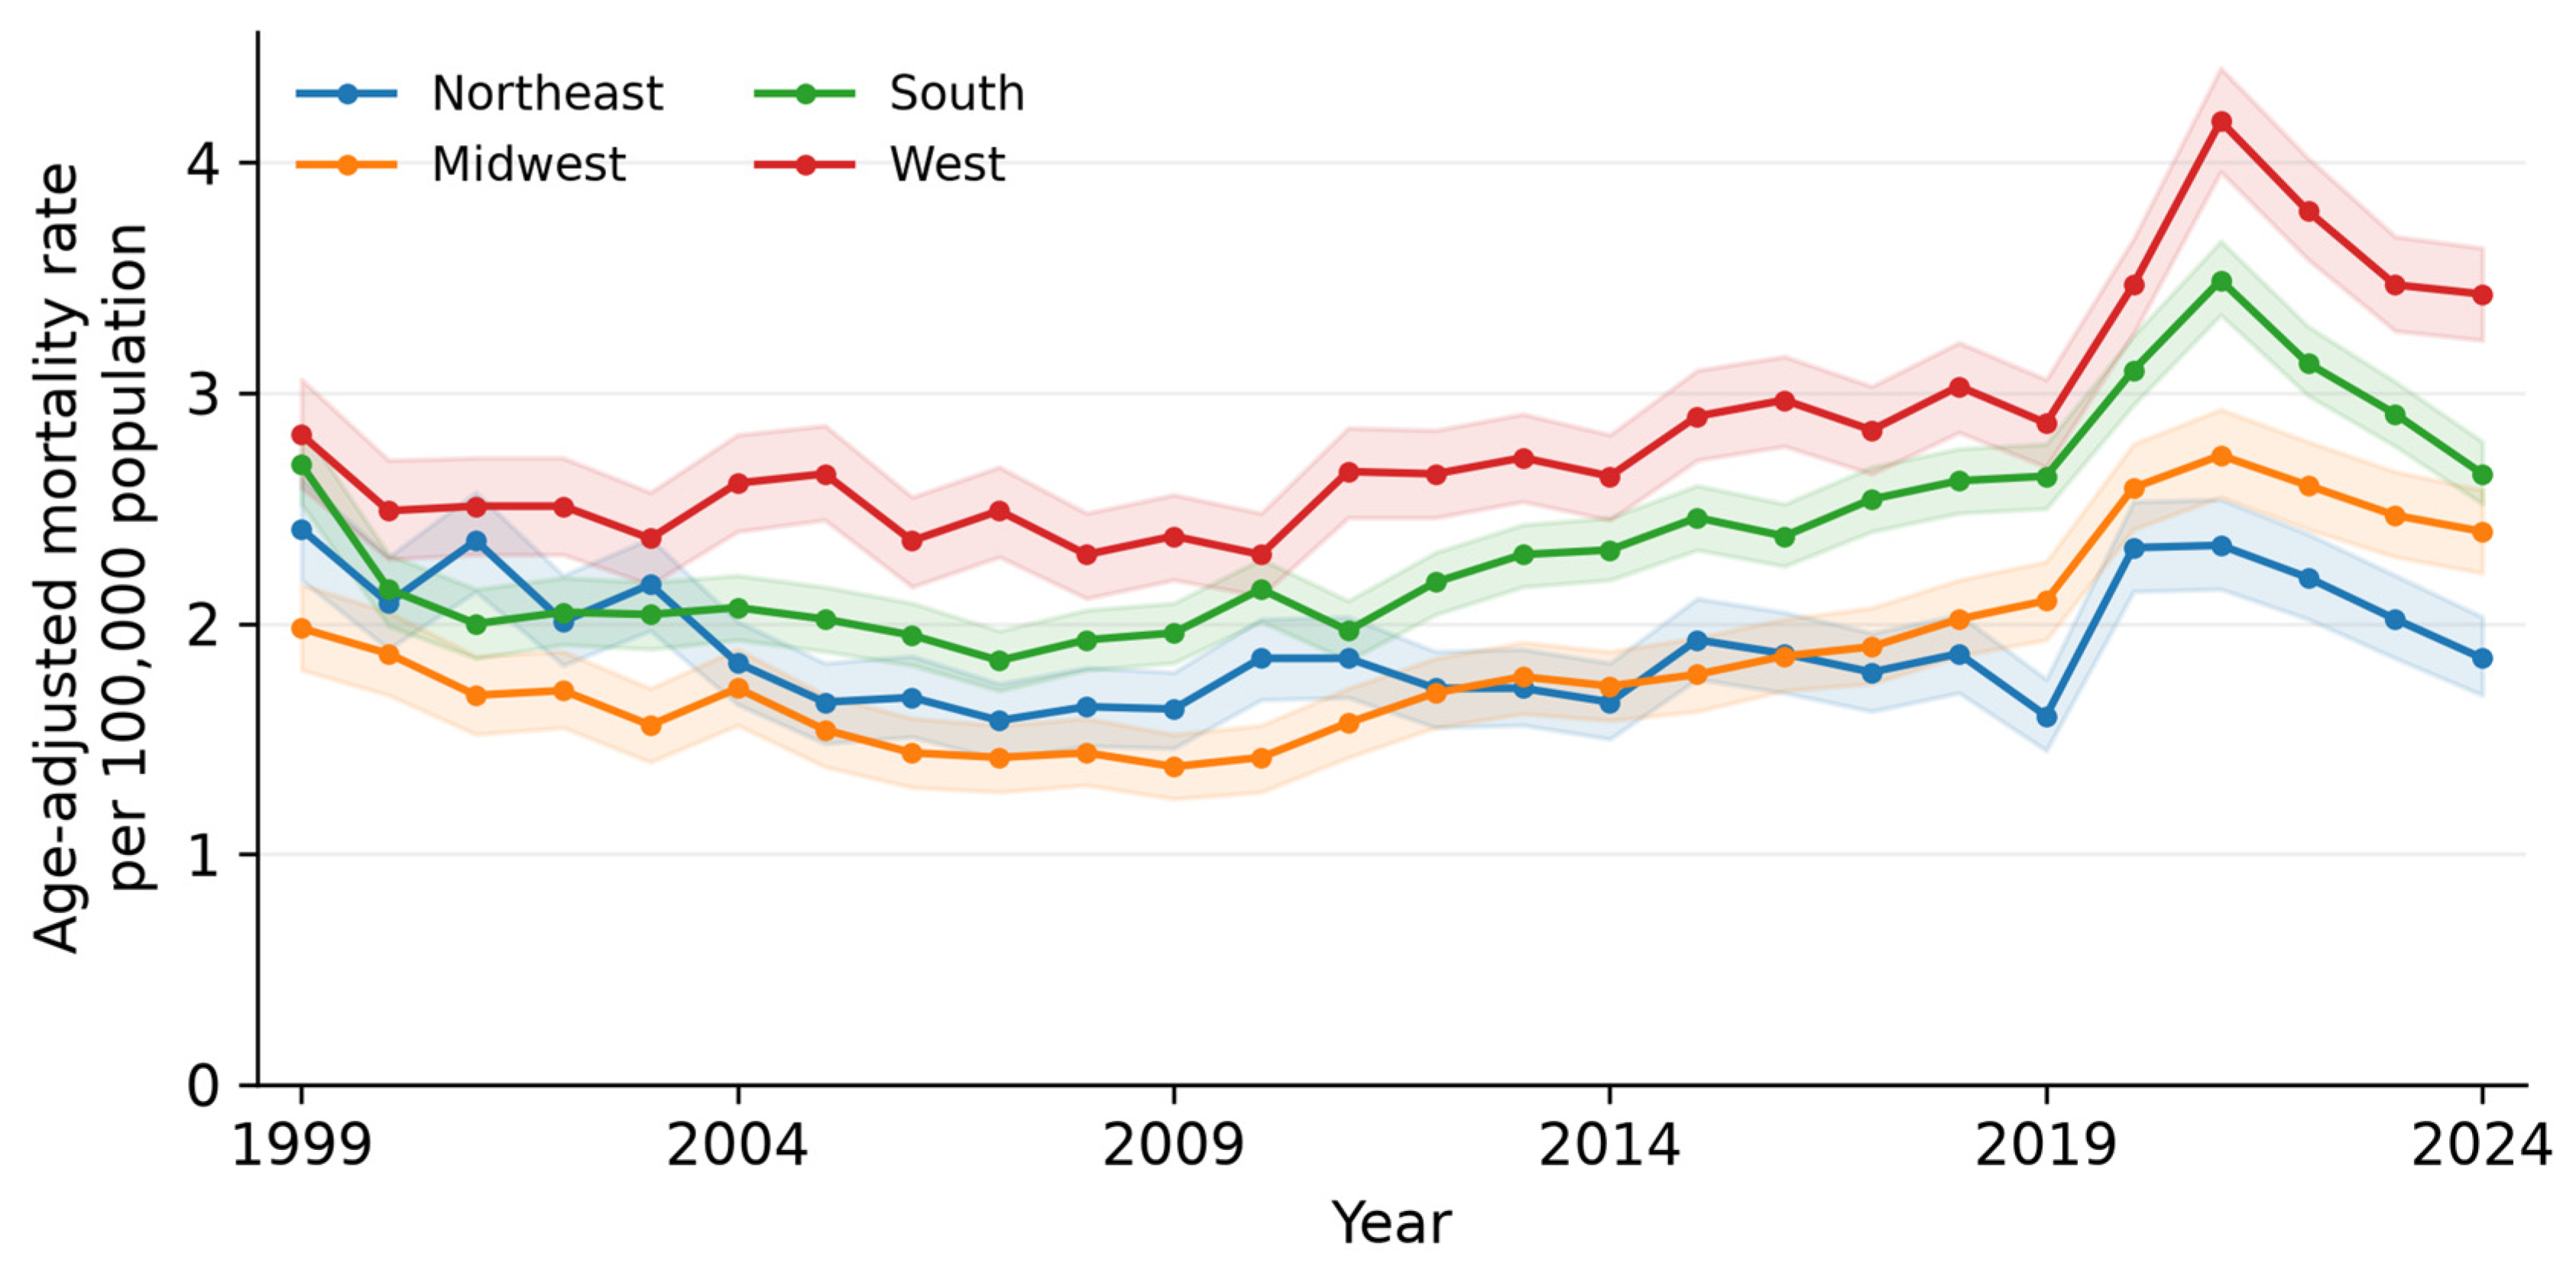
Mean annual AAMRs were 2.82 in the West, 2.37 in the South, 1.91 in the Northeast, and 1.86 in the Midwest. Corresponding death counts were 20,831, 29,339, 11,682, and 13,457, respectively (Figure 3; Supplementary Tables S1 and S2). These summaries use all 26 annual rates within each region and do not represent pooled-period rates or state rankings.
Figure 3.
Annual age-adjusted mortality rates by Census region for deaths with unspecified gastrointestinal hemorrhage (K92.2) and cirrhosis (K70.3 or K74.6) co-recorded, U.S. adults aged 45 years and older, 1999–2024. Shading indicates annual 95% confidence intervals. Rates are per 100,000 and standardized to the 2000 U.S. population. Source: Centers for Disease Control and Prevention Wide-ranging Online Data for Epidemiologic Research (CDC WONDER). Lines connect observed values.
3.4. Race and Ethnicity
Race/ethnicity results use mutually exclusive Hispanic origin and non-Hispanic race categories, with unknown origin retained (Supplementary Table S5). In 14 years, all categories were reportable and their counts summed to the national total. In 12 years, suppressed categories prevented complete public reconciliation; their counts were not inferred. Race-specific counts and population estimates differed between the bridged-race and single-race databases during the overlapping years 2018–2020. Results are consequently reported separately for 1999–2020 and 2021–2024, and no continuous 26-year race-specific regression is presented.
3.5. State Estimates
State death counts totaled 58,070 in 1999–2020 and 17,239 in 2021–2024, together accounting for all 75,309 deaths. Era-specific pooled AAMRs and confidence intervals are presented in Supplementary Table S4. Complete age-specific data supported calculation of full-period pooled AAMRs for 22 states. Suppressed or missing age cells prevented full-period rate estimation for the remaining 29 jurisdictions (Supplementary Table S7). These incomplete geographic estimates do not support a comprehensive national ranking of states.
3.6. Coding Sensitivity and Cirrhosis Strata
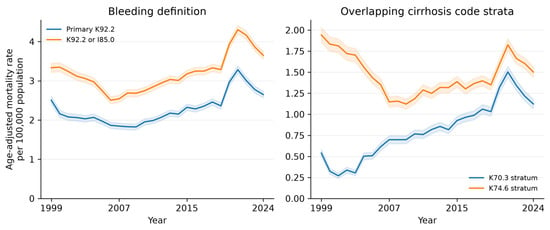
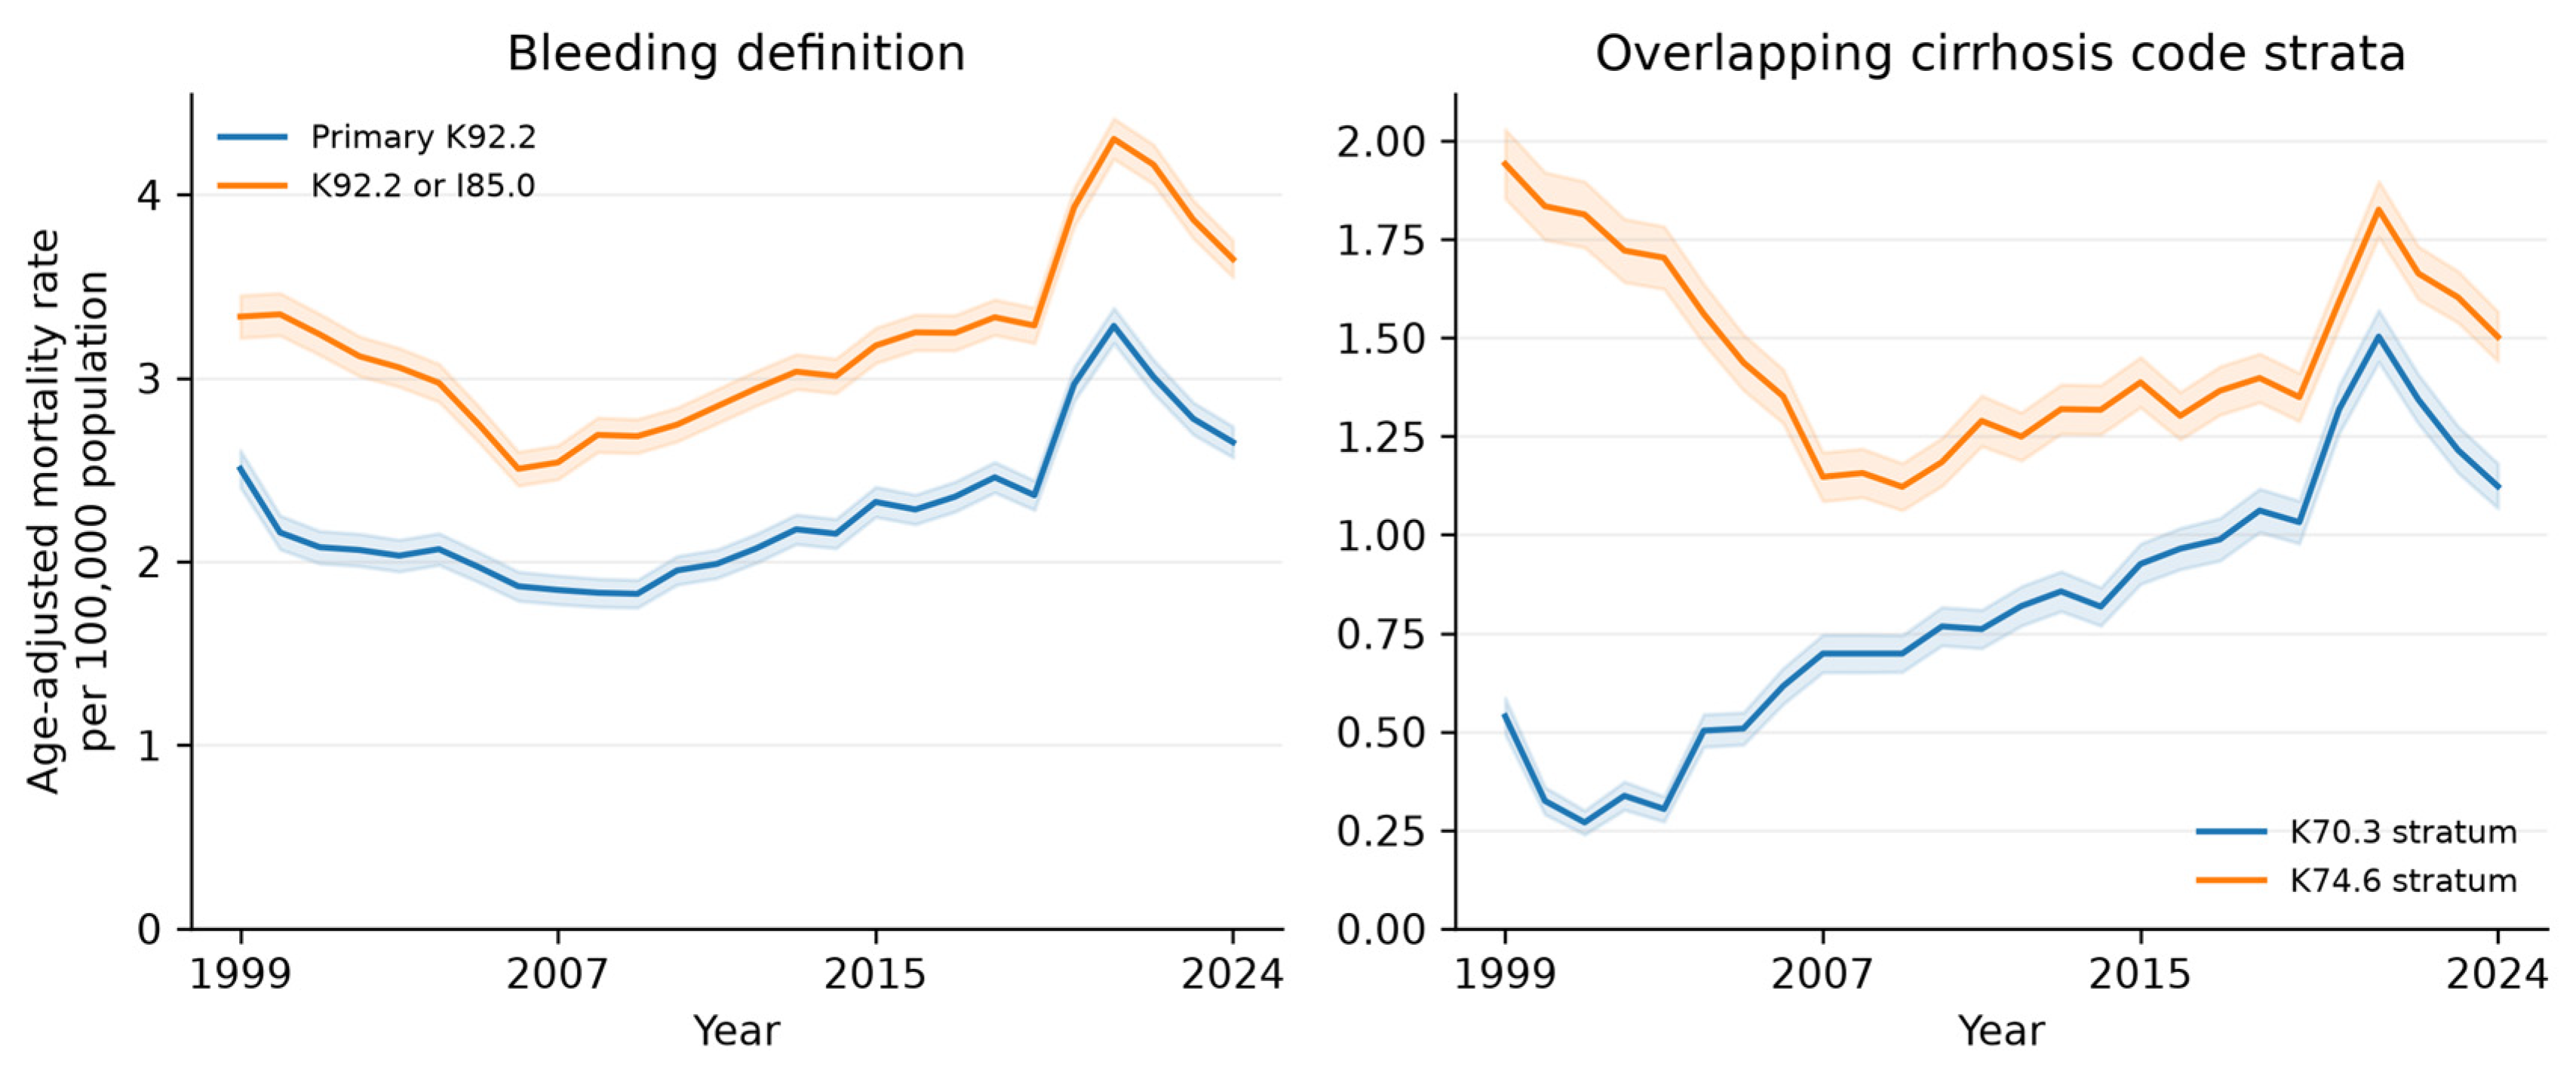
Adding I85.0 to the bleeding definition identified 105,000 deaths, 29,691 (39.4%) more than the primary definition. The expanded-definition AAMR was 3.34 in 1999 and 3.65 in 2024. Joinpoints were selected in 2007, 2018 and 2021, as in the primary model. The full-period AAPC was 0.26% (95% CI, −0.52 to 1.05; p = 0.508). Segment APCs were −3.50%, 2.26%, 8.88% and −4.87%, respectively, with all four segment CIs excluding zero (Supplementary Tables S6 and S8; Figure 4).
Figure 4.
Annual observed age-adjusted mortality rates and 95% confidence intervals for coding sensitivity analyses, U.S. adults aged 45 years and older, 1999–2024. Left: K92.2 versus K92.2 or I85.0, each co-recorded with K70.3 or K74.6. Right: K92.2 co-recorded with K70.3 versus K74.6; these strata overlap. Rates are per 100,000 and standardized to the 2000 U.S. population. Shading represents annual confidence intervals; lines connect observed values. Source: Centers for Disease Control and Prevention Wide-ranging Online Data for Epidemiologic Research (CDC WONDER).
In exploratory analyses, the K92.2-with-K70.3 query identified 27,581 deaths, with annual AAMRs of 0.54 in 1999 and 1.12 in 2024. The fitted AAPC was 3.11% (95% CI, 0.14–6.18; p = 0.040), with joinpoints in 2001, 2006, 2018 and 2021. The K92.2-with-K74.6 query identified 47,977 deaths, with corresponding rates of 1.94 and 1.50. Its AAPC was −1.16% (−2.64 to 0.34; p = 0.128), with joinpoints in 2008, 2018 and 2021. The K70.3 model includes a three-observation initial segment, and its short-segment estimates warrant caution. The strata overlap and must not be summed as mutually exclusive groups. Statistical significance in one stratum but not the other does not establish a statistically significant difference between their trends (Supplementary Table S8).
4. Discussion
The analysis identified approximately 2897 deaths annually with unspecified GIH and cirrhosis co-recorded. The primary model did not demonstrate a statistically significant full-period trend. However, the wider-spacing model did, and the final decline was not statistically significant in the maximum-two-joinpoint model. These findings show that an overall summary and the identification of short late segments depend on model restrictions. We therefore do not interpret the primary nonsignificant AAPC as evidence of stable mortality or as a conclusion robust to alternative specifications. Males had higher descriptive mean annual rates than females, and the West had the highest regional mean (Figure 5).
Figure 5.
National mortality burden and sensitivity of the full-period average annual percent change (AAPC) to model restrictions, U.S. adults aged 45 years and older, 1999–2024. The endpoint is K92.2 AND (K70.3 OR K74.6) co-recorded in multiple-cause fields. The mean annual age-adjusted mortality rate is an arithmetic mean, not a pooled-period rate. Points show AAPCs and horizontal intervals show parametric 95% confidence intervals. The dashed line marks zero change. The primary and maximum-two-joinpoint models use minimum-observation settings of two, and the wider-spacing model uses settings of four. Source: Centers for Disease Control and Prevention Wide-ranging Online Data for Epidemiologic Research and Joinpoint analyses reported in Supplementary Tables S8 and S9.
The primary outcome is narrower than all GIH in cirrhosis. K92.2 does not identify the bleeding site, and specifically coded variceal hemorrhage may be missed. The expanded sensitivity definition demonstrates that including esophageal varices with bleeding materially increases the identified burden. It still does not capture every bleeding diagnosis or establish that cirrhosis caused the hemorrhage. These population mortality measures cannot estimate the incidence of bleeding or the effectiveness of endoscopy, prophylaxis, or TIPS. Earlier work on U.S. liver-related mortality showed that changing the set of included diagnoses materially altered both the estimated burden and its temporal interpretation [21]. That finding supports transparent reporting of code selection, but it does not validate the sensitivity or specificity of the present co-recorded endpoint.
U.S. studies have documented changes in cirrhosis mortality and its etiological composition [22,23]. An independent national study also documented rising alcohol-associated liver disease mortality, using a different outcome definition [24]. In the code-stratified models, the K70.3 stratum had a positive full-period AAPC, whereas the K74.6 stratum did not show a statistically significant full-period trend. No formal test compared those trends, and the overlapping strata are not independent etiological groups. The wide K70.3 interval and its short initial segment also limit interpretation. K74.6 is a mixed category and cannot be equated with MASLD or viral cirrhosis. These results characterize code-defined mortality patterns rather than establishing the etiological mechanisms driving national trends.
The 2018–2021 increase overlaps the onset of the COVID-19 pandemic, but the fitted upward trend begins in 2007 and the later segment begins before 2020. Pandemic-related changes in access, alcohol exposure, and death certification are hypotheses rather than mechanisms established here. Published chronic liver disease analyses provide relevant context [25], but these data cannot isolate a pandemic effect. The short post-2021 interval also does not establish a durable improvement.
Higher male and regional population rates may reflect differences in disease prevalence, exposures, bleeding incidence, survival, or recording practices. The analysis cannot separate these components or attribute regional patterns to rurality, specialist availability, or socioeconomic circumstances. A county-level study found urban–rural differences in cirrhosis mortality [26], but it examined cirrhosis as the underlying cause rather than the co-recorded hemorrhage endpoint used here. Its findings cannot establish the explanation for our regional patterns. Race-specific estimates also depend on death-certificate classification and the source population estimates. A national validation study identified inaccuracies in race and Hispanic-origin reporting on death certificates, reinforcing the need for caution in interpreting subgroup mortality comparisons [27]. Suppressed observations and the bridged-to-single-race transition limit comparisons. Full-period state estimates are limited to jurisdictions with complete age cells and therefore do not support a nationwide ranking.
These deaths represent losses to patients and families as well as a clinical burden. The observed count is not the total number of people experiencing GIH with cirrhosis, and years of potential life lost were not estimated. Studies of hospital resource use and caregiver well-being illustrate consequences beyond mortality [5,9]. The present database contains neither costs nor patient-reported quality-of-life measures.
The contribution is incremental in relation to earlier CDC WONDER studies [11,12]. This analysis extends follow-up through 2024 for a specified age group and narrower cirrhosis code set, and evaluates sensitivity to inclusion of esophageal varices with bleeding and to the cirrhosis code selected. Differences in coding scope change the population captured; the additional year alone should not be presented as establishing a new clinical association.
Clinical prevention and care priorities arise from existing evidence, rather than causal effects measured here. These include addressing alcohol and metabolic risk, treating viral hepatitis, and providing access to hepatology and appropriate endoscopic assessment. Alcohol-associated liver disease guidance supports coordinated hepatology and addiction care [28], while cirrhosis guidance addresses nutritional assessment, frailty, and sarcopenia [29]. These recommendations concern clinical care and were not evaluated in this study. For patients with portal hypertension, guideline-directed screening, prophylaxis, and treatment of confirmed variceal bleeding remain relevant [4,6,7]. Our analysis cannot determine which policy or intervention would change these mortality rates, and it does not justify targeted policies based on unvalidated race or state rankings. Multidisciplinary services involving psychological and nutritional support, with caregiver participation where appropriate, could be evaluated for people with harmful alcohol use. As an example from another clinical setting, an Italian oncology survey reported gaps in integrating nutritional care into multidisciplinary practice [30]. That survey did not test alcohol-use reduction or cirrhosis outcomes; neither it nor the present mortality analysis establishes the effectiveness of such a program for this population.
Strengths and Limitations
Strengths include a 26-year national series, reconciliation of sex and regional counts with national totals, direct checks of overlapping database years, and additional coding sensitivity analyses. Limitations include death-certificate misclassification, changes in coding and certification, the selected bleeding definition, and absence of clinical validation. The general-population denominator prevents estimation of bleeding incidence or case fatality within cirrhosis. The database transition affects race categories, denominators, and uncertainty estimates. Race-specific comparisons were therefore separated by era; full-period state AAMRs were calculable for only 22 jurisdictions, preventing comprehensive state rankings. Sensitivity analyses demonstrated dependence of full-period significance and late-segment interpretation on the regression specification. The standard errors were retained from each source database, and a separate sensitivity analysis harmonizing uncertainty methods across the database transition was not performed. Stratum analyses were exploratory, with no multiplicity adjustment or formal between-stratum trend test. Short segments, especially the initial three-observation K70.3 segment, should not be interpreted as precise clinical turning points. Code strata cannot establish causal etiologies, and no causal conclusions about treatment, rurality, or the pandemic can be drawn. The age restriction excludes deaths before age 45, and the selected cirrhosis codes omit other fibrosis and cirrhosis categories. The coding sensitivity analyses broadened the bleeding definition but did not validate the age threshold or comprehensively broaden the cirrhosis definition.
5. Conclusions
Among U.S. adults aged 45 years and older, 75,309 deaths had unspecified GIH and K70.3 or K74.6 co-recorded during 1999–2024. Including esophageal varices with bleeding increased the identified count to 105,000, demonstrating dependence on the bleeding definition. The primary and maximum-two-joinpoint models yielded nonsignificant full-period AAPCs, whereas the wider-spacing model yielded a significant increase. Overall temporal inference and evidence for a distinct late decline were therefore sensitive to model restrictions. The exploratory cirrhosis-code analyses do not establish differences between etiologies. These findings describe a selected population-level mortality endpoint and cannot establish stable mortality, causal mechanisms, or treatment outcomes.
Supplementary Materials
The following supporting information can be downloaded at https://www.mdpi.com/article/10.3390/diseases14110409/s1: Supplementary Table S1 provides annual national, sex and Census-region data; Table S2 provides descriptive mean annual rates; Table S3 documents source provenance. Table S4 provides direct pooled state rates by database era; Table S5 provides mutually exclusive racial/ethnic categories by era; Table S6 provides coding sensitivity and cirrhosis-stratum results; and Table S7 provides full-period state rates where complete age cells are available. Table S8 provides all six Joinpoint models and their APCs and AAPCs; Table S9 documents analysis settings. Query criteria, database-overlap checks, calculation scripts, input files and saved Joinpoint outputs accompany these tables.
Author Contributions
All authors contributed equally to this work. Conceptualization and topic selection: N.A., J.G., S.A., and S.H.; Investigation and literature searching: N.A., J.G., S.A., S.H., K.A., and K.K.; Data curation and extraction: E.K., S.M. (Saqib Muhammad), H.B., S.M. (Sania Minhas) and Z.U.R.; Formal analysis: M.A., M.H., I.U., and H.S.; Writing—original draft: W.A., A.R., and T.R.; Writing—review and editing: G.B., N.A., S.E., G.M., B.S., and I.J. All authors have read and agreed to the published version of the manuscript.
Funding
This research received no external funding.
Institutional Review Board Statement
Institutional Review Board approval was not required because this study analyzed publicly available, de-identified aggregate mortality data from CDC WONDER.
Informed Consent Statement
Not applicable. This study analyzed publicly available, de-identified aggregate mortality data and did not involve direct participation of human subjects.
Data Availability Statement
The source mortality data are publicly available through CDC WONDER (https://wonder.cdc.gov/mcd.html, accessed on 14 October 2026). Supplementary Tables S1–S9, query criteria, database-overlap checks, calculation scripts, Joinpoint inputs and saved outputs provide the data and analyses reported here. Suppressed data are not reconstructed.
Conflicts of Interest
The authors declare no conflicts of interest.
Abbreviations
The following abbreviations are used in this manuscript:
| AAMR | age-adjusted mortality rate |
| AAPC | average annual percent change |
| APC | annual percent change |
| CDC | Centers for Disease Control and Prevention |
| CI | confidence interval |
| GIH | gastrointestinal hemorrhage |
| ICD-10 | International Classification of Diseases, Tenth Revision |
| MASLD | metabolic dysfunction-associated steatotic liver disease |
| TIPS | transjugular intrahepatic portosystemic shunt |
| WONDER | Wide-ranging Online Data for Epidemiologic Research |
References
- D’Amico, G.; Garcia-Tsao, G.; Pagliaro, L. Natural history and prognostic indicators of survival in cirrhosis: A systematic review of 118 studies. J. Hepatol. 2006, 44, 217–231. [Google Scholar] [CrossRef] [Scilit] [PubMed]
- Liu, Y.B.; Chen, M.K. Epidemiology of liver cirrhosis and associated complications: Current knowledge and future directions. World J. Gastroenterol. 2022, 28, 5910–5930. [Google Scholar] [CrossRef] [Scilit] [PubMed]
- Tapper, E.B.; Parikh, N.D. Diagnosis and Management of Cirrhosis and Its Complications: A Review. JAMA 2023, 329, 1589–1602. [Google Scholar] [CrossRef] [Scilit] [PubMed]
- Kaplan, D.E.; Ripoll, C.; Thiele, M.; Fortune, B.E.; Simonetto, D.A.; Garcia-Tsao, G.; Bosch, J. AASLD Practice Guidance on risk stratification and management of portal hypertension and varices in cirrhosis. Hepatology 2024, 79, 1180–1211. [Google Scholar] [CrossRef] [Scilit] [PubMed]
- Farooq, U.; Tarar, Z.I.; Malik, A.; Amin, M.K.; Sifuentes, H. How does cirrhosis impact mortality, morbidity, and resource utilization in non-variceal upper gastrointestinal bleeding? A nationwide analysis. Gastroenterol. Rev. 2023, 18, 204–215. [Google Scholar] [CrossRef] [Scilit] [PubMed]
- de Franchis, R.; Bosch, J.; Garcia-Tsao, G.; Reiberger, T.; Ripoll, C.; Abraldes, J.G.; Albillos, A.; Baiges, A.; Bajaj, J.; Bañares, R.; et al. Baveno VII Faculty. Baveno VII—Renewing consensus in portal hypertension. J. Hepatol. 2022, 76, 959–974. [Google Scholar] [CrossRef] [Scilit] [PubMed]
- Lee, E.W.; Eghtesad, B.; Garcia-Tsao, G.; Haskal, Z.J.; Hernandez-Gea, V.; Jalaeian, H.; Kalva, S.P.; Mohanty, A.; Thabut, D.; Abraldes, J.G. AASLD Practice Guidance on the use of TIPS, variceal embolization, and retrograde transvenous obliteration in the management of variceal hemorrhage. Hepatology 2024, 79, 224–250. [Google Scholar] [CrossRef] [Scilit] [PubMed]
- García-Pagán, J.C.; Caca, K.; Bureau, C.; Laleman, W.; Appenrodt, B.; Luca, A.; Abraldes, J.G.; Nevens, F.; Vinel, J.P.; Mössner, J.; et al. Early use of TIPS in patients with cirrhosis and variceal bleeding. N. Engl. J. Med. 2010, 362, 2370–2379. [Google Scholar] [CrossRef] [Scilit] [PubMed]
- Nagel, M.; Weidner, V.; Schulz, S.; Marquardt, J.U.; Galle, P.R.; Schattenberg, J.M.; Nguyen-Tat, M.; Wörns, M.-A.; Labenz, C. Continued alcohol consumption and hepatic encephalopathy determine quality of life and psychosocial burden of caregivers in patients with liver cirrhosis. Health Qual. Life Outcomes 2022, 20, 23. [Google Scholar] [CrossRef] [Scilit] [PubMed]
- Bajaj, J.S.; Wade, J.B.; Gibson, D.P.; Heuman, D.M.; Thacker, L.R.; Sterling, R.K.; Stravitz, T.R.; Luketic, V.; Fuchs, M.; White, M.B.; et al. The multi-dimensional burden of cirrhosis and hepatic encephalopathy on patients and caregivers. Am. J. Gastroenterol. 2011, 106, 1646–1653. [Google Scholar] [CrossRef] [Scilit] [PubMed]
- Tahira, S.; Ul Hassan, S.S.; Akram, A.; Sher, A.; Ahmed, M.T.; Asif, M.A.; Khalid, A. Disparities in Upper Gastrointestinal Bleeding Associated with Liver Cirrhosis: Epidemiological Trends in the United States (1999 to 2023): A CDC WONDER Analysis. ACG 2025 Annual Scientific Meeting; Abstract P3076. Conference Abstract. Available online: https://acg2025.eventscribe.net/fsPopup.asp?PosterID=755056&mode=posterInfo (accessed on 14 October 2026).
- Merza, N.; Masoud, A.T.; Ahmed, Z.; Dahiya, D.S.; Nawras, A.; Kobeissy, A. Trends of Upper Gastrointestinal Bleeding Mortality in the United States Before and During the COVID-19 Era: Estimates from the Centers for Disease Control WONDER Database. Gastroenterol. Res. 2023, 16, 165–170. [Google Scholar] [CrossRef] [Scilit] [PubMed]
- Centers for Disease Control and Prevention; National Center for Health Statistics. Multiple Cause of Death, 1999–2020. CDC WONDER. Available online: https://wonder.cdc.gov/mcd-icd10.html (accessed on 14 October 2026).
- Centers for Disease Control and Prevention; National Center for Health Statistics. Multiple Cause of Death, 2018–2024, Single Race. CDC WONDER. Available online: https://wonder.cdc.gov/mcd-icd10-expanded.html (accessed on 14 October 2026).
- Rinella, M.E.; Lazarus, J.V.; Ratziu, V.; Francque, S.M.; Sanyal, A.J.; Kanwal, F.; Romero, D.; Abdelmalek, M.F.; Anstee, Q.M.; Arab, J.P.; et al. A multisociety Delphi consensus statement on new fatty liver disease nomenclature. J. Hepatol. 2023, 79, 1542–1556. [Google Scholar] [CrossRef] [PubMed]
- Fay, M.P.; Feuer, E.J. Confidence intervals for directly standardized rates: A method based on the gamma distribution. Stat. Med. 1997, 16, 791–801. Available online: https://wonder.cdc.gov/controller/pdf/FayFeuerConfidenceIntervals.pdf (accessed on 14 October 2026). [CrossRef] [Scilit]
- Anderson, R.N.; Rosenberg, H.M. Age standardization of death rates: Implementation of the year 2000 standard. Natl. Vital Stat. Rep. 1998, 47, 1–16,20. Available online: https://stacks.cdc.gov/view/cdc/232281 (accessed on 3 November 2026). [PubMed]
- National Cancer Institute. Joinpoint Regression Program. Available online: https://surveillance.cancer.gov/joinpoint/ (accessed on 14 October 2026).
- Kim, H.J.; Fay, M.P.; Feuer, E.J.; Midthune, D.N. Permutation tests for joinpoint regression with applications to cancer rates. Stat. Med. 2000, 19, 335–351. [Google Scholar] [CrossRef] [Scilit]
- Clegg, L.X.; Hankey, B.F.; Tiwari, R.; Feuer, E.J.; Edwards, B.K. Estimating average annual per cent change in trend analysis. Stat. Med. 2009, 28, 3670–3682. [Google Scholar] [CrossRef] [Scilit] [PubMed]
- Asrani, S.K.; Larson, J.J.; Yawn, B.; Therneau, T.M.; Kim, W.R. Underestimation of liver-related mortality in the United States. Gastroenterology 2013, 145, 375–382.e1–2. [Google Scholar] [CrossRef] [Scilit] [PubMed]
- Tapper, E.B.; Parikh, N.D. Mortality due to cirrhosis and liver cancer in the United States, 1999–2016: Observational study. BMJ 2018, 362, k2817. [Google Scholar] [CrossRef] [Scilit] [PubMed]
- Kim, D.; Li, A.A.; Perumpail, B.J.; Gadiparthi, C.; Kim, W.; Cholankeril, G.; Glenn, J.S.; Harrison, S.A.; Younossi, Z.M.; Ahmed, A. Changing trends in etiology-based and ethnicity-based annual mortality rates of cirrhosis and hepatocellular carcinoma in the United States. Hepatology 2019, 69, 1064–1074. [Google Scholar] [CrossRef] [Scilit] [PubMed]
- Moon, A.M.; Yang, J.Y.; Barritt, A.S., IV; Bataller, R.; Peery, A.F. Rising Mortality From Alcohol-Associated Liver Disease in the United States in the 21st Century. Am. J. Gastroenterol. 2020, 115, 79–87. [Google Scholar] [CrossRef] [Scilit] [PubMed]
- Kim, D.; Alshuwaykh, O.; Dennis, B.B.; Cholankeril, G.; Ahmed, A. Trends in etiology-based mortality from chronic liver disease before and during COVID-19 pandemic in the United States. Clin. Gastroenterol. Hepatol. 2022, 20, 2307–2316.e3. [Google Scholar] [CrossRef] [Scilit] [PubMed]
- Ha, A.Y.; Le, M.H.; Henry, L.; Yeo, Y.H.; Cheung, R.C.; Nguyen, M.H. County-Level Variation in Cirrhosis-Related Mortality in the US, 1999–2019. JAMA Netw. Open 2022, 5, e2146427. [Google Scholar] [CrossRef] [Scilit] [PubMed]
- Arias, E.; Heron, M.; Hakes, J.K. The Validity of Race and Hispanic-Origin Reporting on Death Certificates in the United States: An Update; Vital and Health Statistics, Number 172; National Center for Health Statistics: Hyattsville, MD, USA, 2016; pp. 1–21. Available online: https://www.cdc.gov/nchs/data/series/sr_02/sr02_172.pdf (accessed on 3 November 2026).
- Jophlin, L.L.; Singal, A.K.; Bataller, R.; Wong, R.J.; Sauer, B.G.; Terrault, N.A.; Shah, V.H. ACG Clinical Guideline: Alcohol-Associated Liver Disease. Am. J. Gastroenterol. 2024, 119, 30–54. [Google Scholar] [CrossRef] [Scilit] [PubMed]
- Lai, J.C.; Tandon, P.; Bernal, W.; Tapper, E.B.; Ekong, U.; Dasarathy, S.; Carey, E.J. Malnutrition, Frailty, and Sarcopenia in Patients With Cirrhosis: 2021 Practice Guidance by the American Association for the Study of Liver Diseases. Hepatology 2021, 74, 1611–1644. [Google Scholar] [CrossRef] [Scilit] [PubMed]
- De Felice, F.; Malerba, S.; Nardone, V.; Salvestrini, V.; Calomino, N.; Testini, M.; Boccardi, V.; Desideri, I.; Gentili, C.; De Luca, R.; et al. Progress and Challenges in Integrating Nutritional Care into Oncology Practice: Results from a National Survey on Behalf of the NutriOnc Research Group. Nutrients 2025, 17, 188. [Google Scholar] [CrossRef] [Scilit] [PubMed]
Disclaimer/Publisher’s Note: The statements, opinions and data contained in all publications are solely those of the individual author(s) and contributor(s) and not of MDPI and/or the editor(s). MDPI and/or the editor(s) disclaim responsibility for any injury to people or property resulting from any ideas, methods, instructions or products referred to in the content. |
© 2026 by the authors. Licensee MDPI, Basel, Switzerland. This article is an open access article distributed under the terms and conditions of the Creative Commons Attribution (CC BY) license.