


Abstract
News and reports frequently drive future trends, yet traditional Time Series Forecasting often fails to capture these external influences. To integrate textual insights, we introduce Text-Time Cross-Modal Attention (TTCA), a multimodal framework that fuses numerical embeddings with text embeddings extracted from a pre-trained language model. TTCA employs a cross-attention mechanism that treats time series features as queries and textual features as keys and values. This architecture ensures that semantic context enhances, rather than overshadows, underlying temporal dynamics. Extensive evaluations on the Time-MMD dataset across nine real-world domains demonstrate that TTCA consistently outperforms state-of-the-art unimodal baselines, achieving average improvements of 3.29% in MSE and 9.66% in MAE. Furthermore, TTCA shows moderate performance gains over recent multimodal approaches, particularly in event-driven scenarios.
1. Introduction
Unimodal time series analysis [1,2,3,4,5,6,7] relies exclusively on numerical sequences, often resulting in incomplete representations that overlook the external events driving temporal behavior. In contrast, Multimodal Time Series (MMTS) models offer a more holistic perspective by fusing diverse modalities. This integration enables the capture of subtle cross-modal dependencies [8,9], enhances robustness to noise, and facilitates more explainable outcomes [10,11,12,13,14,15]. Therefore, MMTS is better suited for real-world forecasting where numerical trends require contextualization, such as in healthcare monitoring [16,17,18] and finance [19,20,21,22].
However, MMTS poses unique challenges that do not exist in unimodal time series [23,24]. A primary challenge is the difficulty in cross-sequence alignment between numerical sequences and textual context [21,25]. While numerical data provides fine-grained temporal details, it often lacks the high-level semantic context needed to explain sudden shocks; conversely, textual data provides reasoning but lacks the precise temporal alignment required for forecasting [26]. Current frameworks, such as Time-LLM [14] and TEMPO [27], often utilize “Prompt-as-Prefix” or simple decomposition strategies, but these can oversimplify the relationship as a one-way instruction rather than a dynamic interaction [14,28].
We motivate a cross-attention mechanism from time to text to address this alignment gap [14,29]. By allowing the learned temporal features to “attend” to the textual embeddings, the model can dynamically identify which specific events or news are most relevant to observed fluctuations in the numerical data. This addresses the limitation identified in TimeCMA [29], where existing solutions struggle to learn disentangled and robust embeddings that truly integrate both worlds. Furthermore, Pretrained Language Model (PLM) may not inherently represent sequential dependencies better than specialized layers; a targeted cross-attention mechanism ensures the model explicitly learns the dependency between temporal triggers and their corresponding textual explanations [13].
The second challenge lies in the nature of textual data itself. Existing single-prompt frameworks often struggle to capture the semantics of time-stamped text and may introduce redundant information that can hinder model performance [25]. When multiple news or events are fed into a model as a single block, salient information can be diluted by noise. To mitigate this, we propose processing each snippet of text with a Text Encoder separately, followed by a pooling mechanism. This approach is motivated by the need for semantically useful tokenized inputs, a concept emphasized by LPTM to handle heterogeneous data across domains [30]. By encoding snippets individually, the model acts as a contextualizer—similar to the agent-based approach in TimeCAP—ensuring that discrete events are captured as distinct semantic units before being aggregated [9]. Subsequent pooling allows for the creation of a refined, unified text embedding while reducing the computational overhead and information redundancy typical of long-text prompting. This structured processing ensures that the PLM provides the robust prompt embeddings necessary to guide the time series toward more accurate, explainable forecasts.
To summarize, we propose Text-Time Cross-Modal Attention, a multimodal framework that fuses time series with auxiliary textual information for forecasting tasks. Our contributions are as follows:
- We utilize a Cross-Modal Attention mechanism to effectively fuse time series with auxiliary textual information.
- For text processing, we propose a grouped text encoding mechanism that takes temporal alignment into account to avoid information redundancy.
- We evaluate the proposed method on the Time-MMD dataset to demonstrate that it outperforms five unimodal baselines and achieves competitive results with two multimodal baselines, TaTS and TSFlib.
2. Related Work
2.1. State-of-the-Art Unimodal Time Series
Time Series Forecasting (TSF) has evolved significantly, transitioning from traditional statistical methods to deep learning approaches. Early deep learning models, such as RNNs and TCNs [1,2,3], demonstrated superior capability in capturing non-linear temporal dependencies compared to statistical counterparts. However, the advent of the Transformer architecture marked a paradigm shift [31]. Models like Informer [4] and Autoformer [5] introduced efficient attention mechanisms and decomposition strategies to address the long-term dependency challenge and computational complexity. More recently, the focus has shifted towards refining how Transformers process time series. PatchTST [7] proposed a patch-based approach with channel independence, significantly enhancing local semantic capture. Building on this, iTransformer [6] inverted the typical attention mechanism to embed entire time series as tokens, effectively capturing multivariate correlations. Additionally, Crossformer [32] utilized a two-stage attention mechanism to explicitly model cross-dimension and cross-time dependencies. These unimodal models still represent the state-of-the-art, focusing on optimizing the representation of numerical sequences to maximize forecasting accuracy.
2.2. Recent Advances in Multimodal Time Series
The integration of Large Language Model (LLM) into TSF has evolved through four distinct paradigms. Early efforts focused on bridging the data sparsity gap by treating numerical sequences as a language. Chronos [33,34] pioneered this by quantizing time series into fixed vocabularies for zero-shot generalization [35], while LPTM [30] introduced adaptive segmentation to handle cross-domain heterogeneity during pre-training. To align these modalities without extensive retraining, researchers developed reprogramming and prompting frameworks. Time-LLM [14] and TEMPO [27] utilize frozen backbones with “Prompt-as-Prefix” or distribution-adaptation strategies, while LSTPrompt [28] integrates Chain-of-Thought (CoT) task decomposition to move beyond simple next-token prediction.
Shifting toward external signals, recent work addresses the difficulty of incorporating multimodal data like news or knowledge graphs. DP-GPT4MTS [25] leveraged dual-prompt mechanisms to capture timestamped semantics [21], while TimeCAP [9] redefines the PLM as a “contextualizer” that summarizes information rather than acting as a direct predictor. Meanwhile, TimeCMA [29] ensures efficient inference by aligning disentangled time series embeddings with robust prompt embeddings. To capture both semantic context and fine-grained patterns, Time-VLM [26] encodes sequences as images for Vision-Language Models. Bridging the topic of AI agents with time series analysis, Zhao et al. introduced Time Series Scientist [36], which comprises four specialized agents, one of which is the Forecaster.
Despite these advancements, the utility of LLMs in forecasting remains contested. Tan et al. [13] demonstrate that basic attention layers often outperform computationally expensive LLMs, arguing that pre-trained models do not inherently represent sequential dependencies better than specialized architectures. This highlights the need for scenarios where the computational expense of multimodal alignment yields statistically significant benefits over lightweight, specialized attention mechanisms.
3. Methodology
In this section, we formally define MMTS and our Text-Time Cross-Modal Attention. Our framework integrates numerical time series with external textual information through a Cross-Modal Fusion (CMF) to enhance forecasting accuracy.
3.1. Problem Definition
Let denote a sequence of numerical time series data of length T, where represents the univariate feature at time step t. Correspondingly, let denote the sequence of associated textual data (e.g., news headlines, reports) that do not necessarily align in time with the numerical data. Unlike traditional unimodal approaches that rely solely on , MMTS leverages the semantic context from to capture external factors influencing temporal dynamics. The goal of MMTS forecasting is to predict the future values of the time series for a forecast horizon H, given the historical multimodal inputs:
where is the mapping function parameterized by . The goal of this paper is to build a fusion architecture for and find the optimal parameters that minimize the forecasting error:
where is the loss function. In this paper, we use the Mean Squared Error (MSE) as the loss function.
3.2. Architecture
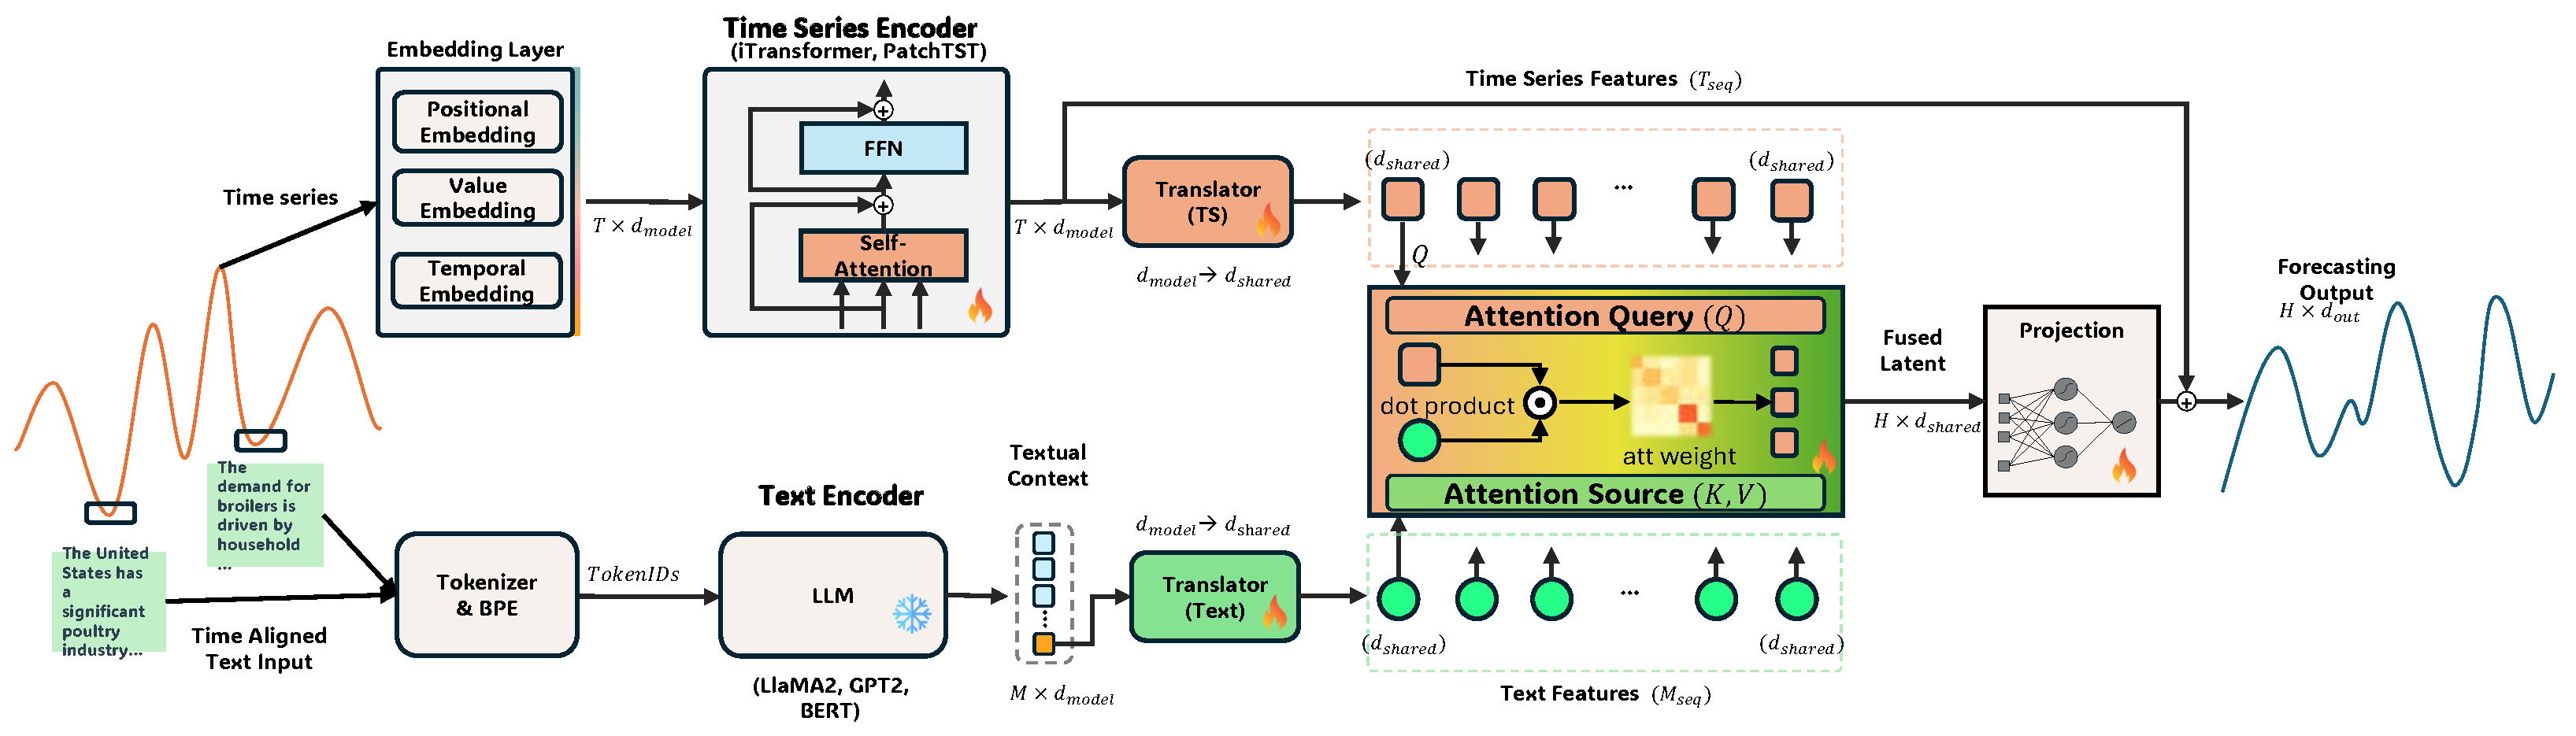
Our TTCA architecture (Figure 1) consists of three main components: a Time Series Encoder (Section 3.2.1), a Text Encoder (Section 3.2.2), and a Cross-Modal Fusion layer (Section 3.2.3).
Figure 1.
TTCA architecture. Numerical time series input is fed into the Time Series Encoder; similarly, textual input is fed into the Text Encoder. Both time series embeddings and text embeddings are fused through cross-attention after being projected into the same latent space with Translator. A skip connection is added to the Time Series Encoder before the final projection. The trained module is marked with a fire mark, while the frozen module is marked with a snowflake mark.
3.2.1. Time Series Encoder
The input series is first projected into a latent embedding space via three embedding layers: value embedding, positional embedding, and temporal embedding. The value embedding is obtained using a 1D convolution to capture local patterns [4]:
Padding ensures sequence length preservation. Positional embeddings and temporal embeddings follow the sinusoidal formulations [37]. The time series input embedding is calculated as
Next, we employ a Transformer-based encoder as the backbone. Unlike vanilla Transformer models designed for end-to-end forecasting, TTCA employs only the encoder blocks to generate time embeddings [6,7] because we only need to capture the temporal dependencies in the numerical data, not to forecast the future values of the time series at this stage.
where represents the encoded time series features.
To prepare time series features for Cross-Modal Fusion, we use a translator layer to compress feature vectors, emphasizing salient elements such as trends or anomalies [29]. This layer maps time series features to a shared latent space, ensuring dimensional and semantic alignment across modalities. For efficiency, we use an Multilayer Perceptron (MLP) with non-linear activation:
where , , are biases, is ReLU activation, is an intermediate dimension, and matches text embedding sizes.
3.2.2. Text Encoder
We process the text input at the temporal level rather than a whole paragraph, an improvement over prior concatenation-based approaches like MM-TSFlib [12]. Such methods risk exceeding PLM context limits (e.g., 1024 tokens for GPT-2), leading to truncation and information loss, and introducing noise from unrelated texts [14,33]. For this purpose, we first group the textual data into discrete snippets based on temporal alignment with the time series. Each snippet corresponds to a specific time window and is processed independently.
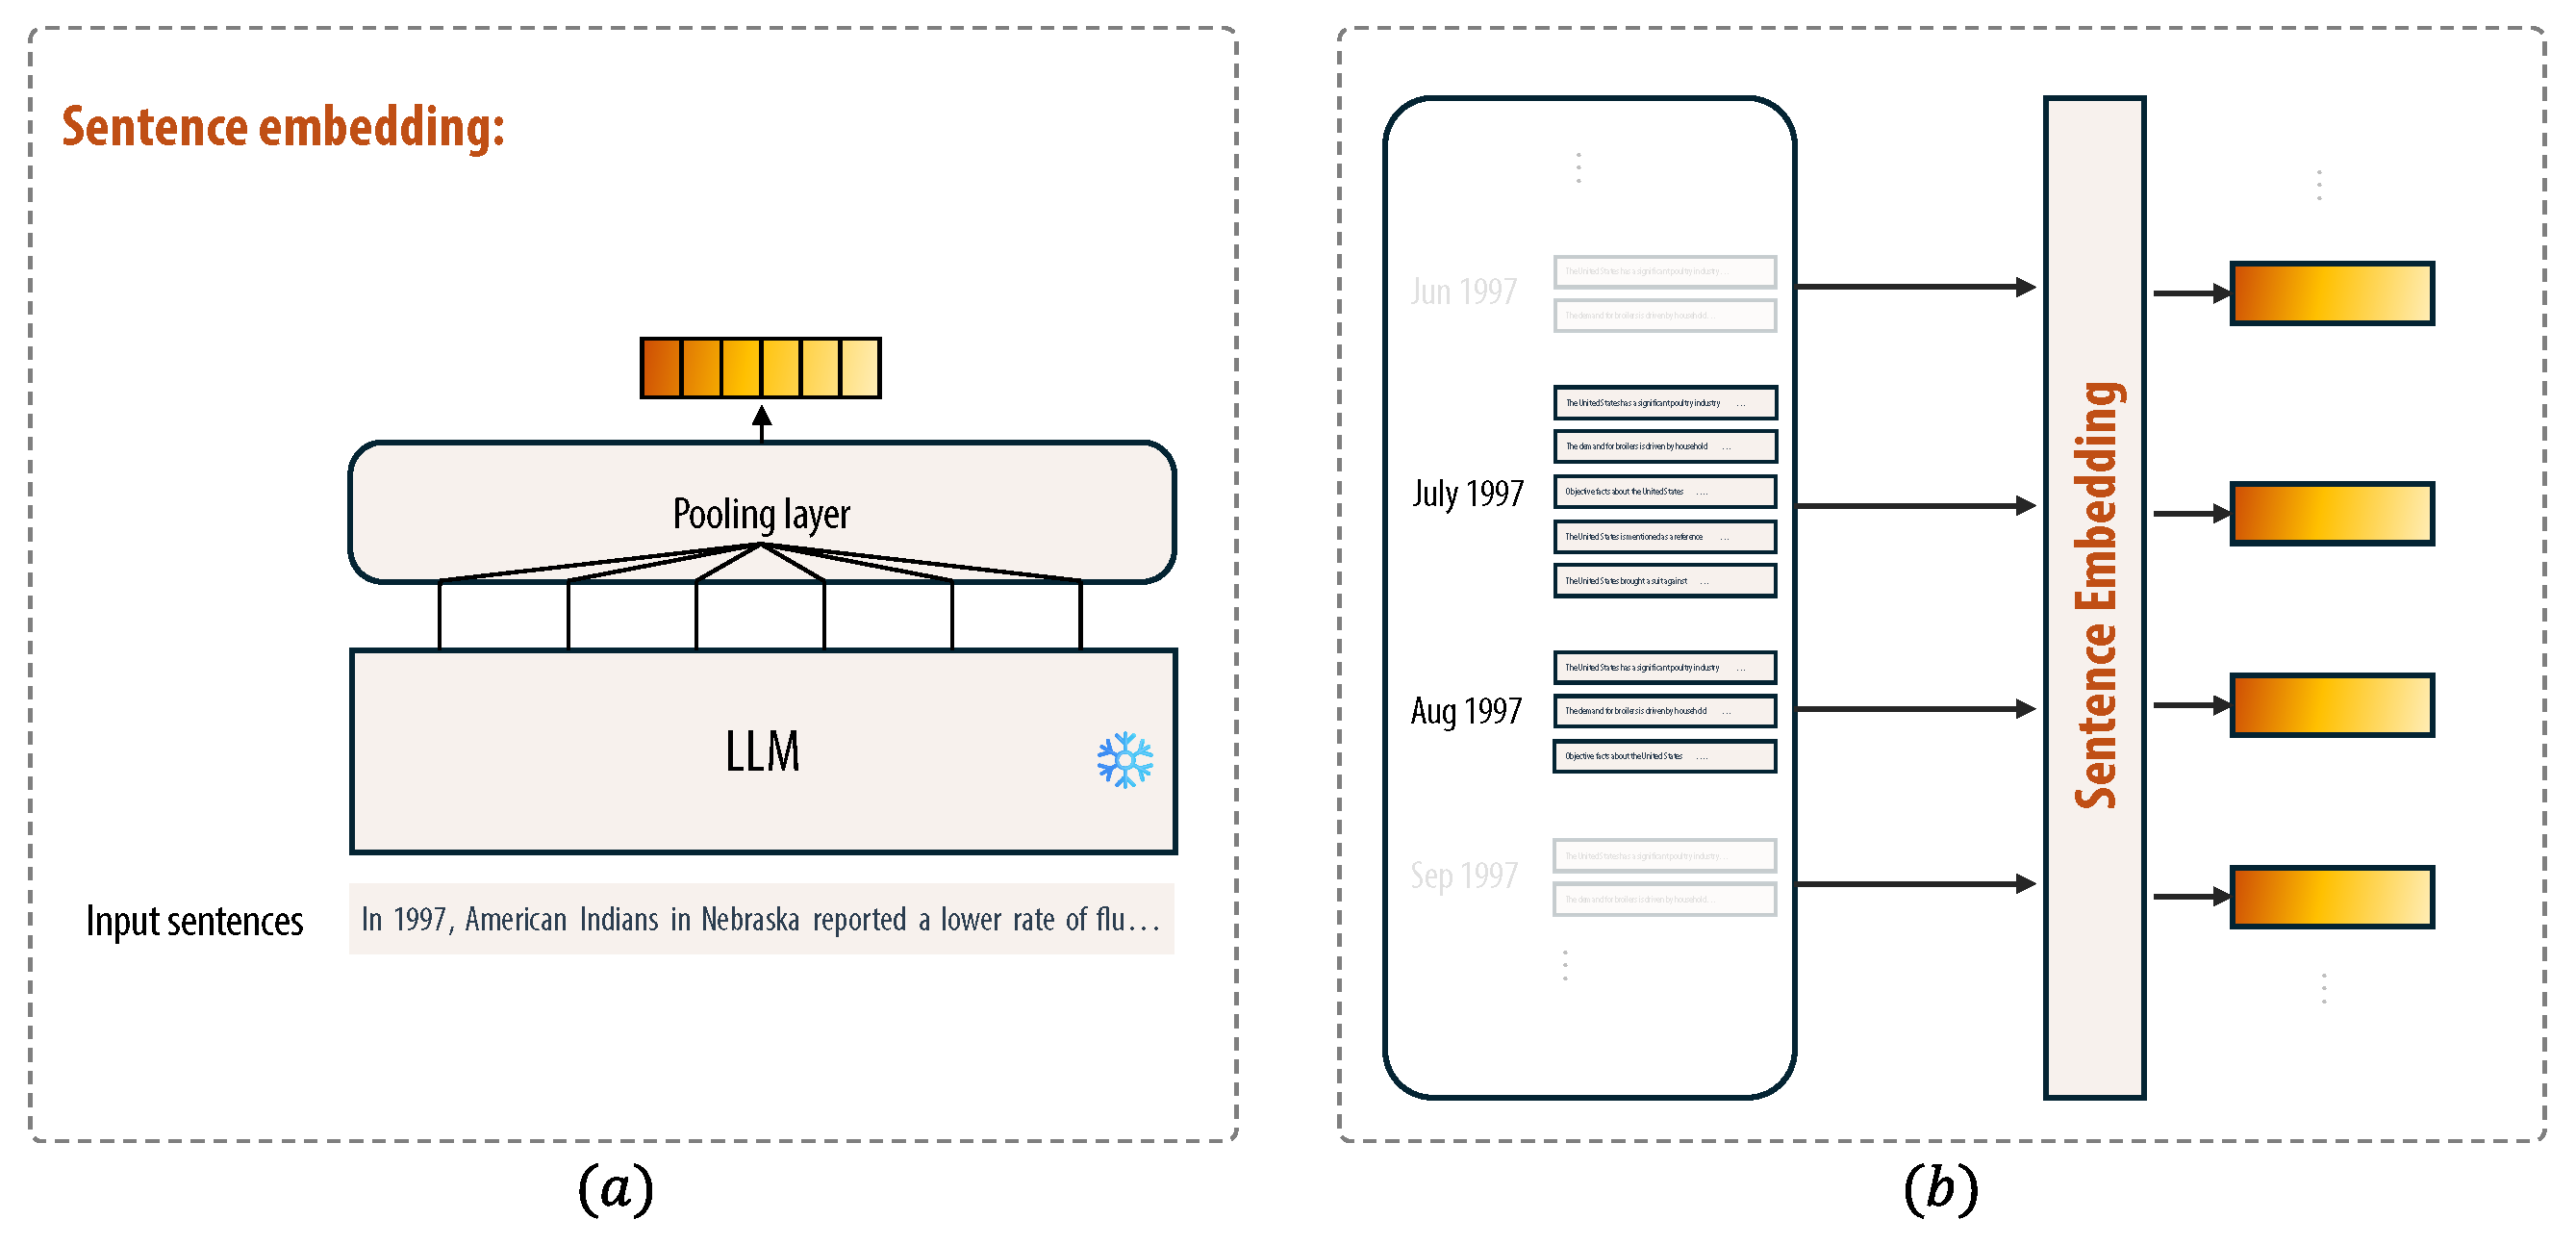
As shown in Figure 2, each text input (one snippet) is individually tokenized and passed through the PLM to obtain a dense vector representation,
where t is the index of the text snippet in the input , and L is the context length defined by the language model. A linear projection Proj is applied to map to to ensure dimension compatibility for fusion.
Figure 2.
The textual processing pipeline in TTCA: (a) Sentence-level embedding (b) Tokenization, a pretrained language model, and pooling for temporal-level embeddings.
Inspired by efficient summarization in TimeCMA [29] and Sentence-BERT [38], we reduce downstream computational overhead by aggregating these token embeddings into a fixed-length embedding via pooling. Specifically, we employ mean pooling to average the token embeddings across the sequence:
where is the embedding of the j-th token in the t-th snippet, and L is the number of tokens. This method captures average semantic content effectively, and fits well in our design where we need sequence-level representations. For models with a [CLS] token, the [CLS] embedding can alternatively serve as a pooled summary. If multiple snippets exist per timestep, their embeddings are further aggregated (e.g., via another mean pool) to form a temporal vector. The resulting textual embeddings are then passed to a translator layer, similar to the time series branch:
mapping them to the shared latent space for fusion.
3.2.3. Cross-Modal Fusion
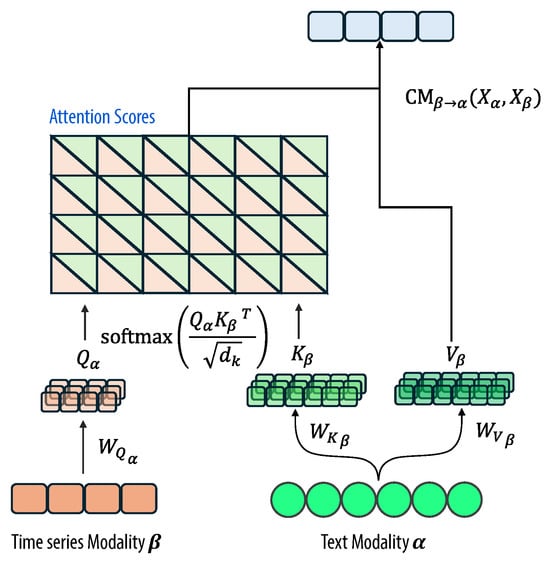
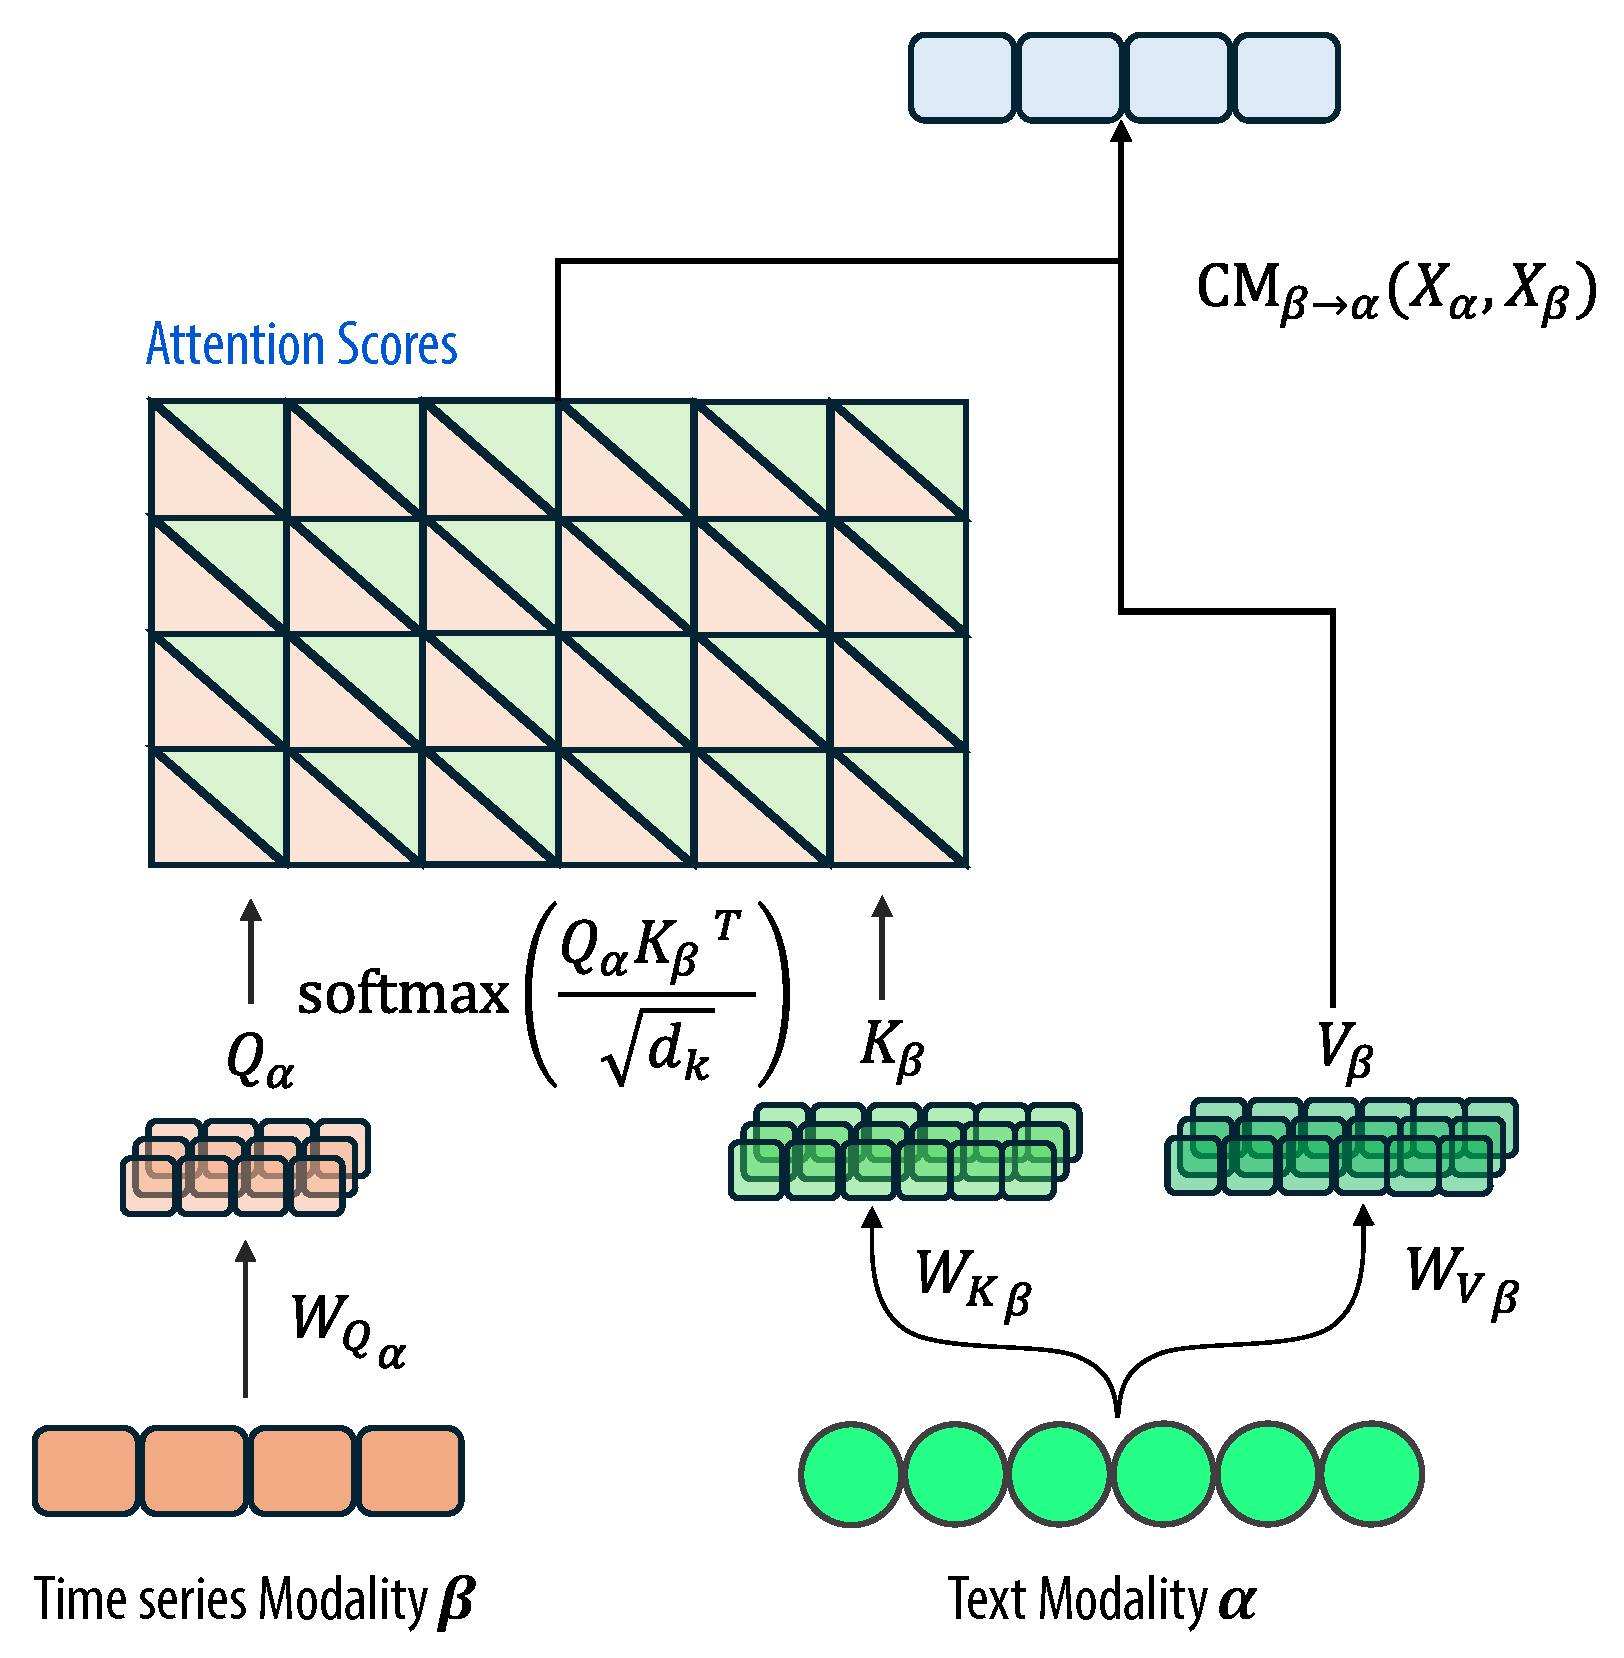
To integrate textual features into numerical features , the fusion module employs a directed Cross-Modal Attention mechanism, denoted by CMF (Time → Text) in Figure 3. The CMF module is implemented as a multi-head cross-attention mechanism [37], where the time series features serve as the Query (), and the textual features serve as the Key () and Value ():
This design allows the model to dynamically attend to relevant textual information that explains or precedes changes in the numerical trends. The output of the cross-attention layer is a fused representation that incorporates both temporal dynamics and semantic context.
Figure 3.
Illustration of the CMF module in TTCA by applying cross-attention between the time series () and textual features ().
Our approach is different from prior fusion strategies in MMTS, such as the additive combination in MM-TSFlib [12] that aggregates unimodal forecasting outputs by merging scalar predictions with textual narratives in a manner that overlooks latent dimensional synergies and misalignment. Likewise, TextFusionHTS [39] applies cross-attention with queries from text and keys/values from time series, which may inadvertently emphasize textual dominance at the expense of temporal information, leading to diluted focus on the core forecasting objective. In contrast, TTCA’s CMF prioritizes the time series modality by deriving queries from time series, while sourcing keys and values from text. This aligns with a principle in multimodal integration, where the primary modality queries auxiliary sources to incorporate contextual enhancements without overshadowing the forecasting objective.
3.3. Time Series Forecasting Layer
To preserve and enrich the original time series information with textual context, we add a residual connection from the translated time series features into the fused output:
where is the fusion weight, which is added to the time series branch before the final projection layer. This residual pathway ensures the primary temporal signals are retained while being augmented by auxiliary textual insights, mitigating information loss and enhancing prediction stability. In multimodal settings, such connections have been shown to enrich the dominant modality [10,12,29,40].
Following the residual connection, an MLP serves as the prediction head to map the enriched representations to the forecasted horizon . The MLP is employed to learn nonlinear mappings from the fused features to scalar outputs for regression tasks:
where , , are biases, and denotes ReLU activation. The model is trained end-to-end by minimizing the MSE between the predicted and ground truth values.
4. Experiments
We evaluate the TTCA framework through extensive experiments on the Time-MMD dataset [12] for the TSF task. The main comparison is with five state-of-the-art unimodal models and two popular multimodal models (Section 4.2). Ablation studies are also provided in Section 4.3. Reproducible code is available at https://github.com/synapsespectrum/TTCA, accessed on 15 March 2026.
4.1. Settings
Dataset: Time-MMD dataset (Table 1) encompasses MMTS data across nine distinct domains: agriculture, climate, economy, environment, health, social good, traffic, energy, and finance. We select this dataset due to its comprehensive coverage of real-world scenarios where textual exogenous factors play a critical role in influencing numerical time series patterns. For example, in domains like climate and environment, textual data such as weather reports or policy announcements can capture event-based anomalies (e.g., extreme weather events or regulatory changes) that are not evident in numerical data alone, thereby enabling a fair assessment of multimodal fusion benefits.
Table 1.
Time-MMD dataset.
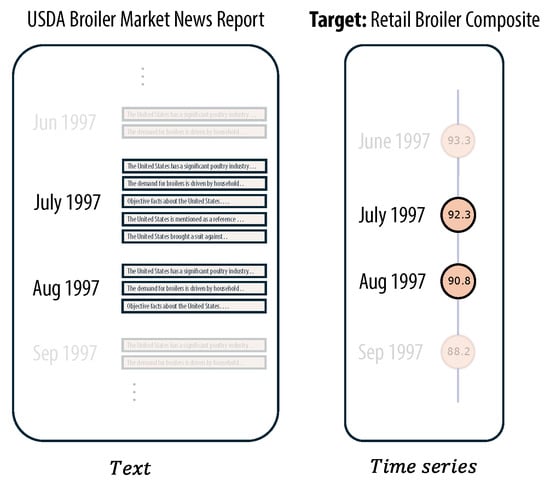
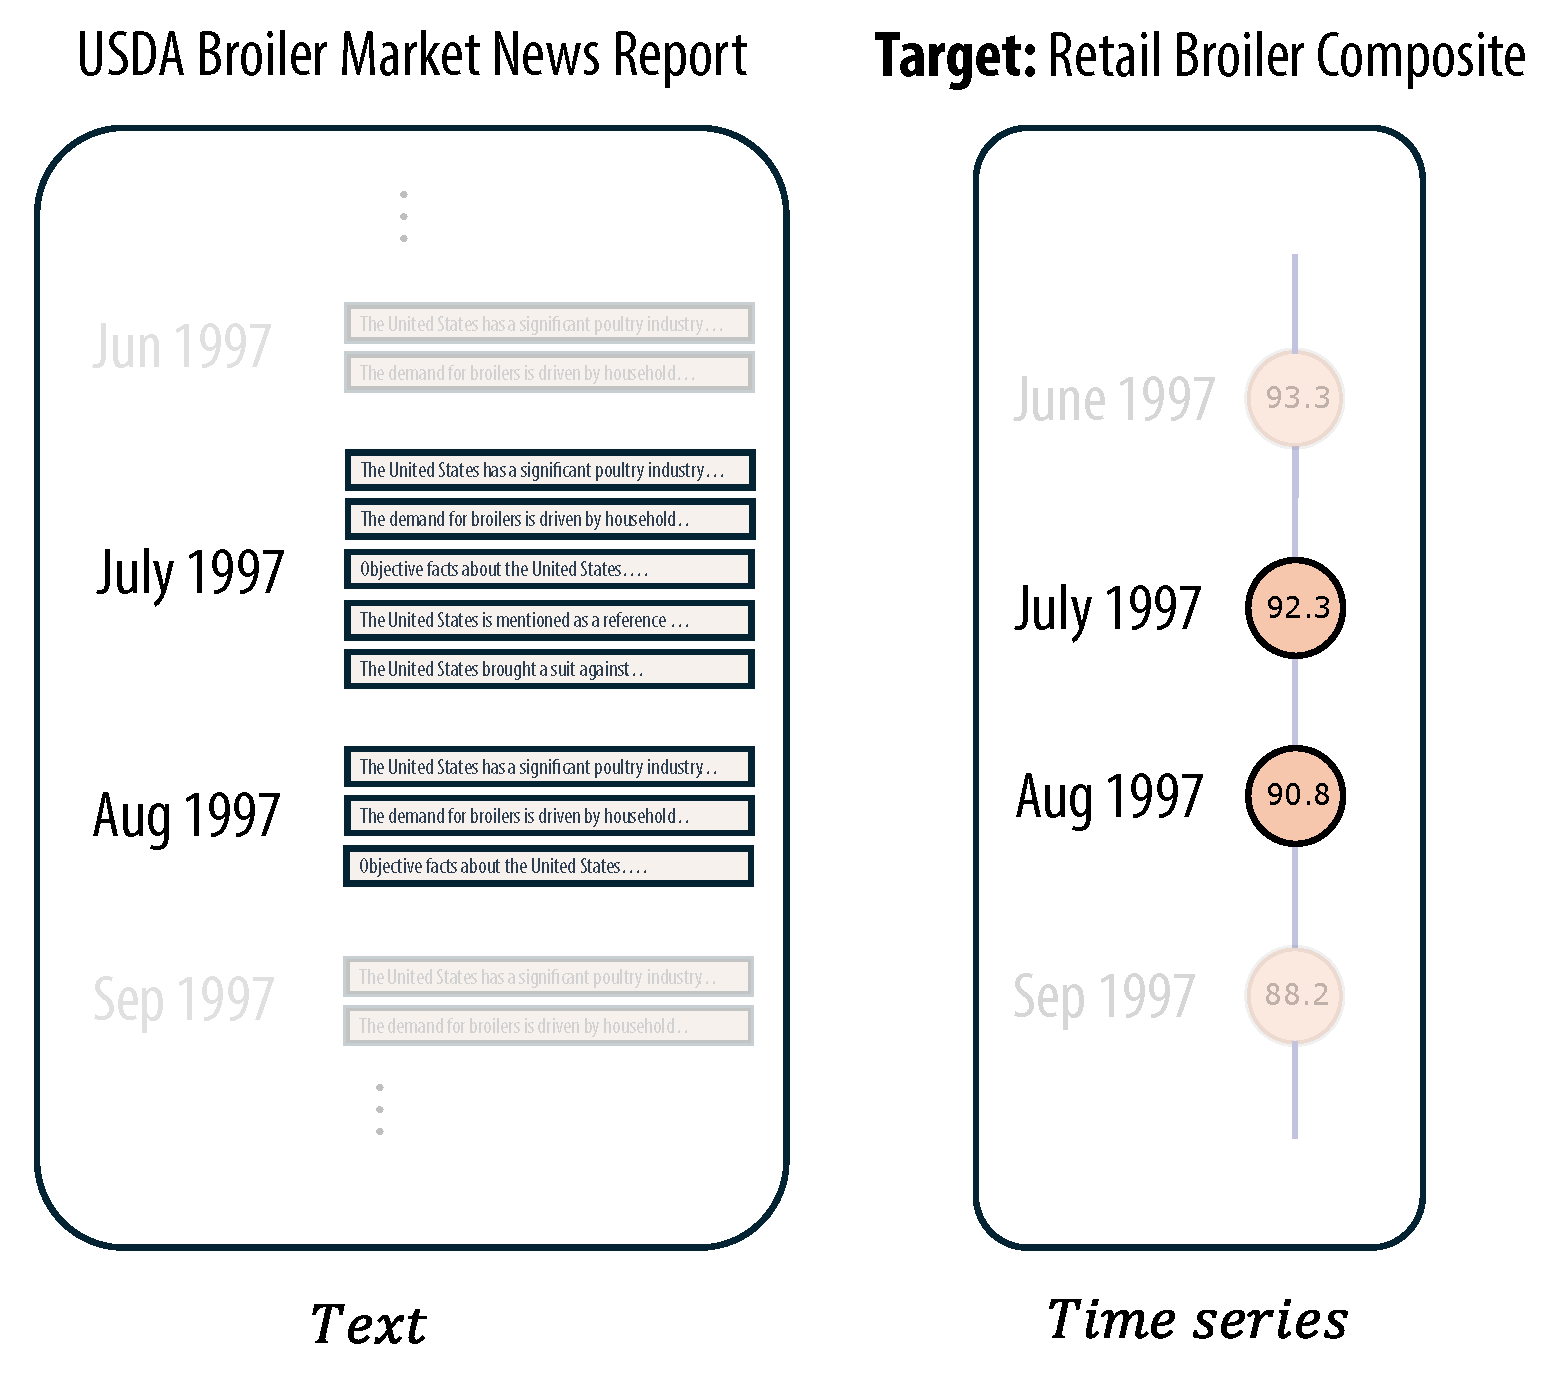
Preprocessing: The Time-MMD dataset aligns text with time series using a mechanism called binary timestamps, which mark the start and end dates as a universal temporal alignment method. For example, the text “The drought level in the agriculture domain was high from January 2023 to March 2023” is aligned with the time series data from January 2023 to March 2023. We further clean the textual data by removing sentences that do not align with the start and end dates. For non-existing textual information timestamps, we augment the data with “No relevant information” to indicate the absence of textual information. As shown in Figure 4 for the agriculture domain, this alignment associates crop yield time series with textual descriptions of seasonal events or market reports. We also perform domain-specific normalization to handle scale differences, and each dataset is split into training (70%), validation (15%), and testing (15%).
Figure 4.
Example of temporal alignment between numerical and textual data in the agriculture domain.
Configurations: We use a high-performance computing environment with NVIDIA A100 GPUs (80 GB VRAM) to handle large-scale multimodal data. All experiments are implemented by PyTorch 2.9 with Hugging Face Transformers for PLM integration and custom modules for TTCA. Table 2 lists key hyperparameters for TTCA to ensure reproducibility and optimal performance. Additionally, look-back window lengths and prediction horizons are configured based on data frequency, as detailed in Table 3.
Table 2.
Hyperparameter configurations.
Table 3.
Forecasting setup configurations.
4.2. Main Results
All models are trained from scratch with a fixed random seed; however, we only utilize the PLM for text encoding and do not fine-tune it. Evaluation metrics MSE and Mean Absolute Error (MAE) are chosen for their sensitivity to forecasting deviations in continuous-valued time series. The evaluations are aggregated over prediction horizons and domains, with lower values indicating better performance. All baselines are implemented using official repositories when available, with adaptations to ensure compatibility with the Time-MMD dataset’s multimodal structure. For unimodal baselines, textual data are ignored during evaluation.
4.2.1. Comparison with Unimodal Models
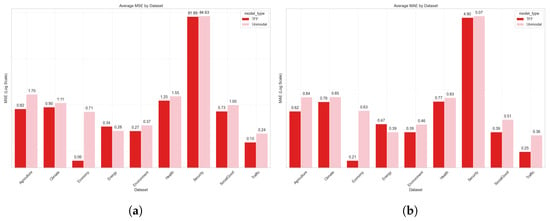
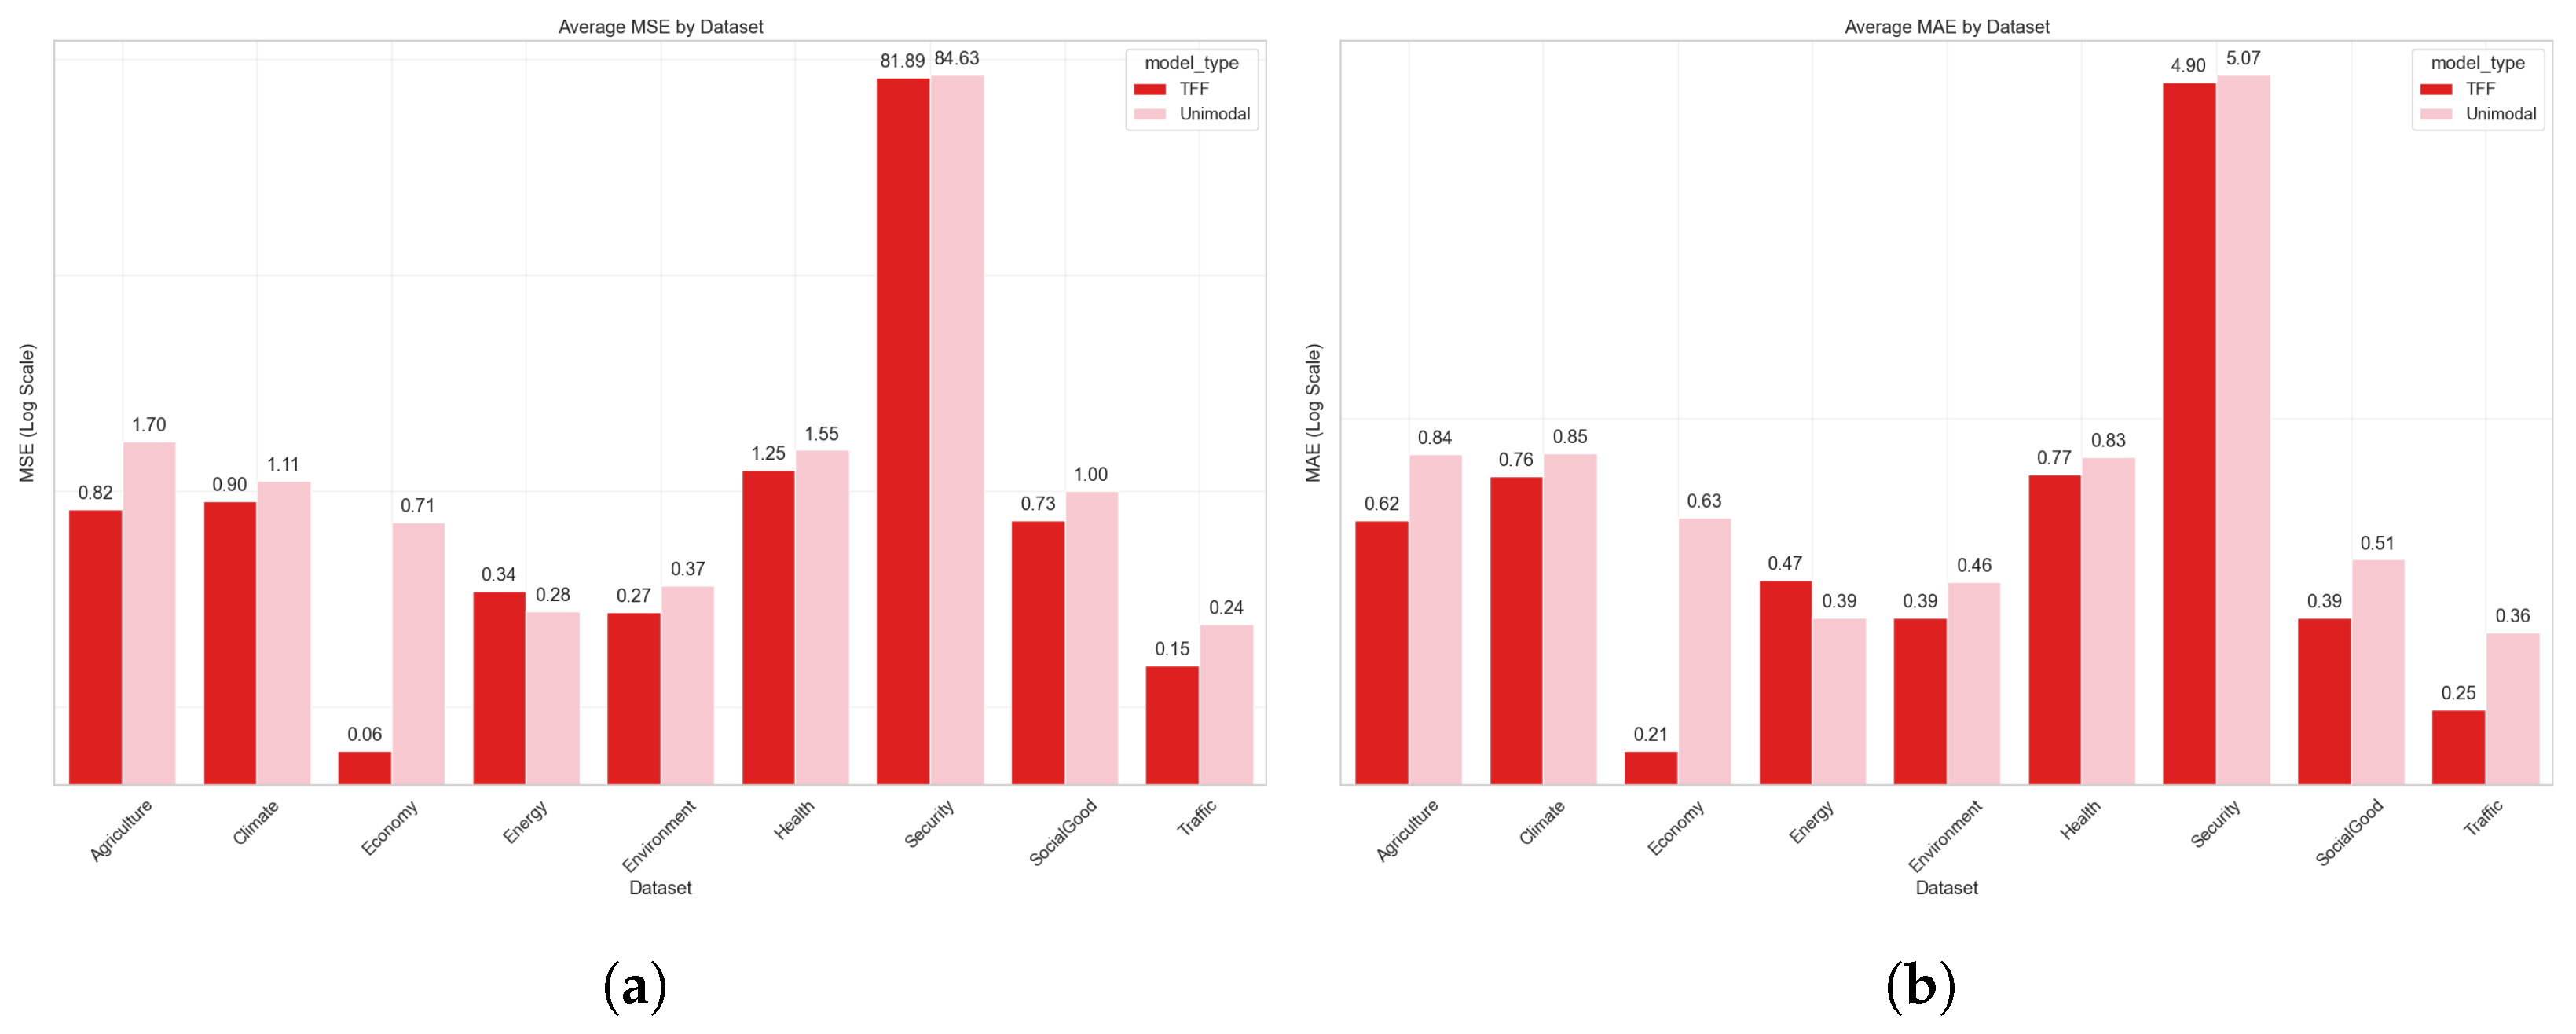
We benchmark the TTCA against 5 well-established unimodal deep learning models: iTransformer [6], PatchTST [7], Crossformer [32], Autoformer [5], and Informer [4]. Note that these baselines process solely numerical time series data, while TTCA fuses textual with numerical data. Detailed results are shown in Table 4, while Figure 5 illustrates the average MAE and MSE per dataset. To further highlight TTCA’s competitive positioning, Table 5 provides a performance leaderboard, comparing TTCA’s MSE and MAE per domain against the best-performing unimodal baseline in that domain, along with TTCA’s ranking.
Table 4.
Comparison between TTCA and unimodal baselines on the Time-MMD dataset.
Figure 5.
Average MSE and MAE comparisons between TTCA and unimodal models across domains (logarithmic scale is applied for better visualization). (a) Average MSE comparisons, (b) Average MAE comparisons.
Table 5.
Performance leaderboard: TTCA vs. best baseline models (from 1 to 6, where 1 indicates the lowest error among TTCA and the five baselines).
Briefly, TTCA attains an average MSE of 9.618 and MAE of 0.973 across all domains and horizons, compared to the unimodal baselines’ averages of 9.945 (MSE) and 1.077 (MAE), leading to enhancements of 3.29% in MSE and 9.66% in MAE. As summarized in Table 5, TTCA secures an average ranking of 2.1/6 for MSE and 2.4/6 for MAE, indicating that it consistently places in the top tier among the 6 models. This ranking underscores TTCA’s robustness and competitive edge, particularly as a multimodal approach that outperforms the best unimodal model in five out of nine domains for both metrics.
The improvements are particularly salient in domains characterized by event-driven dynamics, as depicted in Figure 5. For example, in the Economy domain, TTCA achieves an average MSE of 0.063 and MAE of 0.208, resulting in reductions of 51.88% in MSE and 46.77% in MAE relative to the best unimodal baseline (iTransformer), securing a rank of 3/6 for both metrics. Comparable results emerge on Traffic (average MSE: 0.155, MAE: 0.252; improvements: 25.84% MSE, 4.87% MAE over the best baseline, PatchTST; rank: 1/6 for both), Social Good (MSE: 0.729, MAE: 0.390; improvements: 6.34% MSE, 9.72% MAE over Crossformer; rank: 1/6 for both), and Climate (MSE: 0.901, MAE: 0.760; improvements: 11.00% MSE, 5.47% MAE over Crossformer; rank: 1/6 for both). Otherwise, intermediate gains are observed on Environment (24.64% MSE, 15.02% MAE improvement over the best baseline; rank: 1/6 MSE, 2/6 MAE), Health (8.95% MSE, 0.17% MAE improvement; rank: 1/6 MSE, 2/6 MAE), and Agriculture (199.35% MSE, 74.58% MAE improvement over iTransformer). These results affirm TTCA’s ability to frequently outperform even the strongest unimodal competitors, validating the proposed framework’s contribution to multimodal forecasting.
Nevertheless, TTCA exhibits performance challenges in certain domains, notably Energy and Security. On Energy, the framework’s averages (MSE: 0.342, MAE: 0.465) reflect degradations of 39.75% in MSE and 30.81% in MAE compared to the best unimodal benchmark (iTransformer), yielding a rank of 6/6 for both metrics. This may arise from the inherently cyclical and pattern-dominant nature of energy consumption data, where textual inputs—like policy overviews or consumption advisories—potentially introduce extraneous noise or temporal misalignments during fusion, without yielding commensurate predictive advantages. Similarly, on Security (MSE: 81.886, MAE: 4.902), TTCA shows degradations (11.88% MSE, 16.31% MAE over PatchTST; rank: 4/6 for both), possibly due to the domain’s volatility.
4.2.2. Comparison with Multimodal Models
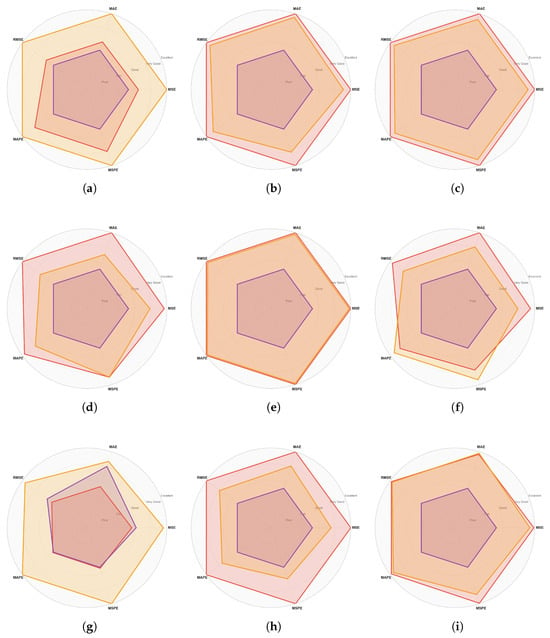
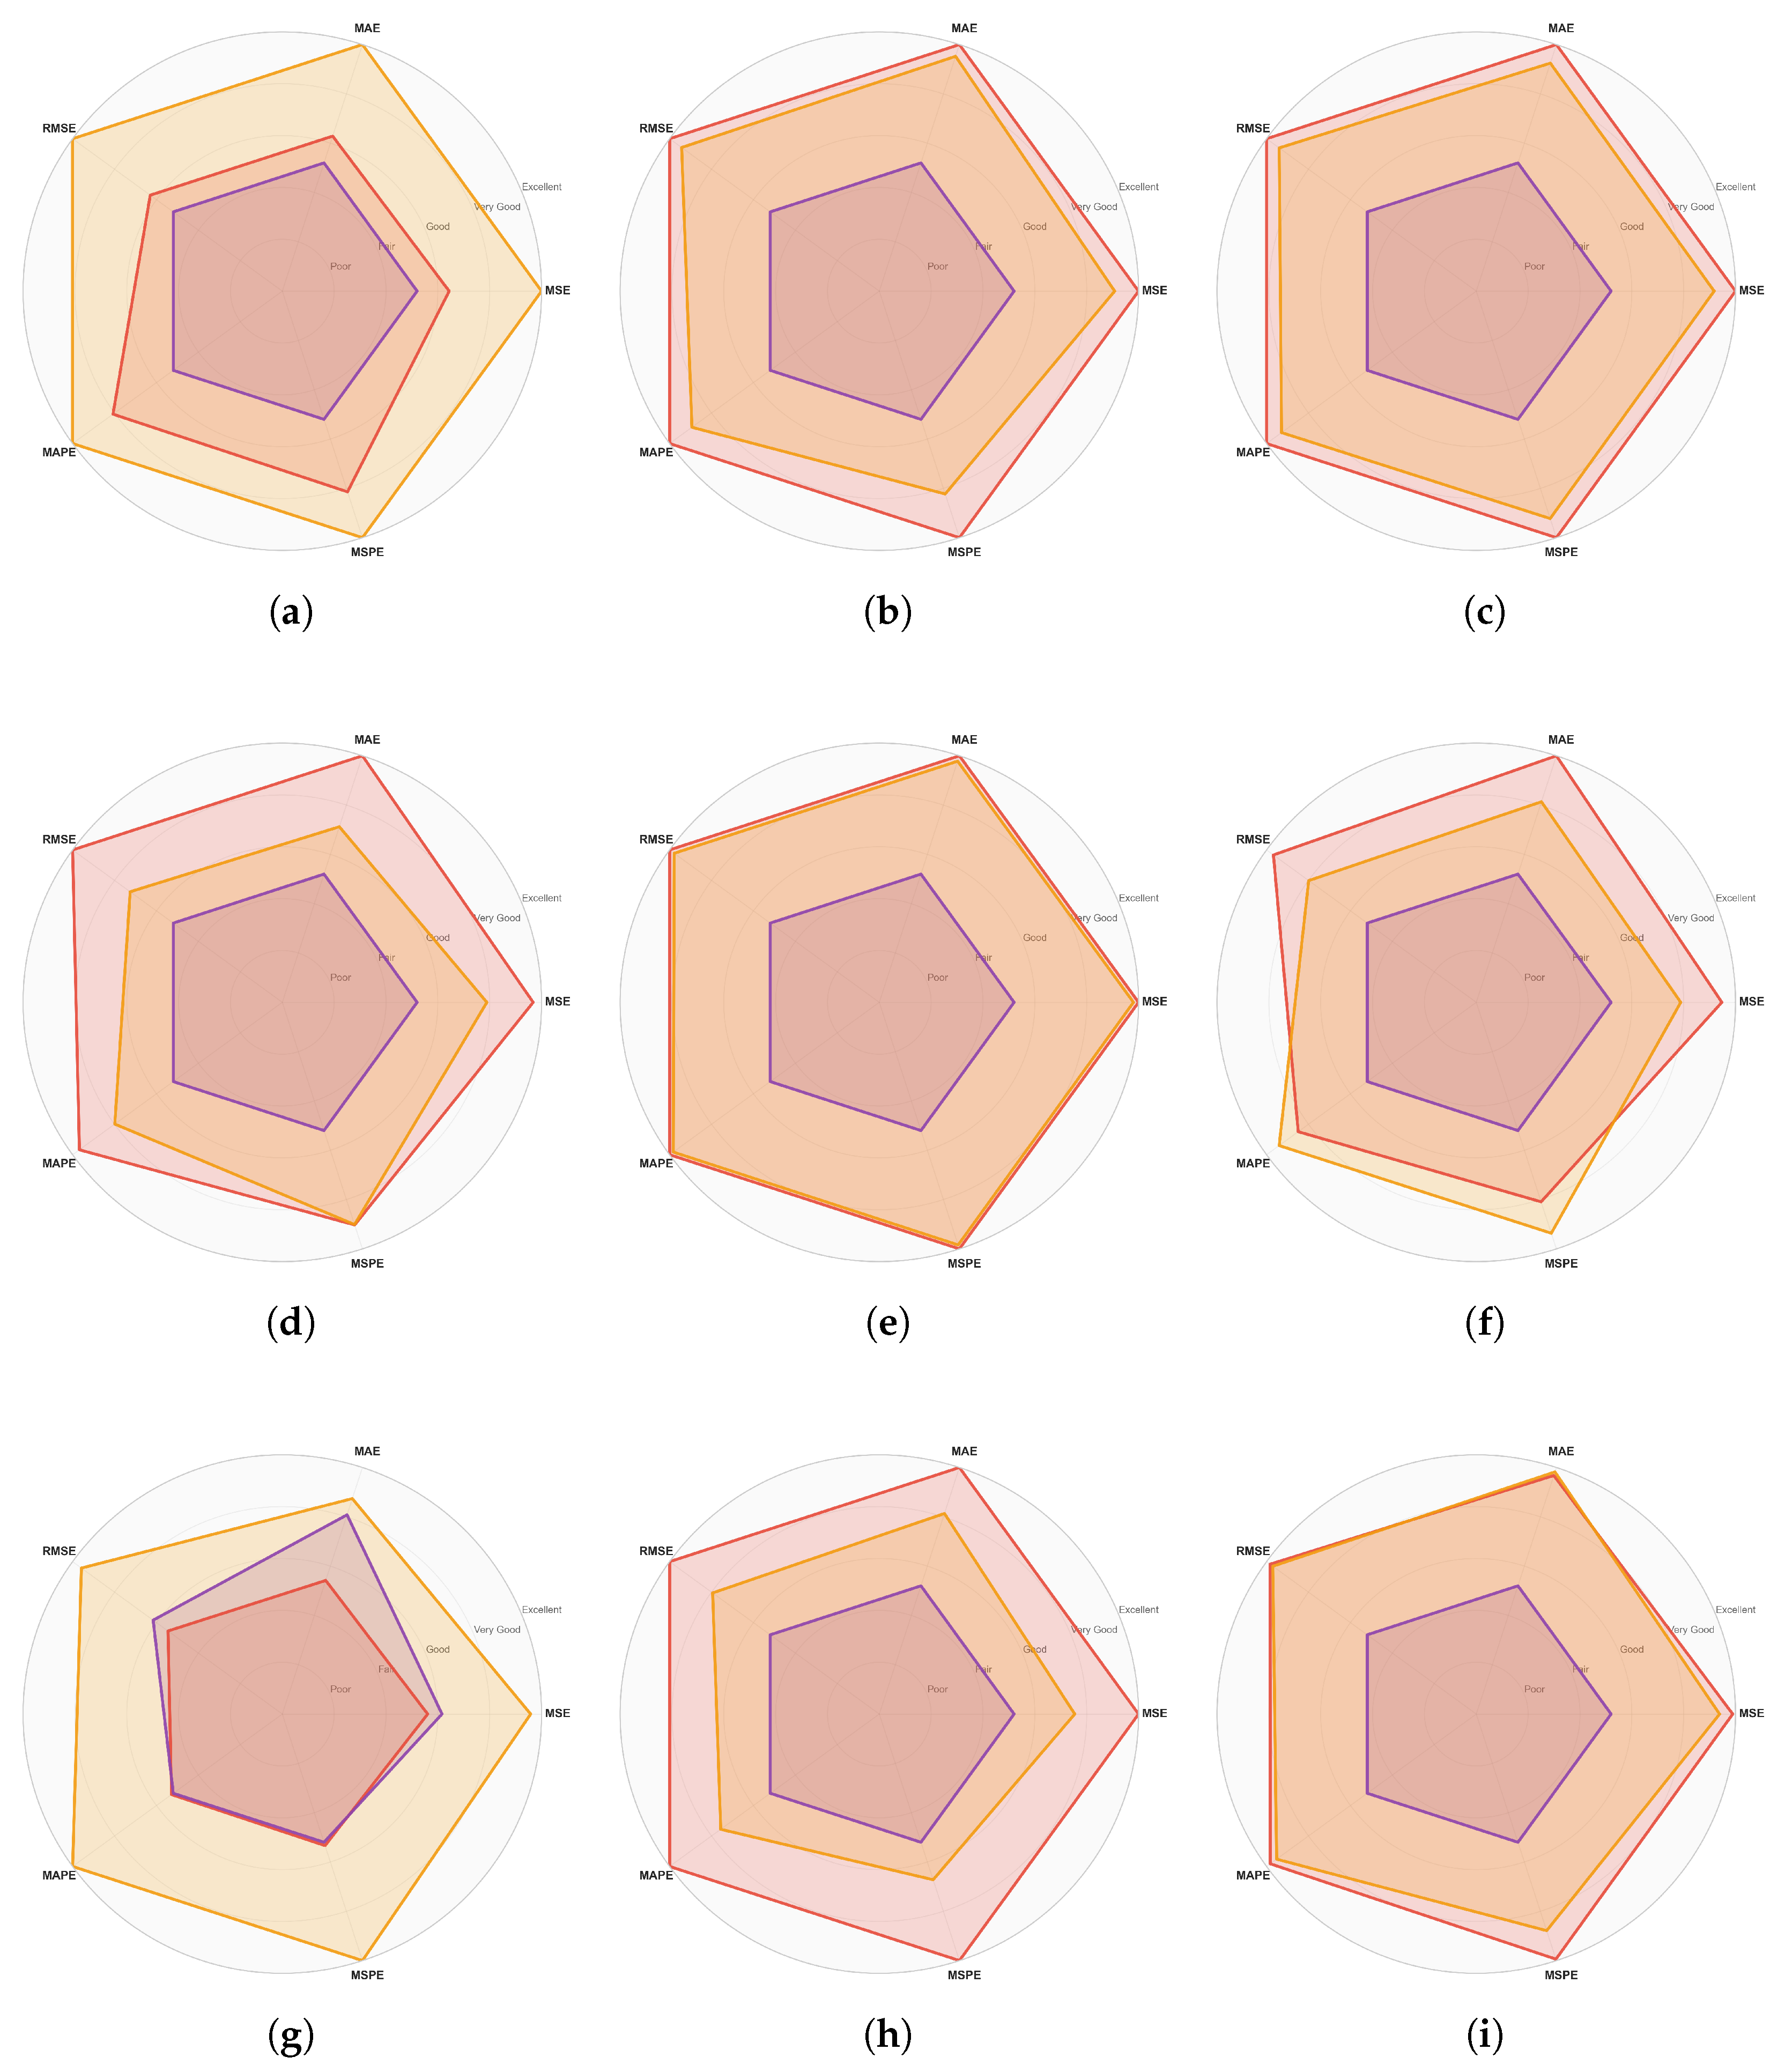
This section assesses TTCA’s performance in multimodal contexts against two popular models, TaTS [10] and TSFlib [12]. The average MSE, MAE, Root Mean Squared Error (RMSE), Mean Absolute Percentage Error (MAPE), and Mean Squared Percentage Error (MSPE) are presented in Table 6, while the relative performance is visualized in Figure 6.
Table 6.
Comparison between TTCA and multimodal baselines on the Time-MMD dataset.
Figure 6.
Radar chart comparison of TTCA, TSFlib, and TaTS across all domains. Each chart shows normalized performance metrics where larger areas indicate better performance. TTCA (red)—TaTS (Orange)—TSFlib (Purple). (a) Agriculture Domain; (b) Climate Domain; (c) Economy Domain; (d) Energy Domain; (e) Environment Domain; (f) Health Domain; (g) Security Domain; (h) Social Good Domain; (i) Traffic Domain.
In summary, TTCA achieves an average MSE of 9.490, MAE of 0.861, RMSE of 1.623, MAPE of 1.180, and MSPE of 67.099, outperforming TSFlib (MSE: 9.917, MAE: 1.080, RMSE: 1.929, MAPE: 2.101, MSPE: 156.085) with improvements of 4.31% in MSE, 20.28% in MAE, 15.86% in RMSE, 43.84% in MAPE, and 57.01% in MSPE. Against TaTS (MSE: 9.582, MAE: 0.915, RMSE: 1.750, MAPE: 1.302, MSPE: 55.342), TTCA shows degradation on the MSE metric due to scale differences in high-variance domains but gains in others, which still demonstrates the effectiveness of TTCA in multimodal forecasting.
Domain-specific analysis reveals TTCA’s strengths in text-enriched environments. On Traffic, TTCA yields the largest improvements of 58.65% in MSE and 3.82% in MAE over TSFlib, and 58.25% in MSE over TaTS, as visualized in Figure 6i, where TTCA’s polygon extends further toward “Excellent” along the error-sensitive axes. Similarly, on Social Good, TTCA yields improvements of 35.60% in MSE over TSFlib and 20.33% over TaTS, with the radar chart (Figure 6h) illustrating enhanced robustness in event-driven data via PLM embeddings. Moderate improvements are observed on Climate (improvements: 25.34% MSE over TSFlib, 6.71% over TaTS), Health (6.52% MSE over TSFlib, though a minor degradation of 0.32% over TaTS), and Economy (67.02% MSE over TSFlib, 38.46% over TaTS), where TTCA’s unimodal backbone (e.g., iTransformer) aids in handling numerical patterns while fusing textual narratives like weather events, health policies, or economic reports, as shown in Figure 6b,c,e,f.
However, underperformance persists in Agriculture, Energy, and Security. This can be observed in Figure 6a,d,g, where TTCA also lags in these numerically dominant domains due to the added complexity of multimodal fusion. On Agriculture (MSE: 0.825, MAE: 0.617, RMSE: 0.906, MAPE: 0.167, MSPE: 0.047), TTCA is outperformed by TaTS (MSE: 0.555, MAE: 0.495) across most metrics (e.g., a 48.65% degradation in MSE), likely because TaTS treats text as time series representations that enable the integration of periodic patterns (e.g., crop cycles influenced by seasonal reports), where textual data may not require deep semantic extraction but rather direct temporal alignment. In contrast, TTCA and TSFlib’s separate processing of text and time series before cross-attention can introduce misalignment or information dilution, such as mismatched embedding dimensions or an over-reliance on PLM-derived features that amplify noise in less event-driven data. Similarly, in Energy (MSE: 0.342 vs. TaTS 0.492, but mixed with degradations in MSPE: 10.57%) and Security (MSE: 81.886 vs. TaTS 81.386, with a 0.61% degradation in MSE and broader degradations in MAPE: 25.50%).
4.2.3. Attention Maps
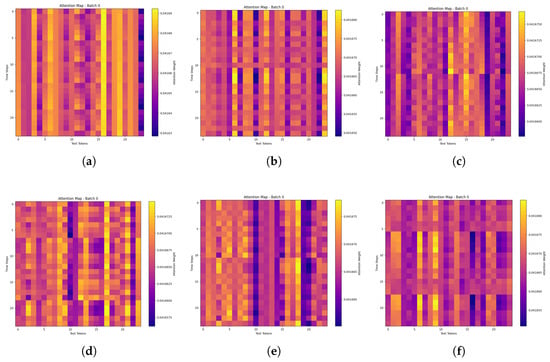
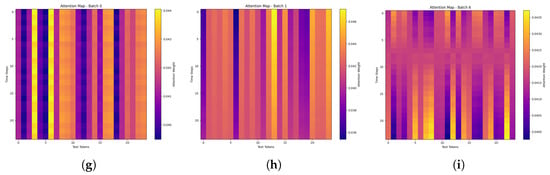
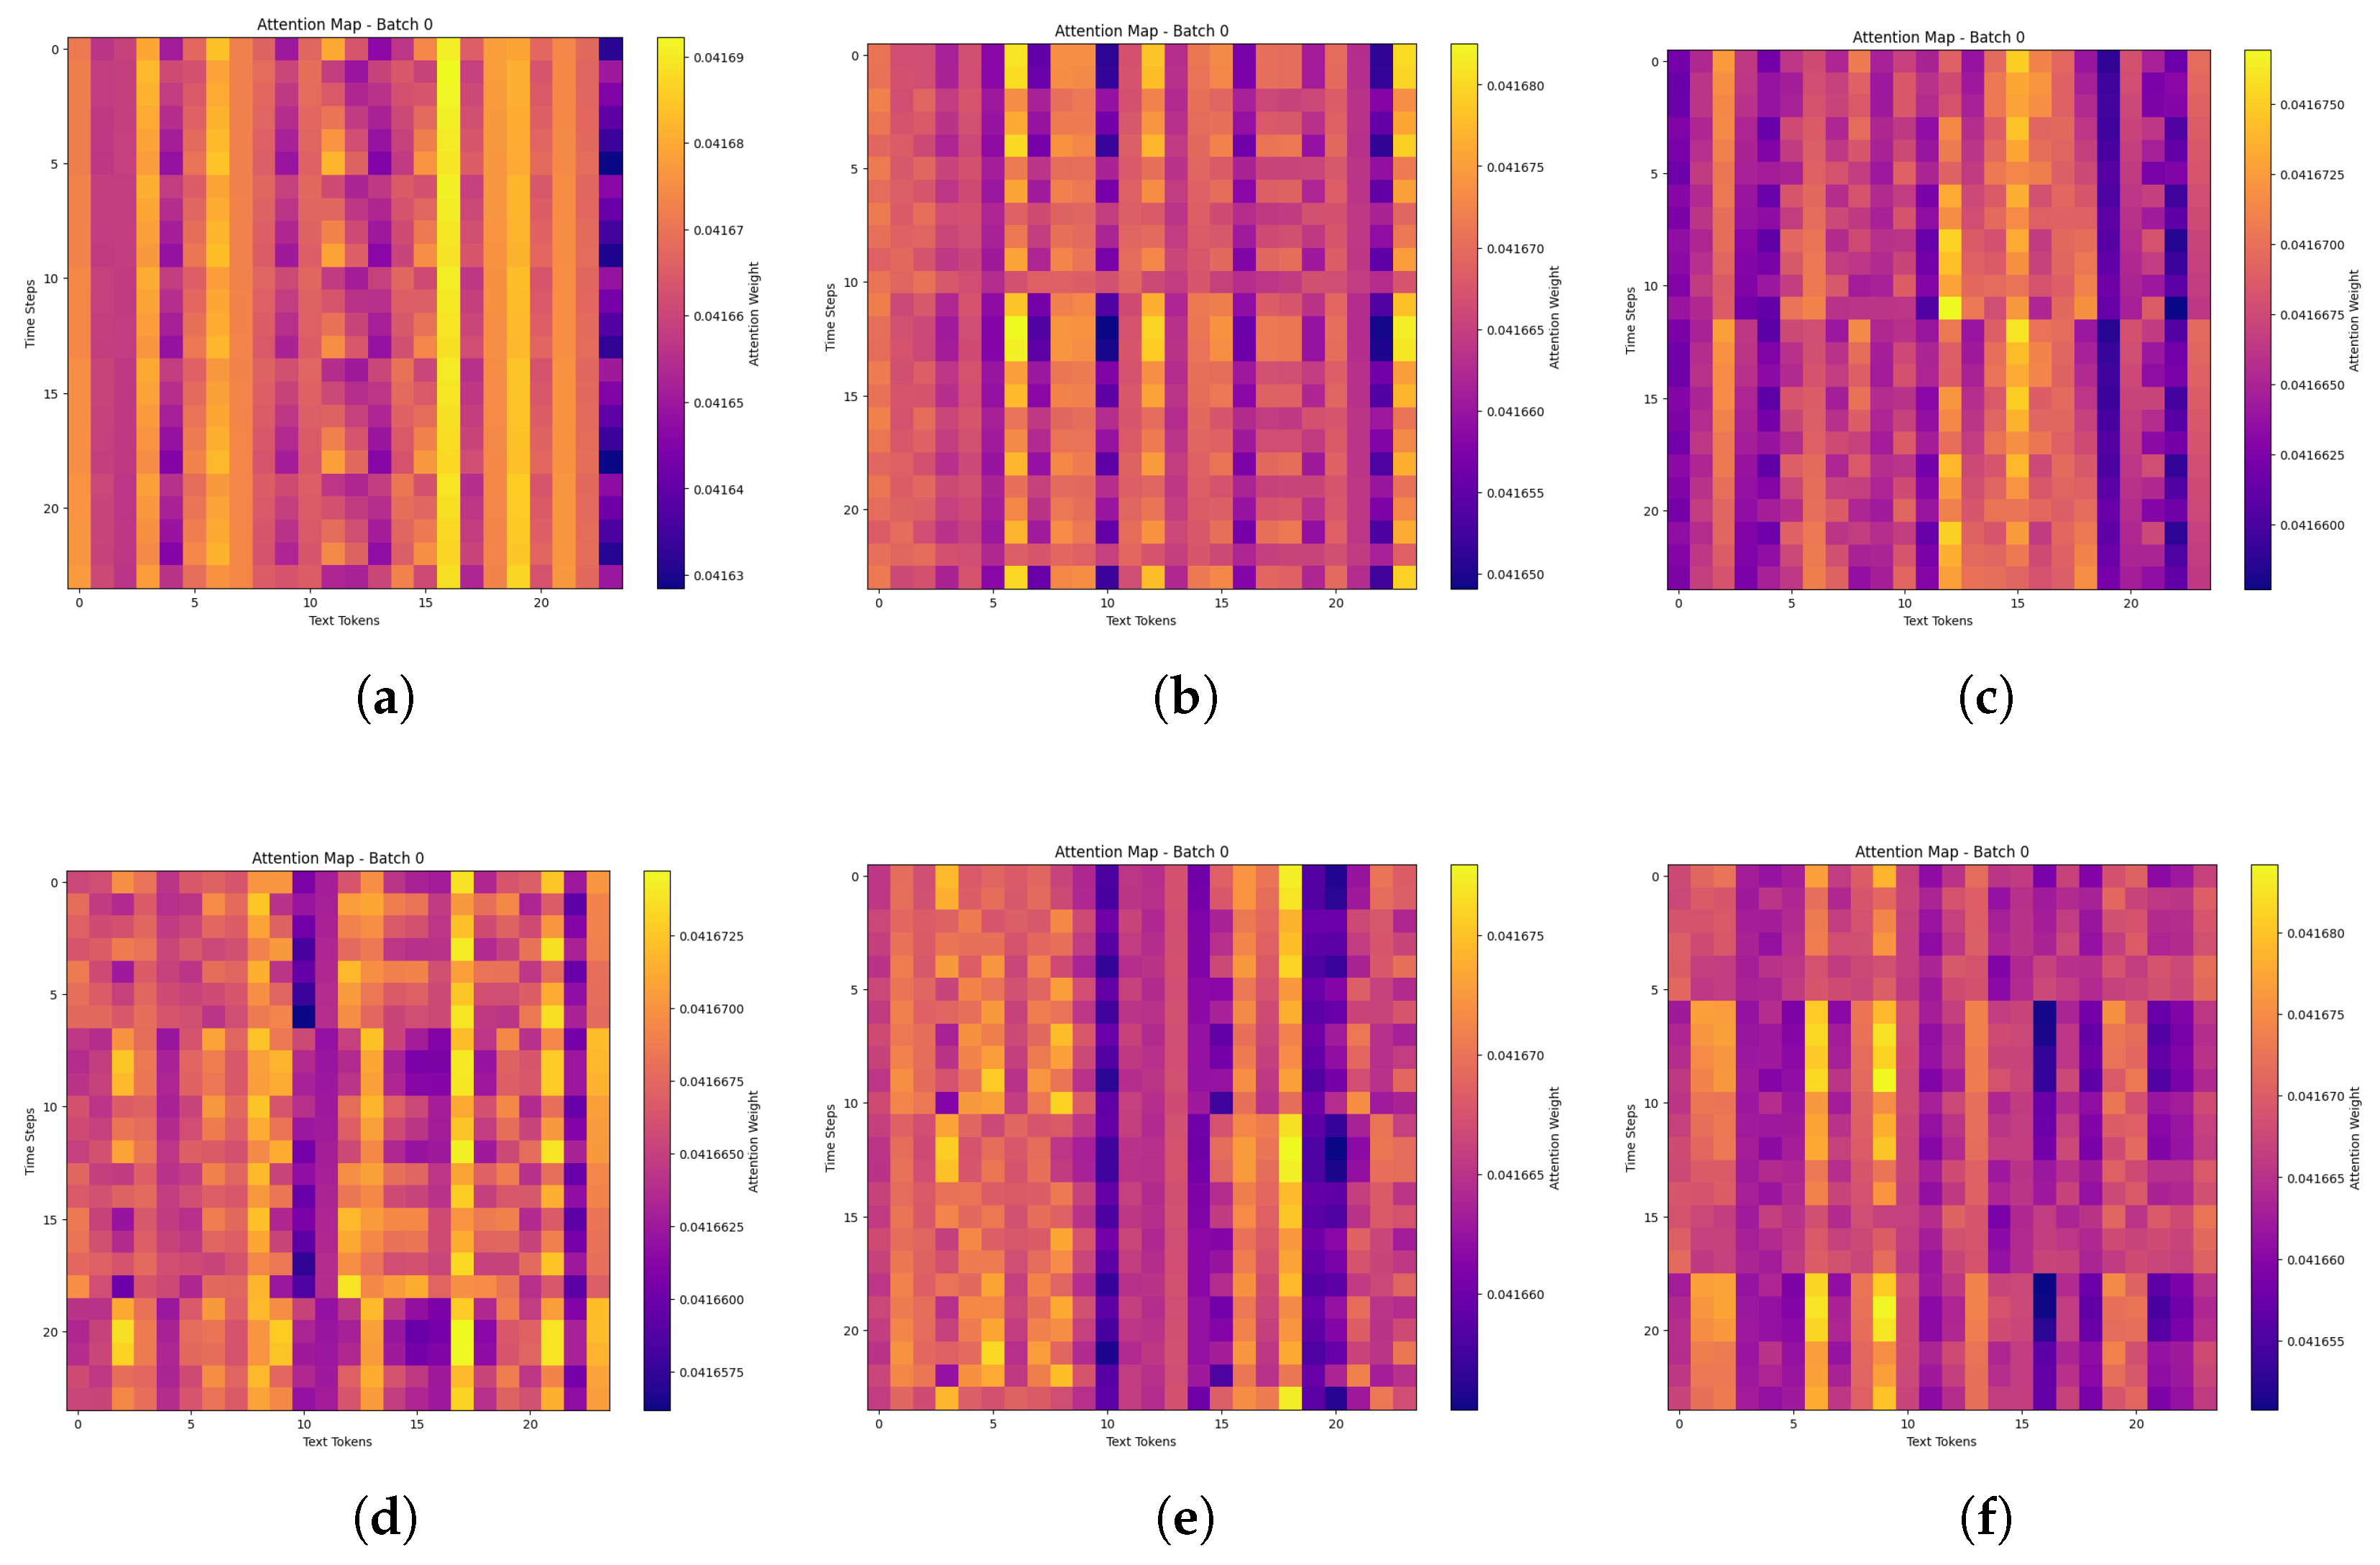
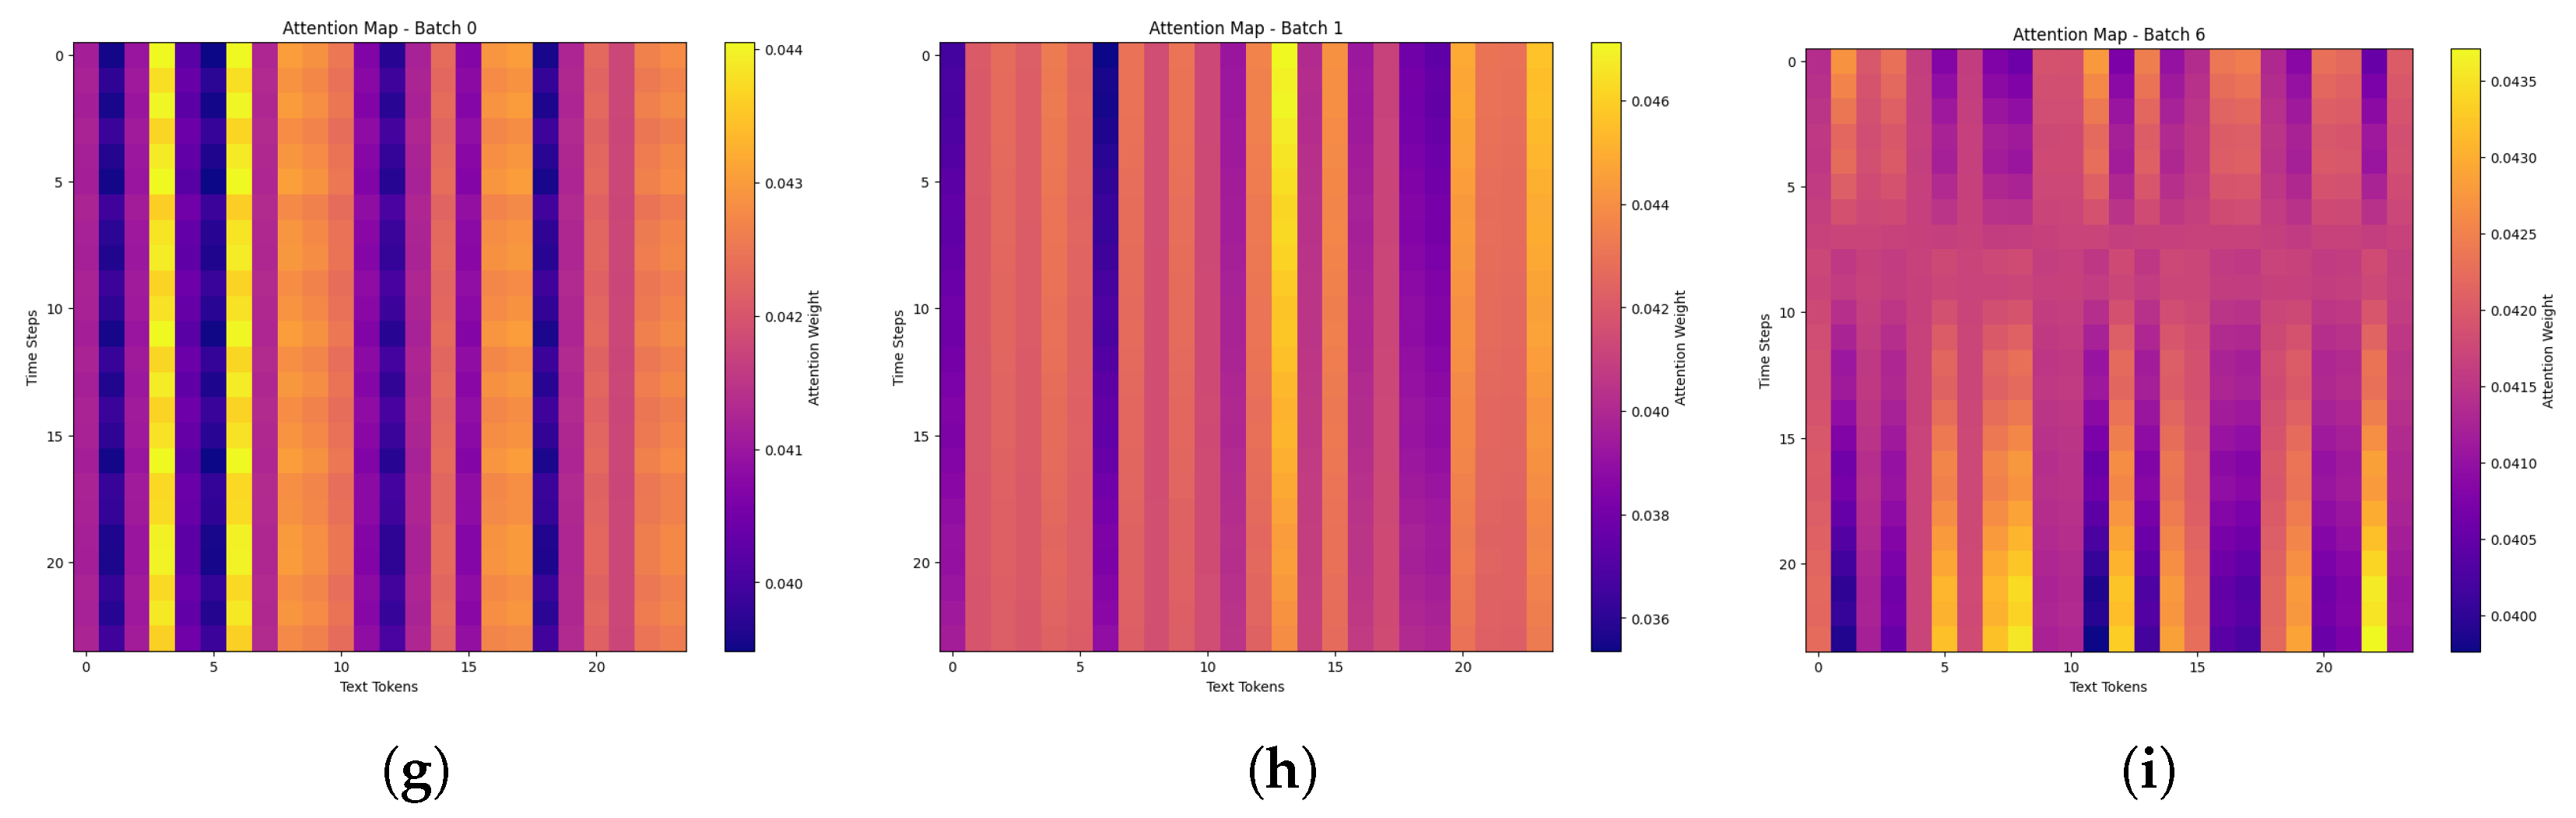
To further understand how TTCA leverages textual context, we visualize the attention weights between time series and textual features. Figure 7 displays the attention maps of the first example in each batch for 8 domains. The attention weights are distributed unevenly across the time series, and different domains have different attention patterns. For example, in the Social Good domain and Health domain, some text tokens have no correlation with the time series, but some text tokens at the end of the text have high correlation with the time series. In addition, attention patterns are different across samples; as shown in Figure 7h,i, an unclear pattern emerges from time steps 5 to 10.
Figure 7.
Attention maps across 8 domains, where the x-axis represents textual snippets and the y-axis represents time series time steps. The color intensity indicates the attention weights, with brighter regions signifying stronger correlations between specific time steps and textual content. (a) Energy; (b) Climate; (c) Economy; (d) Traffic; (e) Agriculture; (f) Security; (g) Social Good; (h) Health (batch - 0); (i) Health (batch - 6).
4.3. Ablation Studies
We conducted comprehensive ablation studies to validate the effectiveness of each component in our proposed TTCA model. The experiments were performed on all 9 datasets with an input length of 24 and a forecast horizon of 12; the results are mainly reported in the MSE. To speed up the experiments, we trained each run for 20 epochs instead of 100, as shown in the main results. Other hyperparameters were set following Table 2 if not specified.
4.3.1. Skip Connection
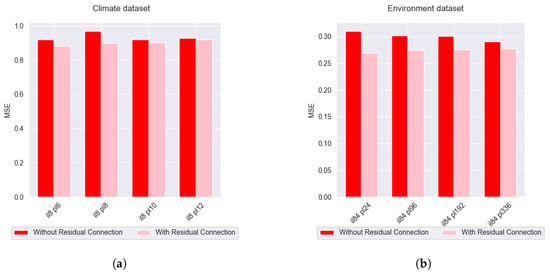
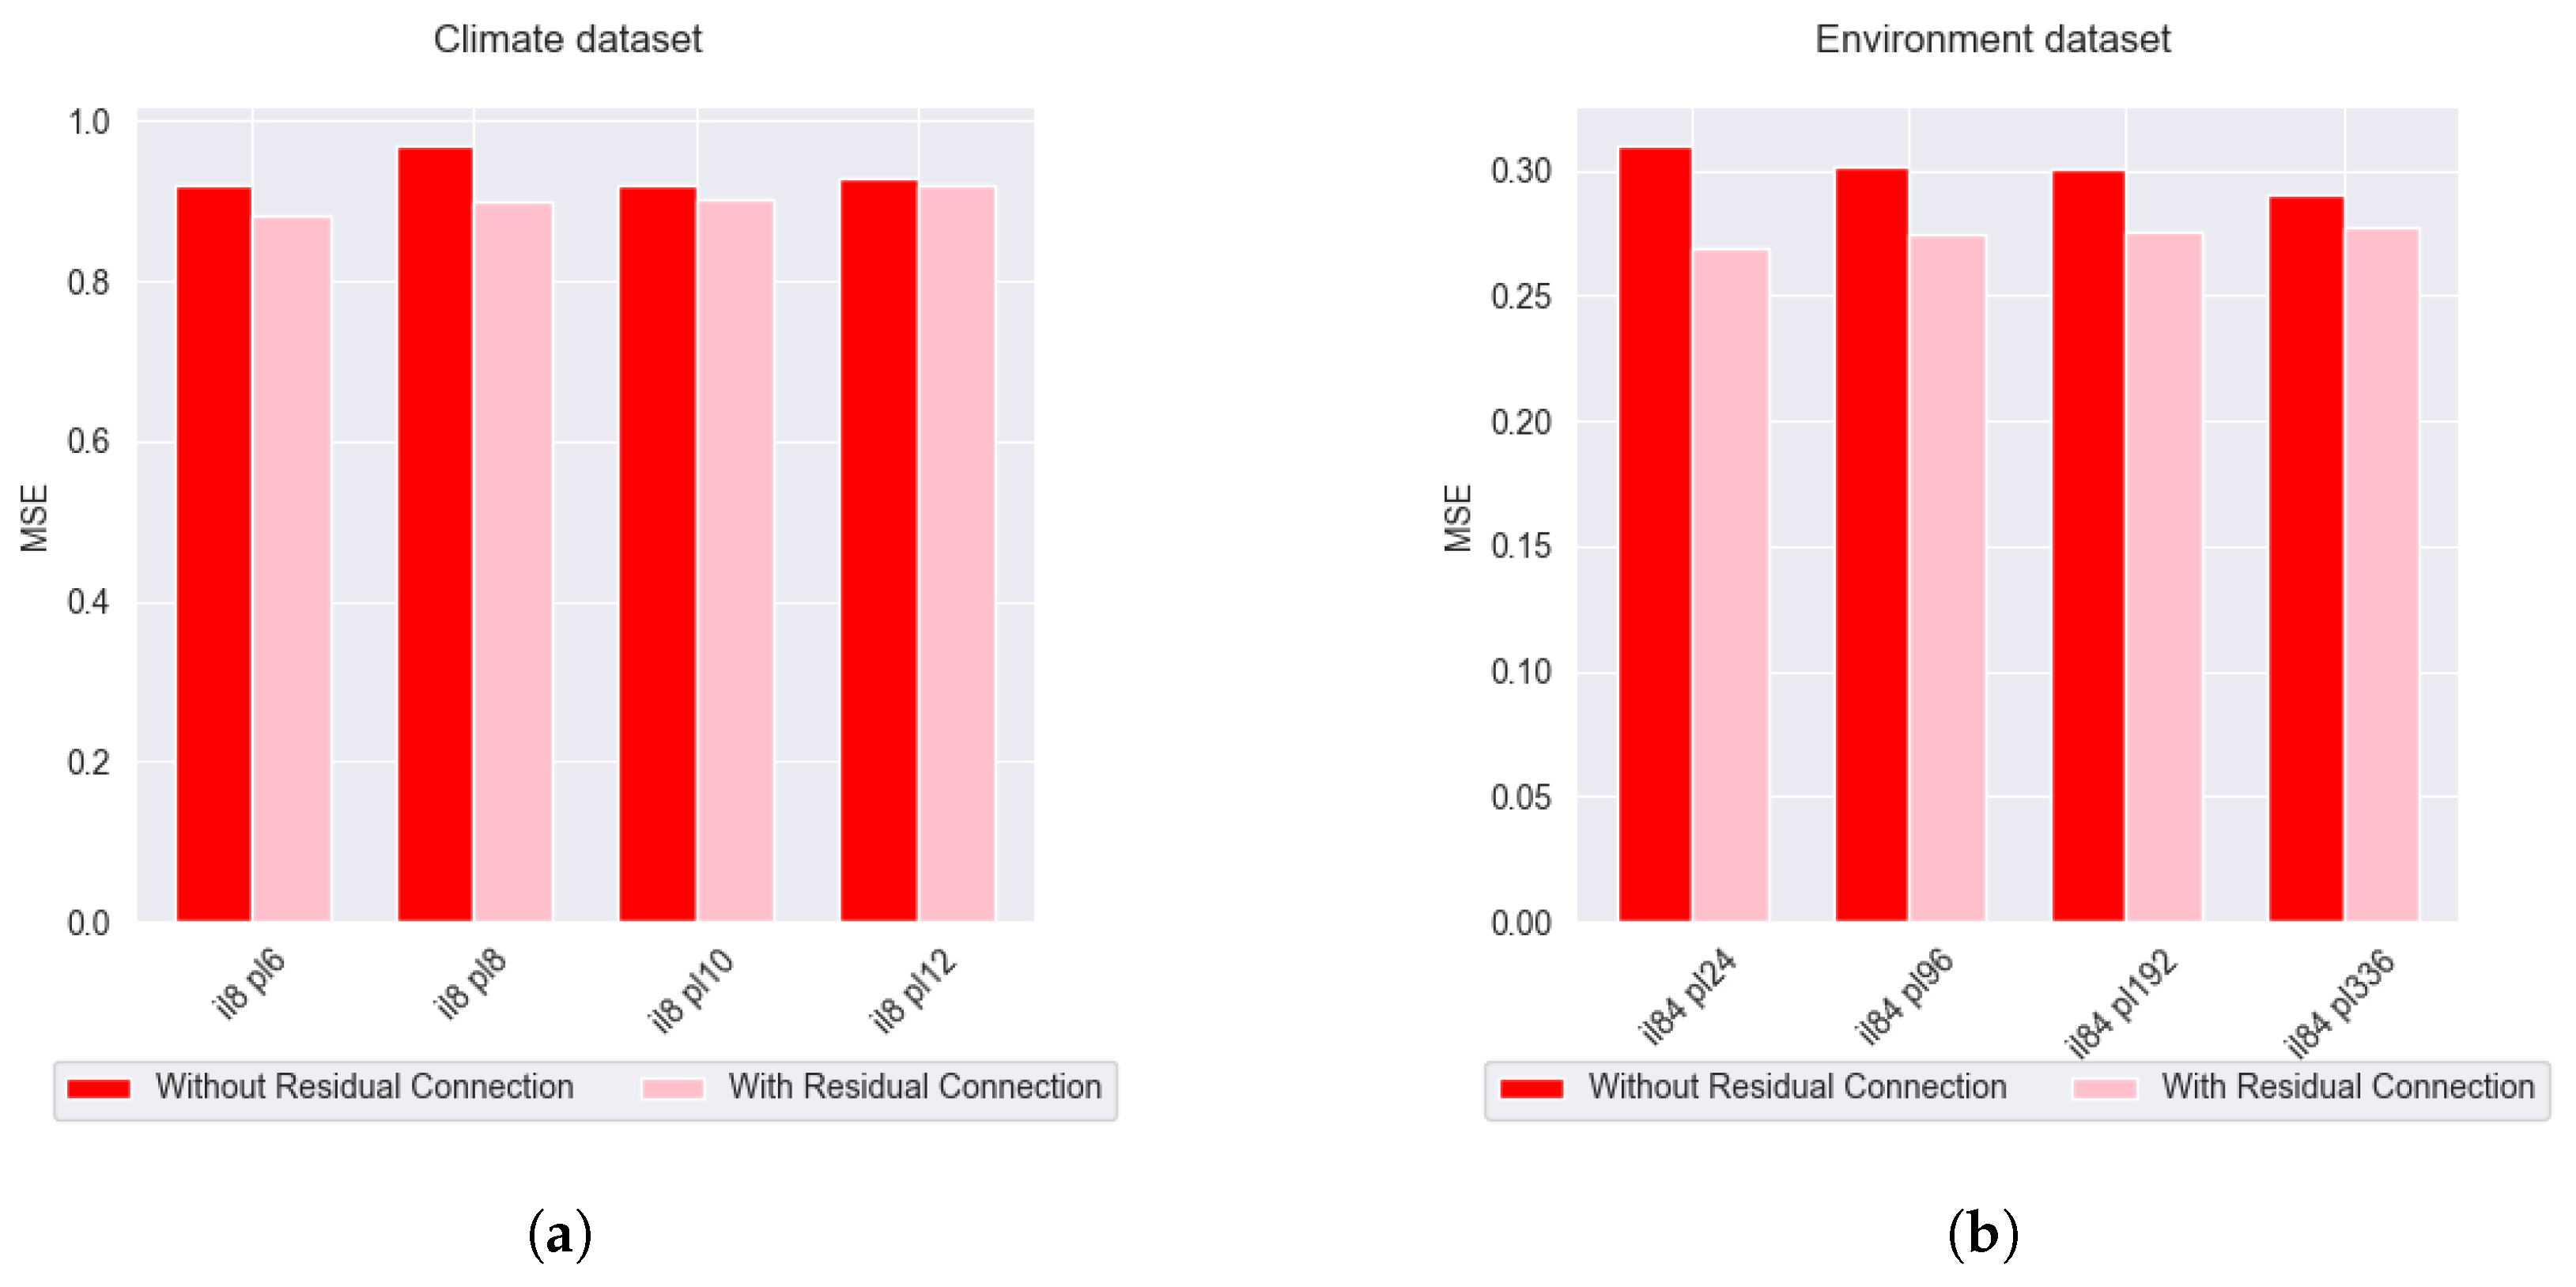
The skip connection ablation compares the full TTCA model, incorporating residual connections, against a variant without them, as shown in Figure 8. In the Environment domain, the full TTCA model achieves consistent MSE reductions of 10–15% across horizons, from 0.30 to 0.26 at horizon 84, and from 0.28 to 0.25 at horizon 336. Similarly, in the Climate domain, MSE improvements range from 8–12%, from 0.95 to 0.85 at horizon 96, and from 0.92 to 0.82 at horizon 112. These outcomes demonstrate the skip connections’ role in mitigating information loss within the deep fusion layers, where referencing the original time series information is crucial for the forecasting task.
Figure 8.
Ablation study on skip connection, results are reported in the Climate and Environment datasets. (a) Climate Dataset; (b) Environment Dataset.
4.3.2. Fusion Method
Fusion Method: We investigate the effectiveness of our proposed fusion mechanism by comparing it with three other approaches: (1) bidirectional Cross-Modal Fusion, (2) simple concatenation of modalities, and (3) a unimodal approach, where no textual information is used. To summarize, fusing text into time series is beneficial to the forecasting task, as shown in Table 7. However, there are some exceptions, such as Agriculture, Economy, and Security datasets, where the unimodal approach achieves better performance than the fusion approaches. About the fusion method, the Time → Text approach achieves the best MSE overall. In terms of architecture, both Text ↔ Time and concatenation double the dimension of latent representation before forecasting, which increases the complexity and the tendency to overfit.
Table 7.
Ablation study on different fusion methods across datasets.
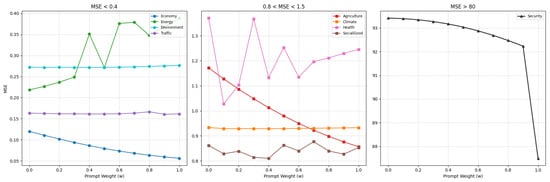
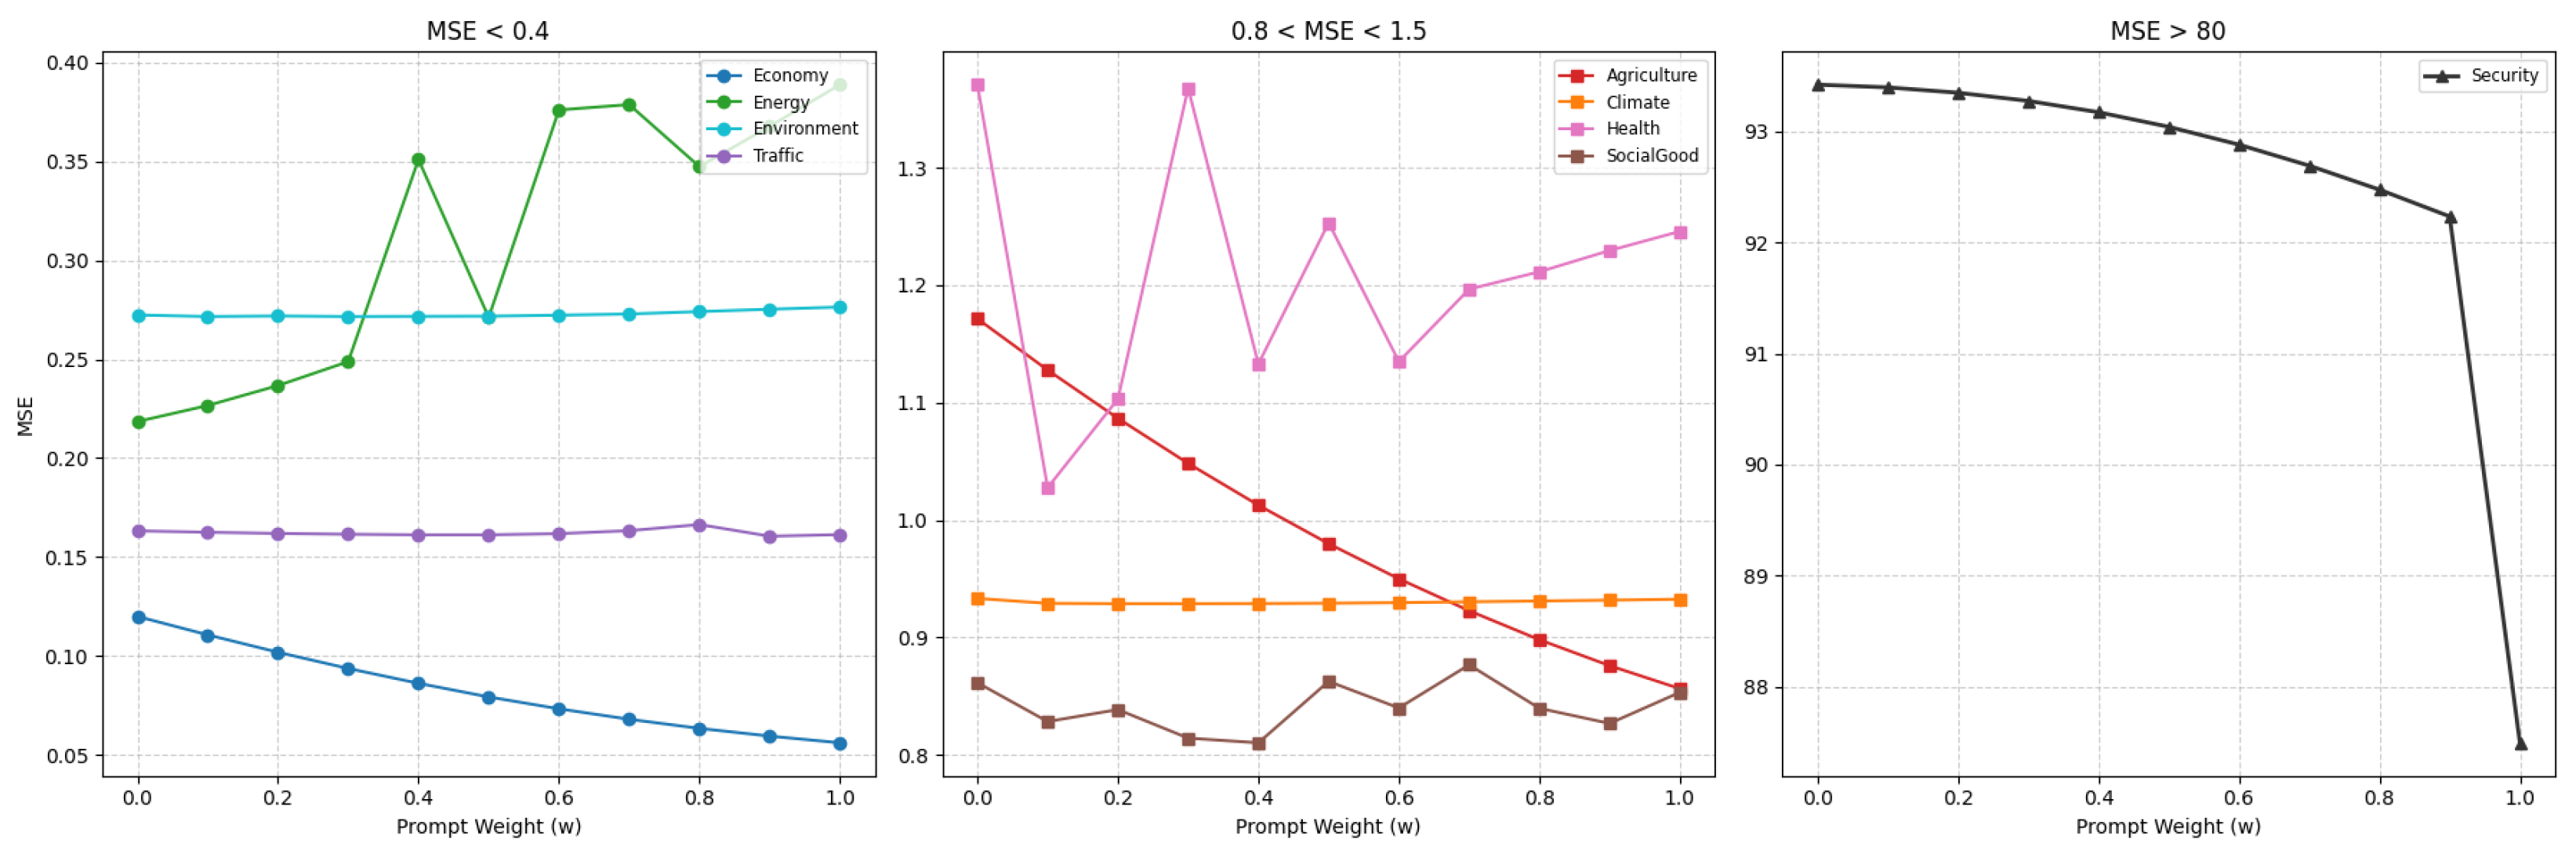
Fusion Weight: The effect of the text branch on the time series branch is controlled by the fusion weight, which is added at the skip connection layer. We investigate 11 values of fusion weight, from 0 to 1 in steps of 0.1, where means no text fusion and means no direct connection from the time series branch. The plot in Figure 9 shows that only the Energy dataset does not benefit from text fusion, while the other datasets do. In particular, the MSE on Agriculture, Economy, and Security gradually decreases when increases from 0 to 1. The remaining datasets, such as Climate, Environment, Health, Social Good, and Traffic, do not show an obvious trend, but the best performance is achieved when is around 0.1 to 0.3.
Figure 9.
Ablation study on fusion weight. For better visualization, 3 charts are plotted based on the MSE scale.
4.3.3. Encoder Model
Text Encoder: We evaluate the impact of different text encoders on model performance by comparing three families of language models (GPT, BERT, and Llama), as shown in Table 8. In terms of model size, BERT (0.11 B), RoBERTa (0.12 B), GPT-2 (0.12 B), and GPT-2 Medium (0.35 B), GPT-2 Large (0.77 B) are relatively small, while Llama-2 (6.7 B) and Llama-3 (8 B) are relatively large but considered small language models as of 2026. The results in Table 8 suggest that smaller models tend to perform better, and that a larger embedding dimension does not necessarily lead to better performance. Also, the performance of GPT is better than BERT and RoBERTa on most of the datasets, suggesting that decoder-only is more suitable than the encoder architecture.
Table 8.
Ablation study on different language models and their impact on MSE across datasets.
Time Series Encoder: We evaluate the impact of different Time Series Encoders on model performance by comparing two variants: iTransformer and PatchTST. Unlike the Text Encoder, which is pre-trained on large-scale text corpora and can be used directly, the Time Series Encoder must be trained from scratch because no open weights are available. In implementation, the output lengths of PatchTST and iTransformer differ because of patch division. In particular, iTransformer considers a token as a single time step, while PatchTST considers a token as a patch of time steps (default patch size = 16 and stride = 8). As a result, the output length of PatchTST is , while the output length of iTransformer equals the length of the input time series T.
As shown in Table 9, iTransformer achieves better performance than PatchTST on 8 out of 9 datasets. The results suggest two possible reasons. First, the patch division of PatchTST may lead to a lack of information for Cross-Modal Fusion due to very short context length. Second, iTransformer employs variate tokenization, which is well-known for outperforming patch-based tokenization, and that is also true in the case of multimodal.
Table 9.
Ablation study on different Time Series Encoders across domains.
4.3.4. Parameter Sensitivity
We have performed extensive hyperparameter tuning to determine the default hyperparameter settings shown in Table 2. In this ablation study, we present a sensitivity analysis of the most important hyperparameters, including the dimension of the fusion layer, the translator layer, and the pooling type.
Pooling Type: We compare two common pooling strategies, mean pooling and max pooling, for aggregating token-level text embeddings into temporal-level representations. As shown in Table 10, mean pooling achieves better performance than max pooling on 8 out of 9 datasets.
Table 10.
Ablation study on different pooling types across domains.
Fusion dimension Performance sensitivity to the fusion dimension is evaluated across five values: 64, 128, 256, 512, and 1024. As shown in Table 11, a dimension of 256 consistently yields the lowest MSE across most domains, suggesting an optimal balance between representation capacity and overfitting. Smaller dimensions like 64 or 128 often restrict the model’s ability to capture complex cross-modal correlations, while larger dimensions such as 1024 increase computational overhead without providing commensurate predictive gains. There is a slight reduction in MSE from 512 to 1024, which may be attributed to the use of the same latent dimension in the forecasting head.
Table 11.
Ablation study on different fusion dimensions across domains.
5. Conclusions
We introduce Text-Time Cross-Modal Attention, a multimodal framework designed to enhance Time Series Forecasting by fusing numerical data with exogenous textual information through a cross-attention mechanism. Empirical evaluations on the Time-MMD dataset demonstrate that TTCA can utilize the semantic information of text to improve the forecasting performance, and is on par with TaTS and TFS-Lib, which are multimodal baselines. These results are particularly pronounced in domains where text provides vital context, such as climate and environmental forecasting. This work highlights the potential of multimodal time series analysis as multi-domain data becomes increasingly accessible. Nonetheless, future research should explore the integration of fact-checking mechanisms, because the current framework has equal sensitivity to fake news.
Author Contributions
Conceptualization, L.H.A. and D.T.V.; methodology, L.H.A. and S.O.; software, L.H.A.; validation, L.H.A., D.T.V. and G.H.Y.; formal analysis, J.Y.K.; investigation, L.H.A. and G.H.Y.; resources, S.O. and J.Y.K.; data curation, D.T.V. and J.J.A.; writing—original draft preparation, L.H.A.; writing—review and editing, D.T.V. and J.Y.K.; visualization, L.H.A.; supervision, J.Y.K.; project administration, J.Y.K.; funding acquisition, G.H.Y. and J.Y.K. All authors have read and agreed to the published version of the manuscript.
Funding
This work was supported by the Korea Institute of Planning and Evaluation for Technology in Food, Agriculture and Forestry (IPET) through the Open-field Smart Agriculture Utilization Model Development Program, funded by the Ministry of Agriculture, Food and Rural Affairs (MAFRA) (RS-2025-02307408, 50); by the BK21 FOUR Program (Fostering Outstanding Universities for Research, 5199991714138) funded by the Ministry of Education (MOE, Korea) and National Research Foundation of Korea (NRF); and by the Artificial Intelligence Industrial Convergence Cluster Development Project funded by the Ministry of Science and ICT (MSIT, Korea) & Gwangju Metropolitan City.
Institutional Review Board Statement
Not applicable.
Informed Consent Statement
Not applicable.
Data Availability Statement
Publicly available datasets were analyzed in this study. This data can be found here: https://github.com/AdityaLab/Time-MMD (accessed on 19 April 2025).
Conflicts of Interest
Authors Dang Thanh Vu and Gwang Hyun Yu were employed by the company AISeed Inc. The remaining authors declare that the research was conducted in the absence of any commercial or financial relationships that could be construed as a potential conflict of interest.
References
- Bai, S.; Kolter, J.Z.; Koltun, V. An Empirical Evaluation of Generic Convolutional and Recurrent Networks for Sequence Modeling. arXiv 2018, arXiv:1803.01271. [Google Scholar] [CrossRef] [Scilit]
- Anh, L.H.; Yu, G.H.; Vu, D.T.; Kim, J.S.; Lee, J.I.; Yoon, J.C.; Kim, J.Y. Stride-TCN for Energy Consumption Forecasting and Its Optimization. Appl. Sci. 2022, 12, 9422. [Google Scholar] [CrossRef] [Scilit]
- Anh, L.H.; Yu, G.H.; Vu, D.T.; Kim, H.G.; Kim, J.Y. DelayNet: Enhancing Temporal Feature Extraction for Electronic Consumption Forecasting with Delayed Dilated Convolution. Energies 2023, 16, 7662. [Google Scholar] [CrossRef] [Scilit]
- Zhou, H.; Zhang, S.; Peng, J.; Zhang, S.; Li, J.; Xiong, H.; Zhang, W. Informer: Beyond efficient transformer for long sequence time-series forecasting. In Proceedings of the AAAI Conference on Artificial Intelligence, Virtual, 2–9 February 2021; Volume 35, pp. 11106–11115. [Google Scholar]
- Wu, H.; Xu, J.; Wang, J.; Long, M. Autoformer: Decomposition transformers with auto-correlation for long-term series forecasting. Adv. Neural Inf. Process. Syst. 2021, 34, 22419–22430. [Google Scholar]
- Liu, Y.; Hu, T.; Zhang, H.; Wu, H.; Wang, S.; Ma, L.; Long, M. iTransformer: Inverted Transformers are Effective for Time Series Forecasting. In Proceedings of the International Conference on Learning Representations (ICLR), Vienna, Austria, 7–11 May 2024. [Google Scholar]
- Nie, Y.; Nguyen, N.H.; Sinthong, P.; Kalagnanam, J. A Time Series is Worth 64 Words: Long-term Forecasting with Transformers. In Proceedings of the International Conference on Learning Representations (ICLR), Kigali, Rwanda, 1–5 May 2023. [Google Scholar]
- Zheng, L.; Chen, Z.; He, J.; Chen, H. MULAN: Multi-modal causal structure learning and root cause analysis for microservice systems. In Proceedings of the ACM Web Conference 2024, Virtual, 13–17 May 2024; pp. 4107–4116. [Google Scholar]
- Lee, G.; Yu, W.; Shin, K.; Cheng, W.; Chen, H. Timecap: Learning to contextualize, augment, and predict time series events with large language model agents. In Proceedings of the AAAI Conference on Artificial Intelligence, Philadelphia, PA, USA, 25 February–4 March 2025; Volume 39, pp. 18082–18090. [Google Scholar]
- Li, Z.; Lin, X.; Liu, Z.; Zou, J.; Wu, Z.; Zheng, L.; Fu, D.; Zhu, Y.; Hamann, H.; Tong, H.; et al. Language in the flow of time: Time-series-paired texts weaved into a unified temporal narrative. arXiv 2025, arXiv:2502.08942. [Google Scholar]
- Kim, K.; Tsai, H.; Sen, R.; Das, A.; Zhou, Z.; Tanpure, A.; Luo, M.; Yu, R. Multi-modal forecaster: Jointly predicting time series and textual data. arXiv 2024, arXiv:2411.06735. [Google Scholar] [CrossRef] [Scilit]
- Liu, H.; Xu, S.; Zhao, Z.; Kong, L.; Prabhakar Kamarthi, H.; Sasanur, A.; Sharma, M.; Cui, J.; Wen, Q.; Zhang, C.; et al. Time-mmd: Multi-domain multimodal dataset for time series analysis. Adv. Neural Inf. Process. Syst. 2024, 37, 77888–77933. [Google Scholar]
- Tan, M.; Merrill, M.; Gupta, V.; Althoff, T.; Hartvigsen, T. Are language models actually useful for time series forecasting? Adv. Neural Inf. Process. Syst. 2024, 37, 60162–60191. [Google Scholar]
- Jin, M.; Wang, S.; Ma, L.; Chu, Z.; Zhang, J.Y.; Shi, X.; Chen, P.Y.; Liang, Y.; Li, Y.F.; Pan, S. Time-LLM: Time Series Forecasting by Reprogramming Large Language Models. In Proceedings of the International Conference on Learning Representations (ICLR), Vienna, Austria, 7–11 May 2024. [Google Scholar]
- Qiao, Z.; Pan, S.; Wang, A.; Zhukova, V.; Liu, Y.; Jiang, X.; Wen, Q.; Long, M.; Jin, M.; Liu, C. It’s TIME: Towards the Next Generation of Time Series Forecasting Benchmarks. arXiv 2026, arXiv:2602.12147. [Google Scholar]
- Liu, X.; McDuff, D.; Kovacs, G.; Galatzer-Levy, I.; Sunshine, J.; Zhan, J.; Poh, M.Z.; Liao, S.; Di Achille, P.; Patel, S. Large Language Models are Few-Shot Health Learners. In Proceedings of the 2024 IEEE Conference on Body Sensor Networks (BSN), Chicago, IL, USA, 15–17 October 2024. [Google Scholar]
- Li, J.; Liu, C.; Cheng, S.; Arcucci, R.; Hong, S. Frozen language model helps ecg zero-shot learning. In Proceedings of the Medical Imaging with Deep Learning; PMLR: Cambridge, MA, USA, 2024; pp. 402–415. [Google Scholar]
- Wang, Z.; Ji, H. Open vocabulary electroencephalography-to-text decoding and zero-shot sentiment classification. In Proceedings of the AAAI Conference on Artificial Intelligence, Online, 22 February–1 March 2022; Volume 36, pp. 5350–5358. [Google Scholar]
- Bamford, T.; Coletta, A.; Fons, E.; Gopalakrishnan, S.; Vyetrenko, S.; Balch, T.; Veloso, M. Multi-modal financial time-series retrieval through latent space projections. In Proceedings of the Fourth ACM International Conference on AI in Finance, Brooklyn, NY, USA, 27–29 November 2023; pp. 498–506. [Google Scholar]
- Chen, Z.; Zheng, L.N.; Lu, C.; Yuan, J.; Zhu, D. Chatgpt informed graph neural network for stock movement prediction. arXiv 2023, arXiv:2306.03763. [Google Scholar] [CrossRef] [Scilit]
- Yu, X.; Chen, Z.; Ling, Y.; Dong, S.; Liu, Z.; Lu, Y. Temporal data meets LLM–explainable financial time series forecasting. arXiv 2023, arXiv:2306.11025. [Google Scholar]
- Mou, S.; Xue, Q.; Chen, J.; Takiguchi, T.; Ariki, Y. Mm-itransformer: A multimodal approach to economic time series forecasting with textual data. Appl. Sci. 2025, 15, 1241. [Google Scholar]
- Jiang, Y.; Ning, K.; Pan, Z.; Shen, X.; Ni, J.; Yu, W.; Schneider, A.; Chen, H.; Nevmyvaka, Y.; Song, D. Multi-modal time series analysis: A tutorial and survey. In Proceedings of the 31st ACM SIGKDD Conference on Knowledge Discovery and Data Mining, Toronto, ON, Canada, 3–7 August 2025; pp. 6043–6053. [Google Scholar]
- Kong, Y.; Yang, Y.; Wang, S.; Liu, C.; Liang, Y.; Jin, M.; Zohren, S.; Pei, D.; Liu, Y.; Wen, Q. Position: Empowering time series reasoning with multimodal llms. In Proceedings of the 42nd International Conference on Machine Learning (ICML), Vancouver, BC, Canada, 13–19 July 2025. [Google Scholar]
- Liu, C.; Wang, S.; Zhu, E. DP-GPT4MTS: Dual-Prompt Large Language Model for Textual-Numerical Time Series Forecasting. arXiv 2025, arXiv:2508.04239. [Google Scholar]
- Zhong, S.; Ruan, W.; Jin, M.; Li, H.; Wen, Q.; Liang, Y. Time-vlm: Exploring multimodal vision-language models for augmented time series forecasting. arXiv 2025, arXiv:2502.04395. [Google Scholar]
- Cao, D.; Jia, F.; Arik, S.O.; Pfister, T.; Zheng, Y.; Ye, W.; Liu, Y. TEMPO: Prompt-based Generative Pre-trained Transformer for Time Series Forecasting. In Proceedings of the International Conference on Learning Representations (ICLR), Vienna, Austria, 7–11 May 2024. [Google Scholar]
- Liu, H.; Zhao, Z.; Wang, J.; Kamarthi, H.; Prakash, B.A. Lstprompt: Large language models as zero-shot time series forecasters by long-short-term prompting. arXiv 2024, arXiv:2402.16132. [Google Scholar]
- Liu, C.; Xu, Q.; Miao, H.; Yang, S.; Zhang, L.; Long, C.; Li, Z.; Zhao, R. Timecma: Towards llm-empowered multivariate time series forecasting via cross-modality alignment. In Proceedings of the AAAI Conference on Artificial Intelligence, Philadelphia, PA, USA, 25 February–4 March 2025; Volume 39, pp. 18780–18788. [Google Scholar]
- Prabhakar Kamarthi, H.; Prakash, B.A. Large Pre-trained time series models for cross-domain Time series analysis tasks. Adv. Neural Inf. Process. Syst. 2024, 37, 56190–56214. [Google Scholar]
- Anh, L.H.; Vu, D.T.; Oh, S.; Yu, G.H.; Han, N.B.N.; Kim, H.G.; Kim, J.S.; Kim, J.Y. Partial Transfer Learning from Patch Transformer to Variate-Based Linear Forecasting Model. Energies 2024, 17, 6452. [Google Scholar] [CrossRef] [Scilit]
- Zhang, Y.; Yan, J. Crossformer: Transformer utilizing cross-dimension dependency for multivariate time series forecasting. In Proceedings of the Eleventh International Conference on Learning Representations, Kigali, Rwanda, 1–5 May 2023. [Google Scholar]
- Gruver, N.; Finzi, M.; Qiu, S.; Wilson, A.G. Large language models are zero-shot time series forecasters. Adv. Neural Inf. Process. Syst. 2023, 36, 19622–19635. [Google Scholar]
- Ansari, A.F.; Stella, L.; Turkmen, C.; Zhang, X.; Mercado, P.; Shen, H.; Shchur, O.; Rangapuram, S.S.; Arango, S.P.; Kapoor, S.; et al. Chronos: Learning the Language of Time Series. In Proceedings of the 41st International Conference on Machine Learning (ICML), Vienna, Austria, 21–27 July 2024. [Google Scholar]
- Gopali, S.; Chhetri, B.; Giri, D.; Siami-Namini, S.; Namin, A.S. In-Context and Few-Shots Learning for Forecasting Time Series Data based on Large Language Models. arXiv 2025, arXiv:2512.07705. [Google Scholar]
- Zhao, H.; Zhang, X.; Wei, J.; Xu, Y.; He, Y.; Sun, S.; You, C. Timeseriesscientist: A general-purpose ai agent for time series analysis. arXiv 2025, arXiv:2510.01538. [Google Scholar]
- Vaswani, A.; Shazeer, N.; Parmar, N.; Uszkoreit, J.; Jones, L.; Gomez, A.N.; Kaiser, Ł.; Polosukhin, I. Attention is all you need. In Proceedings of the 31st Conference on Neural Information Processing Systems (NIPS 2017), Long Beach, CA, USA, 4–9 December 2017; Volume 30. [Google Scholar]
- Reimers, N.; Gurevych, I. Sentence-BERT: Sentence Embeddings using Siamese BERT-Networks. In Proceedings of the 2019 Conference on Empirical Methods in Natural Language Processing and the 9th International Joint Conference on Natural Language Processing (EMNLP-IJCNLP), Hong Kong, China, 3–7 November 2019; pp. 3982–3992. [Google Scholar]
- Zhou, X.; Wang, W.; Qu, S.; Zhang, Z.; Bergmeir, C. Unveiling the potential of text in high-dimensional time series forecasting. arXiv 2025, arXiv:2501.07048. [Google Scholar] [CrossRef] [Scilit]
- Li, Z.; Rao, Z.; Pan, L.; Wang, P.; Xu, Z. Ti-MAE: Self-Supervised Masked Time Series Autoencoders. In Proceedings of the International Conference on Learning Representations (ICLR), Vienna, Austria, 7–11 May 2024. [Google Scholar]

Disclaimer/Publisher’s Note: The statements, opinions and data contained in all publications are solely those of the individual author(s) and contributor(s) and not of MDPI and/or the editor(s). MDPI and/or the editor(s) disclaim responsibility for any injury to people or property resulting from any ideas, methods, instructions or products referred to in the content. |
© 2026 by the authors. Licensee MDPI, Basel, Switzerland. This article is an open access article distributed under the terms and conditions of the Creative Commons Attribution (CC BY) license.