1. Introduction
In recent years, the assessment of multimedia Quality of Experience (QoE) has gained significance within dynamic content delivery systems and streaming services. The precise evaluation of perceived video quality continues to be a significant concern, as it directly affects user satisfaction and service optimization tactics. Conventional laboratory investigations have always been the foundation for subjective video quality evaluation, owing to their regulated circumstances that provide uniform measurements and reduce extraneous disturbances. The emergence of crowdsourcing approaches has created opportunities for extensive and economical experimentation, but also prompting concerns over data reliability, user diversity, and environmental variability.
Our previous research [
1,
2] has extensively explored subjective video quality evaluations using a proprietary crowdsourcing platform designed in accordance with ITU-T P.910 Recommendations [
3]. These studies, conducted in uncontrolled environments and using international participant sampling via the Prolific platform, demonstrated that while web-based assessments offer significant scalability and external validity, they also introduce several sources of potential variability. Factors such as participant device specifications, ambient lighting, network bandwidth, and display precision can influence rating behavior and response time dynamics, leading to heterogeneous measurement outcomes.
This study conducts a comparative analysis between two experimental settings: a controlled laboratory environment at AGH University of Krakow, utilizing undergraduate students on standardized laboratory computers, and an uncontrolled remote crowdsourcing environment previously implemented via the Prolific platform. The study seeks to quantify the impacts of environmental management on subjective judgments, rating consistency, and temporal response patterns by adhering to uniform experimental protocols: video stimuli, Absolute Category Rating (ACR) scale, and response time measurement in milliseconds.
The incorporation of response-time analytics provides a new viewpoint on QoE evaluation, connecting cognitive processing effort to subjective decision-making. Initial evidence [
4] from prior research indicates that medium-quality video sequences (designated as “Fair”) provoke prolonged response times, signifying heightened cognitive load and perceptual ambiguity. This study expands the investigation by examining whether these response patterns consistently occur in controlled laboratory environments or are intensified in uncontrolled contexts.
This comparative analysis aims to enhance experimental approaches in video quality research. The study elucidates the trade-offs between external validity and data consistency across contexts, offering useful insights for the development of robust, scalable, and cognitively informed QoE evaluation frameworks suitable for both academic research and commercial applications.
The remainder of this paper is organized as follows.
Section 2 presents a survey of related literature.
Section 3 describes the methodology.
Section 4 details the experimental procedures employed in both the controlled and uncontrolled settings.
Section 5 presents the results.
Section 6 discusses the key findings, including the limitations of crowdsourcing for temporally complex tasks and the threats to validity.
Section 7 concludes the paper and outlines directions for future research.
2. Literature Survey
Subjective video quality assessment is generally regarded as the most reliable method from the end-user perspective, with core QoE concepts and technologies thoroughly discussed in [
5,
6,
7]. Crowdsourcing has become a faster, more cost-effective alternative to traditional lab-based QoE evaluations, and has been increasingly adopted as a substitute for laboratory experiments, with several advances reported in task design, including paired-comparison approaches and integrated feedback mechanisms that trigger rating forms after playback or via interface buttons [
8,
9,
10]. However, crowdsourcing still faces challenges such as dependence on stable internet connectivity, participant recruitment, limited guarantees of high-resolution display availability partially mitigated by higher resolution crowd testing methods and persistent concerns over the validity and reliability of results [
11,
12]. While some studies indicate that crowdsourced assessments can match lab-based outcomes under specific conditions, reliability, conceptual, technical, and motivational issues must be addressed through better test design tailored to crowdsourcing environments, and accuracy can further improve when workers evaluate others’ opinions rather than their own, with aggregation methods critically influencing final result quality [
12,
13].
Winther et al. showed that experts, due to their domain knowledge and motivation, generally outperform crowdworkers when selecting diverse video footage (e.g., shooting, tackling, running, walking, standing) to validate assumptions [
14]. To enhance video quality assessment, an open-source crowdsourcing-based extension of the ITU-T P.910 test was proposed, but its 2021 implementation is limited by slow recruitment of suitable participants [
15]. Although crowdsourcing lacks the accuracy of P.910 and remains only an alternative, controlled lab-based subjective tests are still the gold standard, highlighting the importance of rigorous video quality evaluation in engineering. To mitigate crowdsourcing’s weaknesses, Anegekuh et al. developed a screening algorithm using metadata such as workers’ devices and time-on-task, finding that about one-third of participants did not actually watch the video [
16]. Seufert et al. proposed an adaptive crowdsourced QoE method that reallocates a fixed rating budget across conditions to boost reliability [
17], while Nassar et al. discussed expert-identification techniques, including using rich social media data to exclude unreliable workers before task assignment [
18]. Overall, quality control is central to crowdsourcing, yet Daniel et al.’s unified model of quality-related factors indicates that, despite extensive prior work and general agreement on its importance, current practices still fall short of consistently achieving quality levels that fully leverage human intelligence [
19].
Crowdsourced mobile reporting faces challenges because many contributors lack the expertise and mobile editing skills needed to produce detailed, consistent bug reports, which undermines clear communication [
20]. In response, research on crowdsourced subjective quality evaluation in mobile and video communications has developed and validated systems and methodologies against formal MPEG tests, proposed streaming approaches to cope with uncontrolled end-to-end network conditions and motivated Paired Comparison-based assessments, leveraged existing databases and web apps to exploit large observer pools, surveyed web-based frameworks compatible with major platforms and global workers, and even integrated eye-tracking to connect gaze behavior with users’ evolving understanding and potential gaps between actions and self-reports [
21,
22,
23,
24,
25].
Crowdsourcing has been widely used for image and audio quality assessment, including HDR images and codecs, aesthetic evaluation, object segmentation, and audio MOS testing [
26,
27,
28,
29,
30,
31,
32,
33]. For HDR images, ref. [
27] split participants into two groups and ensured reliability via repeated image presentations and comparison with a gold standard, while [
28] compared aesthetic evaluations of Tone Mapping Operators across a lab study, an online replication, and a Prolific-based crowdsourced test. Implicit input for object segmentation was collected through a game in [
29], revealing that crowd workers underperformed relative to computer vision experts, and [
30] similarly used gamification for subjective image quality assessment. In audio, crowdMOS [
31] offered a low-cost, web-based alternative to traditional lab MOS tests, suitable as a complement or early substitute for objective metrics. Image-related work in [
32] found high agreement between lab and crowdsourced evaluations for content recognisability but not for aesthetic appeal, while a large-scale study in [
33] showed that learning-based image codecs provide promising compression performance compared to anchor codecs.
Crowdsourcing has become an increasingly popular research method, particularly since the COVID-19 pandemic. For graphics-related QoE, it was proposed as an alternative to lab-based tests using multiple screening strategies [
34]. Speech quality assessment, which is even more time-consuming and traditionally conducted in controlled labs following ITU-T P.800 [
35], has similarly moved toward micro-task platforms, leading to standardized crowdsourcing methodologies in ITU-T P.808, with studies showing good agreement between crowdsourced and P.800 lab results [
36,
37]. Further work comparing lab and crowdsourced assessments of overall speech quality using ITU-T P.501 Annex D samples (each presented four times) found that inter-rater agreement increased with task exposure while intra-rater reliability remained stable [
38]. Another web-based crowdsourcing study examined how the number of stimuli affects rating validity, noting that although 40 stimuli produced the strongest correlations, it also increased reports of listener fatigue [
39].
Kurup et al. propose an aggregation method that evaluates submission quality by considering similarity among answers, worker reliability and expertise, and task difficulty, followed by a cost-minimization phase [
40]. Similarly, Kazai et al. analyze how workers’ motivation, interest, domain familiarity, perceived task difficulty, and satisfaction with pay, together with task design, affect the accuracy of relevance labels [
41]. In disaster management, Khajwal et al. introduce an uncertainty-aware framework that decomposes overall damage assessment into simple microtask questionnaires to reduce subjectivity and improve accuracy, while Weaver et al. examine the reliability of crowd reports and highlight the importance of enabling report modification and completion marking as key features [
42,
43]. More broadly, crowdsourcing in information retrieval demands careful task design and ongoing quality control during both design and execution [
44], and in innovation and management, Ghezzi et al. systematically review the field to identify key themes such as open innovation, co-creation, information systems management, organizational theory and design, marketing, and strategy [
45].
Narimanzadeh evaluates two labeling methods for handling task subjectivity, showing that comparison-based labeling either more effectively minimizes random error when the number of comparisons and votes is the same or scales more efficiently as task volume grows, whereas majority voting tends to plateau [
46]. Gardlo et al. demonstrate that carefully designed incentive schemes can markedly enhance crowd performance and introduce real-time verification of participant reliability, which is applicable not only to video but also to images and audio [
47]. Jin et al. propose the Subjectivity-and-Difficulty Response (SDR) model, which separates question subjectivity to derive worker-specific truths and captures how question difficulty influences the likelihood that a worker’s response aligns with their perceived subjective truth [
48]. Focusing on task assignment, Boutsis and Kalogeraki design a crowdsourcing framework that effectively chooses appropriate worker groups for each task, meeting application requirements with minimal overhead while boosting the total number of tasks completed under fixed constraints [
49]. Varshney presents a method that jointly guarantees privacy and reliability via stochastic perturbation of microtasks and associated fusion rules, offering a mathematical formulation with threshold conditions for privacy loss under collusion and examining the tradeoffs among privacy, reliability, and cost [
50]. Blanco et al. further show, through a large-scale, multi-system study on ad hoc Web object retrieval, that crowd-based evaluation can be conducted repeatedly over long periods while maintaining reliability [
51]. Complementing these findings, Behrend et al. investigate whether crowdsourcing can substitute for traditional university subject pools—often criticized for their homogeneity and limited work experience—by surveying targeted samples from both crowdsourcing platforms and university participant pools to compare data quality and better understand crowd workers; overall, the behavior of the crowdsourcing sample was largely comparable to that of participants from a standard psychology subject pool [
52].
Jimenez et al. examined how effectively “trapping questions” and “outlier detection” contribute to reliable results, while noting that they may clutter tasks with stimuli irrelevant to the researcher or remove data points that still reflect genuine worker opinions. They conducted a speech quality assessment via a web-based crowdsourcing platform in accordance with ITU-T Recommendation P.800. Their results show that neither crowdsourcing nor laboratory testing alone improves accuracy; instead, combining both methods is required [
53].
Hoßfeld et al. describe QoE as the overall acceptability or degree of delight or annoyance a user experiences with an application or service, framing it as a subjective evolution of the more objective QoS and emphasizing its multidimensional, factor-dependent nature [
54]. A comprehensive review of QoE methodologies for video services underscores the scarcity of long-term studies and the need to observe user experiences over time, summarizing existing methods, subjective assessment techniques, and study durations, and identifying research gaps and future directions to better capture QoE variability and improve external validity [
55]. To enhance the generalizability of QoE research, a unified theoretical model integrating Influencing Factors (IFs) and Perceptual Dimensions (PDs) from experiment design through data analysis enables additive measurement across comparable experiments [
56], while crowdsourcing is noted as a less costly and time-consuming alternative to traditional lab-based QoE assessments. Additionally, Konaszyński et al. examine how memory and variability in video quality affect subjective ratings, introducing “measurement points” as critical moments shaping assessments, revealing the negative effect of quality fluctuations, the “last impression effect” whereby improving quality yields higher ratings, and the role of contextual factors, such as the quality of previously viewed videos [
57].
A comprehensive review of video compression and optimization technologies and their impact on video streaming QoE is presented in [
58], focusing on QoE measurement methodologies, major codecs (MPEG, Google, Apple), and future challenges, especially for high-resolution streaming under bandwidth and storage constraints. Crowdsourcing-based QoE evaluation tools and methods are explored in [
1,
2,
59,
60], including Kaleidoscope, a browser-extension platform enabling side-by-side webpage comparisons, and subjective experiments where human participants assess video summaries. These works highlight cost-effective large-scale testing, the role of demographics (e.g., gender) in rating reliability, and statistical validation of crowdsourced VQA outcomes. Objective no-reference quality metrics for consistent video evaluation are further addressed in [
61].
Research on QoE in video streaming highlights the tension between internal and external validity and proposes theoretical models, especially the video QoE model, as tools to clarify assumptions, improve study comparability, and strengthen real-world relevance [
62]. Recent work shifts from traditional subjective ratings toward behavior-based assessment and even direct brain activity measurements, with a focus on realistic user interaction, psychometric function-based analysis, and user-centered, real-time optimization of multimedia services [
63,
64]. Age-related differences in video quality perception appear minimal, as psychometric function fitting and ANOVA showed no significant variation in detection thresholds across three age groups [
65]. In addition, the structure of video presentation—such as content variability, sequence order, and prior clip quality—has been shown to influence subjective ratings, with repeated viewings generally reducing perceived quality [
66].
Recent work highlights the need for user-subjective criteria and externally valid conditions in QoE assessment. Aguilar et al. introduce a no-reference QoE model for video streaming that uses crowdsourcing and the TRIANGLE testbed to efficiently collect diverse user opinions, accounting for network conditions and human preferences [
67]. Wielgus et al. propose an experimental protocol for YouTube QoE that better reflects real user behavior such as searching, pausing, changing resolution, and reading comments, arguing that traditional lab-based video quality tests lack external validity due to restricted interaction and content choice [
68]. Similarly, Cieplinska et al. conduct a longitudinal study to explore how video quality is perceived over time and how it relates to behaviors like service abandonment in realistic usage scenarios [
69]. Crowdsourcing-based studies using the Absolute Category Rating (ACR) scale show that short HD clips rated as “fair” lead to longer response times and reveal contextual biases, for instance due to monitor resolution, while confirming the value of crowdsourcing for collecting heterogeneous feedback [
70]. Complementing these approaches, Wanat et al. propose behavioral experiments that emulate real-world conditions, such as the “Fix Your Netflix” experiment, where participants actively respond to quality degradations; psychometric analysis of these interactions uncovers individual differences in perceived quality [
71].
A study on low-latency adaptive bitrate (LL-ABR) algorithms for HTTP Adaptive Streaming (HAS) evaluates whether reducing end-to-end delay compromises video quality, a key QoE factor in modern video applications [
72]. Another work introduces an application for longitudinal QoE studies that simulates real-life video use and collects daily subjective ratings, offering customizable scheduling, user feedback, device orientation tracking, and instant results [
73]. The COVID-19 pandemic rapidly expanded the use of video consultations between patients and general practitioners, compelling even inexperienced or initially reluctant users to adopt tele-consultations. This widespread uptake creates an opportunity to examine QoE and influencing factors in video consultations [
74].
Crowdsourced subjective video and image quality assessments have been shown to be both effective and reliable under appropriate conditions. Naderi et al. compare three methods: Absolute Category Rating (ACR), ACR with Hidden Reference (ACR-HR), and Comparison Category Rating (CCR) and find that although ACR-HR is faster and cheaper, CCR is more sensitive and better at capturing quality improvements, making it preferable across diverse compression settings and content types [
75]. Saupe et al. report a strong correlation (above 0.96) between crowdsourced DMOS and lab-based MOS, despite limitations in experimental control and preprocessing, indicating that crowdsourcing can provide trustworthy video quality evaluations [
76]. A broader perspective on how crowdsourcing supports vendors, operators, and regulators in assessing QoE for emerging network applications and architectures is presented in [
77], which also outlines key use cases and challenges of crowdsourced network and QoE measurements. Similarly, Ak et al. assess the use of crowdsourcing for evaluating tone mapping operators (TMOs) for HDR images, and show that results from the Prolific platform closely align with controlled lab experiments while offering faster and larger-scale data collection [
27].
Existing outlier detection methods are largely evaluated on synthetic data, highlighting the need for more reliable comparative studies. To address this, the authors present a practical worst-case analysis based on adversarial attacks and propose two low-complexity, robust detection techniques that outperform many conventional methods by explicitly countering such attacks and improving the stability of quality labels [
78]. In related work on digital image quality assessment, Gavrovska et al. propose a no-reference approach that avoids subjective ratings by using data augmentation over various distortions and combining Approximate Entropy (AppE), the Perception Image Quality Evaluator (PIQE), Weibull modeling, and color invariance factors to better align objective metrics with human perception and support more extensive experimental analysis [
79,
80].
3. Methodology
3.1. Experimental Design
The study employed a comparative experimental design to analyze differences in subjective video quality assessment between two distinct environments: (1) a controlled laboratory setting with undergraduate students from AGH University of Krakow, and (2) an uncontrolled online crowdsourcing environment using the Prolific platform.
Both experiments adhered to the ITU-T Recommendations P.910 standard for subjective multimedia evaluations, ensuring methodological consistency and comparability across sessions. The same video sequences, assessment procedures, and quality scales were used in both environments to isolate the influence of environmental factors on user responses and response time dynamics.
In the controlled environment, participants were 32 bachelor’s degree students aged 19–25, all with basic technical literacy and experience with video streaming services. They performed the assessment on pre-calibrated laboratory desktop computers with identical hardware configurations and Full HD (1920 × 1080) monitors. In the uncontrolled environment, participant recruitment was achieved through the Prolific crowdsourcing platform, ensuring demographic diversity across countries, age groups, and educational backgrounds. Only participants meeting the technical criteria—stable network connection (>40 Mbps) and Full HD display resolution—were admitted to the online test.
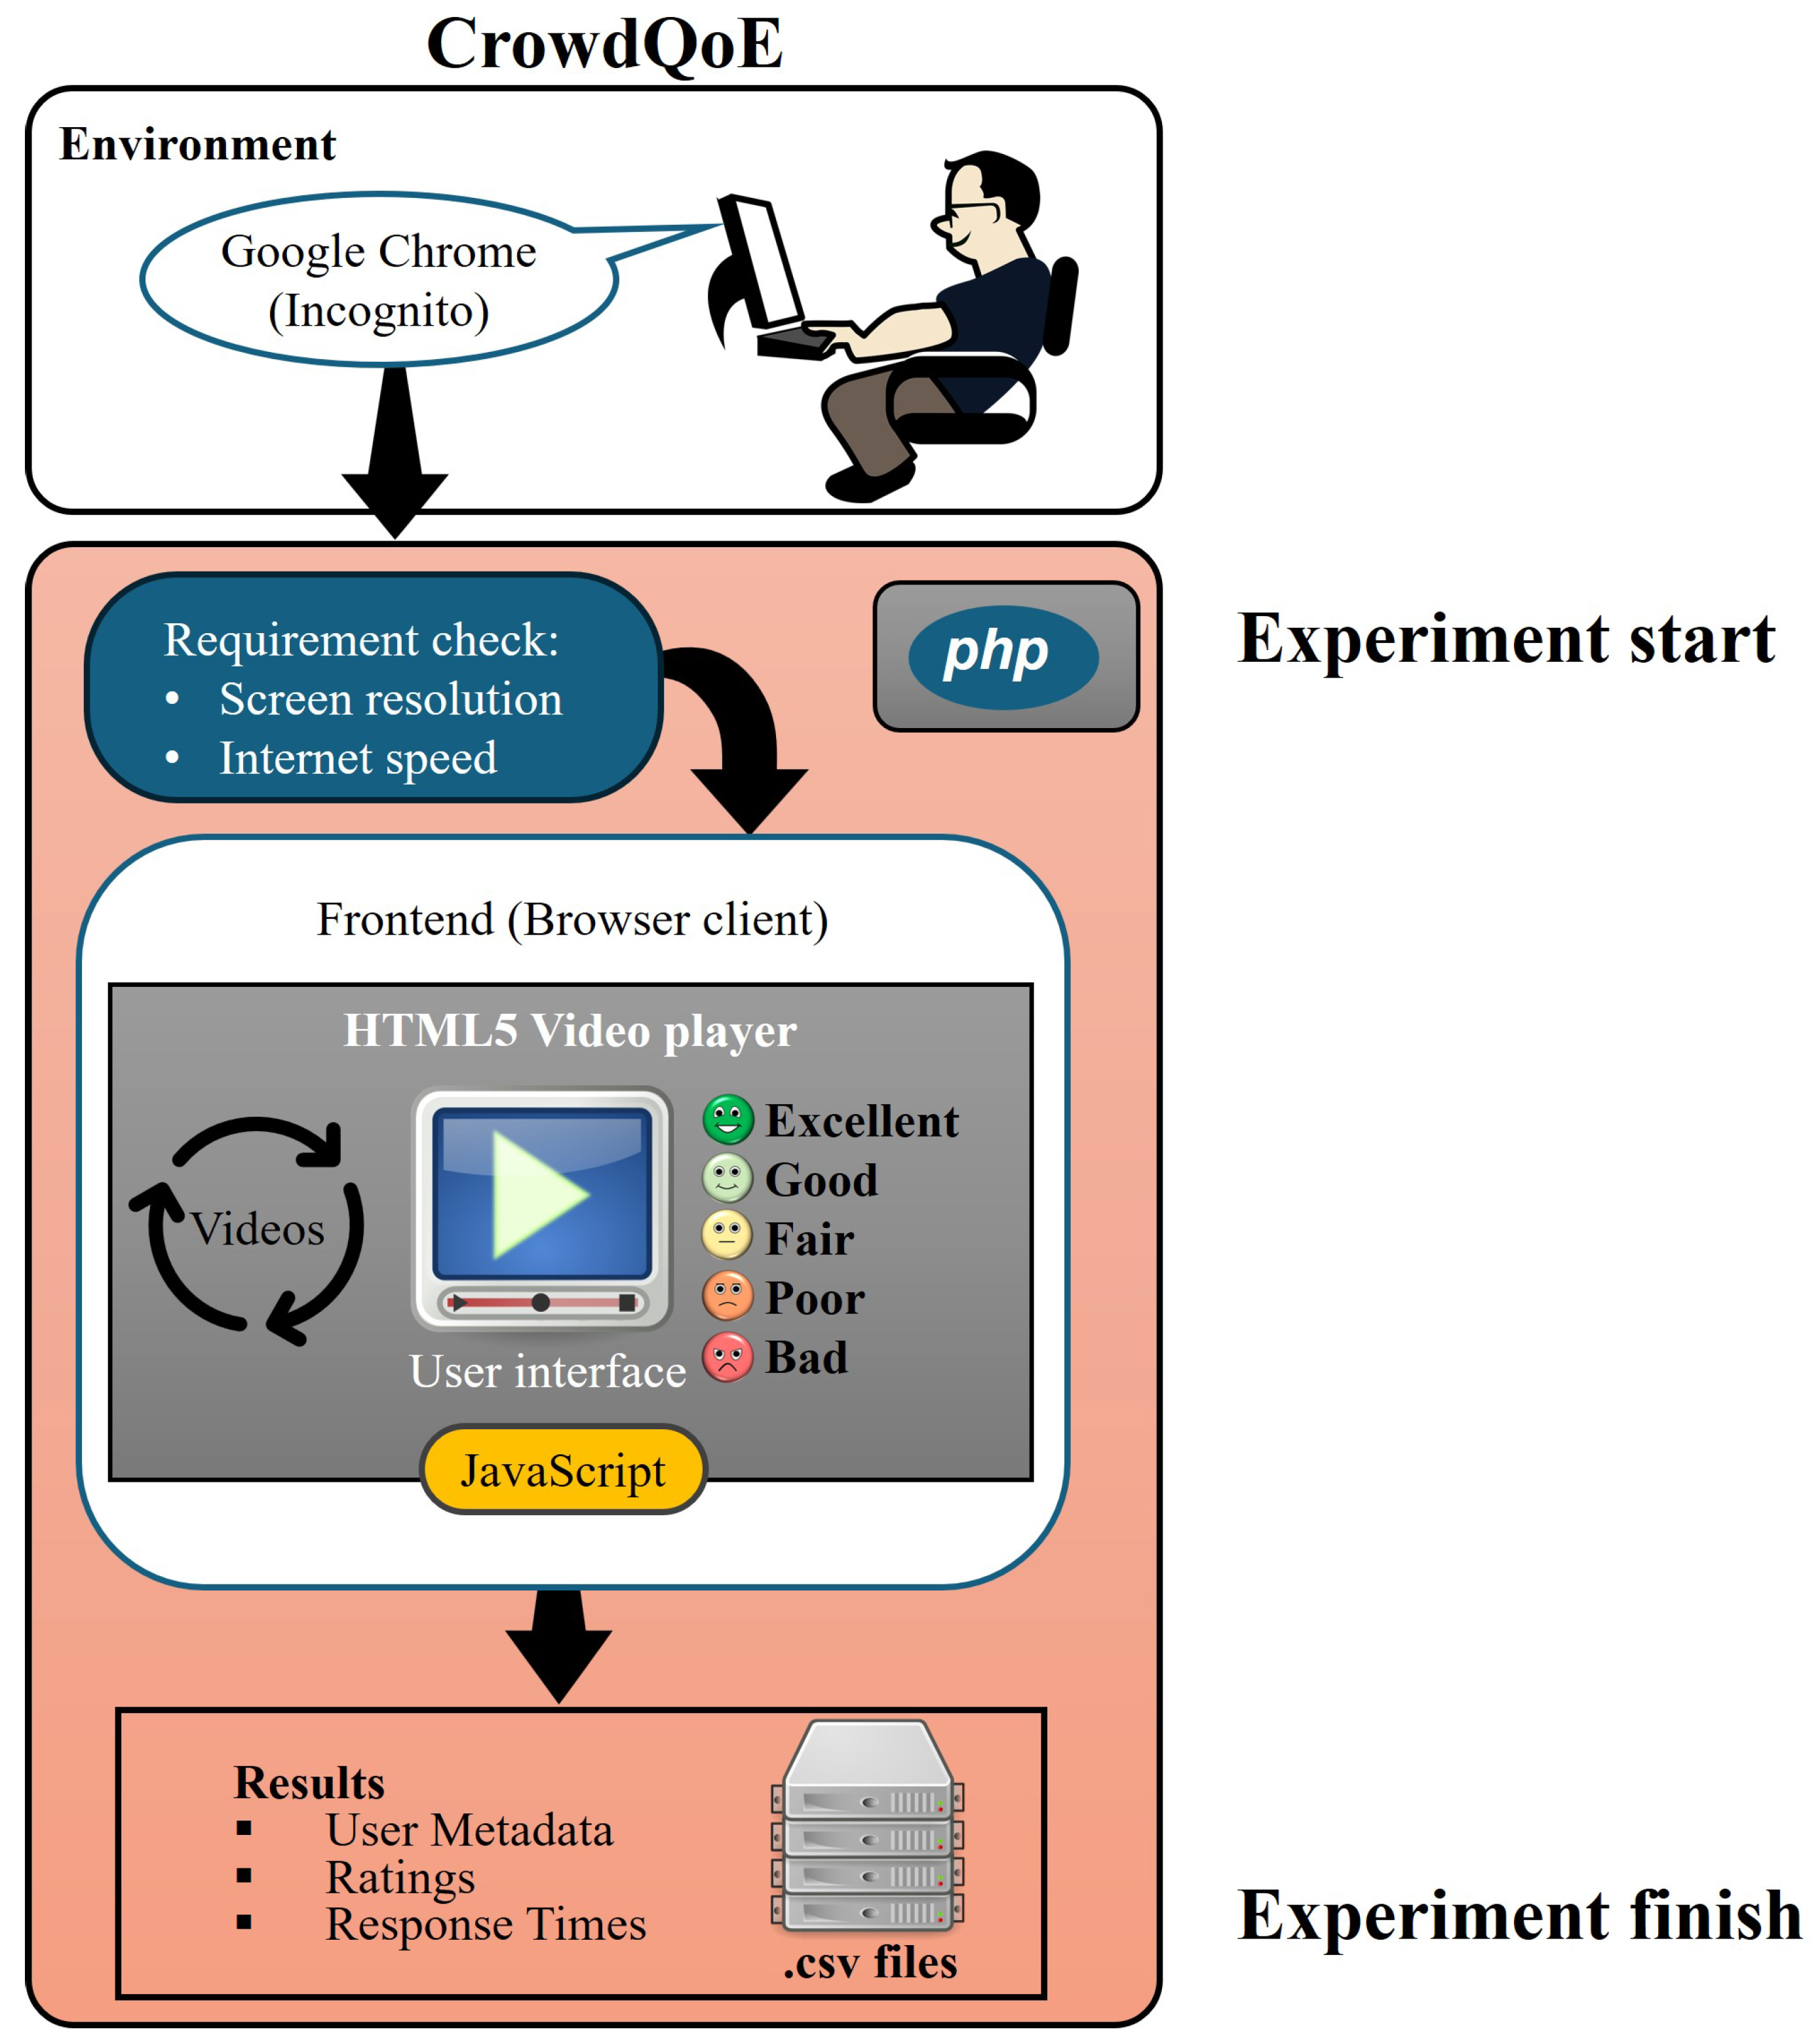
Both experiments utilized the CrowdQoE platform [
81], a web-based system developed in-house using PHP, JavaScript, and HTML, designed for scalable subjective evaluation experiments. Before participation, the system automatically verified browser compatibility, screen resolution, and internet speed. Users failed verification if their resolution dropped below the Full HD threshold or their download speed was insufficient. All interactions, including video playback and rating submissions, were automatically logged with millisecond precision to capture response time after each video clip.
Database A contains 26 unique full HD short video clips and 20 unique full HD long videos, which are processed to create 60 short test videos and 20 long test videos, all exhibiting time-varying quality. In the experiment, each of the 80 videos is shown in a randomized order. In a similar manner, Database B is built from 26 full HD short clips taken from the same source material as Database A. The clips in Database B are encoded to preserve a constant quality level throughout playback. In total, 40 high-quality videos are generated for testing. During the test, each is shown 3 times, arranged in a pseudo-random sequence, yielding 120 video presentations to the participants. The quality levels are regulated by modifying the bitrate and compression settings. The derived clips represented five quality levels: Excellent, Good, Fair, Poor, and Bad, generated by adjusting parameters such as bitrate, quantization, and compression ratio. All videos shared identical content durations (20–60 s) and visual categories to maintain uniform cognitive demand. To eliminate any effect of auditory cues, all audio tracks are intentionally removed from the videos. The inclusion of both content types was a deliberate methodological decision. Database B (stable quality) serves as a cognitively minimal baseline, allowing participants to deliver immediate perceptual judgments without temporal integration, thereby isolating the effect of the evaluation environment from task cognitive complexity. Database A (time-varying quality), by contrast, requires continuous integration of fluctuating quality levels, a process referred to as temporal pooling. This juxtaposition allows the study to identify the boundary conditions of crowdsourcing validity as a function of cognitive demand, which constitutes the primary methodological finding of this work. The complete datasets, including all video sequences and associated metadata, are publicly available via the CrowdQoE-2025 repository [
81] to which interested readers are directed for full dataset documentation and reproducibility purposes.
Participants were instructed to watch each video in full-screen mode (F11) and evaluate its perceived visual quality using a 5-point Absolute Category Rating (ACR) scale: Excellent, Good, Fair, Poor, or Bad. After each video, the evaluation interface appeared automatically, and participants had to select a score before proceeding to the next clip. The response time (in milliseconds) was recorded as the interval between the display of the evaluation page and the submission of the rating.
3.2. Environment Protocol
In the laboratory experiment, the controlled setting was standardized to remove potential confounding factors. All participants: Used the same AGH laboratory computers and network infrastructure, completed the tasks individually under supervision, worked in quiet rooms with regulated lighting conditions, and were instructed not to multitask or run other applications during the sessions. Each session lasted about 50 to 55 min to keep the cognitive load manageable.
In the Prolific-based experiment, participants accessed the platform on their personal computers in natural, uncontrolled environments. They followed on-screen instructions to ensure browser and display compliance, yet differences in ambient light, task focus, and system performance introduced inevitable variability. This phase captured the external reality of web-based subjective QoE testing.
3.3. Data Collection and Analysis
The main data collected comprised ACR rating scores (ordinal, on a 1–5 scale), response times (continuous, measured in milliseconds), and a set of demographic and contextual variables, including gender, age, education, country, and self-reported mood and fatigue.
In the post-processing phase, outlier responses were detected and removed using modified z-scores and Pearson correlation thresholds (), in line with the reliability criteria specified in ITU-T P.910. Subsequent comparative statistical analysis considered the distributions of ratings and response times, applied two-sample Kolmogorov–Smirnov and Mann–Whitney U tests to examine differences between environments, and employed a Linear Mixed-Effects Model (LMM).
All statistical analyses were conducted using Python 3.14.1 (SciPy) and MATLAB R2025a.
3.4. Research Objectives
The methodological strategy aimed to:
Quantify differences in rating reliability and response time distributions between controlled and uncontrolled environments;
Determine whether increased control reduces variability without compromising external realism;
Identify potential cognitive load indicators manifested through response time behavior across both setups.
This approach enables a rigorously controlled yet externally valid comparison, advancing the understanding of environmental effects in crowdsourced Quality-of -Experience assessments.
3.5. Uncontrolled Environment: Prolific Study Deployment
The uncontrolled component of the experiment was conducted through the Prolific online crowdsourcing platform, which enabled the recruitment of geographically diverse participants and allowed data collection under naturalistic conditions. The study was configured as an external web-based experiment hosted on the AGH University of Krakow server and accessed via Prolific, ensuring institutional control over data storage while leveraging Prolific’s recruitment and screening infrastructure.
3.5.1. Study Configuration on Prolific
The study was developed using the Survey Builder feature of Prolific, facilitating integration with an external experimental platform instead of utilizing an internal Prolific questionnaire. The data collecting method was classified as a Survey, accompanied by a clear and detailed Study Label presented to participants before enrollment. The study mandated completion on a desktop computer, while mobile devices and tablets were excluded due to variability in display resolution and probable performance errors that could distort judgments of video quality is shown in
Figure 1. No content notice was issued, as the study materials included neither explicit nor sensitive content. Participants were consequently provided with a neutral research description devoid of supplementary ethical or psychological guidance.
3.5.2. External Platform and URL Integration
Participants accessed the experiment through a dedicated university-hosted URL:
https://s.agh.edu.pl/kI0GC (accessed on 8 March 2026).
This link guided participants to the internal CrowdQoE platform, where all experimental protocols, video presentations, and data logging were administered. The incorporation of dynamic Prolific characteristics facilitated traceability between Prolific demographic records and experimental submissions while safeguarding personally identifying information. The study was designed without limitations on concurrent access, permitting any number of individuals to join simultaneously. The decision was warranted by the resilience of the university server and the streamlined design of the web-based interface.
3.5.3. Prolific ID Recording
To ensure accurate correspondence between Prolific records and the experimental data, participant identifiers were transmitted via URL parameters. Specifically, PROLIFIC_PID recorded each participant’s distinct Prolific ID, STUDY_ID linked their responses to the relevant experiment, and SESSION_ID designated each unique participation instance. The identifiers were securely retained in the databases of both CrowdQoE and Prolific systems, utilized solely for validation, exclusion verification, and payment processing.
3.5.4. Screening and Eligibility Criteria
No customized screening completion pathway was established on Prolific. Eligibility was determined using Prolific’s normal screening procedures in conjunction with automated technical checks embedded in the CrowdQoE platform. Participants were required to be proficient in English, possess a desktop computer with a Full HD (1920 × 1080) monitor, maintain a reliable internet connection with a minimum download speed of 40 Mbps, and not have previously engaged in relevant QoE studies. The recruitment aimed at a substantial, internationally diversified cohort, encompassing participants from the United Kingdom, United States, Ireland, Germany, France, and various other nations. This method enhanced demographic diversity and bolstered the external validity of the findings.
3.5.5. Participant Recruitment and Sample
The Prolific cohort deliberately imposed no restrictions on age, educational background, or professional expertise, yielding a demographically heterogeneous sample across multiple countries. This is an intentional and valued feature of the uncontrolled crowdsourcing design, reflecting the natural diversity of a real-world participant pool and maximizing the external validity of findings from the uncontrolled environment. The intended sample size was 80 people. Out of these, 25 and 36 participants completed the survey and were included in the analysis, 5 were excluded for noncompliance with instructions, and 49 were automatically disqualified due to technical validation issues (insufficient internet speed or inadequate display resolution). The final authorized sample had both male and female participants in about equal numbers, indicating a balanced demographic distribution. It is noted that the admitted sample of 25 participants for Database A (uncontrolled) falls below the minimum of 35 specified in ITU-T P.910 Section 10.1 for uncontrolled subjective experiments. This shortfall was a direct consequence of the stringent automated technical validation criteria applied by the CrowdQoE platform. However, as demonstrated in
Section 5.6.1, the subsequent Leave-One-Out (LOO) consistency screening produced a rejection rate of 92.0% for this cohort, resulting in only 2 valid subjects. This extreme attrition rendered the crowdsourced Database A dataset unsuitable for inferential statistical comparison, and it was therefore considered to be a pilot study and excluded from all further analysis. Consequently, the shortfall below the P.910 minimum had no bearing on the validity of the reported statistical findings. The core controlled-versus-uncontrolled comparison was conducted on Database B (stable content), where the uncontrolled environment yielded 36 initial participants and 32 valid subjects after LOO screening, comfortably exceeding the P.910 requirement.
3.5.6. Completion and Payment Procedure
After concluding the experiment, participants were instructed to return to Prolific via the standard completion route and input a confirmation code. Submissions underwent thorough inspection prior to approval to guarantee data integrity, technological compliance, and complete participation. The anticipated study time was 50 min, and participants received £ 9.00 per hour, which Prolific deemed a reasonable and competitive remuneration level.
3.5.7. Technical Validation and Data Integrity
Prior to commencing the video assessment, all participants underwent an automatic screening on the CrowdQoE platform to verify the use of a compatible web browser (preferably Google Chrome), a minimum screen resolution of 1920 × 1080, an internet connection with a download speed of no less than 40 Mbps, and access via a desktop computer, as mobile devices were prohibited. The internet connection speed was verified in real time by measuring the download time of a dedicated test payload file hosted on the AGH university server, ensuring that the measurement reflected actual network performance rather than self-reported values. Screen resolution compliance was verified using JavaScript properties that report the physical display resolution of the participant’s device. Participants failing either check were immediately and automatically redirected to a disqualification page and excluded from the study without consequences, prior to any exposure to the experimental stimuli. Participants who failed to meet any of the criteria were automatically excluded from the study without consequences. Response data, timestamps, and system logs were securely archived in a database, facilitating comprehensive temporal analysis and thorough post hoc reliability assessments, in accordance with ITU-T P.910. The Prolific-based, uncontrolled environment maintained essential experimental criteria while allowing for natural variability in user situations, rendering it appropriate for comparison with the controlled laboratory setup.
4. Experiments
4.1. Hardware Configuration
The experiments were conducted using two distinct hardware setups to represent the controlled and uncontrolled testing environments.
In the controlled laboratory environment, assessments were conducted in the multimedia laboratory at AGH University of Krakow. All participants used identically configured laboratory computers equipped with Intel Core i5 processors, 8 GB RAM, integrated Intel UHD Graphics, and 23-inch Full HD (1920 × 1080) monitors. Each station was connected via a wired 1 Gbps local network, ensuring consistent transmission quality. Room lighting and seating positions were standardized to maintain visual uniformity and reduce reflections or glare.
For comparison, the uncontrolled environment involved participants using their personal computers and network connections to access the same CrowdQoE platform via the Prolific website. The system automatically verified that only users with Full HD displays and a minimum download speed of 40 Mbps could proceed to the test. This verification step was essential for ensuring a comparable baseline quality of visual stimuli despite environmental variability.
4.2. Software Environment
Both experiments were conducted using the custom-built CrowdQoE platform, implemented in PHP, JavaScript, and HTML for internal data handling. The platform incorporated system validation scripts to verify browser compatibility, screen resolution, and internet connection speed; automated redirection mechanisms to exclude participants who did not satisfy the prerequisites; randomization procedures to determine the order in which videos were shown, thereby reducing order-related bias; and response logging modules that recorded user interactions with millisecond-accurate timestamps. Participants accessed the platform using the latest version of Google Chrome in Incognito mode, as recommended on the introduction page, which served a dual purpose: it helped reduce cache-related interference and limit the impact of prior browser performance differences, while simultaneously protecting participant anonymity by preventing the browser from retaining any session data, cookies, or locally stored activity, an aspect of increasing relevance in crowdsourcing studies involving human participants.
4.3. Experimental Procedure
Both groups completed the same testing procedure. First, during the Introduction & Verification phase, participants read the instructions, conducted browser and hardware checks, and provided informed consent. Next, they completed a brief demographic questionnaire covering age, gender, education, current mood (positive/neutral/negative), and fatigue level. They then proceeded to the viewing session, during which each participant watched a randomly ordered set of video clips to minimize learning effects and bias. After each clip, they performed a rating task evaluating perceived video quality on a 5-point Absolute Category Rating (ACR) scale from 1 (Bad) to 5 (Excellent). At the same time, the system automatically recorded the response time, defined as the interval in milliseconds between the appearance of the rating page and the submission of the participant’s response. At the end of the assessment, a completion message confirmed that the session had successfully finished.
In the laboratory environment, an experiment supervisor monitored participants to ensure that all instructions were followed and that they did not multitask, switch windows, or change browser tabs. Participants were offered short breaks roughly every 55 min to alleviate fatigue.
By contrast, the Prolific participants carried out the same procedure independently, without direct supervision, and under diverse, uncontrolled conditions.
4.4. Data Logging and Monitoring
All interaction-related information, including system diagnostics, demographic inputs, timestamps, and ACR scores, was securely retained in the platform’s database. To further ensure data reliability:
Millisecond-accurate response times for each clip were captured with a JavaScript event timer. Unique Session_ID codes preserved anonymity while allowing data tracking. Real-time synchronization automatically excluded incomplete or interrupted sessions.
Extensive system logging facilitated the identification of irregularities such as implausibly short response times (under 200 ms), thereby supporting subsequent outlier detection and analysis in line with ITU-T P.910 and established statistical quality assurance practices.
4.5. Environmental Control Summary
This setup ensured identical experimental logic and interface across both conditions while isolating environmental control as the primary variable of interest. The combination of rigorous software validation and procedural symmetry provided a robust framework for comparing laboratory reliability with real-world diversity in subjective video quality assessment (
Table 1).
5. Results
5.1. Analysis of Raw Data
The experimental study is conducted under two distinct configurations: a controlled laboratory environment and an uncontrolled situation. The session showcases participants’ subjective evaluations of individual video sequences classified in Database A and Database B. Database A contains video content with dynamically fluctuating quality levels, while Database B includes videos with consistent, stable quality throughout their entirety.
Table 2 summarizes the overall number of participants in the study and the average number of movies assessed per participant in each condition.
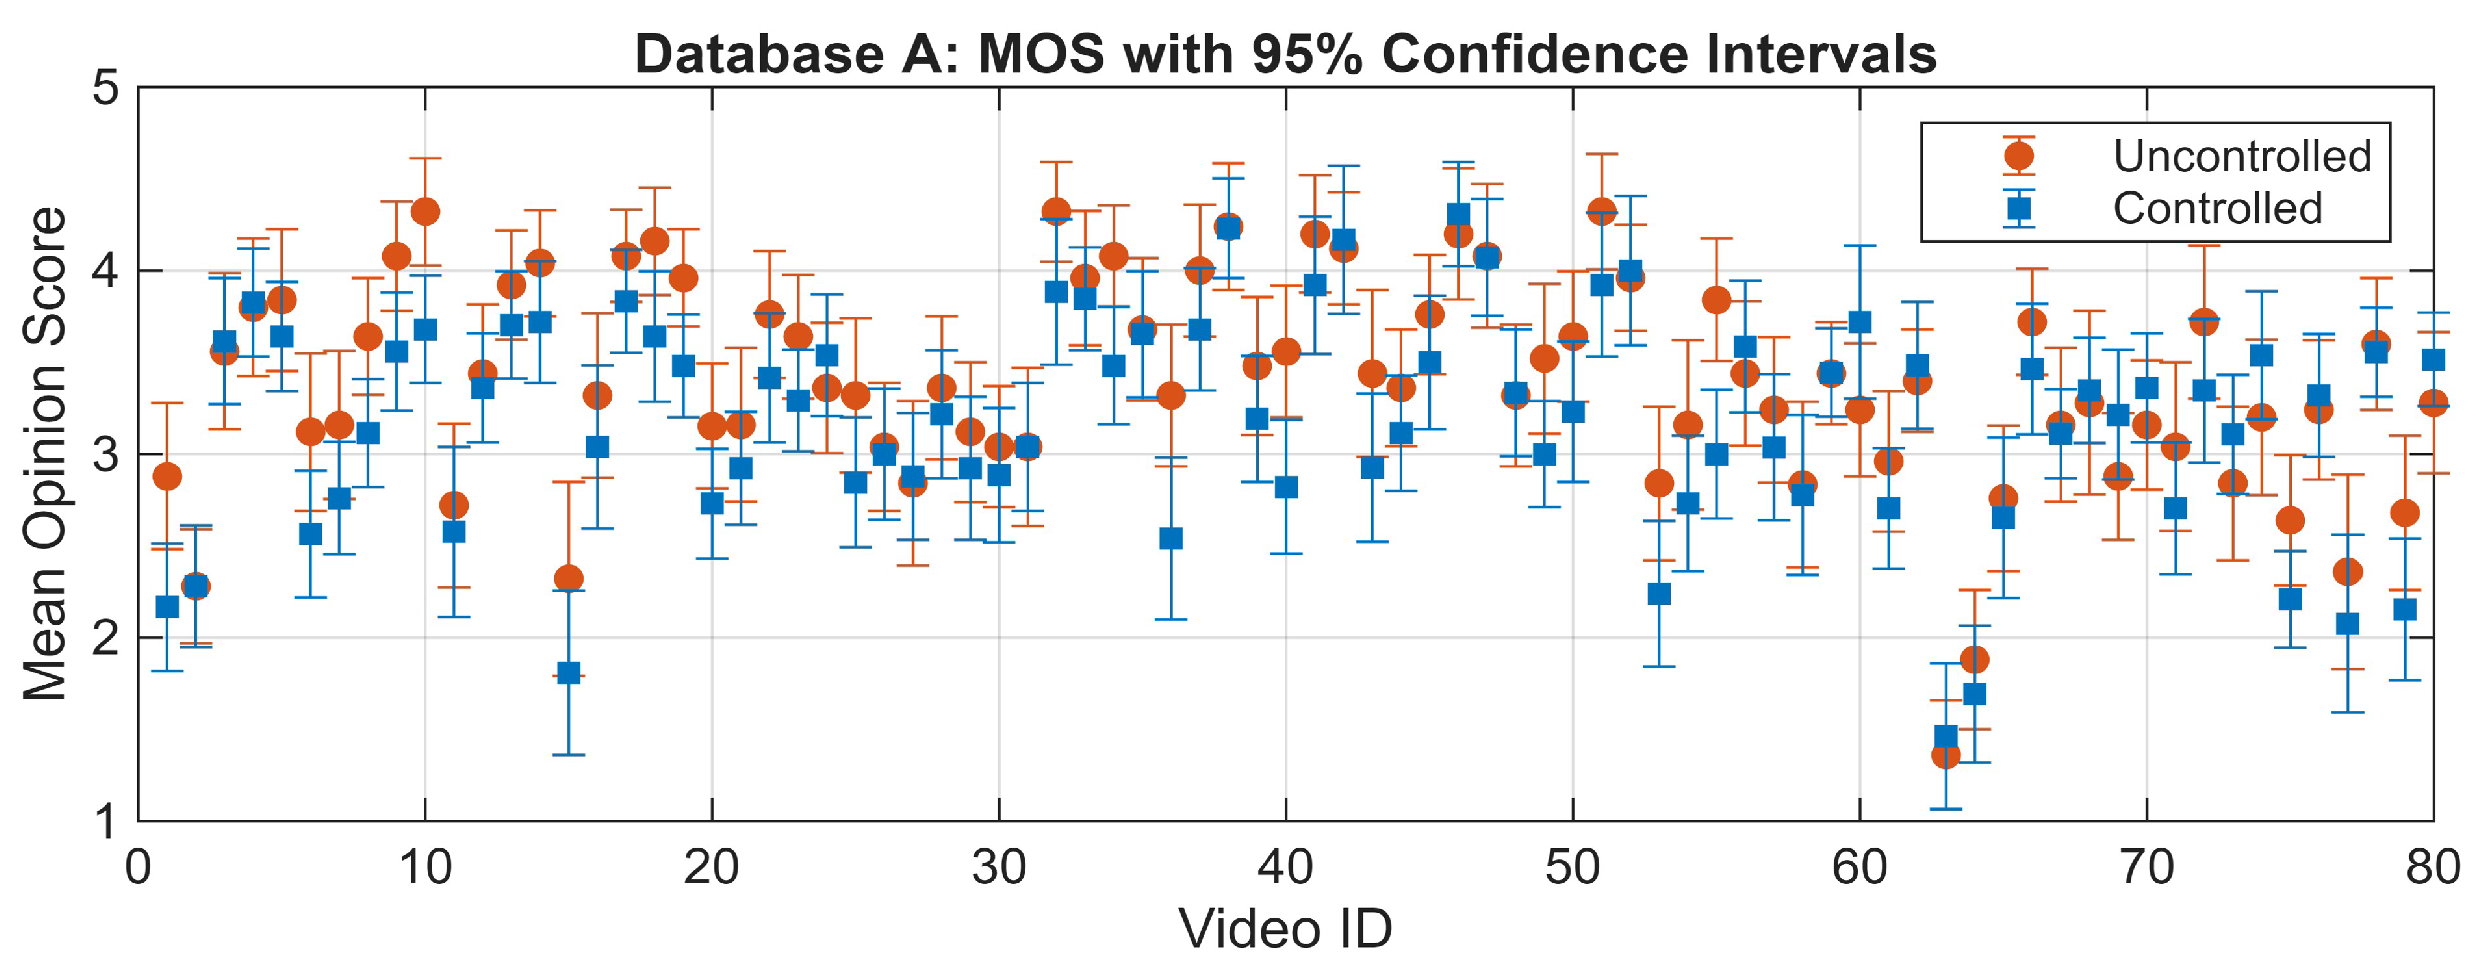
The distribution of the Mean Opinion Score (MOS) per film for database A under both controlled and uncontrolled conditions is shown in
Figure 2. The computed confidence interval, which shows the likely range of the MOS values with a 95% confidence level, is represented by the shaded area. Additionally, for both the controlled and uncontrolled setups of database A,
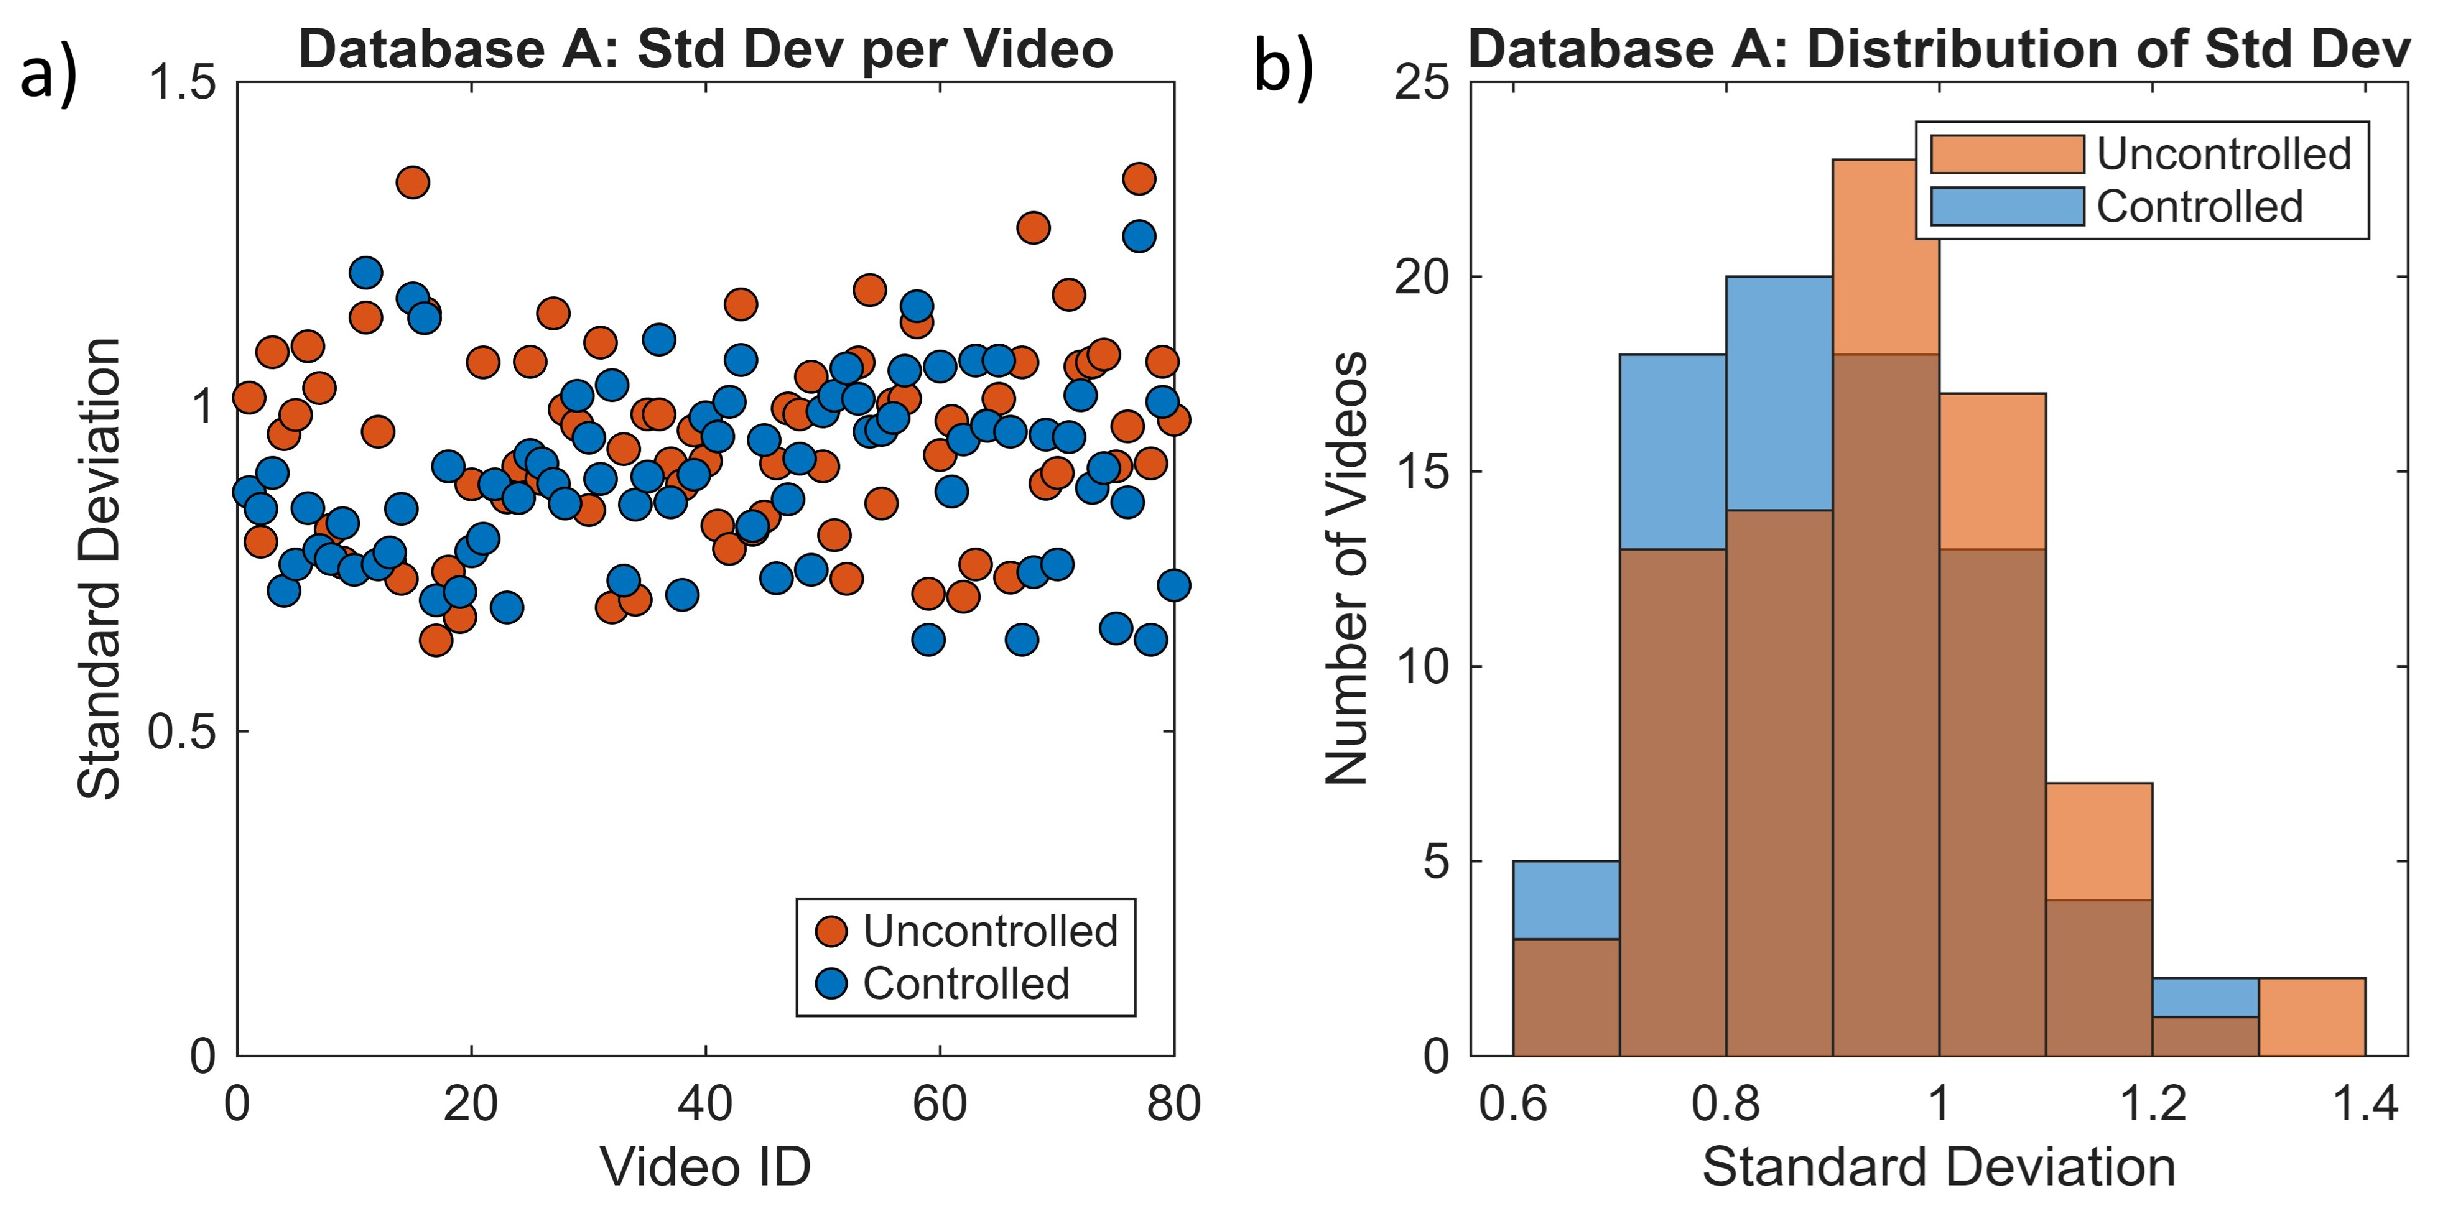
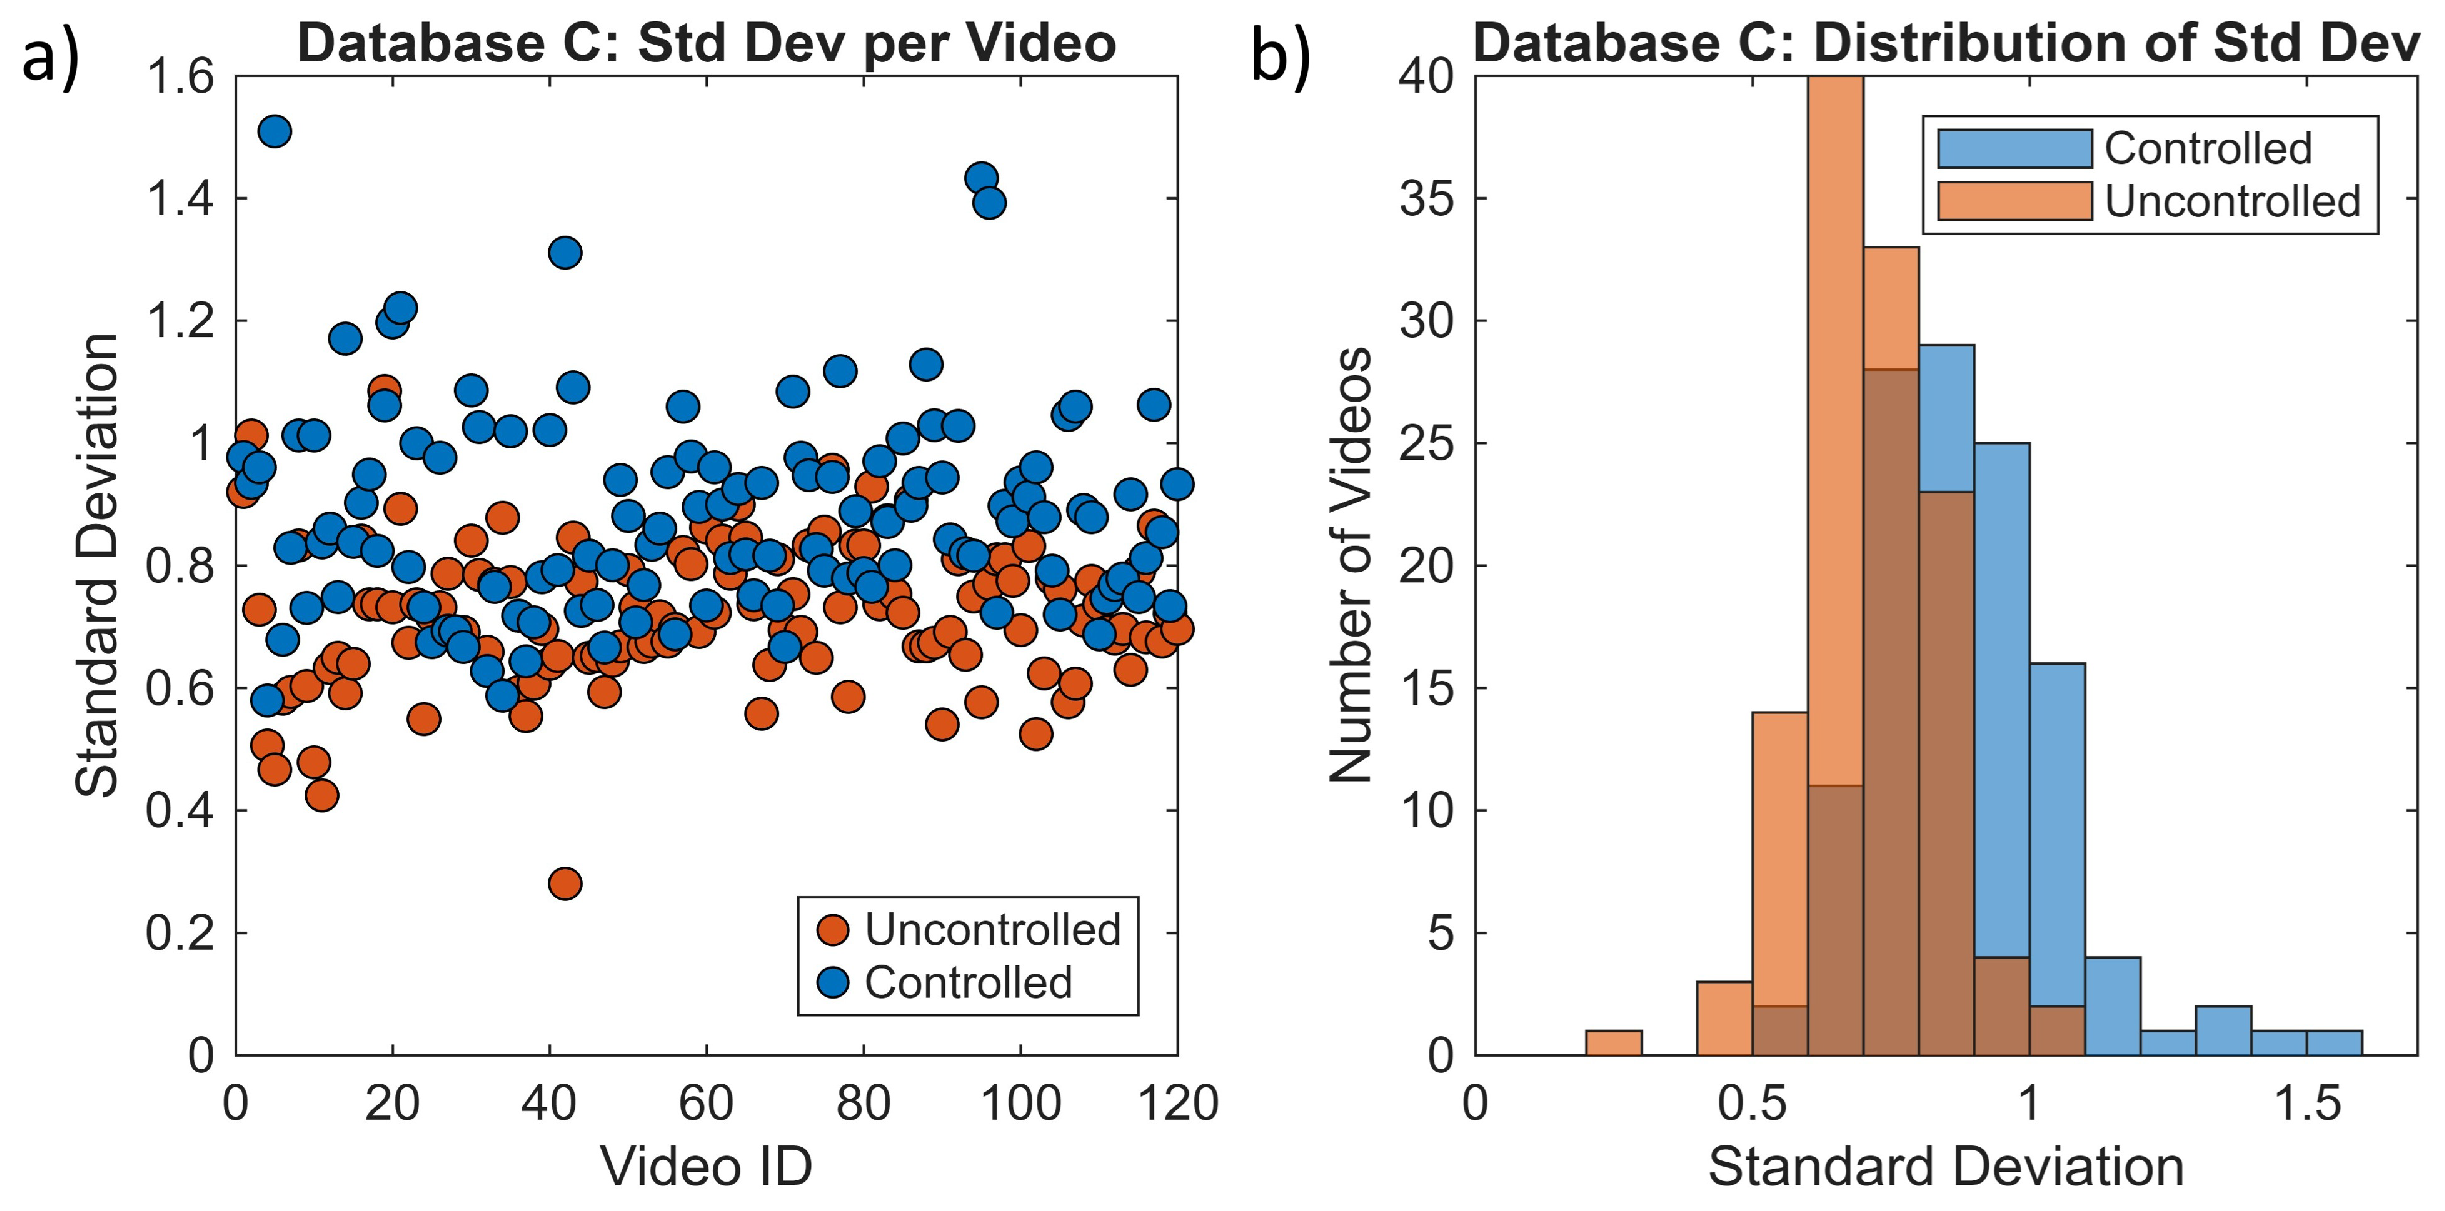
Figure 3 displays the statistically calculated standard deviation of the MOS for every video and frequency histograms that show how many videos fall within specific variability ranges. When taken as a whole, these numbers describe both the subjective scores’ central tendency and their variability in various experimental contexts.
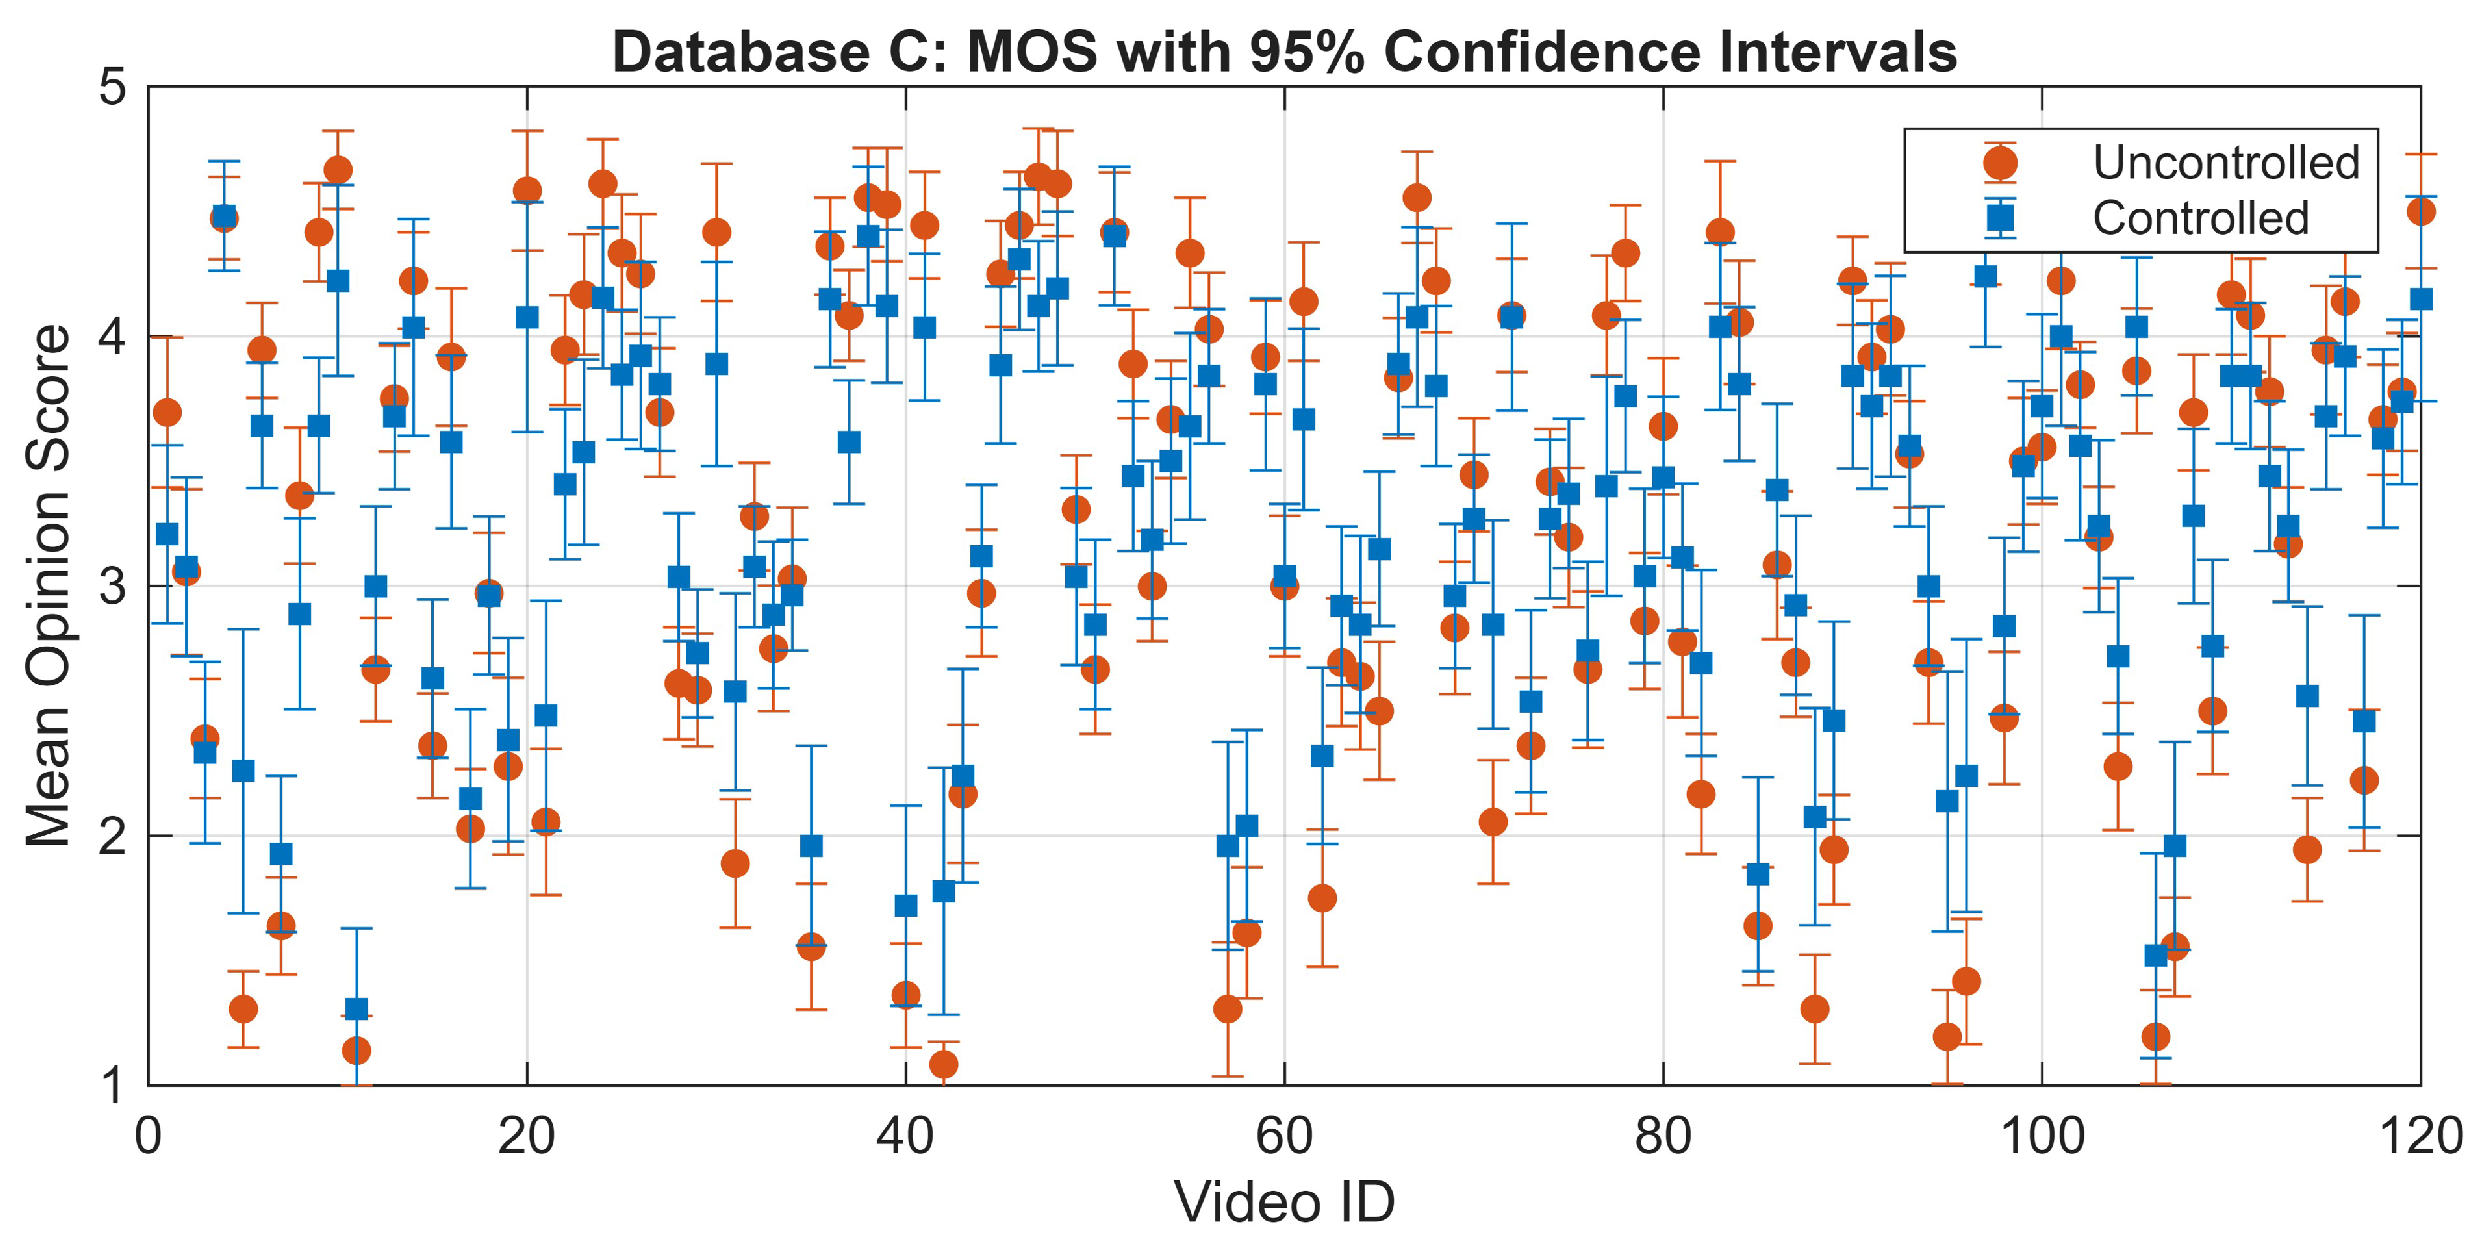
In a similar manner, the distribution of MOS for videos in Database B, under both controlled and uncontrolled experimental conditions, is illustrated in
Figure 4. Furthermore, the corresponding standard deviation values associated with these MOS scores are depicted in
Figure 5, providing additional insight into the variability of subjective quality assessments.
The dataset must be pre-processed to remove replies that are thought to be unreliable before any further statistical studies can be carried out. In order to prevent ratings from being skewed by people who were confused, distracted, insufficiently engaged, or subjected to excessive cognitive demands during the experiment, this data-cleaning step is crucial to ensuring that the resulting analyses primarily capture the behavior of participants who provided coherent and stable judgments. By doing this, the empirical results’ interpretability and integrity are significantly enhanced.
A methodical, correlation-based process is used to identify and eliminate unreliable participants in accordance with the ITU-T’s standards. Specifically, the primary quantitative metric for evaluating the internal consistency and dependability of each participant’s MOS is Pearson’s correlation coefficient. A correlation value of 0.75 is frequently used as the bottom bound for acceptable reliability in this context. Individual correlation values below this cutoff are used to categorize participants as inconsistent raters, and their data is eliminated from all subsequent phases of research. This process reduces the impact of unpredictable or noise-dominated assessments on the total MOS and any inferred statistical findings.
All experimental data gathered under both controlled and uncontrolled testing conditions—corresponding to the A and B databases, respectively—are subjected to the same reliability filter in the same way. The methodology encourages comparability between circumstances and improves the overall findings’ robustness, repeatability, and external validity by applying a consistent exclusion criterion across these two experimental contexts.
5.2. Dataset Reliability and Subject Validation
A two-stage screening procedure that complied with ITU-R BT.500 Recommendations was used to strictly ensure data integrity. The final valid dataset included
subjects for the Time-Varying dataset (Database A) and
subjects for the Stable dataset (Database B) after incomplete sessions (95% completion threshold) and inconsistent raters (Leave-One-Out correlation screening with
) were eliminated. A thorough analysis of the participant retention data is shown in
Table 3, which emphasizes the significant difference in rejection rates between the stable and time-varying settings in the controlled environment.
The dependability of the gathered data was verified by post hoc psychometric validation, even with the smaller sample size for the time-varying cohort. Internal consistency analysis produced Cronbach’s values of 0.81 for Database A and 0.94 for Database B, both of which were higher above the suggested cutoff point of 0.70 for subjective QoE research.
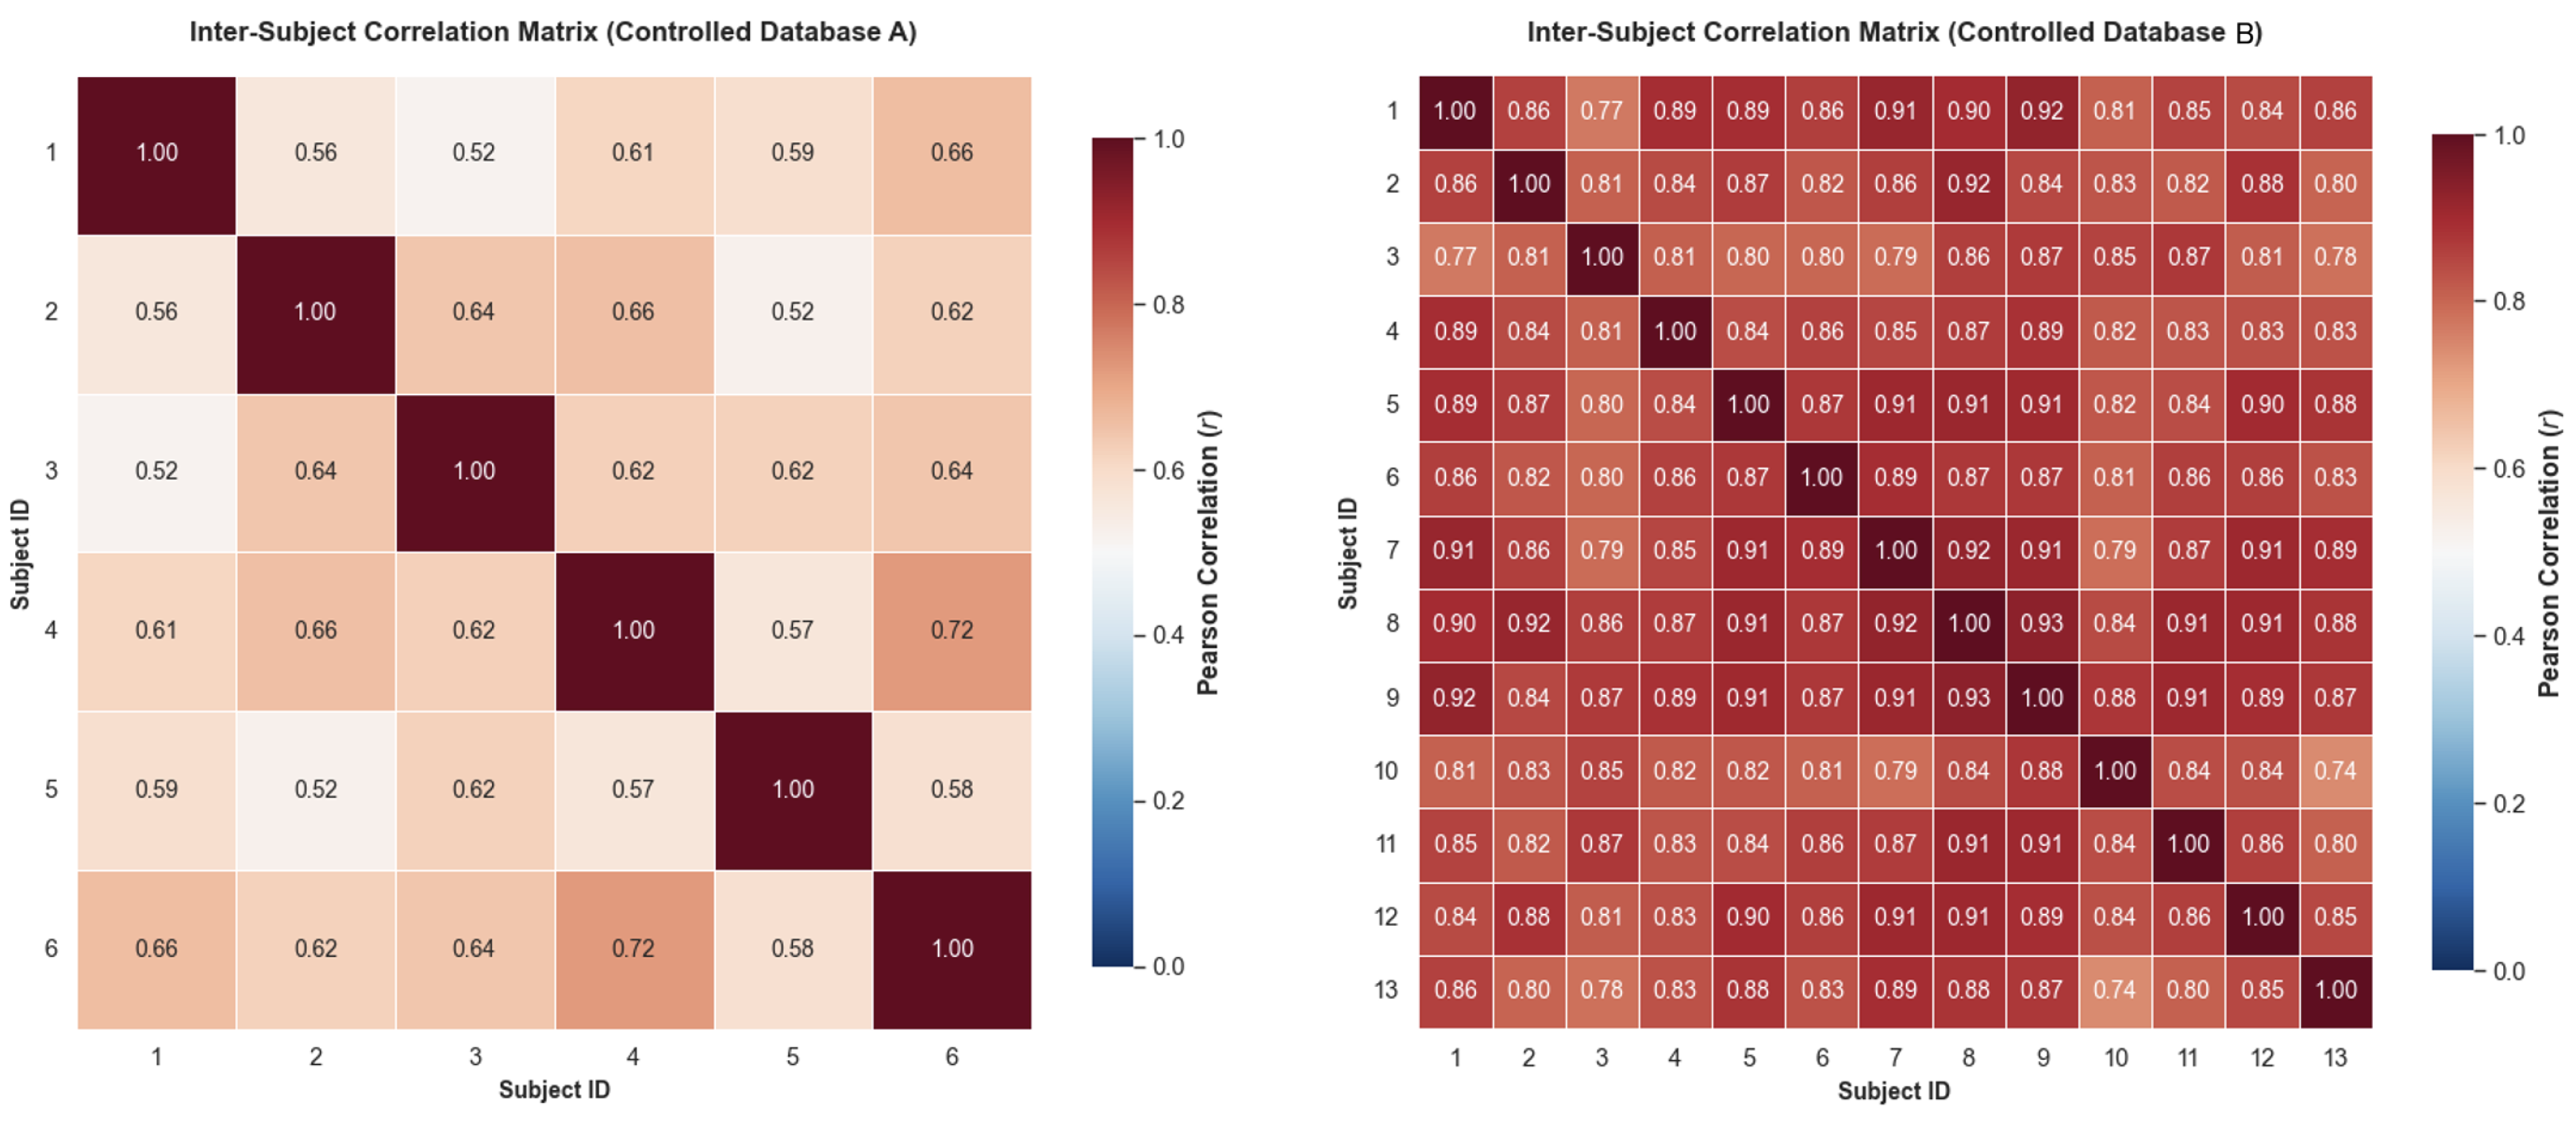
The inter-subject correlation matrices shown in
Figure 6 show consistent pairwise agreement between the individuals that were kept. Additionally, a Shapiro–Wilk test verified that Database A (
) and Database B (
) Mean Opinion Scores (MOS) have a normal distribution.
These metrics confirm that the retained subjects formed a cohesive measurement instrument capable of reliably assessing both stable and temporally complex video distortions.
5.3. Impact of Temporal Complexity on Quality Ratings
Investigating if the temporal variation in video quality causes a systematic bias in subjective judgments was the main goal. Subject ID was treated as a random intercept to account for individual rating baselines, and we used a Linear Mixed-Effects Model (LMM) to predict Score depending on Content Type (Time-Varying vs. Stable).
There was no statistically significant impact of content type on the final quality ratings, according to the analysis (
,
,
). The observed difference in raw MOS was perceptually insignificant (Database A:
; Database B:
), as shown in
Table 4. We computed the effect size, which was determined to be insignificant (Cohen’s
) in order to confirm that this null result was not an artifact of low statistical power. Additionally, for both datasets, strong bootstrapping (1000 resamples) produced overlapping 95% confidence intervals. These findings show that people incorporate different quality into a final score in a controlled setting that is statistically comparable to steady information of similar average quality.
We conducted a bootstrapping validation (1000 resamples) to ascertain the robustness of this null conclusion. The ratings are statistically indistinguishable since the 95% bootstrapped confidence intervals for Database A [, ] and Database B [, ] overlap. Moreover, despite the constrained sample size diminishing statistical power, the effect size observed was negligible (Cohen’s ), suggesting that genuine similarity, rather than a Type II error, accounts for the absence of statistical significance.
5.4. Cognitive Load and Reaction Time Analysis
The implicit behavioral measurements exhibited significant fluctuations, but the explicit quality ratings (MOS) remained unchanged. We utilized a physiologically validated filter to exclude anticipatory reflexes (less than 200 ms) and attentional lapses (more than 10,000 ms) to analyze Voting Reaction Time (ms) as a proxy for cognitive burden. A statistically significant difference in processing time (
) was identified using a Mann–Whitney
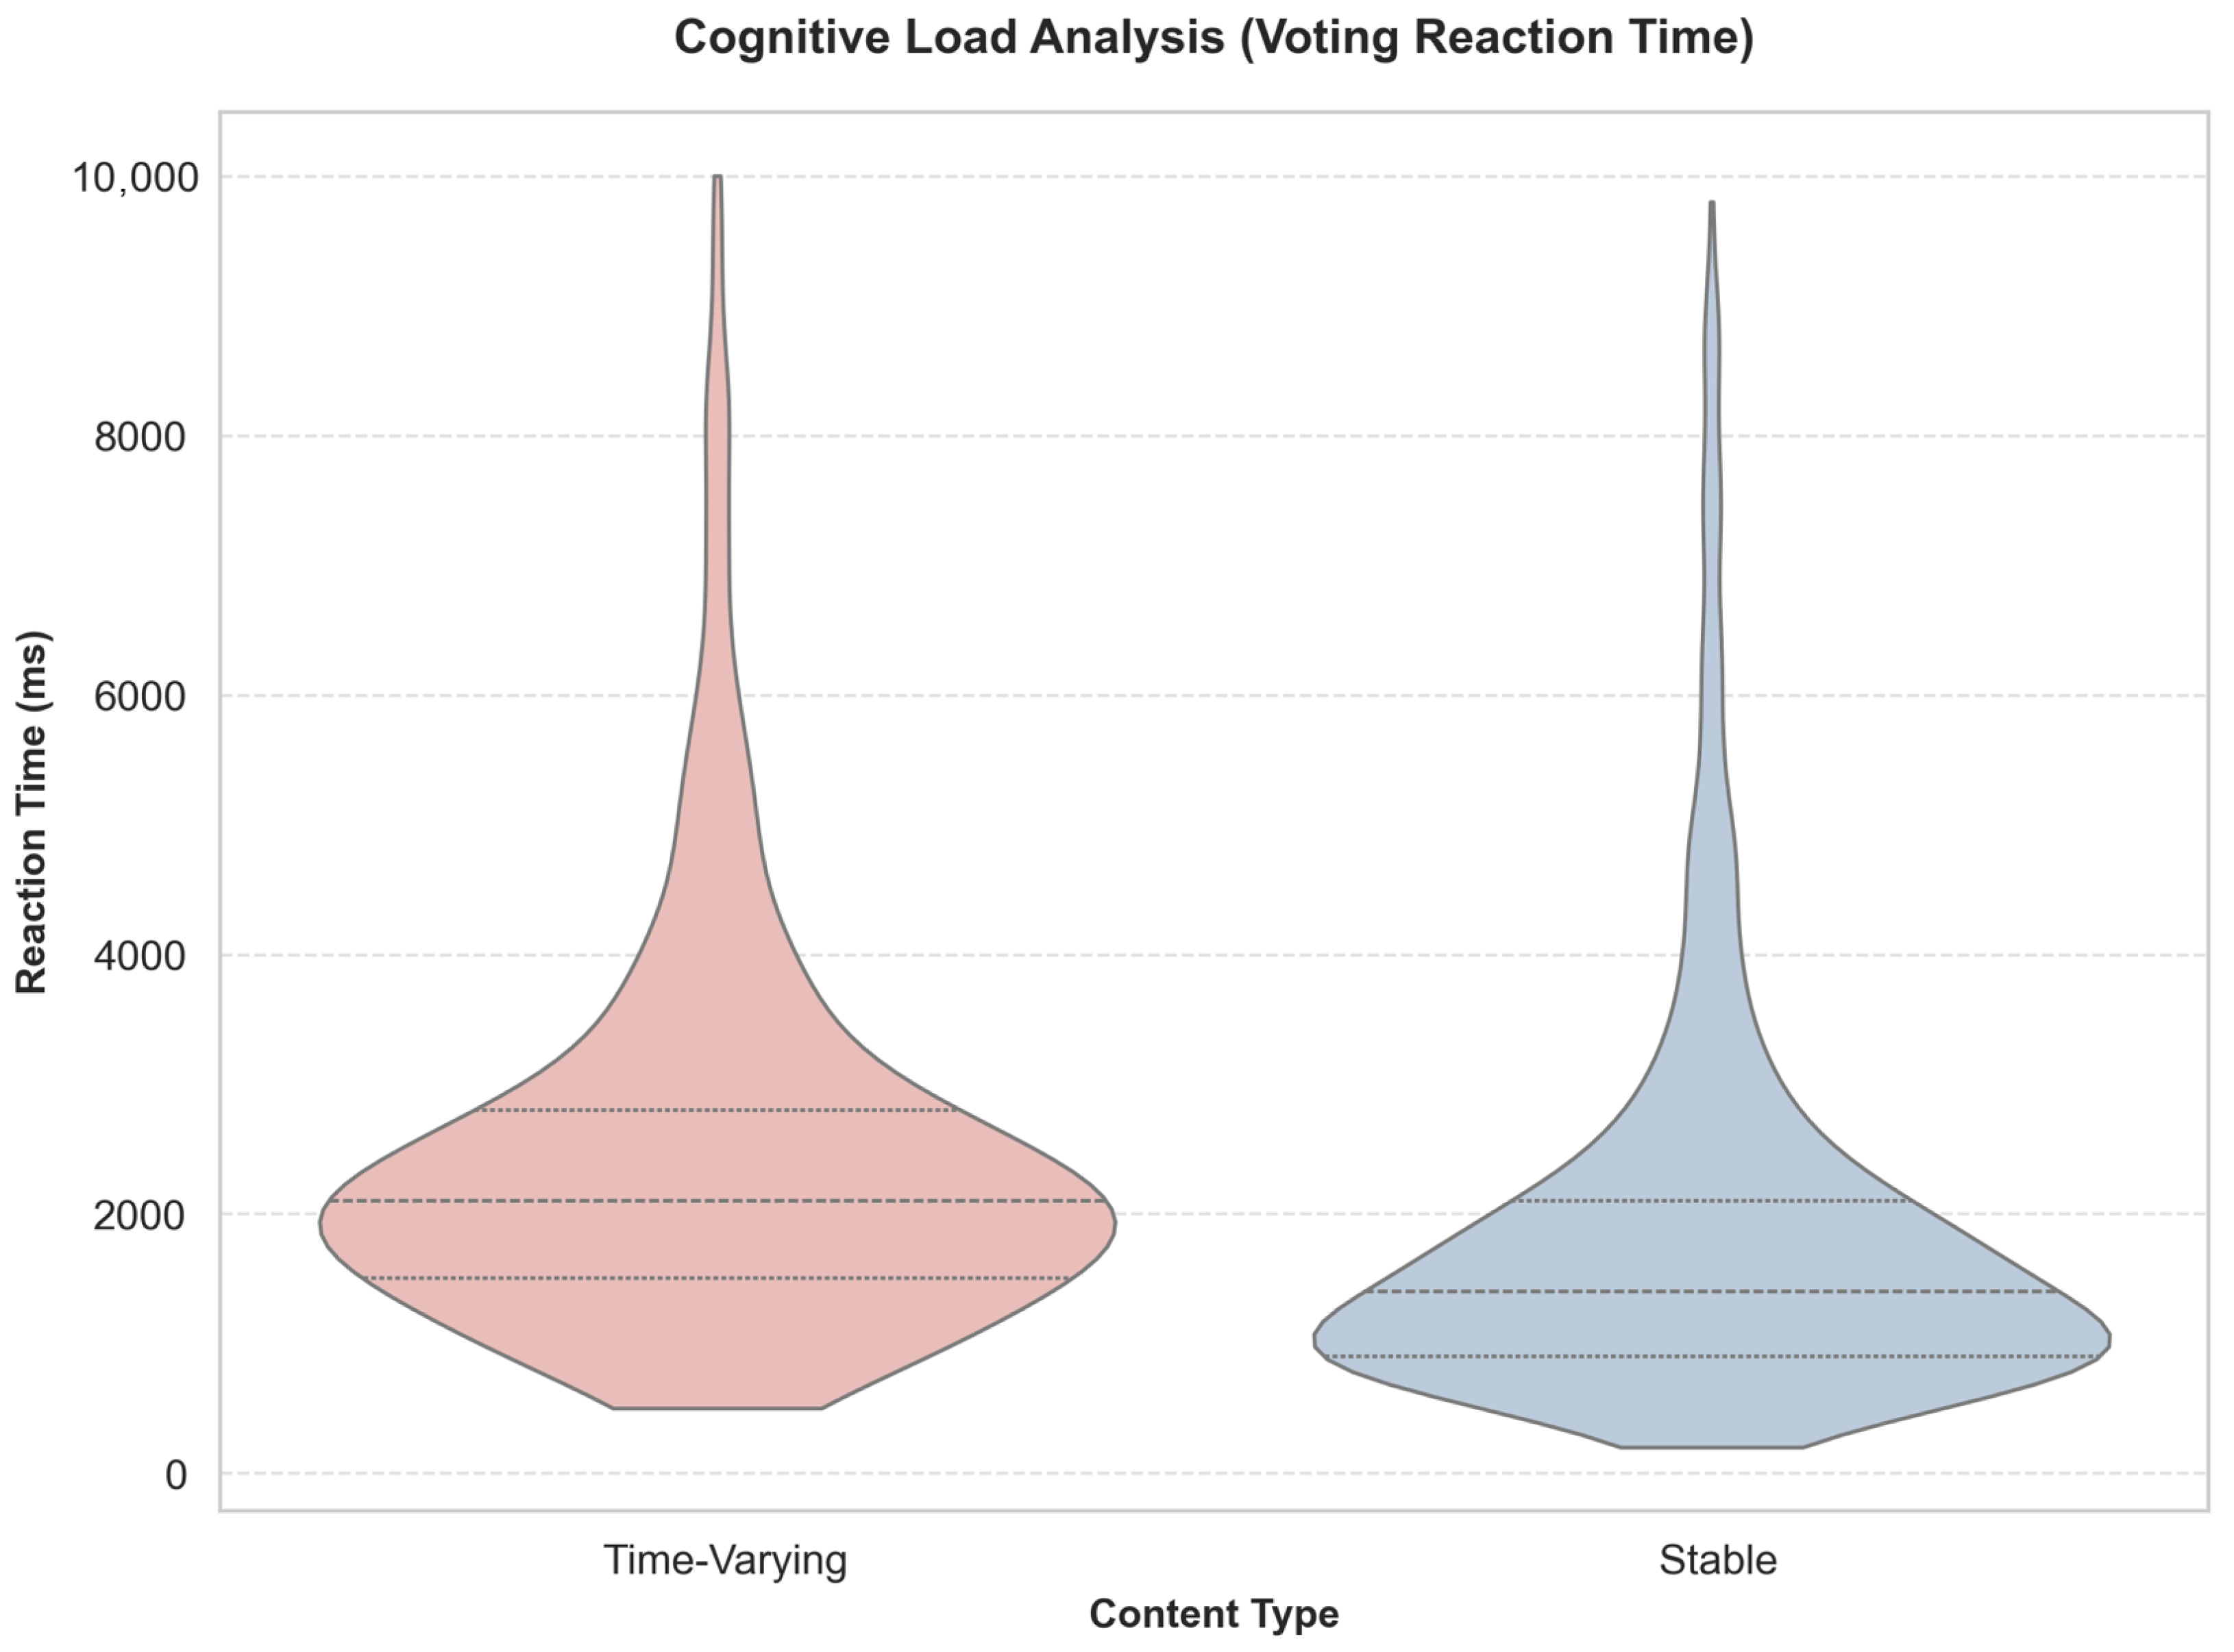
U test. Compared to stable material (M = 2215 ms), respondents required an average of 506 ms longer to evaluate time-varying content (M = 2721 ms).
Figure 7 depicts this distribution, with Database A’s violin plot exhibiting a significant tail that indicates frequent high-latency decision-making occurrences.
The notion of cognitive compensation is substantiated by the disparity between the markedly distinct Reaction Times and the associated Mean Opinion Scores (MOS). The quality of Stable content (Database B) remains constant, facilitating prompt evaluation. Conversely, Time-Varying material (Database A) requires participants to perform temporal pooling, which involves the continuous integration of fluctuating quality levels during the stimulus presentation. The cognitive expense of this pooling technique is indicated by the 506 ms delay seen in Database A. The statistically equivalent final MOS values () indicate that individuals effectively compensated for the heightened cognitive demand in a controlled environment, maintaining rating accuracy while sacrificing processing speed.
5.5. Influence of Human Factors
We conducted a further examination of the influence of subject-specific factors by employing a multivariable Linear Mixed-Effects Model (LMM) (). The findings demonstrate that psychological state greatly influenced QoE evaluations, often eclipsing technical aspects.
Positivity Bias: Subjects reporting a Positive mood rated videos significantly higher (, ) compared to the Negative baseline.
Fatigue Effect: A significant tiredness effect () was observed, whereby subjects reporting High tiredness provided higher ratings, consistent with a leniency effect or heuristic processing strategy aimed at expediting task completion.
5.6. Comprehensive Analysis: Controlled vs. Uncontrolled Environments
5.6.1. The Limits of Crowdsourcing for Temporally Complex Tasks
After establishing the baseline psychometric behavior and quantifying the cognitive costs linked to temporal complexity in a highly controlled laboratory setting, the final phase of this study assesses the feasibility of utilizing crowdsourcing in an uncontrolled environment as a scalable alternative methodology.
Before performing a direct statistical comparison, it is essential to rectify the significant disparity in participant retention rates noted in the crowdsourcing datasets after rigorous Leave-One-Out (LOO) consistency screening. When this cognitively taxing activity was administered to the uncontrolled crowd, the compensatory mechanisms effectively employed by laboratory subjects did not generalize. The crowdsourced cohort for Database A saw an extraordinary 92.0% participant rejection rate, retaining merely two valid subjects () who satisfied the reliability criterion ().
This study suggests that, in the absence of the environmental oversight and concentrated focus characteristic of a laboratory environment, crowd workers were either disinclined or unable of maintaining the cognitive exertion necessary to appropriately assimilate varying quality levels. The resultant attention impairment generated quasi-random or markedly inconsistent voting patterns. As a result, the crowdsourced Database A dataset was omitted from further inferential statistical studies.
Table 5 presents a detailed summary of participant screening and retention statistics, emphasizing the significant difference in rejection rates between the Stable and Time-Varying conditions in the uncontrolled setting.
5.6.2. Objective of the Joint Comparison
In contrast, the crowdsourced Database B (Stable content) had a strong retention rate, maintaining a sufficient pool of very consistent individuals. The cognitive load of steady content is intrinsically smaller, enabling crowd workers to successfully accomplish the rating task. To thoroughly assess the Environmental Effect, the following analysis isolates Database B, contrasting the ground truth acquired in the controlled laboratory environment with the data gathered from the uncontrolled crowd. If the two distributions are statistically equivalent, this would substantiate crowdsourcing as a robust, scalable, and economical alternative to laboratory testing—assuming that video quality is temporally consistent.
5.6.3. Distributional Shift and Leniency Bias
A first distributional shift study was performed on the stable content (Database B) to build a baseline understanding of rating habits across contexts. The unregulated crowdsourced cohort ( ratings) produced a Mean Opinion Score (MOS) of 3.241 (), demonstrating a marginal positive increase relative to the controlled laboratory cohort ( ratings), which achieved a MOS of 3.126 ().
A Mann–Whitney U test revealed that the distributional change was statistically significant (, ). This discovery was validated by a non-parametric bootstrapping study (1000 resamples), which demonstrated non-overlapping 95.
Although the statistical significance is strong, it must be contextualized within the limitations of Null Hypothesis Significance Testing (NHST) applied to big datasets. The absolute difference between the two settings is mathematically negligible (). In psychometric assessments employing a 5-point Absolute Category Rating (ACR) scale, a divergence of this magnitude is often regarded as perceptually insignificant. The modest increase in crowdsourced ratings corresponds with the established leniency bias, or positivity bias, commonly seen in unsupervised remote testing, when evaluators tend to exhibit somewhat greater leniency.
Due to the heightened sensitivity of classic non-parametric tests to large sample sizes, the rejection of the null hypothesis does not necessarily imply practical system equivalency. It requires a hierarchical modeling strategy to distinguish individual subject leniency from the actual environmental effect, followed by formal equivalence testing.
5.6.4. Hierarchical Confounding Control
A Linear Mixed-Effects Model (LMM) was utilized to meticulously separate the genuine impact of the evaluation setting from the confounding effect of individual rater leniency. Standard non-parametric tests, such as the Mann–Whitney U, presume sample independence and are hence excessively sensitive in extensive QoE datasets, frequently merging subject-level variance with ambient influences. The LMM resolves this by treating the Environment as a fixed effect and the Subject ID as a random intercept, thus accommodating the repeated-measures design of the experiment (120 trials per subject over 45 valid subjects).
The hierarchical analysis successfully mitigated the observable distributional change. The model output indicates that the fixed impact of moving from a controlled laboratory setting to an uncontrolled crowd scenario had a coefficient of . Nonetheless, after adjusting for individual subject variability, this environmental effect was statistically negligible (, , 95% CI: [−0.085, 0.316]). The variance was absorbed by the random group effect (), indicating that the inherent leniency of the selected workers, rather than the unsupervised characteristics of the crowdsourcing platform, was responsible for the small increase in raw scores.
Consequently, we ascertain that when the cognitive demands of the QoE task are limited (i.e., employing steady video content), the assessment environment does not induce a systematic bias in the quality ratings. The crowdsourced and laboratory cohorts essentially represent the same psychometric population.
5.6.5. Cross-Environment Rank Agreement and System-Level Equivalence
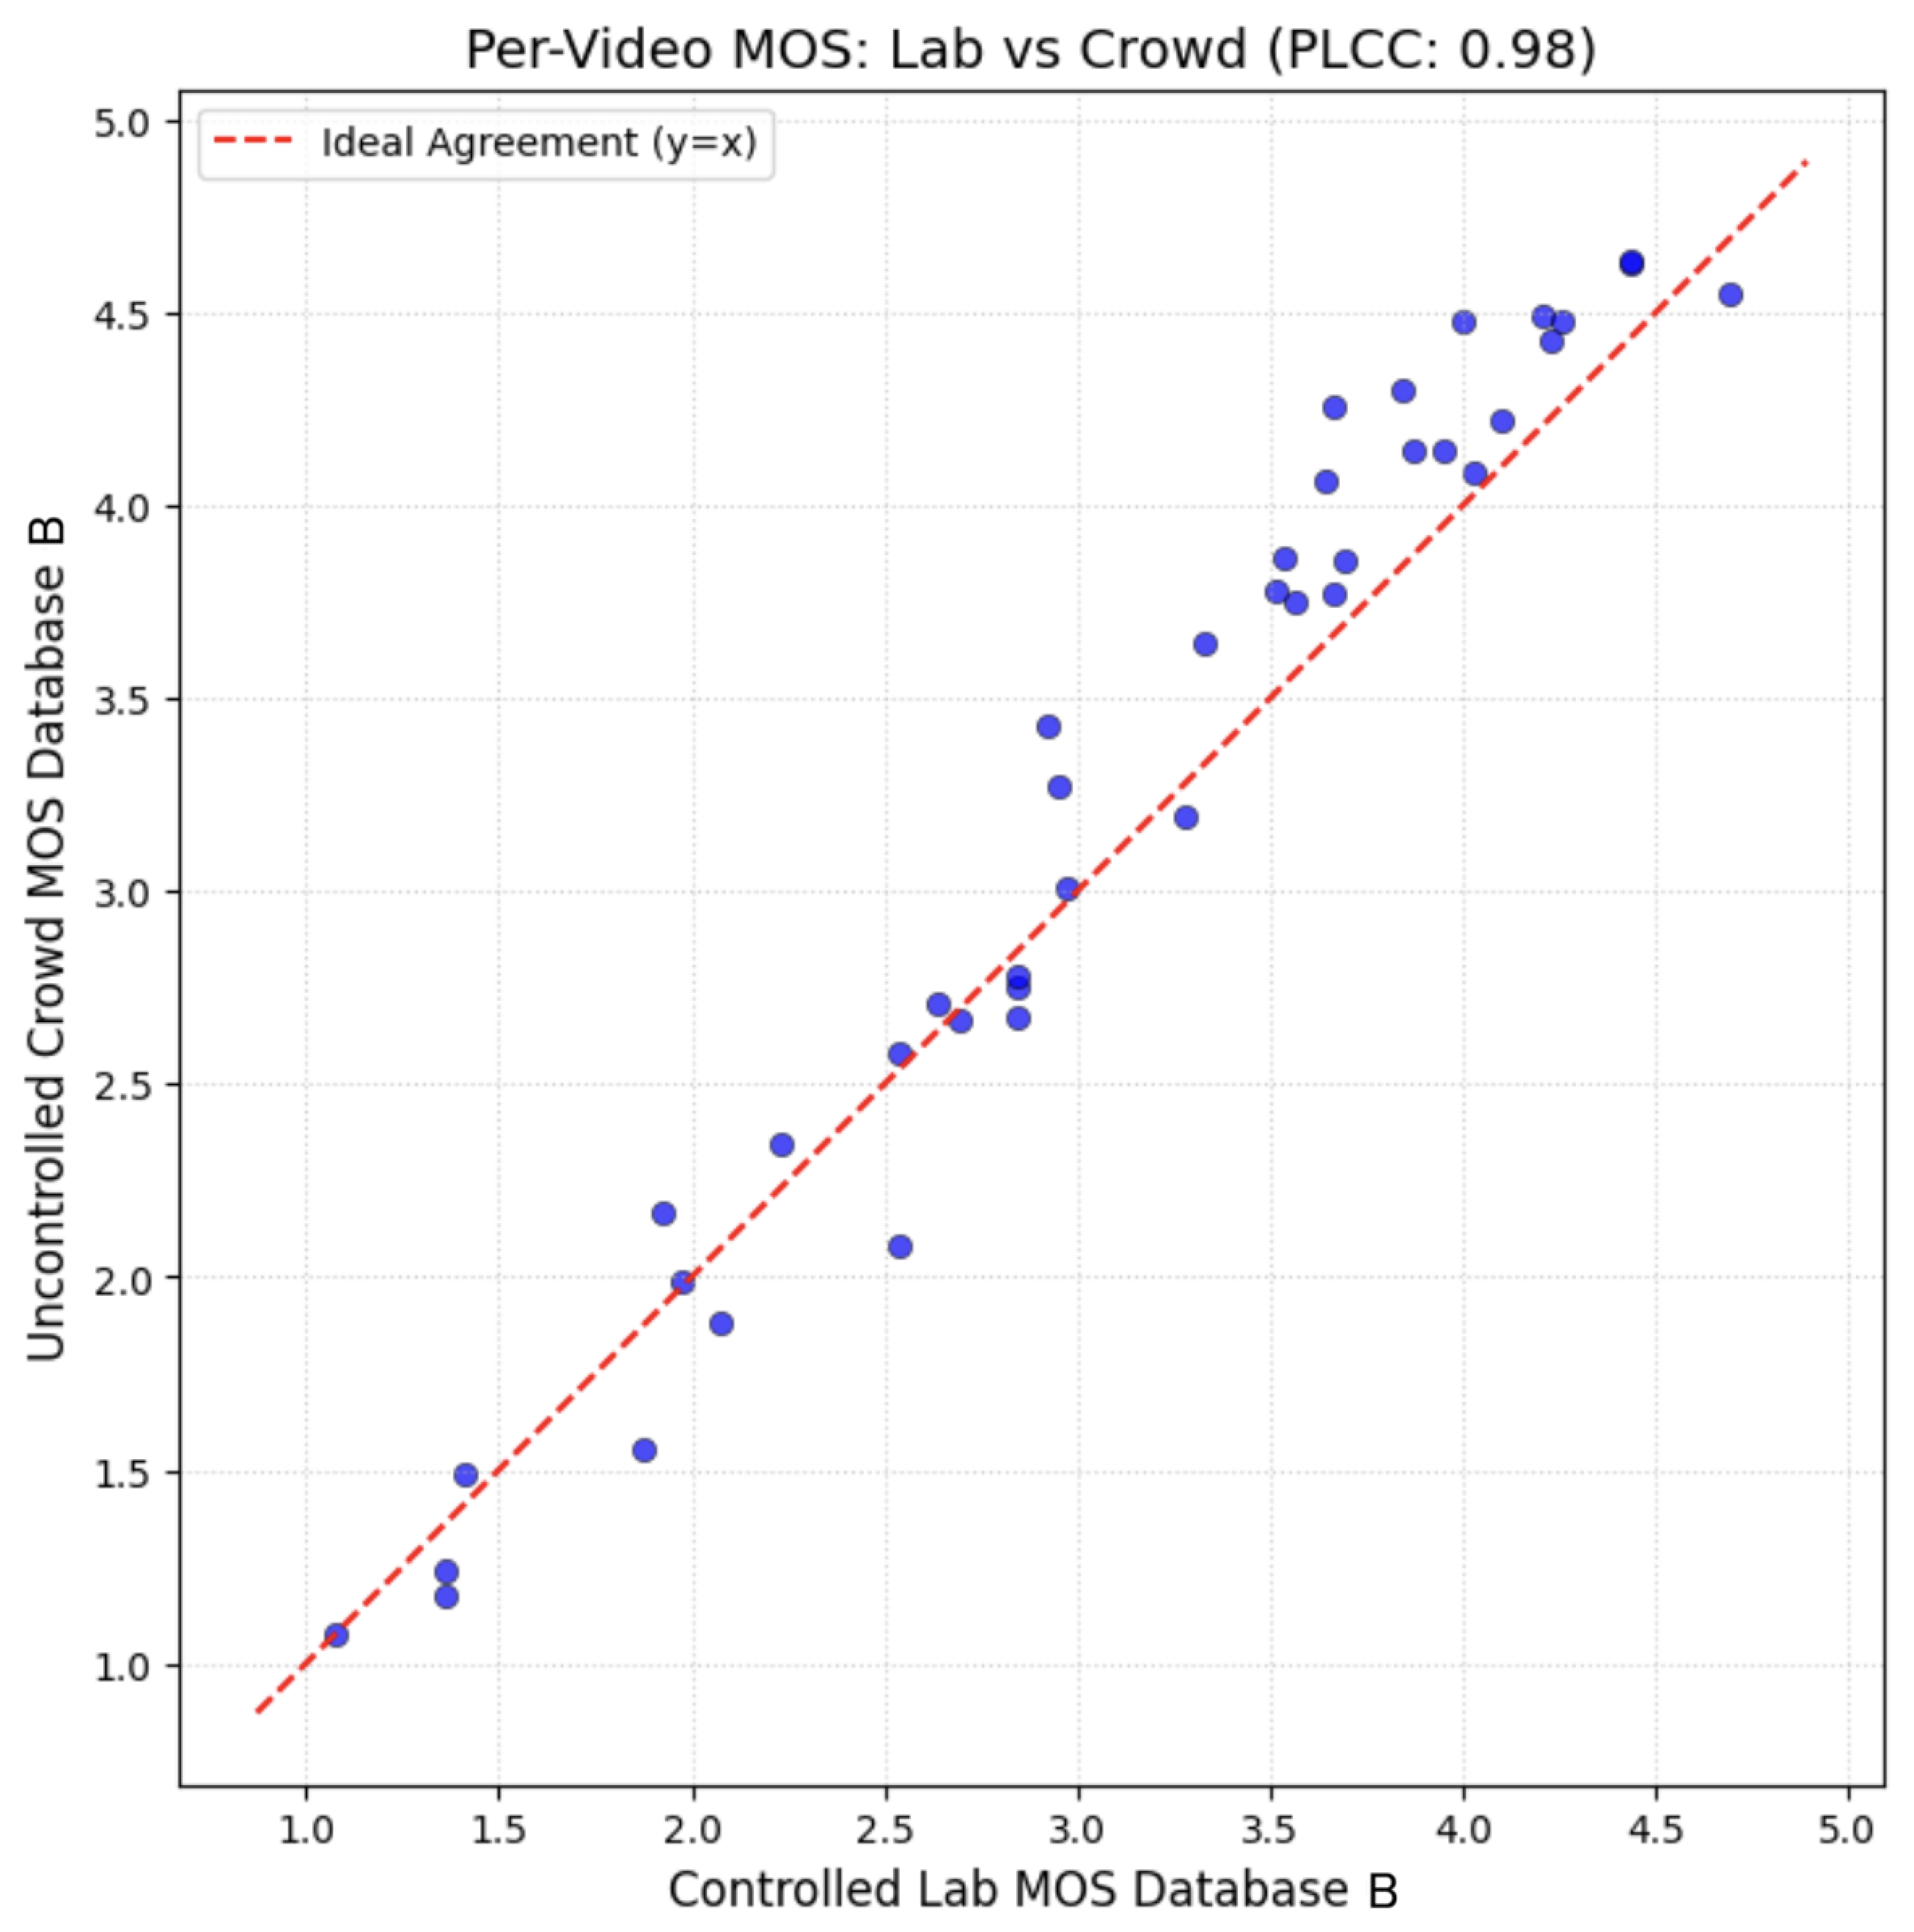
The Linear Mixed-Effects Model (LMM) validated the lack of systemic environmental bias at the population level, although practical video engineering necessitates accurate assessment of individual stimuli. To determine if the uncontrolled public maintains the same relative quality rankings of specific video sequences as the controlled laboratory, we performed a cross-environment correlation study on the per-video Mean Opinion Scores (MOS) for the 40 stable video sequences in Database B.
The inter-environment agreement was assessed utilizing three common benchmarking metrics: Pearson Linear Correlation Coefficient (PLCC) assesses linearity in predictions, Spearman Rank-Order Correlation Coefficient (SRCC) evaluates monotonic rank preservation, and Kendall’s Rank Correlation Coefficient (KRCC) measures resilience in the presence of linked ranks. Additionally, the Root Mean Square Error (RMSE) was computed to measure absolute scoring deviation.
The research demonstrated nearly flawless concordance between the laboratory and crowdsourcing groups.
Figure 8 illustrates that both the linear and rank-order correlations surpassed the conventional ITU benchmarks for superior model concordance, resulting in a PLCC of 0.9829 (
) and an SRCC of 0.9809 (
). The KRCC was notably high at 0.8988 (
), affirming that the precise ordinal ranking of video quality was maintained. The absolute error margin was minimal, with an RMSE of merely 0.2548 MOS points on the 5-point ACR scale, well below the usual limits of human perceptual fluctuation.
These findings offer conclusive evidence of system-level equivalence. The nearly flawless SRCC ensures that a video engineer employing unsupervised crowdsourcing data will arrive at identical algorithmic or optimization judgments as one dependent on supervised laboratory ground truth. Thus, for consistent video content, stringent crowdsourcing methodologies (including LOO screening) provide a highly valid, economical, and scalable alternative to conventional laboratory testing.
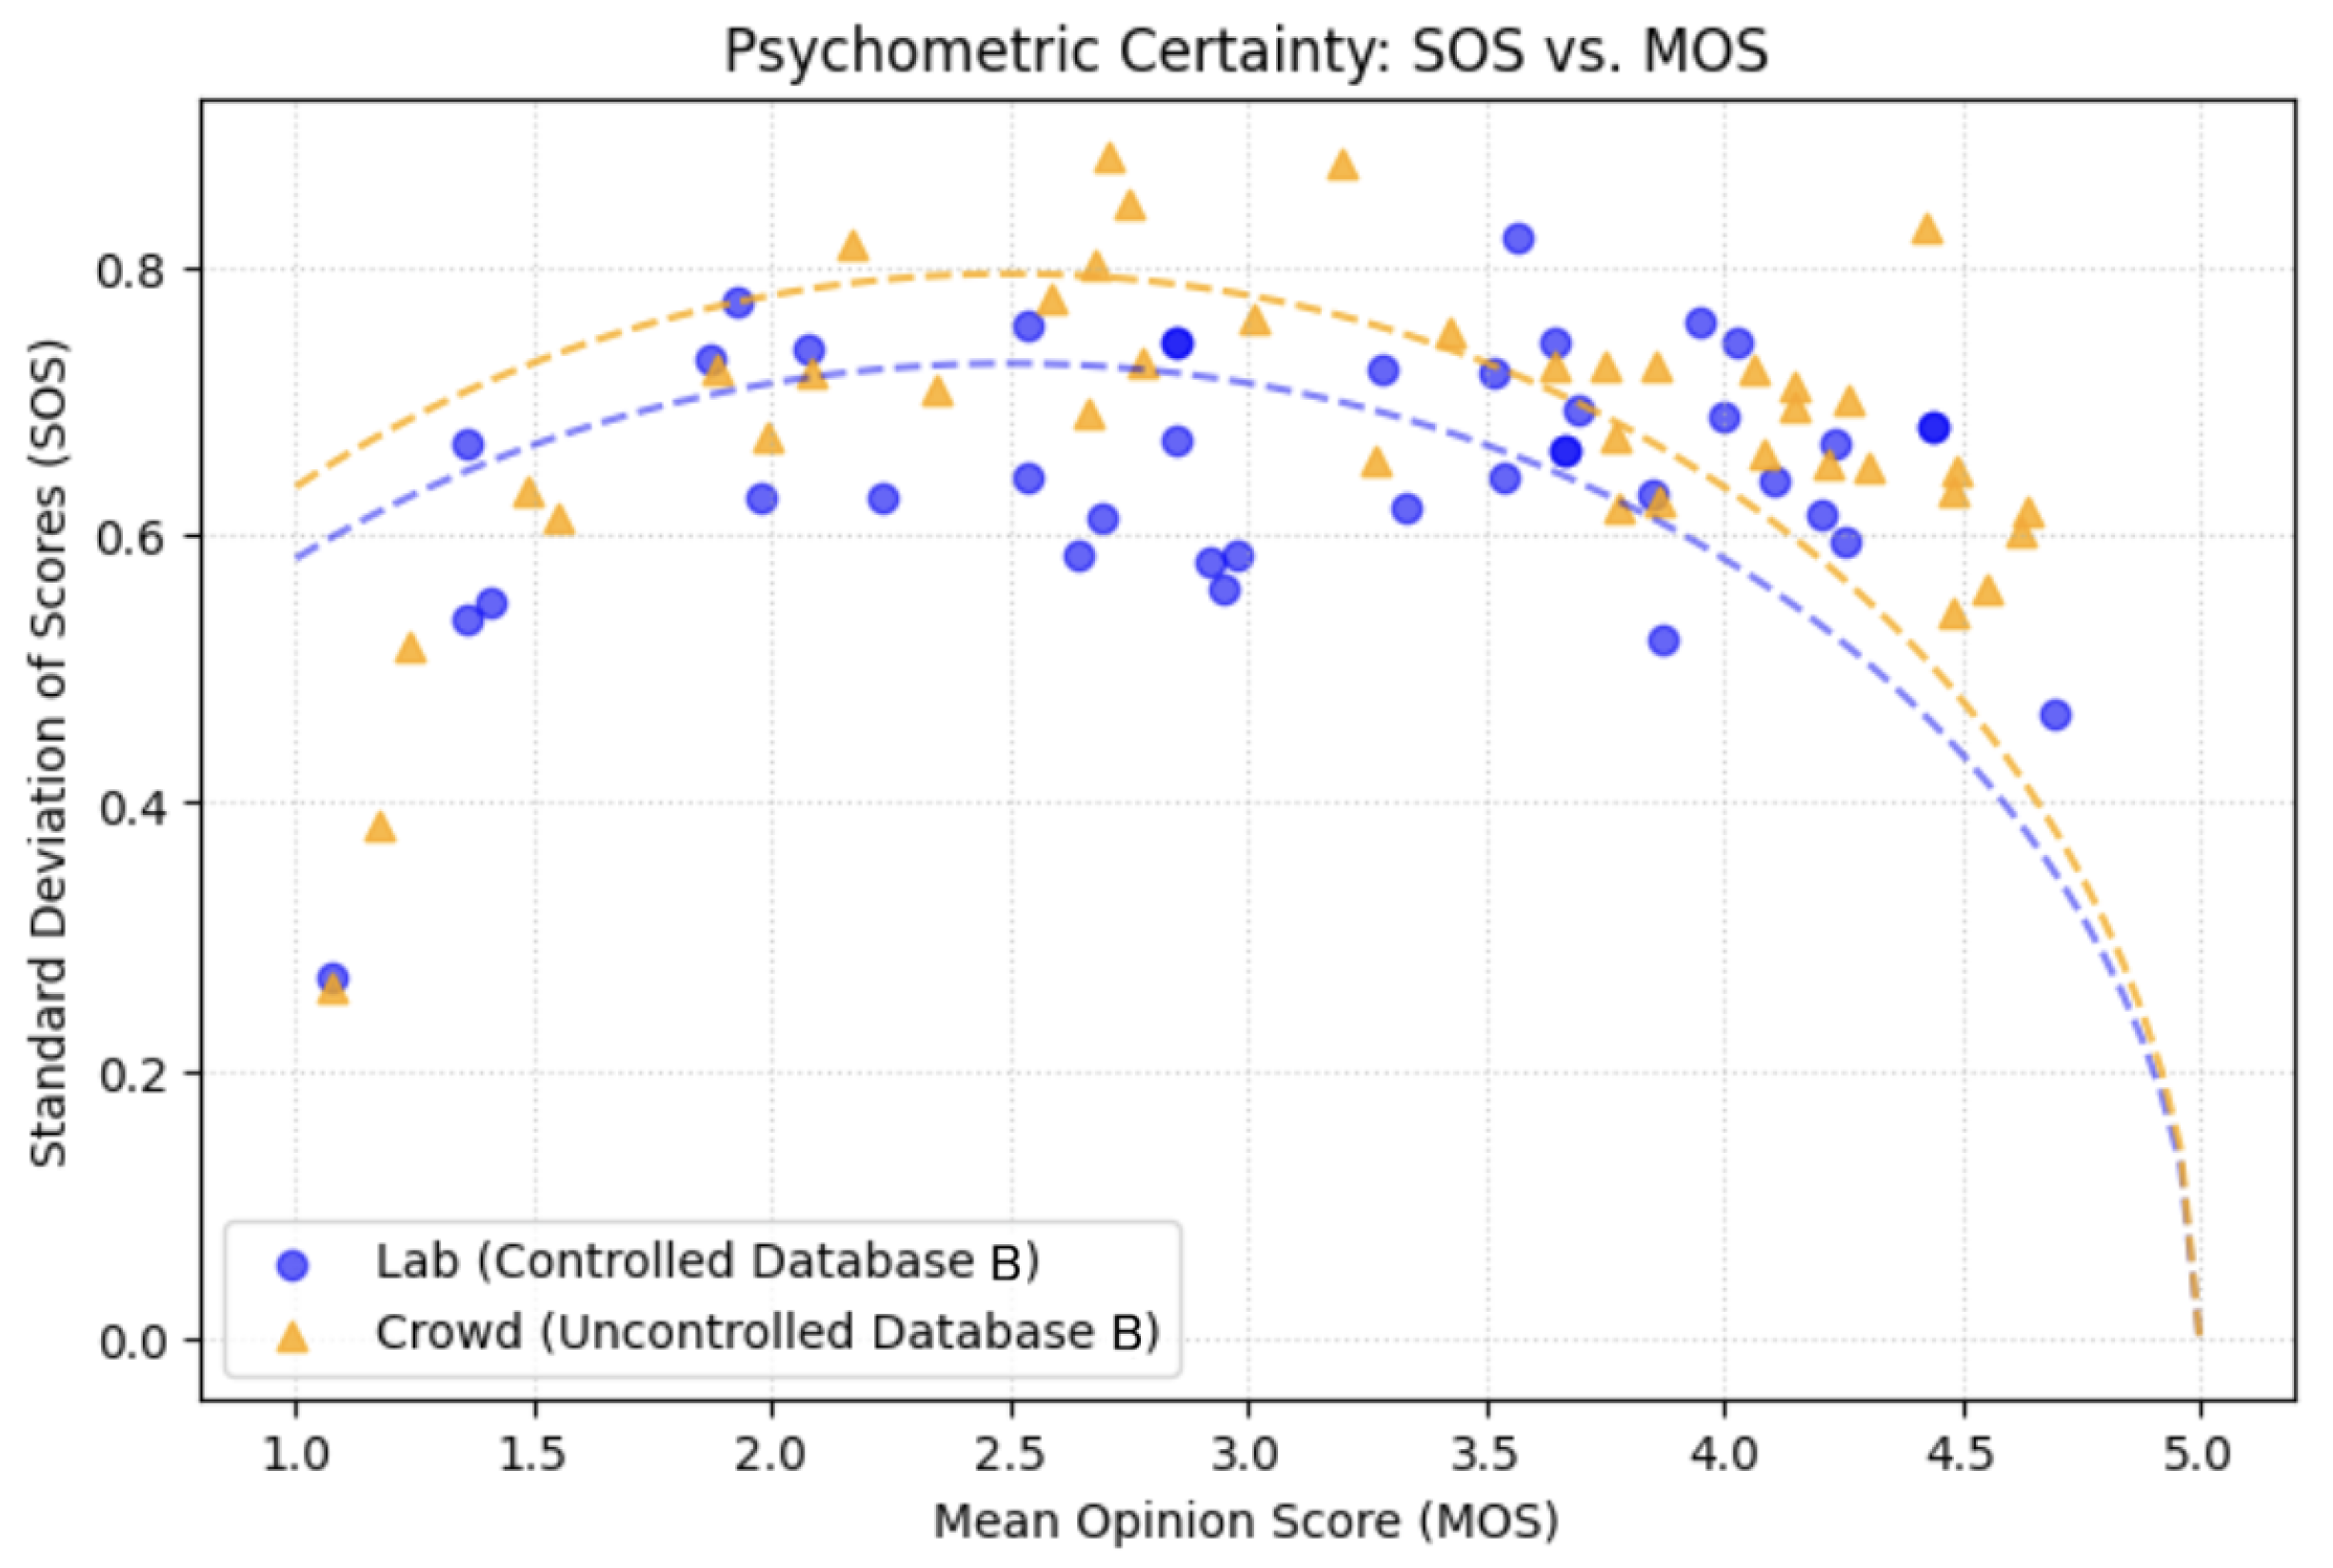
5.7. Psychometric Alignment and Rating Certainty
We assessed whether crowdsourcing individuals employed the rating scale with equivalent psychometric reliability as supervised laboratory subjects by testing the Standard Deviation of Opinion Scores (SOS) hypothesis. The traditional SOS model asserts that rating variance adheres to a quadratic trajectory, reaching its zenith near the midway of the scale (MOS ) owing to heightened user perplexity, while diminishing at the extremities.
We fitted the theoretical curve as in Equation (
1)
to the collaboratively sourced per-video data. The study produced a parameter value of
, accompanied by a negative goodness-of-fit (
), reflecting the psychometric behavior noted in the controlled laboratory group (
,
).
The negative
values suggest that neither group adhered to the traditional parabolic variance curve; instead, both displayed a flattened variance distribution. This indicates that crowdsourced individuals that passed the rigorous LOO screening process had consistently good inter-rater agreement across all quality levels, without displaying the increased uncertainty usually linked to distant mid-tier quality assessment. Thus, we affirm that the assessment setting did not modify the essential psychometric characteristics or rating confidence of the legitimate participants.
Figure 9 elucidates this tendency, demonstrating that participants who passed LOO screening exhibited consistently elevated inter-rater agreement across all quality tiers.
5.8. Summary of System-Level Equivalence
Through a rigorous, multi-stage analytical pipeline, this study evaluated the viability of crowdsourcing as a substitute for controlled laboratory testing. Our findings indicate a clear dichotomy based on content complexity:
High Temporal Complexity (Time-Varying): Crowdsourcing is currently an invalid methodology. The lack of supervision leads to an inability to sustain the cognitive load required for temporal pooling, resulting in a near-total collapse of participant validity (92% rejection rate).
Low Temporal Complexity (Stable): When coupled with strict LOO consistency screening, crowdsourcing achieves system-level equivalence with controlled laboratory data. Hierarchical modeling (LMM) confirmed the absence of systemic environmental bias (), rank-order correlation demonstrated near-perfect sequence alignment (SRCC ), and SOS analysis verified identical psychometric certainty.
Therefore, for stable video content, remote crowdsourcing is not merely an approximation of laboratory testing, but a statistically equivalent, highly scalable alternative.
7. Conclusions
This study presented a comprehensive, multi-environment analysis of QoE assessment methodologies, specifically investigating the viability of unsupervised crowdsourcing as an alternative to controlled laboratory testing. By integrating advanced statistical modeling (Linear Mixed-Effects Models), behavioral metrics (Reaction Time), and psychometric validation (Standard Deviation of Opinion Scores), we empirically demonstrated that the efficacy of crowdsourcing is strictly bounded by the temporal complexity of the video content and the cognitive load it imposes on viewers.
Our findings reveal a critical dichotomy in subjective QoE evaluation. For temporally complex, time-varying video content, viewers must execute temporal pooling, a continuous mental integration of fluctuating quality levels. While supervised laboratory subjects successfully engaged in this cognitive compensation (evidenced by a statistically significant ∼500 ms processing latency), this mechanism failed to generalize to the unsupervised crowd. The unprecedented 92.0% participant rejection rate for crowdsourced time-varying content empirically proves that, under current methodological paradigms, crowdsourcing is an invalid and highly unreliable approach for assessing complex, dynamic video distortions. Without laboratory supervision, viewers are generally unwilling or unable to sustain the requisite cognitive effort, leading to a collapse in inter-rater reliability.
Conversely, when evaluating stable video content, the cognitive burden is substantially reduced, allowing for immediate snapshot quality judgments. Under these constrained cognitive conditions, coupled with strict Leave-One-Out (LOO) consistency screening, the crowdsourced cohort achieved definitive system-level equivalence with the controlled laboratory. Hierarchical modeling confirmed the absence of systemic environmental bias (), and cross-environment correlation demonstrated near-perfect sequence alignment (). Furthermore, psychometric analysis confirmed that valid crowd workers exhibited the exact same rating certainty and flattened variance distribution as supervised subjects.
Overall, this study identifies an important limitation for using crowdsourcing in Quality of Experience (QoE) assessment methods. The findings indicate that crowdsourcing should neither be treated as a universally applicable solution nor rejected entirely because of the additional noise that may arise from uncontrolled testing environments. Rather, for video content that is relatively stable, well-structured crowdsourcing procedures can serve as a valid, scalable, and cost-effective alternative to conventional laboratory experiments. In addition, the results suggest that future QoE study designs should take into account not only the perceptual effects of visual impairments, but also the cognitive effort required from participants by the evaluation task itself. Future research may aim to broaden this framework to include more demographically varied subject groups and to explore the practicality of incorporating real-time cognitive load monitoring methods into remote testing setups.




 ,
,