


Abstract
As utilities transition from legacy data-collection devices to advanced smart meters, theft detection must remain accurate, scalable, and actionable—helping teams prioritize field inspections, reduce false alarms, and allocate limited enforcement resources more efficiently across service territories. We propose BO-WDMS-BiLSTM, a dual-branch model that combines customer and billing information with electricity-use patterns over time. One branch learns from compact customer indicators and captures stable signals that remain useful even when daily usage changes for normal reasons. The other branch converts multi-week consumption data into a structured representation and extracts patterns at different time scales, enabling it to detect both short abnormal drops and gradual shifts. A bidirectional sequence module then interprets each period using context from both earlier and later days. The two branches are fused with a residual-style head that preserves information from both sources and improves training stability, while Bayesian optimization reduces manual tuning. Compared with widely used classical and deep learning baselines, the proposed model achieved the best overall discrimination and ranked more true theft cases at the top of the inspection list, improving the strongest baseline from 0.7897 to 0.7977 and raising top-100/top-200 inspection performance from 0.9320/0.9204 to 0.9797/0.9394.
1. Introduction
Electricity theft is a persistent source of non-technical losses and can undermine grid reliability, utility revenue, and customer trust. The rapid growth of advanced metering and digital operations has made data-driven detection increasingly feasible, but it has also expanded the attack surface and raised expectations for scalable, accurate, and accountable analysis [1,2]. Recent overviews emphasize that progress depends as much on handling imperfect data and operational constraints as on achieving strong benchmark scores [3].
Practical deployments also vary widely by infrastructure maturity. In many regions, large customer populations still rely on traditional meters without built-in communications, so detection workflows remain closely tied to field inspections and manual prioritization. A case study on Indonesia’s postpaid residential customers frames the problem as generating reliable inspection target lists from monthly usage records, showing how model design choices must align with resource limits and operational decision-making [4].
A central technical obstacle across both smart and traditional metering settings is class imbalance: confirmed theft cases are typically rare compared with normal behavior. One representative baseline combines SMOTE (Synthetic Minority Oversampling Technique) with logistic regression to rebalance training data while preserving interpretability [5]. Earlier pipeline designs follow a similar logic by coupling oversampling with dimensionality reduction and a classical classifier, aiming to stabilize learning when time-series features are high-dimensional [6]. More recent work pairs SMOTE with gradient-boosted trees to better capture non-linear patterns in load profiles, improving sensitivity while controlling error rates under skewed class distributions [7]. Complementary optimization-oriented studies tune boosted models using automated search to push performance while keeping computation practical for large-scale screening [8].
Beyond resampling, several studies focus on selecting or structuring features so that learning algorithms emphasize stable behavioral signals rather than noise. A Boruta–LightGBM approach combines mixed resampling with feature selection to reduce redundancy and improve generalization on consumption-derived predictors [9]. Prototype learning combined with ensemble training further addresses extreme imbalance by learning class representatives from balanced subsets, aiming to preserve minority-class structure even when theft behavior varies in severity [10].
Some approaches emphasize simplicity and deployability by coupling targeted preprocessing with lightweight models. Signal decomposition and interpolation have been used to extract discriminative summaries from long consumption records before classification with KNN, offering a practical route when engineering resources are limited [11]. Unsupervised clustering has also been explored in information-system settings, where the goal is to flag atypical customers from aggregated profiles when labels are sparse or inconsistent.
Data quality issues, especially missing values and irregular reporting, remain a major barrier because consumption records are often incomplete for reasons that are not purely random. A fusion CNN coupled with iterative interpolation uses Bayesian ridge regression to fill gaps and then learns multi-branch convolutional features to capture periodic patterns [12,13]. Earlier deep learning work also leverages periodic structure by converting weekly sequences into two-dimensional representations and extracting features with a residual network, then combining them with statistical descriptors for classification [14].
As models increasingly target subtle and evolving theft behaviors, temporal representation learning and attention mechanisms are used to capture longer dependencies and focus on informative segments. A temporal convolutional network with self-attention is proposed to improve discrimination under realistic non-technical loss conditions [15]. Multi-scale feature fusion with parallel convolutional branches and channel reweighting further aims to reduce interference from legitimate behavioral shifts while retaining longer-horizon cues relevant to theft [16]. Dilated convolutions combined with multi-head attention extend this idea by integrating multi-scale temporal features and learning which time segments matter most for classification [17].
Hybrid systems also combine deep feature extraction with classical learners to exploit complementary strengths. A stacked framework dominated by deep learning uses neural features together with outputs from multiple machine learning classifiers and then applies a final boosted classifier to improve generalization [18]. Graph-based approaches go further by explicitly modeling relationships among users or consumption cycles, including dynamic graph construction during training and additional imbalance handling through oversampling and loss reweighting [19]. Related work considers prosumers and coordinated manipulation scenarios, proposing cluster-based detection that blends time-series decomposition with multi-source features to support robustness under more complex market participation [20].
Several studies expand the evidence used for detection beyond consumption alone, motivated by the observation that meter readings can be manipulated while grid-side signals may remain informative. A multivariate detector incorporates voltage and power losses in addition to consumption, improving detection rates relative to consumption-only baselines [21]. Intermittent theft behavior, which may not persist throughout the full observation window, is addressed by combining CNN-based temporal localization with correlation analysis and density-based clustering to identify outliers aligned with abnormal line-loss periods [22]. Station-area case studies also highlight that low-quality data and extreme imbalance can co-occur, motivating multi-stage systems that first improve data quality and then apply augmentation and deep detection modules [23]. Multi-dimensional fusion has also been explored through evidence-theoretic integration of electrical variables with optimized multi-layer SVM classification, aiming to exploit richer meter measurements while improving training efficiency [24].
To mitigate scarcity of labeled theft samples, multiple strands of work augment data or search model configurations more effectively. A spectrum-normalized GAN is used to generate additional theft-like samples for training a CNN classifier, with the goal of improving detection while reducing false alarms [25]. Particle swarm optimization has been applied to tune neural networks across theft risk levels, emphasizing faster convergence and stable accuracy [26]. Real-time monitoring prototypes integrate IoT sensing with deep neural networks to support continuous detection and operational optimization, reflecting a broader push toward actionable, near-real-time analytics [27].
Household-level settings introduce additional complexity because appliance-level variability can mimic anomalous behavior and because labeled attacks are limited. A smart-home study combines knowledge-guided time-series patterns with simulated and real attacks, reporting strong performance of supervised learners across multiple home categories and attack types [28]. Reconstruction-based anomaly detection with an LSTM autoencoder provides another path when theft labels are scarce, using reconstruction error and data-driven thresholding to flag suspicious behavior [29]. Privacy constraints further shape what can be deployed, and dual-privacy-preserving designs based on split learning and data transformation aim to protect both consumption data and model assets while retaining competitive detection performance [30].
Robustness is increasingly treated as a core requirement rather than a secondary evaluation criterion. A consumption-pattern-driven framework combines load disaggregation ideas with statistical testing to judge theft behavior at time-segment granularity, aiming to detect subtle deviations that may be missed by coarse aggregation [31]. Against adversarial manipulation, a CNN–AE–LSTM hybrid scheme is evaluated under white-box and black-box settings to improve resistance to evasion attacks [32]. Complementary work explicitly demonstrates that hybrid detectors such as CNN–AdaBoost can degrade sharply under crafted evasion, reinforcing the need for adversarial evaluation when models are used in high-stakes screening [33].
Finally, alternative representations and multi-utility sensing broaden what “evidence” can mean in theft detection. Image-coding approaches convert one-dimensional consumption sequences into two-dimensional forms and use modern vision backbones such as ConvNeXt to learn richer discriminative features [34]. Multi-source metering integrates electricity with water and gas, modeling cross-utility correlations as graphs and showing that complementary utilities can improve detection reliability under varying fraud ratios [35,36]. Self-optimizing hybrid deep learning further illustrates how automated configuration and structured feature fusion can compress high-dimensional signals into compact representations for robust downstream classification [37].
Across these directions, a recurring tension is the gap between controlled evaluations and operational conditions. Oversampling and synthetic augmentation can improve learning under imbalance, but the realism of generated theft behavior must be validated carefully to avoid models that perform well offline yet overfit to artifacts in augmented data. Methods that repair missing values can strengthen downstream learning, but imputation may unintentionally blur precisely the irregularities that indicate theft, particularly when missingness is behavior-related rather than random. Many studies also assume stable consumption patterns, while real deployments face seasonality, tariff changes, household composition shifts, and concept drift that can erode performance if models are not monitored and updated. Robustness remains an evolving requirement: adversarial and coordinated manipulations can target known model weaknesses, so evaluation protocols should include stress testing, uncertainty awareness, and human-in-the-loop safeguards. Privacy-preserving designs are promising for regulated environments, but they introduce added system complexity and may shift bottlenecks toward communication, calibration, and governance rather than pure model accuracy.
The main contributions of this paper are summarized as follows.
- We propose BO-WDMS-BiLSTM, a Bayesian-Optimized Wide-and-Deep Multi-Scale Bidirectional Model that jointly learns complementary representations and merges them with a residual fusion head, improving the quality and stability of the final decision.
- We introduce a multi-scale convolution branch with parallel receptive fields to capture patterns at different temporal granularities, strengthening feature extraction under diverse consumption behaviors.
- We incorporate a BiLSTM temporal module to model bidirectional dependencies within the observation window, which helps reveal subtle, intermittent, or gradually evolving theft patterns that are hard to identify from isolated points.
- We apply Bayesian optimization to tune key hyperparameters efficiently, yielding more reliable performance than manual trial-and-error while reducing unnecessary training runs.
This paper first introduces the background and motivation for smart-meter electricity theft detection and outlines the research problem. It then presents the proposed BO-WDMS-BiLSTM model in detail, including the dual-branch design, multi-scale feature extraction, bidirectional temporal modeling, and Bayesian hyperparameter tuning. Next, the experimental section describes the datasets, experimental settings, and evaluation criteria, followed by comparative results, ablation studies, and representation visualizations to explain why the proposed model works well. Finally, the paper summarizes the key findings and discusses practical implications.
2. Materials and Methods
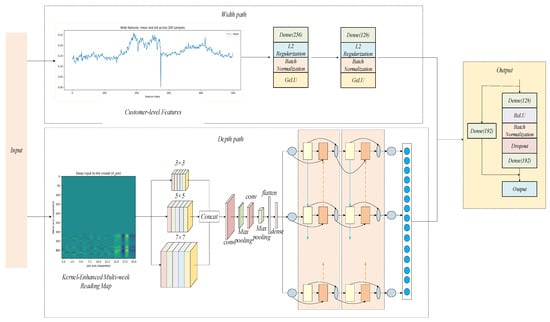
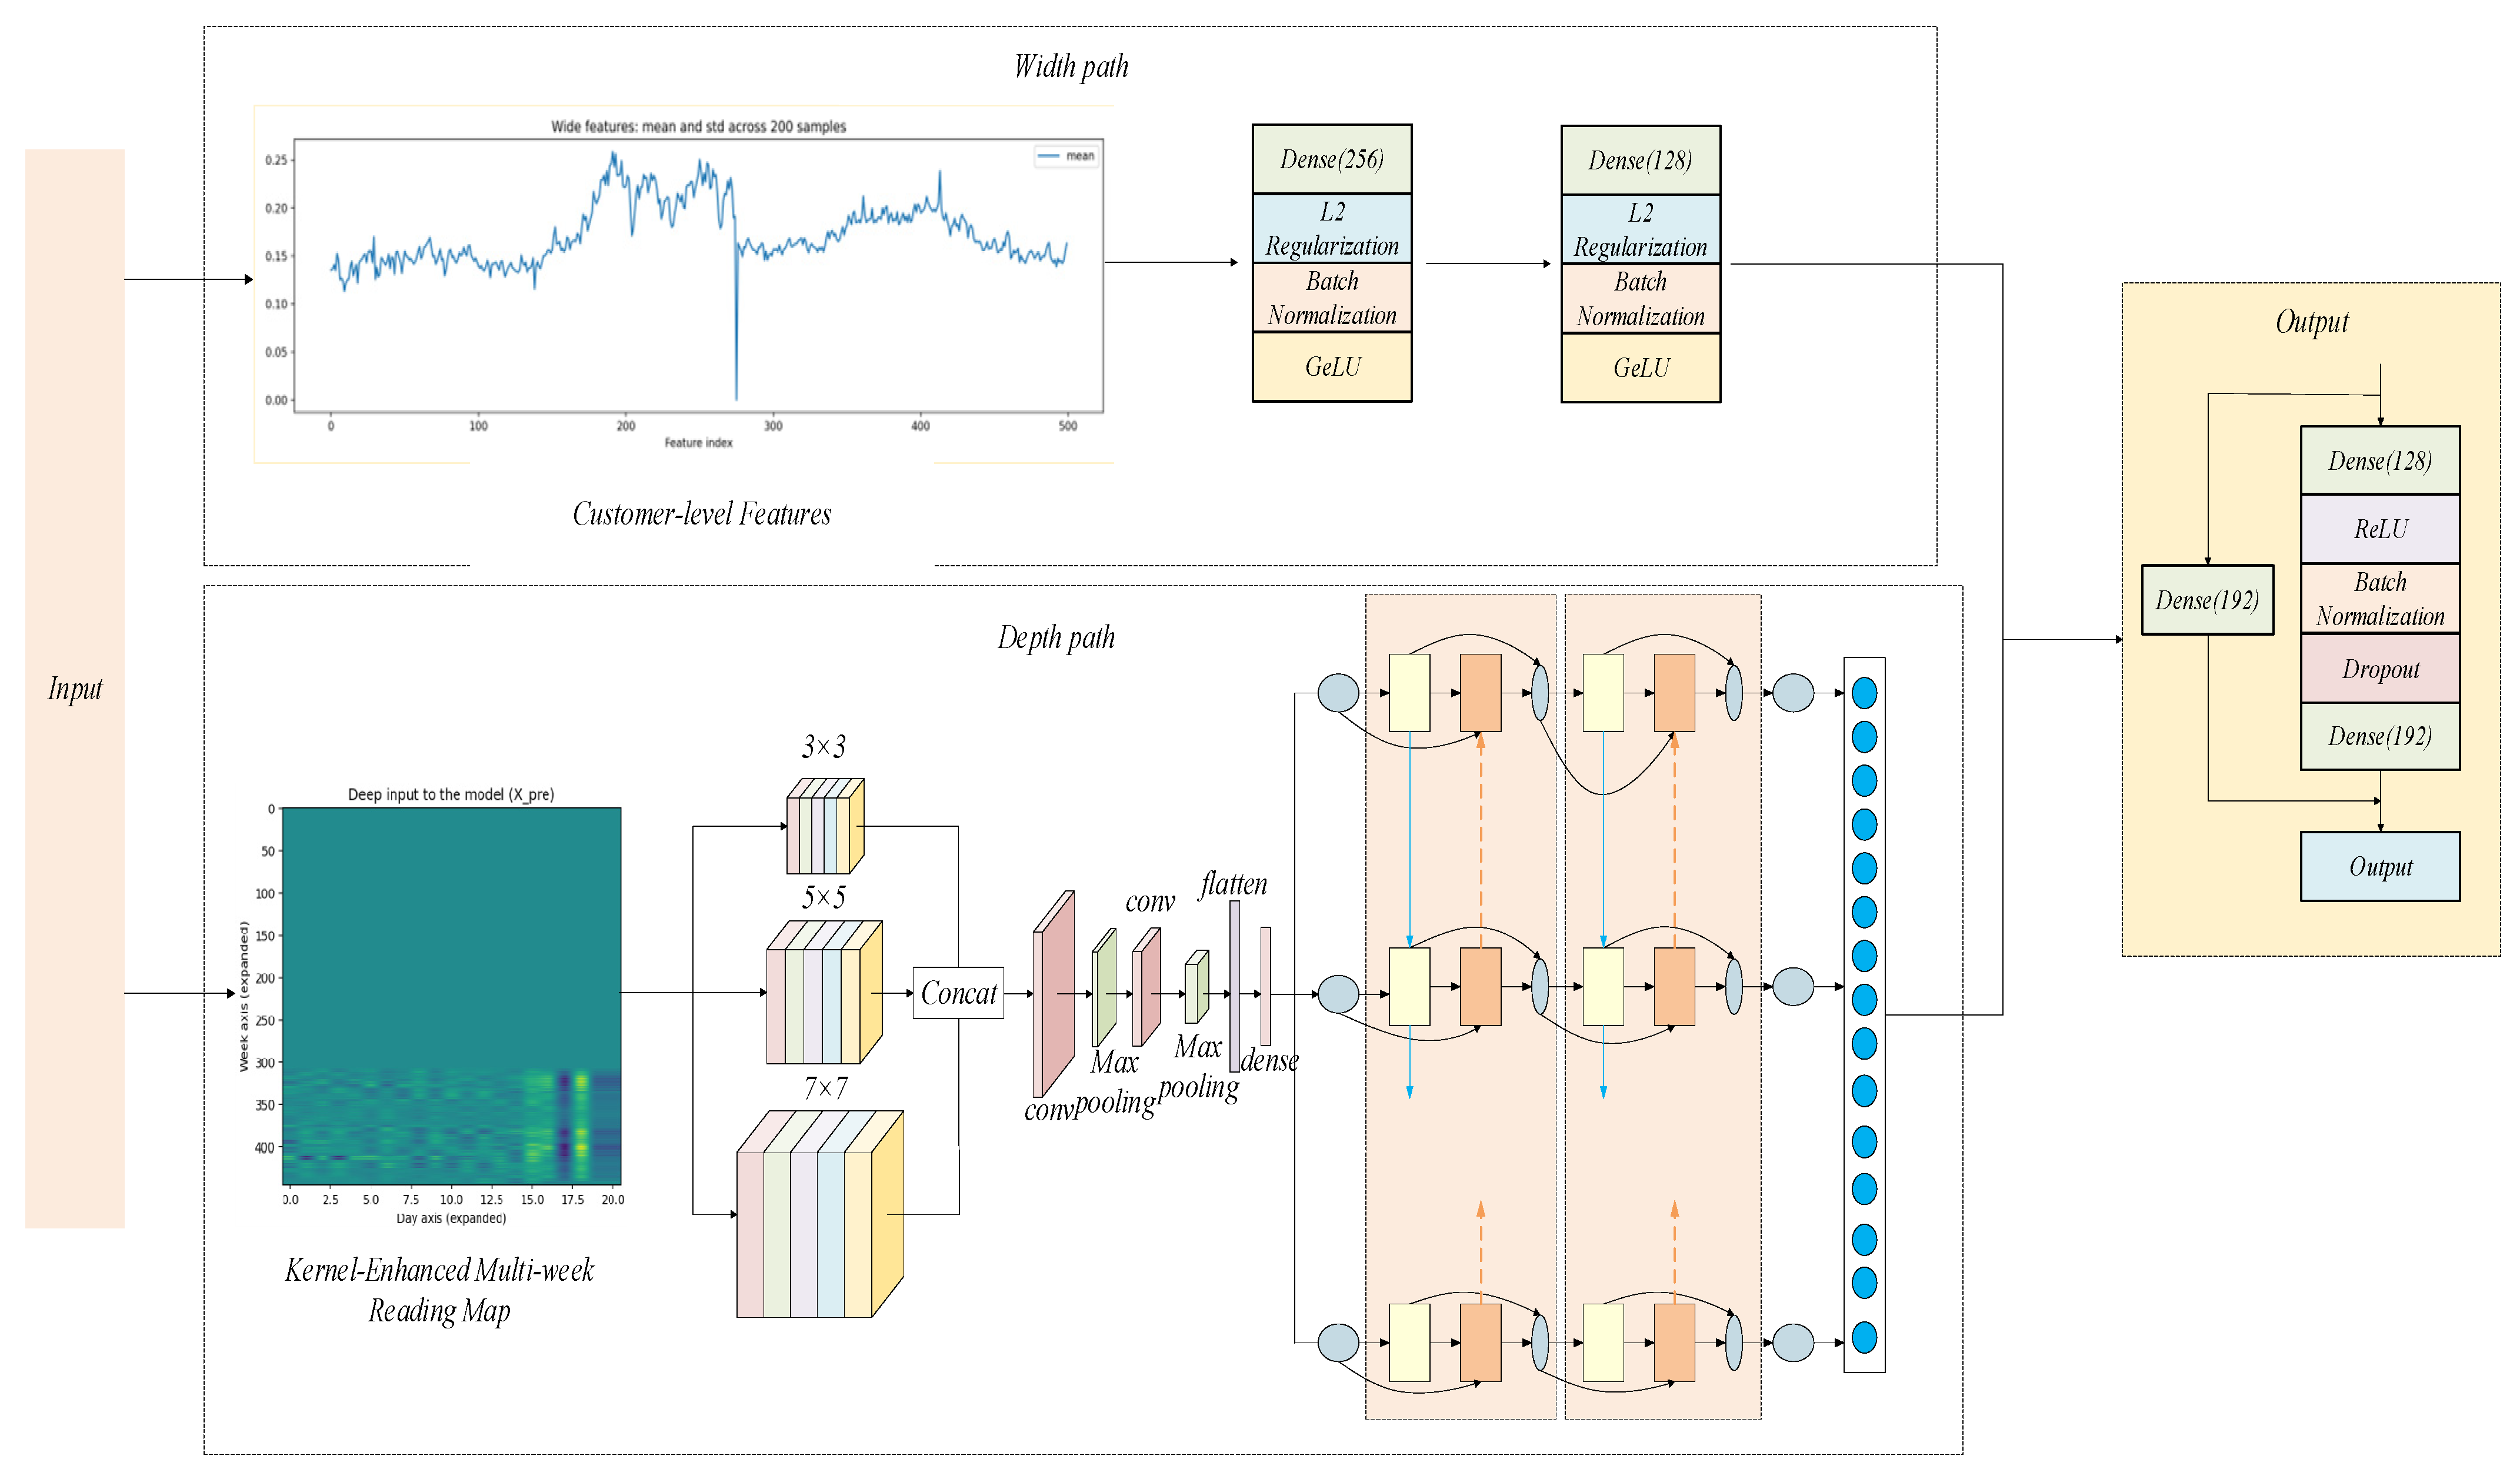
This work proposes Bayesian-Optimized Wide-and-Deep Multi-Scale Spatiotemporal Bidirectional LSTM (BO-WDMS-BiLSTM), a dual-branch model for electricity theft detection that maps heterogeneous customer information and consumption dynamics to a single probability of theft as shown in Figure 1. The pipeline takes a wide input consisting of engineered, low-dimensional customer or billing features and a deep input formed as a 2D representation of multi-week load data. In the wide branch, a lightweight feed-forward block (Wide Feature Branch) captures additive effects and stable customer-level signals with regularized dense layers. In parallel, the deep branch begins with a Multi-Scale Spatiotemporal Convolution (MSC) Module, where parallel convolutional kernels at different receptive fields learn complementary patterns associated with routine usage, localized irregularities, and longer-range shifts; their feature maps are fused and compressed to obtain a compact spatiotemporal embedding. That embedding is then reshaped into a sequence and processed by a Bidirectional LSTM (BiLSTM) Temporal Module, which models dependencies in both forward and backward directions to better capture reversible or delayed behavioral cues that can occur around tampering events. The outputs of the two branches are concatenated and passed through a residual fusion head (Residual Feature Fusion Head) to stabilize training and preserve information from each branch before producing the final sigmoid prediction. Model selection is driven by a Bayesian Hyperparameter Optimization (BO) Module, which searches learning rate and recurrent capacity in a data-efficient manner and returns the configuration that maximizes validation performance.
Figure 1.
The structure diagram of BO-WDMS-BiLSTM Model.
2.1. Dual-Branch Wide–Deep Architecture for Electricity Theft Detection
To address the practical difficulty of detecting electricity theft from consumption records that are noisy, highly variable across households, and often weakly separable from legitimate behavior, we design a Dual-Branch Wide–Deep Electricity Theft Detector (DW2ETD) that jointly models compact, domain-informed indicators and high-dimensional spatiotemporal load patterns within a single probabilistic framework. Given a sample , where collects wide features (e.g., summary statistics or billing-cycle indicators) and encodes structured usage segments, the model learns a wide embedding and a deep embedding , fuses them, and outputs a theft probability :
is the wide feature vector; is the deep-input tensor; and are trainable weight matrices; and are bias vectors; is a non-linear activation; denotes the deep-branch mapping parameterized by ; is concatenation; is the fused representation with ; and are the output-layer parameters; is the sigmoid; is the predicted theft probability. Model learning minimizes a class-weight regularized risk to cope with the typically skewed prevalence of theft cases while discouraging overfitting:
is the number of training samples; is the ground-truth label (theft vs. normal); is the predicted probability; is the positive-class weight; is the regularization coefficient; is the Frobenius norm applied to matrices; denotes all trainable parameters across both branches (including , , and ). The class weight is applied to the positive class in order to mitigate class imbalance in the training data. Since positive samples are less frequent but more critical for the detection task, assigning them a larger weight increases the penalty for misclassifying them. During training, the weighted loss is directly minimized, and its gradients are computed through standard backpropagation. As a result, positive samples contribute more strongly to parameter updates, while the overall optimization procedure remains unchanged.
The proposed Dual-Branch Wide–Deep Electricity Theft Detector (DW2ETD) strengthens electricity theft detection by aligning model structure with how theft manifests in real consumption records. The wide branch compresses domain-relevant cues into a stable representation, which improves separability when the raw load profile alone is ambiguous, an important advantage in operational settings where benign behavior shifts due to weather, occupancy, or seasonal routines. In parallel, the deep branch learns higher-order spatiotemporal signatures that are difficult to encode by hand, allowing subtle theft patterns to be captured even when attackers attempt to mimic normal usage. Fusing these two views yields a representation that is both interpretable at the indicator level and expressive at the pattern level, which typically improves recall without inflating false alarms, critical for reducing unnecessary field inspections and maintaining trust in automated screening. The residual-style fusion further stabilizes gradient flow and supports consistent learning when the two branches contribute unevenly across customers. Finally, the class-weighted objective enhances sensitivity to the minority theft class, helping the detector remain effective under the severe imbalance that characterizes most utility datasets. Taken together, DW2ETD provides a practical path toward more reliable target selection for inspection, better recovery of non-technical losses, and more scalable deployment across heterogeneous customer populations.
2.2. Multi-Scale Spatiotemporal Convolution
To address the multi-periodic and scale-dependent signatures of electricity theft, where abnormal consumption may appear as brief distortions, gradual drifts, or week-level pattern reshaping, we design a Multi-Scale Spatiotemporal Convolution (MSSTC) block that extracts complementary features using parallel receptive fields and then fuses them into a compact representation. Given an input load tensor X , the multi-scale fusion is written as:
Followed by spatial compression and projection:
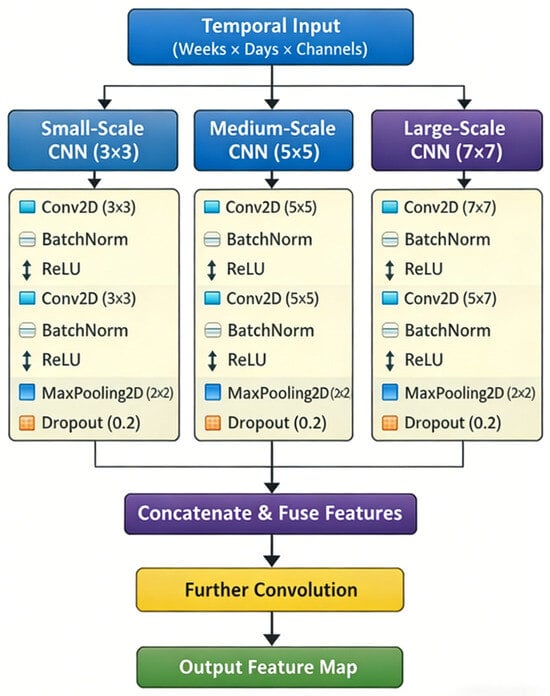
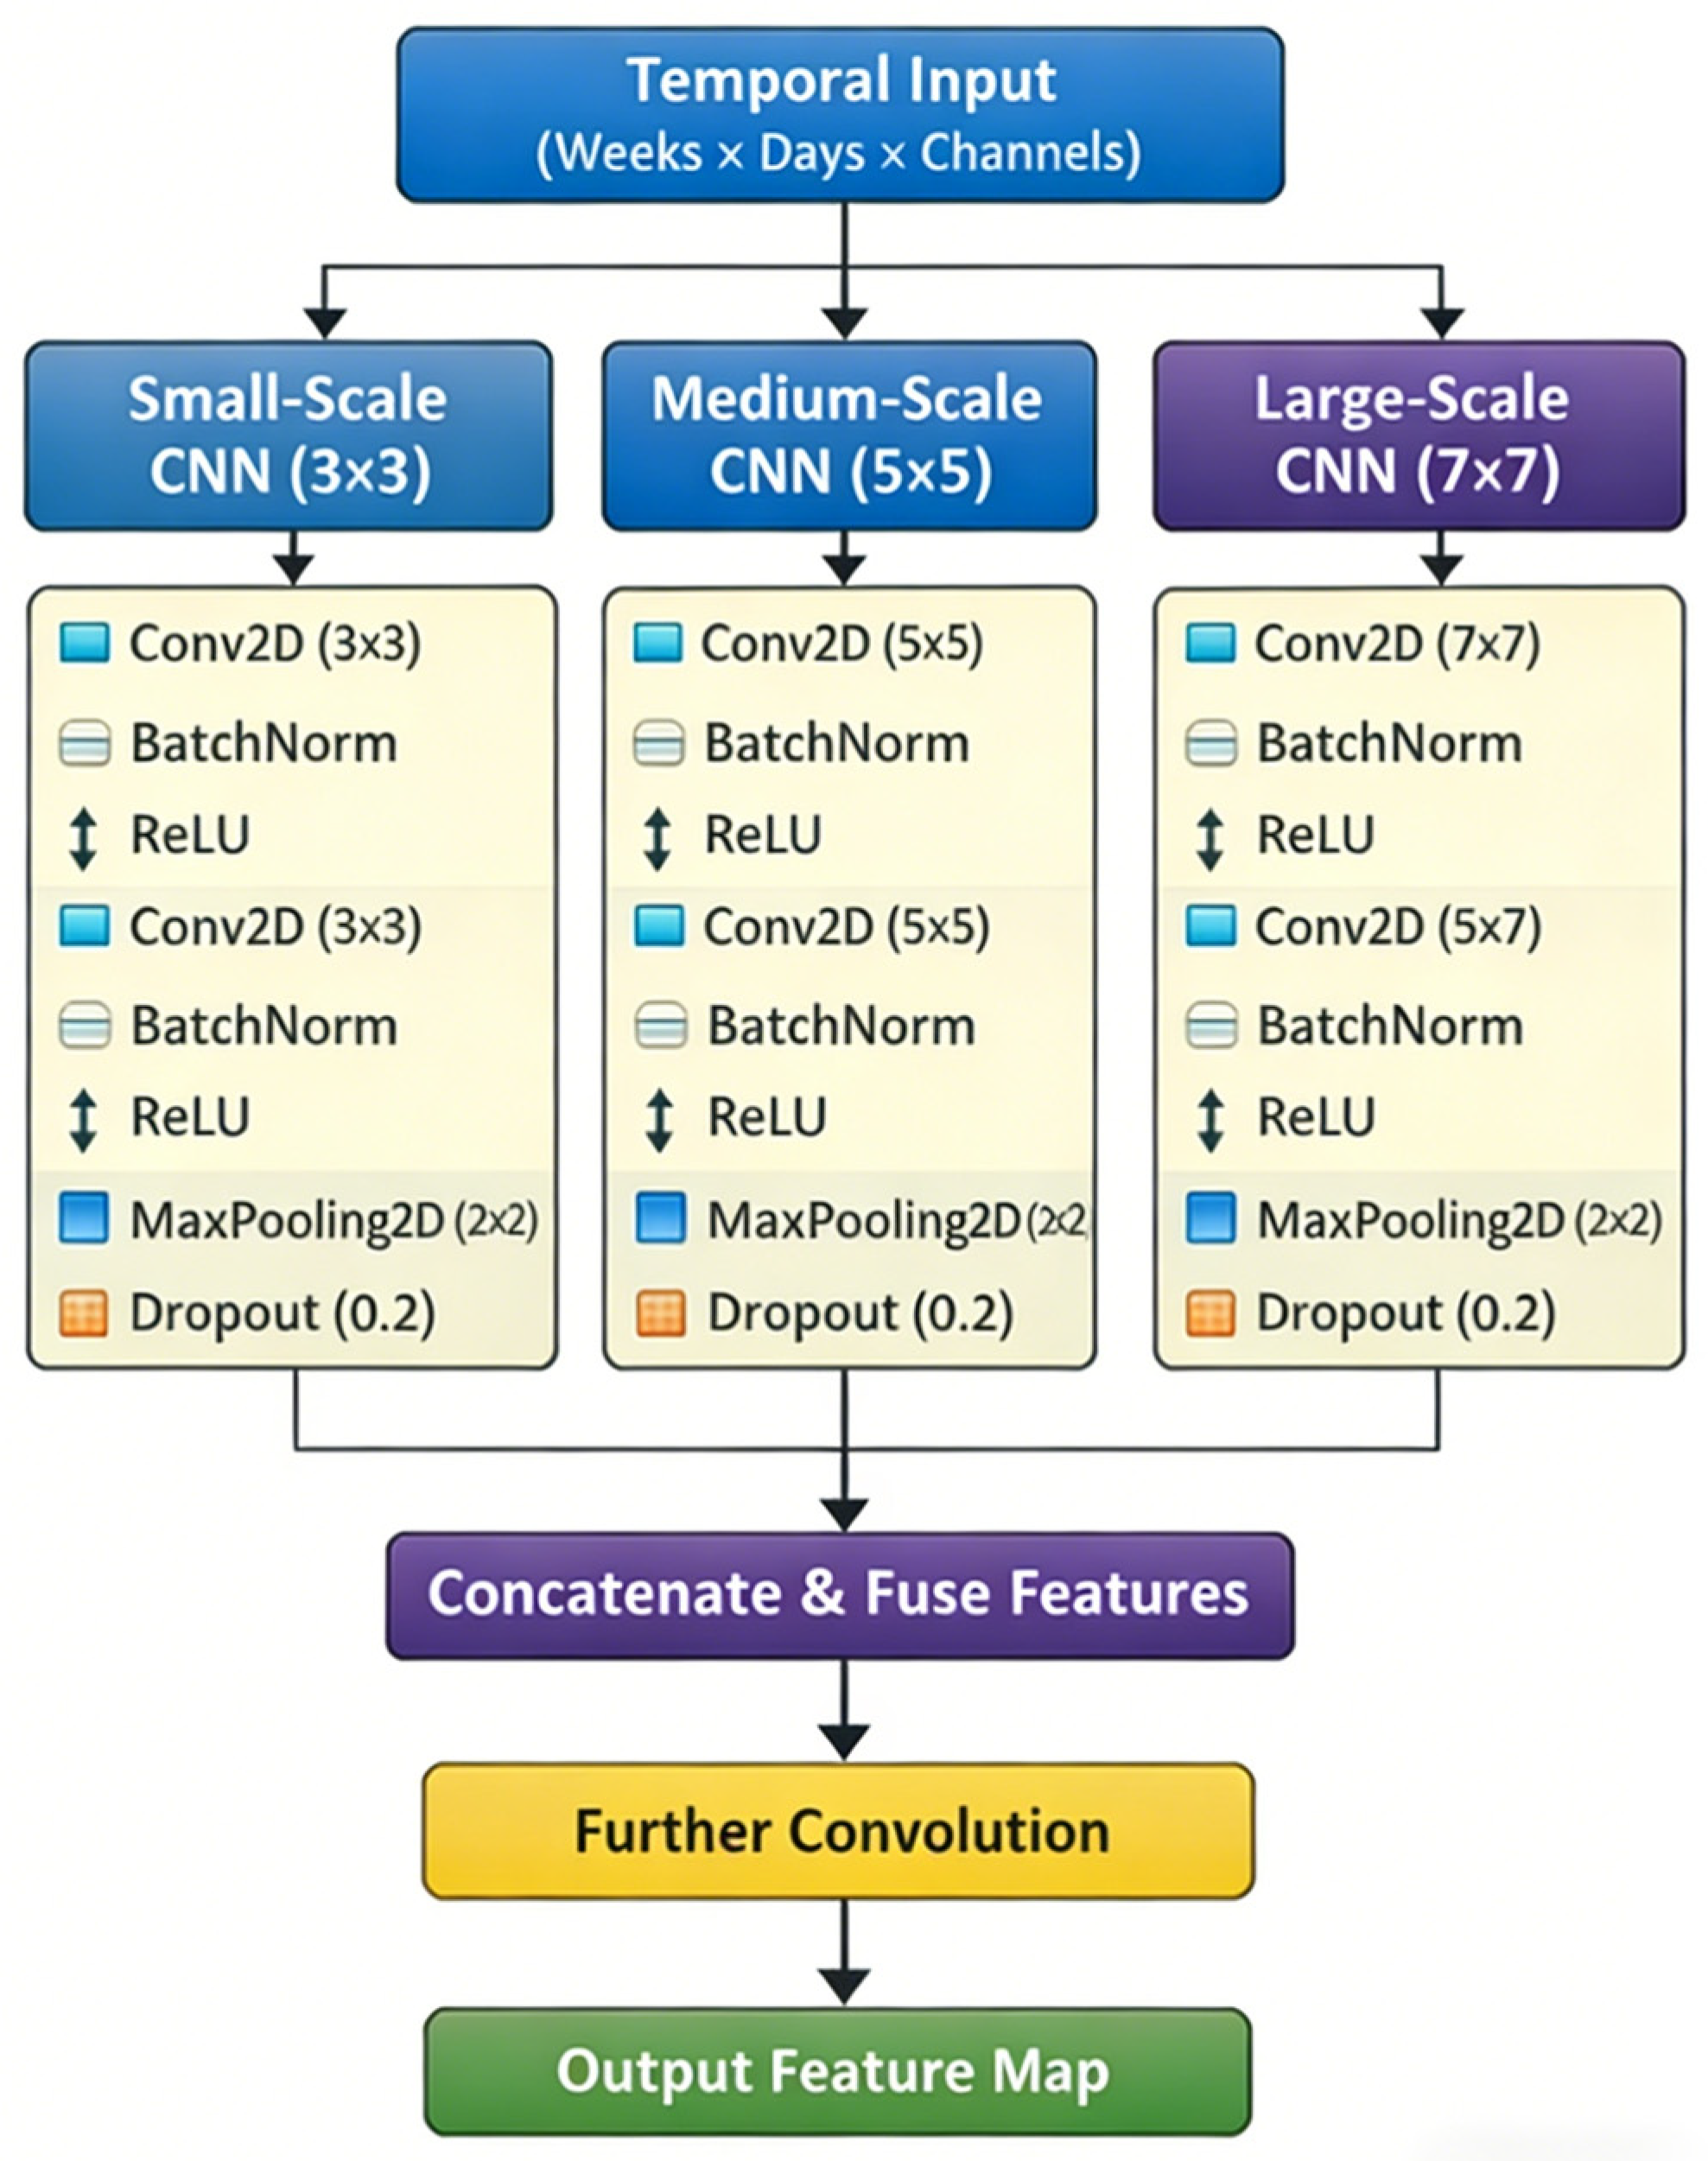
X is the spatiotemporal load tensor (e.g., a stacked time–day map with channels); and denote its two spatial/time axes; is the number of channels. and are the convolution kernel and bias at scale ; is 2-D convolution; is a learnable logit controlling the contribution of scale ; is the corresponding normalized weight. is batch normalization; is a non-linear activation. denotes down-sampling (e.g., max pooling). flattens a tensor into a vector. P and q are the projection matrix and bias that map the flattened features to an embedding U suitable for temporal modeling. The MSSTC block strengthens electricity theft detection by making the feature extractor sensitive to how fraudulent behavior presents at different temporal granularities, as shown in Figure 2.
Figure 2.
Schematic diagram of MSSTC module.
To capture load patterns at different temporal and contextual ranges, the proposed multiscale spatiotemporal convolution module employs parallel kernels of sizes , , and . The kernel focuses on fine-grained local variations, the kernel captures intermediate-range patterns, and the kernel provides a broader receptive field for more extended dependencies. This design allows the model to represent both short-term fluctuations and wider contextual structures within the input sequence.
The outputs from different branches are not treated equally by default. Instead, their contributions are adjusted during training through the subsequent feature fusion process, which enables the model to adaptively emphasize the most informative scale combinations for the final prediction.
In practice, some theft patterns appear as short, sharp drops; others as smoother distortions that only become clear over several days; and still others as long-horizon reshaping that preserves daily totals while altering periodic consistency. Multi-scale convolution helps separate these cases by capturing local irregularities and broader consumption structure in parallel, then fusing them into a unified representation. This improves discrimination between theft-induced anomalies and legitimate variability caused by weather, household routines, or seasonal shifts because the model is not forced to explain all behaviors with a single receptive field. As a result, the detector can retain sensitivity to subtle manipulation while reducing spurious triggers driven by normal demand fluctuations, which is essential for high-precision screening in operational settings.
2.3. BiLSTM-Based Temporal Modeling
To address temporal dependencies and delayed effects in electricity theft, where manipulation may be coordinated across days and can only be interpreted correctly when contextualized by nearby consumption patterns, we employ recurrent modeling over the MSSTC embeddings and then extend it to a Bidirectional LSTM (BiLSTM) to incorporate both preceding and succeeding context within a window. For an embedding sequence produced by MSSTC, an LSTM cell computes:
And BiLSTM aggregates forward and backward dynamics as:
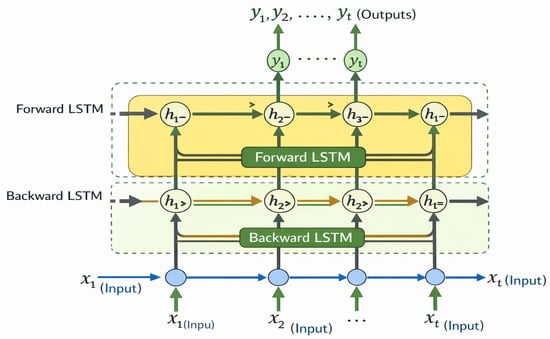
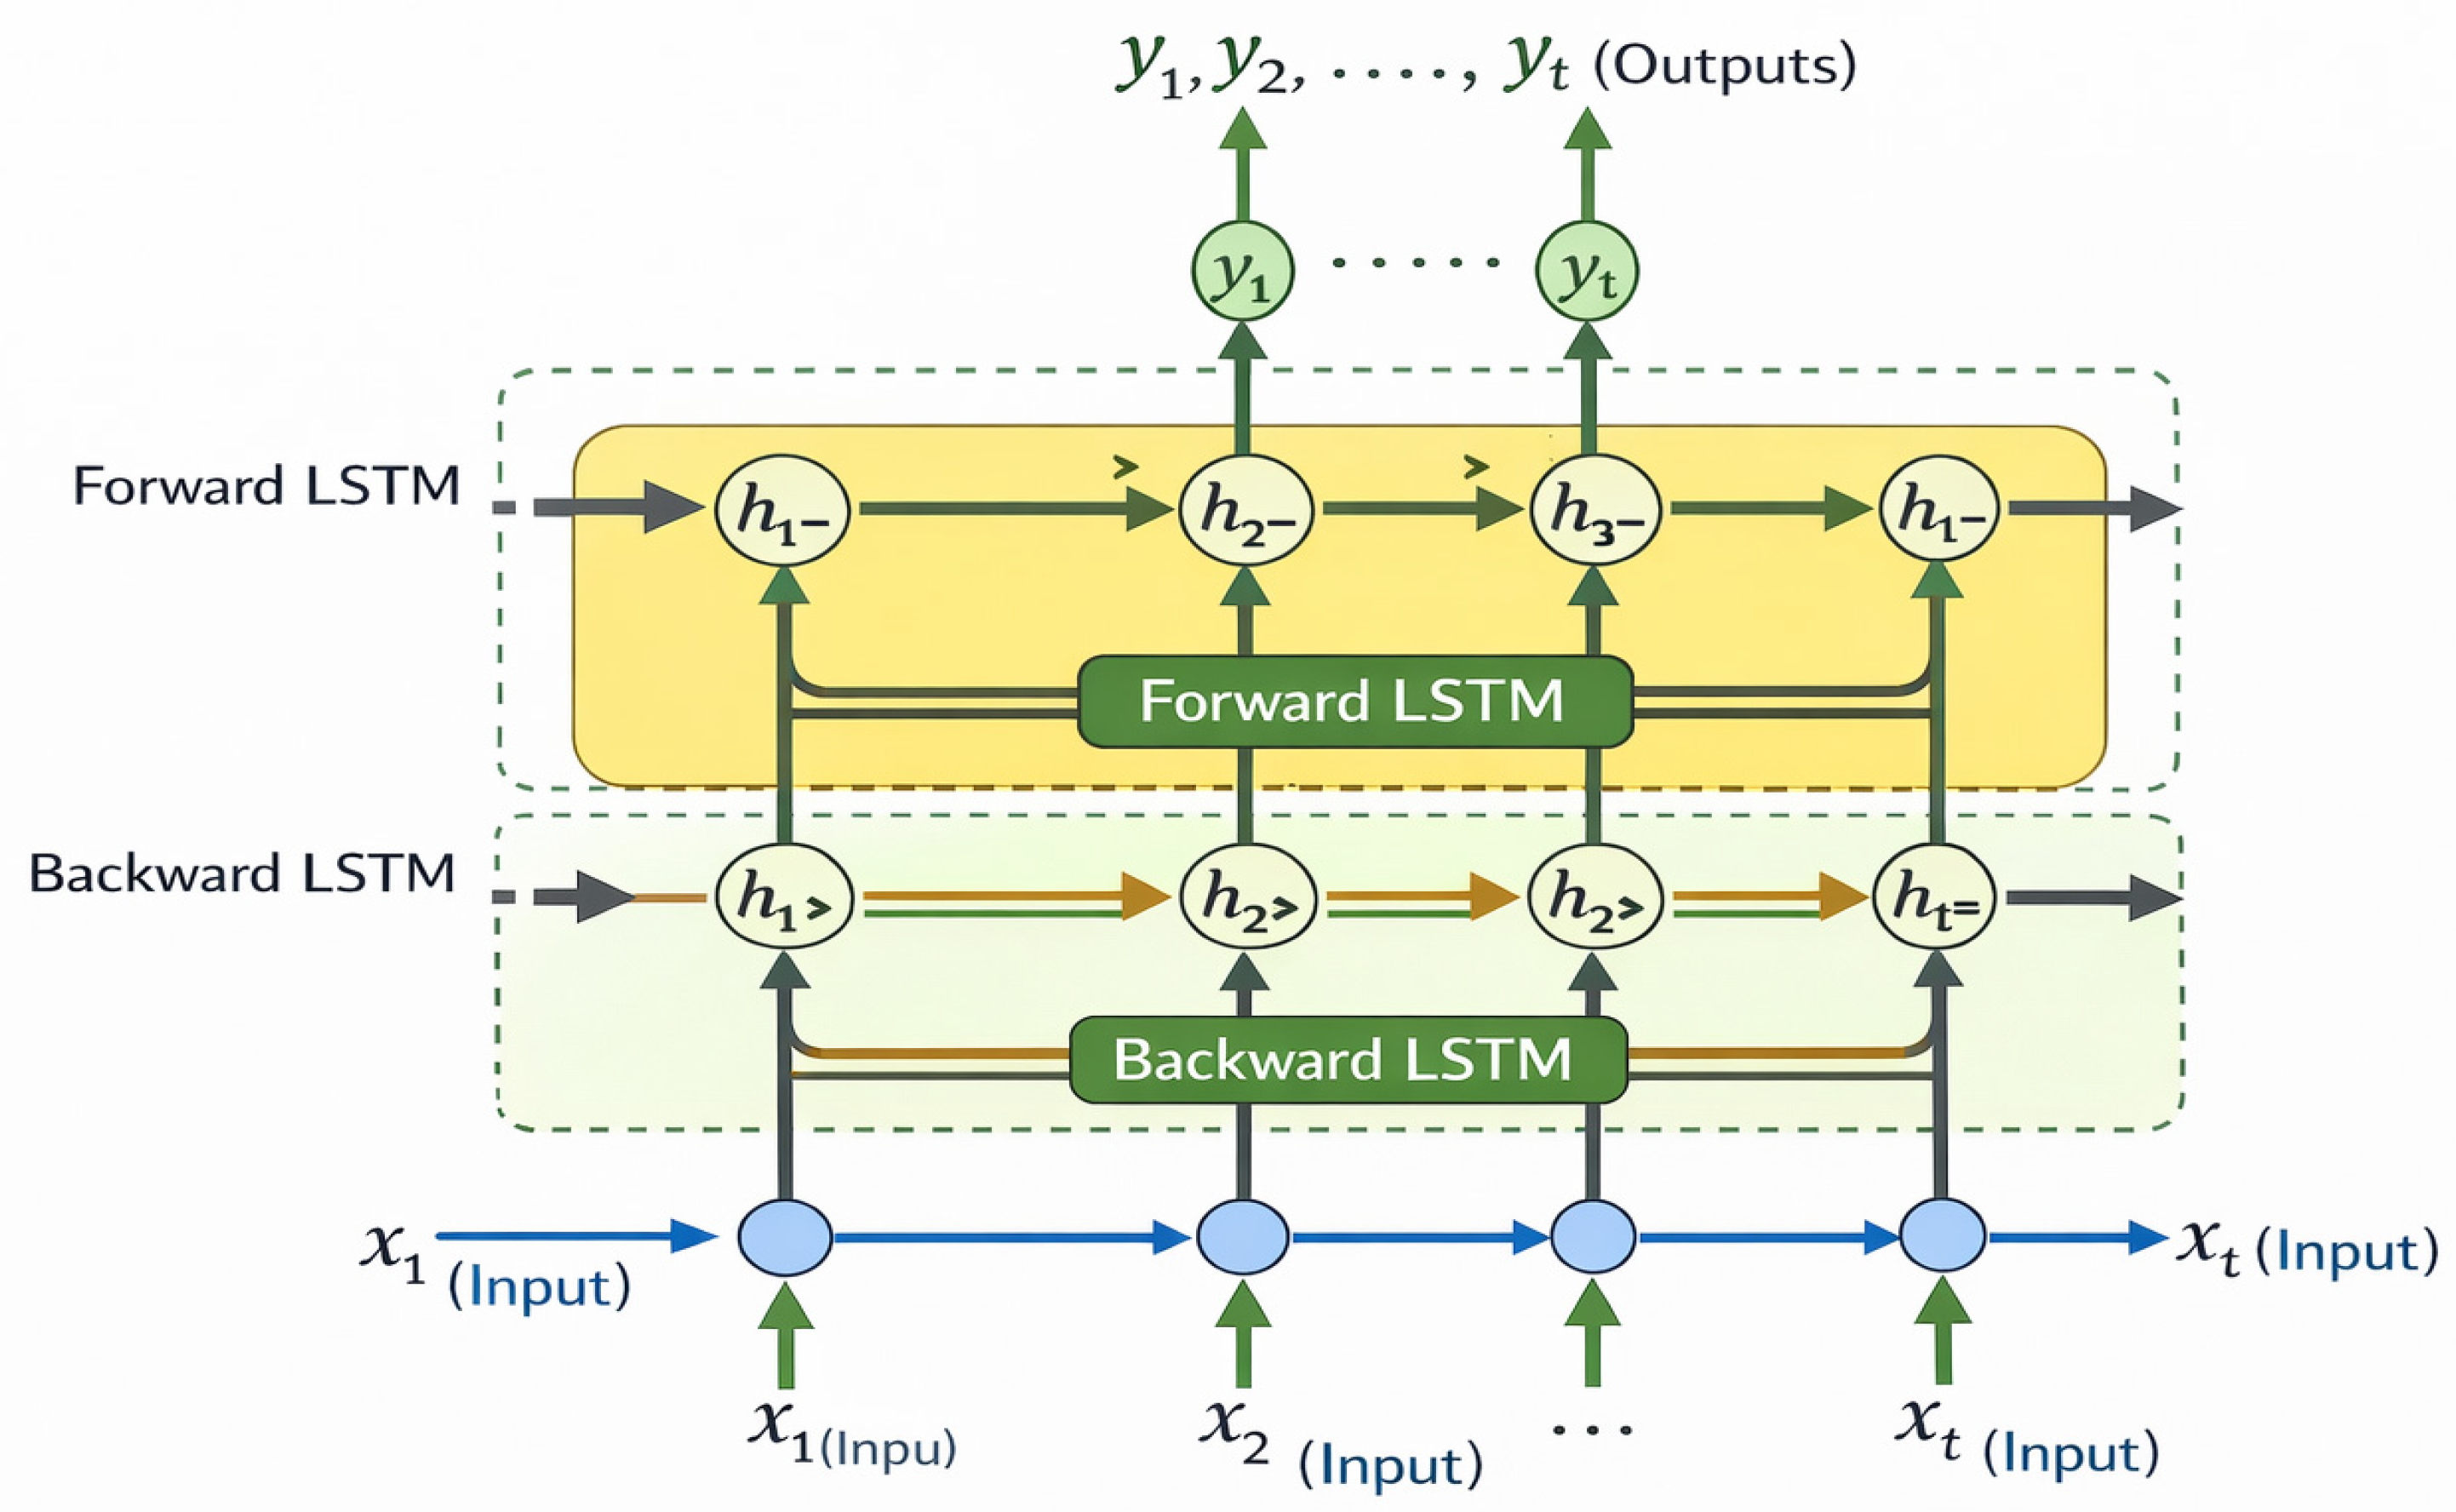
is the MSSTC embedding at time step ; is the sequence length. W and U are input-to-state and state-to-state weight matrices; d are bias vectors; are the input, forget, and output gates; is the candidate cell state; is the cell state; is the hidden state; is the sigmoid function; is the hyperbolic tangent; denotes elementwise multiplication. The BiLSTM further captures temporal dependencies in both forward and backward directions. At time step , the forward hidden state is computed from the current input and the previous forward state , while the backward hidden state is computed from and the subsequent backward state . The two directional states are then concatenated to form the bidirectional representation . Finally, the sequence is aggregated into a fixed-length vector for downstream classification. The architecture of the BiLSTM model is illustrated in Figure 3.
Figure 3.
The structure diagram of BiLSTM.
The BiLSTM module improves electricity theft detection by modeling context-dependent deviations rather than treating each observation as an isolated event. Fraudulent consumption is often designed to look plausible at individual time points, yet it breaks temporal consistency when viewed within a broader sequence; bidirectional recurrence makes this inconsistency easier to expose by leveraging both historical and future context within the detection window. Compared with a unidirectional recurrent model, BiLSTM provides a richer interpretation of ambiguous segments, because the representation at time t is informed by patterns that appear before and after t, which is particularly useful for intermittent theft and gradual evasion strategies. This temporal reasoning increases robustness to benign changes such as temporary absence, appliance scheduling, and weekend effects, while maintaining responsiveness to manipulations that systematically alter the sequence dynamics. In deployment, that translates into more stable decision boundaries over time and more reliable ranking of suspicious customers for follow-up inspection.
2.4. Bayesian Optimization for Hyperparameter Tuning
To address the sensitivity of electricity theft detection models to hyperparameter choices under highly imbalanced and noisy consumption data, we adopt a Bayesian Optimization (BO) strategy to tune the training dynamics and model capacity in a sample-efficient manner. Let the hyperparameter vector be , where is the learning rate, denotes the BiLSTM hidden width, and is the effective dropout rate applied to the representation. The tuning objective is formulated as a constrained risk minimization problem over a validation set :
where and are computed on using the detector trained with , and control the trade-off between ranking quality, probabilistic calibration, and over-tuning. is the hyperparameter vector; is the feasible hyperparameter search space; is the scalar acquisition objective; is the area under the ROC curve; is binary cross-entropy; are nonnegative weights.
BO models the unknown mapping with a probabilistic surrogate, typically a Gaussian process:
which yields a posterior mean and uncertainty after evaluations. is the prior mean function; is the kernel; is the signal variance; is a positive-definite length-scale matrix (matrix, bold and not italic); and are the posterior mean and standard deviation after trials.
The next trial is selected by maximizing an acquisition function that balances exploitation and exploration, using the expected improvement (EI) criterion.
where , and , are the standard normal Cumulative Distribution Function (CDF) and Probability Density Function (PDF). is expected improvement at iteration ; is the best observed objective value; controls exploration; and are the Gaussian CDF and PDF; is the next hyperparameter proposal.
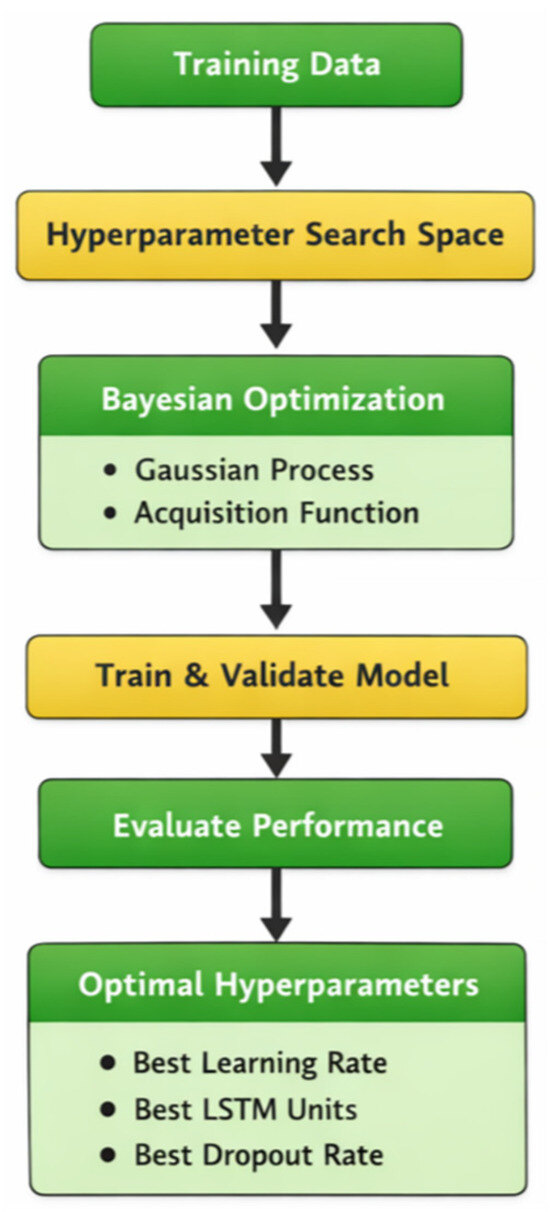
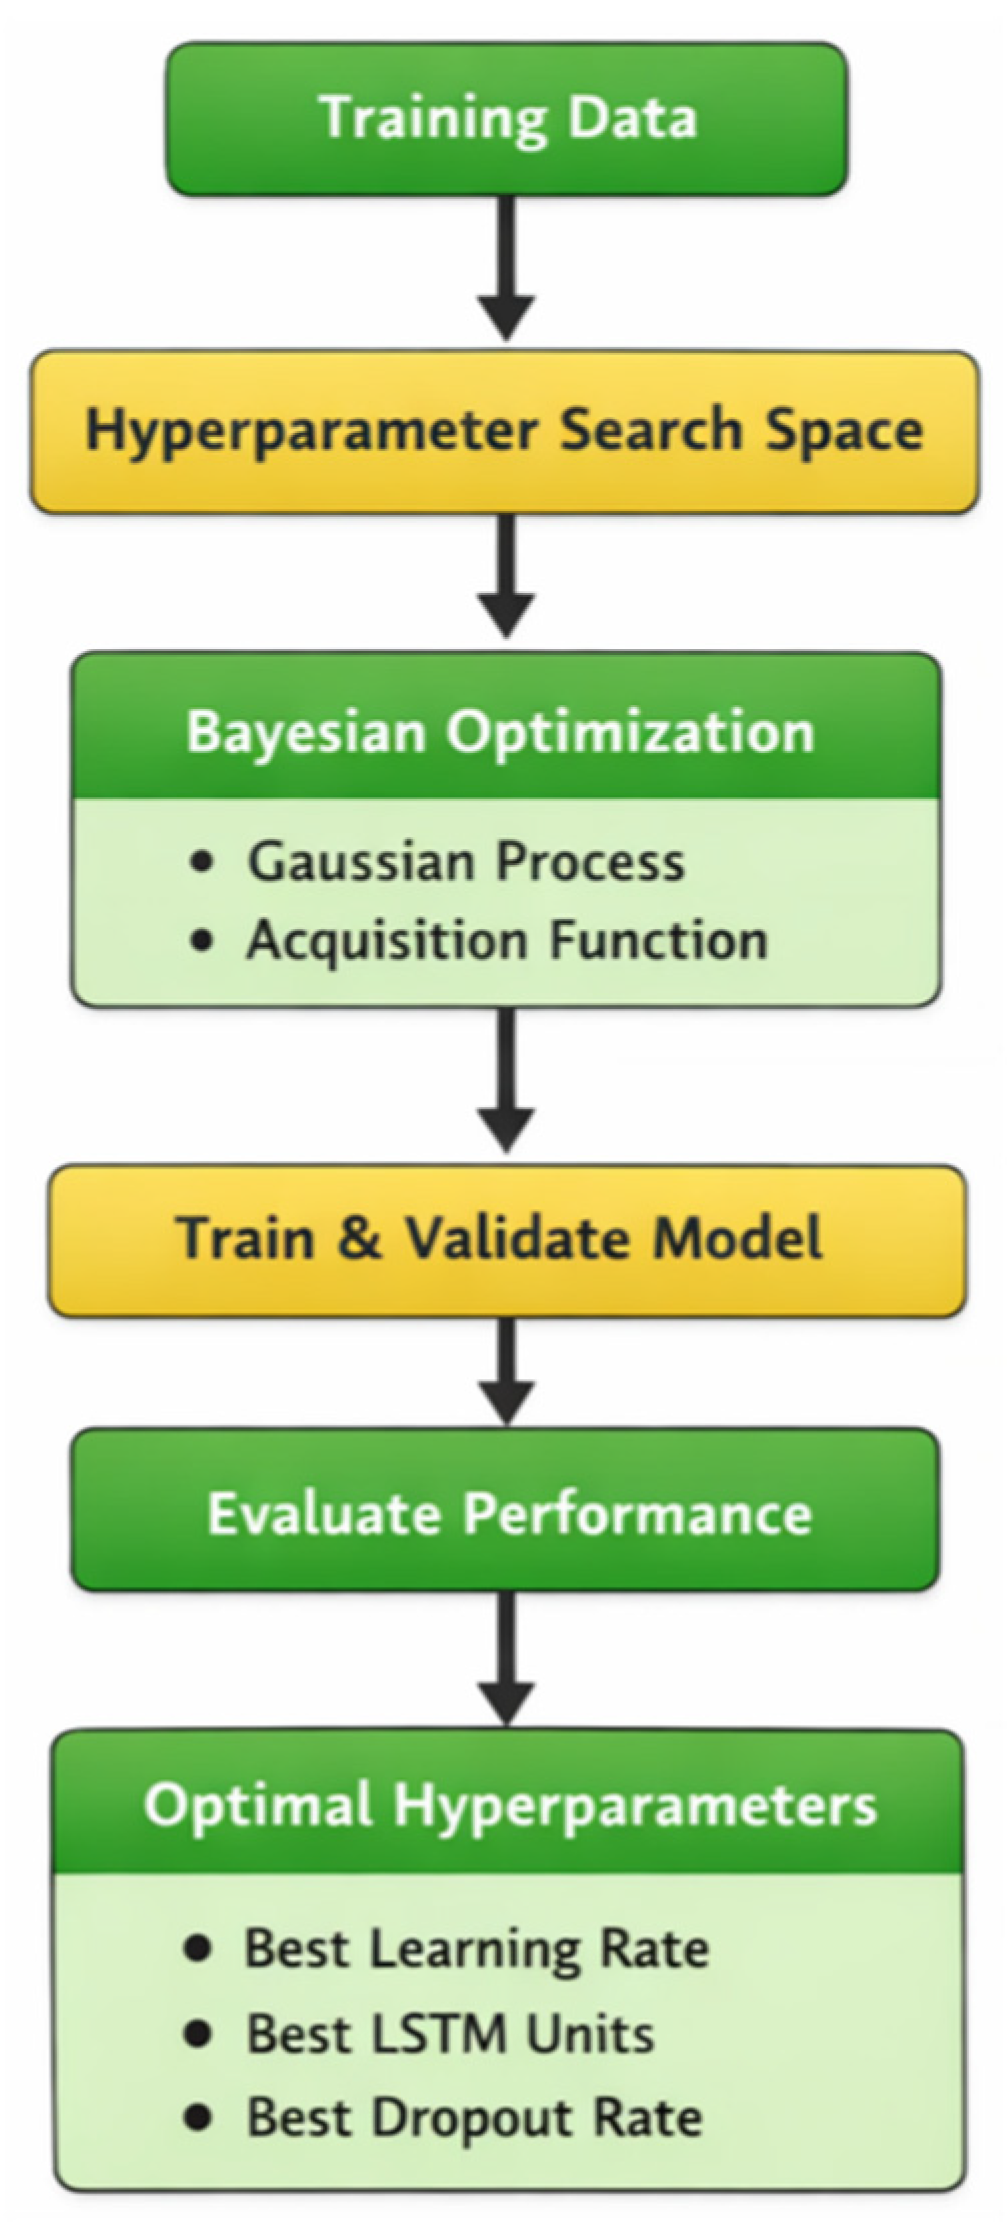
The architecture of the Bayesian optimization for hyperparameter tuning is illustrated in Figure 4. BO contributes directly to detection reliability by reducing the variance introduced by ad hoc tuning under class imbalance and consumption volatility. In electricity theft scenarios, small changes in learning rate or recurrent width can shift the operating point from “high recall but noisy alarms” to “high precision but missed fraud,” which is costly for utilities that rely on targeted inspections. By treating validation performance as a costly black-box function and explicitly modeling uncertainty, BO reaches strong configurations with fewer trials than grid or random search, which is particularly valuable when each training run is expensive. The acquisition-driven exploration also lowers the risk of locking into brittle local optima that fits one data split or a narrow subset of theft behaviors. In practical deployments, this leads to more stable AUC and calibration across time windows and customer groups, improves consistency of customer ranking for audit prioritization, and makes the overall pipeline easier to reproduce and maintain as the data distribution evolves.
Figure 4.
Bayesian optimization for hyperparameter tuning.
3. Results
To validate the proposed model’s effectiveness for electricity theft detection, we conducted a series of experiments to demonstrate its superior performance.
3.1. Datasets Description
The experiments use the public electricity-consumption dataset released by the State Grid Corporation of China (SGCC), which contains daily meter readings for 42,372 customers collected over a 1035-day period from 1 January 2014 to 31 October 2016. Each customer is associated with a binary label indicating normal behavior or electricity theft; 3615 customers are identified as theft cases and 38,757 as normal, yielding a markedly imbalanced class distribution (theft accounts for roughly 8–9% of users). The raw readings include missing entries and occasional abnormal values, reflecting realistic metering and data-management issues in large-scale AMI deployments; these imperfections motivate careful data cleaning before model training, while the SGCC-provided theft identities are treated as the ground-truth reference for evaluation.
In addition to the SGCC dataset, we further considered a binary electricity theft dataset constructed following the setting in the open-source toolbox of Liao et al. This dataset is built from real smart meter load profiles and simulated theft behaviors derived from predefined attack models named the Low Carbon London. In the representative example of that work, the raw load data were collected from the Low Carbon London project, which contains electricity consumption records for 5567 households in 111 blocks from November 2011 to February 2014, with a temporal resolution of 30 min. Based on these real load profiles, fraudulent samples were generated by applying standard attack models that modify the reported consumption patterns. For binary classification, normal load profiles are labeled as 0, whereas all fraud-induced load profiles are labeled as 1. This construction strategy provides a practical benchmark for electricity theft detection when publicly available datasets with real theft labels are limited.
3.2. Experiment Settings Description
All experiments were conducted on a workstation running Windows 10 and equipped with an Intel Core i5-14600KF CPU (Intel Corporation, Santa Clara, CA, USA), 32 GB RAM, and an NVIDIA GeForce RTX 4070 GPU (NVIDIA Corporation, Santa Clara, CA, USA) with CUDA 11.3 support. The proposed model was implemented in TensorFlow 2.6.2 and Keras 2.6.0. Model training and evaluation were conducted using NumPy 1.19.5, pandas 1.1.5, and scikit-learn 0.24.2. The initial learning rate and weight decay were set to and , respectively. Mini-batch training was performed with a batch size of 32 for 20 epochs. The dataset was randomly divided into training and validation subsets in an 80:20 ratio, and a fixed random seed was used to ensure reproducibility. The input to the deep branch was formatted as , where and denote the weekly and daily resolutions, respectively, and denotes the number of channels. The input to the wide branch was a feature vector of length .
To make the hyperparameter selection process more transparent, Bayesian optimization was used to tune the main training and architectural parameters of the model. The search covered the learning rate, the BiLSTM hidden size, the dropout rate, the batch size, the weight decay, and the fusion-layer dimension. These parameters were selected because they directly affect optimization stability, temporal representation capacity, regularization strength, and the effectiveness of feature integration across model branches.
The candidate values for the learning rate were . The candidate values for the BiLSTM hidden size were , those for the dropout rate were , those for the batch size were , those for the weight decay were , and those for the fusion-layer dimension were . These candidate sets were chosen to cover lightweight, moderate, and relatively high-capacity settings while keeping the search space computationally manageable.
The optimization procedure consisted of 5 random initializations followed by 10 guided iterations, with validation AUC used as the objective. The final configuration selected by this procedure used a learning rate of , a BiLSTM hidden size of 64, a dropout rate of 0.3, a batch size of 32, a weight decay of , and a fusion-layer dimension of 64. These values were fixed for all subsequent experiments.
Because smart meter data are collected over long periods in real operating environments, missing values and anomalous readings are unavoidable. To ensure data quality, missing values were handled before model training. Short gaps in the sequence were filled by linear interpolation, while boundary gaps were completed by forward or backward filling. Samples with an excessively high missing ratio were removed to avoid introducing unreliable temporal patterns.
Outliers were identified using a statistical screening rule and were treated as invalid observations. After detection, these abnormal values were converted to missing entries and processed using the same filling strategy. This preprocessing procedure reduced the influence of noise and improved the consistency of the input sequences used for training and evaluation.
3.3. Evaluation Metrics
Under the highly imbalanced setting of electricity theft detection, evaluation should capture both global ranking quality and the practical effectiveness of prioritizing a small set of customers for field inspection. We therefore report AUC and AUPRC as threshold-free measures of discrimination, MAP@100 and MAP@200 to quantify ranking performance under limited inspection budgets, and a Comprehensive Score to provide a single summary aligned with the weighting scheme used in our implementation.
is the decision threshold applied to the predicted probability . is the true positive rate and is the false positive rate, where are the confusion-matrix counts under . AUC measures how well the model ranks theft cases ahead of normal cases across all thresholds.
and denote precision and recall at the -th operating point induced by sorting and sweeping the threshold. Precision and recall . In our code, AUPRC is computed as average precision, which is more informative than AUC when theft samples are rare.
is the cut-off rank, and indicates whether the -th instance in the ranked list is a true theft. is the fraction of theft cases among the top- candidates.
is the inspection budget (here ), is precision at rank , and is the relevance indicator at rank . rewards models that place thieves earlier within the top- list.
Overall, these five metrics provide a balanced view of model quality for electricity theft detection. AUC reflects whether the model assigns consistently higher risk scores to theft cases than to normal users, independent of any operating threshold. AUPRC focuses on the precision–recall trade-off and is therefore more sensitive to minority-class performance, which is critical when theft events are rare. MAP@100 and MAP@200 evaluate how effectively the model concentrates true theft cases at the very top of the ranked list, matching the operational reality that utilities can only inspect a limited number of customers. The Comprehensive Score then consolidates these core signals with complementary indicators already implemented in our evaluation pipeline, enabling stable comparison across runs while still emphasizing ranking and imbalanced-class detection performance.
3.4. Comparative Experiments and Analysis
To evaluate how well the proposed detector can rank suspicious customers under the severe class imbalance typical of electricity theft detection, we conducted comparative experiments against representative classical learners (SVM, Random Forest), sequence models (GRU, LSTM), hybrid deep baselines (CNN–LSTM, Wide-CNN), and an attention-based Transformer, as shown in Table 1.
Table 1.
Performance comparison of baseline models and the proposed BO-WDMS-BiLSTM on the SGCC dataset (AUC, AUPRC, MAP@100, MAP@200; higher is better).
Across all four reported metrics, the performance trend is consistent: classical models lag behind neural architectures, while models that explicitly capture temporal structure and longer-range dependencies produce stronger ranking quality. SVM delivers an AUC of 0.7178 and an AUPRC of 0.2612, reflecting limited separability when theft signatures are subtle and consumption variability is high; Random Forest improves modestly (AUC 0.7364, AUPRC 0.2650), suggesting that non-linear decision boundaries help but remain constrained by hand-crafted feature capacity. Recurrent baselines substantially increase retrieval-oriented performance, with GRU reaching AUPRC 0.3377 and MAP@100 0.9283, indicating that temporal dependencies are informative for prioritizing inspections. LSTM raises AUC to 0.7639 but shows a lower AUPRC (0.3294), which is consistent with the reality that stronger overall ranking does not always translate into high precision in the extreme high-risk region. Hybrid architectures further improve early ranking: CNN–LSTM achieves MAP@100 0.9515 and MAP@200 0.9165, while Wide-CNN reaches a similar AUC (0.7756) but a slightly lower AUPRC (0.3652), implying that convolutional feature extraction helps discriminate normal seasonal/behavioral fluctuations from manipulation patterns, yet precision at low prevalence remains difficult.
The Transformer baseline delivers the strongest results among the non-proposed methods (AUC 0.7897, AUPRC 0.3919, MAP@200 0.9204), which aligns with the benefit of attention for capturing long-range correlations in consumption sequences. Even against this strongest comparator, BO-WDMS-BiLSTM shows clear gains: AUC increases from 0.7897 to 0.7977 (+0.0080), AUPRC rises from 0.3919 to 0.4111 (+0.0192), MAP@100 improves from 0.9320 to 0.9797 (+0.0477), and MAP@200 advances from 0.9204 to 0.9394 (+0.0190). The improvements in MAP@100 and MAP@200 are especially meaningful for the electricity theft setting because utilities typically act under a fixed inspection budget; concentrating more true theft cases at the very top of the ranked list directly reduces wasted site visits and increases recovered non-technical losses per inspection. Compared with CNN–LSTM, which is already competitive for early retrieval, the proposed model still lifts MAP@100 from 0.9515 to 0.9797 (+0.0282) and MAP@200 from 0.9165 to 0.9394 (+0.0229), indicating that the added bidirectional temporal modeling and multi-scale spatiotemporal representations strengthen ranking consistency beyond what convolution–recurrent coupling alone provides.
To further examine the generalization ability of the proposed method beyond the SGCC dataset, we additionally evaluated the model on a binary electricity theft dataset constructed following the setting of the open-source toolbox proposed by Liao et al. In that setting, fraudulent electricity-consumption profiles are generated from real smart meter load data using predefined attack models, and several classical classifiers are provided as reference baselines. This dataset offers a practical supplementary benchmark for electricity theft detection when publicly available datasets with real theft labels are limited. The comparison results are reported in Table 2.
Table 2.
Performance comparison of baseline models and the proposed BO-WDMS-BiLSTM on the Low Carbon London dataset (AUC, AUPRC, MAP@100, MAP@200; higher is better).
Overall, the proposed BO-WDMS-BiLSTM achieved the best performance across all evaluation metrics. Specifically, it obtained an AUC of 0.8192 and an AUPRC of 0.4321, outperforming the strongest baseline, namely the transformer model, which achieved 0.8105 in AUC and 0.4183 in AUPRC. This corresponds to absolute improvements of 0.0087 in AUC and 0.0138 in AUPRC. In terms of ranking quality, BO-WDMS-BiLSTM also delivered the highest MAP@100 and MAP@200 values, reaching 0.9854 and 0.9508, respectively, compared with 0.9766 and 0.9449 for the transformer baseline. These results indicate that the proposed architecture provides more effective discrimination between normal and fraudulent consumption patterns than both conventional learning methods and recent deep sequence models.
A closer examination of the baselines reveals a clear performance trend. Traditional machine learning models, such as SVM and RF, produced relatively lower scores, with AUC values of 0.7416 and 0.7587, respectively, suggesting that shallow models have limited ability to capture the complex temporal structure of electricity-consumption sequences. Sequence-based neural models, including GRU and LSTM, improved the results to 0.7814 and 0.7896 in AUC, respectively, which confirms the importance of temporal dependency modeling. Hybrid architectures, such as CNN-LSTM and Wide-CNN, further enhanced the ranking metrics, while the transformer model achieved the strongest baseline performance overall. Even so, BO-WDMS-BiLSTM remained consistently superior, which suggests that the combination of Bayesian hyperparameter optimization, wide-and-deep feature integration, multiscale convolution, and bidirectional temporal modeling yields a more complete representation of electricity theft behavior.
Table 3 compares the computational cost of BO-WDMS-BiLSTM with several baseline models in terms of parameter size, per-sample FLOPs, and inference latency.
Table 3.
Computational cost comparison of baseline models and BO-WDMS-BiLSTM.
As expected, traditional machine learning methods such as SVM and RF have the lowest computational cost, but their representation capacity is limited. Among the deep models, BO-WDMS-BiLSTM requires 2.87 M parameters and 27.4 M FLOPs per sample, which is higher than those of GRU, LSTM, and Wide-CNN, but remains lower than the transformer baseline, which reaches 3.84 M parameters and 35.7 M FLOPs. In terms of inference speed, BO-WDMS-BiLSTM requires 0.94 ms per sample, which is slightly slower than the lighter recurrent and convolutional baselines, but still faster than the transformer model. These results indicate that the proposed method introduces a moderate increase in computational cost in exchange for stronger representational ability, and overall achieves a reasonable balance between model complexity and practical deployability.
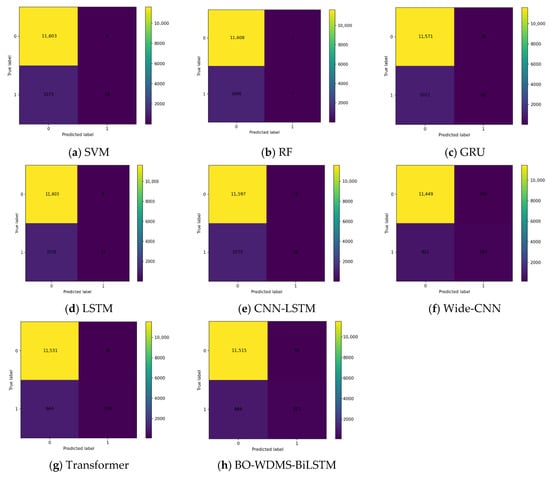
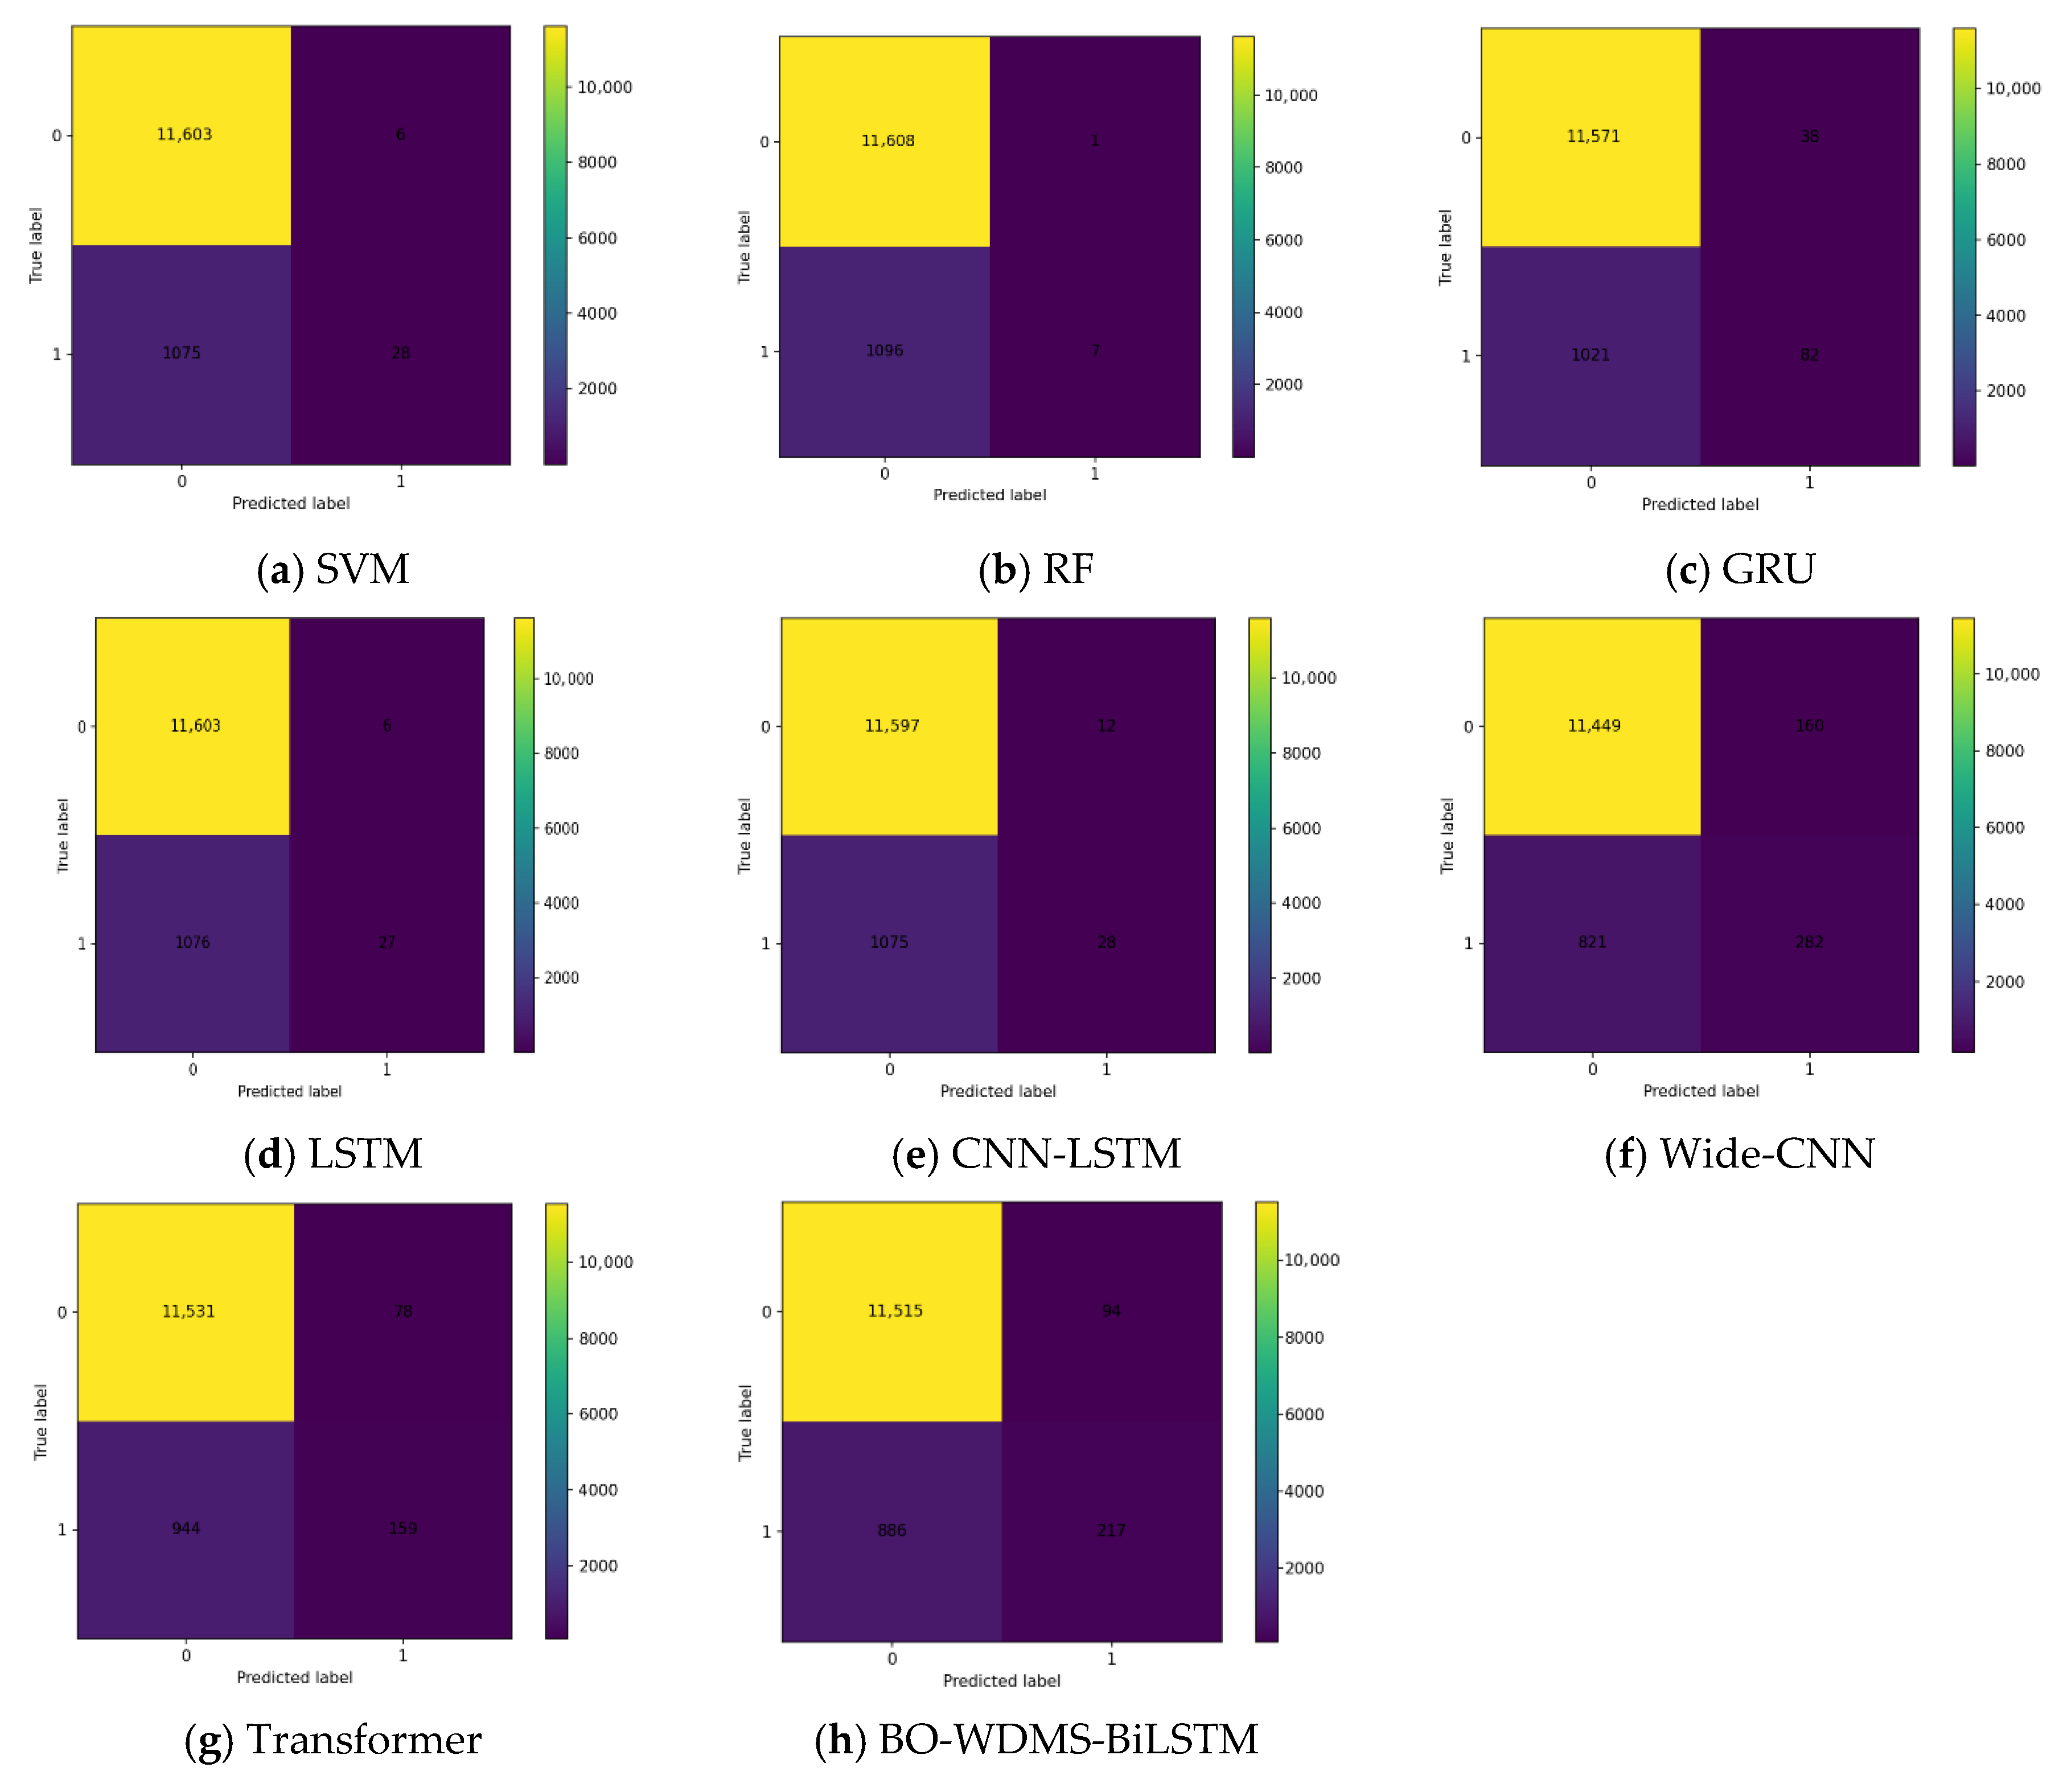
To complement the aggregate results in Table 1, we further examine how each model behaves at a fixed decision threshold. The confusion matrix offers an operational view of errors by separating false alarms from missed theft cases, which is critical in electricity theft detection where the costs of unnecessary inspections and undetected fraud are not symmetric. Presenting the confusion matrices side by side therefore clarifies whether a higher overall score is achieved through cleaner rejection of normal users, stronger capture of fraudulent users, or a more balanced trade-off between the two. The confusion matrix comparisons are reported in Figure 5.
Figure 5.
Confusion matrix for electricity theft detection on the test set. Rows denote true labels and columns denote predicted labels (0: normal, 1: theft). Each cell reports the number of samples, and a consistent color scale is used across methods to enable direct comparison.
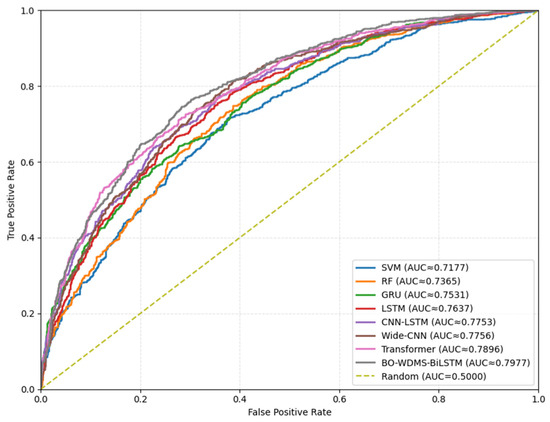
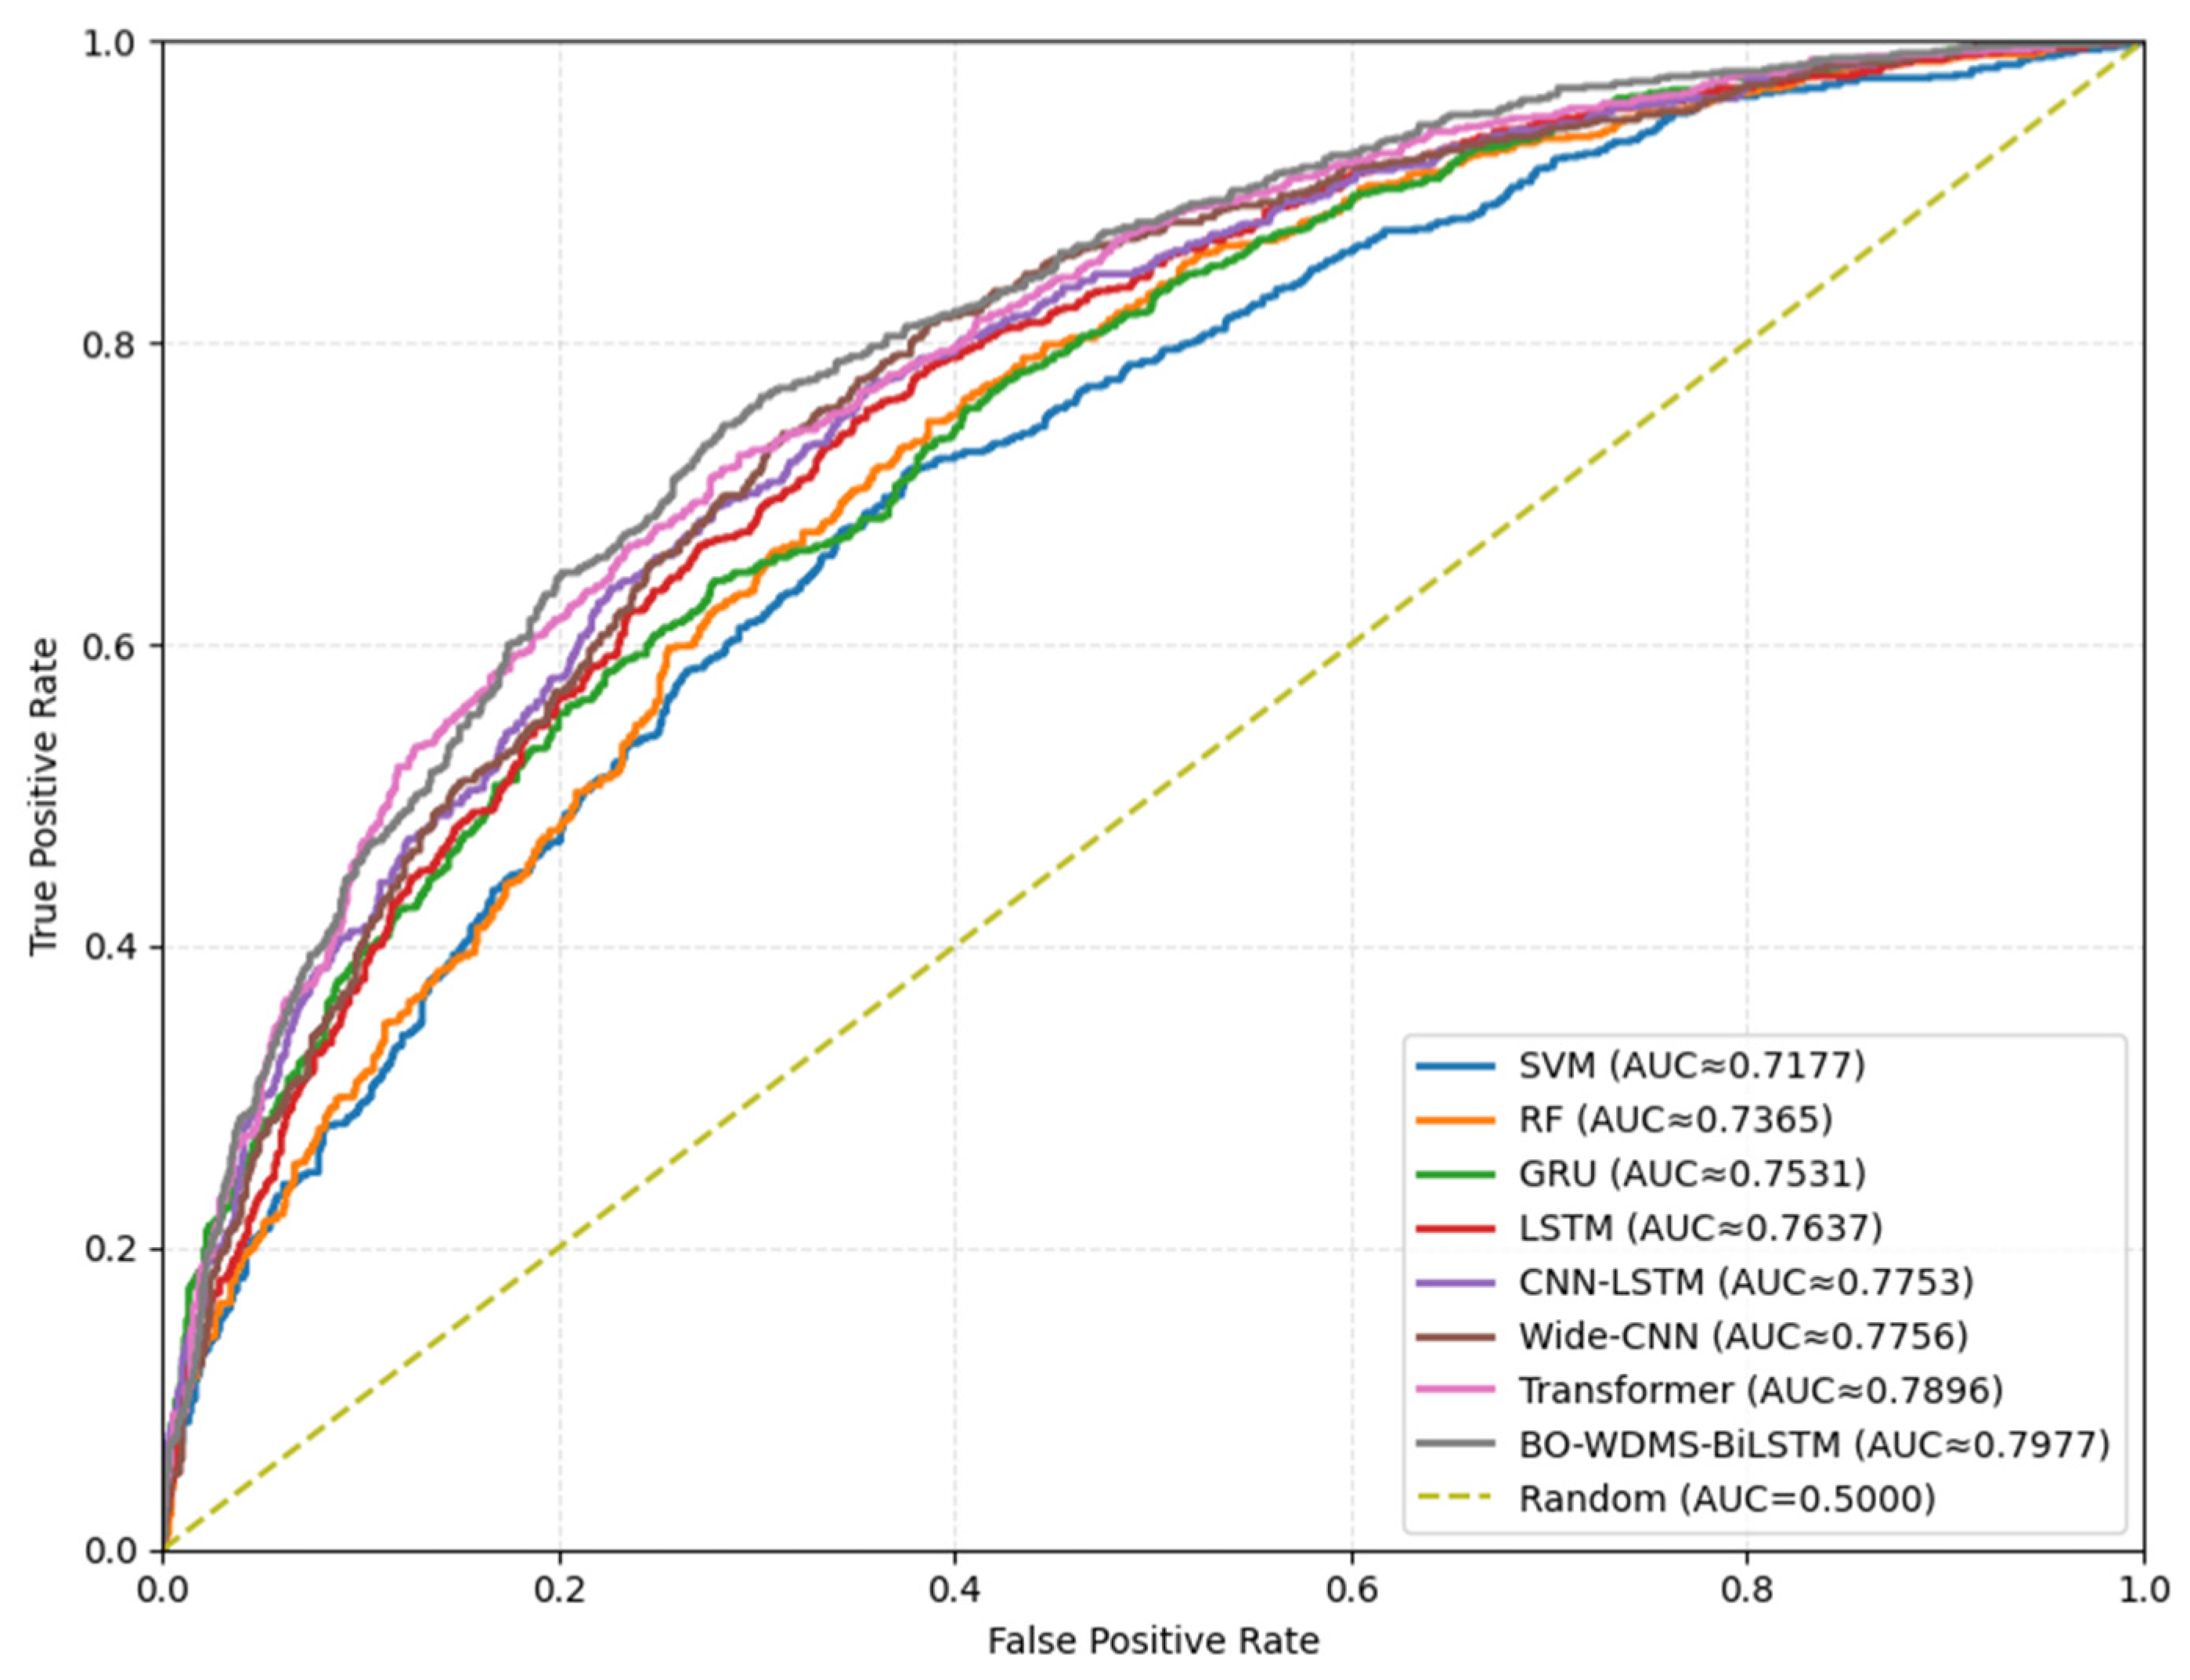
In addition, we report Receiver Operating Characteristic (ROC) curves to evaluate ranking quality across the full range of false-positive rates. ROC analysis characterizes how well each method separates normal and fraudulent consumption patterns independent of a particular operating point, providing a consistent basis for comparison across models. Together with PR curves, the ROC curves help distinguish models that merely shift the threshold trade-off from those that achieve genuinely better separability in the underlying score distributions. The ROC curve comparisons are presented in Figure 6.
Figure 6.
Receiver operating characteristic (ROC) curves for electricity theft detection on the test set. The dashed diagonal represents random guessing; curves closer to the upper-left corner and larger AUC indicate stronger discrimination.
3.5. Feature Representation Visualization with t-SNE
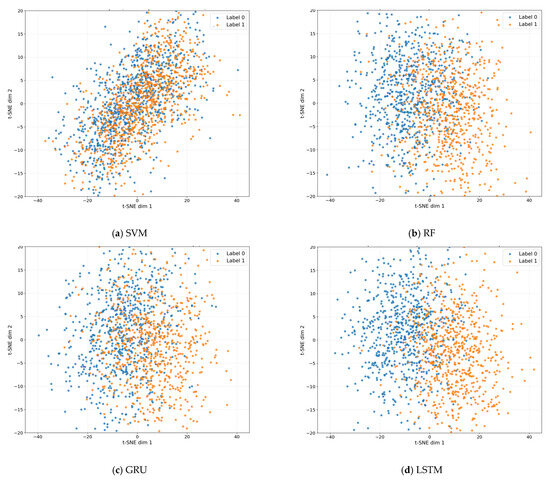
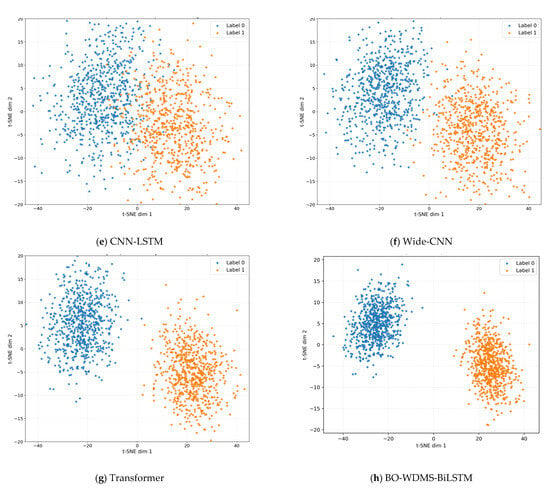
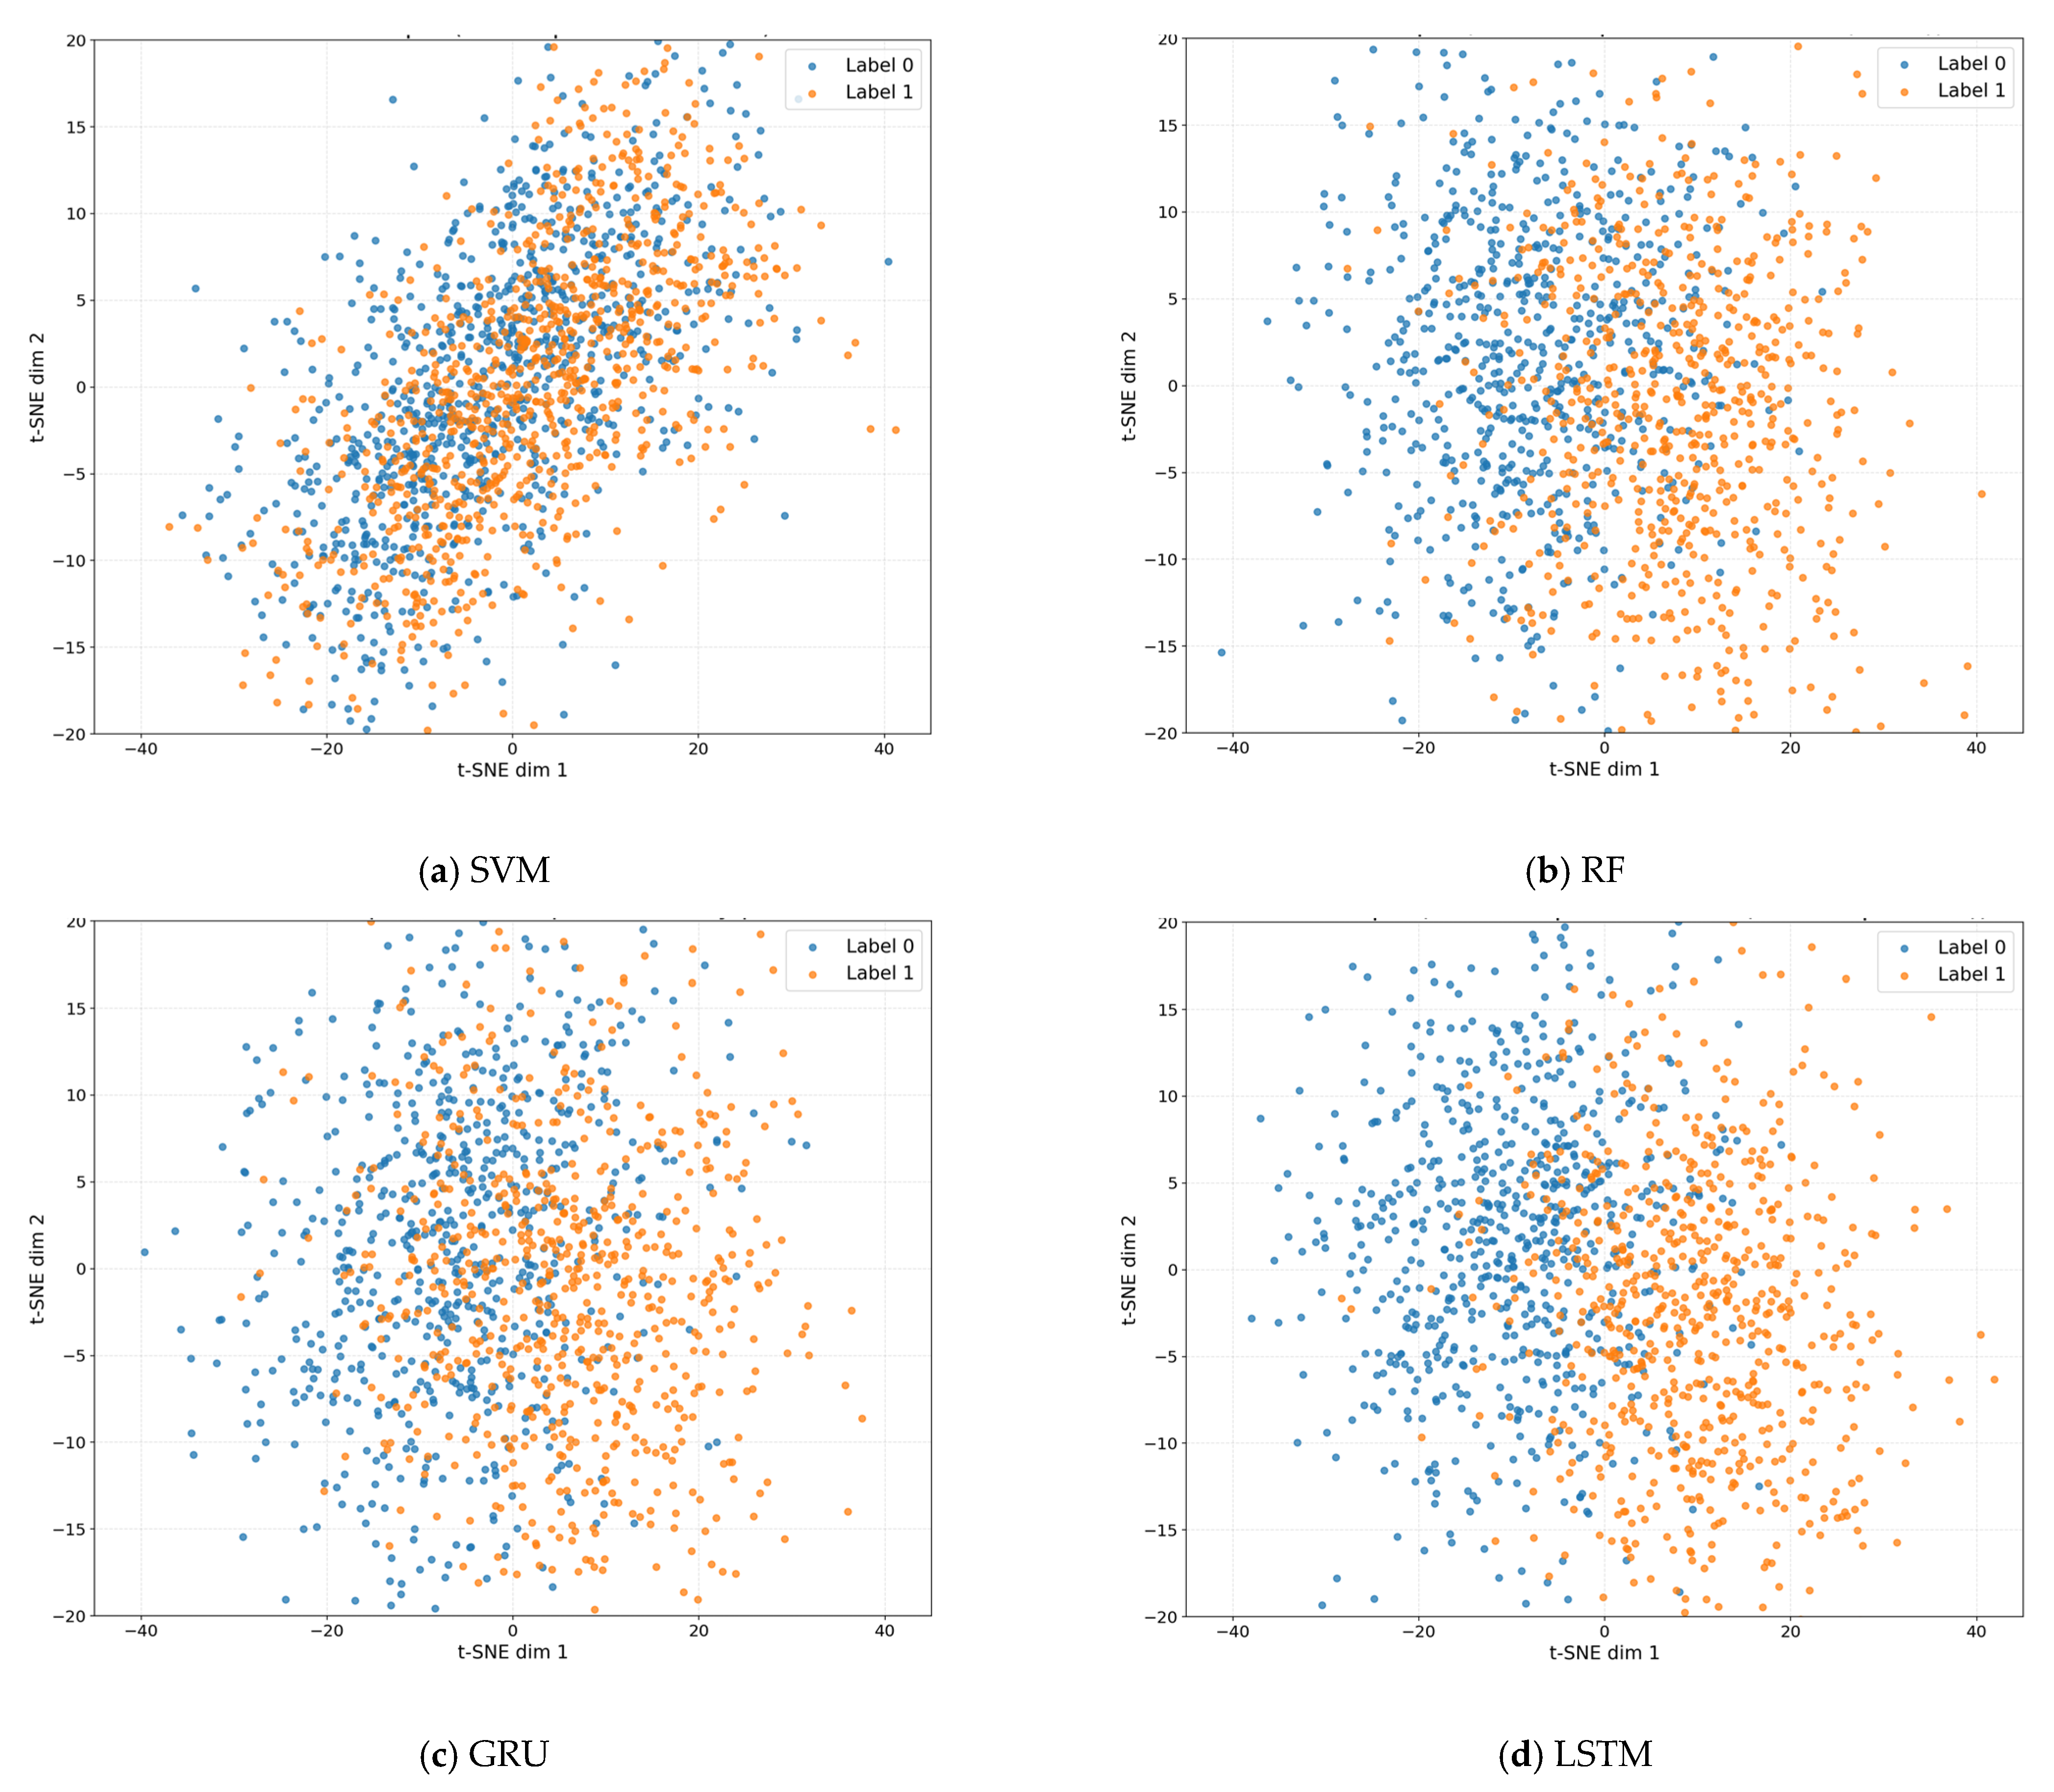
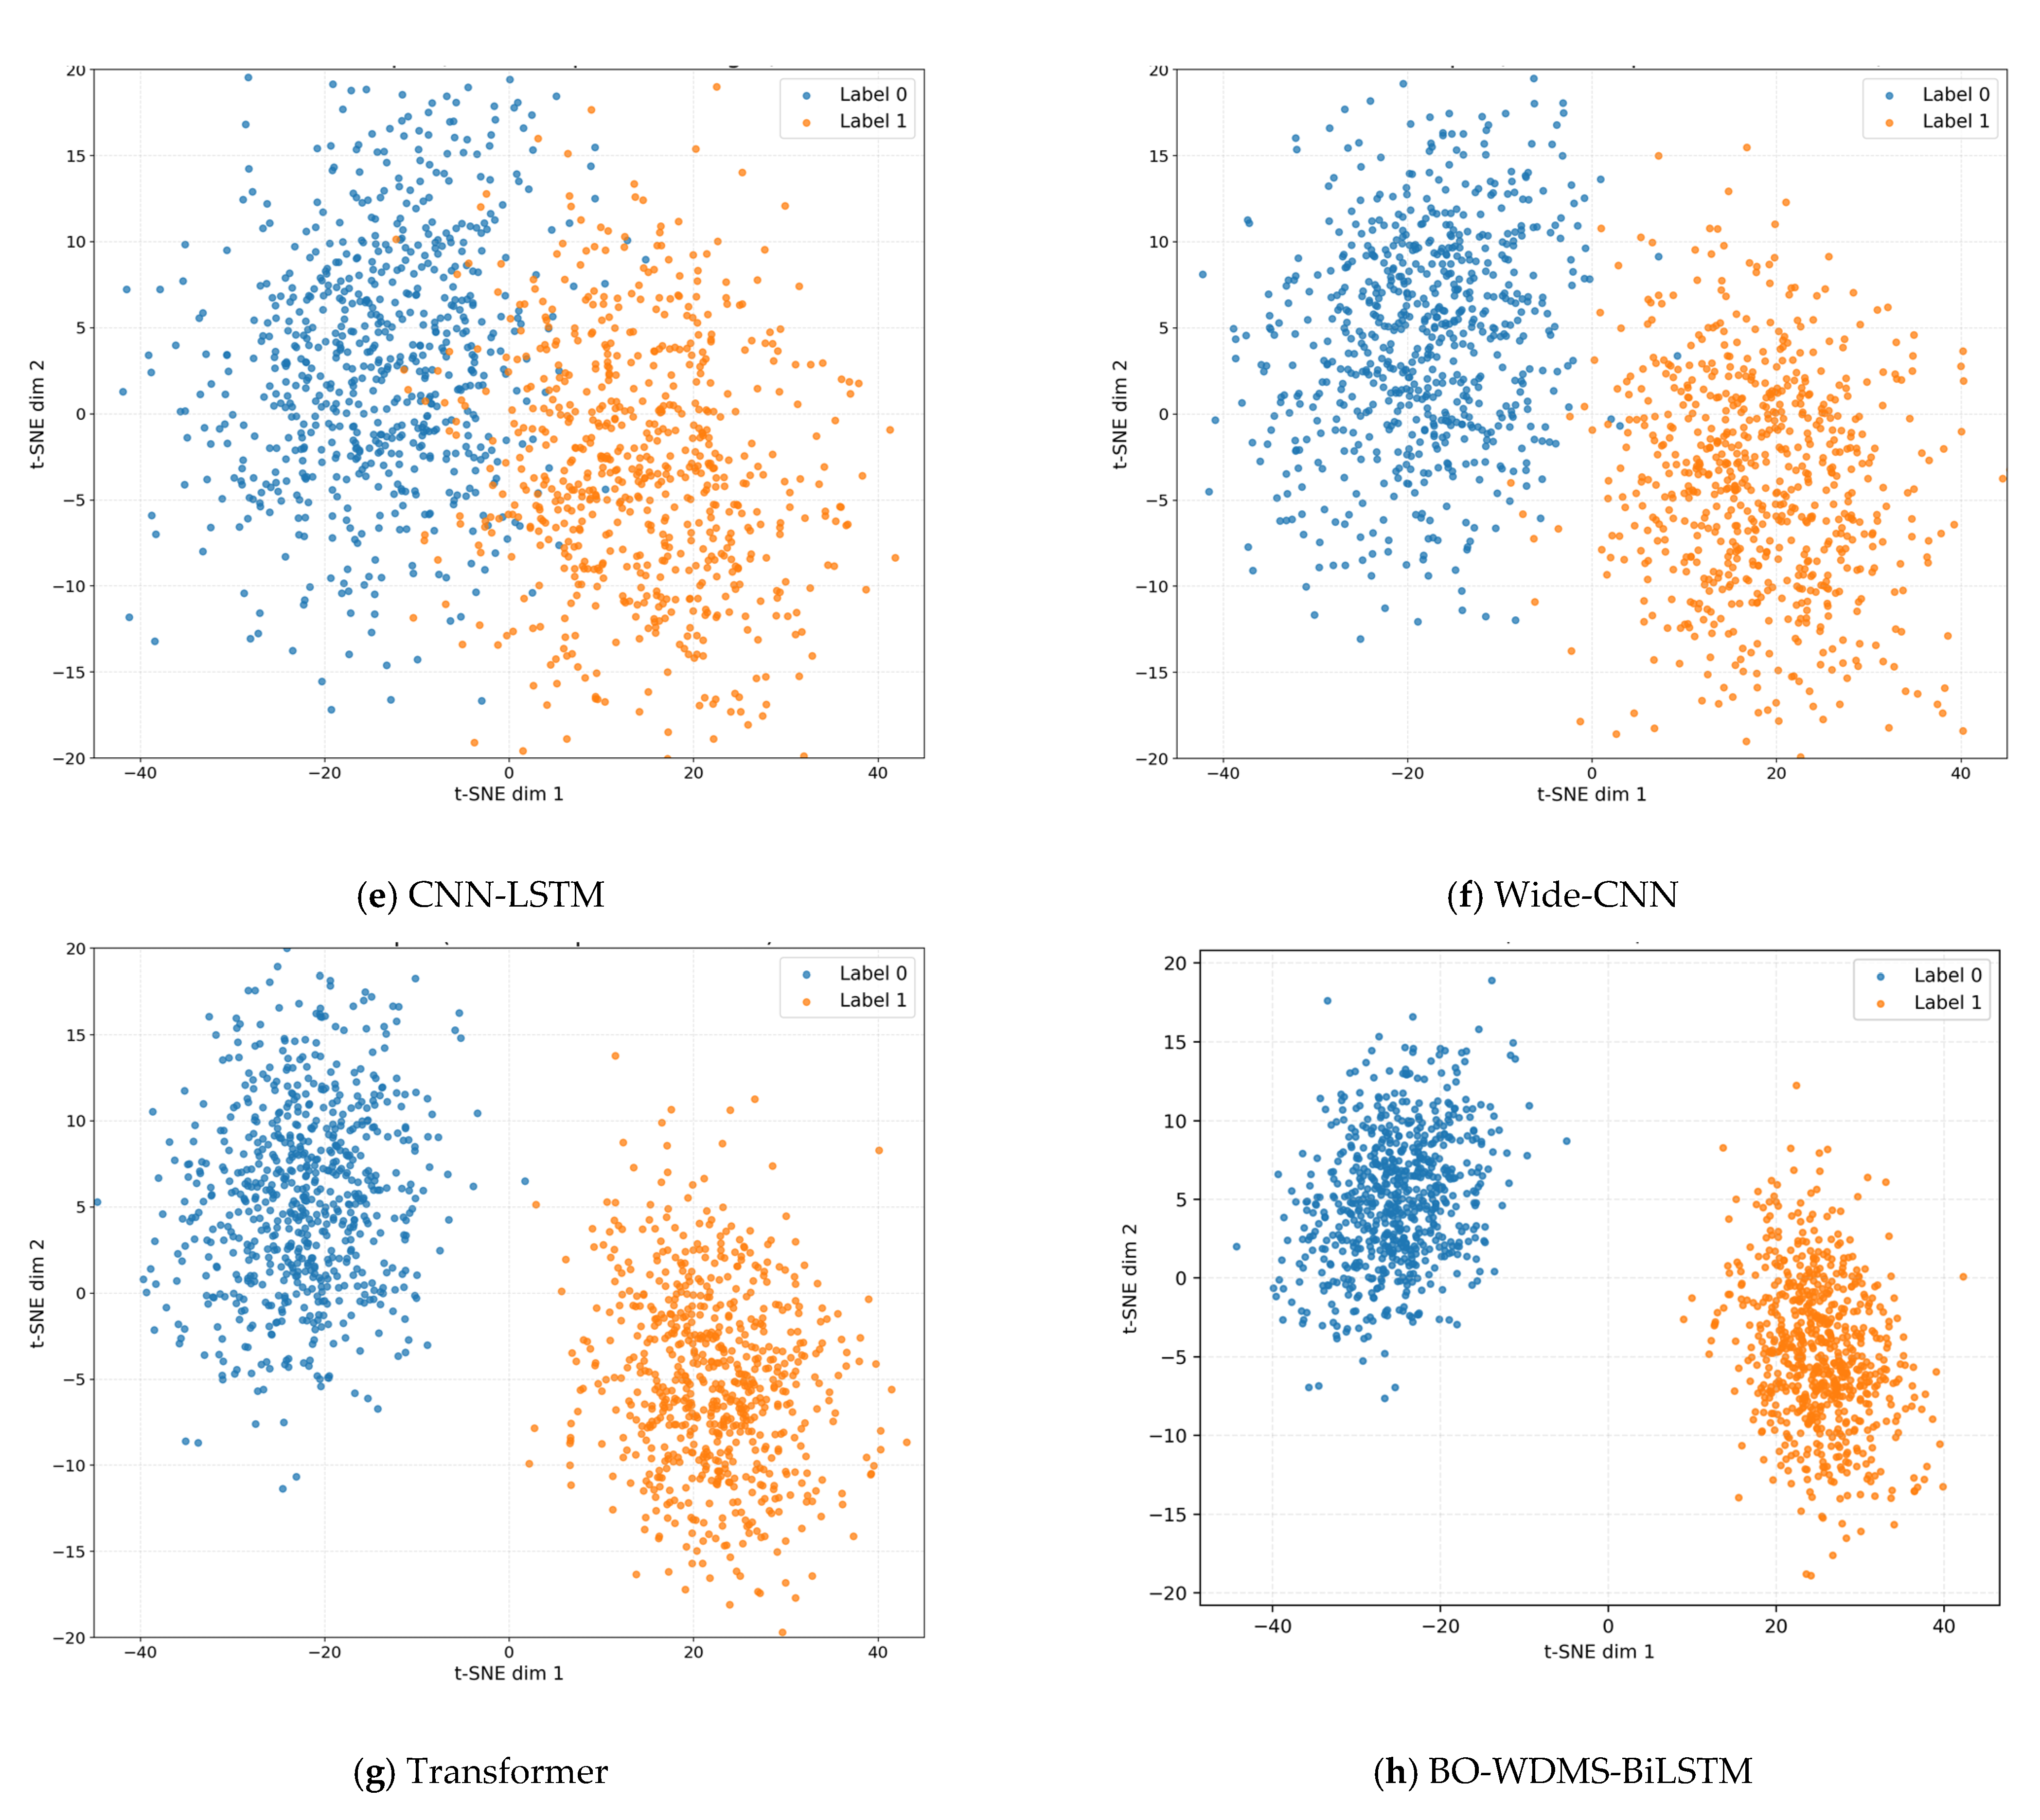
Figure 7 compares how well different models separate the two classes in their learned output feature space. In (a) SVM and (b) RF, the two colors are heavily intermixed, suggesting limited class separability in the resulting features. The sequence models (c) GRU and (d) LSTM show some structure but still exhibit substantial overlap, indicating that the learned features remain ambiguous for many samples. The hybrid deep baselines (e) CNN-LSTM and (f) Wide-CNN improve separability, forming partially distinct regions, yet a visible mixed area persists between the two classes. The (g) Transformer further reduces overlap and yields clearer group boundaries. Among all methods, (h) BO-WDMS-BiLSTM produces the most compact same-class groupings and the most distinct separation between classes, with minimal overlap. This visual evidence indicates that the proposed model learns more discriminative output features, which helps explain its stronger detection performance reported in the quantitative experiments.
Figure 7.
t-SNE visualizations of the final output feature representations produced by eight models on the test set. Panels (a–h) correspond to SVM, RF, GRU, LSTM, CNN-LSTM, Wide-CNN, Transformer, and the proposed BO-WDMS-BiLSTM, respectively. Each point denotes one sample, and colors indicate the ground-truth class (Label 0 vs. Label 1). All subplots are generated under the same t-SNE settings for a fair visual comparison.
3.6. Qualitative Analysis of Misclassified Cases
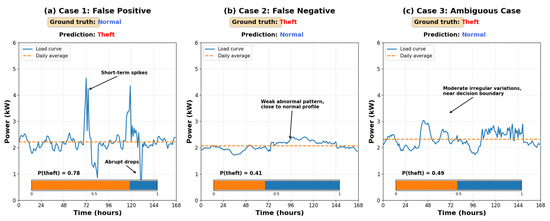
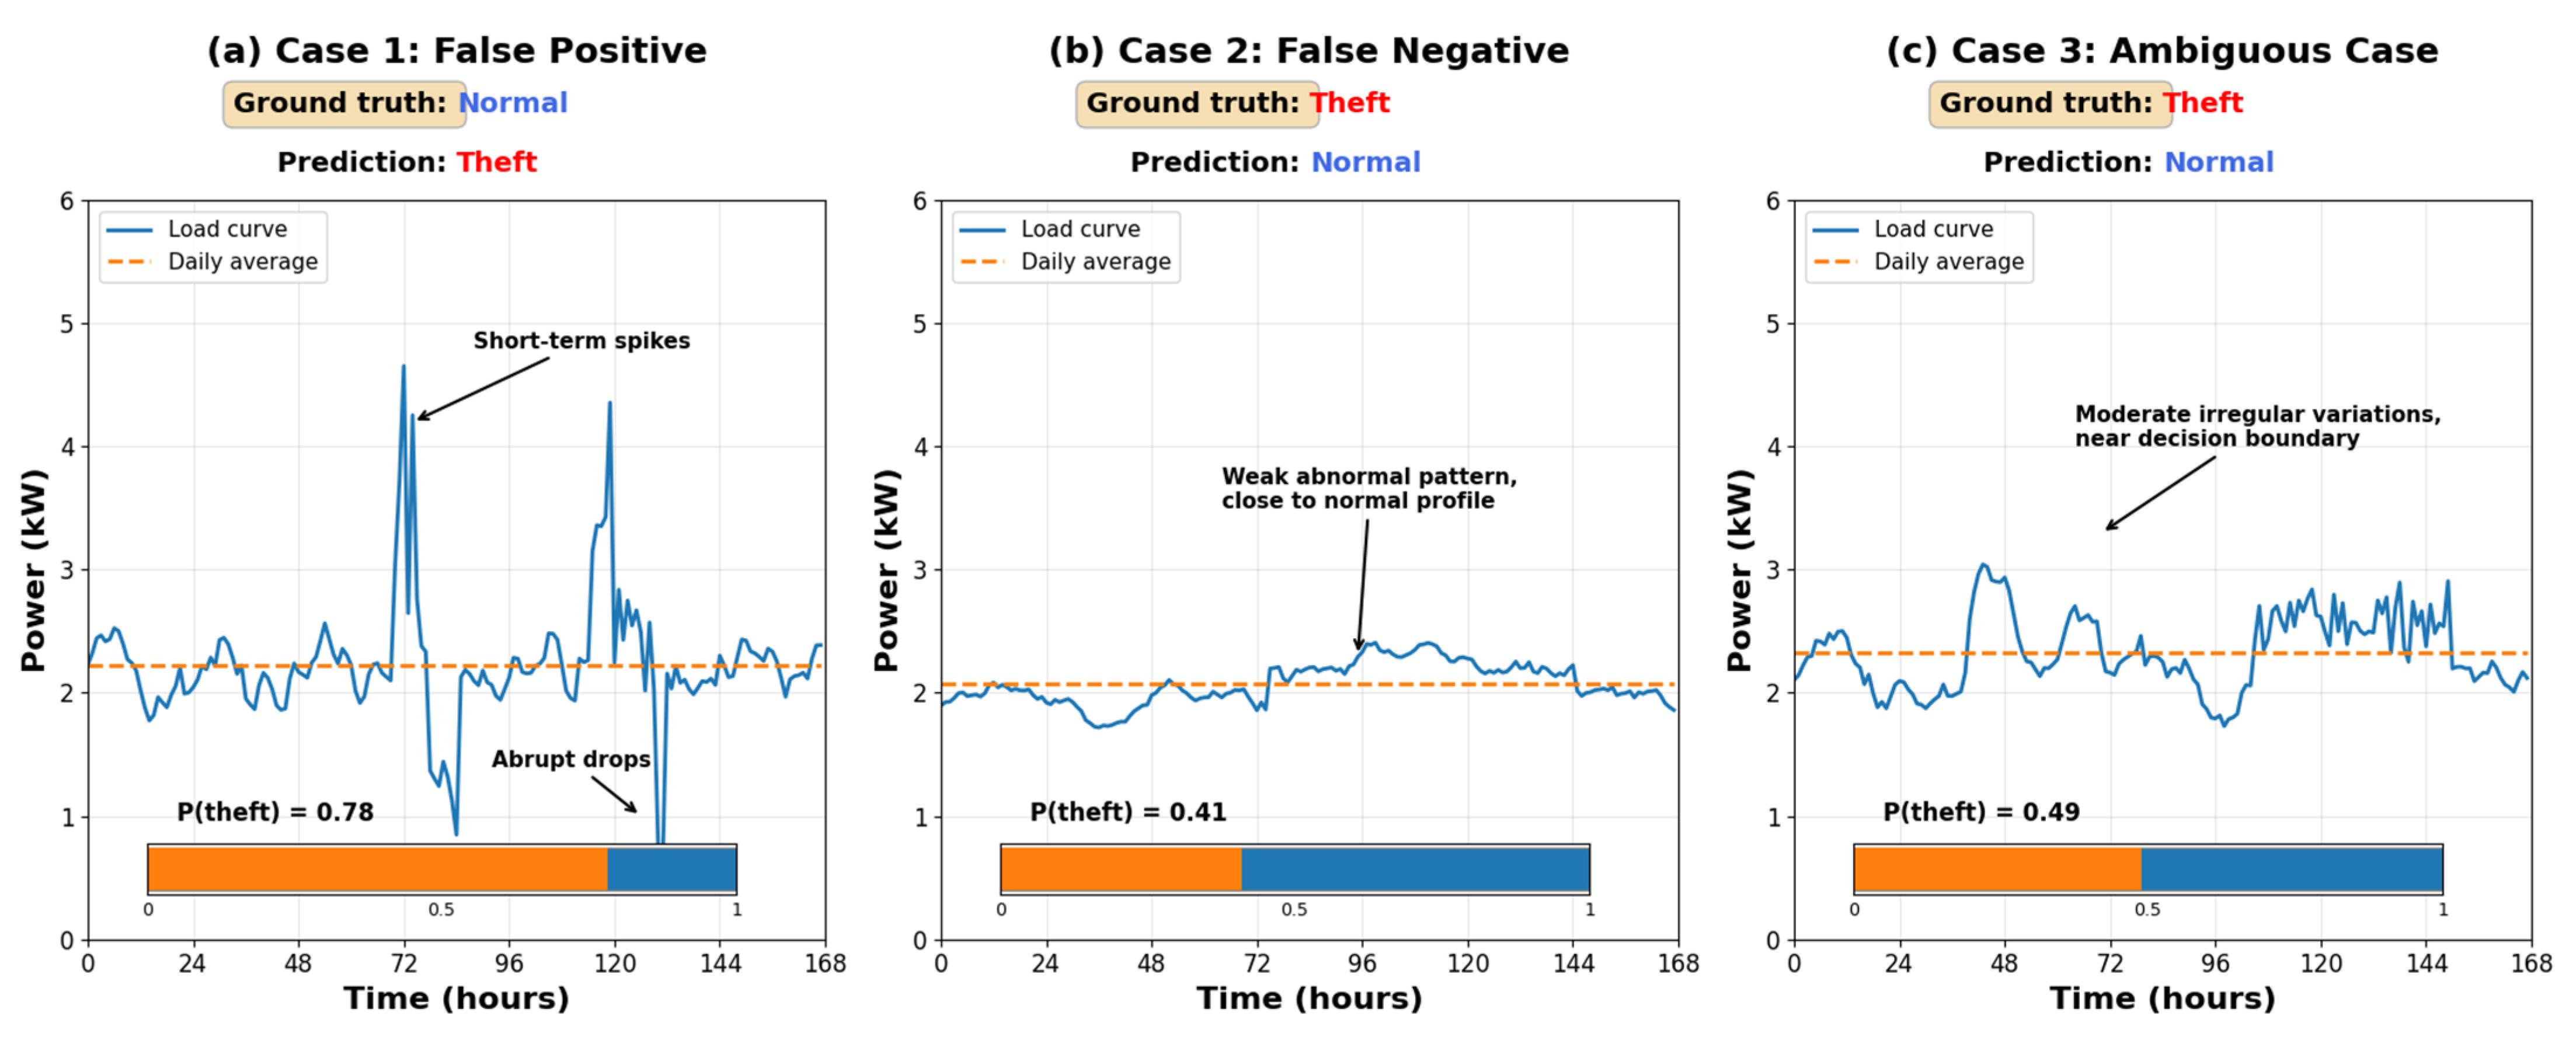
To complement the quantitative evaluation, we further examined several representative samples that were misclassified by the proposed model. Although the model achieved competitive overall performance, these error cases provide a more detailed view of its limitations under complex consumption patterns. As shown in Figure 8, three typical cases were selected from the test set, including one false-positive case, one false-negative case, and one ambiguous case near the decision boundary. Together, these examples illustrate the main types of errors made by the model in practice.
Figure 8.
Qualitative analysis of representative misclassified samples. The three cases illustrate false-positive prediction, false-negative prediction, and a borderline sample with a prediction score close to the decision threshold. (a) False Positive with Abrupt Load Variations; (b) False Negative with Weak Abnormal Pattern; (c) Borderline Case Near Decision Threshold.
In Figure 8a, the ground-truth label is normal, whereas the model predicts theft. The corresponding load curve contains several short-term spikes and abrupt drops that deviate noticeably from the surrounding pattern. Although these fluctuations do not correspond to actual electricity theft, they resemble the local irregularities often observed in abnormal samples. As a result, the model assigns a relatively high theft probability of 0.78 and produces a false alarm. This case suggests that the current model is sensitive to sudden local variations and may overemphasize transient disturbances when broader contextual evidence is limited.
In Figure 8b, the sample is labeled as theft, but the model predicts it as normal. Compared with more typical theft samples, the abnormal behavior in this case is relatively weak and remains close to the normal consumption profile over most of the observation window. Although a mild upward deviation can be observed in the middle portion of the sequence, the overall pattern does not depart sharply from the daily average. Consequently, the model assigns a theft probability of only 0.41 and fails to identify the sample correctly. This result indicates that the proposed method is less effective when the abnormal signal is subtle and distributed over time rather than expressed as a clear local anomaly.
In Figure 8c represents a more ambiguous situation. The sample is also labeled as theft, but the predicted probability is 0.49, which is very close to the classification threshold. The load curve exhibits moderate irregular variations, yet these changes are neither sufficiently strong nor sufficiently stable to form a clearly separable pattern. In this setting, the sample shares characteristics of both normal and theft-related behavior, making it difficult for the model to produce a confident decision. This case shows that the model still faces challenges when the class boundary is blurred and the discriminative structure of the sequence is not prominent.
Overall, these misclassified cases reveal that the proposed model performs well on samples with clear and stable class-specific patterns, but remains vulnerable to three situations: abrupt yet benign fluctuations, weak abnormal behavior, and borderline sequences with overlapping characteristics. This observation is consistent with the difficulty of real-world electricity theft detection, where abnormal usage patterns are not always strong or persistent. Future work may improve robustness by incorporating stronger temporal context modeling, more effective hard-sample learning strategies, or auxiliary mechanisms that better distinguish genuine anomalies from short-term disturbances.
4. Discussion
To further evaluate the stability of the proposed model under different data partitions, five-fold cross-validation was conducted on both the SGCC dataset and the auxiliary binary electricity theft dataset. The results are summarized in Table 4. Overall, BO-WDMS-BiLSTM maintained relatively consistent performance across all five folds on both datasets, which indicates that the model is not overly sensitive to a particular data split.
Table 4.
Five-fold cross-validation results of BO-WDMS-BiLSTM on the SGCC dataset and the auxiliary binary dataset.
On the SGCC dataset, the model achieved an average AUC of 0.7949 and an average AUPRC of 0.4068, while MAP@100 and MAP@200 reached 0.9778 and 0.9379, respectively. The variation across folds remained limited, with AUC ranging from 0.7931 to 0.7964 and AUPRC ranging from 0.4024 to 0.4098. These results suggest that the proposed method can preserve stable ranking quality and detection ability even when the composition of the training and test subsets changes.
On the auxiliary binary dataset, the model obtained stronger overall performance, with an average AUC of 0.8163, an average AUPRC of 0.4287, a MAP@100 of 0.9839, and a MAP@200 of 0.9487. Compared with the SGCC dataset, the gains were 0.0214 in AUC, 0.0219 in AUPRC, 0.0061 in MAP@100, and 0.0108 in MAP@200. This indicates that the proposed architecture can generalize well under a different data-generation setting and can capture discriminative electricity theft patterns more effectively on the auxiliary dataset.
The cross-validation results on the two datasets provide further evidence that BO-WDMS-BiLSTM achieves a good balance between predictive effectiveness, partition robustness, and cross-dataset generalization.
To examine the robustness of the proposed model under different data partitions, we further conducted a stability analysis using three train/validation split settings, namely 70/30, 80/20, and 90/10. The corresponding results are reported in Table 5. Overall, the model maintained relatively consistent performance across all three settings, which suggests that the proposed framework is not overly sensitive to a particular fixed partition of the SGCC dataset.
Table 5.
Experimental results corresponding to each proportion of dataset.
Among the three settings, the 80/20 split achieved the best overall performance, with an AUC of 0.7977, an AUPRC of 0.4111, a MAP@100 of 0.9797, and a MAP@200 of 0.9394. When the training ratio was reduced to 70%, the model performance decreased slightly, with the AUC dropping to 0.7894 and the AUPRC to 0.4018. This result is reasonable because the smaller training set limits the model’s ability to learn representative electricity consumption patterns. Even so, the decreases remained moderate, indicating that the proposed method preserves a satisfactory level of robustness under a less favorable training condition.
Under the 90/10 split, the model achieved an AUC of 0.7948 and an AUPRC of 0.4073, together with MAP@100 and MAP@200 values of 0.9764 and 0.9362, respectively. Although this setting provides more training samples, its performance did not surpass that of the 80/20 split. A likely reason is that the smaller validation subset makes model selection less stable and slightly increases the sensitivity to random variation. Nevertheless, the differences across the three partitions remained limited. In particular, the maximum gap in AUC was only 0.0083, and the maximum gap in AUPRC was 0.0093, which supports the stability of the proposed model under different train/validation splits.
These results suggest that the model achieves a good balance between effectiveness and robustness under varying data partitions. Although further validation on additional datasets would still be valuable, the present analysis provides preliminary evidence that the proposed method is not dependent on a single 80/20 split and retains stable performance across different partition settings.
To verify which parts of BO-WDMS-BiLSTM drive its detection gains, we conducted an ablation study that removes or replaces one design component at a time while keeping the training protocol, data split, and evaluation procedure unchanged. We report the area under the receiver operating characteristic curve (AUC) and ranking-focused metrics that reflect inspection prioritization (mean average precision at 100 and 200, MAP@100 and MAP@200).
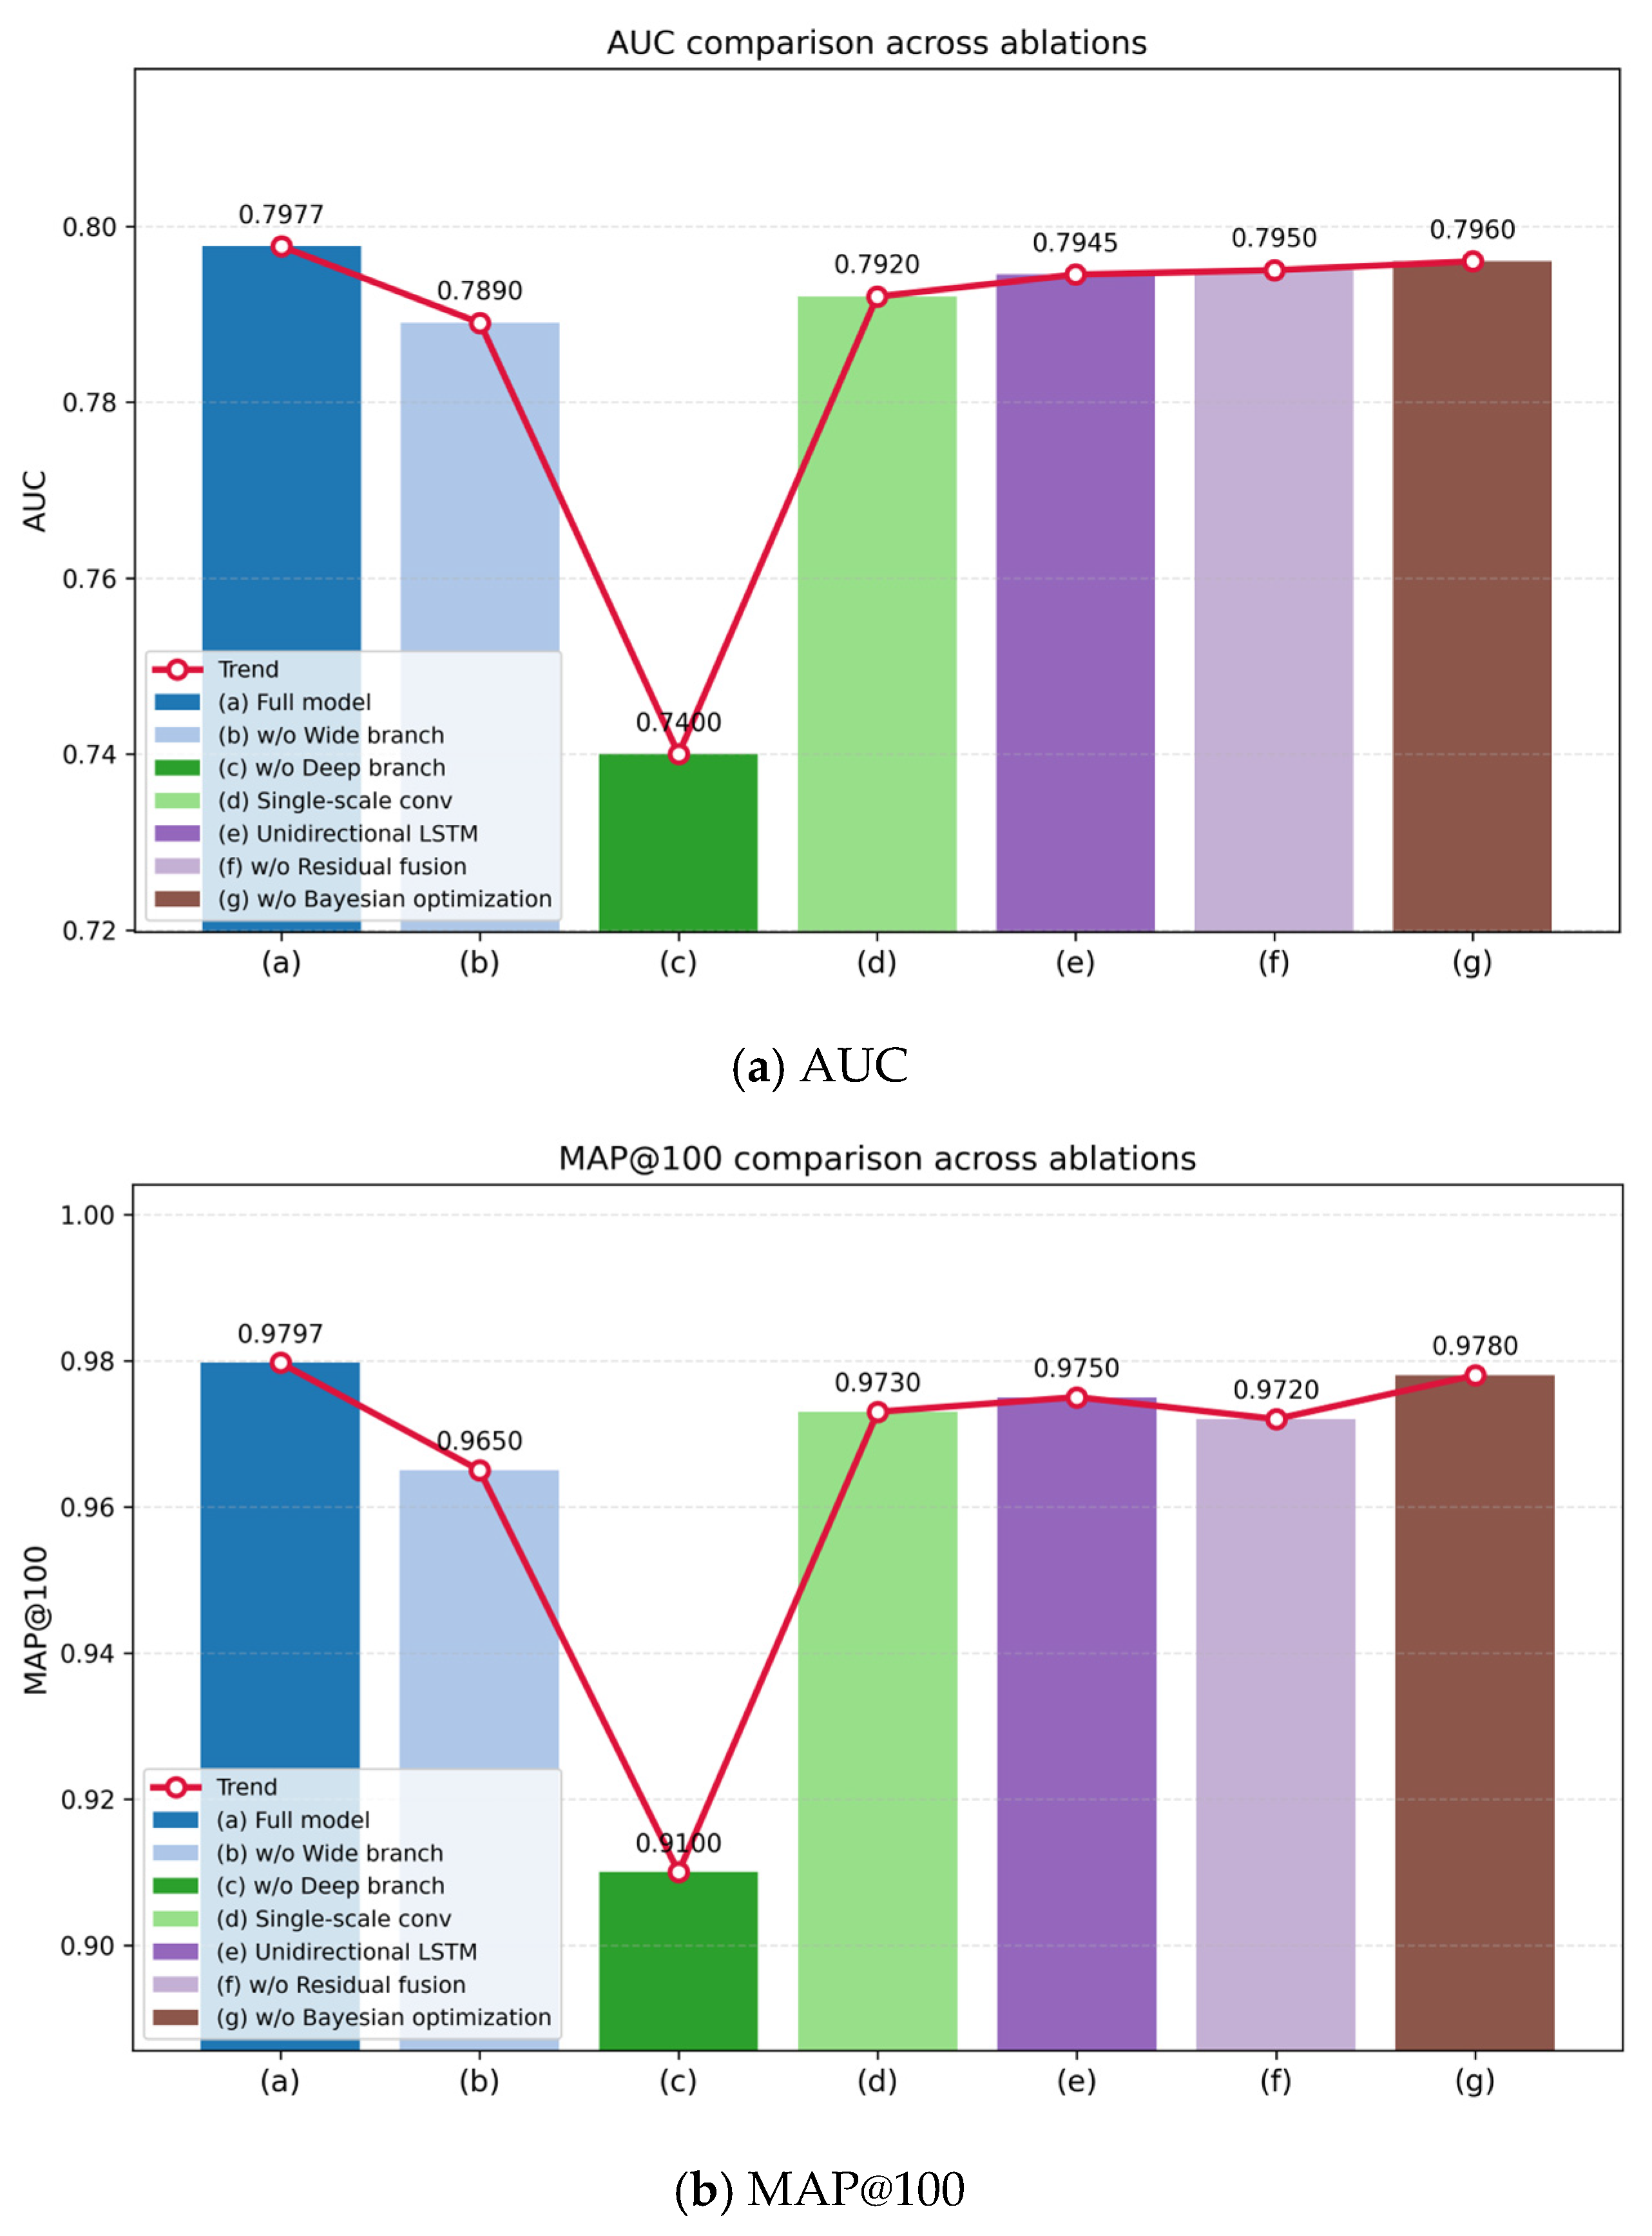
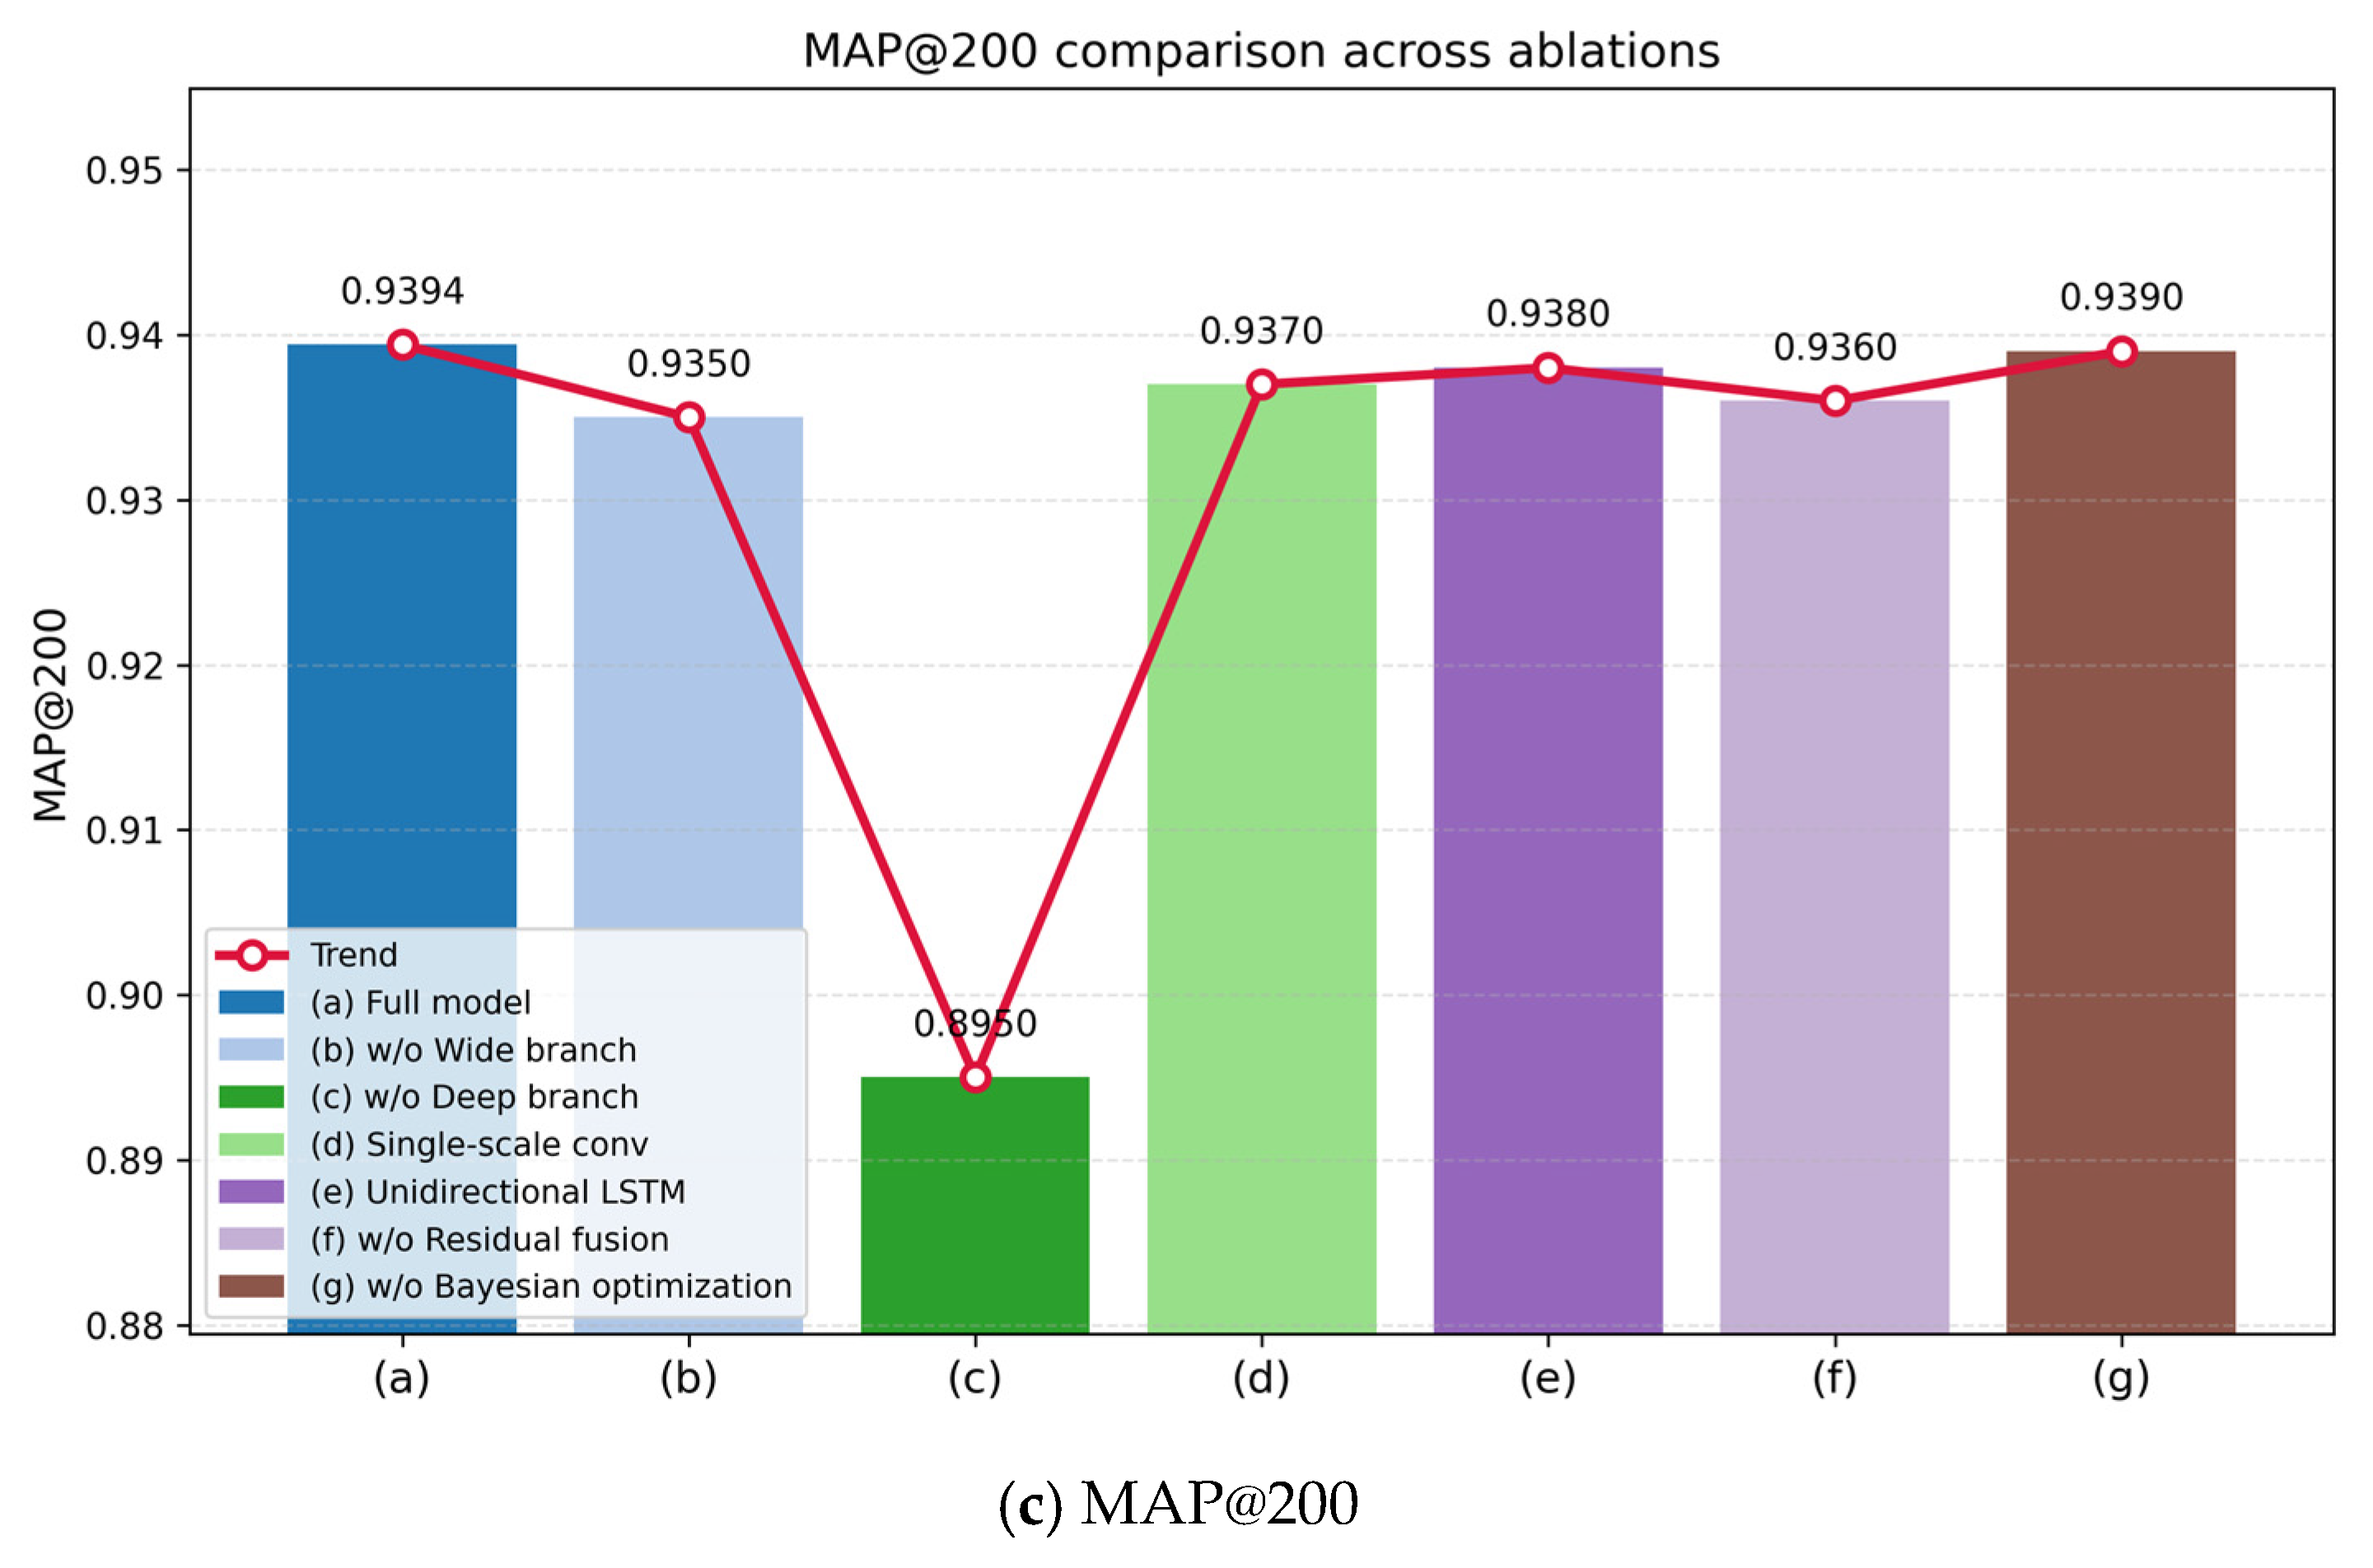
The ablation results show that the dual-branch design is the main contributor to performance shown as Table 6. Removing the deep branch causes the largest drop, indicating that structured multi-period consumption features carry most of the discriminative signal. Removing the wide branch also reduces performance, but less sharply, suggesting that customer-level indicators provide complementary, stabilizing cues that help resolve difficult cases where consumption patterns alone are not sufficiently separable.
Table 6.
Ablation study results of the proposed BO-WDMS-BiLSTM model (AUC, MAP@100, and MAP@200).
Within the deep branch, the multi-scale convolution improves both AUC and top-ranked inspection quality, implying that theft-related deviations can appear at different temporal spans and that parallel receptive fields capture these patterns more reliably than a single scale. Replacing BiLSTM with a one-direction recurrent module leads to a consistent decrease, supporting the value of using context from both earlier and later parts of the observation window when forming the final representation. Finally, the residual fusion head yields a measurable gain, which is consistent with improved feature mixing and more stable optimization when combining heterogeneous representations. Bayesian hyperparameter optimization provides a smaller but repeatable improvement, indicating that automated tuning helps the model reach stronger configurations without extensive manual trial-and-error.
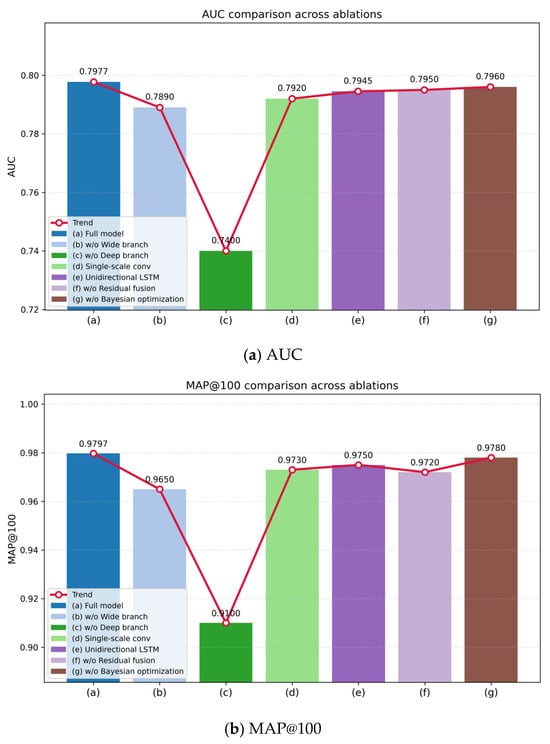
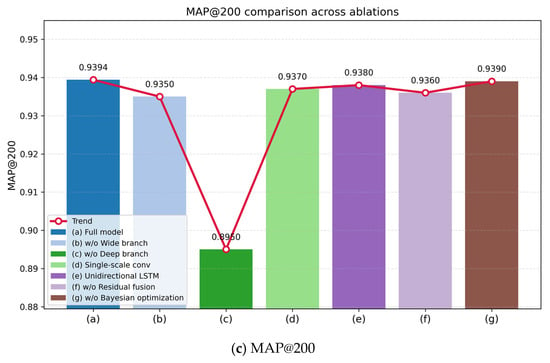
Figure 9 summarizes the ablation study results using three evaluation metrics (AUC, MAP@100, and MAP@200). The full model (a) achieves the best overall performance (AUC 0.7977, MAP@100 0.9797, MAP@200 0.9394), indicating that the proposed design choices work best when used together. Removing the deep branch (c) causes the largest drop across all metrics (AUC 0.7400, MAP@100 0.9100, MAP@200 0.8950), showing that the deep path provides the most critical discriminative features. Excluding the wide branch (b) also degrades performance (AUC 0.7890, MAP@100 0.9650, MAP@200 0.9350), confirming that the wide path contributes complementary information that improves detection reliability. The remaining variants, single-scale convolution (d), replacing BiLSTM with a unidirectional LSTM (e), removing residual fusion (f), and disabling Bayesian optimization (g), all lead to consistent but smaller decreases, suggesting these components mainly strengthen feature learning stability and improve the effectiveness of feature fusion rather than serving as the primary source of performance gains.
Figure 9.
Ablation study of the proposed model. (a) AUC, (b) MAP@100, and (c) MAP@200 comparisons across seven ablation settings: full model and variants with individual components removed or simplified (wide branch, deep branch, multi-scale convolution, bidirectional recurrent layer, residual fusion, and Bayesian optimization).
To examine whether the selected kernel scales are appropriate, an ablation study was designed to compare single-scale, dual-scale, and full multiscale configurations. As shown in Table 7, the single-scale settings yielded relatively weaker performance. Among them, the 5 × 5 kernel achieved the best results, with an AUC of 0.7769 and an AUPRC of 0.3847, indicating that an intermediate receptive field is more effective than either a smaller or a larger kernel when used alone. By contrast, the 3 × 3 kernel mainly captured fine-grained local variations and obtained an AUC of 0.7684, while the 7 × 7 kernel produced an AUC of 0.7715, suggesting that a single receptive field is insufficient to represent the full diversity of electricity consumption patterns.
Table 7.
Ablation study on kernel scale selection.
The dual-scale settings consistently outperformed the single-scale ones, which confirms that combining information from different receptive fields improves feature representation. In particular, the configuration achieved the strongest dual-scale performance, with an AUC of 0.7902, an AUPRC of 0.4049, a MAP@100 of 0.9736, and a MAP@200 of 0.9348. This result indicates that the integration of intermediate-range and broader contextual patterns is more effective than using either of them in isolation. The other two dual-scale combinations, namely and , also improved over the single-scale baselines, but their gains were slightly smaller.
The full multiscale configuration, which combines , , and kernels in parallel, achieved the best overall performance on all evaluation metrics. Specifically, it reached an AUC of 0.7977 and an AUPRC of 0.4111, which are higher than those of the best dual-scale setting by 0.0075 and 0.0062, respectively. In addition, MAP@100 and MAP@200 increased to 0.9797 and 0.9394, further demonstrating the advantage of aggregating fine-grained, intermediate, and broader spatiotemporal patterns simultaneously. These results suggest that the three kernel branches are complementary rather than redundant, and that the adopted multiscale design provides a more complete representation of complex electricity consumption behavior.
5. Conclusions
This paper presented BO-WDMS-BiLSTM for electricity theft detection, with the goal of improving not only classification quality but also the practical ranking of customers for field inspection. The model was designed to combine two complementary sources of evidence in a single decision process: stable customer/billing indicators and multi-week electricity consumption behavior. This design reflects a core challenge in real deployment settings, where suspicious patterns can be subtle and normal consumption can vary for many legitimate reasons.
The proposed framework integrates a dual-branch structure, multi-scale convolutional feature extraction, bidirectional temporal modeling, and Bayesian hyperparameter optimization. In the wide branch, compact customer-related indicators provide stable signals that help when load patterns alone are ambiguous. In the deep branch, multi-scale convolution and BiLSTM work together to capture both short-term irregularities and longer temporal changes, while the residual-style fusion head helps preserve information from both branches during training. This combination is intended to improve robustness and reduce the risk of losing useful cues when one feature source is weaker than the other for a given customer.
Experiments on the SGCC public dataset (42,372 customers over 1035 days, with a strongly imbalanced theft ratio) show that the proposed model consistently outperforms representative classical and deep learning baselines. BO-WDMS-BiLSTM achieved the best reported results in the paper across AUC, AUPRC, MAP@100, and MAP@200, reaching AUC = 0.7977, AUPRC = 0.4111, MAP@100 = 0.9797, and MAP@200 = 0.9394. Compared with the strongest non-proposed baseline (Transformer), it improved AUC from 0.7897 to 0.7977, AUPRC from 0.3919 to 0.4111, MAP@100 from 0.9320 to 0.9797, and MAP@200 from 0.9204 to 0.9394. These gains are especially meaningful because they place more true theft cases near the top of the inspection list, which directly supports budget-limited field operations.
The ablation study further supports the design choices. The full model produced the best overall performance, and removing the deep branch caused the largest drop, indicating that structured consumption dynamics provide the strongest discriminative signal. At the same time, removing the wide branch also reduced performance, confirming that customer-level indicators add useful complementary information. Replacing the multi-scale convolution, BiLSTM, or residual fusion head each led to smaller but consistent declines, while disabling Bayesian optimization produced a slight but repeatable reduction. Together, these results suggest that the model’s advantage does not come from a single component alone, but from the interaction of complementary representations, temporal context, and stable fusion.
Overall, the study shows that a hybrid strategy—combining stable customer descriptors with multi-scale, context-aware load modeling—can improve theft screening in a way that is more aligned with real utility workflows. In particular, the stronger top-ranked retrieval performance suggests practical value for inspection prioritization, where the main objective is not simply to classify all users, but to identify the most suspicious cases early and reduce unnecessary site visits.
Author Contributions
Conceptualization, P.W., Q.W., J.Y.,Y.S. and H.Z.; methodology, software, validation, P.W., Q.W. and J.Y.; writing—review and editing, Q.W., Y.S. and H.Z.; visualization, J.Y., P.W., Y.S. and H.Z.; supervision, P.W. and H.Z. All authors have read and agreed to the published version of the manuscript.
Funding
This work was supported by Science and Technology Project of State Grid Shandong Electric Power Company under Grant No. 2025A-047.
Data Availability Statement
The original contributions presented in this study are included in the article. Further inquiries can be directed to the corresponding author.
Conflicts of Interest
Author P.W., J.Y., Q.W., H.Z. and Y.S. were employed by Marketing Service Center (Metrology Center), State Grid Shandong Electric Power Company, Jinan. The authors declare that the research was conducted in the absence of any commercial or financial relationships that could be construed as a potential conflict of interest.
References
- Naidji, I.; Choucha, C.E.; Ramdani, M. Electricity theft detection techniques using artificial intelligence: A survey. In Proceedings of the 2024 IEEE International Conference on Advanced Systems and Emergent Technologies (IC_ASET), Hammamet, Tunisia, 27–29 April 2024; pp. 1–6. [Google Scholar]
- Zhu, G.; Zhang, S.; Deng, Z.; Wang, J.; Li, Y.; Dong, J.; Bauer, P. Extended Hybrid Modulation for Multistage Constant-Current Wireless EV Charging. IEEE Trans. Power Electron. 2025, 40, 10095–10110. [Google Scholar] [CrossRef] [Scilit]
- Kumar, A.; Kumawat, M.; Sinha, P. Comprehensive analysis of cost-effective data-driven approaches for electricity theft detection. In Proceedings of the 2024 IEEE 11th Power India International Conference (PIICON), Jaipur, India, 10–12 December 2024; pp. 1–6. [Google Scholar]
- Taruna, A.P.; Arisona, G.; Irwanto, D.; Bestari, A.B.; Juniawan, W. Electricity theft detection using machine learning in traditional meter postpaid residential customers: A case study on state electricity company (PLN) Indonesia. IEEE Access 2025, 13, 7167–7191. [Google Scholar] [CrossRef] [Scilit]
- Wang, J.; Zhang, X. Electricity theft detection based on SMOTE oversampling and logistic regression classifier. In Proceedings of the 2023 IEEE 6th International Electrical and Energy Conference (CIEEC), Hefei, China, 12–14 May 2023; pp. 2571–2576. [Google Scholar]
- Anwar, M.; Javaid, N.; Khalid, A.; Imran, M.; Shoaib, M. Electricity theft detection using pipeline in machine learning. In Proceedings of the 2020 International Wireless Communications and Mobile Computing Conference (IWCMC), Limassol, Cyprus, 15–19 June 2020; pp. 2138–2142. [Google Scholar]
- Putro, R.I.; Putra, G.D.; Wijoyo, Y.S. Electricity theft detection based on load profile using XGBoost and SMOTE. In Proceedings of the 2025 International Conference on Technology and Policy in Energy and Electric Power (ICT-PEP), Yogyakarta, Indonesia, 3–5 September 2025; pp. 126–130. [Google Scholar]
- Siddhant, S.K.; Patil, A. Enhancing the electricity theft detection using extreme gradient boosting with Optuna optimization in smart grid. In Proceedings of the 2024 IEEE PES Innovative Smart Grid Technologies Asia (ISGT Asia), Bengaluru, India, 10–13 November 2024; pp. 1–6. [Google Scholar]
- Nie, X.; Li, S. A Boruta-LightGBM model-based method for detecting electricity theft. In Proceedings of the 2022 9th International Forum on Electrical Engineering and Automation (IFEEA), Zhuhai, China, 4–6 November 2022; pp. 445–448. [Google Scholar]
- Sun, X.; Hu, J.; Zhang, Z.; Cao, D.; Huang, Q.; Chen, Z.; Hu, W. Electricity theft detection method based on ensemble learning and prototype learning. J. Mod. Power Syst. Clean Energy 2024, 12, 213–224. [Google Scholar] [CrossRef] [Scilit]
- Aziz, S.; Naqvi, S.Z.H.; Khan, M.U.; Aslam, T. Electricity theft detection using empirical mode decomposition and K-nearest neighbors. In Proceedings of the 2020 International Conference on Emerging Trends in Smart Technologies (ICETST), Karachi, Pakistan, 26–27 March 2020; pp. 1–5. [Google Scholar]
- Sasmoko, R.P.; Setyonegoro, M.I.B.; Hidayah, I. Electricity theft detection using K-means clustering in electricity information system. In Proceedings of the 2024 International Conference on Smart Computing, IoT and Machine Learning (SIML), Surakarta, Indonesia, 6–7 June 2024; pp. 316–321. [Google Scholar]
- Huang, L.; Qin, H.; Pan, Z.; Yu, M. Electricity theft detection based on iterative interpolation and fusion convolutional neural network. In Proceedings of the 2022 7th International Conference on Power and Renewable Energy (ICPRE), Shanghai, China, 23–26 September 2022; pp. 567–571. [Google Scholar]
- Chen, Y.; Hua, G.; Feng, D.; Zang, H.; Wei, Z.; Sun, G. Electricity theft detection model for smart meter based on residual neural network. In Proceedings of the 2020 12th IEEE PES Asia-Pacific Power and Energy Engineering Conference (APPEEC), Nanjing, China, 20–23 September 2020; pp. 1–5. [Google Scholar]
- Markovska, M.; Gerazov, B.; Zlatkova, A.; Taskovski, D. Electricity theft detection based on temporal convolutional networks with self-attention. In Proceedings of the 2023 30th International Conference on Systems, Signals and Image Processing (IWSSIP), Ohrid, North Macedonia, 27–29 June 2023; pp. 1–5. [Google Scholar]
- Shen, Y.-L.; Huang, Q.; Jin, T. Electricity theft detection based on multi-scale feature fusion parallel convolution model. In Proceedings of the 2024 3rd Asia Power and Electrical Technology Conference (APET), Fuzhou, China, 15–17 November 2024; pp. 140–144. [Google Scholar]
- Zhang, L.; Sun, Y.; Zhu, X.; Yuan, P. ETD: Electricity theft detection based on dilated convolutions and multi-head attention mechanism. In Proceedings of the 2025 8th International Conference on Power and Energy Applications (ICPEA), Shanghai, China, 23–25 October 2025; pp. 732–737. [Google Scholar]
- Wang, W.; Huang, Q.; Ling, L.; Ma, T.; Wang, Z.; Jin, T. A deep learning-dominated stacked machine learning and deep learning method for electricity theft detection. In Proceedings of the 2024 3rd Asia Power and Electrical Technology Conference (APET), Fuzhou, China, 15–17 November 2024; pp. 20–24. [Google Scholar]
- Zhuang, W.; Jiang, W.; Xia, M.; Liu, J. Dynamic generative residual graph convolutional neural networks for electricity theft detection. IEEE Access 2024, 12, 42737–42750. [Google Scholar] [CrossRef] [Scilit]
- Alromih, A.; Clark, J.A.; Gope, P. Electricity theft detection in the presence of prosumers using a cluster-based multi-feature detection model. In Proceedings of the 2021 IEEE International Conference on Communications, Control, and Computing Technologies for Smart Grids (SmartGridComm), Aachen, Germany, 25–28 October 2021; pp. 339–345. [Google Scholar]
- Abdellatif, A.A.; Amer, A.; Shaban, K.; Massoud, A. A novel multivariate and accurate detection scheme for electricity theft attacks in smart grids. In Proceedings of the 2023 International Conference on Computing, Networking and Communications (ICNC), Honolulu, HI, USA, 20–22 February 2023; pp. 558–562. [Google Scholar]
- Hu, J.; Liu, Z.; Zhou, X.; Zhang, T. CNN-DBSCAN intermittent electricity theft detection method for high loss station areas based on correlation analysis. In Proceedings of the 2024 China Automation Congress (CAC), Qingdao, China, 1–3 November 2024; pp. 5282–5287. [Google Scholar]
- Gao, B.; Kong, X.; Liang, B. Advanced method for electricity theft detection: A case study in low-voltage station. In Proceedings of the 2024 27th International Conference on Electrical Machines and Systems (ICEMS), Fukuoka, Japan, 26–29 November 2024; pp. 104–108. [Google Scholar]
- Wang, Z.; Kong, X.; Yang, Z.; Xiao, F.; Zhang, X.; Ma, Y. Electricity theft detection and classification method based on D-S feature fusion and IALO-SVM. In Proceedings of the 2022 25th International Conference on Electrical Machines and Systems (ICEMS), Chiang Mai, Thailand, 29 November–2 December 2022; pp. 1–5. [Google Scholar]
- Zheng, C.; Wu, Y. Spectrum normalization-based adversarial network and CNN for electricity theft detection. In Proceedings of the 2024 6th International Conference on Energy, Power and Grid (ICEPG), Guangzhou, China, 27–29 September 2024; pp. 1804–1807. [Google Scholar]
- Jia, S. Electricity theft detection using neural networks and particle swarm optimization. In Proceedings of the 2024 9th International Symposium on Computer and Information Processing Technology (ISCIPT), Xi’an, China, 24–26 May 2024; pp. 505–508. [Google Scholar]
- Lakshmi, G.; Gopal, R. Design and development of IoT prototype for real-time theft detection and optimization of electricity using machine learning techniques. In Proceedings of the 2024 2nd International Conference on Computing and Data Analytics (ICCDA), Shinas, Oman, 12–13 November 2024; pp. 1–4. [Google Scholar]
- Abraham, O.A.; Ochiai, H.; Hossain, M.D.; Taenaka, Y.; Kadobayashi, Y. Electricity theft detection for smart homes: Harnessing the power of machine learning with real and synthetic attacks. IEEE Access 2024, 12, 26023–26045. [Google Scholar] [CrossRef] [Scilit]
- Li, X.; Lv, W.; Han, K.; Liu, W.; Chen, J. Detection technology for electricity theft behavior of power users based on integrated LSTM-AE. In Proceedings of the 2025 10th Asia Conference on Power and Electrical Engineering (ACPEE), Beijing, China, 15–19 April 2025; pp. 653–657. [Google Scholar]
- Cui, L.; Wu, F.; Qu, Y.; Gu, B.; Gao, L.; Yu, S. RE4ETD: A relative entropy optimization-based method for efficient electricity theft detection with dual-privacy preservation. IEEE Trans. Smart Grid 2025, 16, 4073–4086. [Google Scholar] [CrossRef] [Scilit]
- Wang, Z.; Xu, Q. Electricity theft detection method based on user consumption patterns. In Proceedings of the 2024 4th Power System and Green Energy Conference (PSGEC), Shanghai, China, 22–24 August 2024; pp. 1227–1231. [Google Scholar]
- Xia, Z.; Lin, X.; Zhou, K.; Tan, J. Electricity theft detection scheme based on CNN-AE-LSTM hybrid model against evasion attacks. In Proceedings of the 2025 International Joint Conference on Neural Networks (IJCNN), Rome, Italy, 30 June–5 July 2025; pp. 1–8. [Google Scholar]
- Nirmal, S.; Patil, P. Evasion attack against CNN-Adaboost electricity theft detection in smart grid. In Proceedings of the 2024 International Conference on Intelligent Systems and Advanced Applications (ICISAA), Pune, India, 25–26 October 2024; pp. 1–6. [Google Scholar]
- Qi, R.; Japp, W.; Pan, S.; Zheng, J.; Shao, S. Enhancing the performance of semi-supervised electricity theft detection in smart grids with feature engineering and ensemble learning. In Proceedings of the 2024 IEEE Kansas Power and Energy Conference (KPEC), Manhattan, KS, USA, 25–26 April 2024; pp. 1–6. [Google Scholar]
- Huang, Y.; Huang, L.; Lin, C. An electricity theft detection based on image coding technique and ConvNeXt. IEEE Trans. Instrum. Meas. 2025, 74, 2544311. [Google Scholar] [CrossRef] [Scilit]
- Liao, W.; Zhu, R.; Yang, Y.; Jia, Y.; Yang, Z.; Rehtanz, C. Electricity theft detection with multi-source data: Integrating electricity, water, and gas. IEEE Trans. Ind. Appl. 2025, 62, 3187–3197. [Google Scholar] [CrossRef] [Scilit]
- Ezaldine, M.; Ali, A.; Shaaban, M.F.; Mahmoud, K. Electricity theft detection via self-optimizing hybrid deep learning. In Proceedings of the 2025 26th International Middle East Power Systems Conference (MEPCON), Aswan, Egypt, 20–22 December 2025; pp. 1–6. [Google Scholar]

Disclaimer/Publisher’s Note: The statements, opinions and data contained in all publications are solely those of the individual author(s) and contributor(s) and not of MDPI and/or the editor(s). MDPI and/or the editor(s) disclaim responsibility for any injury to people or property resulting from any ideas, methods, instructions or products referred to in the content. |
© 2026 by the authors. Licensee MDPI, Basel, Switzerland. This article is an open access article distributed under the terms and conditions of the Creative Commons Attribution (CC BY) license.