


Abstract
Soiling of solar panels has a considerable impact on the performance of photo voltaic (PV) systems, emphasizing the importance of developing reliable decision support tools for solar panel cleaning. Although recent convolutional neural network (CNN)-based models, including lightweight architectures such as SolPowNet, have demonstrated high classification accuracy, their performance can be sensitive to dataset variability and domain shifts encountered in real-world PV environments. Motivated by the lightweight design philosophy of SolPowNet, this paper proposes a hybrid and ensemble-based intelligent cleaning decision framework that integrates classical image processing, machine learning, and deep learning techniques. The proposed approach combines physically interpretable handcrafted texture and sharpness features classified using a Random Forest model with a pretrained MobileNetV3-Small CNN through a conservative OR-based ensemble fusion strategy. In addition, a probability-driven Soiling Index (SI) is introduced to translate classification confidence into actionable cleaning decisions, including no cleaning, light cleaning, and full cleaning. Experimental results on multiple PV image datasets demonstrate that, under domain-shift conditions where individual models may experience performance degradation, the proposed ensemble framework achieves an accuracy of up to 85.93% and attains a dusty-panel detection rate of 0.90 on the unseen dataset. On the in-distribution evaluation, the proposed OR-ensemble achieves an average accuracy of 0.9663 ± 0.0177 with dusty recall of 0.9896 ± 0.0104 over repeated stratified runs. Importantly, the conservative fusion strategy minimizes high-risk false negative cases while avoiding excessive misclassification of clean panels. Overall, the proposed framework offers a robust, scalable, and deployment-ready solution for intelligent PV cleaning decision support, advancing CNN-based soiling detection toward practical and risk-aware operation and maintenance systems.
1. Introduction
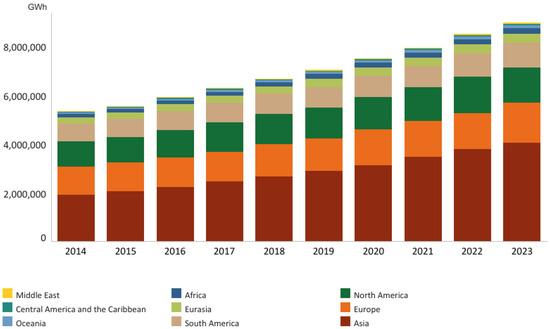
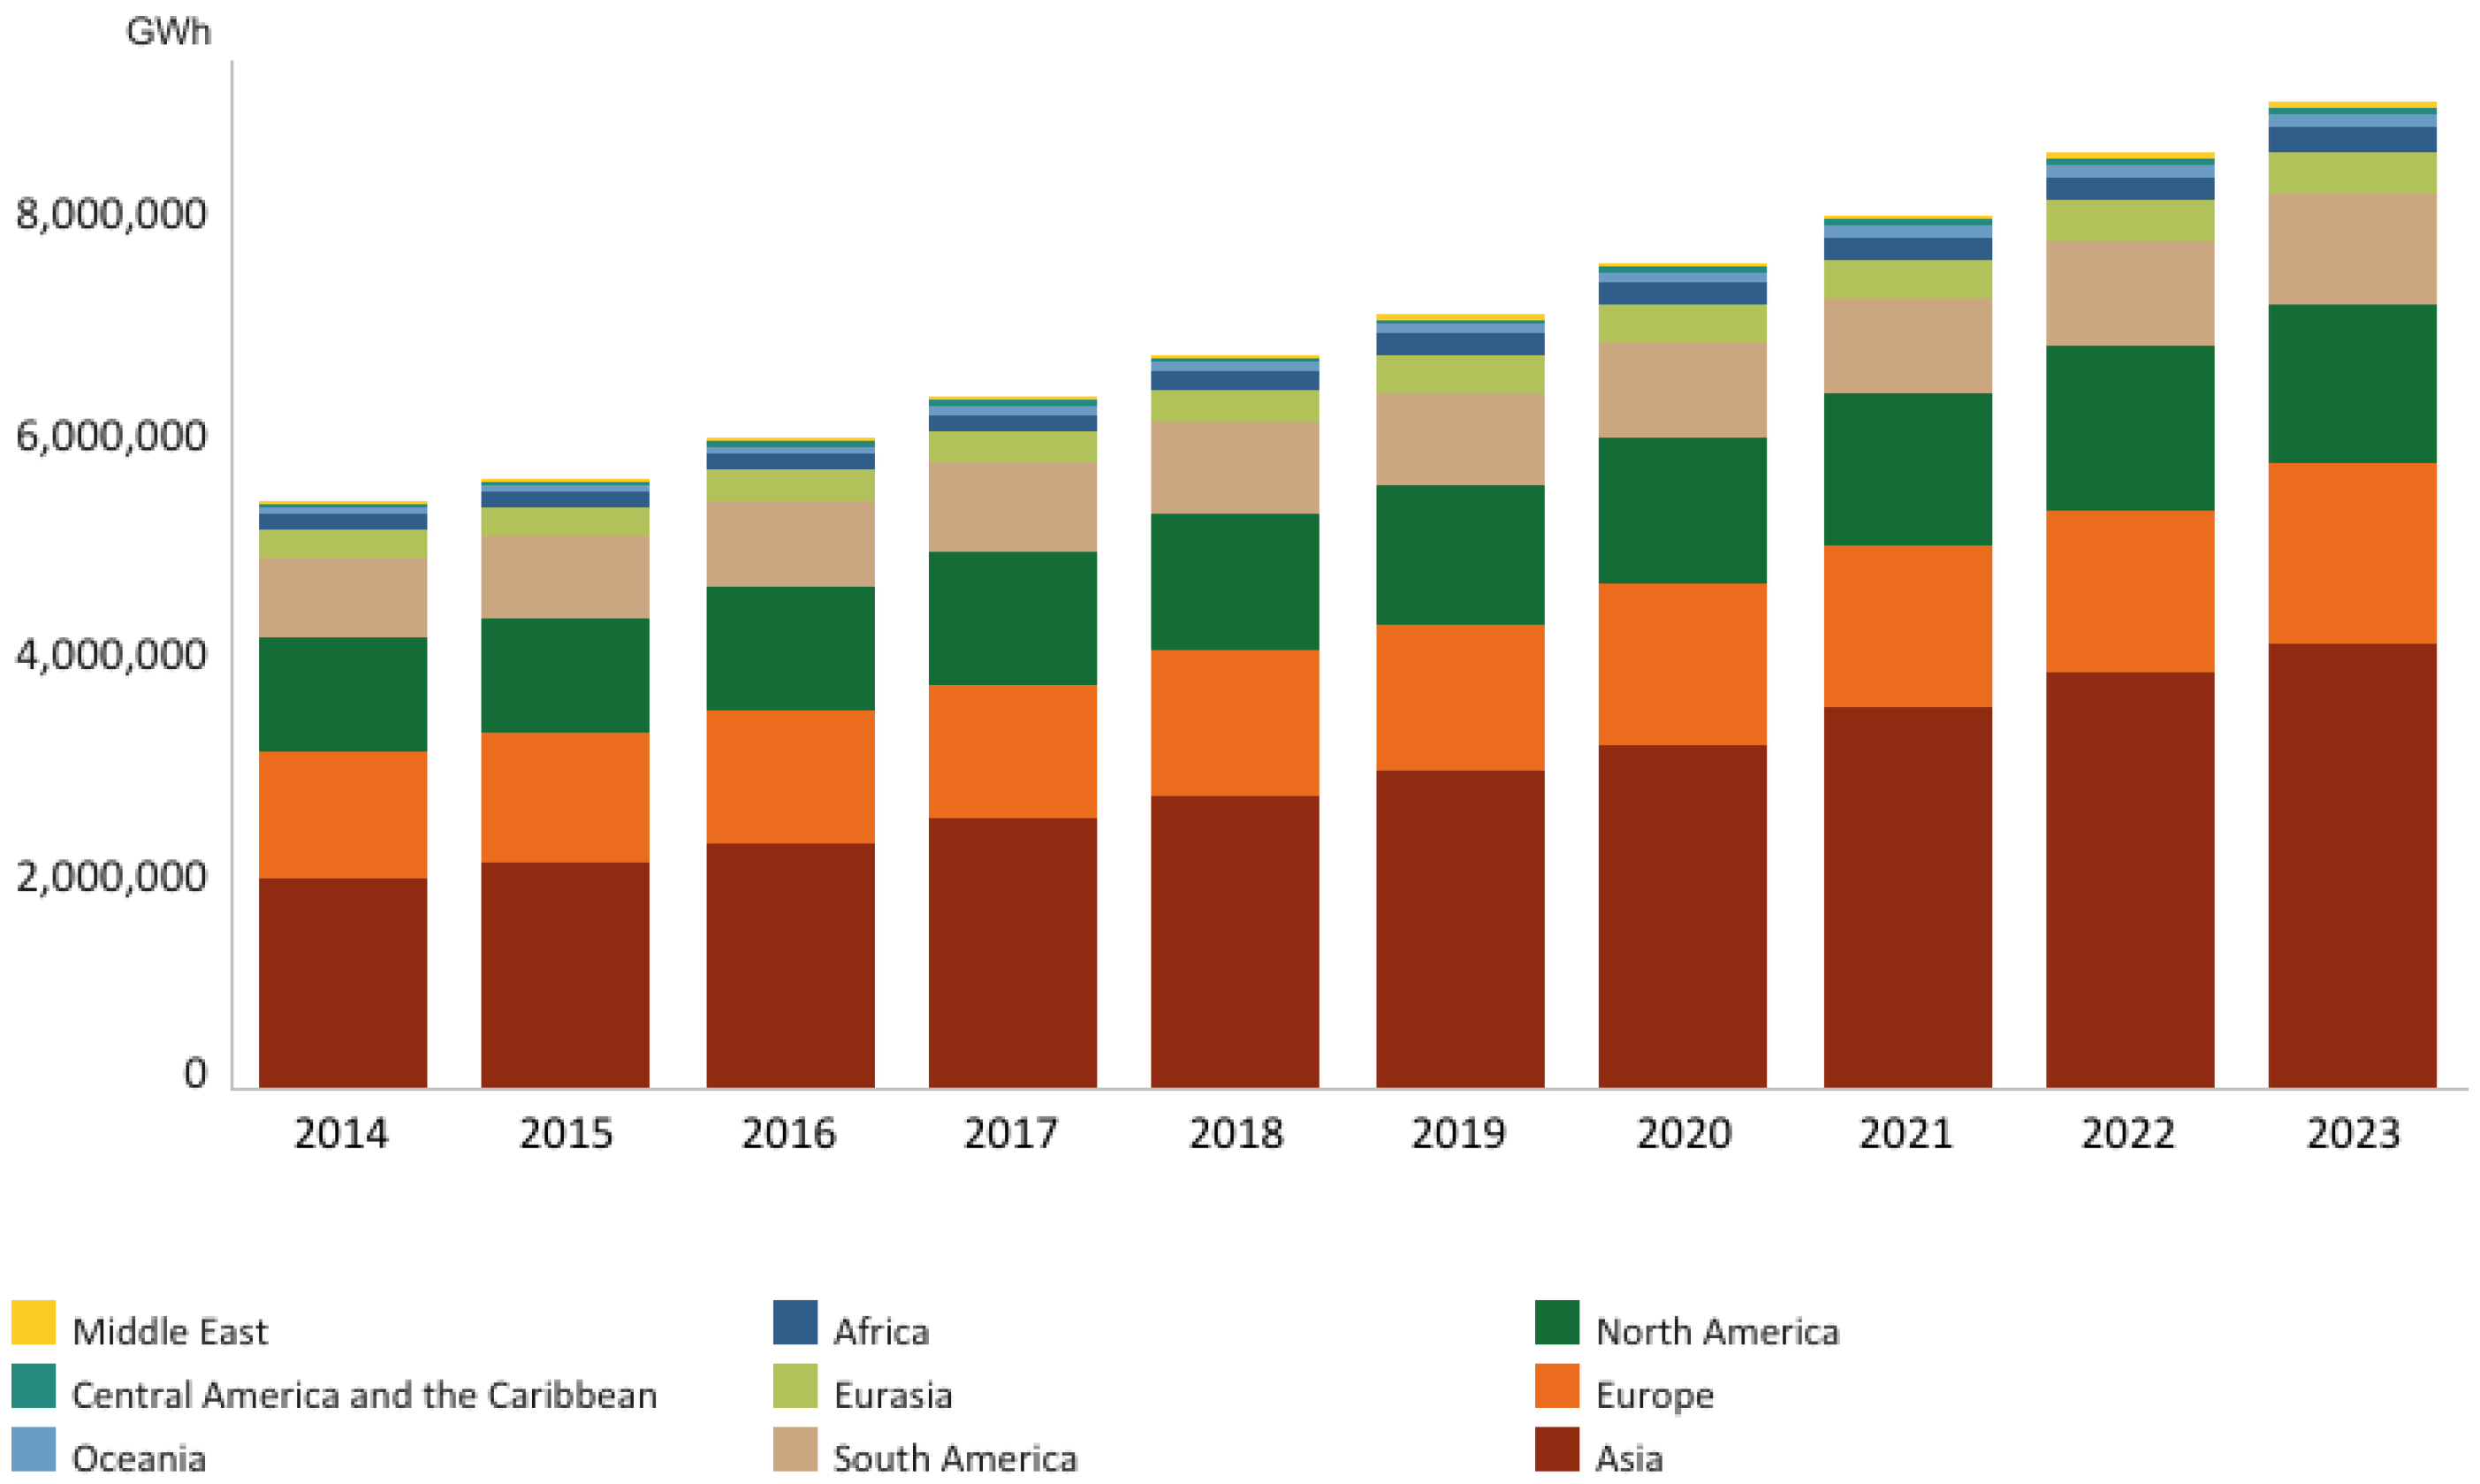
The depletion of fossil fuel resources and their adverse environmental impacts have accelerated the global transition toward renewable energy sources. Among the available alternatives, solar energy has emerged as one of the most promising solutions due to its sustainability, widespread availability, and critical role in ensuring long-term energy security. PV technology, which directly converts solar radiation into electrical energy, has consequently experienced rapid growth, shown in Figure 1, with the global installed capacity projected to exceed 8000 GW by 2050 [1].
Figure 1.
Global rise in electricity power installation using renewable energy sources. The statistics are taken from https://www.irena.org (accessed on 7 January 2026).
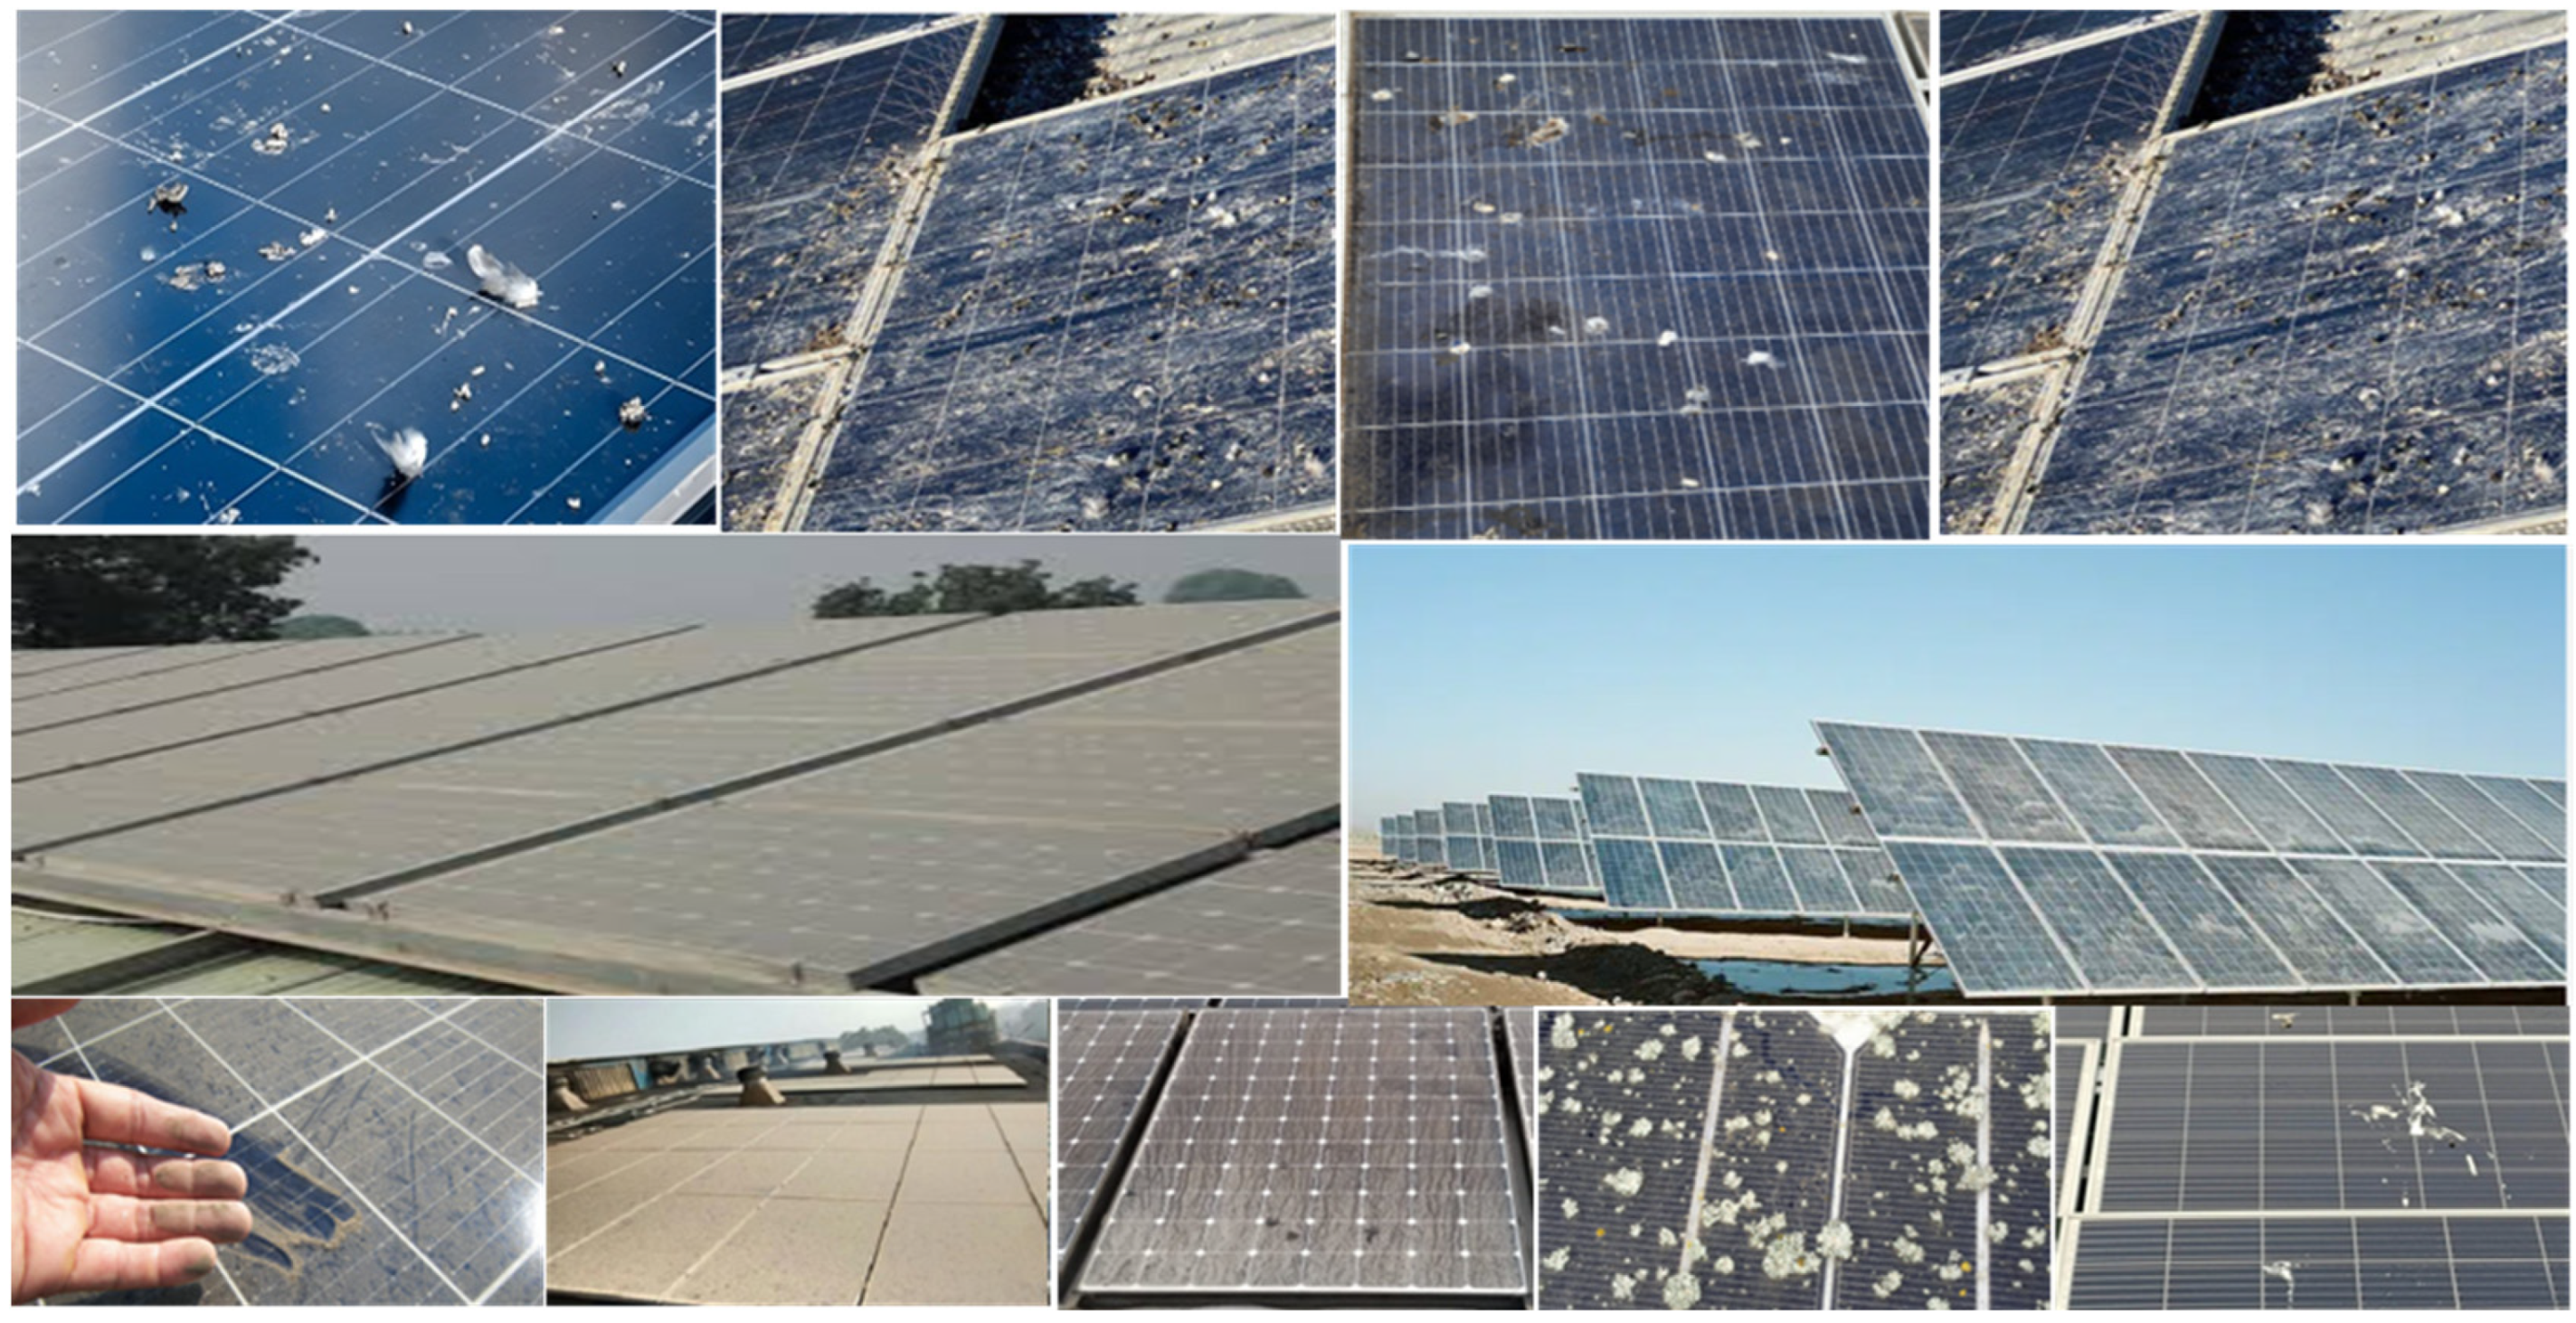
Despite all these advantages, the operational efficiency of PV systems is highly sensitive to environmental factors. Prolonged exposure to dust, sand, air pollution, rainfall residues, and changes in meteorological conditions causes soiling of the PV panels. Soiling causes the loss of incident solar radiation and hence affects the efficiency of the PV system [2]. It has been observed in various studies that the efficiency loss of PV systems due to soiling varies between 10 and 60% [3]. Such extreme losses have been observed in different geographical locations. In Saudi Arabia, 50% efficiency loss has been observed in six months [4]. In Nepal, 76% efficiency loss has been observed in 29 months [5]. In India, 30% efficiency loss has been observed in two months [6]. In Kuwait, 65% efficiency loss has been observed in two months [7]. In addition to efficiency loss, soiling of PV panels causes the trapping of moisture, leading to corrosion and structural degradation of the panels [8]. Figure 2 shows various types of dirt accumulated on solar panels.
Figure 2.
Various types of dirt and birds waste found on solar panels.
All these effects, collectively, underscore the need to ensure effective monitoring, timely cleaning, and effective maintenance strategies for large-scale solar power plant installations. However, it is not practical to use conventional methods such as image processing and cleaning strategies for solar power plant installations due to their high costs, labour requirements, and scalability. Hence, image processing and AI-based monitoring systems have drawn considerable attention as a cost-effective solution to monitor solar power plant conditions [9]. This is to ensure intelligent scheduling strategies to reduce energy production costs. Recent advances in image processing and AI have made significant contributions to various applications, including surveillance, disease detection, and medical image analysis [6]. Similarly, image processing and AI have made significant contributions to solar power plant monitoring. Specifically, CNN models have shown promising potential to learn discriminative features from images to detect soiling on solar panel surfaces. However, most state-of-the-art models have a large number of parameters to be trained, which may require significant computational resources, such as GPUs. Moreover, the model architecture and classification-oriented outputs may not be suitable for risk-based decision-making [10,11].
In order to overcome these challenges, lightweight CNN architectures have been proposed to reduce the computational cost while achieving reasonable classification performance. Among these, SolPowNet proposed an efficient CNN architecture specifically designed for solar panel dust detection, which showed promising results under controlled experimental conditions. However, it is observed that most CNN-based methods proposed so far use a single CNN model to perform classification on the given dataset, with limited focus on predicting the cleanliness level of the solar panels. Moreover, these methods do not use prediction confidence to make decisions. These limitations restrict the applicability of CNN-based methods to real-world PV operation and maintenance scenarios. With these observations in mind, this paper proposes an intelligent cleaning decision framework that is inspired by the SolPowNet architecture. The proposed framework utilizes the benefits of classical image processing techniques, machine learning methods, and lightweight deep learning architectures. The proposed system uses physically interpretable handcrafted features to represent the intuitive soiling features, while the high-level semantic features are represented using a lightweight CNN architecture. Unlike existing CNN-based methods, the proposed system uses an ensemble approach to make decisions, thereby reducing high-risk classification.
1.1. Paper Contributions
The main contributions of this research work are briefly summarized as follows:
- A hybrid ensemble method that combines a handcrafted feature-based Random Forest classifier and a lightweight CNN architecture, namely MobileNetV3-Small, to enhance the robustness of soiling detection results.
- A conservative OR-based ensemble fusion method that ensures minimal false negatives in dusty-panel detection, which is critical in PV maintenance decision-making.
- A probability-based SI that utilizes confidence probability to inform decision-making in PV panel maintenance, including no cleaning, light cleaning, and heavy cleaning, which redefines soiling detection as decision-making rather than classification.
- Experimental evaluation of the proposed method on various PV panel image datasets to demonstrate improved reliability in dusty panel detection and decision-making under different environmental conditions.
Novelty and innovation: While several existing methods report high classification accuracy, their primary focus is typically on classifier performance under a fixed dataset setting. The novelty of this work is the introduction of a risk-aware maintenance decision framework that (i) integrates physically interpretable handcrafted features with a lightweight CNN to exploit complementary cues, (ii) employs a conservative OR-based fusion rule specifically designed to reduce maintenance-critical missed soiling events (false negatives), and (iii) converts probabilistic confidence into an actionable Soiling Index (SI) with explicit cleaning thresholds. Together, these design choices emphasize maintenance outcomes and deployment-oriented decision support, rather than only maximizing headline accuracy.
Risk-aware problem statement: In PV operation and maintenance, the cost of a false negative (dusty panel predicted as clean) is typically higher than that of a false positive, because missed soiling can delay cleaning and cause cumulative energy loss. Therefore, the objective of this work is to design a soiling detection system that explicitly prioritizes reducing dusty false negatives (i.e., improving dusty recall) while maintaining acceptable overall classification performance.
Hypothesis (risk-aware fusion): Because handcrafted texture–sharpness features (RF branch) and CNN features respond differently to environmental and imaging variations, fusing the two branches using a conservative OR-based ensemble rule (flagging dusty if either model predicts soiling) will reduce missed soiling events (false negatives) and improve dusty-panel recall, thereby providing more reliable maintenance-oriented cleaning decisions when combined with the probability-driven Soiling Index (SI).
1.2. Paper Roadmap
The rest of this paper is organized as follows. Section 2 discusses the relevant literature on solar panel soiling detection and intelligent monitoring systems. Section 3 introduces the proposed hybrid ensemble approach along with its architectural components. Section 4 introduces the experiment design along with the evaluation approach. Section 5 contains a detailed discussion of the results. Section 6 concludes the paper and presents directions for future research.
2. Related Work
In recent years, various image processing and deep learning-based techniques have been extensively researched and explored for the purpose of automatic evaluation of PV panel cleanliness. CNN architectures have been found to possess excellent potential in learning discriminative features from images of PV panels and classifying them into clean and dusty panels quickly and accurately. Such developments in this field have greatly aided in the automation of monitoring and maintenance activities in solar power plants, and this has resulted in an increased interest in this field of research. Various studies were conducted on developing a deep learning framework for the purpose of detecting and classifying dust on solar panels. Sun et al. used a YOLO-based architecture for improving the detection of dust pollution on PV panels, and it was found to perform better in terms of accuracy and speed compared to conventional deep learning models. The precision and recall of this model were 89.71% and 90.23%, respectively, making it highly suitable for practical applications [12]. In addition to this, some studies were conducted to explore the physical effects of dust on solar panels using experimental measurements. Maghami et al. conducted comparative experiments using two identical PV panels, one of which was cleaned and the other left uncleaned, and it was found that an energy loss of 11.61 kWh occurred in the uncleaned panel, thereby validating the direct proportionality between dust and power loss [13].
In addition to this, various studies have focused on combining deep learning with traditional machine learning paradigms to create a hybrid model that leverages CNN features and traditional machine learning classification algorithms. Mehta and Singh created a CNN–SVM model that utilized a CNN to obtain deep features and then employed a support vector machine classifier to classify those features. This model was able to achieve 95% accuracy even when subjected to adverse environmental conditions while keeping the implementation costs low [14]. Ghosh et al. employed a CNN model inspired by AlexNet to detect dust on solar panels and was able to achieve 85% accuracy, thus proving that CNN can be employed to automate PV cleaning processes [15]. Other more complex architectures combine residual learning and attention mechanisms with physics-informed approaches to achieve higher robustness and accuracy. Fan et al. created a residual network model that was enhanced with image preprocessing capabilities and was thus able to achieve an R2 accuracy of 78.7% and a mean absolute error of 3.67%, thus proving to be more accurate than other such models [16]. Bashirr et al. created a model that combined CNN with a Random Forest classifier and was thus able to achieve 98% accuracy by first converting characteristics of an electric I–V curve into an RGB image and then extracting features using a CNN model [17].
Apart from fixed camera image analysis techniques, various drone-assisted and sensor-based vision techniques have been proposed in the recent literature for large-scale PV system monitoring. In this context, various techniques have been proposed that use unmanned aerial vehicles (UAVs), cameras, and computer vision techniques for the automation of data acquisition and analysis for large-scale solar farms. Some specific techniques proposed in the literature include cell-level soiling analysis techniques, hybrid CNN-tree-based techniques, attention-based CNN-Transformer techniques, and physics-informed deep learning techniques. A comparative summary of various techniques proposed in the recent literature is given in Table 1.
Table 1.
Summary of representative studies on PV panel soiling detection and analysis.
Despite these advances, most existing methods emphasize classification accuracy without explicitly addressing decision confidence or the operational risks associated with false negative soiling detections.
3. Proposed Hybrid Ensemble Framework
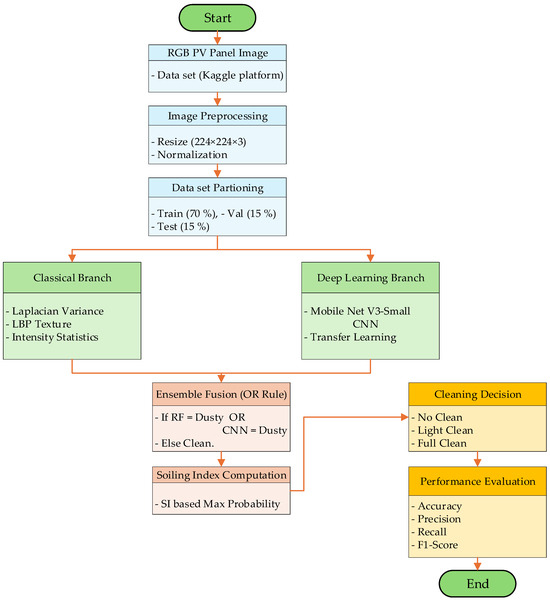
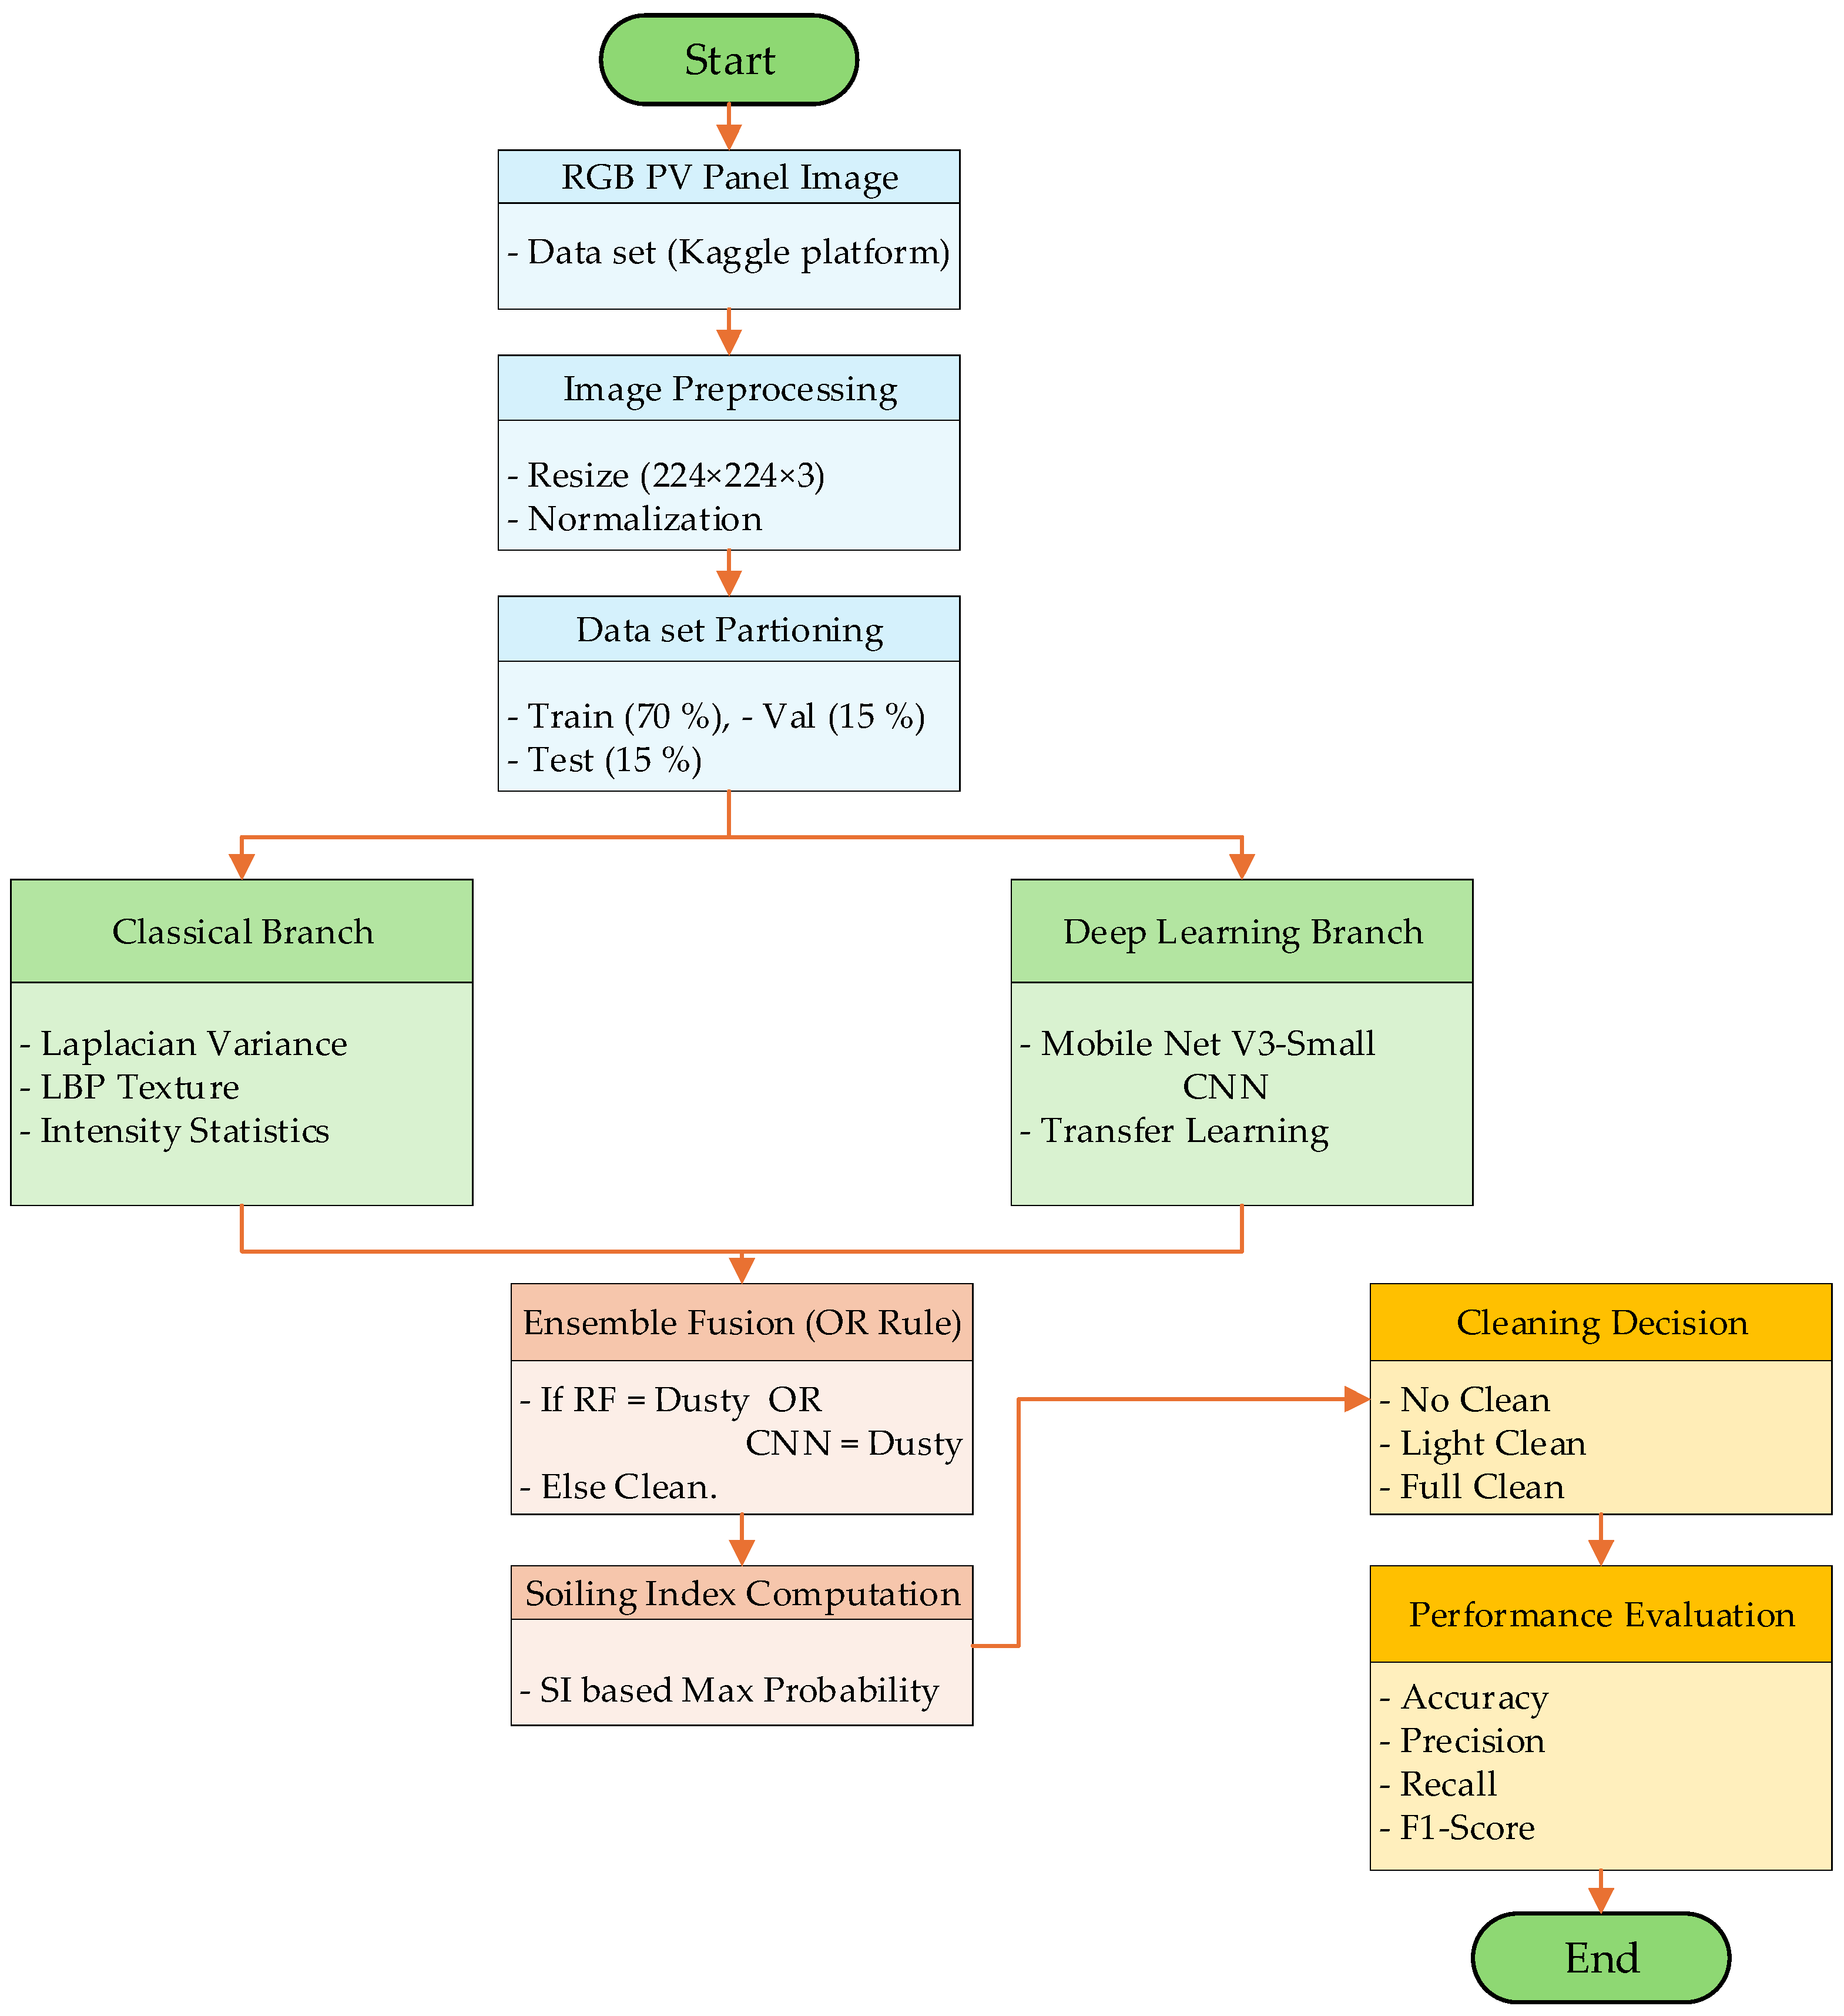
In this section, a SolPowNet-inspired hybrid and ensemble-based intelligent cleaning decision framework is presented for the automatic detection of dust on PV panels, with the overall workflow illustrated in Figure 3.
Figure 3.
Proposed hybrid ensemble framework work flow.
The section first describes the datasets used in this study, highlighting their main characteristics, class distributions, and variability in environmental and imaging conditions, which form the basis for training, validation, and independent testing. It then introduces the core components of the proposed framework, including a classical image processing branch that extracts handcrafted texture, sharpness, and statistical features and classifies them using a Random Forest model, alongside a lightweight deep learning branch based on transfer learning that employs a convolutional neural network for high-level feature extraction from RGB images. The “complementary” nature of these two branches is exploited through the implementation of a conservative ensemble fusion strategy with the aim of increasing robustness while minimizing the likelihood of risky misclassification, especially with regard to the misclassification of soiled panels as clean. Additionally, the formulation of a probability-driven SI is presented with the aim of mapping model outputs to actionable cleaning decisions, namely no cleaning, light cleaning, and full cleaning, thereby effectively transforming the soiling detection problem from a binary classification one to a more applicable one. Lastly, the criteria employed in the performance evaluation are presented, namely accuracy, precision, recall, F1-score, confusion matrix analysis, with special emphasis being given to the reliable detection of dusty panels.
3.1. Effect of Dust on Light Attenuation in PV Panels
The electrical performance of PV panels is directly influenced by the amount of solar irradiance reaching the cell surface. Under standard operating conditions, the output power of a PV module can be expressed as [27]:
where denotes the output power, is the incident solar irradiance on a clean panel surface, γ is the temperature coefficient, and represents the ambient temperature. , , and correspond to values under Standard Test Conditions.
In real outdoor environments, PV panels are exposed to dust and airborne contaminants that attenuate incoming solar radiation through absorption and scattering effects [28,29,30]. The effective irradiance received by a dust-covered panel can be modelled as:
where denotes the irradiance under dusty conditions and represents the dust-induced optical attenuation coefficient.
To quantify soiling-induced degradation, the Soiling Loss Index (SLI) is defined as:
The SLI provides a normalized indicator of irradiance loss due to surface contamination and directly reflects the severity of dust accumulation. Incorporating the soiling effect into the power model yields:
This formulation highlights the combined influence of irradiance attenuation, temperature variation, and surface soiling on PV output power, thereby motivating the need for accurate soiling detection and intelligent cleaning decision mechanisms.
3.2. Dataset Description
The data used by the research is collected from an openly accessible photovoltaic panel soiling dataset provided by Afroz and shared on the Kaggle platform [31]. The dataset consists of RGB images of photovoltaic panels collected under different environmental conditions, with different lighting, surface contamination levels, viewing angles, and background environments. The images are classified as clean or dusty photovoltaic panels.
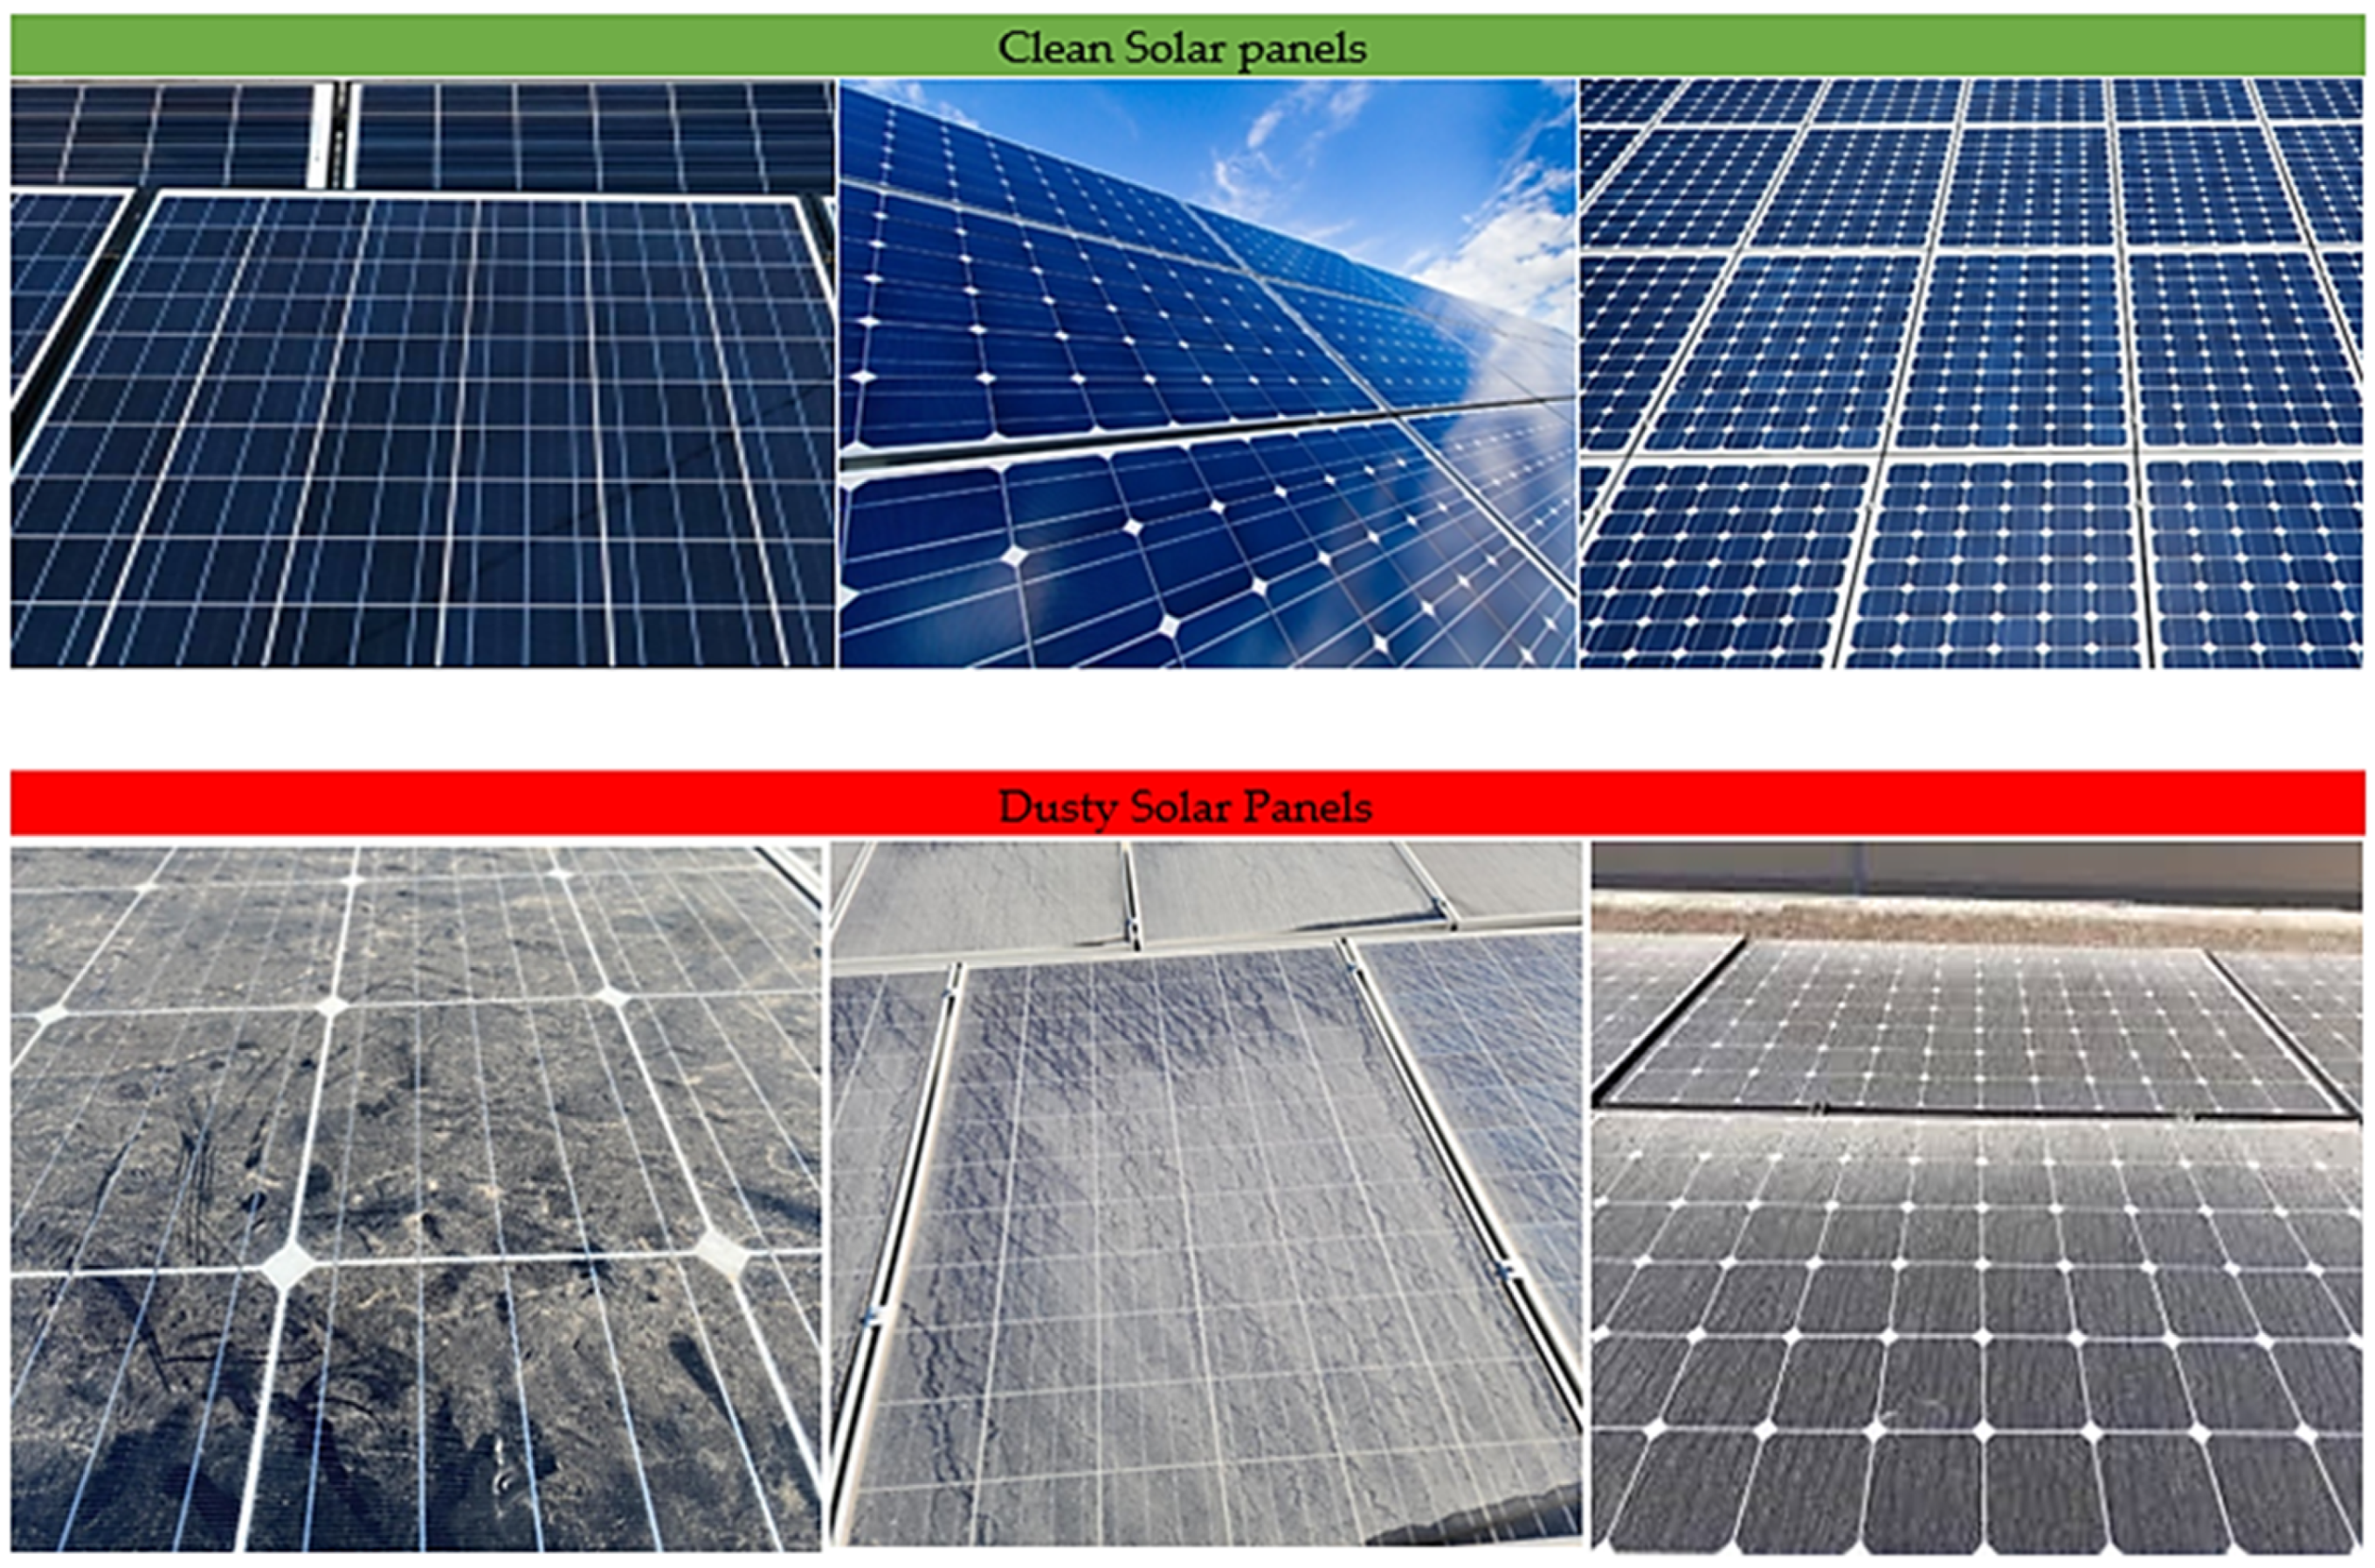
In total, the dataset comprises 383 images, with 193 images classified as clean and 190 images classified as dusty photovoltaic panels, which can be considered almost equally distributed. Because the dataset is modest in size for CNN training, it applies lightweight data augmentation during MobileNetV3-Small training to improve generalization while preserving physically meaningful soiling cues. Specifically, the training images are augmented using random horizontal flipping, small-angle rotations (±5°), and mild colour jittering; augmentation is applied only to the training subset (see Section 4.2 for details). The images were originally collected at different spatial resolutions; however, all of these images are resized to a uniform size of 224 × 224 × 3 pixels. This uniform size is appropriate for the input data for the MobileNetV3-Small CNN and meets the criteria for the conventional and deep learning components of the CNN. Figure 4 shows some examples of clean and dusty photovoltaic panels.
Figure 4.
Sample images illustrating clean and dirty PV panels.
To assess model robustness beyond controlled experimental conditions, additional evaluation was performed using an independent unseen dataset, enabling the investigation of cross-dataset generalization under domain-shift scenarios. Details regarding dataset partitioning, training–validation–testing splits, and evaluation protocols are provided in Section 4.1.
Independent Unseen Dataset (Domain-Shift Evaluation Dataset)
To assess model robustness beyond the development dataset, additional evaluation has been performed using an independent unseen dataset to examine cross-dataset generalization under domain shift. In this study, domain shift refers to a change in the image distribution between the development dataset and the external dataset due to differences in acquisition and environmental conditions (e.g., illumination, camera viewpoint/orientation, background content, and soiling appearance). The unseen dataset was obtained from a separate Kaggle PV soiling dataset and was not used during training, validation, or model selection. It contains 2562 images, comprising 1493 clean and 1069 dusty samples (clean: dusty ratio ≈ 1.40:1).
Labelling procedure: Images were labelled into clean and dusty classes according to the Kaggle dataset annotations (class folders/labels). These provided labels used directly for evaluation to ensure consistency with the dataset ground truth.
Details regarding dataset partitioning, training–validation–testing splits, and evaluation protocols are provided in Section 4.1, while cross-dataset performance under domain shift is reported in Section 5.8.
3.3. Image Preprocessing
Before the feature extraction or classification, each image of the PV panel undergoes an image preprocessing step, which is unique to the needs of the two branches in the suggested framework, namely, the classical machine learning branch and deep learning approaches. In the classical machine learning, the images are converted from RGB to grayscale. The rationale for this is to optimize the calculation of texture and sharpness-related features, as well as those associated with dust buildup. The image is converted to grayscale to reduce redundancy in the colour data, but the essential intensity and spatial irregularities are preserved, reflecting the impact of the dust on the PV panel surface. The dust primarily affects the image in terms of contrast, brightness, and high-frequency texture, and these are the dimensions in the image data in the case of the grayscale image, which are the most relevant to the calculation of the Laplacian variance, Local Binary Pattern (LBP), and other statistical intensity-related features.
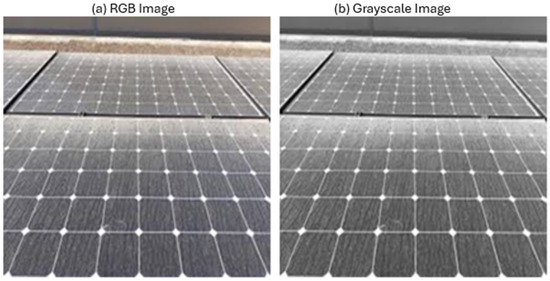
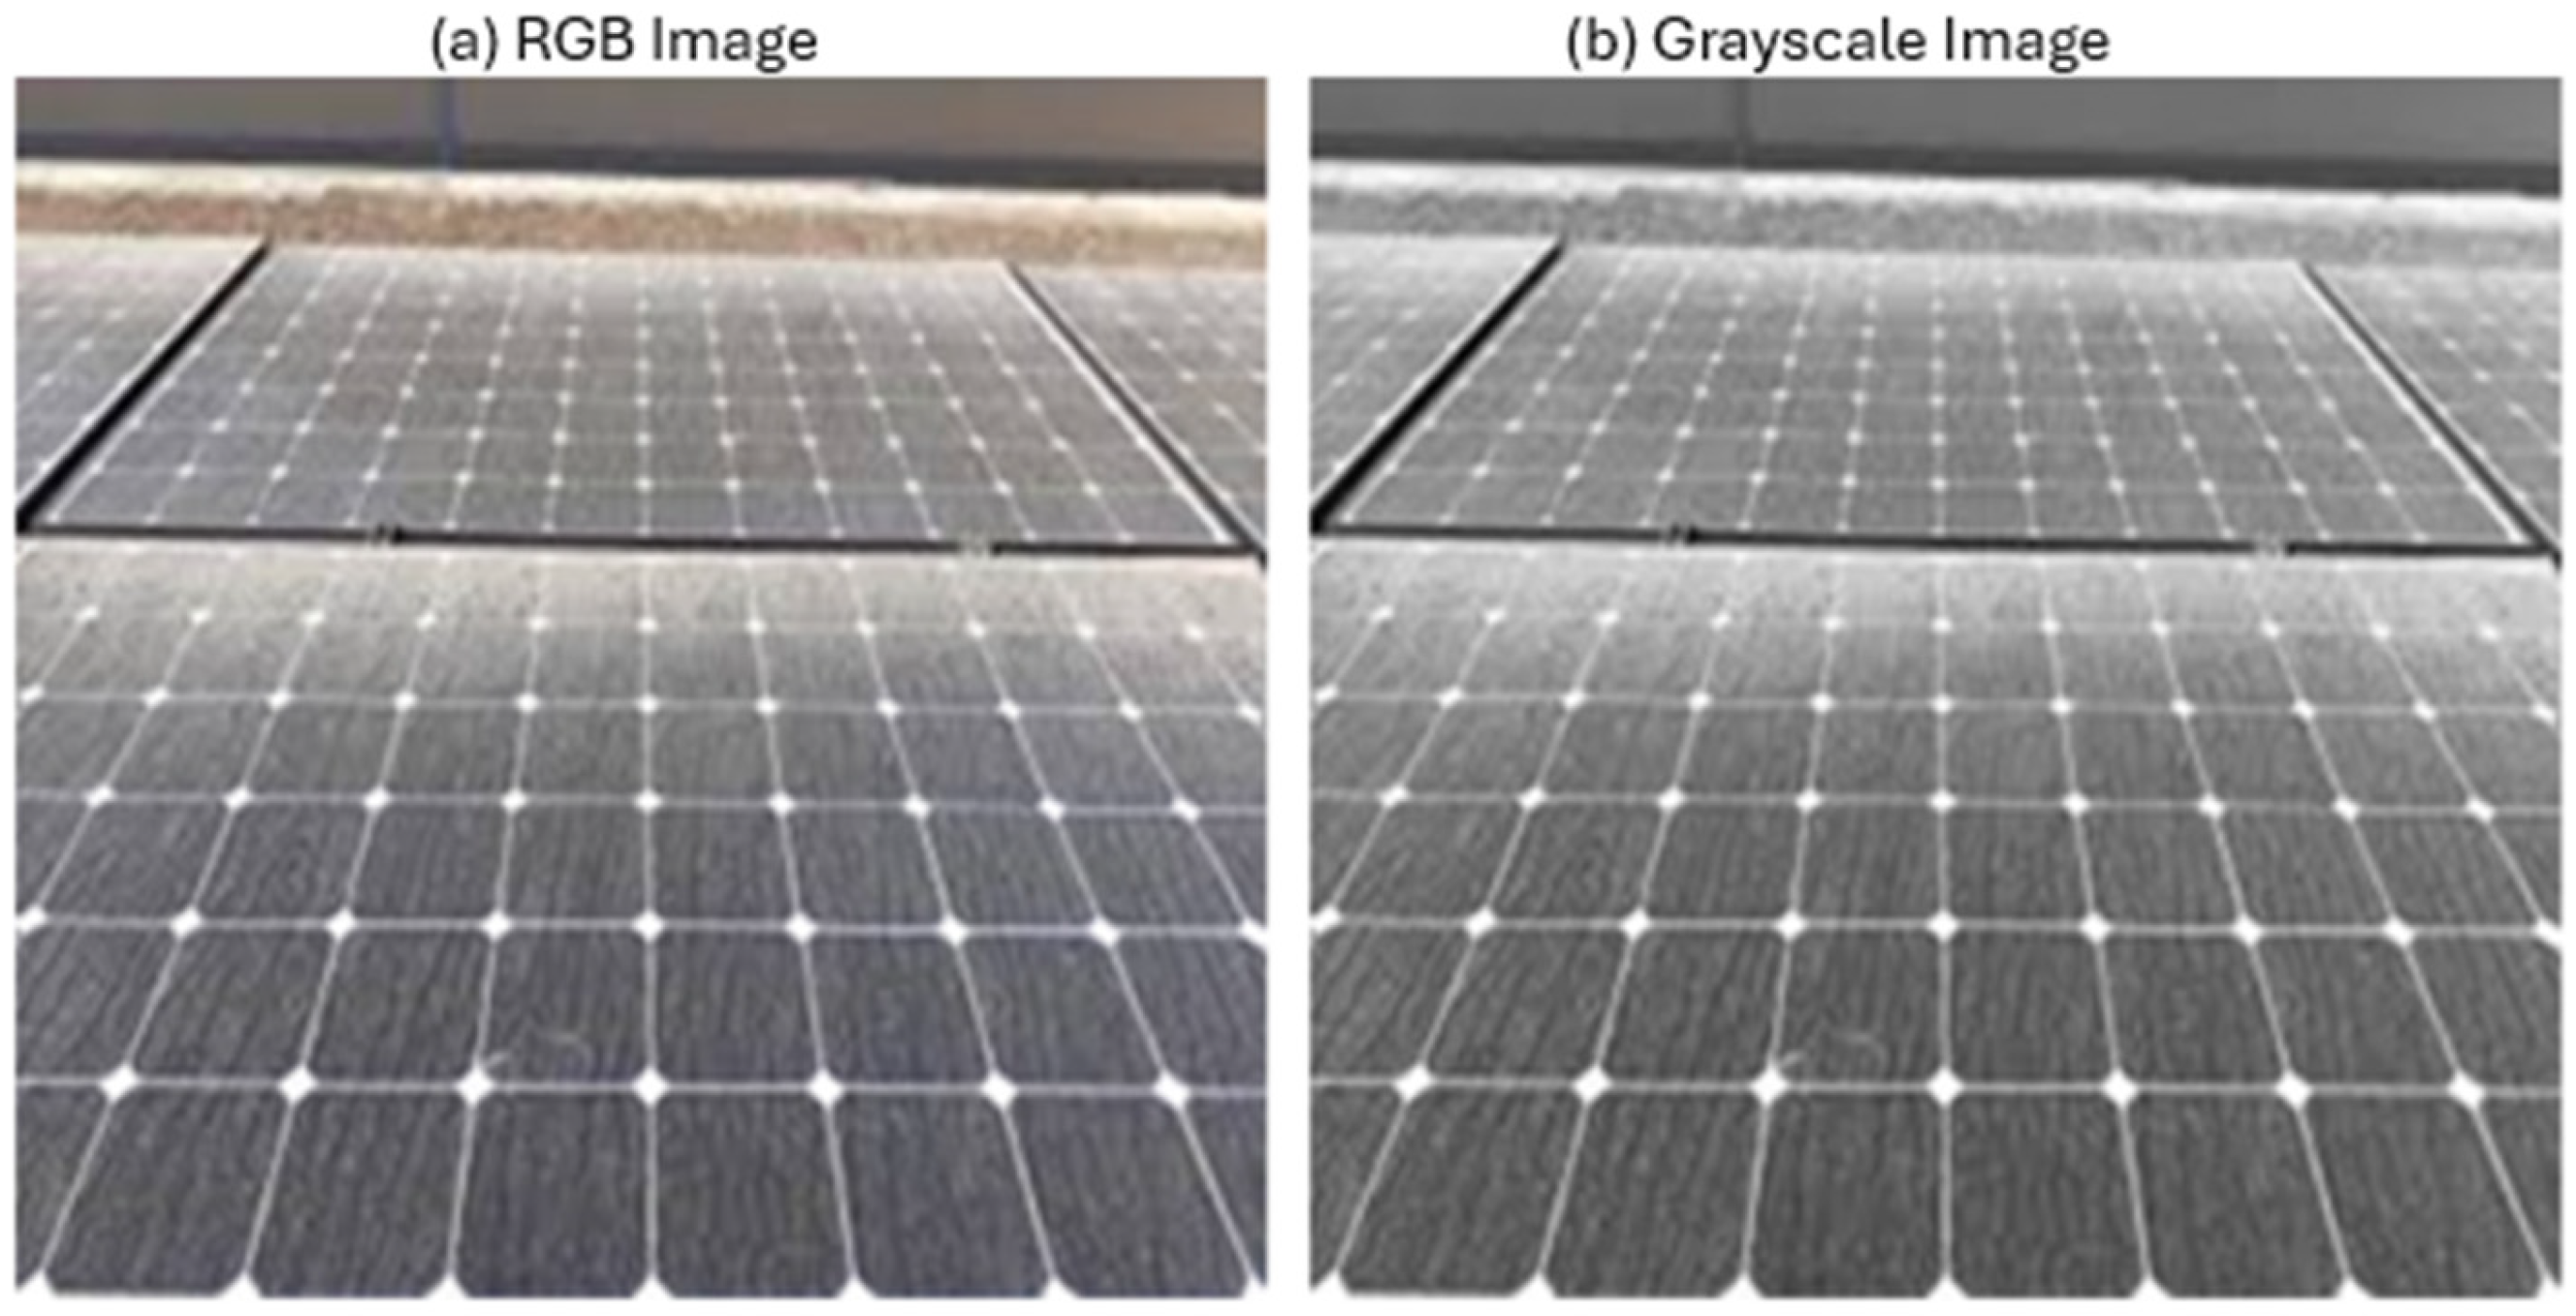
An illustrative example of this conversion is presented in Figure 5, where a dusty PV panel in RGB format (Figure 5a) and its corresponding grayscale representation (Figure 5b) are shown. As observed, the grayscale image retains dust-related texture non-uniformities and shading variations, which are critical for classical feature modelling, while simplifying the data representation.
Figure 5.
(a) Example RGB image of a dusty PV panel; (b) Corresponding grayscale representation used for handcrafted texture and sharpness feature extraction.
In the deep learning branch, the images are used in RGB to ensure the presence of colour and semantic information in the image data, as explained in the following paragraphs. All the images are resized to 224 × 224 × 3 pixels and are normalized using the ImageNet dataset’s mean and variance values to ensure the stability of the learning process and the convergence of the deep learning model. This dual preprocessing strategy ensures that each branch operates on an input representation optimized for its respective modelling paradigm, thereby enhancing complementary feature learning within the hybrid ensemble framework.
3.4. Handcrafted Feature Extraction and Random Forest Classification
Inspired by classical image processing techniques, a set of handcrafted features is extracted to capture physically interpretable soiling characteristics from PV panel images. Image sharpness and surface clarity are quantified using the Laplacian variance, which measures the amount of high-frequency content in the image. The Laplacian operator applied to a grayscale image is defined as
and the corresponding Laplacian variance is computed as
Moreover, the histograms of Local Binary Pattern (LBP) are utilized to extract the local texture variations introduced by dust accumulation. For a central pixel with intensity , the LBP code is expressed as
Here, represents the intensity of neighbouring pixels within a circular neighbourhood of radius R. The resulting LBP codes are accumulated into histograms that describe local texture distributions.
Furthermore, statistical intensity measures are computed to capture global brightness and contrast variations caused by surface contamination. These include the mean intensity
While the standard deviation is computed as
The root mean square (RMS) contrast, which reflects overall intensity contrast, is defined as
and the local intensity variation is computed as the average of local standard deviations over neighbourhoods,
All extracted descriptors are concatenated to form a compact feature vector representing each image. These feature vectors are classified using a Random Forest classifier, selected for its robustness to overfitting, ability to model nonlinear feature interactions, and reliable performance on medium-sized datasets. In addition to predicted class labels, the RF model provides class probability estimates, which are later incorporated into the ensemble fusion strategy and the cleaning decision formulation.
The Random Forest classifier was configured as follows: number of trees n_estimators = 400, maximum depth max_depth = None (i.e., nodes are expanded until pure or until the minimum split constraint is reached), and feature selection at each split max_features = “sqrt”, meaning that a random subset of candidate features is considered at each split (where d is the number of handcrafted input features). The split criterion was Gini impurity, and class imbalance was handled using class_weight = “balanced”. The full handcrafted feature vector is provided to the RF; the max_features setting controls the random subset of candidate features evaluated at each node split.
3.5. Lightweight CNN Architecture (MobileNetV3-Small)
To complement the physically interpretable handcrafted features, a lightweight CNN based on MobileNetV3-Small is employed to automatically learn high-level visual representations directly from RGB PV panel images. MobileNetV3-Small is specifically designed for efficiency-critical applications and offers an optimal trade-off between classification accuracy and computational complexity, making it particularly suitable for deployment in resource-constrained environments such as edge devices, embedded systems, and drone-based inspection platforms. This claim is supported by the CPU inference-time and model-size benchmarks reported in Section 5.9. The choice of MobileNetV3-Small is motivated not only by deployment efficiency but also by its reduced parameter count (~2.5M), which helps mitigate overfitting risks in limited-data scenarios.
In this work, transfer learning is applied by initializing the network with ImageNet-pretrained weights and replacing the final classification layer with a two-node output corresponding to the clean and dusty classes. Fine-tuning enables the network to adapt to PV-panel-specific soiling patterns while retaining the compact structure and fast inference capability of the original architecture.
MobileNetV3-Small is composed of stacked convolutional blocks that integrate depth wise separable convolutions, inverted residual bottleneck structures, and squeeze-and-excitation (SE) attention mechanisms. Compared with conventional CNN architectures, this design significantly reduces the number of trainable parameters and floating-point operations while preserving strong representational capacity.
3.5.1. Convolutional and Depth Wise Separable Convolution Layers
Instead of standard convolutions, MobileNetV3-Small predominantly employs depth wise separable convolutions, which decompose a conventional convolution into two sequential operations: a depth wise convolution and a pointwise convolution. For an input feature map X and convolution kernel K, a standard two-dimensional convolution is expressed as
In depth wise separable convolution, the operation is factorized as
where represents the depth wise kernel applied independently to each input channel, and the term represents a pointwise convolution operation of size 1 × 1, which combines the responses of each channel. This factorization reduces the computation significantly and enables the model to learn discriminative texture and intensity features related to dust accumulation on the surface of PV panels. The model enables fast inference and retains sufficient representation capacity to model surface soiling.
3.5.2. SE Attention Mechanism
To enhance the discriminability of features, MobileNetV3-Small introduces SE modules that dynamically weight channel-wise feature responses. Given a feature map , the squeeze operation collects global spatial features through global average pooling along the height and width:
The excitation operation computes channel-wise weights using a gating mechanism:
In this equation, δ (·) denotes the ReLU activation function, and σ (·) denotes the sigmoid activation function, with learnable parameters and . This configuration enables the network to focus on more informative feature channels about dust information and suppress less informative ones.
3.5.3. Pooling and Fully Connected Layers
The pooling operations gradually decrease the spatial resolution of the feature maps while retaining the significant structural details. After the feature extraction process, fully connected layers are used for classification. The last layer is adjusted to produce two outputs for clean PV panels and dusty PV panels. The SoftMax activation function is used for class probability estimation, and the results are used for ensemble fusion and Soiling Index calculation.
The detailed layer-wise configuration of the fine-tuned MobileNetV3-Small model employed in this study is summarized in Table 2.
Table 2.
Fine-tuned MobileNetV3-Small architecture used in this study (input size: 224 × 224 × 3).
3.6. Ensemble Fusion Strategy
Risk-aware fusion objective: The ensemble fusion strategy is designed to reflect maintenance risk, where missing a dusty panel (false negative) is more costly than incorrectly flagging a clean panel (false positive). Accordingly, a conservative OR-based rule has been adopted that marks a panel as dusty if either the RF branch or the MobileNetV3-Small branch detects soiling, and marks it clean only when both agree it is clean. This design directly supports maintenance outcomes by reducing missed cleaning events that can lead to avoidable energy losses.
To leverage the best of traditional machine learning and deep learning without overcomplicating things, a cautious ensemble of a Random Forest classifier and a MobileNetV3-Small CNN has been used. Both models work on the same input image of a PV panel independently and produce a label and a confidence score for it.
Instead of relying on a single source of truth, an OR-based fusion rule has been used to make a final decision, which is more focused on not missing dusty panels. In this approach, a panel is marked dusty if either model marks it dusty, and it is marked clean only if both models agree on a clean state.
In addition to providing the final classification result, the ensemble system also retains the probabilistic results from each of the models, which are then used as input to a probability-driven SI. With the interpretability of the handcrafted features and the high-level semantic information provided by the CNN, the ensemble system moves beyond the simple classification task and into the realm of decision support, providing risk-based cleaning decisions that are critical for large-scale monitoring systems.
3.7. Soiling Index and Cleaning Decision Formulation
A Soiling Index (SI) is introduced as a continuous measure of PV panel soiling severity, translating classification outputs into actionable maintenance advice. Rather than providing a binary “clean/dusty” decision, SI encodes the model’s confidence and supports risk-adjusted cleaning actions aligned with PV operation and maintenance requirements.
Let and denote the dusty-class probabilities predicted by the Random Forest classifier and the MobileNetV3-Small CNN, respectively. In accordance with the conservative OR-based ensemble strategy adopted in this study, the ensemble dusty confidence is computed as
The Soiling Index is then defined on a normalized scale from 0 to 100 as
This strategy focuses on the reliable detection of panels that might be dusty by always choosing the highest confidence score from one of the classifiers. This strategy aims to reduce high-risk false negatives while remaining responsive to various levels of surface contamination.
With the SI value calculated, three cleaning levels are established:
- No Cleaning (SI < 30): little to no soiling is detectable;
- Light Cleaning (30 ≤ SI < 60): some soiling is present, with minimal impact on energy output;
- Full Cleaning (SI ≥ 60): heavy soiling is expected, with noticeable energy losses.
The probabilistic confidence incorporated in the decision process converts the soiling detection problem from a simple yes/no question into a useful decision support system. This helps in the scheduling of condition-based maintenance, minimizes unnecessary cleaning, and keeps automated vision-based detection in tune with cost-effective PV cleaning strategies.
3.8. Performance Evaluation Metrics
In the study “Assessing the proposed hybrid ensemble framework and its individual classifiers,” classification metrics such as accuracy, precision, recall, F1-score and Area Under the ROC Curve (AUC) were utilized, which are commonly applied when classifying images. These metrics provide a comprehensive overview, such as overall correctness, reliability of classifiers when classifying dusty panels, as well as sensitivity to surface contamination.
The evaluation criteria are derived from the confusion matrix, where the predicted results are categorized into True Positives (TPs), False Negatives (FNs), True Negatives (TNs), and False Positives (FPs). In the context of PV panel maintenance, the interest is particularly in the recall value of the dusty class because a false negative result, which is a dusty panel missed, may cause a delay in cleaning and result in energy losses.
The definitions of these metrics are provided in Table 3. These metrics are computed uniformly over all models and evaluation settings, as described in this section, to provide a fair comparison. The numerical results and side-by-side analysis are provided in Section 5.
Table 3.
Mathematical formulas and explanations for the evaluation metrics.
In addition to the metrics based on the confusion matrix, AUC is said to evaluate the threshold-independent separability of clean and dusty PV panels, as highlighted in the ROC curve in Section 5.
3.9. Implementation Environment
All experiments were performed using Python-based libraries for image processing, machine learning, and deep learning techniques. The classical feature extraction and classification using the Random Forest classifier were implemented using OpenCV, NumPy, and scikit-learn libraries, while the CNN was implemented using the PyTorch library. Due to the lightweight nature of the MobileNetV3-Small architecture used for the CNN, the experiments can be performed efficiently using a CPU-based workstation, with the option to use a GPU for the CNN training process. This implementation of the proposed framework is suitable for deployment in resource-constrained environments.
4. Experimental Setup
This section describes the process of testing the proposed hybrid and ensemble-based intelligent soiling detection framework. The division of data, training of models, steps of the algorithm, and performance metrics will be discussed in this section.
4.1. Dataset Partitioning and Evaluation Protocol
The dataset obtained in Section 3.2 was divided using a stratified method to maintain class balance. In particular, 70% of the images were used for training, 15% for validation, and the remaining 15% for testing. A fixed random seed was used to make the results reproducible.
Statistical reliability protocol: In addition to reporting single-split results, 10 independent repetitions of the stratified 70%/15%/15% train/validation/test partitioning were performed using different random seeds. For each repetition, the RF, MobileNetV3-Small, and OR-ensemble models were trained and evaluated using the same hyperparameters and preprocessing. The research work reports mean ± standard deviation across runs and 95% confidence intervals (CIs) for accuracy, dusty recall, dusty F1-score, and AUC using a t-based interval computed from the per-run metric distribution.
In addition to testing on the same dataset, it is also tested for the generalization performance across datasets by performing batch inference on a separate PV image dataset obtained under different conditions. This protocol enables assessment of model robustness under domain shift, including variations in illumination, camera viewpoint, and soiling characteristics, which are commonly encountered in real-world PV monitoring scenarios.
The distribution of images across the training, validation, and testing subsets is summarized in Table 4.
Table 4.
Distribution of images in the training, validation, and test sets.
4.2. Training Configuration
The CNN branch was fine-tuned using MobileNetV3-Small initialized with ImageNet-pretrained weights. The final classification layer was replaced to output two classes (clean vs. dusty), and the network was fine-tuned end-to-end (no layers were frozen during training). Training used a learning rate of 1 × 10⁻⁴, batch size of 32, the AdamW optimizer with weight decay of 1 × 10⁻⁴, and the cross-entropy loss function. The maximum number of epochs was set to 50, with early stopping applied based on validation accuracy to prevent overfitting (the best-performing checkpoint on the validation set was retained). Data augmentation was applied only to the training split and included random horizontal flipping, small-angle rotations (±5°), and mild colour jittering.
The Random Forest (RF) classifier was implemented using scikit-learn with 400 decision trees (n_estimators = 400). The split criterion was Gini impurity (criterion = “gini”), the maximum depth was set to max_depth = None (unrestricted depth), and the feature selection strategy at each split was max_features = “sqrt” (i.e., a random subset of features is considered at each node, where d is the number of handcrafted features). Class imbalance was handled using class_weight = “balanced”. Class probability estimates were obtained via predict_proba for integration into the ensemble fusion strategy.
All hyperparameters were kept fixed across experiments to ensure consistency and reproducibility. The final configuration used in this study is reported in Table 5.
Table 5.
Final hyperparameters used in the experimental setup.
Given the relatively small dataset size (383 images), several measures were implemented to mitigate potential overfitting risks. First, a lightweight backbone architecture (MobileNetV3-Small) was selected to limit model capacity and reduce the number of trainable parameters. Second, transfer learning was employed by initializing the network with ImageNet-pretrained weights, allowing the model to leverage generalized visual representations. Third, data augmentation techniques—including random horizontal flipping, small-angle rotations, and colour jittering—were applied to increase effective data variability. Additionally, weight decay regularization and early stopping based on validation accuracy were incorporated to prevent excessive fitting to the training data. The number of training epochs was selected conservatively to balance convergence and generalization.
4.3. Algorithmic Implementation
To clearly formalize the experimental procedure, the proposed framework is described through two complementary algorithms. Algorithm 1 describes the training procedure for MobileNetV3-Small CNN while the Algorithm 2 describes the Hybrid Ensemble-Based Soiling detection and cleaning decision frame work.
| Algorithm 1. Training Procedure for MobileNetV3-Small CNN |
| Input: Labelled PV panel image dataset Output: Trained MobileNetV3-Small CNN model
|
| Algorithm 2. Hybrid Ensemble-Based Soiling Detection and Cleaning Decision Framework |
| Input: RGB PV panel image Output: Final panel condition and cleaning decision
|
4.4. Evaluation Metrics and Testing Protocol
The performance of the model was evaluated based on the metrics discussed in Section 3.8, including accuracy, precision, recall, and F1-score, all of which are extracted from the confusion matrix. The performance of the model was evaluated based on the validation data, test data, and unseen data, giving us a comprehensive view of the performance of the model, including its generalization. The precision of the dusty class was of major concern, considering that false negatives could be very detrimental, resulting in unnecessary delays in cleaning, which could cause loss of energy in photovoltaic systems. The metrics were all derived based on the same evaluation process, giving us a fair basis for comparing the performance of the models. For the repeated-run analysis (Table 6), the research work used 10 seeds (100–109). For visualization and representative examples, a fixed seed (42) is used.
Table 6.
Performance across 10 repeated stratified runs (mean ± std; 95% CI).
5. Results and Discussion
This segment provides an in-depth evaluation of the proposed hybrid ensemble-based intelligent PV panel soiling detection framework. It commences with an evaluation of the MobileNetV3-Small CNN’s learning mechanism and continues through quantitative performance evaluation, error evaluation, assembling effects, and statistical evaluation. In this context, it is important to consider the implications for PV panel maintenance, especially in terms of detecting dusty panels.
5.1. Learning Behaviour and Convergence Analysis
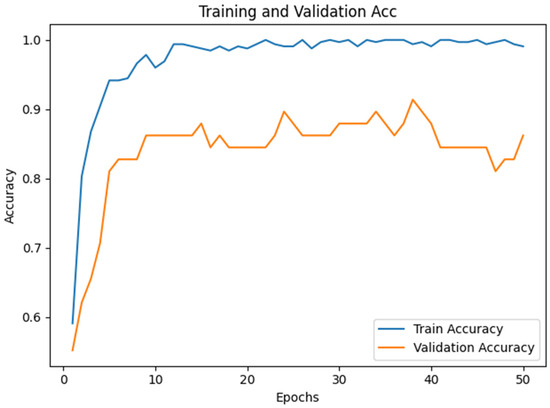
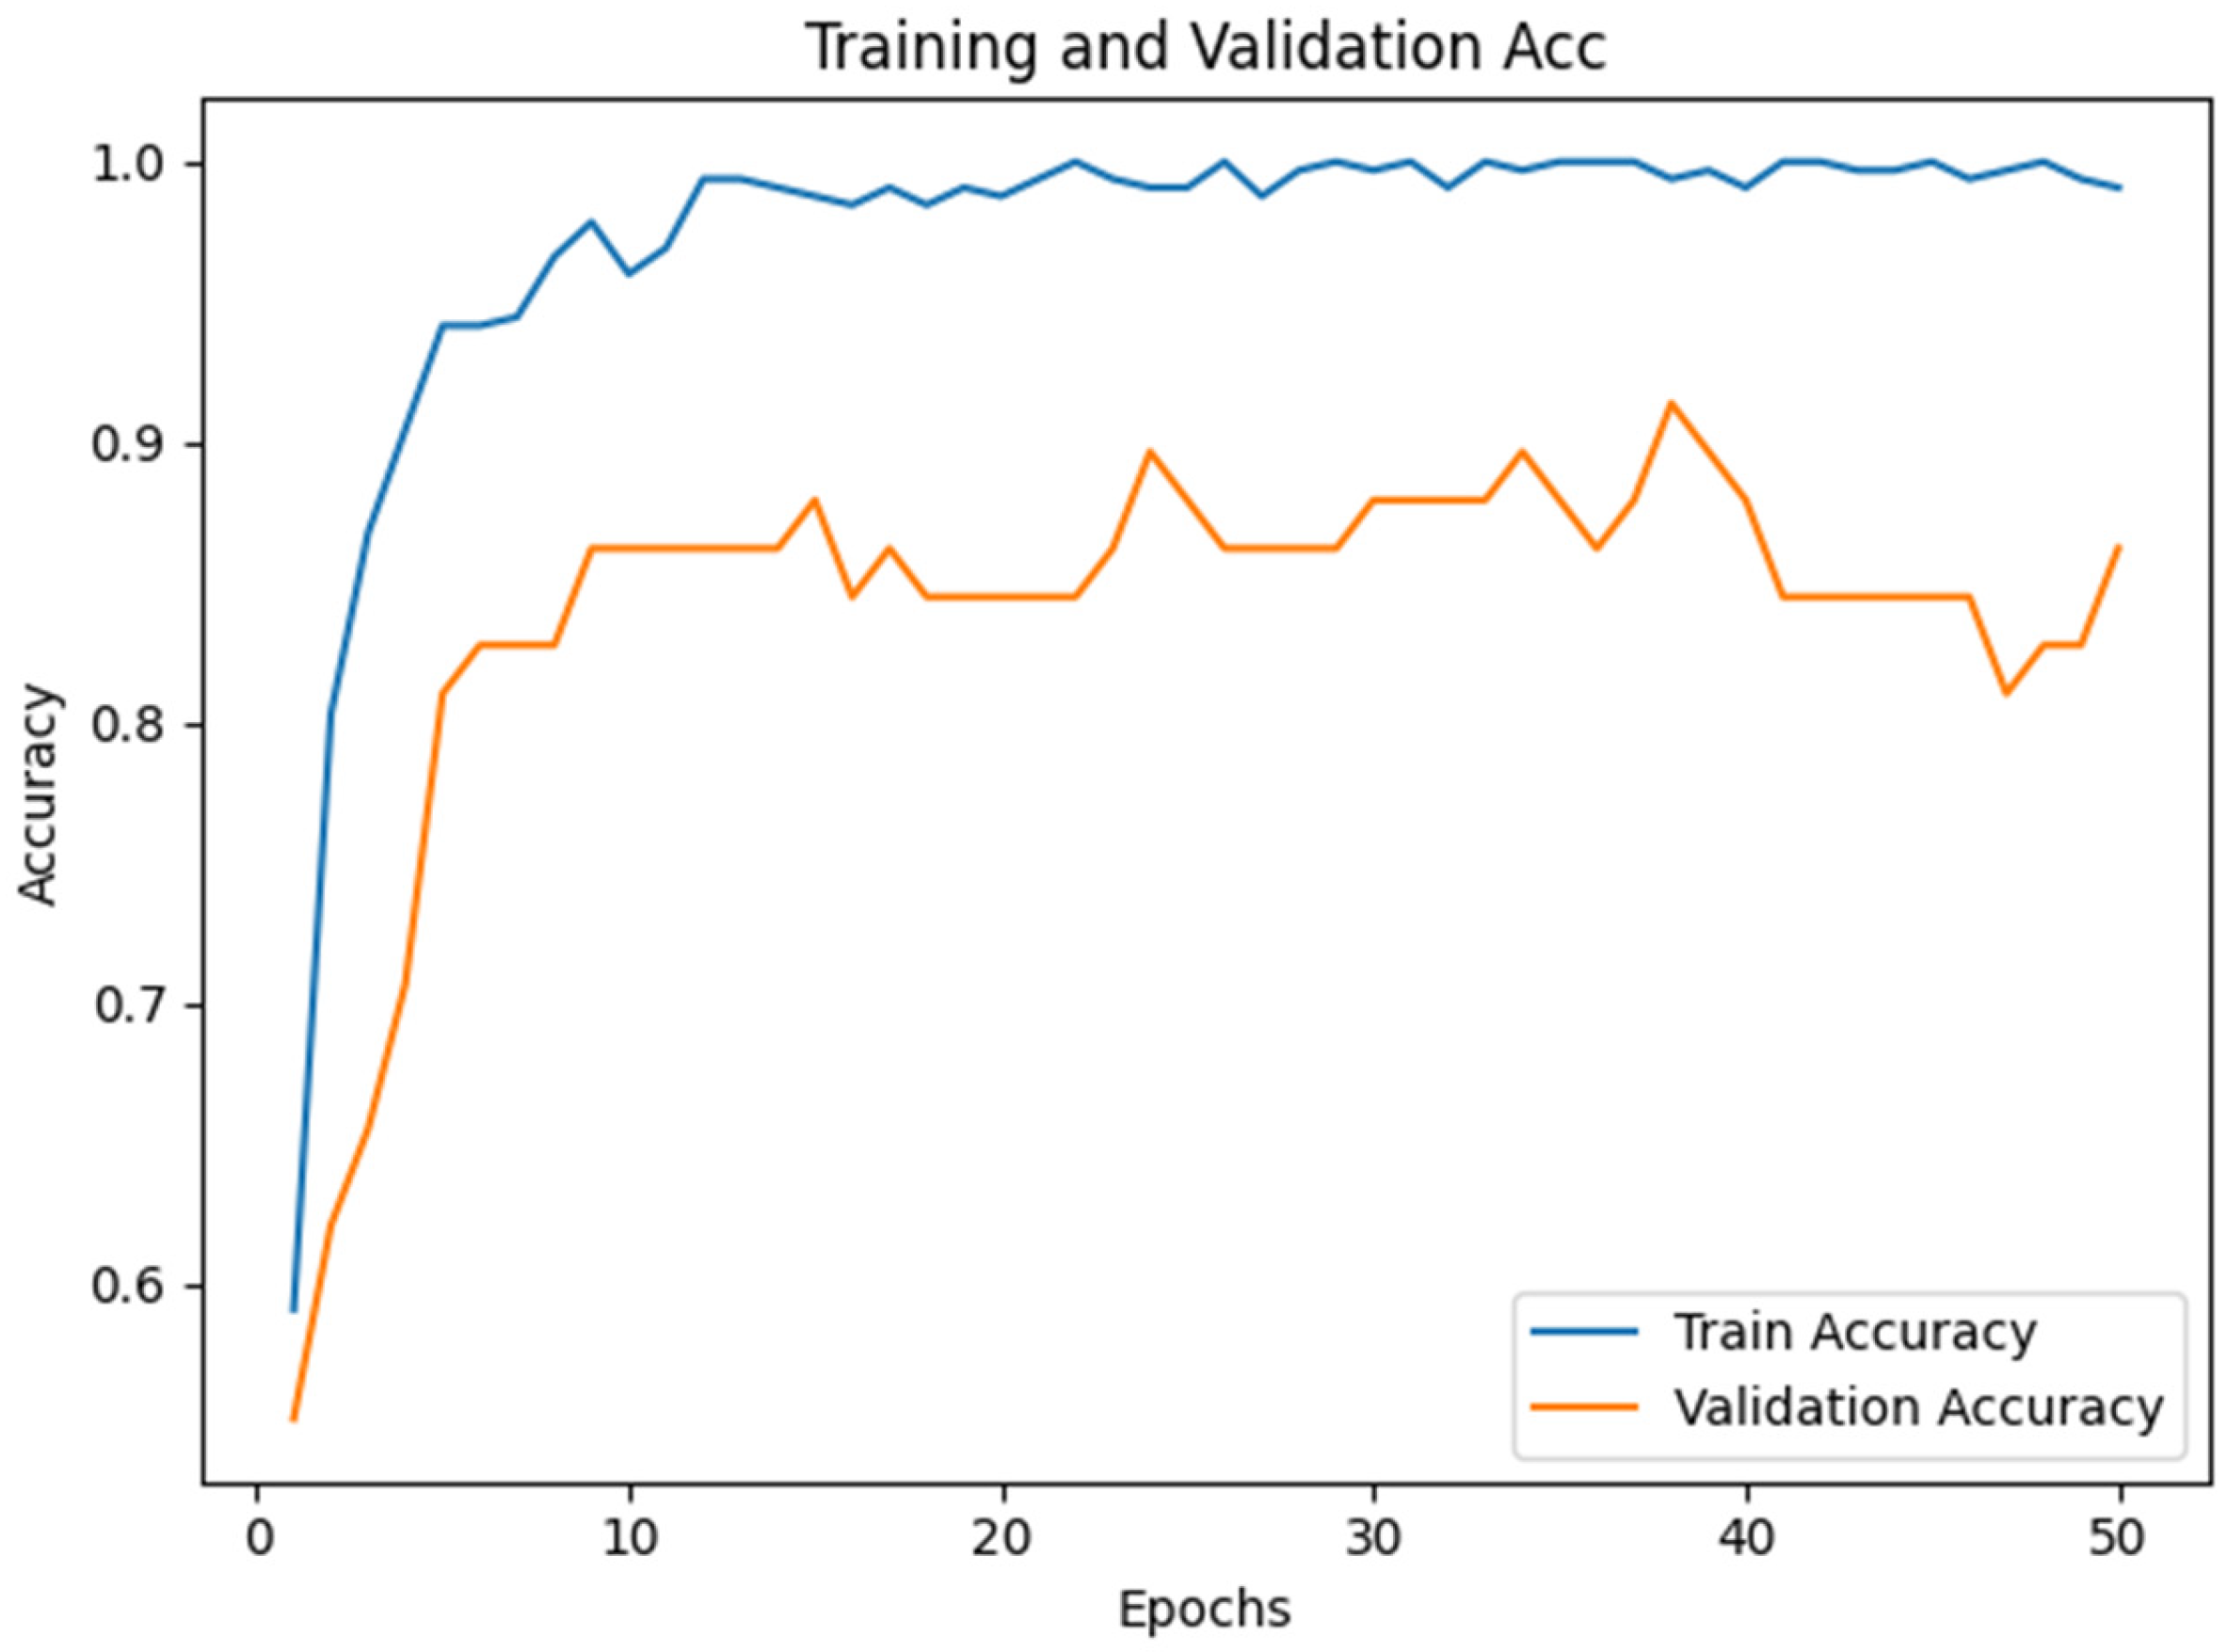
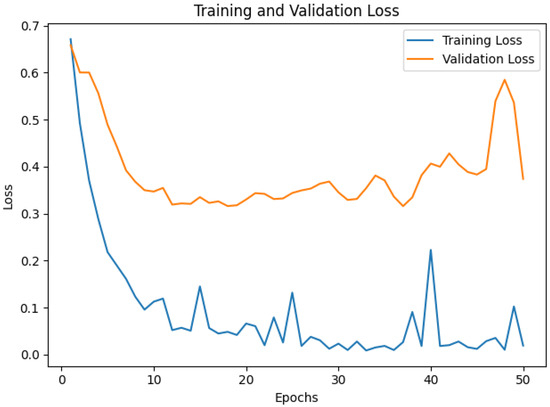
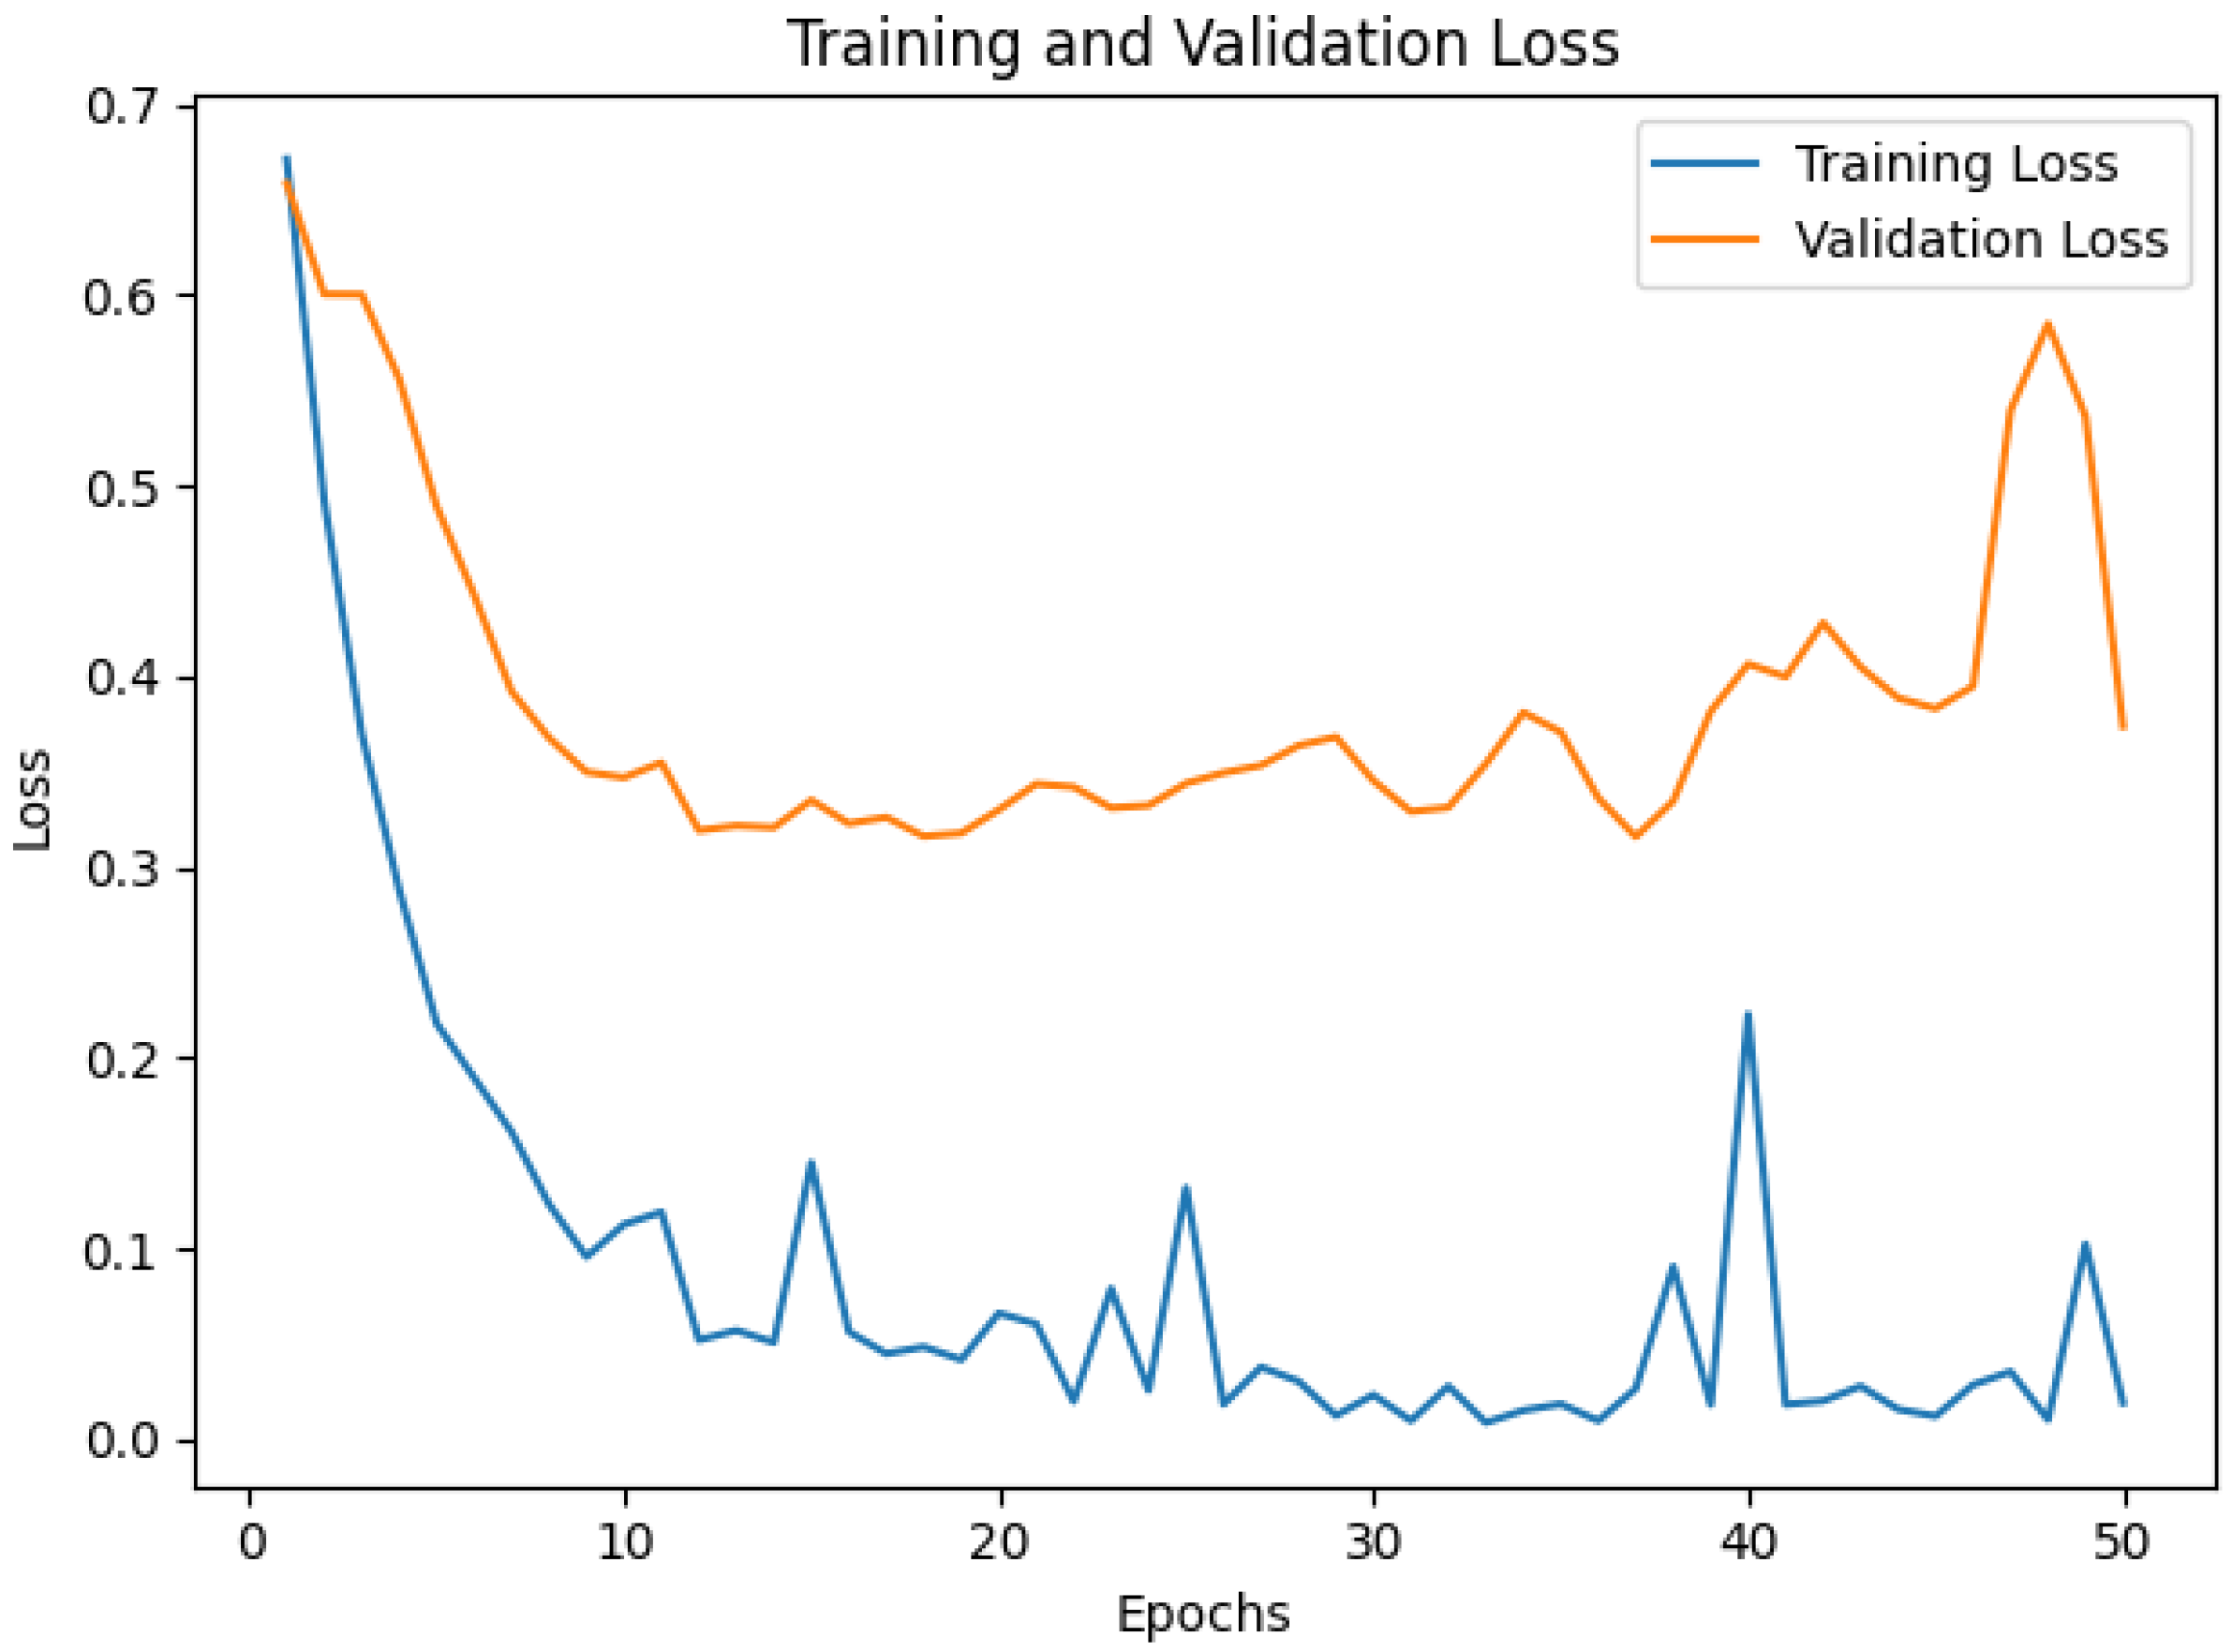
The training process of the MobileNetV3-Small CNN was evaluated by observing the training and validation accuracy and loss at each epoch, as presented in Figure 6 and Figure 7. Generally, the CNN model has a stable training process with continuous improvement in validation performance as training progresses.
Figure 6.
Training and validation accuracy of the proposed MobileNetV3-Small CNN.
Figure 7.
Training and validation loss curves of the proposed MobileNetV3-Small CNN.
During training, the validation accuracy increases rapidly, indicating effective adaptation of the pretrained backbone to PV soiling characteristics. Moving forward, it can be seen that the training and validation accuracy curves stabilize at a range, with minor fluctuations in the validation curve. The fluctuations are due to the messy nature of the limited data, the varying lighting, angles, and textures of the PV panels.
Meanwhile, the training loss decreases rapidly while the validation loss gradually plateaus without any extreme behaviour. The minor gap between the two curves does not indicate any extreme overfitting. The overall observations suggest that the model’s performance with the MobileNetV3-Small backbone is favourable for effective feature learning, optimization, and generalization, which is beneficial for the model fusion process. Although the dataset size is moderate for deep learning applications, the observed training–validation curves demonstrate stable convergence without severe divergence between training and validation accuracy. The relatively small gap between training and validation metrics indicates that overfitting is effectively controlled. Furthermore, the ensemble framework improves robustness by combining complementary representations, thereby reducing sensitivity to limited sample variability. These findings suggest that the lightweight transfer-learning approach is suitable for practical PV monitoring scenarios with moderate dataset sizes.
5.2. Core Performance Metrics Obtained
To provide a quantitative assessment of the proposed framework, the research work reports standard performance metrics derived from the confusion matrix and predicted probabilities (accuracy, dusty-class recall, dusty-class F1-score, and AUC). To address variability and strengthen comparative conclusions, metrics are reported over 10 repeated stratified 70%/15%/15% runs as mean ± standard deviation with 95% confidence intervals. The results for the Random Forest (handcrafted features), MobileNetV3-Small CNN, and the proposed OR-based ensemble fusion framework are summarized in Table 6.
Table 6 shows that the proposed OR-ensemble achieves the highest dusty-panel recall (0.9896 ± 0.0104, 95% CI: 0.9822–0.9970), which aligns with the PV maintenance objective of minimizing missed soiling events (false negatives). In addition, the OR-ensemble attains the highest mean accuracy (0.9663 ± 0.0177) and highest AUC (0.9920 ± 0.0102) among the compared methods. These results indicate that combining the complementary RF and CNN detectors using the conservative OR fusion rule improves the reliability of dusty-panel identification, while maintaining strong overall discriminative performance. This behaviour is consistent with risk-aware operation and maintenance, where reducing false negatives is typically prioritized due to the energy-loss cost of undetected soiling. These findings directly support the risk-aware hypothesis stated in the Introduction: the OR-based fusion improves maintenance-relevant performance by reducing missed soiling events through higher dusty-panel recall. Table 6 reports performance on the seen (in-distribution) dataset using repeated stratified runs; cross-dataset results under domain shift on an independent unseen dataset are reported separately in Table 7.
Table 7.
Cross-dataset performance on the unseen dataset (domain-shift evaluation).
5.3. Confusion Matrix of the Proposed OR-Based Ensemble Model
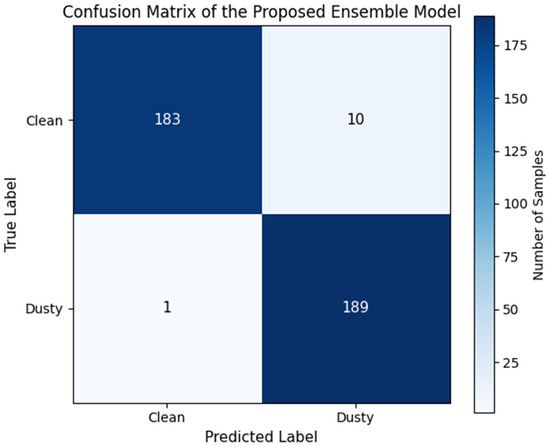
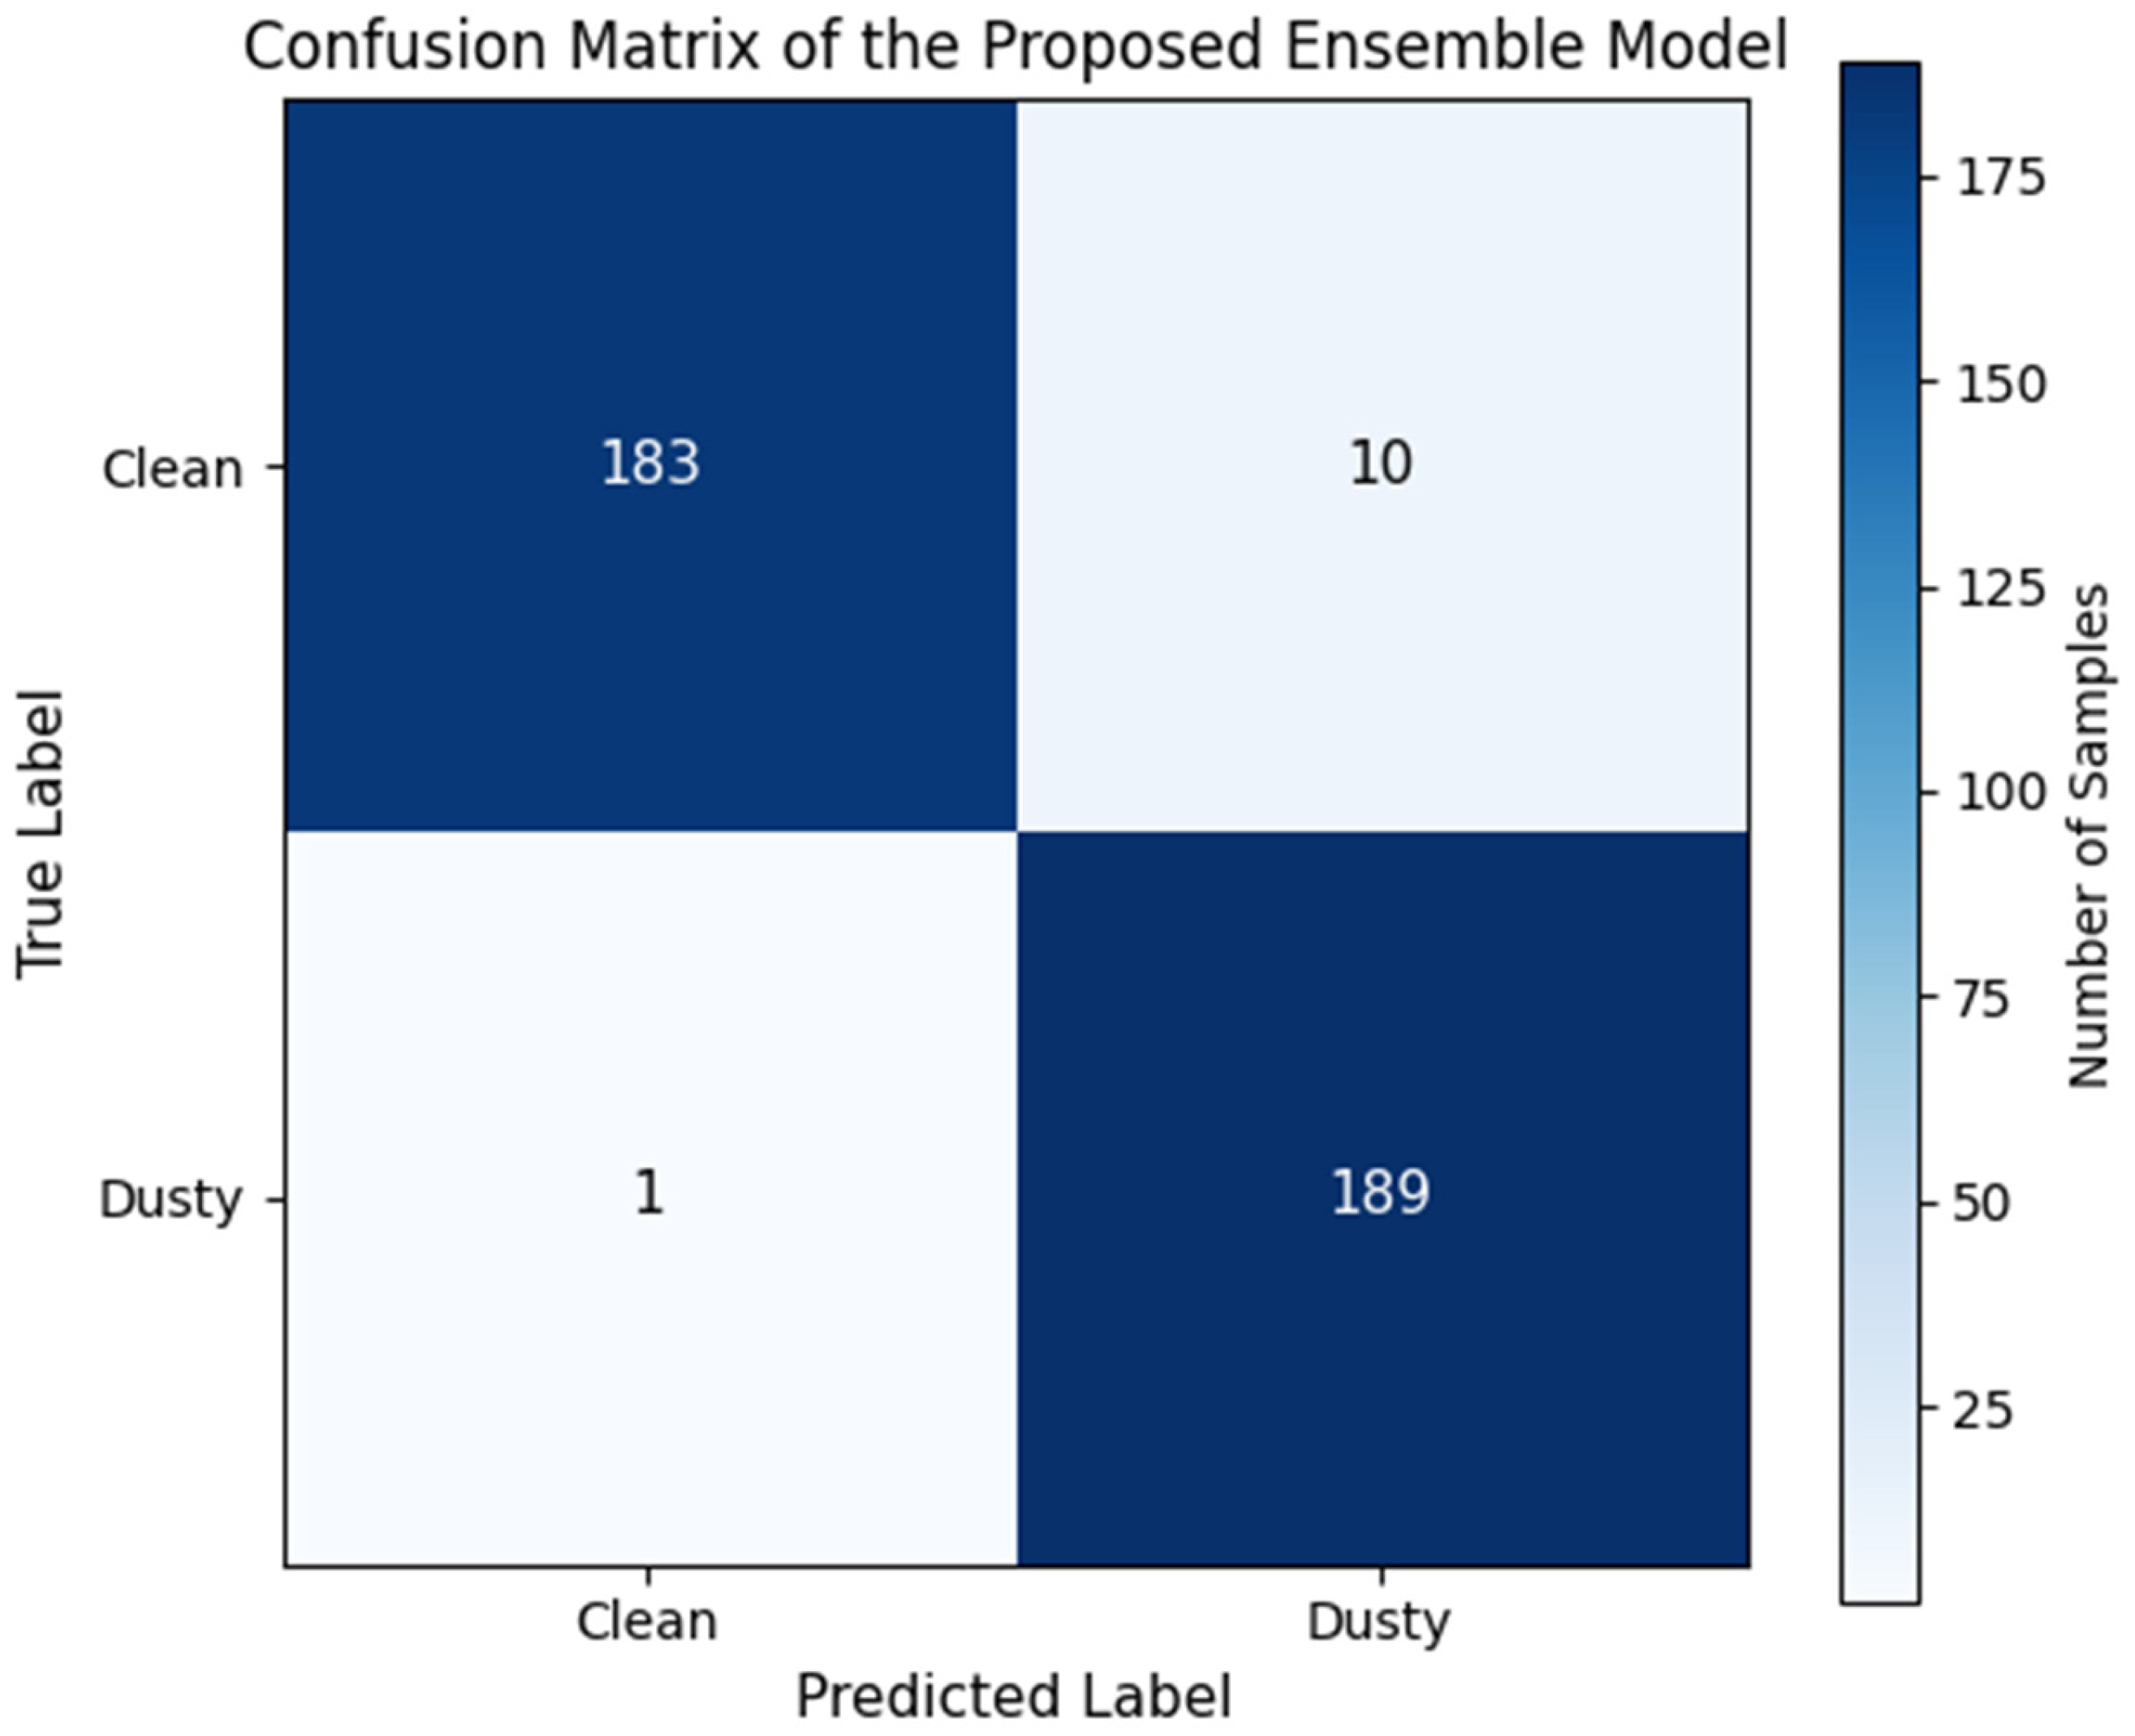
The confusion matrix for the proposed OR-based ensemble model is shown in Figure 8 as an illustrative evaluation on the full seen dataset (N = 383). The primary quantitative results are reported in Table 6, which summarizes performance over 10 repeated stratified splits.
Figure 8.
Confusion matrix of the proposed OR-based ensemble model on the full seen dataset (N = 383) (illustrative visualization). Primary performance statistics over repeated splits are reported in Table 6.
In this illustrative evaluation, only a small number of misclassifications occur. False negatives (dusty predicted as clean) are more critical in PV maintenance because they may delay cleaning and lead to cumulative energy losses, whereas false positives primarily trigger earlier inspection or cleaning. The conservative OR decision rule labels a panel as dusty if either the Random Forest or the MobileNetV3-Small CNN predicts soiling, thereby reducing the risk of false negatives and supporting deployment-oriented PV cleaning decision support.
5.4. Ensemble Impact on Decision Reliability
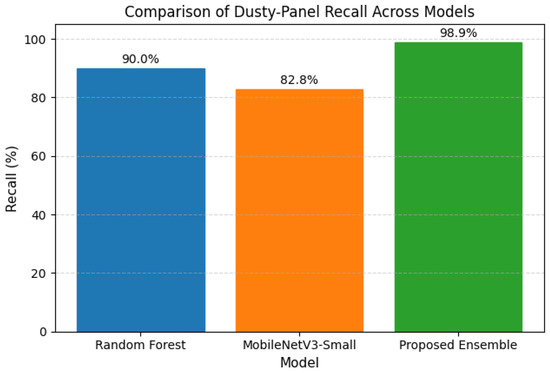
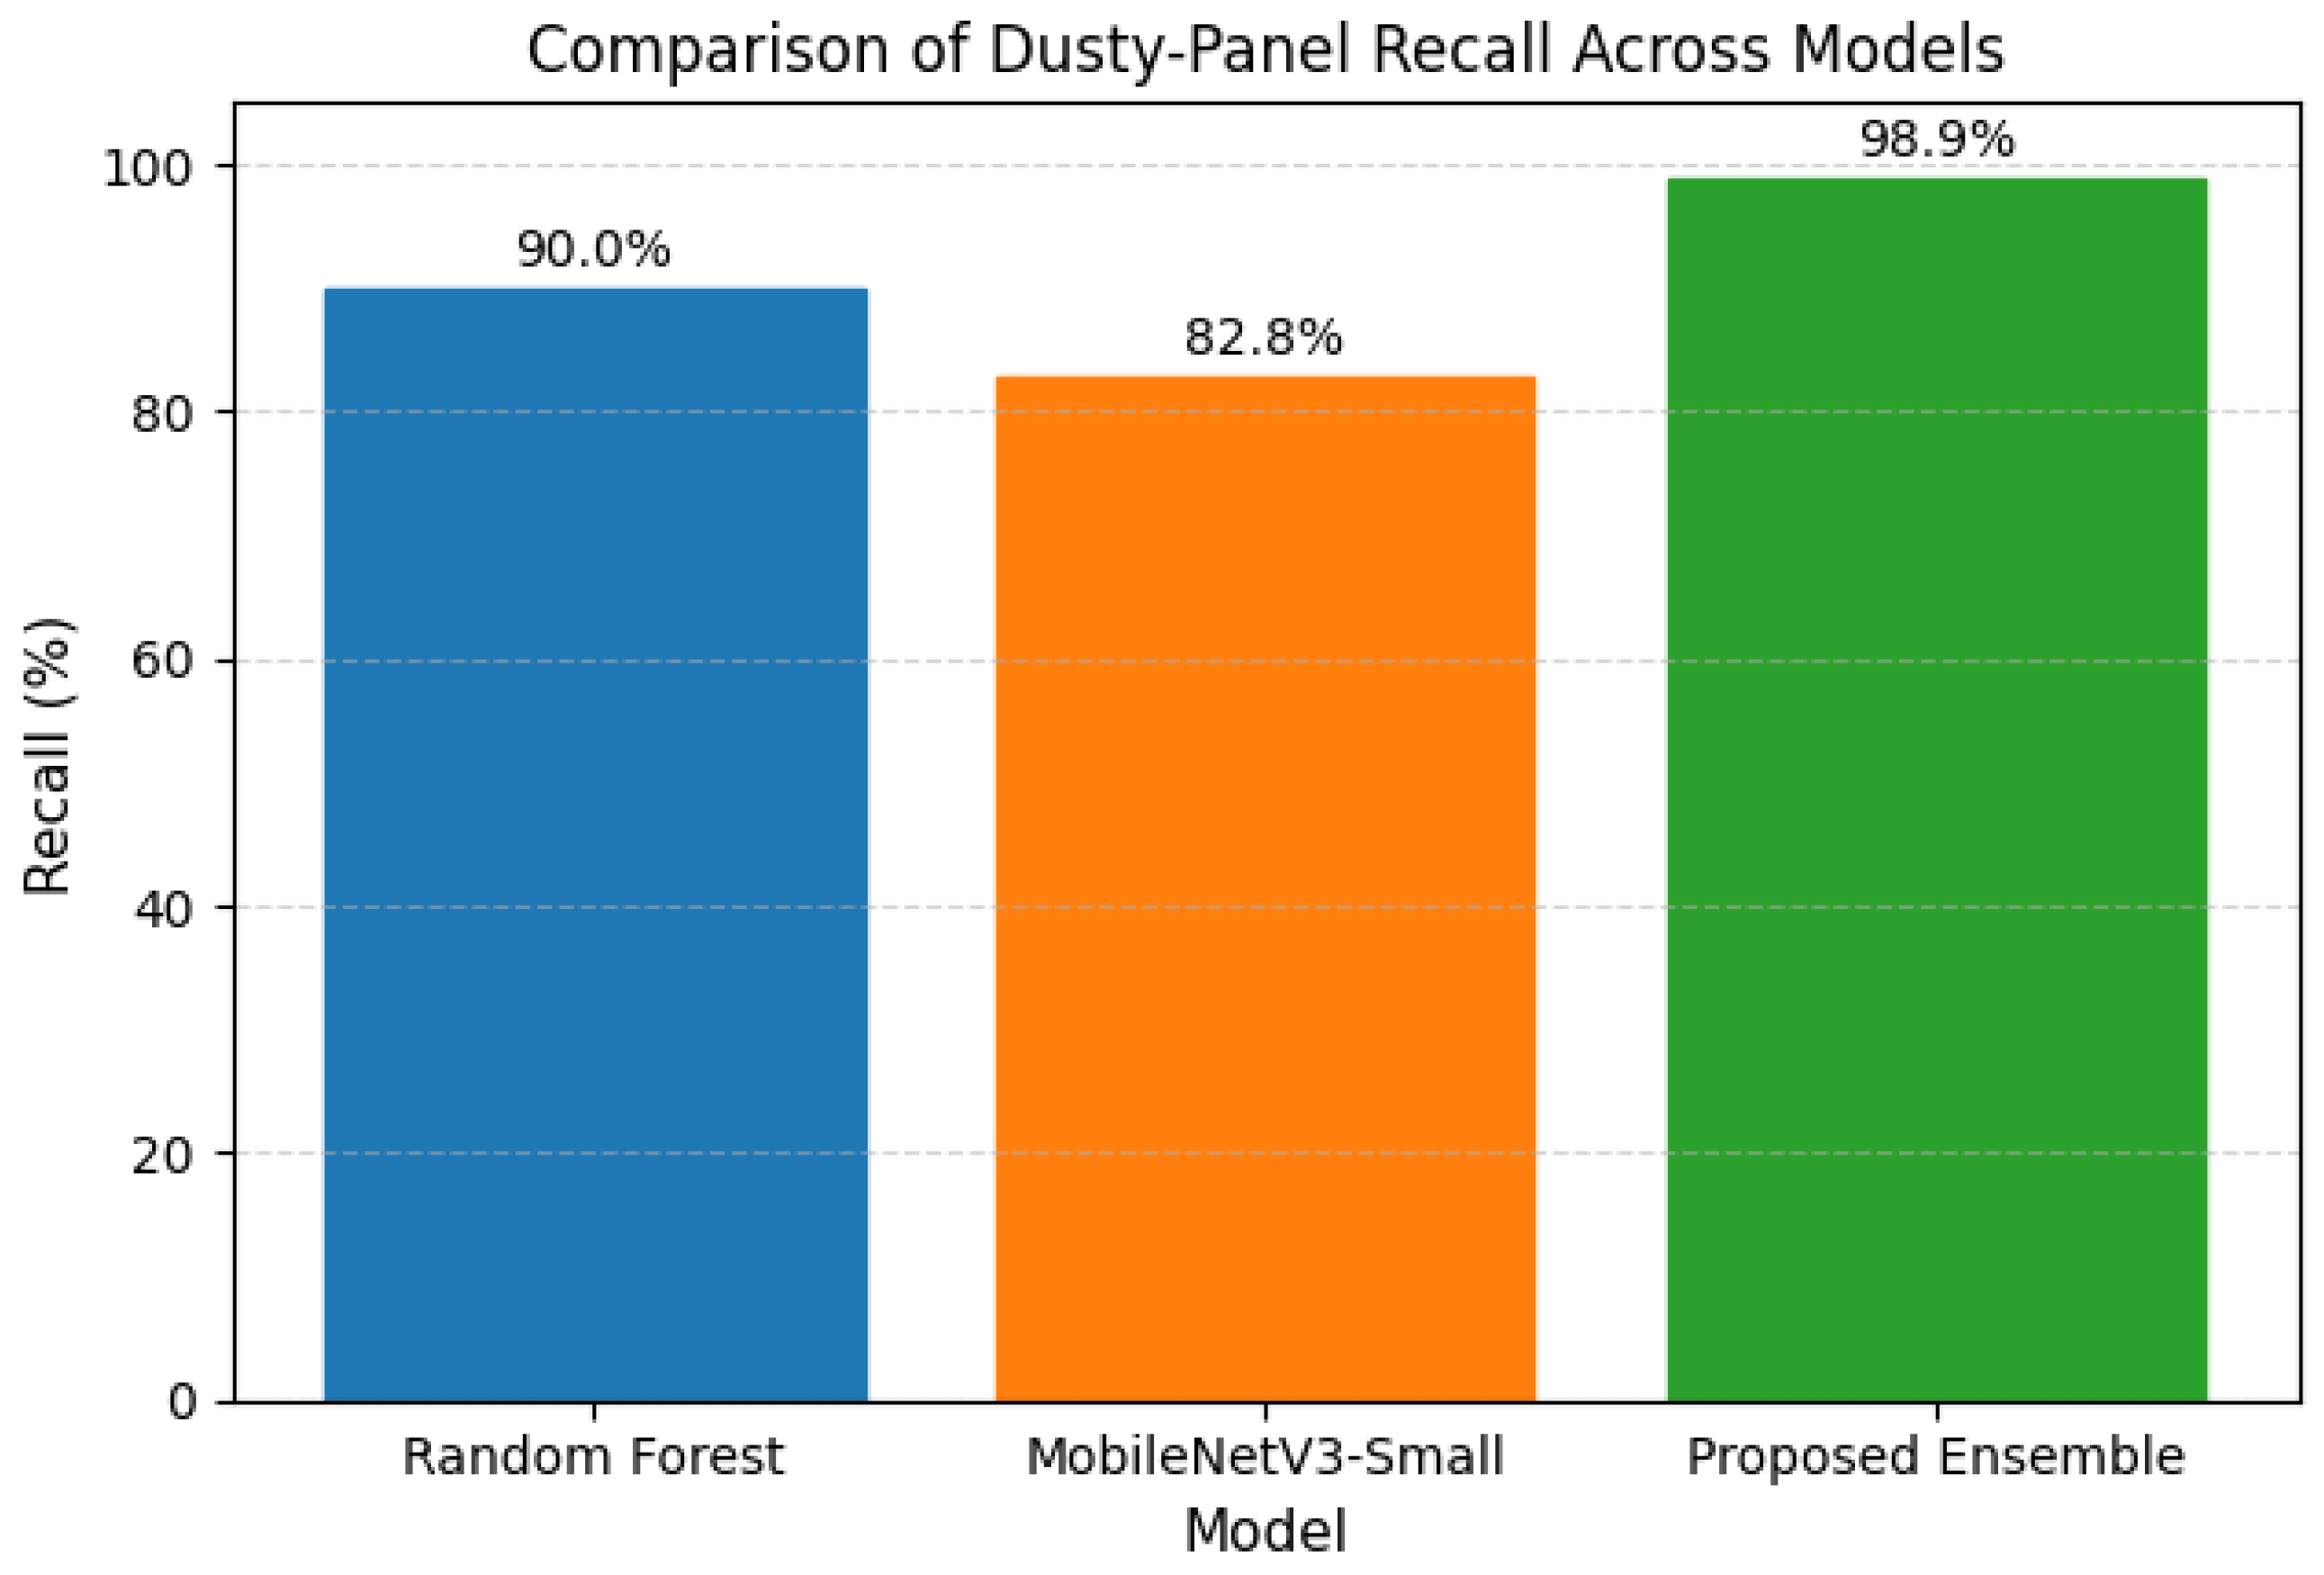
To illustrate the impact of the proposed ensemble method on the reliability of soiling detection, Figure 9 provides a visual representation of the dusty-panel recall of the models under consideration. Recall has been emphasized in this figure because this parameter has a direct relationship with the capability of the model to correctly identify soiled photovoltaic panels, thus avoiding unnecessary cleaning operations and the associated energy losses.
Figure 9.
Comparison of dusty-panel recall across the Random Forest classifier, MobileNetV3-Small CNN, and the proposed OR-based ensemble framework.
As illustrated in Figure 9, the standalone Random Forest classifier peaks at a recall of 90%. This is because it uses physically interpretable handcrafted features that are quite sensitive to texture and sharpness changes. The MobileNetV3-Small CNN classifier follows with a slightly lower recall of 82.8%, likely because it uses learned features that are quite sensitive to lighting changes and contamination patterns. The OR-based ensemble framework, however, aims to achieve a much higher dusty-panel recall of 98.9%, demonstrating its effectiveness in preventing false negatives. By conservatively classifying a panel as dusty if either the CNN or the Random Forest classifier detects soiling, the ensemble framework effectively leverages the complementary strengths of both classifiers. This side-by-side comparison demonstrates the benefits of the ensemble approach to improving the reliability of soiling detection over a single classifier.
Overall, the results demonstrate that the proposed ensemble framework provides a more robust and risk-conscious solution to PV panel soiling detection, particularly in real-world use cases where false negatives can significantly impair performance.
5.5. Receiver Operating Characteristic (ROC) Analysis
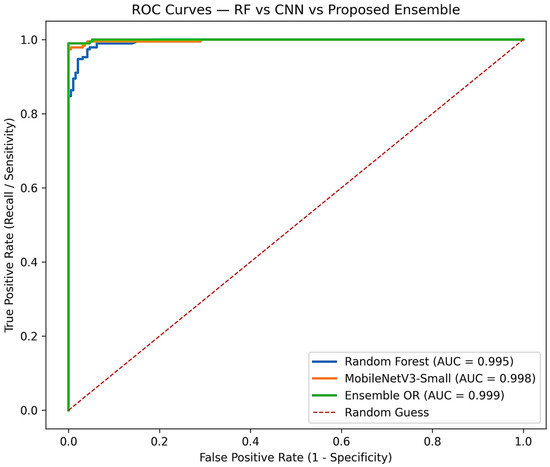
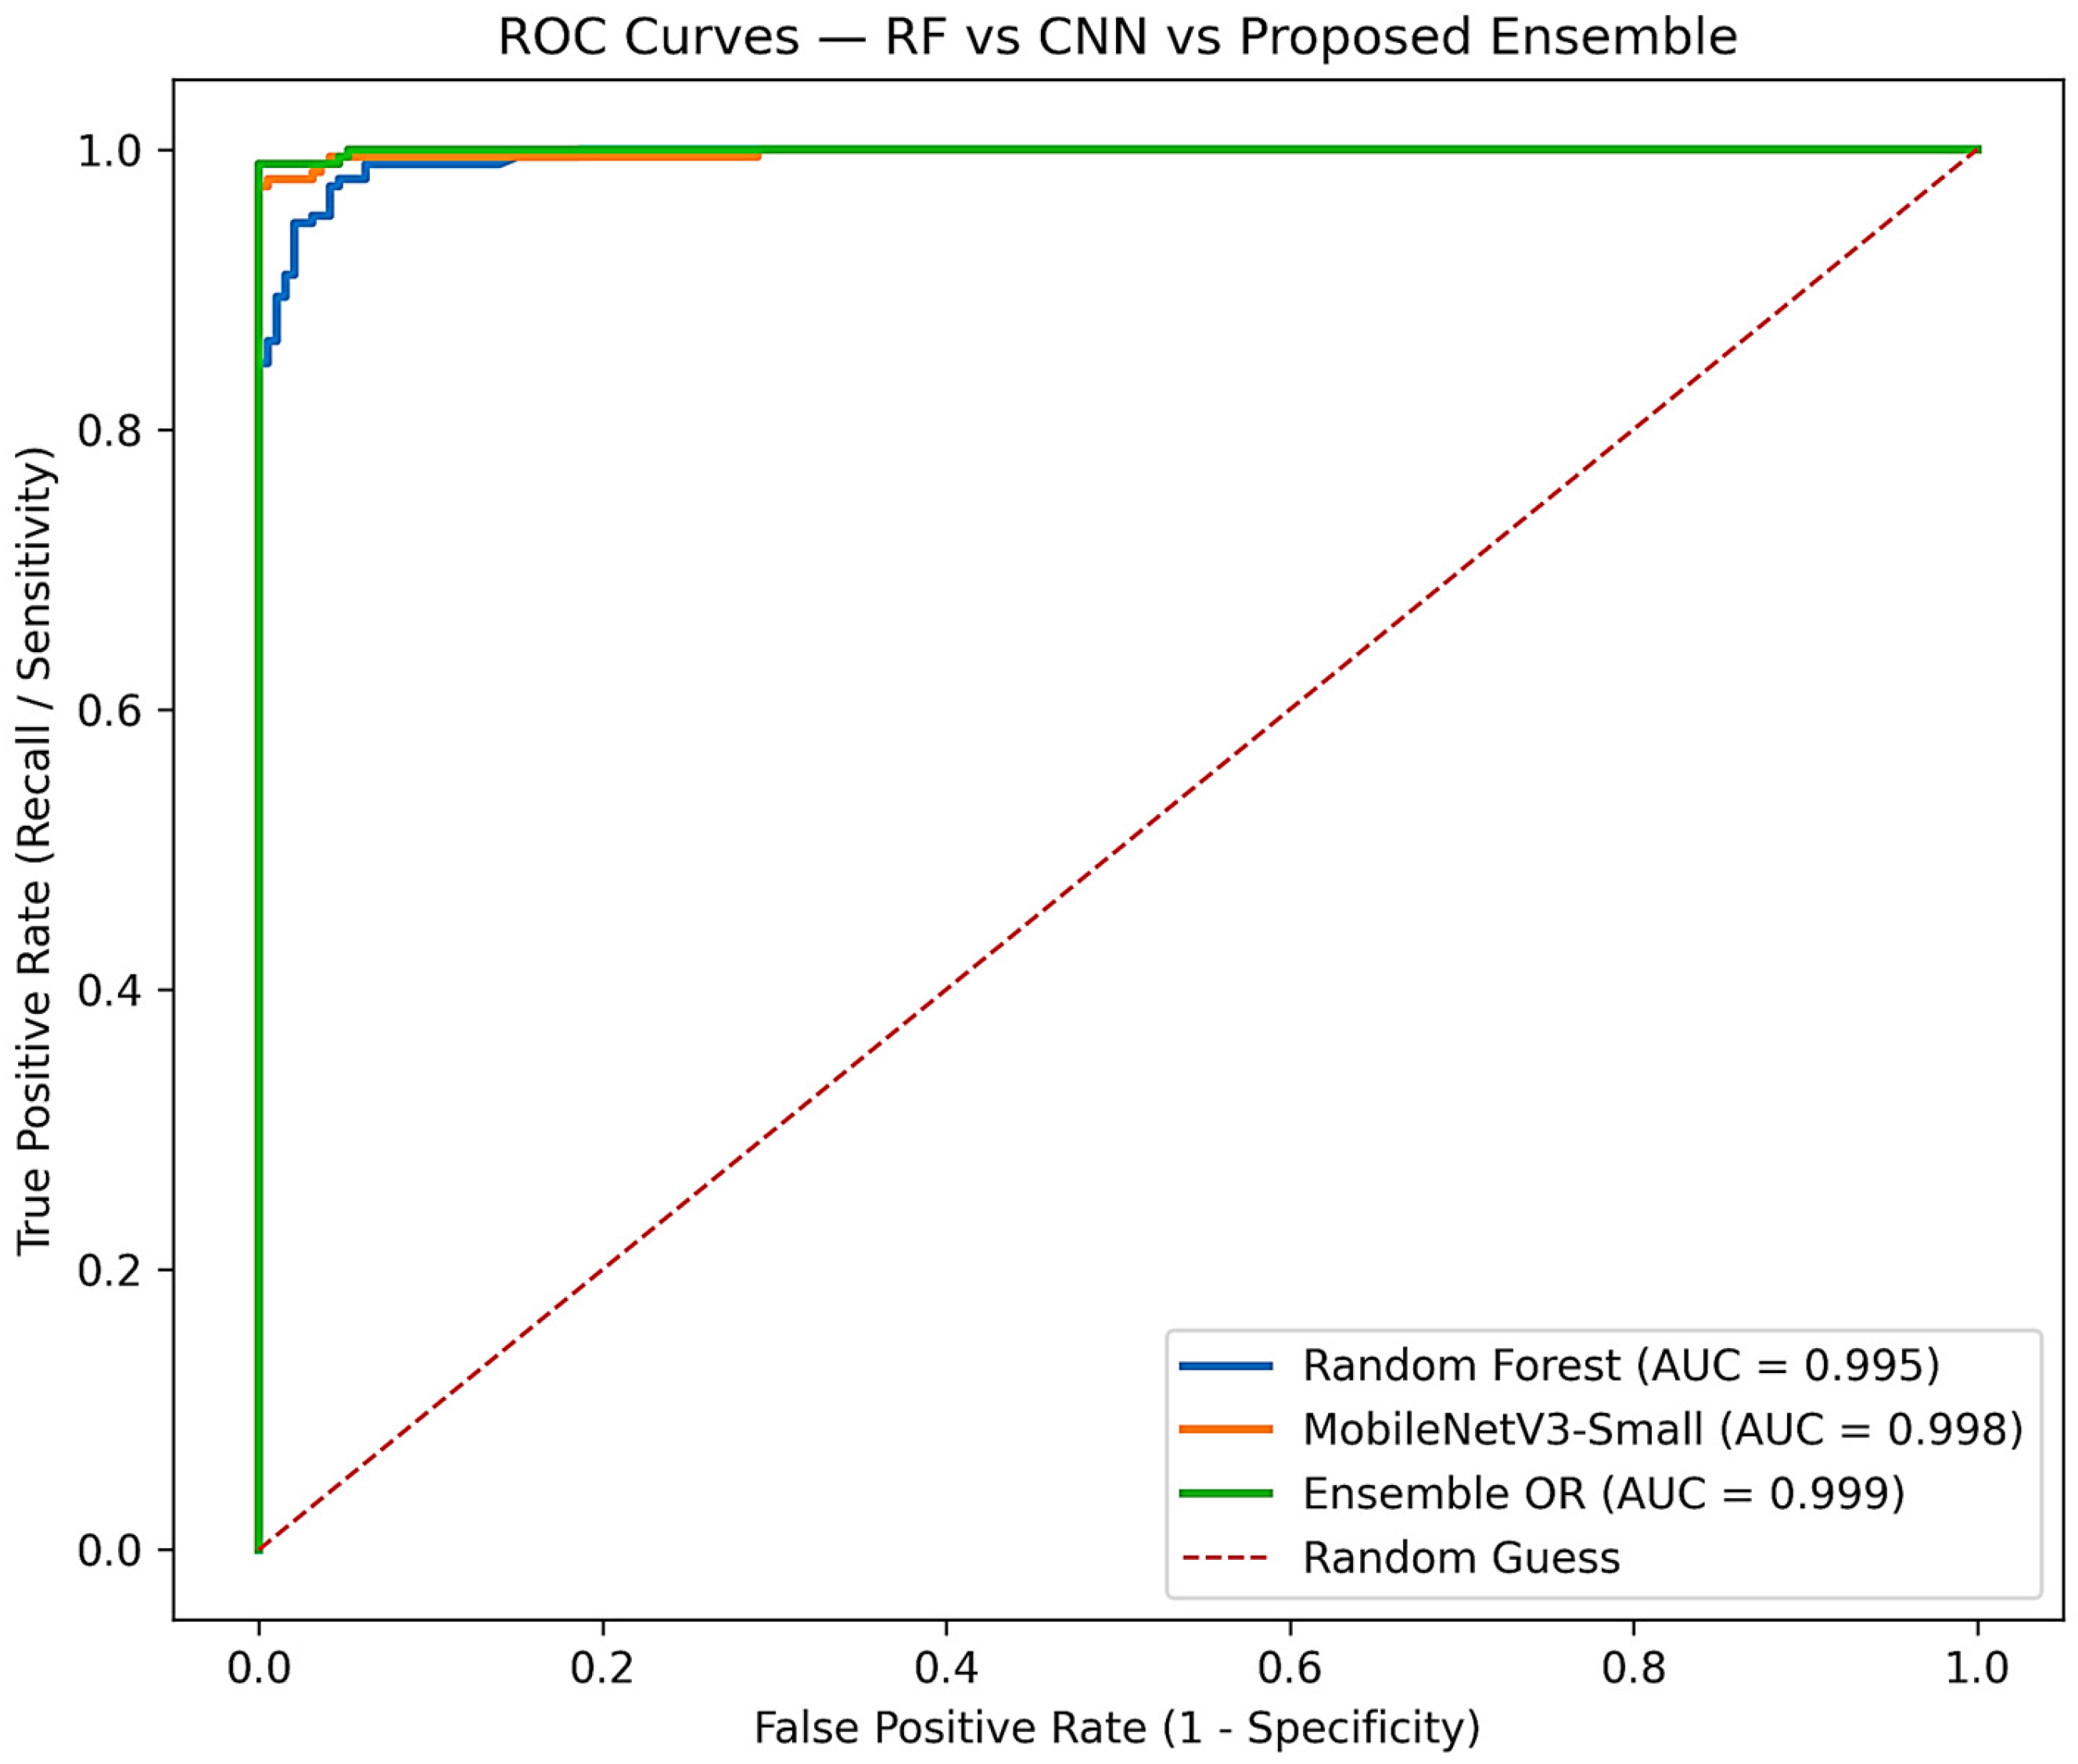
To further evaluate the discriminative capability of the proposed framework under varying decision thresholds, ROC analysis was conducted for the standalone Random Forest classifier, the MobileNetV3-Small CNN, and the proposed OR-based ensemble model. The ROC curve illustrates the trade-off between the true positive rate (recall/sensitivity) and the false positive rate (1 − specificity) across different classification thresholds, providing a threshold-independent assessment of model performance. In this study, AUC is computed on the held-out evaluation set using the dusty-class probability score (dusty treated as the positive class) to ensure consistent and reproducible reporting.
Figure 10 shows ROC curves for a representative split of the seen dataset (seed = 42) to visualize the operating characteristics of the RF, MobileNetV3-Small CNN, and the proposed OR-ensemble. Because ROC/AUC values can vary across data partitions—particularly for modest dataset sizes—the research work reports the statistical reliability of AUC in Table 6, which summarizes the mean ± standard deviation and 95% confidence intervals over 10 repeated stratified runs. Accordingly, Figure 10 serves as a qualitative visualization of classifier behaviour, while Table 6 provides the primary aggregated quantitative AUC results.
Figure 10.
ROC curves for a representative split (seed = 42) comparing RF, MobileNetV3-Small CNN, and the proposed OR-ensemble. Aggregated AUC statistics across 10 repeated runs are reported in Table 6.
Overall, the ROC analysis indicates that the models maintain meaningful discriminative capability across thresholds, consistent with the AUC values reported in Table 6. While the CNN and the OR-ensemble show comparable threshold-independent discrimination, the OR-ensemble is specifically designed to prioritize dusty-panel recall and reduce missed soiling events, which is critical for PV maintenance decision support.
5.6. PV-Oriented Operational Implications
Accurate detection of dusty panels is vital to PV system operation and maintenance. Among the reported metrics, dusty-class recall most directly reflects the system’s ability to identify panels that require cleaning. As shown in Table 6, the proposed OR-ensemble achieves the highest dusty recall on average across repeated runs, indicating improved sensitivity to soiling under variations in illumination, partial soiling, and reflections.
5.7. Statistical Significance Analysis
To address variability and strengthen comparative conclusions, the research work evaluated all models over 10 repeated stratified runs (70%/15%/15%) using different random seeds. For each run, the Random Forest, MobileNetV3-Small CNN, and the proposed OR-ensemble were trained and evaluated under the same protocol. Accordingly, Table 6 reports the performance distribution as mean ± standard deviation together with 95% confidence intervals computed from the per-run metric values. The results show that the proposed OR-ensemble consistently improves dusty-panel recall across repeated runs, supporting the reliability of the risk-aware fusion strategy.
5.8. Domain-Shift Evaluation on an Unseen Dataset (Cross-Dataset Testing)
To examine robustness under domain shift, the research work performed cross-dataset testing using an independent unseen PV soiling dataset that was not used during training. This dataset contains 1493 clean and 1069 dusty images (total 2562) and exhibits different acquisition conditions (e.g., illumination, camera viewpoint/orientation, background, and soiling appearance), which alter the data distribution relative to the training dataset. The research work evaluated the RF baseline, the MobileNetV3-Small CNN baseline, and the proposed OR-ensemble on this unseen dataset using the same inference pipeline.
As shown in Table 7, the proposed OR-ensemble achieves the strongest performance under domain shift, reaching 85.93% accuracy, 0.90 dusty recall, and a 0.87 dusty-class F1-score on the unseen dataset. This directly supports the conservative OR-based design decision: compared with the standalone CNN (dusty recall = 0.76) and RF (dusty recall = 0.69), OR fusion substantially reduces missed soiling events; for example, at dusty recall ≈ 0.90 on 1069 dusty samples, the expected number of false negatives is approximately 107. This indicates improved cross-dataset generalization compared with either standalone model and demonstrates enhanced capability to detect dusty panels—an essential requirement for PV operation and maintenance, where missed soiling events (false negatives) can lead to cumulative energy losses. Overall, these results clarify that “robustness under domain shift” in this study refers to maintaining reliable dusty-panel detection when acquisition conditions differ from those observed during training.
5.9. Computational Complexity and Edge Inference Benchmarking
To validate suitability for resource-constrained deployment, the research works benchmarked inference latency per image and model size on a standard CPU environment (PyTorch 2.9.1 + cpu, Python 3.13.7). The research work reports median and 95th-percentile (p95) latency over repeated runs (with warm-up) for the Random Forest (RF) pipeline (preprocessing + feature extraction + RF inference), the MobileNetV3-Small CNN, and the complete OR-ensemble (RF + CNN + fusion). Results are summarized in Table 8. The OR-ensemble latency reflects the cumulative cost of both branches and the fusion step, while remaining within practical limits for near real-time PV monitoring and decision support.
Table 8.
CPU inference-time and model-size benchmarking (single-image inference).
6. Conclusions
In this study, a hybrid intelligent decision framework for risk-aware photovoltaic (PV) panel soiling detection and cleaning support using an ensemble approach has been proposed. The framework combines physically meaningful handcrafted features classified by a Random Forest (RF) model with high-level representations learned by a lightweight MobileNetV3-Small CNN. A conservative OR-based fusion rule is employed to improve the reliability of dusty-panel detection and to reduce high-risk false negative cases. To strengthen the reliability of the reported results, performance was evaluated over 10 repeated stratified 70%/15%/15% runs, and metrics were reported as mean ± standard deviation with 95% confidence intervals. Across these repeated runs, the proposed OR-ensemble achieved 0.9663 ± 0.0177 accuracy (95% CI: 0.9537–0.9790), 0.9896 ± 0.0104 dusty-panel recall (95% CI: 0.9822–0.9970), 0.9592 ± 0.0295 dusty-class F1-score (95% CI: 0.9381–0.9803), and 0.9920 ± 0.0102 AUC (95% CI: 0.9847–0.9993). These results demonstrate that the proposed fusion strategy consistently prioritizes the detection of dusty panels—an essential requirement for PV operation and maintenance—while maintaining strong overall discriminative performance.
Furthermore, the probability-driven Soiling Index (SI) transforms the detection outputs into actionable cleaning recommendations, making the framework suitable for deployment-oriented PV cleaning management. Overall, this work enhances image-based PV soiling detection by integrating risk awareness and decision support, providing a practical and scalable approach for intelligent PV panel cleaning management.
Author Contributions
Conceptualization and methodology were performed by A.W., B.M.K., H.A., S.K. and A.M.A. Investigation was performed by A.W., B.M.K. and H.A. Formal analysis, data curation, resources, and software development were performed by A.W., B.M.K. and H.A. Validation was performed by A.W., B.M.K., H.A., S.K., O.H.A. and A.M.A. Visualization was performed by A.W. and H.A. Funding acquisition and project administration were performed by H.A. and A.M.A. Writing—original draft was performed by A.W., B.M.K. and H.A. Writing—review and editing was performed by all authors (A.W., B.M.K., H.A., S.K., A.M.A. and O.H.A.). All authors have read and agreed to the published version of the manuscript.
Funding
This article is derived from a research grant funded by the Research, Development, and Innovation Authority (RDIA)—Kingdom of Saudi Arabia—with grant number (13385-Tabuk-2023-UT-R-3-1-SE).
Data Availability Statement
The original contributions presented in this study are included in the article. Further inquiries can be directed to the corresponding author.
Acknowledgments
The authors extend their appreciation to the Research, Development, and Innovation Authority (RDIA), Saudi Arabia, for funding this work through grant number (13385-Tabuk-2023-UT-R-3-1-SE).
Conflicts of Interest
The authors declare no conflicts of interest.
Abbreviations
The following abbreviations are used in this manuscript:
| PV | Photo Voltaic |
| CNN | Convolution neural network |
| SI | Soiling Index |
| UAVs | Unmanned Air vehicles |
| SLI | Soiling Loss Index |
| LBP | Local Binary Pattern |
| RMS | Root Mean Square |
| SE | Squeeze-and-Excitation |
| TP | True Positive |
| FN | False Negative |
| TN | True Negative |
| FP | False Positive |
| ROC | Receiver Operating Characteristic |
| AUC | Area Under the ROC Curve |
References
- Qi, J.; Dong, Q.; Song, Y.; Zhao, X.; Shi, L. Combining Dust Scaling Behaviors of PV Panels and Water Cleaning Methods. Renew. Sustain. Energy Rev. 2025, 212, 115394. [Google Scholar] [CrossRef] [Scilit]
- Onim, M.S.H.; Sakif, Z.M.M.; Ahnaf, A.; Kabir, A.; Azad, A.K.; Oo, A.M.T.; Afreen, R.; Hridy, S.T.; Hossain, M.; Jabid, T.; et al. SolNet: A Convolutional Neural Network for Detecting Dust on Solar Panels. Energies 2023, 16, 155. [Google Scholar] [CrossRef] [Scilit]
- Hussain, A.; Batra, A.; Pachauri, R. An Experimental Study on Effect of Dust on Power Loss in Solar Photovoltaic Module. Renew. Wind Water Sol. 2017, 4, 9. [Google Scholar] [CrossRef] [Scilit]
- Adinoyi, M.J.; Said, S.A.M. Effect of Dust Accumulation on the Power Outputs of Solar Photovoltaic Modules. Renew. Energy 2013, 60, 633–636. [Google Scholar] [CrossRef] [Scilit]
- Paudyal, B.R.; Shakya, S.R. Dust Accumulation Effects on Efficiency of Solar PV Modules for off Grid Purpose: A Case Study of Kathmandu. Sol. Energy 2016, 135, 103–110. [Google Scholar] [CrossRef] [Scilit]
- Vaishak, S.; Bhale, P.V. Effect of Dust Deposition on Performance Characteristics of a Refrigerant Based Photovoltaic/Thermal System. Sustain. Energy Technol. Assess. 2019, 36, 100548. [Google Scholar] [CrossRef] [Scilit]
- Mekhilef, S.; Saidur, R.; Kamalisarvestani, M. Effect of Dust, Humidity and Air Velocity on Efficiency of Photovoltaic Cells. Renew. Sustain. Energy Rev. 2012, 16, 2920–2925. [Google Scholar] [CrossRef] [Scilit]
- Noura, H.N.; Chahine, K.; Bassil, J.; Abou Chaaya, J.; Salman, O. Efficient Combination of Deep Learning Models for Solar Panel Damage and Soiling Detection. Measurement 2025, 251, 117185. [Google Scholar] [CrossRef] [Scilit]
- Abdelsattar, M.; Rasslan, A.A.A.; Emad-Eldeen, A. Detecting Dusty and Clean Photovoltaic Surfaces Using MobileNet Variants for Image Classification. SVU-Int. J. Eng. Sci. Appl. 2025, 6, 9–18. [Google Scholar] [CrossRef] [Scilit]
- Sladojevic, S.; Arsenovic, M.; Anderla, A.; Culibrk, D.; Stefanovic, D. Deep Neural Networks Based Recognition of Plant Diseases by Leaf Image Classification. Comput. Intell. Neurosci. 2016, 2016, 3289801. [Google Scholar] [CrossRef] [Scilit]
- Yilmaz, A. Brain Tumor Detection from MRI Images with Using Proposed Deep Learning Model: The Partial Correlation-Based Channel Selection. Turk. J. Electr. Eng. Comput. Sci. 2021, 29, 2615–2633. [Google Scholar] [CrossRef] [Scilit]
- Sun, T.; Gao, H.; Fan, S.; Hu, X. Enhancing Dust Detection on Photovoltaic Panels with PP-YOLO: A Deep Learning Approach. In Proceedings of the 2024 4th International Conference on Machine Learning and Intelligent Systems Engineering (MLISE), Zhuhai, China, 28–30 June 2024; IEEE: Piscataway, NJ, USA, 2024; pp. 24–28. [Google Scholar]
- Maghami, M.; Hizam, H.; Gomes, C. Impact of Dust on Solar Energy Generation Based on Actual Performance. In Proceedings of the 2014 IEEE International Conference on Power and Energy (PECon), Kuching, Malaysia, 1–3 December 2014; IEEE: Piscataway, NJ, USA, 2014; pp. 388–393. [Google Scholar]
- Mehta, S.; Singh, M. Optimizing Solar Energy Output Through Automated Dust Detection Using CNN-SVM. In Proceedings of the 2024 5th International Conference on Smart Electronics and Communication (ICOSEC), Trichy, India, 18–20 September 2024; IEEE: Piscataway, NJ, USA, 2024; pp. 920–924. [Google Scholar]
- Ghosh, A.; Afrin, S.; Tithy, R.S.; Nahid, F.; Alam, F.; Reza, A.W. Improving Solar Panel Efficiency: A CNN-Based System for Dust Detection and Maintenance. In Proceedings of the 2nd International Conference on Big Data, IoT and Machine Learning, Dhaka, Bangladesh, 6–8 September 2023; Volume 867, pp. 673–684. [Google Scholar]
- Fan, S.; Wang, Y.; Cao, S.; Zhao, B.; Sun, T.; Liu, P. A Deep Residual Neural Network Identification Method for Uneven Dust Accumulation on Photovoltaic (PV) Panels. Energy 2022, 239, 122302. [Google Scholar] [CrossRef] [Scilit]
- Bashir, S.B.; Farag, M.M.; Hamid, A.-K.; Adam, A.A.; Bansal, R.C.; Mbungu, N.T.; Elnady, A.; Abo-Khalil, A.G.; Hussein, M. Innovative Dust Detection and Efficient Cleaning of PV Panels: A CNN-RF Approach Using I–V Curve Data Transformed into RGB Mosaics. Energy Convers. Manag. X 2025, 27, 101079. [Google Scholar] [CrossRef] [Scilit]
- Li, M.; Wang, Y. Deep Learning for Dust Accumulation Analysis on Desert Solar Panels: A CNN-Transformer Approach. IEEE Access 2025, 13, 69857–69872. [Google Scholar] [CrossRef] [Scilit]
- Ozer, T.; Turkmen, O. An Approach Based on Deep Learning Methods to Detect the Condition of Solar Panels in Solar Power Plants. Comput. Electr. Eng. 2024, 116, 109143. [Google Scholar] [CrossRef] [Scilit]
- Bassil, J.; Noura, H.N.; Salman, O.; Chahine, K.; Guizani, M. Efficient Combination of Deep Learning and Tree-Based Classification Models for Solar Panel Dust Detection. Intell. Syst. Appl. 2025, 26, 200509. [Google Scholar] [CrossRef] [Scilit]
- Alatwi, A.M.; Albalawi, H.; Wadood, A.; Anwar, H.; El-Hageen, H.M. Deep Learning-Based Dust Detection on Solar Panels: A Low-Cost Sustainable Solution for Increased Solar Power Generation. Sustainability 2024, 16, 8664. [Google Scholar] [CrossRef] [Scilit]
- Abuqaaud, K.A.; Ferrah, A. A Novel Technique for Detecting and Monitoring Dust and Soil on Solar Photovoltaic Panel. In Proceedings of the 2020 Advances in Science and Engineering Technology International Conferences (ASET), Dubai, United Arab Emirates, 4 February–9 April 2020; IEEE: Piscataway, NJ, USA, 2020; pp. 1–6. [Google Scholar]
- Khalid, H.M.; Rafique, Z.; Muyeen, S.M.; Raqeeb, A.; Said, Z.; Saidur, R.; Sopian, K. Dust Accumulation and Aggregation on PV Panels: An Integrated Survey on Impacts, Mathematical Models, Cleaning Mechanisms, and Possible Sustainable Solution. Sol. Energy 2023, 251, 261–285. [Google Scholar] [CrossRef] [Scilit]
- Abd, H.S.; Judran, H.K.; Aun, S.H.A.; Jaddoa, A.A.; Hammoodi, K.A.; Kadhim, S.A.; Daif, J.M. Dust Deposition and Cleaning Effect on PV Panel: Experimental Approach. Results Eng. 2025, 27, 106041. [Google Scholar] [CrossRef] [Scilit]
- Shao, Y.; Zhang, C.; Xing, L.; Sun, H.; Zhao, Q.; Zhang, L. A New Dust Detection Method for Photovoltaic Panel Surface Based on Pytorch and Its Economic Benefit Analysis. Energy AI 2024, 16, 100349. [Google Scholar] [CrossRef] [Scilit]
- Winkel, P.; Wilbert, S.; Roger, M.; Krauth, J.J.; Algner, N.; Nouri, B.; Wolfertstetter, F.; Carballo, J.A.; Alonso-Garcia, M.C.; Polo, J.; et al. Cell-Resolved PV Soiling Measurement Using Drone Images. Remote Sens. 2024, 16, 2617. [Google Scholar] [CrossRef] [Scilit]
- Al-Addous, M.; Dalala, Z.; Alawneh, F.; Class, C.B. Modeling and Quantifying Dust Accumulation Impact on PV Module Performance. Sol. Energy 2019, 194, 86–102. [Google Scholar] [CrossRef] [Scilit]
- Fatima, K.; Faiz Minai, A.; Malik, H.; Garcia Marquez, F.P. Experimental Analysis of Dust Composition Impact on Photovoltaic Panel Performance: A Case Study. Sol. Energy 2024, 267, 112206. [Google Scholar] [CrossRef] [Scilit]
- Yakubu, S.; Samikannu, R.; Gawusu, S.; Wetajega, S.D.; Okai, V.; Shaibu, A.K.S.; Workneh, G.A. A Holistic Review of the Effects of Dust Buildup on Solar Photovoltaic Panel Efficiency. Sol. Compass 2025, 13, 100101. [Google Scholar] [CrossRef] [Scilit]
- Chen, L.; Fan, S.; Sun, S.; Cao, S.; Sun, T.; Liu, P.; Gao, H.; Zhang, Y.; Ding, W. A Detection Model for Dust Deposition on Photovoltaic (PV) Panels Based on Light Transmittance Estimation. Energy 2025, 322, 135284. [Google Scholar] [CrossRef] [Scilit]
- Afroz. Solar Panel Images Clean and Faulty Images. Available online: https://www.kaggle.com/datasets/pythonafroz/solar-panel-images (accessed on 31 December 2025).

Disclaimer/Publisher’s Note: The statements, opinions and data contained in all publications are solely those of the individual author(s) and contributor(s) and not of MDPI and/or the editor(s). MDPI and/or the editor(s) disclaim responsibility for any injury to people or property resulting from any ideas, methods, instructions or products referred to in the content. |
© 2026 by the authors. Licensee MDPI, Basel, Switzerland. This article is an open access article distributed under the terms and conditions of the Creative Commons Attribution (CC BY) license.