Article

TSFPTD: A Multimodal Model Integrating Temporal and Spectral Features for Electricity Theft Detection

1
Beijing China-Power Information Technology Co., Ltd., Beijing 100089, China
2
State Grid Heilongjiang Electric Power Co., Ltd., Harbin 150006, China
3
College of Control and Computer Engineering, North China Electric Power University, Beijing 100026, China
*
Author to whom correspondence should be addressed.
Electronics 2026, 15(6), 1153; https://doi.org/10.3390/electronics15061153
Submission received: 20 January 2026 / Revised: 5 March 2026 / Accepted: 9 March 2026 / Published: 10 March 2026

Abstract

In modern power grids, the detection of electricity theft is crucial for ensuring the safety and stability of the power system and reducing revenue losses. Current electricity theft detection methods do not take into account the spectral space features contained in the original time series data sequences, and thus are unable to adapt to the complex and ever-changing scenarios of electricity theft. This paper proposes an electricity theft detection model TSFPTD that integrates time series signals and their synchronous spectral features. The multi-modal model constructs the synchronous spectral modal space corresponding to the time series data through a deep wavelet network. It is found that this newly generated synchronous modal space contains implicit features that cannot be revealed by the original time series data. The explicit features of the time series data space and the implicit features of the synchronous spectral modal space are fused and aligned for the detection of power theft behavior. The performance verification experiment of the model was completed on the real dataset released by State Grid Corporation of China. The electricity theft detection accuracy of the TSFPTD model reached over 96.83%, and its performance is superior to the existing electricity theft detection methods.

1. Introduction

Electricity is essential to modern society, underpinning both residential consumption and industrial infrastructure. With the rapid evolution of smart grid technologies, monitoring grid operations has become crucial for ensuring the safety and stability of power systems. Grid supervision and inspection primarily target two categories of loss: non-human-induced losses and human-induced losses. The latter includes electricity theft, illegal wiring, and meter tampering—activities that are often numerous, difficult to detect, and prolonged in duration. These irregularities not only result in substantial economic damage to power utilities but also compromise the safety and reliability of the electricity supply. Globally, the power industry incurs annual losses of nearly USD 89 billion due to electricity theft [1], underscoring the urgent need for effective detection methodologies.
In response to these challenges, various machine learning and deep learning approaches have been proposed for electricity theft detection [2]. Li et al. [3], for instance, introduced a method combining deep learning with a Random Forest (RF) classifier. By integrating deep feature extraction with ensemble learning, their approach achieves effective identification of anomalous users. However, its capacity to capture periodic patterns in large-scale, high-dimensional time-series data remains constrained. Haq et al. [4] developed a hybrid deep learning and Support Vector Machine (SVM) framework that leverages nonlinear features from deep networks to improve SVM classification performance. Although accuracy is enhanced, the model is sensitive to hyperparameters and shows limited generalization under complex load fluctuations. Jindal et al. [5] employed a combined Decision Tree (DT) and SVM strategy, offering fast training and interpretability, yet performance tends to degrade in large-scale, imbalanced datasets. Feng et al. [6] proposed an anomaly detection method based on local matrix reconstruction and Principal Component Analysis (PCA), identifying theft via reconstruction error. While beneficial in label-scarce scenarios, the method relies solely on linear feature extraction, limiting its ability to detect highly nonlinear theft behaviors.
With advances in deep learning, Ismail et al. [7] utilized a Convolutional Neural Network (CNN) to detect electricity theft resulting from network attacks, effectively extracting local spatial features from load profiles. However, CNNs are generally limited in capturing long-term temporal dependencies. Dhaked et al. [8] applied Long Short-Term Memory (LSTM) networks to forecast power data, demonstrating strong capability in modeling sequential dependencies, though the model is prone to overfitting on noisy real-world data. Markovska et al. [9] implemented a Transformer-based time-series detection model, employing self-attention to capture long-range dependencies and multi-scale temporal patterns. Nevertheless, the complex architecture and large parameter count of Transformers result in high training costs and potential generalization degradation in noisy or data-sparse environments. Consequently, approaches relying exclusively on either machine learning or deep learning often fail to fully capture the spatiotemporal characteristics inherent in electricity consumption data.
Recognizing that no single model can simultaneously capture spatial features, temporal dependencies, and anomalous behavioral patterns in load data, researchers have increasingly adopted multi-algorithm fusion strategies to construct more powerful hybrid detection frameworks. Sun et al. [10] proposed using VAE-GAN to generate high-fidelity synthetic theft samples, followed by 1D-CNN for time-series classification, significantly alleviating class imbalance and improving detection rates. However, distributional discrepancies between synthetic and real theft samples may lead to biased feature learning. Bai et al. [11] introduced a hybrid model combining multi-scale CNN for local feature extraction with Transformer for capturing cross-period global dependencies, enabling joint modeling of local periodicities and long-range temporal relationships. Although this enhances representation of complex time-series structures, the framework’s complexity and parameter scale incur substantial computational costs during training and inference. Hasan et al. [12] developed a CNN-LSTM hybrid model, where CNN extracts local spatial features and LSTM captures long-term and short-term temporal dependencies, achieving spatiotemporal joint modeling that improves detection accuracy and robustness. However, the model remains computationally intensive and may still overfit with limited or noisy data. Djaghoul et al. [13] proposed a 1D-CNN and LSTM hybrid model for open-circuit fault detection in multilevel inverters, where the convolutional layers extract local spatial features from voltage signals and the LSTM layers capture temporal dependencies to track signal variations over time, achieving spatiotemporal joint modeling that enables accurate detection and localization of single and double switch failures with high robustness under varied operating conditions. Nirmal et al. [14] introduced a CNN-AdaBoost hybrid for smart grid theft detection, using CNN to extract deep load features and AdaBoost to enhance classification. While effective on nonlinear and complex features, the method is sensitive to CNN feature quality and AdaBoost parameter tuning and may produce false alarms on highly imbalanced or noisy datasets, accompanied by considerable training and tuning overhead.
To overcome the limitations inherent in current electricity theft detection methodologies, this paper introduces a novel multimodal framework termed TSFPTD—Temporal-Spectral Feature Fusion for Theft Detection. This model is designed to synergistically integrate temporal and spectral feature representations, thereby achieving enhanced accuracy and robustness in identifying fraudulent consumption patterns. The proposed approach performs a comprehensive analytical process by first extracting implicit features from the spectral domain that is synchronized with the temporal data, then aligning these features with explicitly modeled temporal dynamics, and finally executing theft detection through a coherently fused multimodal representation. The principal contributions of this research are systematically outlined as follows:
First, a structured data preprocessing pipeline is implemented, which includes missing value imputation and oversampling to address data incompleteness and class imbalance. Following this, the time-series consumption data are transformed into two-dimensional scalograms via continuous wavelet transformation [15], thereby generating a time–frequency representation. The raw time-series data and the corresponding scalograms are then fed into a Bi-LSTM network [16] and an improved Mask-RepViT model, respectively. This dual-branch architecture enables the alignment and fusion of explicit temporal dynamics with implicit spectral patterns, culminating in a unified feature representation that is subsequently classified through a fully connected layer. Through gated feature interaction and adaptive fusion, the framework enables cross-domain information complementarity rather than simple feature concatenation. This design constitutes a methodological shift from single-domain modeling to synchronized dual-domain representation learning.
Second, this work proposes a fundamentally novel detection paradigm that moves beyond conventional single-modality approaches, which typically rely exclusively on temporal consumption sequences. By strategically incorporating synchronized spectral information derived from wavelet transformations, the proposed framework significantly enriches the feature space. This enrichment allows the model to simultaneously capture sequential behavioral evolution in the time domain and anomalous structural signatures in the frequency domain. More importantly, the proposed approach establishes the systematic integration of synchronized temporal–spectral representation learning within a unified detection framework, rather than treating temporal and spectral information as loosely connected modalities. Such structured integration enables cross-domain feature complementarity and coordinated representation optimization. The multimodal feature expansion effectively compensates for the narrow representational scope of traditional methods, yielding superior discriminative capability, improved robustness against noise, and a heightened ability to identify diverse and evolving theft patterns.
Third, the efficacy of the TSFPTD framework is substantiated through extensive experimental evaluation on the publicly available SGCC electricity theft dataset. Results demonstrate that the proposed model attains advanced detection performance. Compared to established baseline methods such as Transformer-based architectures, the proposed framework not only achieves higher accuracy but also exhibits a more compact model structure. This design translates to significantly lower computational overhead and faster inference times, rendering the model not only effective but also practical for potential large-scale, real-world deployment in smart grid monitoring systems.

2. Materials and Methods

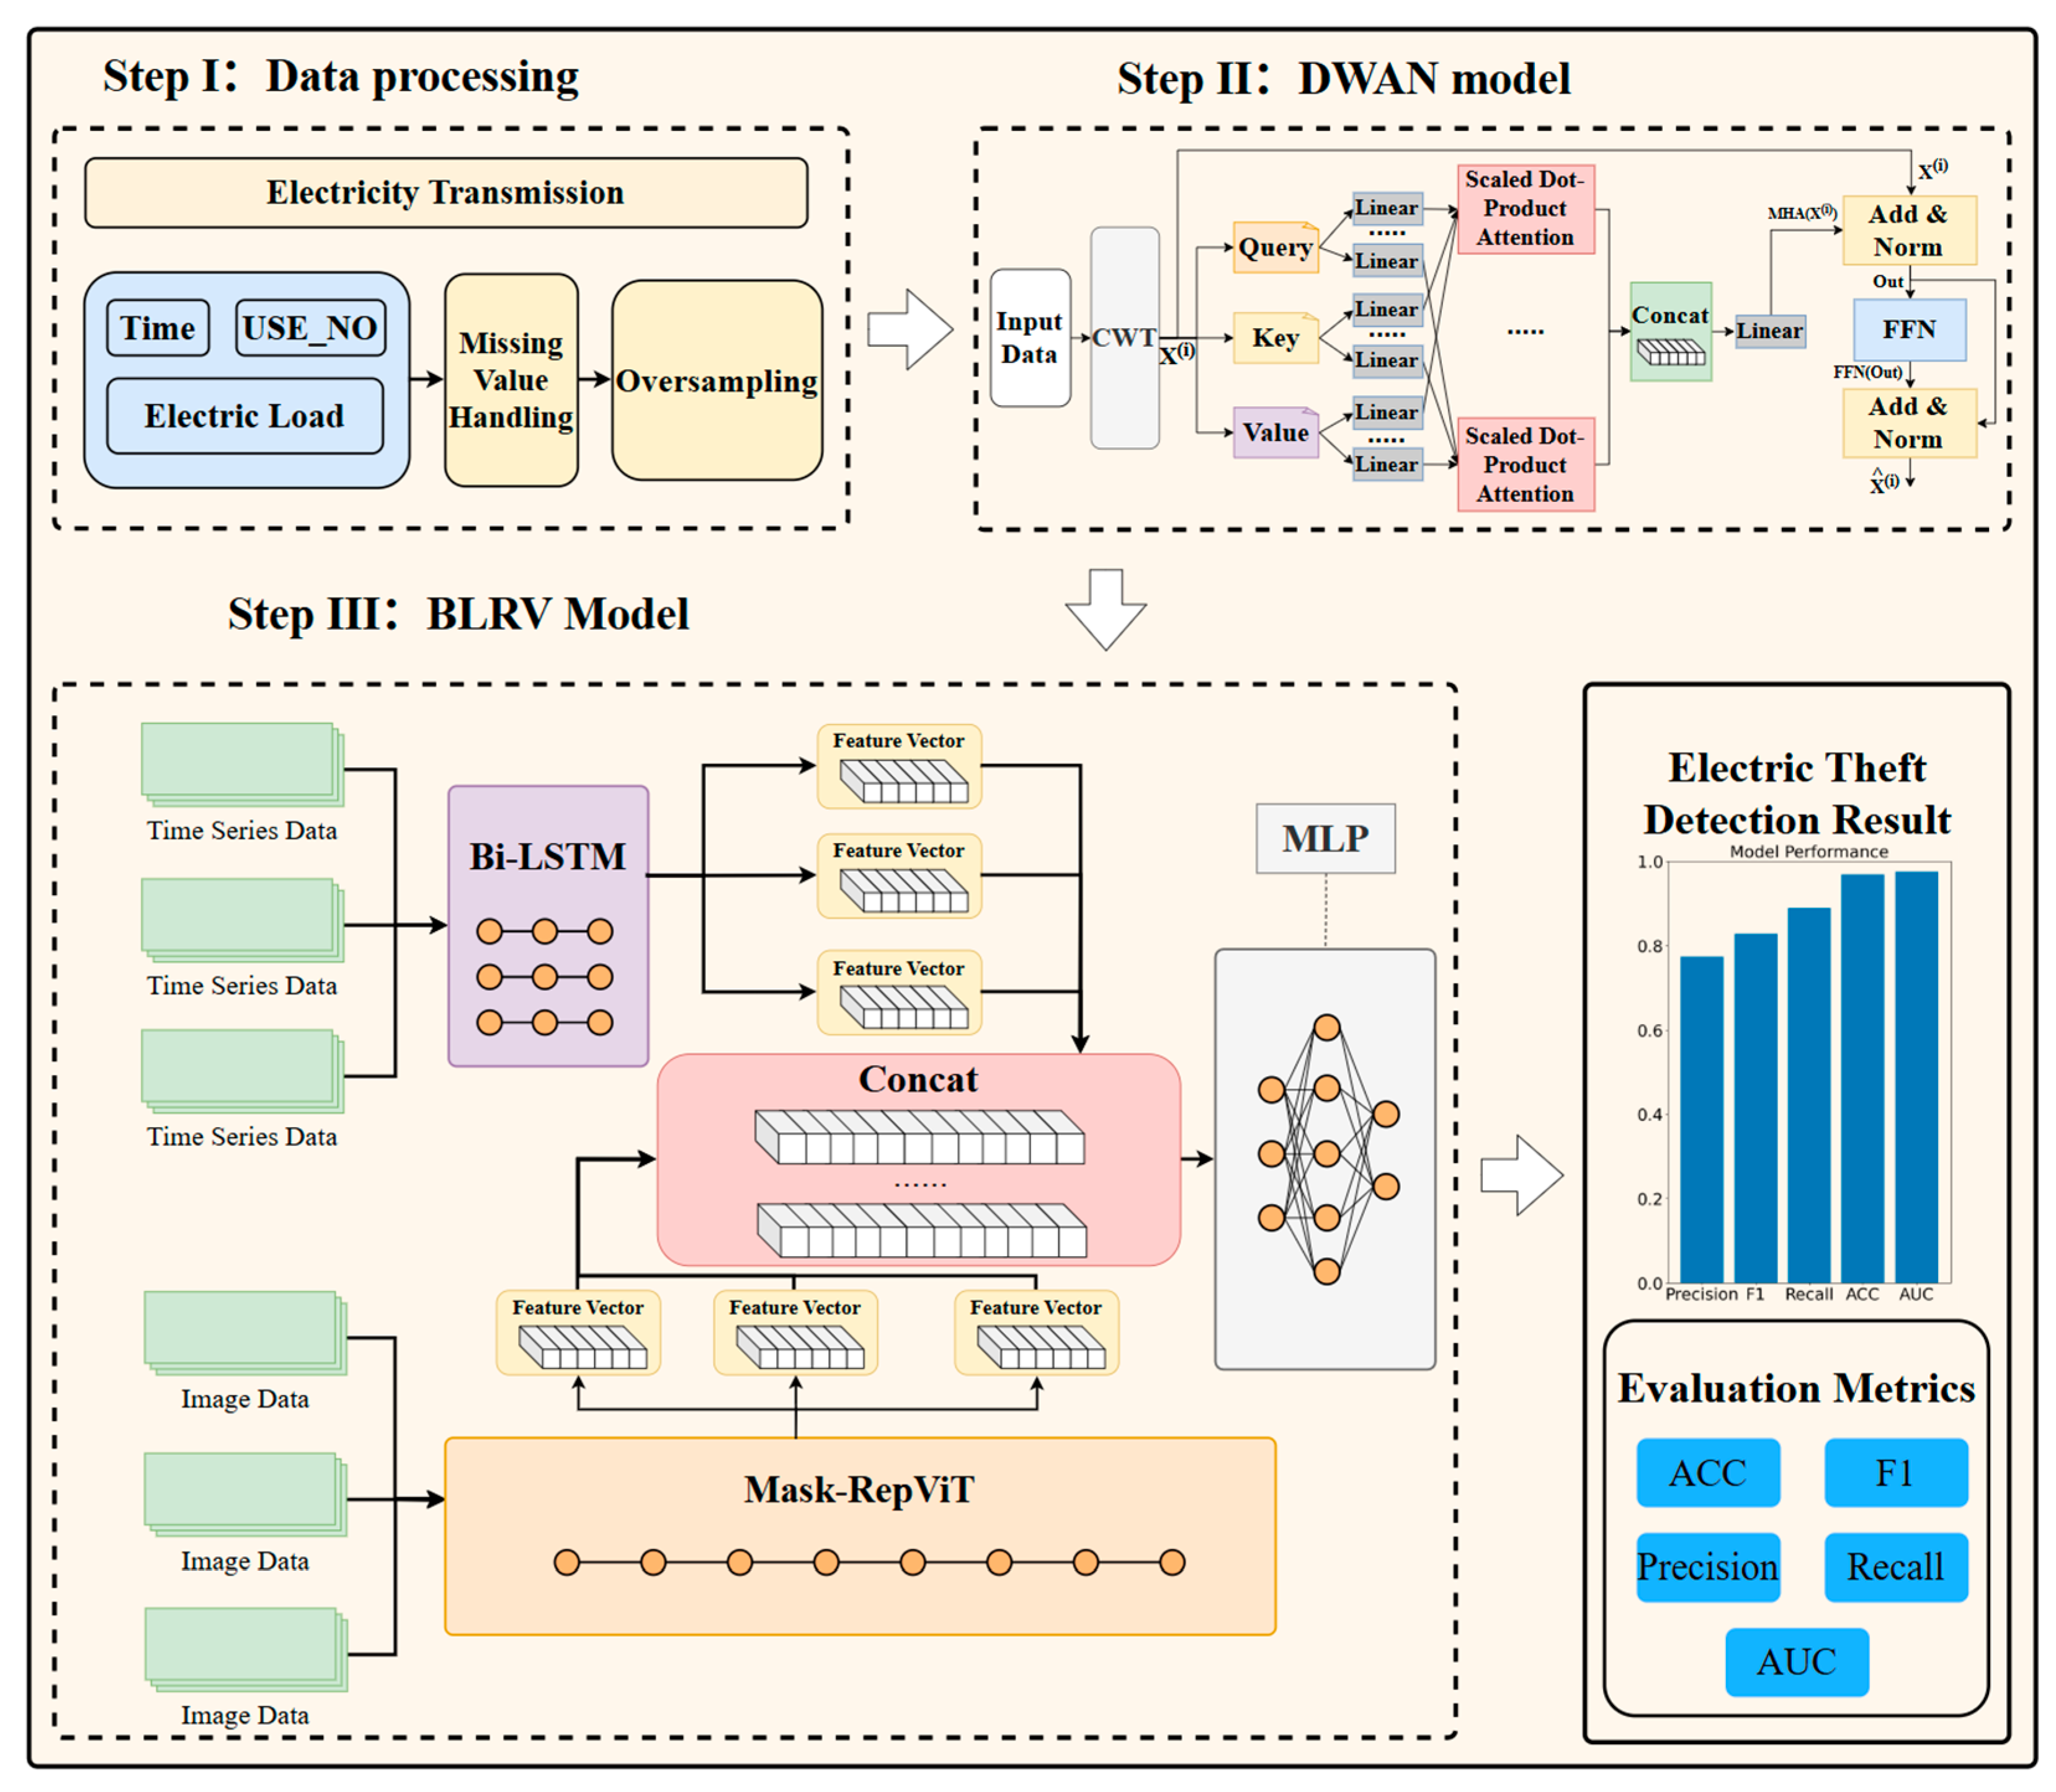
This paper proposes a multimodal electricity theft detection model named TSFPTD, which integrates temporal and spectral features. The electricity theft detection process of the TSFPTD model includes temporal data preprocessing, synchronous scalogram mode generation, multimodal fusion alignment, and detection output. The detailed workflow is illustrated in Figure 1.

2.1. Data Pre-Processing

Existing approaches typically detect electricity theft by analyzing continuous electricity consumption data collected from users within a specific grid area over a defined period. However, due to constraints related to equipment, transmission, or measurement technology, the collected time-series data often suffer from quality issues, most notably missing values. The multi-modal electricity theft detection model proposed in this paper, which integrates temporal and spectral features, addresses these missing values through a hybrid imputation strategy combining linear interpolation, forward/backward filling, and mean substitution [17]. Specifically, linear interpolation is applied to complete continuous time-series segments, thereby preserving underlying trend characteristics. Forward and backward filling are used to restore missing entries at the beginning or end of sequences, as well as consecutive gaps, ensuring data integrity. Mean imputation is employed for non-temporal discrete features to reduce variability. Linear interpolation estimates the missing values through a linear equation. Edge missing values are filled using forward and backward filling, with the previous non-missing value replacing the forward and the next non-missing value replacing the backward. A large number of missing values are imputed using mean imputation, replacing the missing items with the mean of non-missing values in each row. After missing value processing, the class imbalance problem is tackled by applying the SMOTE algorithm to the training set. This technique generates synthetic samples for the minority class via interpolation between existing instances, effectively balancing the class distribution. This enhances the model’s learning capability and improves its sensitivity in detecting abnormal electricity consumption behaviors.

2.2. Obtaining Spectrum Images Using Deep Wavelet Transform Network

Wavelet transform is applied to convert time-series data into two-dimensional scalograms, enabling the extraction of latent features embedded within the spectral image space. As a time–frequency analysis tool, the wavelet transform decomposes signals using mother wavelets that are scalable and translatable. Unlike the Fourier transform, which captures only frequency content, the wavelet transform preserves both frequency information and the temporal localization of frequency components, thereby offering multi-resolution analytical capability.
By applying wavelet transform to electricity consumption time series, a wavelet coefficient matrix is obtained. The absolute values of these coefficients represent energy intensity, which is then mapped to color space to generate a wavelet scalogram. As a synchronous spectral representation, the scalogram characterizes the energy distribution of the target signal across distinct temporal and frequency scales.
The SGCC dataset consists of long-term daily electricity consumption sequences characterized by strong periodicity and multi-scale fluctuations. Typical load profiles exhibit weekly and seasonal cycles, rendering the data inherently oscillatory and non-stationary. Among the various mother wavelets, the Morlet wavelet is especially well-suited for analyzing such oscillatory signals due to its construction—a sinusoidal wave modulated by a Gaussian envelope. This configuration ensures a well-defined central frequency and balanced time–frequency localization. In contrast, the Mexican Hat wavelet, derived as the second derivative of a Gaussian function, is more attuned to detecting abrupt changes and edges but lacks explicit frequency localization, making it less effective for capturing periodic consumption patterns. Daubechies wavelets, primarily developed for discrete multi-resolution analysis and signal reconstruction, are not designed for continuous time–frequency representation. Given that electricity theft typically manifests as distortions in periodic load structures rather than isolated spikes, the Morlet wavelet is theoretically better suited for uncovering frequency-band anomalies and scale-dependent irregularities in consumption behavior.
This paper presents a deep adaptive wavelet network (DWAN) for frequency-domain analysis of time-series signals. The wavelet kernel function in the model is defined as:
ψ ( t ) = π 1 / 4 e j ω 0 t e t 2 2
where t denotes the time variable, ω 0 is the central angular frequency, j is the imaginary unit, and π 1 / 4 is the normalization coefficient ensuring unit energy of the wavelet. The term e j ω 0 t corresponds to a complex sinusoid carrying frequency information, while e t 2 2 represents the Gaussian envelope that provides temporal localization.
The continuous form of the wavelet transform function is defined as:
W ( a , b ) = 1 | a | + x ( t ) ψ * t b a d t
where x(t) is the original electrical time-series signal, ψ(t) is the mother wavelet kernel, and ψ* denotes its complex conjugate, a and b denote the scale and translation parameters, respectively. The wavelet coefficient matrix W(a,b) captures the local characteristics of the signal across different scales and time positions. The energy distribution, obtained from the modulus of this matrix, yields the wavelet time–frequency spectrum (scalogram):
E ( a , b ) = | W ( a , b ) |
After visualization, the resulting scalogram is provided as image input to a deep learning model, thereby furnishing a spatial representation of electricity-theft features.
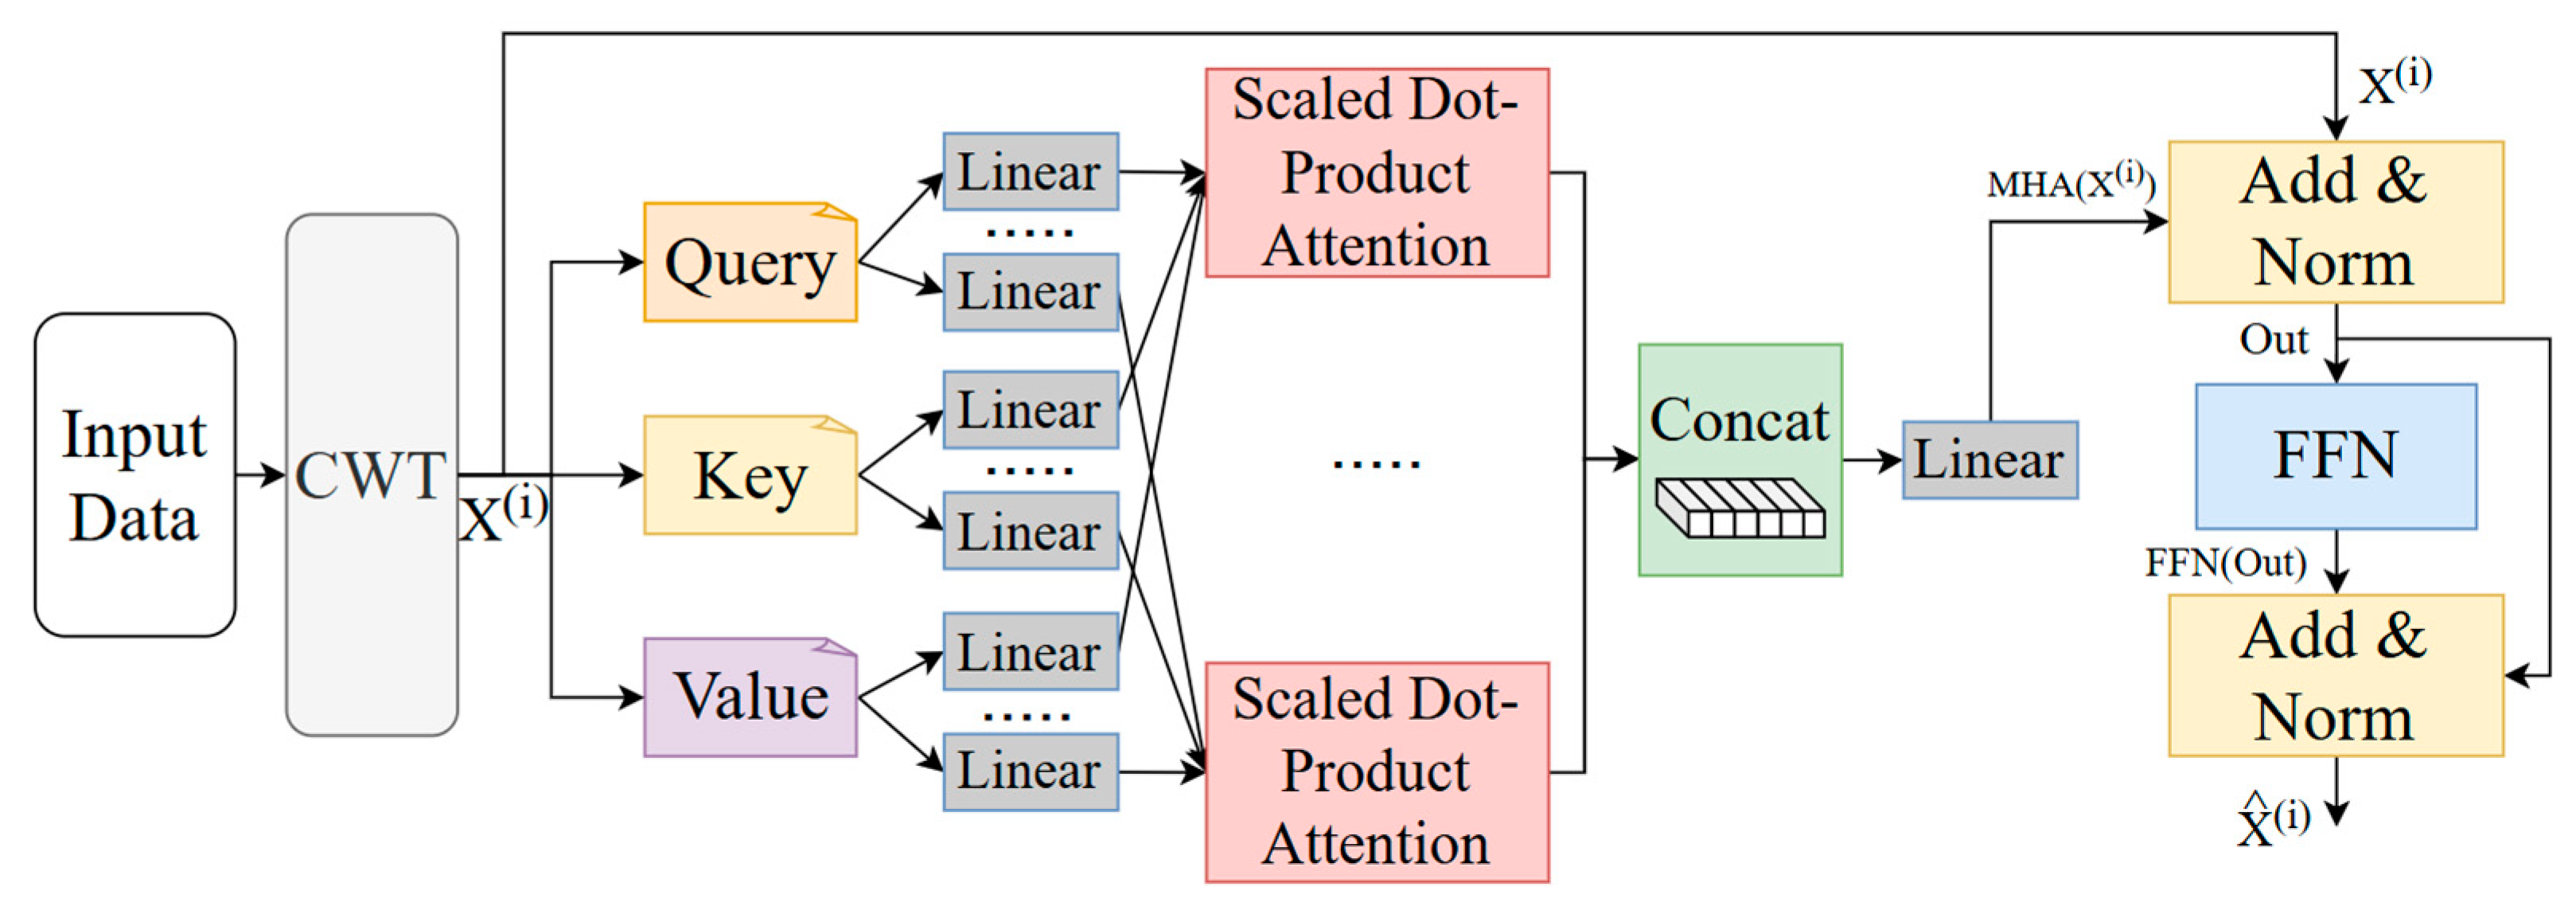
The proposed deep adaptive wavelet network (DWAN) in this paper is designed to improve the continuous wavelet transform (CWT), as illustrated in Figure 2. It adds a multi-head attention mechanism on top of the traditional wavelet transform to learn the dependencies between different time points in the time series, weights the wavelet coefficients in the time dimension, and enables the model to automatically focus on the important time windows with significant signal changes, thus effectively enhancing the processing ability of the continuous wavelet transform (CWT) for non-stationary signals.
Specifically, the core of the multi-head attention mechanism is the feature mapping of Query, Key, and Value. For the wavelet coefficients X ( i ) output by CWT, separate linear transformation layers will generate multiple sets of Query, Key, and Value vectors. Each set of Q, K, and V is then processed by a scaled dot-product attention module, which dynamically weights the wavelet coefficients along the time dimension. This allows the model to assign higher weights to time windows that exhibit salient signal changes, thereby enhancing the representation of critical temporal regions.
Upon feeding the input data into the Morlet wavelet, for the raw wavelet transform output X ( i ) corresponding to the i-th sample, we define
X ( i ) = [ x 1 , x 2 , , x T ] T R T × S
where x t represents the scale vector at time t with a length of S. The multi-head attention mechanism is applied then to the entire sequence X ( i ) . For each head h, linear projections yield the query, key, and value matrices:
Q h   =   X W h Q ,   K h   =   X W h K , V h   =   X W h V
Scaled dot-product attention is then computed for each head.
Attention ( Q h , K h , V h ) h = softmax Q h K h T d k V h
The outputs from H heads are concatenated and passed through a linear transformation:
M H A ( X ( i ) ) = C o n c a t ( A t t n 1 , , A t t n H ) W O
The obtained output is then subjected to a residual connection and processed through a LayerNorm layer. The original wavelet feature X ( i ) is connected with the multi-head attention output via residual connection, and then layer normalization is performed to retain the original information while enhancing the features:
O u t = L a y e r N o r m X ( i ) + M H A ( X ( i ) )
The intermediate feature Out is subsequently fed into a feed-forward network (FFN) for additional transformation, again incorporating a residual connection and layer normalization:
X ( i ) ^ = L a y e r N o r m O u t + F F N ( O u t )
Finally, the feature tensor X ( i ) ^ with the shape of T × S is reshaped into the refined local signal feature W ^ R S × T with the shape of S × T. Using the improved local signal feature, the energy distribution E ( a , b )   =   | W ^ | is obtained. Compared with the original wavelet transform, this approach yields enhanced temporal localization, improved representation of non-stationary signals, and greater feature separability. These advantages can provide more effective feature support for subsequent classification, detection and other tasks, thereby improving the overall performance of the model.
To quantitatively assess the separability of the features derived from the time–frequency spectrograms, we computed the Silhouette Score, which measures both the cohesion within clusters and the separation between different clusters. The obtained Silhouette Score of 0.5468 indicates a reasonable degree of distinction between normal users and electricity theft users in the feature space. This positive value suggests that the time–frequency representations effectively capture discriminative patterns associated with anomalous consumption behaviors, thereby supporting the utility of such spectrograms for downstream classification tasks.
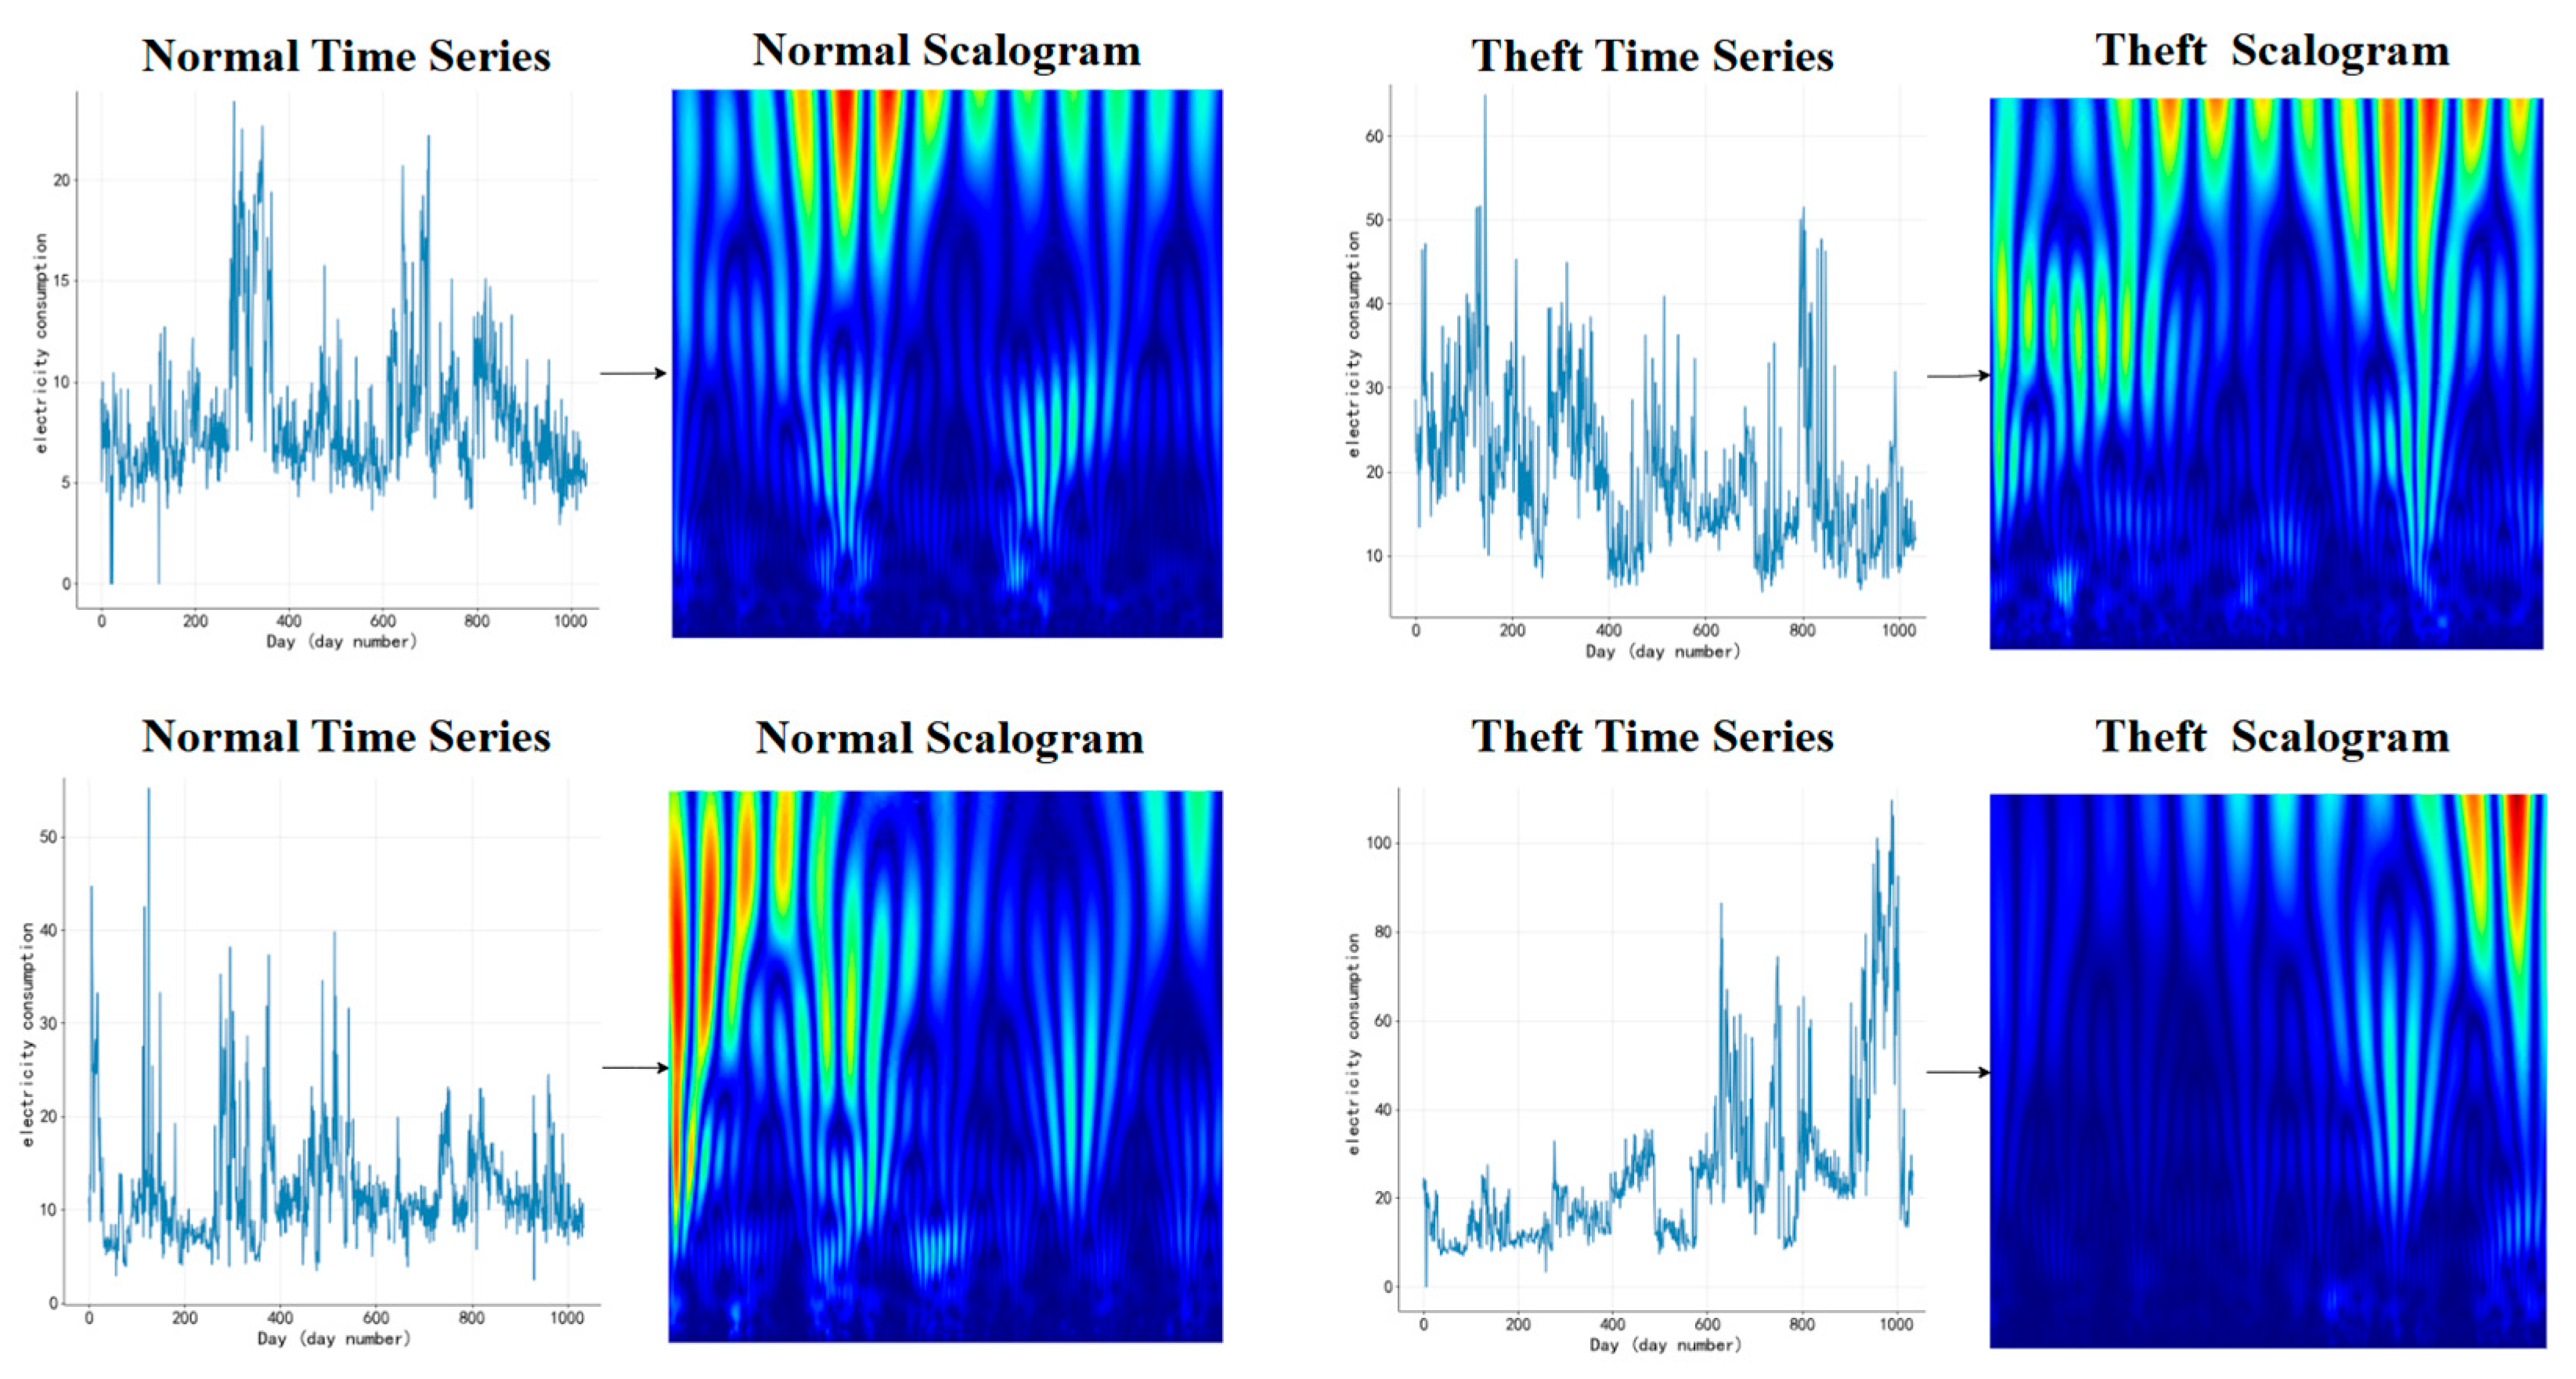
Figure 3 shows a line graph generated from the original time series data, as well as a scalogram of the synchronous spectral mode space derived by applying the wavelet transform network to the original time series data. The synchronous spectral mode space enables time–frequency localization analysis. The horizontal coordinate position corresponds to the time point of that component in the original signal, and the vertical coordinate amplitude represents the energy intensity of the corresponding time point in the frequency domain. The numerical values of the energy intensity are displayed from low to high as dark blue, green, yellow, and red. The transformed synchronous spectral mode space retains the low-frequency coefficients of the original time series data, corresponding to the overall trend and slow-changing part of the original signal, and retains the main features of the signal. At the same time, it amplifies the high-frequency coefficients of the original time series data, corresponding to the local mutations, noise, or rapid fluctuations of the original signal, and can capture the instantaneous characteristics of the signal.
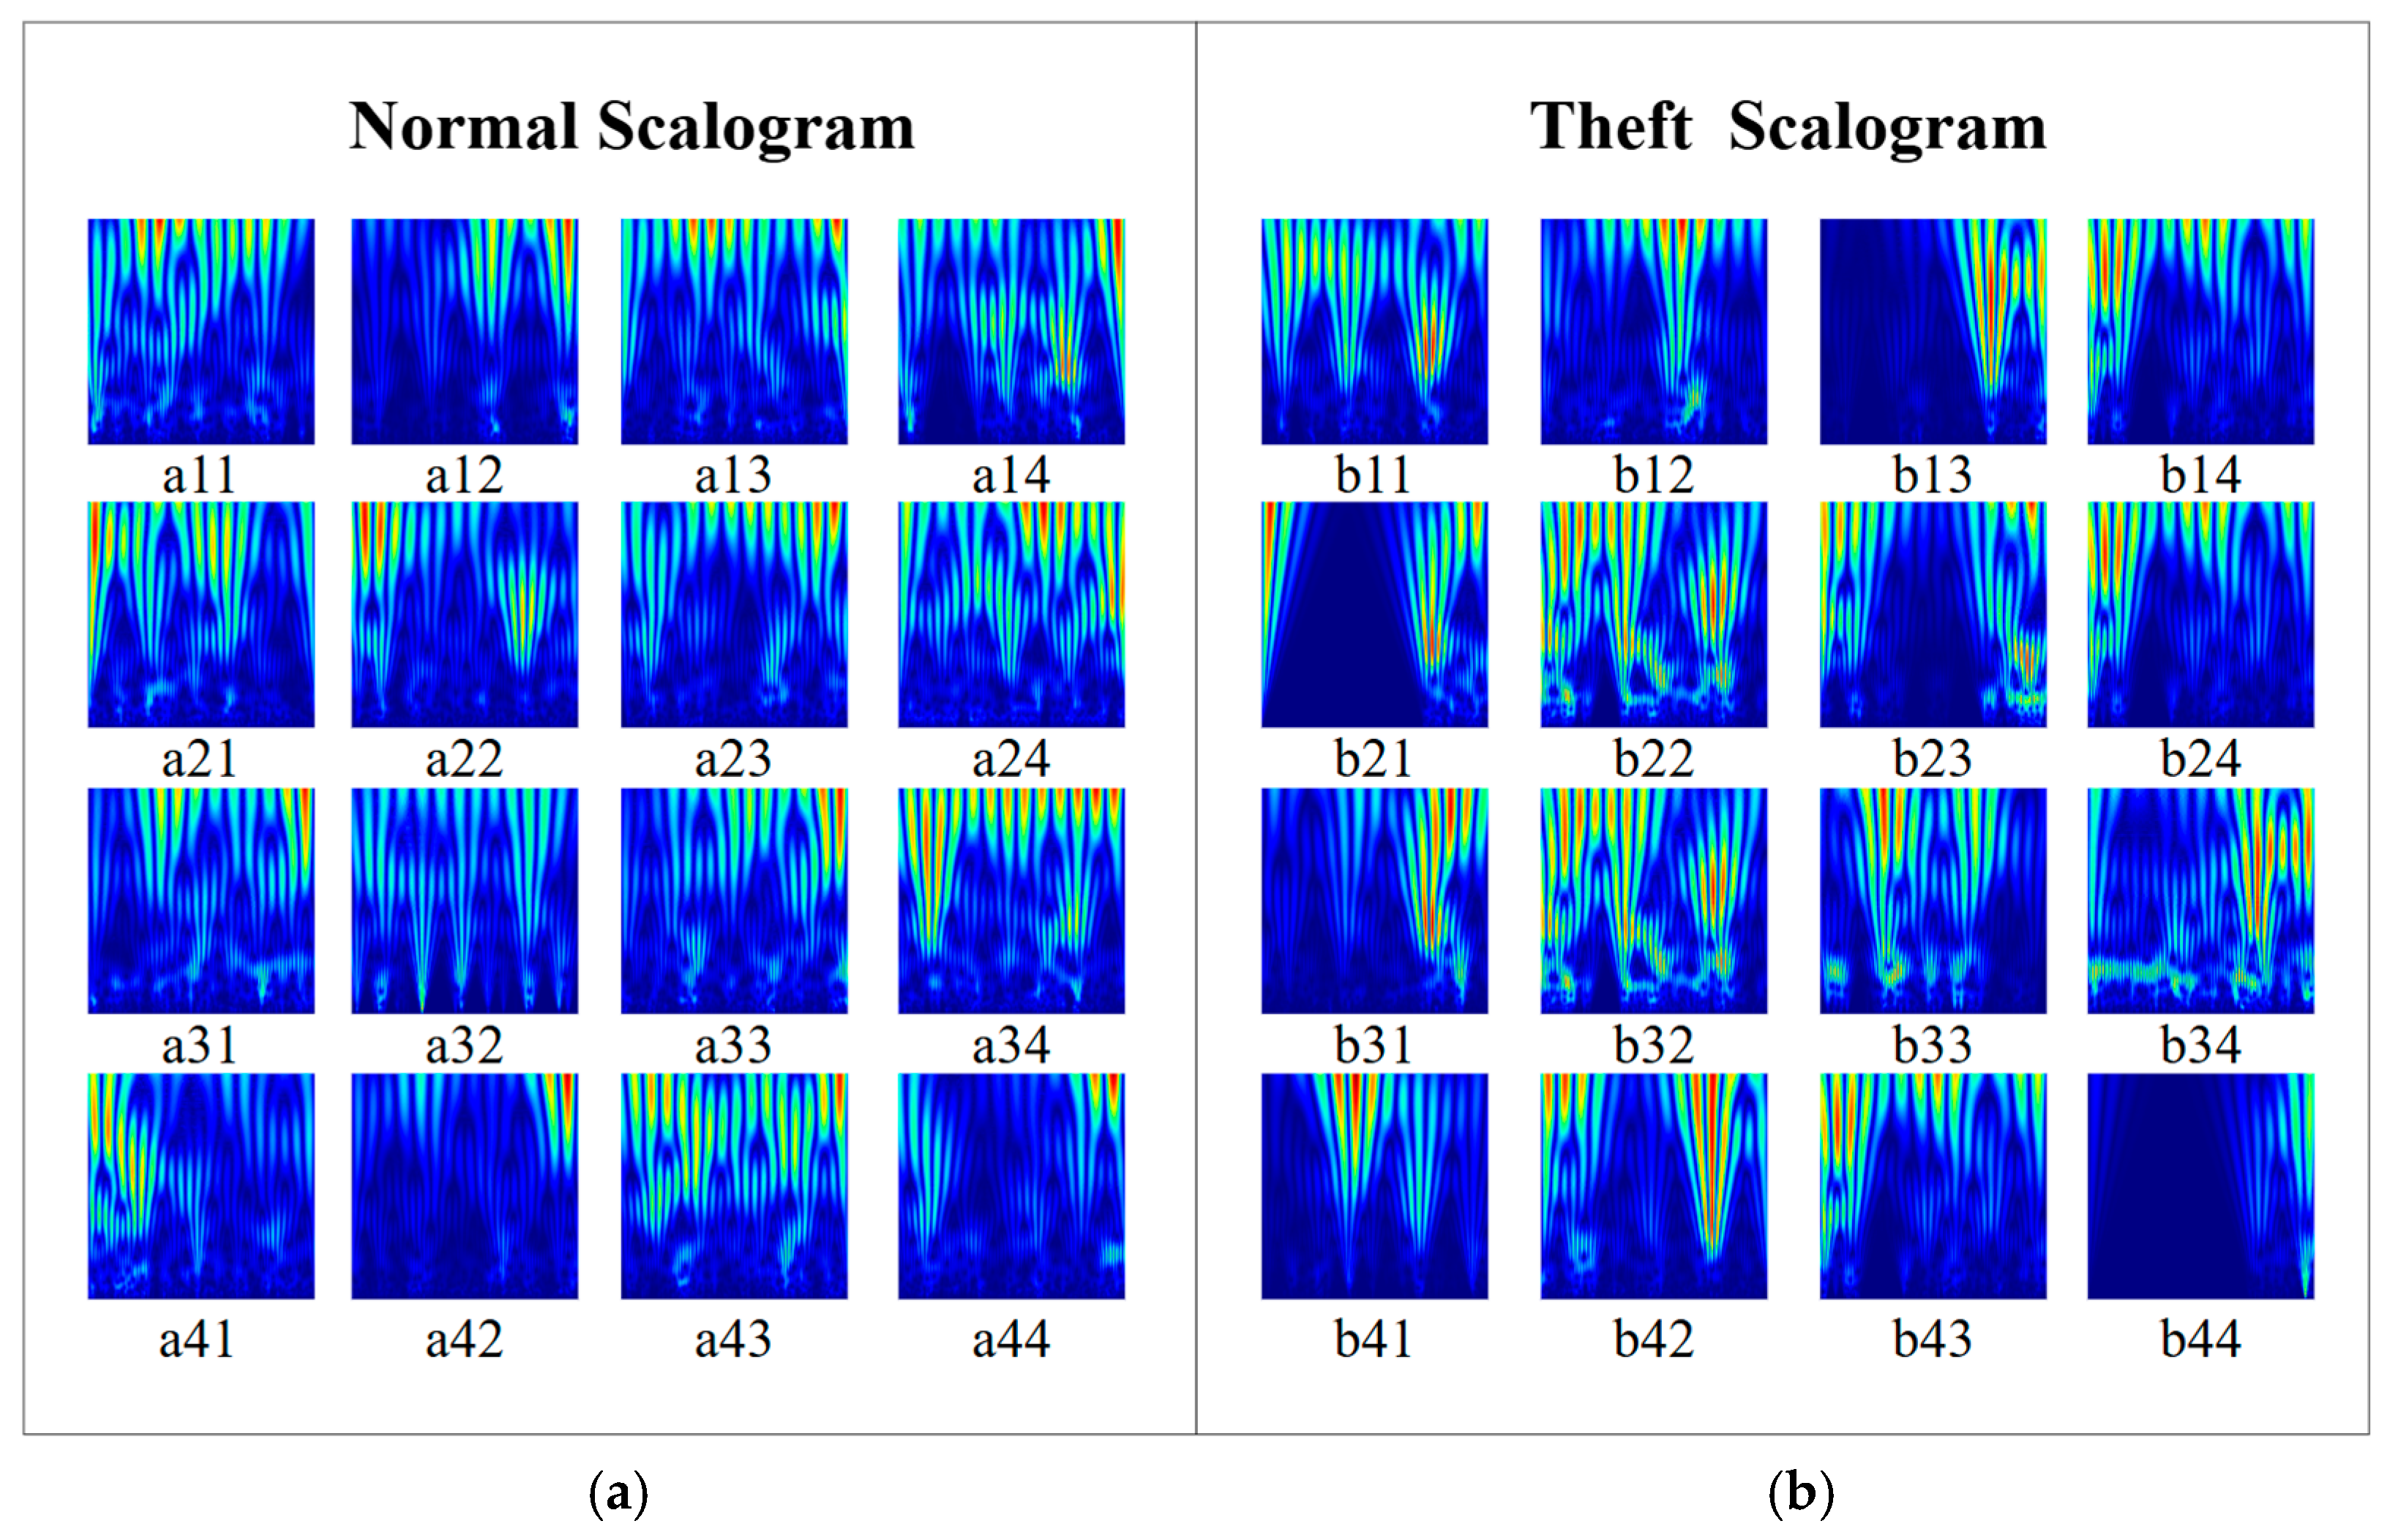
From the characteristics observed in the time–frequency spectra, it can be analyzed that the electricity consumption patterns of theft users differ from those of normal users across multiple spectral regions. The striations in the images represent periodic fluctuations in user consumption, while the warm-colored patches correspond to transient mutations or local high-frequency components in the signal, which may indicate spectral anomalies caused by electricity theft. In the low-frequency region of the time–frequency spectrum of theft users, a sustained enhancement is observed over prolonged usage periods—manifested as notably intensified and persistent red and yellow energy bands in the low-frequency zone. This suggests a baseline elevation resulting from meter bypassing due to theft, a characteristfdic scarcely present in normal users. For example, Figure 4(a11,b34) illustrate the behaviors of a normal user and a theft user, respectively, under the aforementioned conditions.
The time–frequency spectrum of theft users exhibits distinct patch-like red-yellow zones at medium scales and across multiple time intervals, typically corresponding to sudden large-scale short-term theft, altered consumption patterns, and repeated abnormal peaks. In contrast, the mid-frequency region of normal users—reflecting periodic variations at medium scales—appears more uniform and exhibits clearer periodicity, as shown in Figure 4(a13,b22), representing normal and theft behaviors, respectively.
Furthermore, the time–frequency spectra of theft users often display distorted or broken striations, or perturbed periodicity, generally caused by external interference with frequency components or sudden power consumption. As theft occurs, periodic disturbances emerge in the spectrum, disrupting its structural regularity. In comparison, normal users’ spectra exhibit clear vertical striping with pronounced periodic regularity and repetitive patterns, reflecting typical cyclical electricity usage. This is exemplified in Figure 4(a23,b23), which respectively depict normal and theft user behaviors in the scenarios described above.

2.3. Multimodal Feature Fusion for Electricity Theft Detection

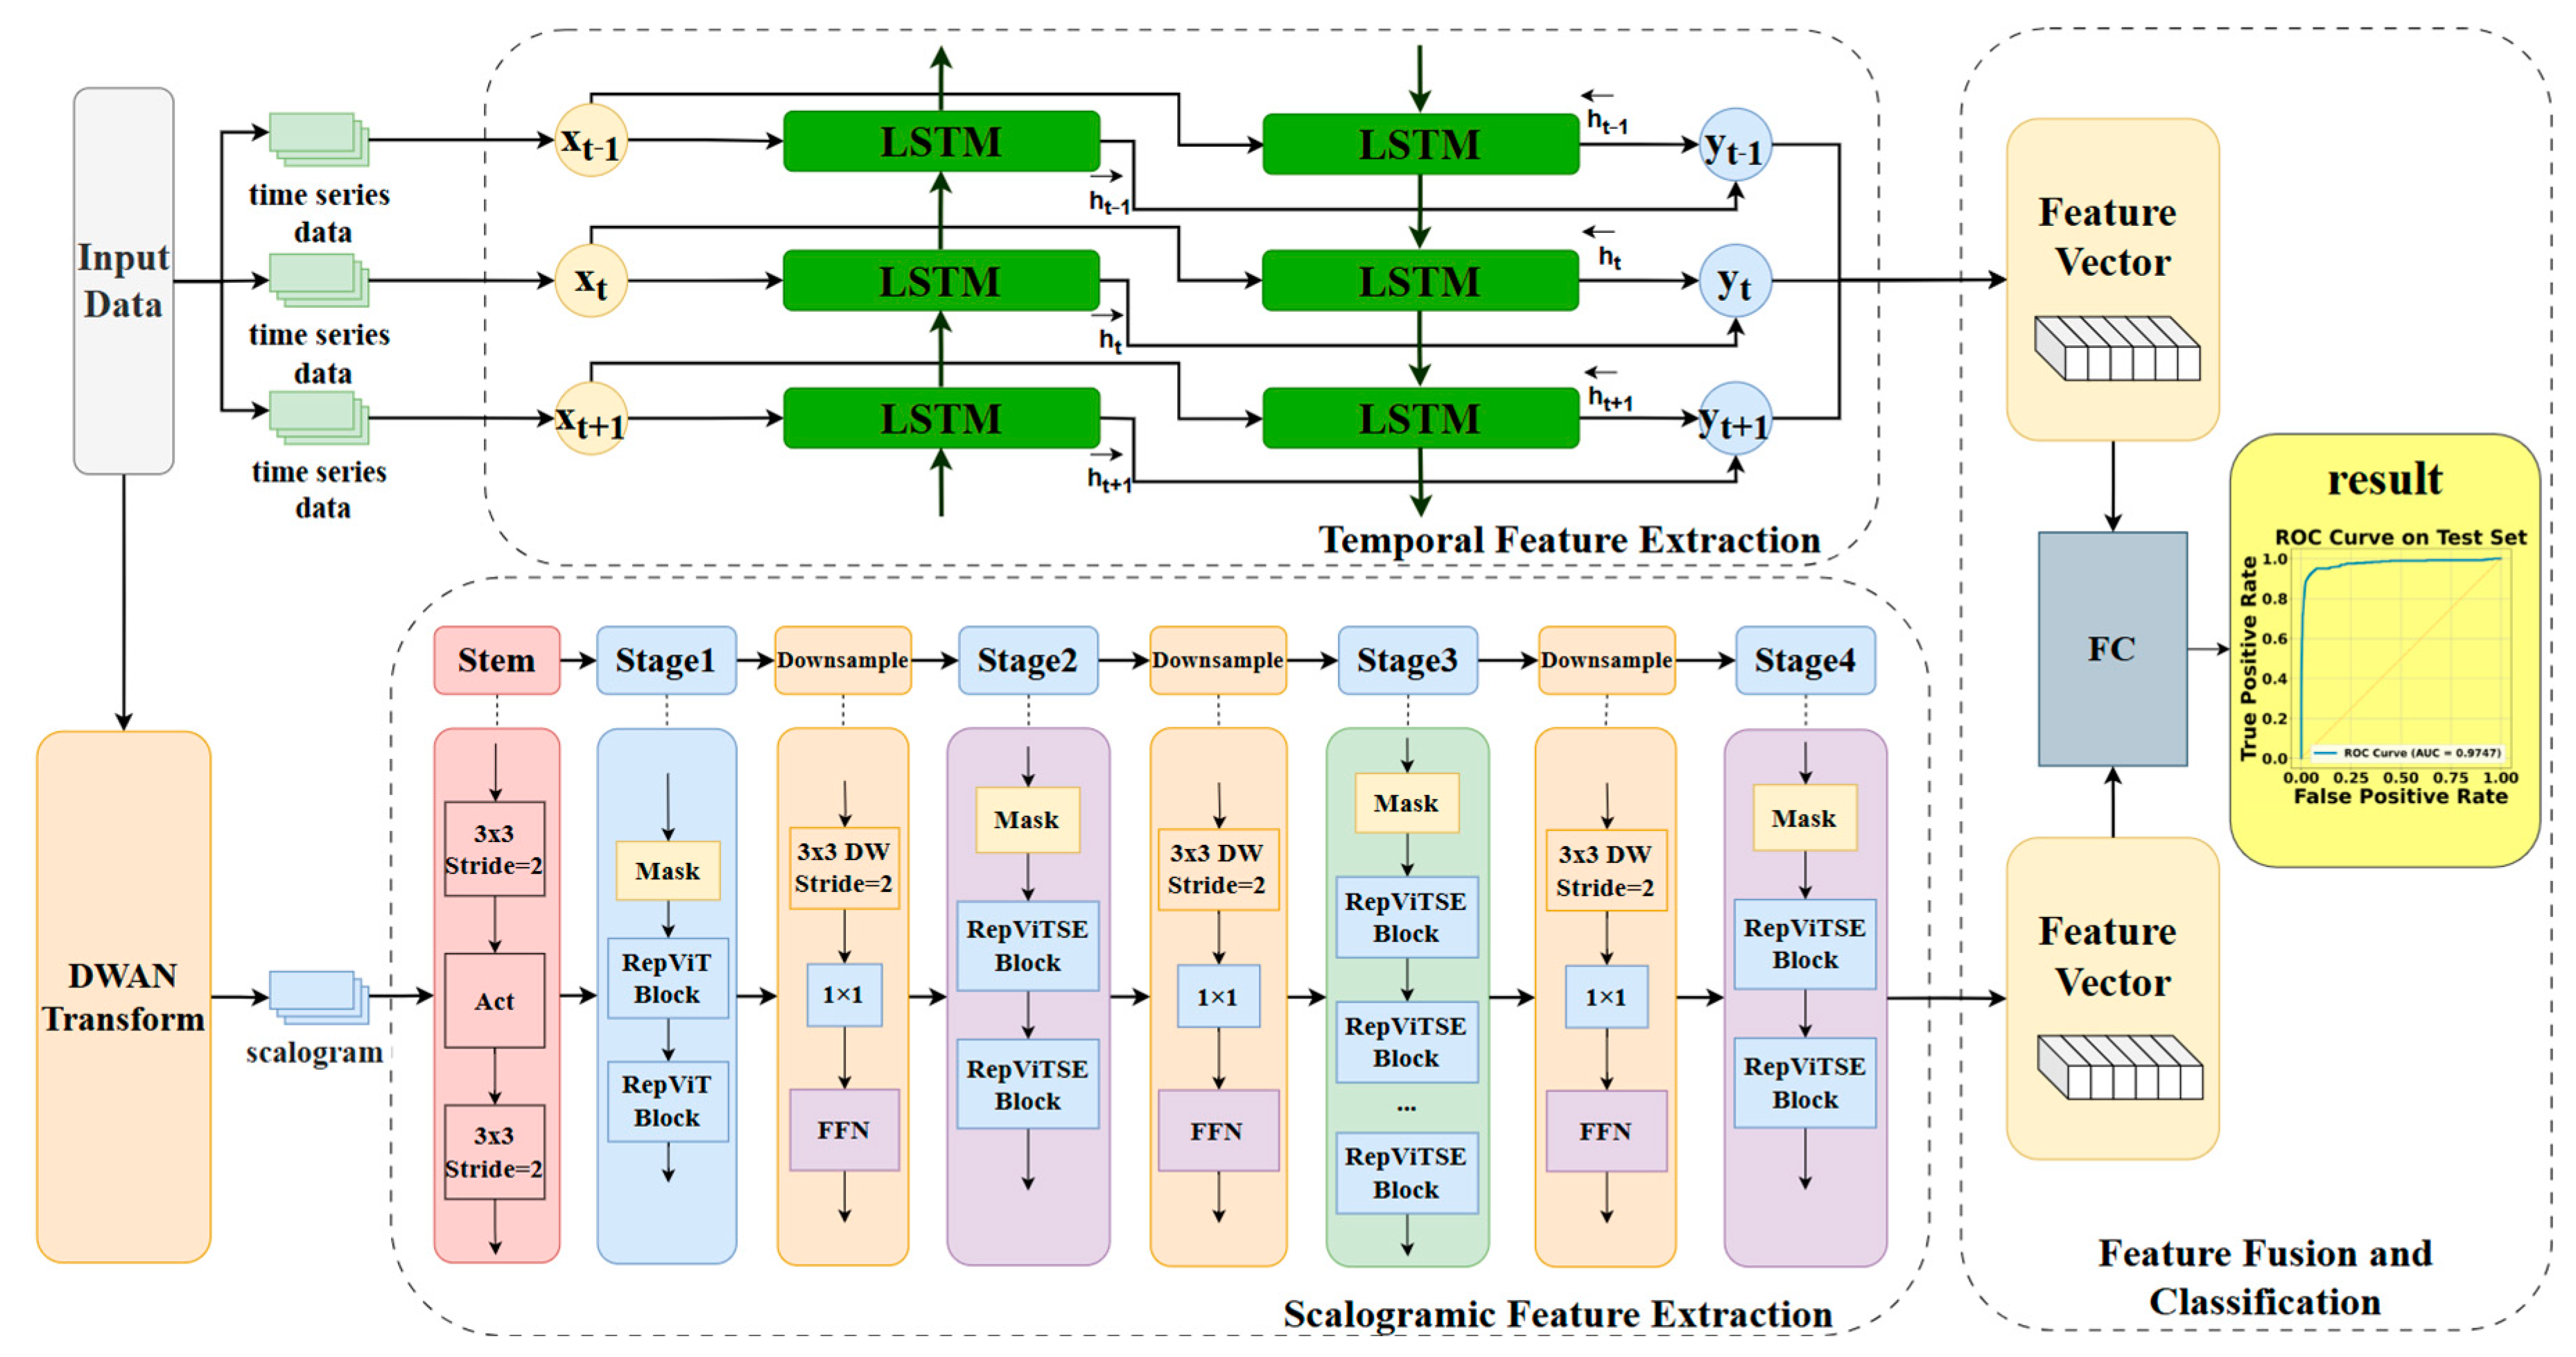
In order to better detect power theft behaviors, this paper proposes a multimodal electricity theft detection model named TSFPTD, which integrates temporal and spectral features. This model consists of three modules: explicit feature extraction of temporal data, implicit feature extraction of scalogram, and modal fusion-based electricity theft identification. The composition of the TSFPTD model is illustrated in the following Figure 5.
Bidirectional Long Short-Term Memory (Bi-LSTM) networks represent a powerful extension of traditional LSTM architectures, specifically designed to capture sequential dependencies from both past and future contexts. The LSTM network inherently addresses the long-term and short-term dependency problems through its sophisticated gating mechanism. This mechanism, comprising forget, input, and output gates, regulates information flow and enables the network to retain relevant patterns over extended time intervals while discarding irrelevant noise—a critical capability for analyzing electricity consumption data that exhibits both periodic daily patterns and long-term seasonal trends [18].
The Bi-LSTM architecture simultaneously encodes the input user time series data in both forward and backward directions of the sequence, enabling it to utilize both past and future information at each temporal moment. This bidirectional processing is particularly advantageous for anomaly detection in time series data with preceding and subsequent context relationships, such as the sudden consumption changes characteristic of electricity theft events. When a potential theft event occurs, the bidirectional nature allows the model to correlate the anomaly with consumption patterns both before the event (to verify consistency with historical behavior) and after the event (to detect suspicious recovery patterns), thereby reducing false positives from temporary legitimate fluctuations. Furthermore, it inherits and enhances the long-term dependency modeling ability of standard LSTM, enabling superior capture of periodicity, long-term trends, and sudden anomalies in regional user electricity consumption time series.
For an input sequence {x1, x2 …, xT} of length T, Bi-LSTM consists of a set of forward LSTMS (from t = 1 to T) and a set of backward LSTMS (from t = T to 1). At any time step t, the forward LSTM generates the hidden sequence h t , the backward LSTM generates the hidden sequence h t . The final feature vector of the user’s electricity consumption time-series data can be obtained by concatenating h t and h t :
h t = c o n c a t ( h t , h t )
The fused hidden state h t fully reflects the explicit feature vector of the user’s electricity consumption time-series data, laying the foundation for subsequent feature fusion with the synchronous scalogram features.
RepViT [19] is a lightweight vision Transformer architecture designed for efficient visual reasoning scenarios. It has good recognition effect for image classification, defect detection, small object recognition and other tasks, but exhibits poor detection performance on scalograms, because the wavelet scalograms may have a large number of background regions or low energy regions, leading to high information noise, dilution of valid features, and dispersion of model attention. In the detection of electricity theft, anomalies may only exist in individual time slices or individual frequency components, and the original RepViT lacks explicit spatial guidance, which is easy to focus on normal areas and cannot highlight the importance of abnormal areas, wasting computing power in irrelevant areas, and thus reducing generalization ability. When the abnormal regions are excessively small, they may be overlooked by the convolution-pooling and attention modules of the original RepViT.
To address these limitations, this paper introduces a mask mechanism to enhance RepViT. Experimental results demonstrate that the improved model, Mask-RepViT, achieves excellent recognition performance on scalograms of electricity theft behavior. Specifically, a soft mask corresponding to each stage’s resolution is inserted at the entrance of every stage. This mechanism explicitly emphasizes critical regions in the scalogram—such as abrupt energy changes, high-frequency transient fluctuations, and low-frequency anomalous waveforms—thereby significantly strengthening the model’s ability to focus on abnormal areas. Moreover, inserting a mask at the entrance of stage1 effectively suppresses background or noise regions in the Stem output, reducing the interference of irrelevant information in subsequent feature extraction modules. This enables the model to concentrate on task-relevant structural regions from the early stages of processing. By preventing reliance on local noise, the mask encourages the model to learn complete patterns from partially visible structures, enhancing robustness against noise, deformation, and brightness variations. Furthermore, the mask mechanism compels RepViT to depend not on isolated local features but on the global time–frequency structure, which helps mitigate overfitting and improves generalization.
The mask parameters are learnable. Like convolution kernels, their weights are updated during training via backpropagation based on task loss. Through exposure to numerous training samples, the model gradually learns to identify regions critical for distinguishing between normal and abnormal time–frequency patterns, assigning higher weights to these areas. Conversely, weights corresponding to background or noise regions are automatically suppressed. This yields an adaptive feature selection capability—dynamically emphasizing informative regions while suppressing irrelevant ones. The resulting learnable spatial attention mechanism endows the improved RepViT with enhanced discriminative power and robustness in scalogram-based anomaly detection tasks.
After incorporating the mask mechanism, the input of each stage becomes:
X i = X i M i
where X i denotes the input feature map of the i-th stage, and M i is a soft mask with the same resolution as the feature map. After multiplying X i and M i element-wise, the resulting X i is used as the actual input for each stage.
After passing through all the RepViT stages, the initial feature map X 0 outputs the feature label map:
F l a s t = R e p V i T ( X 0 )
Then, the entire four-dimensional feature map is directly flattened into a one-dimensional vector, resulting in the implicit feature z of the synchronous spectral modal space:
z = F l a t t e n ( F l a s t )
After obtaining the implicit features of the synchronous spectral mode space, they can be concatenated and fused with the explicit features from the time series data to form the fused vector:
z c a t = C o n c a t ( z b , z r )
Then, the fused vector is fed into the fully connected layer for binary classification, obtaining the final judgment result.
In the electricity theft detection task of this paper, the improved Mask-RepViT is employed to classify and recognize time–frequency images derived from the power time series data via wavelet transformation. Conventional convolutional networks often focus on the recognition of local texture patterns when dealing with such scalograms, but struggle to capture global energy distribution and long-range dependency features. In contrast, the enhanced Mask-RepViT can better understand the coupling relationships of electrical signals across different time and frequency scales by introducing the Transformer-based feature modeling mechanism and the mask mechanism. The hierarchical channel configuration and attention-based feature aggregation of the improved RepViT enable the model to extract more discriminative spatial features when distinguishing between scalograms of normal users and electricity theft users, such as the concentrated distribution of abnormal load changes in the frequency band, the mutation areas of the energy spectrum, and periodic abnormal patterns.
In addition, the lightweight characteristic of the improved Mask-RepViT makes it suitable for edge computing and mobile deployment scenarios, and can achieve high-precision real-time detection while ensuring low computational resource consumption. In the fusion architecture of the TSFPTD model proposed in this paper, Mask-RepViT serves as the spectral branch model, complementing the time-series features extracted by Bi-LSTM. Mask-RepViT captures the distribution patterns of abnormal electricity consumption behavior in scalograms from the spatial domain, while Bi-LSTM models the dynamic evolution features of the user’s historical behavior from the time domain. At the feature representation level, the two focus on “spatial abnormal patterns” and “temporal behavior evolution” respectively, thus forming a multi-modal collaborative representation across the time and frequency domains.
During feature fusion, high-dimensional feature vectors are extracted independently from the Mask-RepViT and Bi-LSTM branches, then integrated into a unified representation through vector concatenation. This fused vector encapsulates both time–frequency structural information and sequential dynamic characteristics, offering a comprehensive description of each user’s overall electricity consumption behavior.
After fusion, the obtained fused feature vector is fed into the classifier composed of the fully connected layer for end-to-end training. The fully connected layer performs further mapping and reorganization of the fused features through linear transformation and non-linear activation functions, thereby exploring the potential high-order correlations between multimodal representations. Ultimately, the classifier outputs the corresponding binary classification prediction result, achieving accurate discrimination between normal users and electricity theft users. This multimodal feature fusion and joint learning mechanism substantially enhances the model’s discriminative capability on complex electricity consumption behavior patterns.

3. Results and Discussion

3.1. Experimental Design

In order to enable the multimodal electricity theft detection model TSFPTD, which integrates temporal and spectral features, to efficiently detect power theft, the training task of this model is carried out on the Google Kaggle platform (version 2.0.0). Kaggle provides a cloud-based, GPU-accelerated environment that facilitates rapid model training and evaluation. The software environment comprised Python 3.10 and PyTorch version 2.6.0 with CUDA 12.4 support. To assess the performance of TSFPTD, we employed standard evaluation metrics including accuracy (ACC), precision, recall, F1-score, and area under the ROC curve (AUC).

3.2. Dataset and Data Preprocessing

The experiments were conducted using the SGCC power theft detection dataset, released by the State Grid Corporation of China. This dataset spans from 1 January 2014 to 31 October 2016, and comprises data from 42,372 users, categorized into two groups: electricity theft users and non-theft users. Specifically, it includes 38,757 non-theft users (approximately 91.6% of the dataset) and 3615 theft users (approximately 8.4% of the dataset). The data are sourced from real-world power networks and reflect authentic consumption patterns along with potential theft behaviors. Considering the issue of missing values in the dataset, we adopted data preprocessing techniques to handle these missing values. Specifically, instead of relying on a single missing value imputation strategy, we combined three methods: linear interpolation, forward/backward filling, and mean imputation. Linear interpolation was applied to fill missing values in continuous time-series segments; forward/backward filling was used to handle small gaps at sequence boundaries or consecutive missing entries; and mean imputation was adopted for features with extensive missing data. This multi-method approach ensured data integrity and consistency while minimizing the impact of missing values on model training, thereby enhancing the stability and reliability of the experimental results.

3.3. Evaluation on the SGCC Dataset

After preprocessing the experimental data, this paper divided the SGCC dataset into training set, validation set and test set in a ratio of 7:2:1. The model was trained in the experimental environment described in Section 3.1, and the test set was used to evaluate the model. The electricity theft detection results of the TSFPTD model are shown in Table 1.
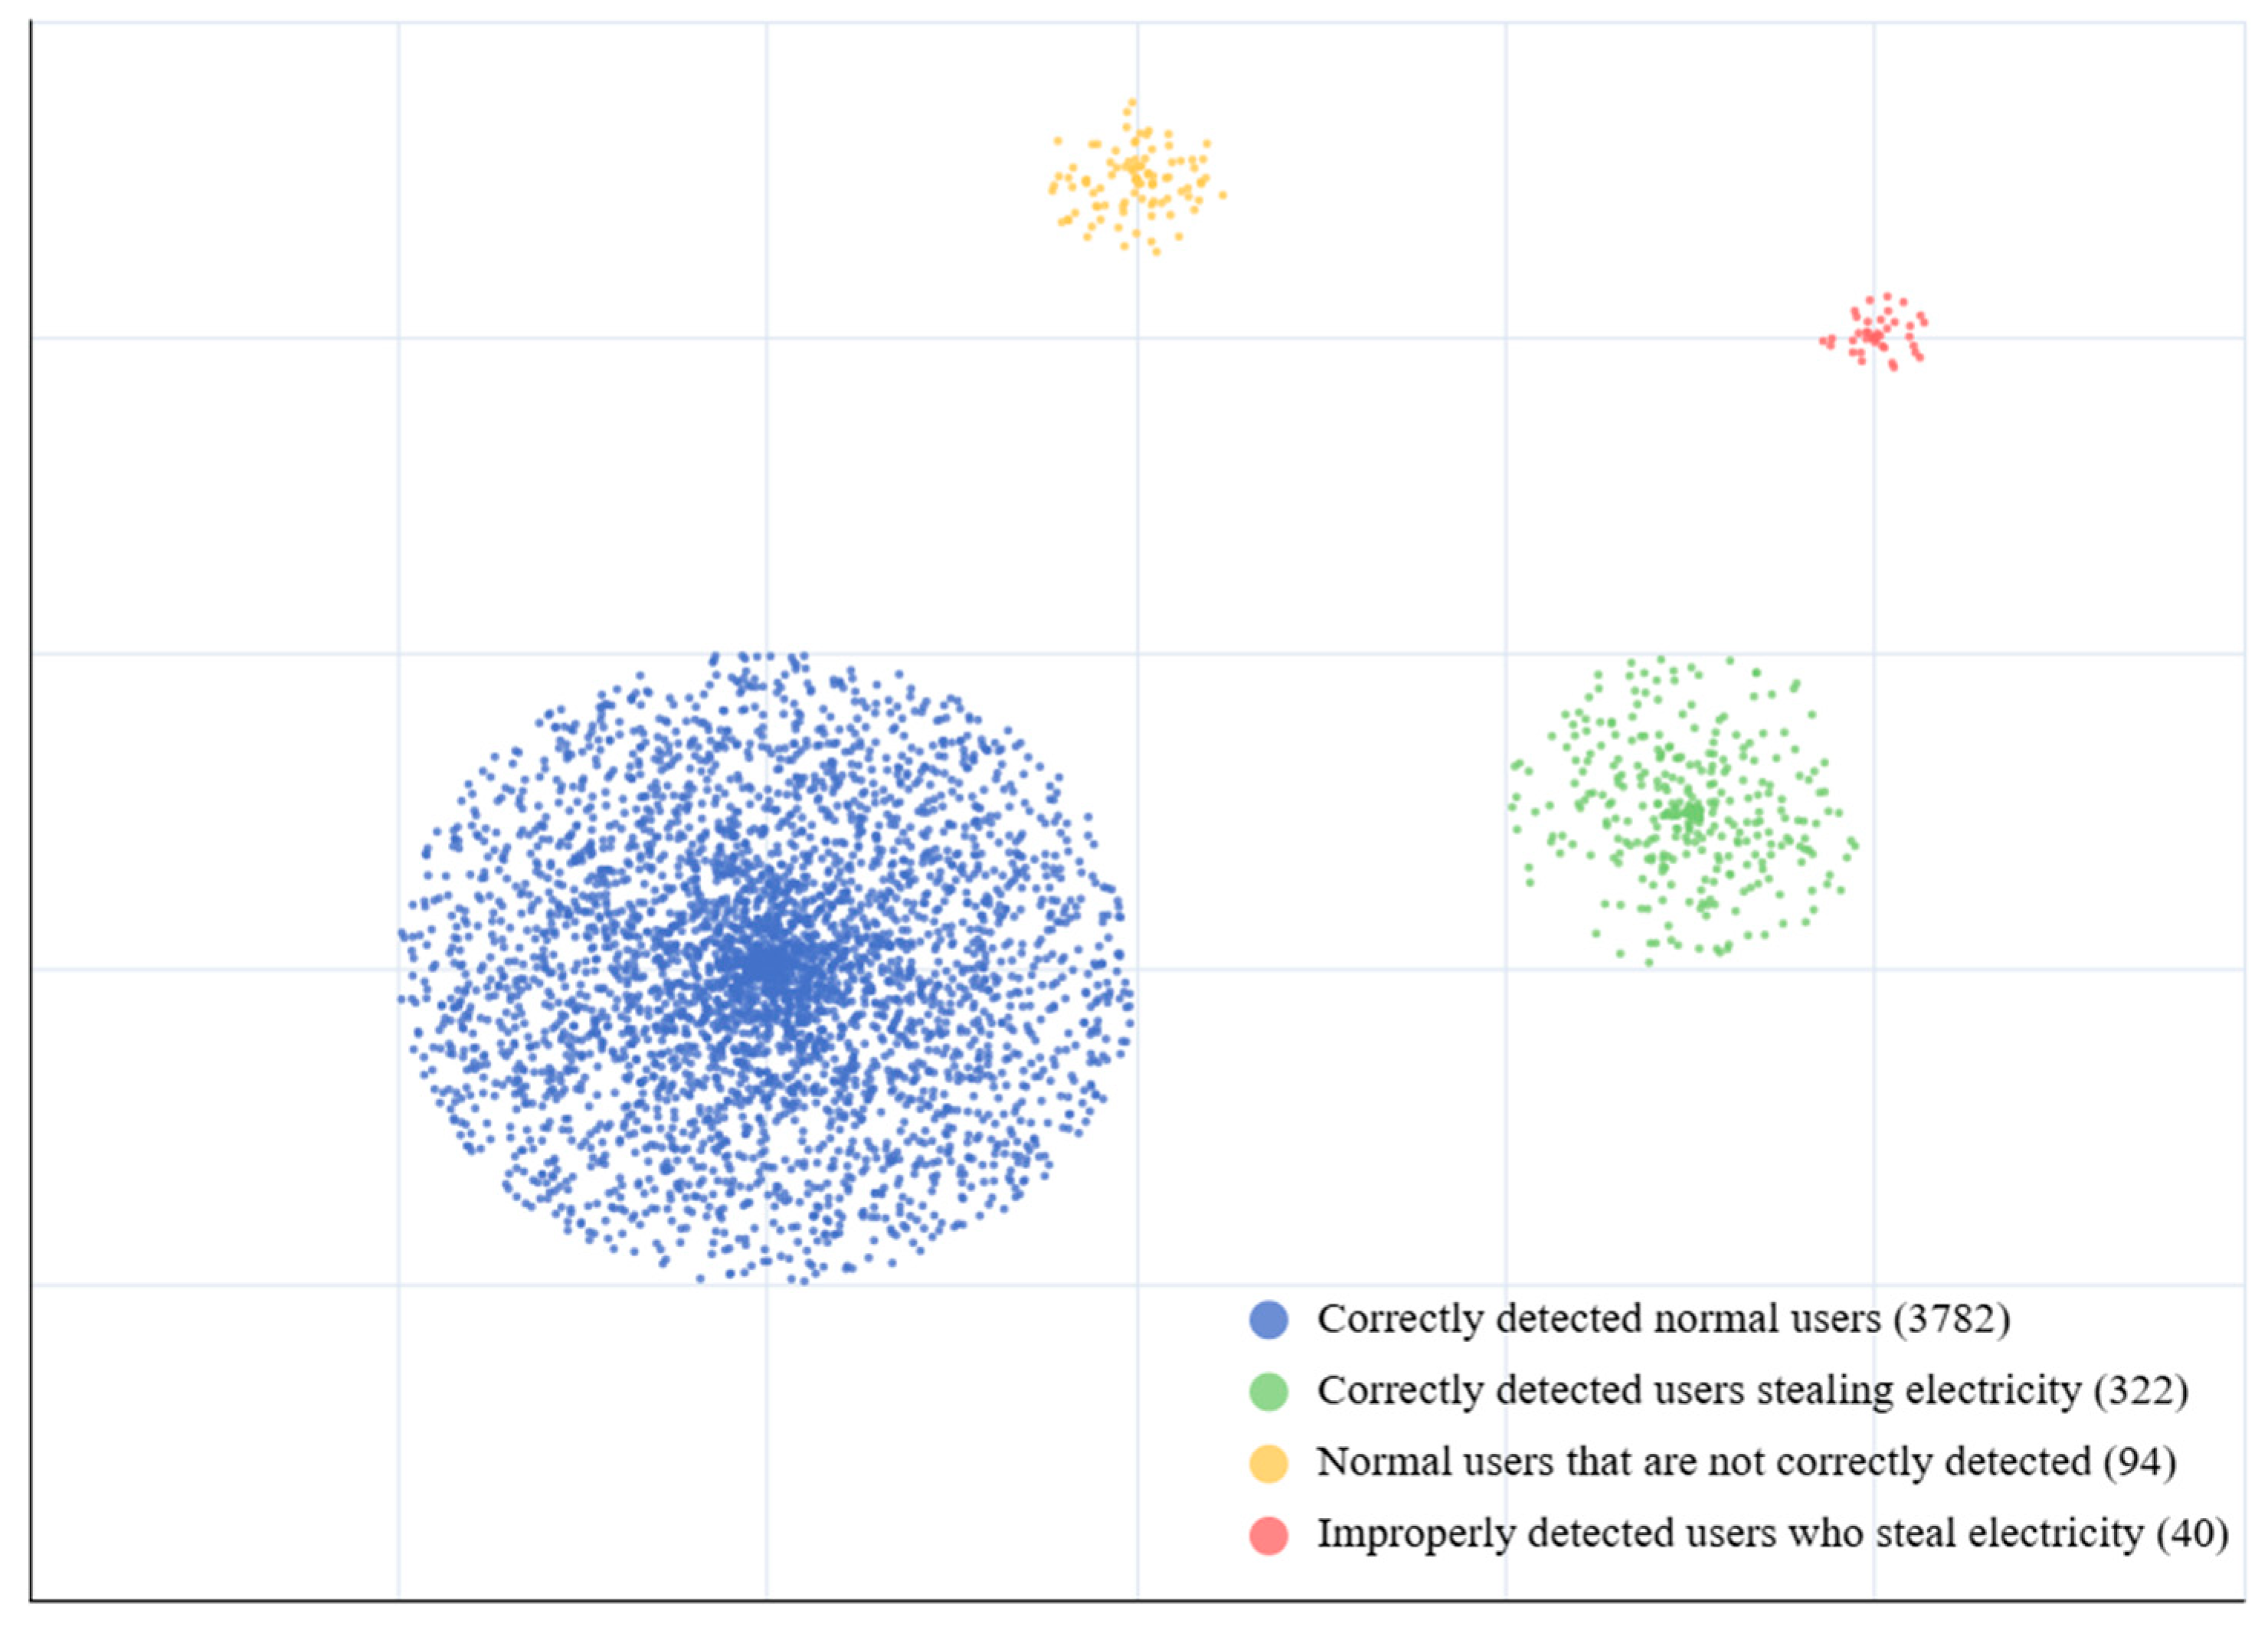
The test set comprises 3876 normal users and 362 electricity theft users. The TSFPTD model correctly identified 3782 normal users and successfully detected 322 theft users. In terms of misclassifications, 94 normal users were erroneously flagged as electricity thieves, while 40 actual theft users remained undetected.
In order to better demonstrate the electricity theft detection performance of the TSFPTD model, this paper conducts a cluster analysis on the experimental results, and obtains the following clustering effects, as shown in Figure 6.
To comprehensively evaluate the efficacy and efficiency of the proposed model, we conducted quantitative assessments on the test set. The model achieves an error rate of 3.17%, corresponding to a classification accuracy of 96.83%, which demonstrates its strong discriminative capability in identifying electricity theft behaviors. In terms of computational complexity, the proposed framework requires 2.4869 GFLOPs per inference, reflecting a moderate operational burden suitable for practical deployment. The average inference time is measured at 17.8104 ms per sample on an NVIDIA Tesla P100 GPU, indicating that the model can process approximately 56 samples per second and is well-suited for real-time or near-real-time monitoring applications. Additionally, the model comprises 14.329 million parameters, striking a balance between representational capacity and memory footprint.
To evaluate the effectiveness of the proposed method, we compared it with several currently highly performing time series classification methods for electricity theft detection, ensuring the validity of the proposed method in different scenarios.
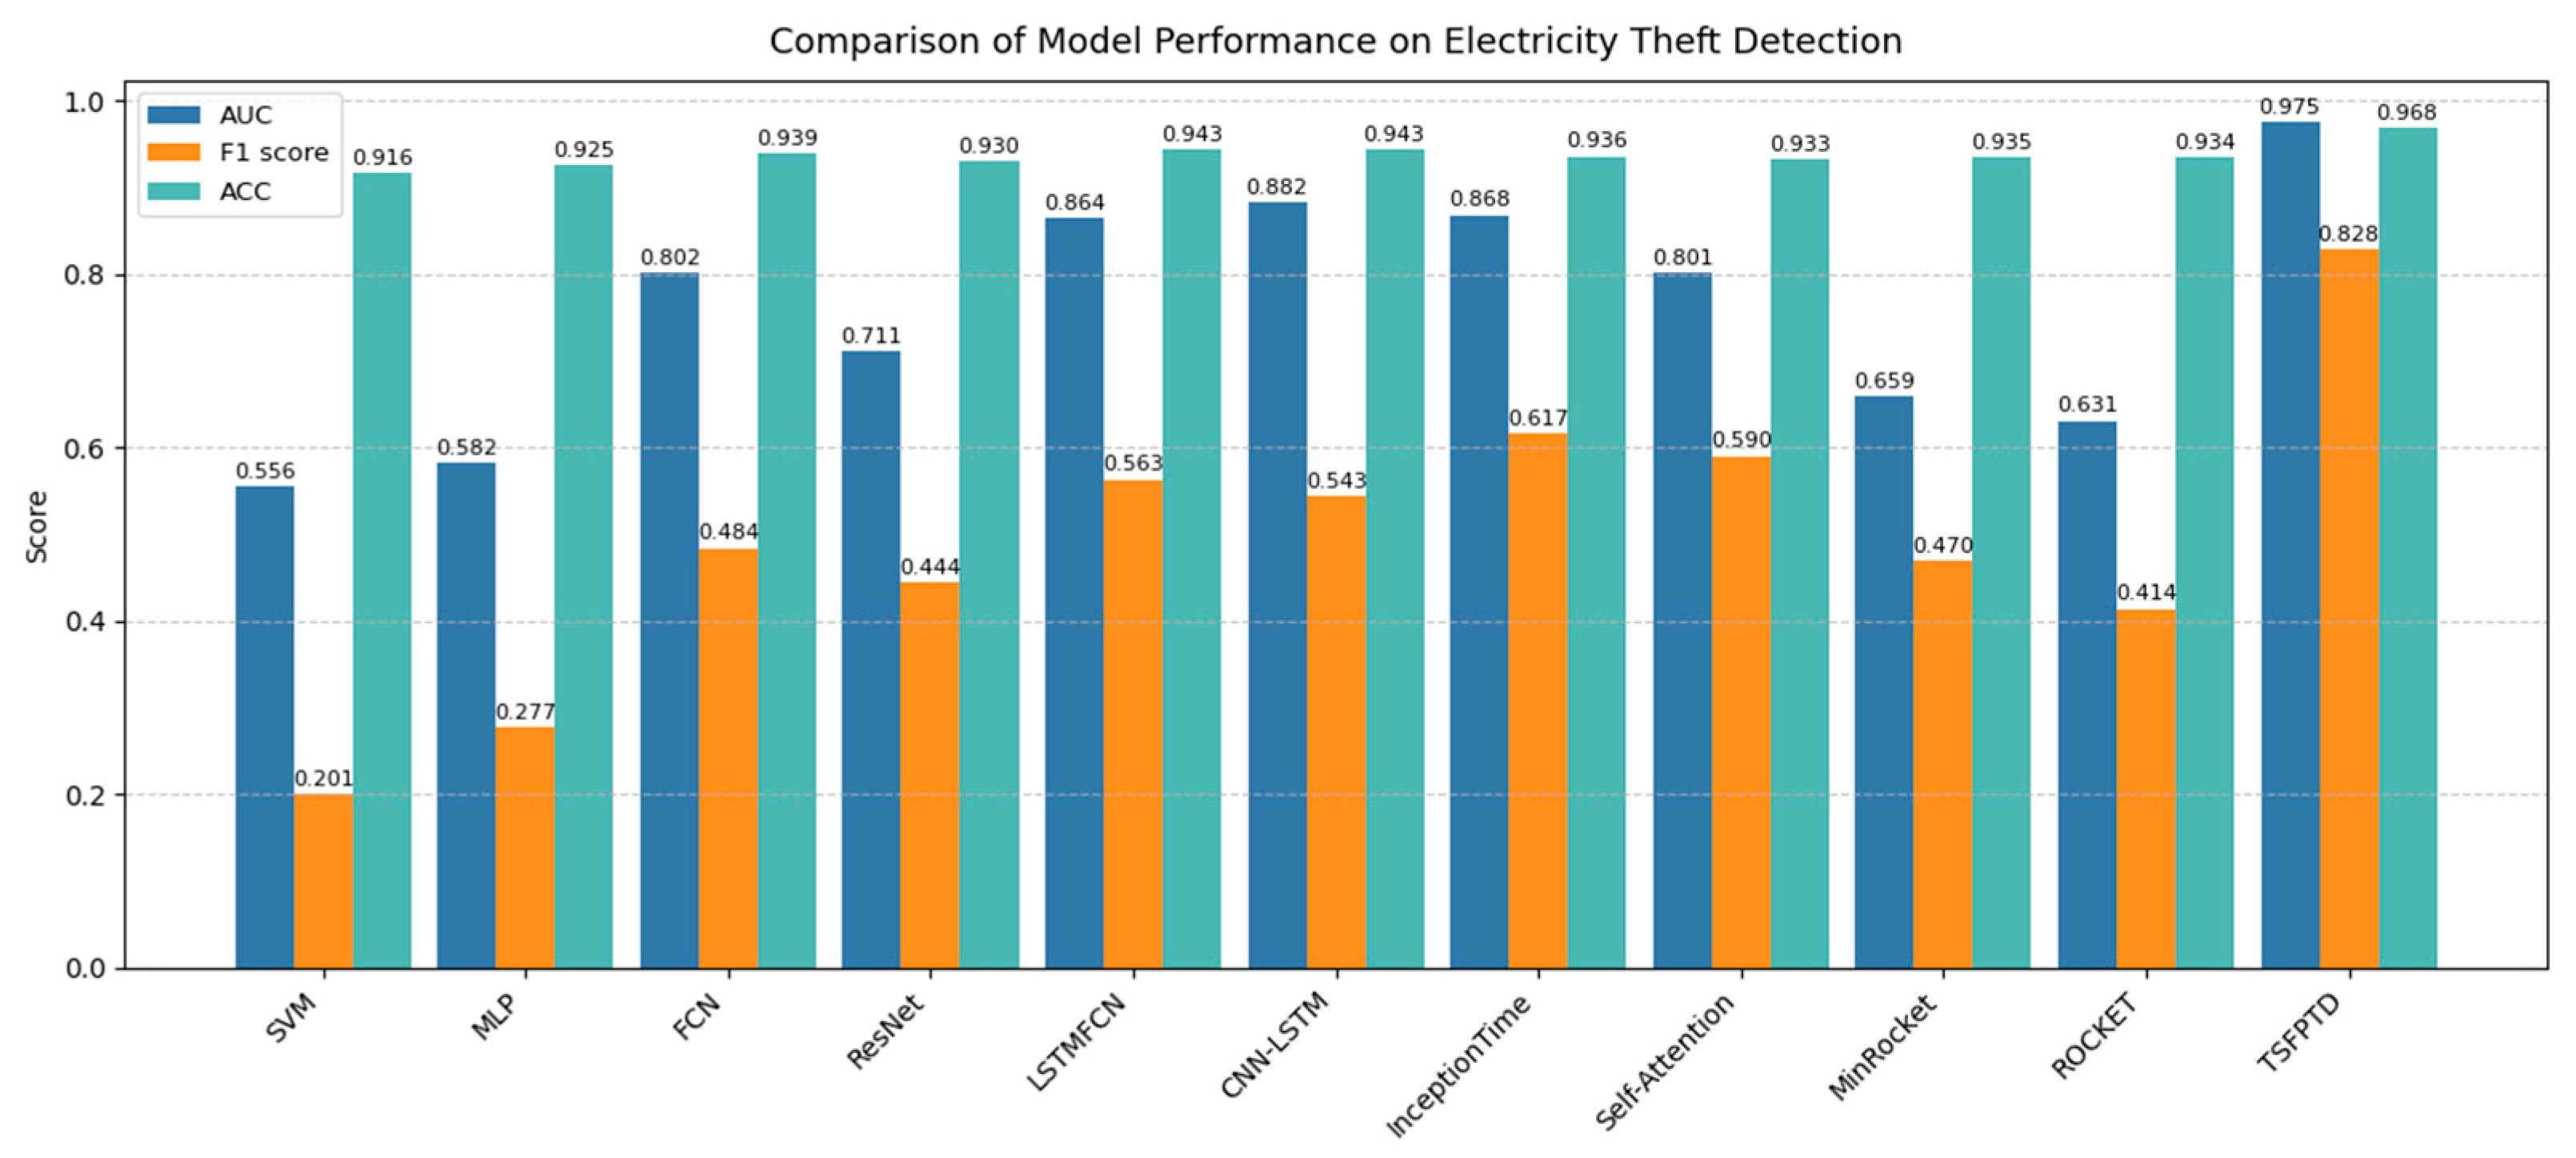
We compared multiple methods ranging from traditional machine learning to deep learning, including SVM, MLP, FCN, ResNet, CNN-LSTM, and DGRGNN, to assess the effectiveness of our proposed method, as shown in Table 2.
Results indicate that the proposed TSFPTD method achieves superior performance compared to existing approaches. Relative to the strong baseline InceptionTime, TSFPTD improves test-set accuracy by 3.23%, AUC by 10.67%, and F1-score by 21.07%. This significant enhancement can be attributed to the core innovation of our model: the joint exploitation of dynamic temporal patterns and structural image features for detection. Specifically, the Bi-LSTM module captures long-term trends, periodic variations, and behavioral dependencies in the time series, while the improved Mask-RepViT extracts local transient patterns, spatial textures, and global structures from the spectral representations. The synergistic integration of temporal and spectral modalities enables the model to achieve robust and accurate detection performance.
A closer examination of the performance metrics in Figure 7 reveals why our multimodal approach is particularly effective for electricity theft detection. The most striking result is the disproportionate gain in F1-score—an improvement of 21.07% over InceptionTime, which is substantially larger than the relative increase in accuracy (3.23%). This marked disparity indicates that TSFPTD does not simply improve overall correctness, but fundamentally recalibrates the trade-off between precision and recall. InceptionTime, as a univariate time-series model, relies solely on sequential patterns and struggles to distinguish theft-induced fluctuations from normal consumption noise, leading to either missed detections or excessive false alarms. By contrast, TSFPTD’s spectral branch offers a complementary perspective, transforming transient irregularities into distinct textural signatures that are readily separable in the time–frequency domain. This cross-modal validation mechanism enables anomalies to be corroborated across both temporal and spectral representations, simultaneously reducing false negatives and false positives—which explains the marked improvement in F1-score and the robust overall performance of our method.

3.4. Ablation Experiment

In the experimental setup of this study, the original SGCC dataset first underwent missing value imputation to ensure data completeness and quality. The SMOTE algorithm was subsequently applied to the training set to oversample the minority class—electricity theft users—thereby increasing the number of theft samples to equal that of normal users and effectively mitigating class imbalance. This preprocessing step strengthened the model’s ability to learn from minority class instances, reduced the risk of overfitting, and ultimately enhanced generalization performance. To quantify the specific contribution of SMOTE oversampling, an ablation study was designed, comparing the performance of the Bi-LSTM and Mask-RepViT models with and without SMOTE application, as shown in Table 3 below.
When the original data was oversampled without using the SMOTE method and only the missing values were handled before being used to train the model, the standalone Bi-LSTM model achieved an accuracy of 0.9155 and an AUC of 0.7164, while the standalone Mask-RepViT model achieved an accuracy of 0.8849 and an AUC of 0.6625. The relatively low AUC values for both models indicate limited capability in distinguishing between positive and negative samples. Although the accuracy figures appeared moderately high, the inspection of the detection results revealed that most electricity theft users were misclassified as normal users. This phenomenon is attributable to the severe class imbalance inherent in the original dataset, which led to model overfitting and produced predictions heavily biased toward the majority class of normal users.
After applying SMOTE oversampling to the training set, the standalone Bi-LSTM model yielded an accuracy of 0.9122 and an AUC of 0.9237, while the standalone Mask-RepViT model achieved an accuracy of 0.9339 and an AUC of 0.9617. Compared to the results without SMOTE, the Mask-RepViT model exhibited improved accuracy in discriminating between normal users and electricity thieves. Although the accuracy of the Bi-LSTM model decreased marginally by 0.0033, the overfitting phenomenon was substantially alleviated. Both models demonstrated marked improvements in AUC, reflecting significantly enhanced ability to distinguish between positive and negative samples. Furthermore, examination of the saved test result files confirmed that, unlike the previous scenario, the majority of theft users were no longer misclassified as normal users.
SMOTE addresses class imbalance by generating synthetic samples for the minority class: for each selected minority instance, it identifies several k-nearest neighbors (typically based on Euclidean distance) and creates new samples along the line segments connecting the instance to these neighbors through random interpolation. This approach enriches the minority feature space with plausible variations rather than simply duplicating existing samples. This substantial improvement in AUC—from 0.7164 to 0.9237 for Bi-LSTM and from 0.6625 to 0.9617 for Mask-RepViT—demonstrates that SMOTE effectively addresses the fundamental limitation imposed by class imbalance: the models’ prior tendency to treat nearly all instances as belonging to the majority class.
To empirically validate the effectiveness of Bi-LSTM for temporal modeling in electricity theft detection, we conducted comparative experiments on the SGCC dataset using Bi-LSTM, Temporal Convolutional Networks (TCNs), and Transformers. As shown in Table 4 below, Bi-LSTM achieves the best overall performance, outperforming both TCNs and Transformers across all key metrics. These results demonstrate that Bi-LSTM is particularly well-suited for this task.
The residential power consumption data in this study constitutes a long-term time series with 1088 daily records, where abnormal electricity consumption is mainly reflected in local temporal mutations rather than global long-range dependencies. The self-attention mechanism in Transformer introduces quadratic computational complexity with respect to sequence length, leading to excessive computational overhead and redundant global modeling for such long sequential data. In contrast, Bi-LSTM adopts a recurrent structure with gating mechanisms, which effectively captures bidirectional contextual dependencies and avoids unnecessary attention dispersion. For TCN, although it can extract local features via dilated convolutions, its fixed receptive field limits adaptability to variable-length abnormal patterns in power consumption. Moreover, the unidirectional causal convolution in TCN cannot fully utilize contextual information before and after abnormal segments. Bi-LSTM, however, dynamically maintains historical and future information through forward and backward hidden states, which is more conducive to identifying subtle and continuous anomalies.
To evaluate the effectiveness of each module of the TSFPTD model, we conducted a series of ablation experiments, and the experimental results are shown in the following Table 5.
In Table 5, “BL” refers to the TSFPTD model excluding the improved Mask-RepViT and DWAN, using Bi-LSTM alone for detection, which illustrates the importance of the implicit features of the synchronous spectral modal space. “MRV-WA” refers to the model excluding Bi-LSTM and using the improved wavelet transform network, which verifies the effectiveness of the explicit features in the time series data space. “TSFPTD-NA” refers to the TSFPTD model using the original wavelet transform, which verifies the effectiveness of the improved wavelet transform network DWAN. “TSFPTD-NM” refers to the TSFPTD model using the original RepViT and the improved wavelet transform network DWAN, which highlights the impact of the mask mechanism on the model.
Table 5 demonstrates the effectiveness of each module in TSFPTD. The experimental results indicate that the complete TSFPTD model exhibits the most outstanding overall performance. The results of “BL” and “MRV-WA” demonstrate that learning the explicit features of the temporal data space alone or the implicit features of the synchronous spectral modal space alone is not as effective as learning both simultaneously and fusing the new spatio-temporal features. The captured features are complementary to each other, and Bi-LSTM can make up for the shortcomings of the improved Mask-RepVIT in time series pattern recognition, while Mask-RepVIT can compensate for the weaknesses of Bi-LSTM in spatial feature expression. Most of the error samples of the two models do not overlap, and the overall error is partially offset after average fusion, thereby improving the overall performance. The result of “TSFPTD-NA” indicates that using the improved wavelet transform network DWAN in the model achieves better performance than the original wavelet transform, verifying that the improved wavelet transform network DWAN can better capture the implicit features of the synchronous spectral modal space. Compared with the original wavelet transform that only performs basic time–frequency decomposition on time series signals, DWAN integrates wavelet transform and multi-head attention mechanism deeply, not only retaining the ability of wavelet transform to extract local time–frequency features, but also leveraging the attention mechanism to emphasize key scales and frequency components, enabling the network to focus on the local time–frequency regions most relevant to classification discrimination, enhancing the model’s ability to learn potential patterns of non-stationary signals. Thus, in complex signal backgrounds, it still maintains a stable and significant feature extraction effect. The result of “TSFPTD-NM” indicates that the Mask-RepVIT can effectively improve the model’s performance, indicating that the mask mechanism plays a crucial role in improving the model’s performance. The masking can effectively suppress irrelevant background and highlight abnormal regions in the early stage of feature extraction, enabling the network to concentrate more representation capabilities on the time–frequency structures most relevant to the classification task. Therefore, its absence will directly lead to insufficient feature expression ability and overall detection performance degradation. By guiding the network to pay more attention to key structures such as abnormal energy mutations and high-frequency local changes, the mask mechanism not only improves the effectiveness of the feature extraction process but also enhances the model’s robustness to noise and interference, thereby bringing a stable and significant improvement in overall performance. In summary, the analysis shows that all modules of the TSFPTD model have made significant contributions to its high accuracy in electricity theft detection.
The above experiments fully verify the effectiveness of the TSFPTD model combined with the architecture, indicating that the model is suitable for the electricity theft detection task.

3.5. Testing of Different Versions of RepViT Models

RepViT has currently been released in multiple versions, and each version performs differently on different datasets and tasks. To evaluate its performance, this study selected five representative and widely applicable versions for training and testing, and evaluated the training results on the SGCC dataset, as shown in Table 6. It can be seen that among the following five versions, repvit_m1_5.dist_450e_in1k performed the most outstandingly in all tests, achieving the highest accuracy rate. Therefore, we decided to adopt this version as the baseline model and fuse the feature vectors extracted by the improved structure of this version with those extracted by Bi-LSTM. Through this approach, we can fully leverage the respective advantages of RepViT and Bi-LSTM to achieve higher classification accuracy and improve the overall performance of the model, ultimately achieving the best intrusion detection effect.

4. Conclusions

This paper proposes a multimodal electricity theft detection model named TSFPTD, which integrates temporal and spectral features. This model fully utilizes the multi-modal feature information of users’ electricity consumption behaviors in both the time domain and the spatial domain. The original time-series electricity consumption data are input into a bidirectional long short-term memory network to analyze long-term and short-term temporal dependencies and obtain explicit features of the time-series data. Through adaptive wavelet transformation to obtain the time–frequency spectrogram corresponding to the time-series signal and inputting it into the improved Mask-RepViT to extract high-level spatial features, it realizes the deep fusion of temporal and spatial features. This fusion structure can effectively identify potential abnormal patterns in complex, nonlinear, and dynamically changing power data, improving the model’s recognition accuracy and robustness for power theft behaviors. Experimental results on the real-world SGCC dataset demonstrate that TSFPTD substantially outperforms traditional single-modal time-series models across multiple evaluation metrics, achieving an accuracy of 0.9683, an F1-score of 0.8277, and an AUC of 0.9747. These results validate the effectiveness and scalability of the proposed model for electricity theft detection in smart grid applications.
Building on these promising results, future work will extend the proposed framework from a pure detection model toward a decision-support tool for resilient smart grid operations. Specifically, we plan to integrate the detection outputs—such as identified anomalous patterns and affected grid segments—into higher-level resilience enhancement strategies. This could involve leveraging recent advances in coordinated energy–transportation system restoration under extreme events to inform recovery-oriented decision-making [29]. Furthermore, to enhance the model’s practical deployment, we will address real-world grid complexities including load variability, data distribution shifts, and system-level uncertainty [30].

Author Contributions

Conceptualization, S.G. and X.H.; methodology, S.G. and X.H.; software, Z.L. and Q.W.; validation, Z.L.; formal analysis, Z.L.; investigation, Z.L. and Q.W.; resources, Z.W.; data curation, L.Y.; writing—original draft preparation, Z.L. and L.Y.; writing—review and editing, Z.W.; visualization, Q.W.; supervision, Z.W.; project administration, Z.W. and L.Y.; funding acquisition, Z.W. All authors have read and agreed to the published version of the manuscript.

Funding

This project was supported by the Science and Technology Project of State Grid Corporation of China, titled “Research on Construction and Application Technology of Intelligent Multimodal Measurement and Diagnosis Model” (52240025000L-131-ZN).

Data Availability Statement

The dataset used in this paper can be accessed through the following link: https://github.com/henryRDlab/ElectricityTheftDetection (accessed on 5 September 2025).

Conflicts of Interest

Authors Shijie Gao, Xin He and Lufeng Yuan were employed by the company Beijing China-Power Information Technology Co., Ltd. Author Qiang Wang was employed by the company State Grid Heilongjiang Electric Power Co., Ltd. The remaining authors declare that the research was conducted in the absence of any commercial or financial relationships that could be construed as a potential conflict of interest.

References

  1. Stracqualursi, E.; Rosato, A.; Di Lorenzo, G.; Panella, M.; Araneo, R. Systematic review of energy theft practices and autonomous detection through artificial intelligence methods. Renew. Sustain. Energy Rev. 2023, 184, 113544. [Google Scholar] [CrossRef]
  2. Yan, Z.; Peng, L.; Feng, W.; Yang, L.T. Social-Chain: Decentralized Trust Evaluation Based on Blockchain in Pervasive Social Networking. ACM Trans. Internet Technol. 2021, 21, 17. [Google Scholar] [CrossRef]
  3. Li, S.; Han, Y.; Yao, X.; Yingchen, S.; Wang, J.; Zhao, Q. Electricity theft detection in power grids with deep learning and random forests. J. Electr. Comput. Eng. 2019, 2019, 4136874. [Google Scholar] [CrossRef]
  4. Haq, E.U.; Huang, J.; Xu, H.; Li, K.; Ahmad, F. A hybrid approach based on deep learning and support vector machine for the detection of electricity theft in power grids. Energy Rep. 2021, 7, 349–356. [Google Scholar] [CrossRef]
  5. Jindal, A.; Dua, A.; Kaur, K.; Singh, M.; Kumar, N.; Mishra, S. Decision tree and SVM-based data analytics for theft detection in smart grid. IEEE Trans. Ind. Inf. 2016, 12, 1005–1016. [Google Scholar] [CrossRef]
  6. Feng, Z.; Huang, J.; Tang, W.H.; Shahidehpour, M. Data mining for abnormal power consumption pattern detection based on local matrix reconstruction. Int. J. Electr. Power Energy Syst. 2020, 123, 106315. [Google Scholar] [CrossRef]
  7. Ismail, M.; Shaaban, M.F.; Naidu, M.; Serpedin, E. Deep learning detection of electricity theft cyber-attacks in renewable distributed generation. IEEE Trans. Smart Grid 2020, 11, 3428–3437. [Google Scholar] [CrossRef]
  8. Dhaked, D.K.; Dadhich, S.; Birla, D. Power output forecasting of solar photovoltaic plant using LSTM. Green Energy Intell. Transp. 2023, 2, 100113. [Google Scholar] [CrossRef]
  9. Markovska, M.; Gerazov, B.; Zlatkova, A.; Taskovski, D. Electricity theft detection based on temporal convolutional networks with self-attention. In Proceedings of the 2023 30th International Conference on Systems, Signals and Image Processing, Ohrid, Macedonia, 27–29 June 2023; IEEE: New York, NY, USA, 2023; pp. 1–5. [Google Scholar] [CrossRef]
  10. Sun, Y.; Lee, J.; Kim, S.; Seon, J.; Lee, S.; Kyeong, C.; Kim, J. Energy Theft Detection Model Based on VAE-GAN for Imbalanced Dataset. Energies 2023, 16, 1109. [Google Scholar] [CrossRef]
  11. Bai, Y.; Sun, H.; Zhang, L.; Wu, H. Hybrid CNN–Transformer Network for Electricity Theft Detection in Smart Grids. Sensors 2023, 23, 8405. [Google Scholar] [CrossRef]
  12. Hasan, N.; Toma, R.N.; Nahid, A.-A.; Islam, M.M.M.; Kim, J.-M. Electricity Theft Detection in Smart Grid Systems: A CNN-LSTM Based Approach. Energies 2019, 12, 3310. [Google Scholar] [CrossRef]
  13. Djaghloul, C.; Tehrani, K.; Vurpillot, F. Open-Circuit Fault Detection in a 5-Level Cascaded H-Bridge Inverter Using 1D CNN and LSTMJ. Energies 2025, 18, 5004. [Google Scholar] [CrossRef]
  14. Nirmal, S.; Patil, P.; Raja Kumar, J.R. CNN-AdaBoost based hybrid model for electricity theft detection in smart grid. e-Prime Adv. Electr. Eng. Electron. Energy 2024, 7, 100452. [Google Scholar] [CrossRef]
  15. Guo, T.; Zhang, T.; Lim, E.; Lopez-Benitez, M.; Ma, F.; Yu, L. A review of wavelet analysis and its applications: Challenges and opportunities. IEEE Access 2022, 10, 58869–58903. [Google Scholar] [CrossRef]
  16. Siami-Namini, S.; Tavakoli, N.; Siami Namin, A. A Comparative Analysis of Forecasting Financial Time Series Using ARIMA, LSTM, and BiLSTM EB/OL. arXiv 2019, arXiv:1911.09512. [Google Scholar] [CrossRef]
  17. Lin, W.C.; Tsai, C.F. Missing value imputation: A review and analysis of the literature (2006–2017). Artif. Intell. Rev. 2020, 53, 1487–1509. [Google Scholar] [CrossRef]
  18. Kaplan, H.; Tehrani, K.; Jamshidi, M. Fault Diagnosis of Smart Grids Based on Deep Learning Approach. In Proceedings of the 2021 World Automation Congress (WAC) 2021, Taipei, Taiwan, 1–5 August 2021; pp. 164–169. Available online: https://ieeexplore.ieee.org/document/9559474 (accessed on 12 February 2026).
  19. Wang, A.; Chen, H.; Lin, Z.; Han, J.; Ding, G. RepViT: Revisiting Mobile CNN From ViT Perspective. arXiv 2024, arXiv:2307.09283. [Google Scholar]
  20. Hur, S.B.; Lee, K.M. Image-coded time series classification with MLP-mixer. In Proceedings of the 2022 Joint 12th International Conference on Soft Computing and Intelligent Systems and 23rd International Symposium on Advanced Intelligent Systems (SCIS&ISIS), Ise, Japan, 29 November–3 December 2022; pp. 1–2. [Google Scholar] [CrossRef]
  21. Wang, Z.; Yan, W.; Oates, T. Time series classification from scratch with deep neural networks: A strong baseline. In Proceedings of the 2017 International Joint Conference on Neural Networks, Anchorage, AK, USA, 14–19 May 2017; pp. 1578–1585. [Google Scholar] [CrossRef]
  22. Zou, X.; Wang, Z.; Li, Q.; Sheng, W. Integration of residual network and convolutional neural network along with various activation functions and global pooling for time series classification. Neurocomputing 2019, 367, 39–45. [Google Scholar] [CrossRef]
  23. Rücker, N.; Pflüger, L.; Maier, A. Hardware failure prediction on imbalanced times series data. J. Digit Imaging 2021, 34, 182–189. [Google Scholar] [CrossRef]
  24. Fawaz, H.I.; Lucas, B.; Forestier, G.; Pelletier, C.; Schmidt, D.F.; Weber, J.; Webb, G.I.; Idoumghar, L.; Muller, P.-A.; Petitjean, F. InceptionTime: Finding AlexNet for time series classification. Data Min. Knowl. Discov. 2020, 34, 1936–1962. [Google Scholar] [CrossRef]
  25. Finardi, P.; Campiotti, I.; Plensack, G.; de Souza, R.D.; Nogueira, R.F.; Pinheiro, G.R.; Lotufo, R. Electricity theft detection with self-attention. arXiv 2020, arXiv:2002.06219. [Google Scholar] [CrossRef]
  26. Zhuang, W.; Jiang, W.; Xia, M.; Liu, J. Dynamic generative residual graph convolutional neural networks for electricity theft detection. IEEE Access 2024, 12, 42737–42750. [Google Scholar] [CrossRef]
  27. Dempster, A.; Schmidt, D.F.; Webb, G.I. MiniRocket: A very fast (almost) deterministic transform for time series classification. In Proceedings of the 27th ACM SIGKDD Conference on Knowledge Discovery & Data Mining, Virtual, 14–18 August 2021; Association for Computing Machinery: New York, NY, USA, 2021; pp. 248–257. [Google Scholar] [CrossRef]
  28. Dempster, A.; Petitjean, F.; Webb, G.I. ROCKET: Exceptionally fast and accurate time series classification using random convolutional kernels. Data Min. Knowl. Discov. 2020, 34, 1454–1495. [Google Scholar] [CrossRef]
  29. Li, Z.; Sun, H.; Xue, Y.; Li, Z.; Jin, X.; Wang, P. Resilience-Oriented Asynchronous Decentralized Restoration Considering Building and E-Bus Coresponse in Electricity-Transportation Networks. IEEE Trans. Transp. Electrif. 2025, 11, 11701–11713. [Google Scholar] [CrossRef]
  30. Chang, L.; Li, Z.; Tian, X.; Su, J.; Chang, X.; Xue, Y.; Li, Z.; Jin, X.; Wang, P.; Sun, H. A two-stage distributionally robust low-carbon operation method for antarctic unmanned observation station integrating virtual energy storage and hydrogen waste heat recovery. Appl. Energy 2025, 400, 126578. [Google Scholar] [CrossRef]
Figure 1. Multi-modal electricity theft detection process integrating temporal and spectral features.
Electronics 15 01153 g001
Figure 2. DWAN Structure Diagram.
Electronics 15 01153 g002
Figure 3. Time–frequency spectrogram obtained after the time series data undergoes the deep wavelet transformation network.
Electronics 15 01153 g003
Figure 4. Time–frequency spectra of some normal users and electricity thieves: (a) Scalograms of normal users; (b) Scalograms of electricity theft users.
Electronics 15 01153 g004
Figure 5. Multi-modal electricity theft detection model integrating temporal and spectral features: TSFPTD.
Electronics 15 01153 g005
Figure 6. The electricity theft detection effect of the TSFPTD model.
Electronics 15 01153 g006
Figure 7. Comparison of the proposed model with other models.
Electronics 15 01153 g007
Table 1. Electricity Theft Detection Results of the TSFPTD Model.
CategoryNormal UsersTheft Users
Total in test set3876362
Correctly identified3782322
Misidentified9440
Table 2. Performance Comparison of Different Methods for Detecting Electricity Theft.
MethodsAUCF1 ScoreACC
SVM [4]0.5560.2010.916
MLP [20]0.5820.2770.925
FCN [21]0.8020.4840.939
ResNet [22]0.7110.4440.930
LSTMFCN [23]0.8640.5630.943
CNN-LSTM [12]0.8820.5430.943
InceptionTime [24]0.8680.6170.936
Self-Attention [25]0.8010.5900.933
DGRGNN [26]0.859--
MinRocket [27]0.6590.4700.935
ROCKET [28]0.6310.4140.934
TSFPTD (Ours)0.97470.82770.9683
Table 3. Effects of Bi-LSTM and Mask-RepViT with and without SMOTE usage.
Bi-LSTMMask-RepViT
Use SMOTEACCAUCACCAUC
0.91220.92370.93390.9617
Do not use SMOTEACCAUCACCAUC
0.91550.71640.88490.6625
Table 4. Performance Comparison of Bi-LSTM, TCNs, and Transformers.
ModelACCF1PrecisionRecallAUC
Bi-LSTM0.91220.59910.49120.76800.9237
TCNs0.88530.52070.40490.72930.8781
Transformers0.89760.52620.43500.66570.8880
Table 5. Ablation Results of the TSFPTD Model.
ModelACCF1PrecisionRecallAUC
TSFPTD(Ours)0.96830.82770.77400.88950.9747
BL0.91220.59910.49120.76800.9237
MRV-WA0.94870.74560.64760.87840.9661
TSFPTD-NA0.95940.77480.73630.81760.9672
TSFPTD-NM0.95490.76090.69560.83970.9667
Table 6. Test Results of Different Versions of RepViT.
RepViT VersionAccF1PrecisionRecallAUC
repvit_m0_9.dist_300e_in1k0.92760.67510.54720.88120.9572
repvit_m1.dist_in1k0.91510.64360.50150.89780.9597
repvit_m1_5.dist_450e_in1k0.93390.69430.57400.87850.9617
repvit_m2.dist_in1k0.93370.69620.57190.88950.9632
repvit_m2_3.dist_450e_in1k0.92800.68390.54730.91160.9641
Disclaimer/Publisher’s Note: The statements, opinions and data contained in all publications are solely those of the individual author(s) and contributor(s) and not of MDPI and/or the editor(s). MDPI and/or the editor(s) disclaim responsibility for any injury to people or property resulting from any ideas, methods, instructions or products referred to in the content.