


Abstract
The development of reliable smartphone-based methods for vascular assessment is limited by the scarcity of large-scale, high-quality, real-world photoplethysmography (PPG) datasets. This work introduces two openly reusable smartphone camera-based PPG datasets curated from over one million unconstrained recordings, designed to support vascular morphology analysis and vascular aging research. The first dataset comprises approximately 5000 high-fidelity PPG heartbeat templates labeled into four morphological classes based on dicrotic notch characteristics, enabling assessment of arterial waveform structure beyond chronological age. The second dataset contains about 10,000 demographically balanced PPG samples curated for chronological age regression using rigorous subject-level balancing and correlation-based quality control. A standardized processing pipeline is presented, including beat alignment, ensemble averaging, and objective signal acceptance criteria to ensure morphological stability. To validate dataset utility, multiple machine learning models were benchmarked using raw signals, second derivatives, and compact Gaussian representations, achieving classification accuracy up to 90.08% and age prediction error below 10 years. By prioritizing real-world data quality, transparency, and reuse, this work provides a robust foundation for scalable, interpretable, and reproducible research in smartphone-based vascular assessment.
1. Introduction
Cardiovascular diseases (CVDs) remain the leading cause of mortality worldwide, accounting for approximately 32% of all deaths each year [1]. Although it is estimated that 80–90% of CVD cases could be prevented through early identification and modification of risk factors, large-scale implementation of preventive screening remains limited, particularly outside clinical environments and in resource-constrained settings [2]. Existing cardiovascular risk assessment tools rely predominantly on chronological age and population-level statistics, providing only indirect insight into individual vascular condition and often failing to capture early functional deterioration. While cardiac activity is routinely assessed using electrocardiography, direct and continuous assessment of vascular health, including arterial stiffness and waveform morphology, is rarely available in everyday monitoring.
Photoplethysmography (PPG) has emerged as a promising non-invasive modality for scalable vascular assessment, enabled by its integration into consumer devices such as smartphones and wearables. PPG waveforms encode physiologically relevant features related to arterial compliance, pulse wave reflection, and vascular aging, offering the potential to move beyond age-based proxies toward direct characterization of vascular condition. However, progress in this area has been constrained by the limited availability of large-scale, high-quality, real-world PPG datasets. Many existing studies rely on small cohorts, controlled laboratory recordings, or synthetic signals, which fail to capture the morphological variability, noise characteristics, and demographic diversity present in unconstrained real-world use.
In this work, we address this gap by introducing two large-scale smartphone camera-based PPG datasets curated from over one million real-world recordings collected under unconstrained conditions. The datasets are designed to support reproducible research in vascular assessment and benchmarking of signal processing and machine learning methods.
- The first dataset comprises approximately 5000 high-fidelity PPG heartbeat templates labeled into four morphological classes based on dicrotic notch characteristics, enabling fine-grained waveform-based assessment of vascular condition independent of chronological age.
- The second dataset contains around 10,000 demographically balanced PPG samples curated for chronological age regression using rigorous subject-level balancing and correlation-based quality control.
Using these datasets, we benchmark a range of deep learning and ensemble models across multiple signal representations, demonstrating the physiological relevance of morphology-driven features and highlighting the limitations of chronological age as a surrogate for vascular health. By prioritizing real-world data quality, transparency, and reuse, this work provides a practical foundation for scalable, interpretable, and reproducible smartphone-based vascular assessment.
2. Background and Related Work
2.1. Clinical Methods for Vascular Health Assessment
Established vascular assessment techniques provide validated measures of vascular structure and function, yet remain limited in scalability and accessibility. Carotid–femoral pulse wave velocity (cfPWV) is widely regarded as the gold standard for non-invasive assessment of arterial stiffness by quantifying aortic pulse wave propagation time. Carotid intima–media thickness (CIMT) enables early detection of atherosclerotic changes through high-resolution ultrasound imaging. Endothelial function is primarily evaluated using flow-mediated dilation (FMD), which uses ultrasound to measure brachial artery diameter changes following transient occlusion [3].
In addition, advanced imaging modalities, including color Doppler ultrasound for hemodynamic assessment, computed tomography (CT) angiography for three-dimensional vascular reconstruction, and magnetic resonance (MR) angiography for radiation-free vessel characterization, offer detailed anatomical and functional insights. However, these methods require specialized equipment, trained personnel, and controlled clinical environments, limiting their feasibility for large-scale population screening, continuous monitoring, or deployment in non-clinical and resource-constrained settings [4]. These limitations motivate the development of non-invasive, low-cost alternatives capable of capturing vascular health outside traditional healthcare infrastructures.
PPG waveforms encode physiologically relevant information related to arterial stiffness and wave reflections, both recognized as non-invasive cardiovascular risk indicators. Arterial stiffness, a key predictor of cardiovascular events, can be estimated using the Stiffness Index (SI), which reflects pulse wave velocity and correlates with cfPWV [5,6]. The Augmentation Index (AIx), derived from the PPG waveform, quantifies wave reflection and has been associated with central aortic pressure and left ventricular afterload [4,5]. PPG-derived pulse wave velocity has also been shown to differentiate healthy individuals from patients with hypertension or coronary artery disease, even after accounting for age [3]. These findings demonstrate that PPG morphology reflects cumulative effects of aging, arterial stiffening, blood pressure elevation, and atherosclerotic changes [7,8]. Features such as dicrotic notch timing and amplitude, reflection index, and second derivative parameters therefore encode vascular state information [9,10,11].
Given the limitations of established imaging and stiffness assessment methods, PPG morphology can be interpreted using established cardiovascular models that relate waveform shape to vascular mechanics. In particular, the 3-element Windkessel model [12] describes how arterial compliance (C) and peripheral resistance (R) determine pulse wave propagation and PPG waveform contour. Reduced compliance (increased stiffness) and altered resistance modify pulse wave reflection timing, which manifests as changes in systolic peak width and attenuation or shifting of the dicrotic notch. These physiological mechanisms link our morphological classes to underlying hemodynamic states rather than purely statistical groupings.
The four morphological classes used in this study, originally described in [13] and validated for PPG signals [14], capture progressive attenuation of the dicrotic notch associated with increasing arterial stiffness. In addition to these classes, derived parameters such as SPDP and AIx are provided to facilitate quantitative analysis of vascular state. Controlled in vitro studies using cardiovascular simulators with varying wall stiffness further confirm that PPG features, including rise time and peak-to-peak interval, vary systematically with arterial mechanical properties [11]. By applying a data-driven pipeline to over one million real-world recordings, we extend these experimentally validated morphological markers to a large and heterogeneous population.
Clinically validated multimodal systems often combine ECG, PCG, and PPG to derive cardiovascular metrics such as Pulse Transit Time (PTT) and Pre-ejection Period (PEP) [15]. While these approaches provide a detailed cardiovascular assessment, they require synchronized multi-sensor hardware and controlled laboratory conditions. Existing studies frequently rely on small supervised cohorts, limiting scalability. In contrast, our dataset comprises over one million unsupervised, real-world recordings collected without supervision by thousands of users. This introduces realistic noise and morphological variability that are essential for the development of robust machine learning models intended for practical deployment.
2.2. Photoplethysmography and Vascular Waveform Analysis
Photoplethysmography (PPG) has emerged as a promising non-invasive modality for vascular assessment, driven by its simplicity, low cost, and integration into consumer devices [5,7,9,10]. PPG signals reflect pulsatile blood volume changes within the microvascular bed and exhibit characteristic morphological features, such as the systolic peak, diastolic wave, and dicrotic notch, that are closely associated with arterial compliance, pulse wave reflection, and vascular aging. In young and healthy vasculature, the dicrotic notch is typically well defined, whereas its attenuation, temporal displacement, or disappearance is commonly observed with increasing arterial stiffness and disease burden. Controlled in vitro experiments have further demonstrated that specific PPG waveform features change systematically in response to alterations in arterial stiffness, indicating a direct link to vascular physiology [11].
A range of metrics has been proposed to quantify vascular properties from PPG signals. The second derivative of the PPG waveform (SDPPG) is widely used to derive interpretable vascular indices based on characteristic inflection points and their amplitude ratios [8]. Additional metrics, such as the Reflection Index (RI), quantify the relative amplitude of the reflected wave with respect to the systolic peak as a surrogate marker of arterial stiffness. However, RI and SDPPG-based features are predominantly amplitude-driven and confined to single-cycle morphology, neglecting temporal relationships between waveform landmarks [16]. The Stiffness Index (SI) incorporates the time delay between systolic and reflected peaks, explicitly leveraging temporal information and exhibiting strong correlation with the augmentation index (AIx), while offering simpler computation from PPG signals compared to radial tonometry [6]. Despite their clinical relevance, these indices remain limited by low-dimensional representations and fixed morphological assumptions that may not capture the full complexity of vascular dynamics.
While this study utilizes chronological age as the target variable, it is important to acknowledge that the relationship between age and PPG signals is driven by physiological changes, primarily vascular aging and increased arterial stiffness. Advancing age is the main driver of structural changes in the arterial wall, including elastin fiber degradation and increased collagen deposition [3,10]. These changes manifest in the PPG waveform through faster pulse wave reflections and alterations in the dicrotic notch, establishing a strong but indirect link between signal morphology and age [7,8]. However, using chronological age as a surrogate label may not fully reflect vascular age, which may differ due to lifestyle and genetic factors [2,11]. Despite this limitation, the strong correlation between age and arterial stiffening in large cohorts supports the use of chronological age as a practical and widely accepted proxy for validating PPG-based predictive models in cardiovascular screening [17,18].
2.3. Machine Learning Methods and Dataset Limitations
Machine learning (ML) and deep learning (DL) approaches offer a powerful alternative by enabling the integration of raw PPG waveforms, mathematical transformations, and diverse derived features encompassing amplitude, timing, morphology, and statistical descriptors. This multidimensional representation supports more comprehensive modeling of vascular properties and the discovery of nonlinear relationships inaccessible to traditional indices. However, the reliability and generalizability of such approaches critically depend on the availability of large, high-quality, and well-annotated datasets.
Many widely used PPG datasets originate from clinical environments, including the MIMIC Critical Care Database [19] and VitalDB [20], and often require institutional approvals, credentialing, or paid access. These datasets are frequently dominated by critically ill or perioperative populations, limiting their applicability to healthy or ambulatory individuals. Large-scale proprietary resources, such as the UK Biobank [21], introduce additional administrative barriers that can delay or restrict research access. Smaller datasets, on the other hand, such as WESAD [22], are collected under controlled laboratory conditions and lack the variability encountered in everyday use. Finally, synthetic datasets, including the Pulse Wave Database [23], provide valuable modeling benchmarks but fail to capture the noise characteristics, motion artifacts, and morphological diversity inherent to real-world recordings.
More recent datasets, such as WildPPG [24] and PPG-DaLiA [25], collect PPG signals under unconstrained daily-life conditions and are primarily designed to support robust pulse detection in the presence of motion artifacts. However, their limited participant pools and reliance on wrist-based acquisition restrict their suitability for detailed waveform morphology analysis and smartphone camera-based sensing. Consequently, many studies continue to rely on synthetic or virtual datasets for ML model development, including neural network-based vascular age prediction [17] and virtual-database-driven cardiac index estimation [26]. While informative, such approaches may lack the morphological variability and signal artifacts present in real-world smartphone-acquired PPG data, potentially limiting model generalizability and translational impact.
3. Materials and Methods
3.1. Datasets and Ethical Approval
The Real-World Smartphone Photoplethysmography (RWS-PPG) datasets introduced in this work were curated from recordings collected using the Android application Pulse HRV by Camera BLE ECG, developed by the authors [27]. The application captures fingertip PPG signals using the smartphone camera under unconstrained conditions. Signals are acquired at the native device frame rate and resampled to 100 Hz for temporal consistency.
All recordings were collected with explicit informed consent obtained through the application interface, which informed participants that anonymized data may be used for research purposes. Prior to analysis, all personally identifiable information (e.g., user identifiers, device identifiers) was removed. The study protocol was approved by the Ethics Committee of Alfa BK University, Serbia (Approval No. 1129).
3.2. Signal Preprocessing and Template Construction
Smartphone-acquired PPG signals frequently exhibit inter-beat morphological and temporal variability due to physiological fluctuations (e.g., respiration) and external noise. To mitigate this variability and obtain a representative waveform, all detected heartbeats within a recording were temporally aligned and ensemble-averaged to construct a dominant template PPG heartbeat.
Each detected beat was linearly detrended, scaled to a common amplitude range, and aligned within a fixed-length template window before averaging. Both arithmetic and weighted averaging were employed, where beat contributions were weighted according to their similarity to the preliminary template waveform. This process enhances morphological stability while suppressing transient artifacts.
3.3. Dataset Construction
Two complementary datasets were constructed for this study: A morphology-based classification dataset and a regression dataset for age prediction.
3.3.1. Morphology Classification Dataset
The classification dataset consists of 5000 template PPG waveforms. Labeling was performed according to the four-class morphological framework proposed by Dawber et al. [13]. It is based on the visibility and position of the dicrotic notch, a subtle inflection point on the descending limb of the pulse waveform. This feature is associated with arterial elastic recoil following aortic valve closure and progressively diminishes with vascular aging and disease burden.
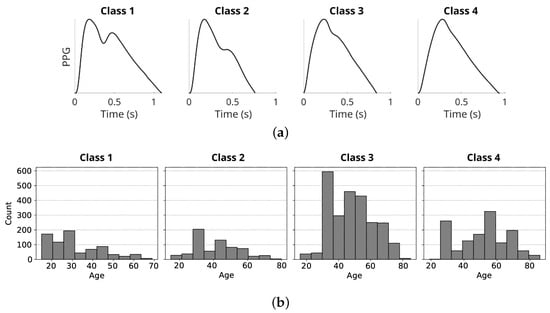
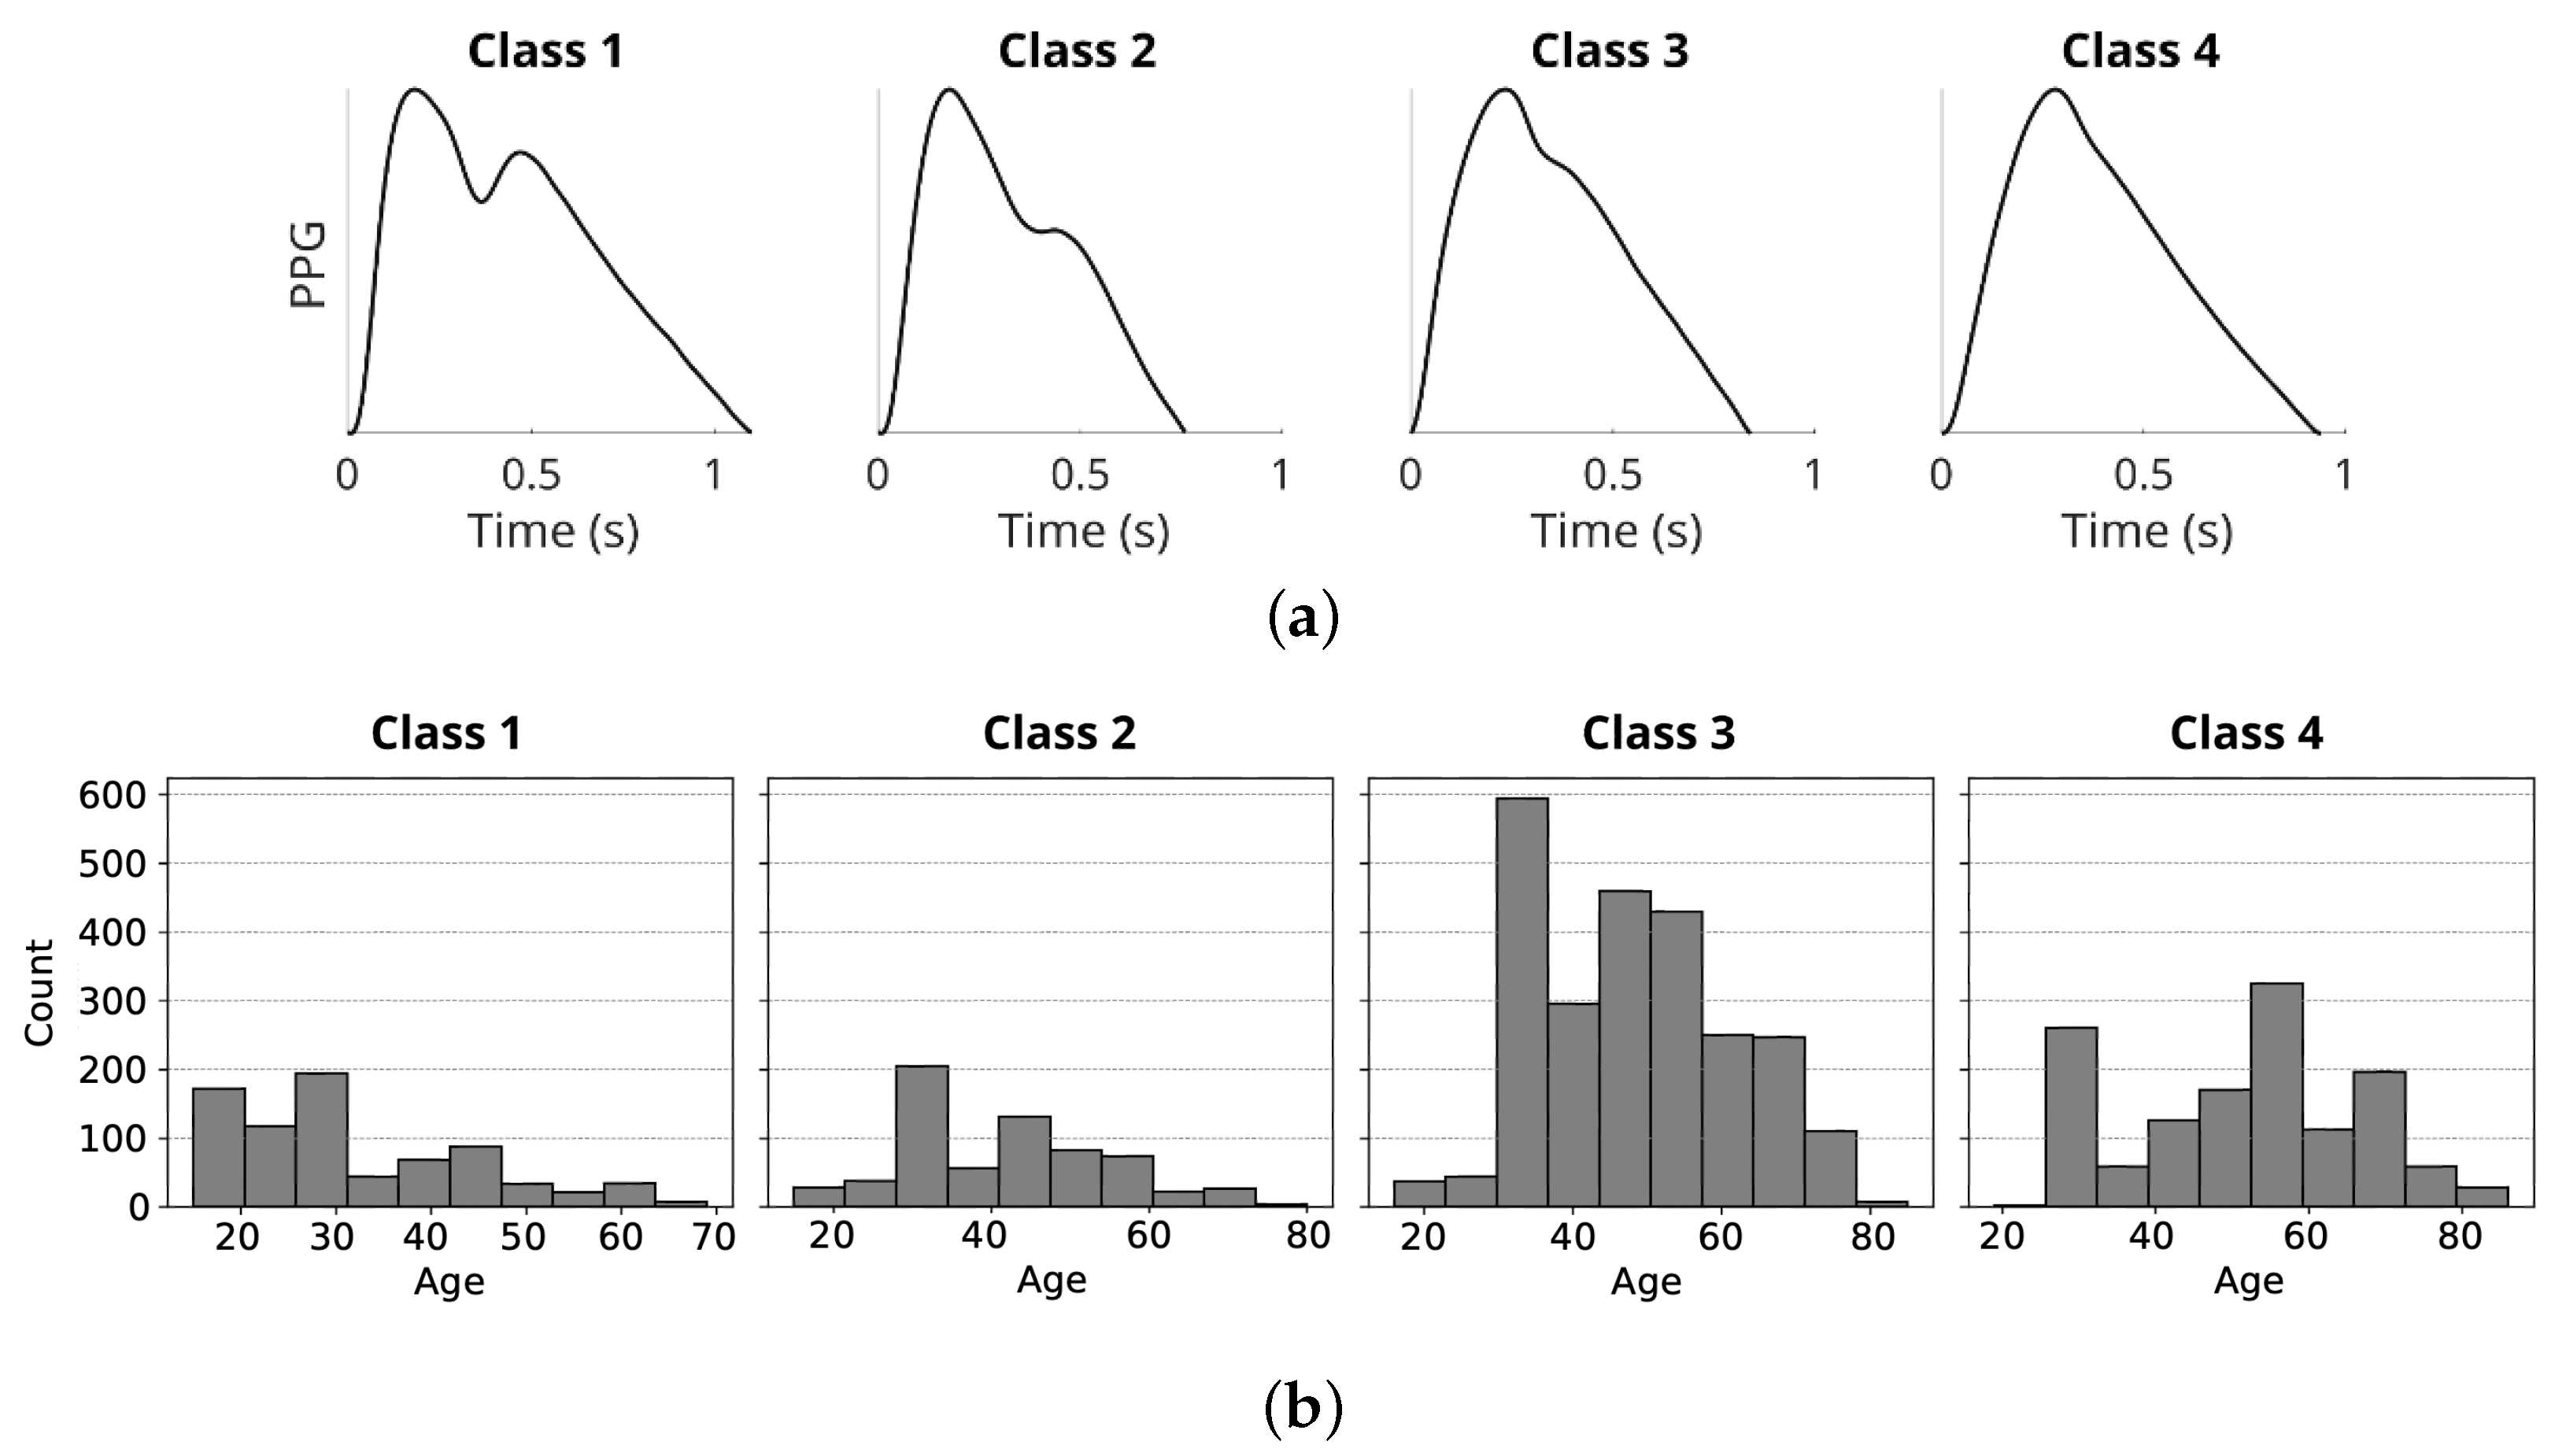
Although originally introduced using oscillometric vasculography, this framework can be interpreted as an early form of digital volume pulse (DVP) analysis. It has been shown that DVP and peripheral pressure pulse waveforms are governed by similar hemodynamic mechanisms and can be related through a transfer function [28]. Furthermore, the same four waveform classes have been successfully applied to optically acquired DVP and PPG signals, demonstrating their relevance to vascular stiffening and aging [14]. To characterize the demographic structure of the resulting classification dataset, Figure 1 presents the distribution of chronological age across the four morphology-based classes. Notably, the age distributions exhibit substantial overlap, indicating that the class labels capture waveform morphology rather than an age-driven grouping.
Figure 1.
(a) Four classes of PPG pulse wave shape proposed by Dawber et al. [13]. (b) Distribution of chronological age across the four morphology-based waveform classes in the classification dataset. Each panel shows the age histogram for one class. The overlap between distributions indicates that class labels are not determined by chronological age alone and serves to characterize the dataset composition.
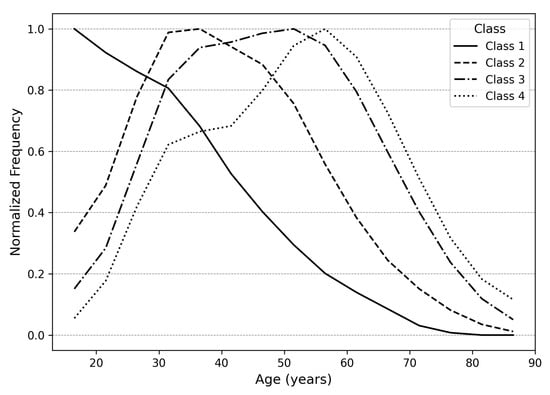
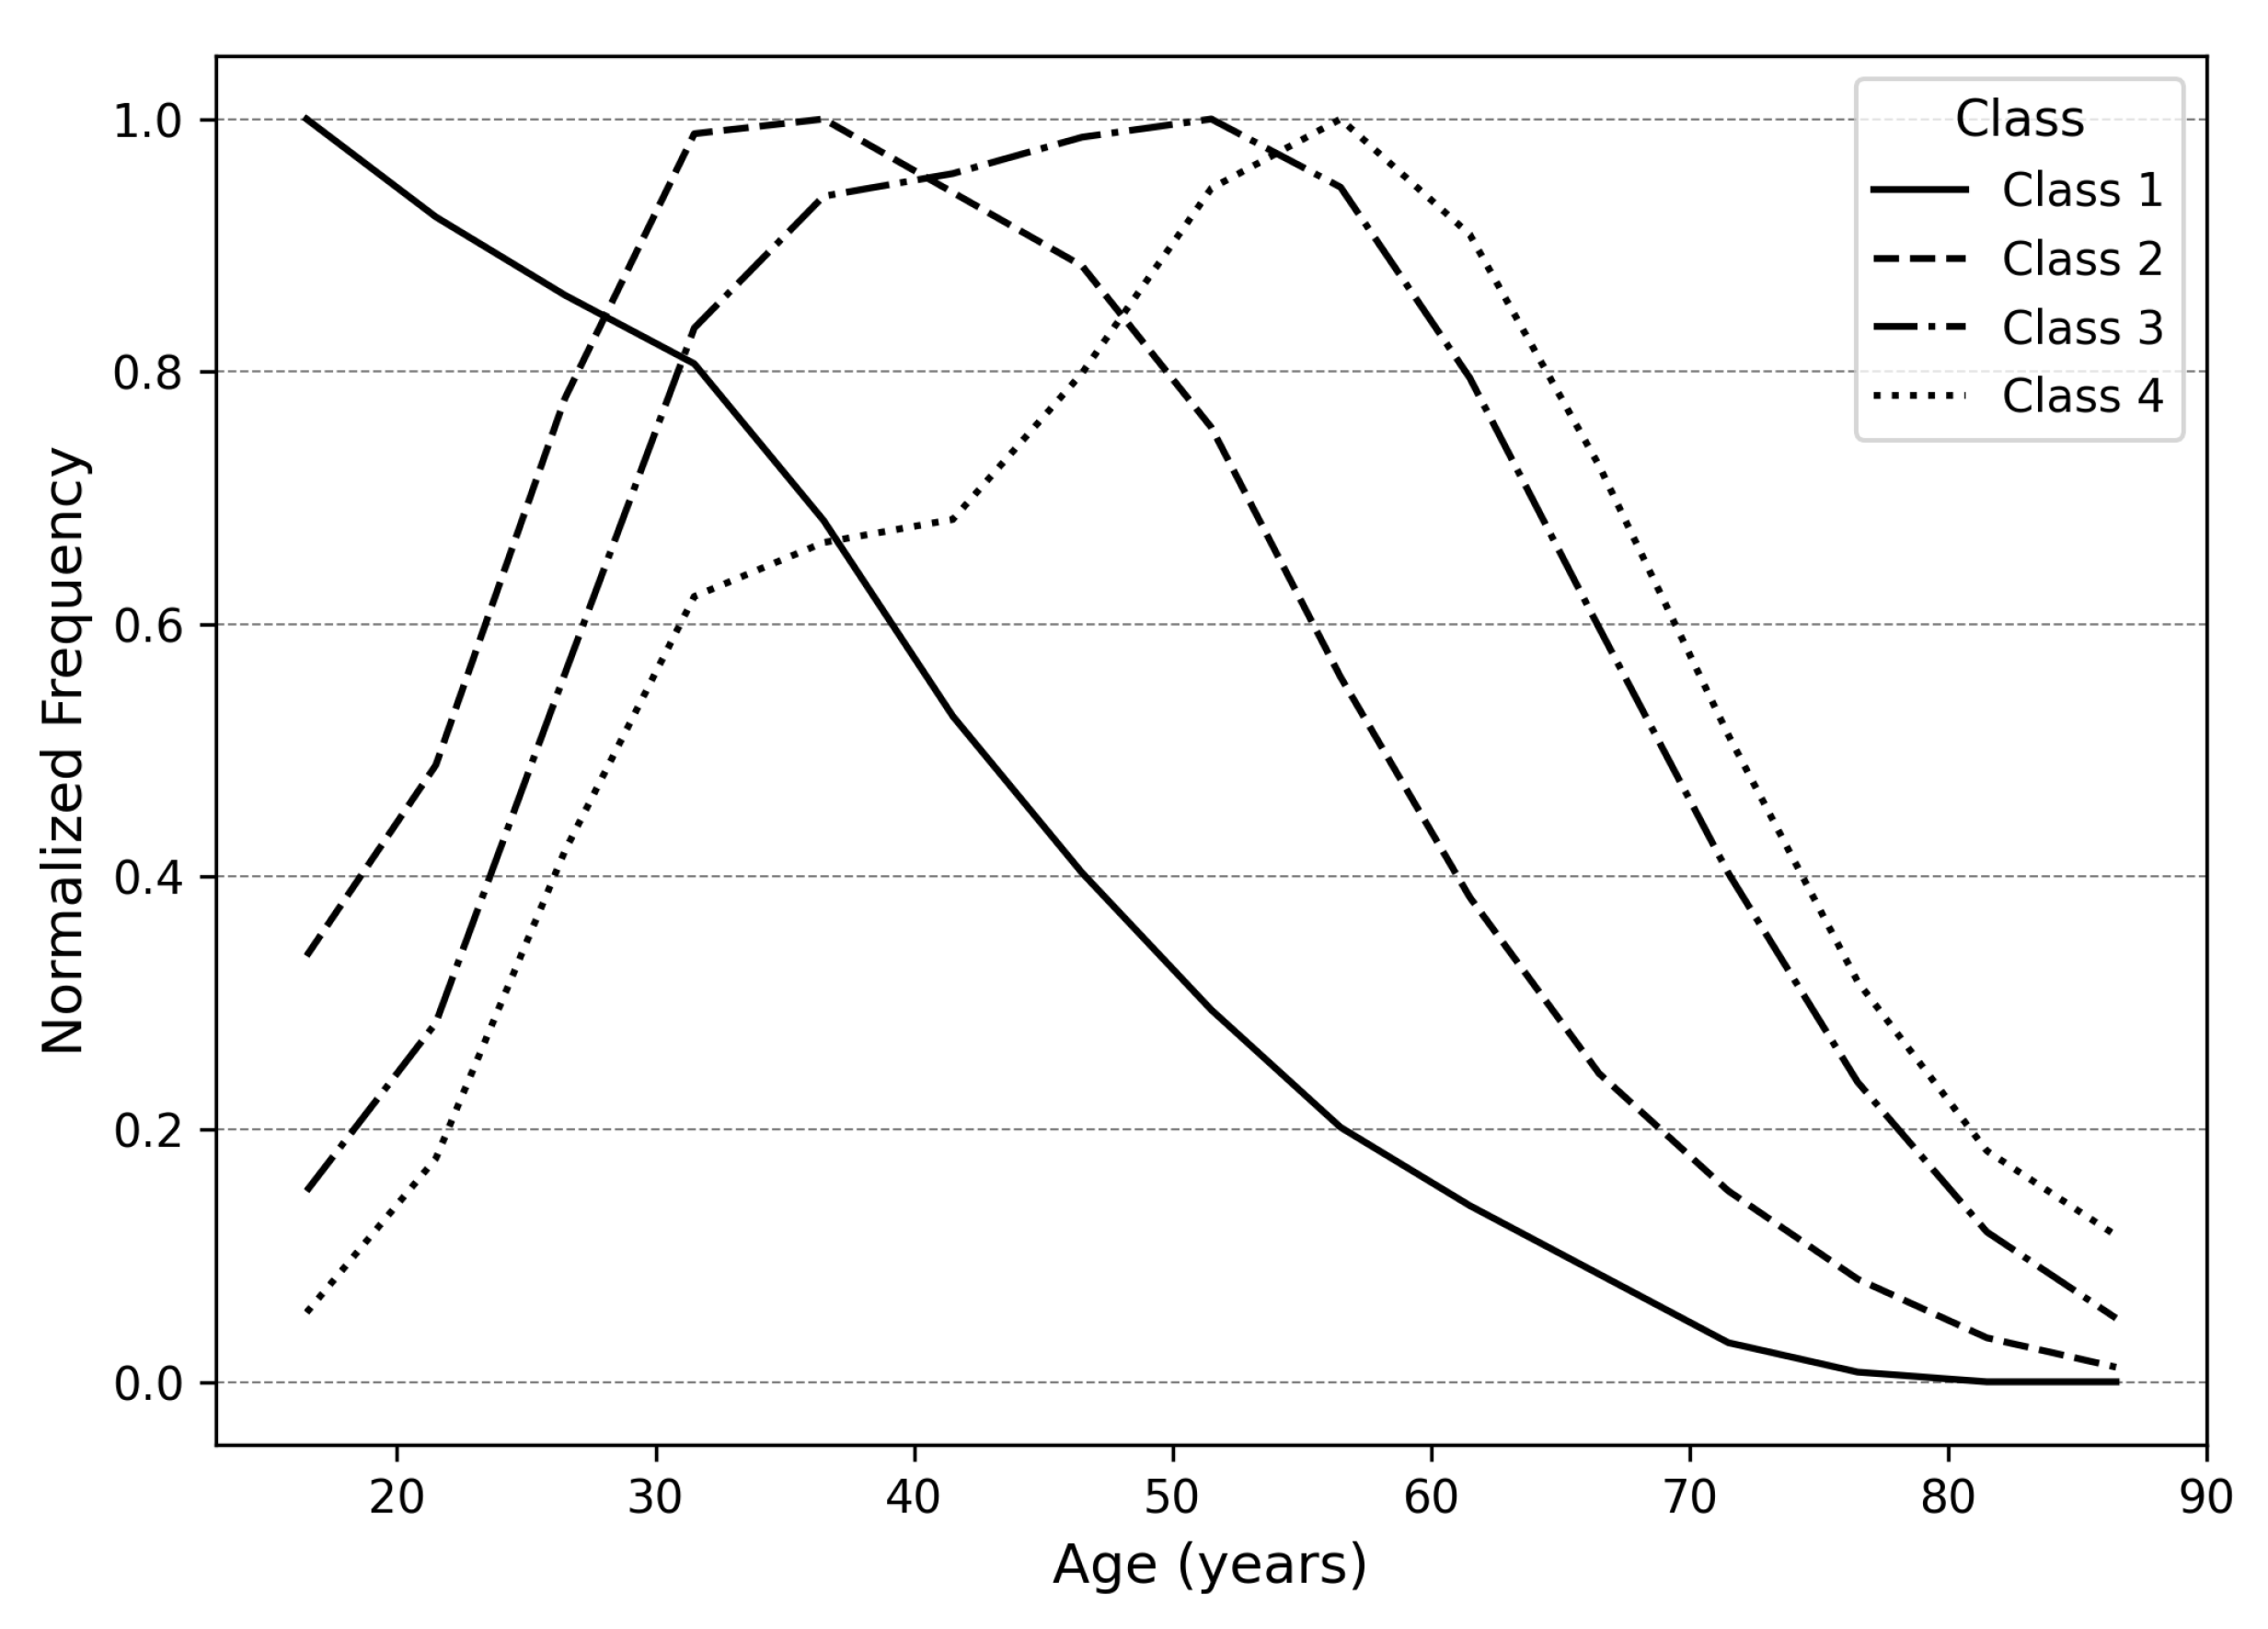
While Class 1 waveforms are generally associated with younger individuals and Classes 2–4 with progressively older cohorts, Figure 2 illustrates substantial overlap in chronological age across the four morphological classes. This observation highlights the limitation of age-based assessment and underscores the importance of morphology-driven classification. Descriptive statistics for the classification dataset are summarized in Table 1.
Figure 2.
Distribution of chronological age across the four PPG morphology classes.
Table 1.
Descriptive statistics of the classification dataset.
3.3.2. Age Regression Dataset
The regression dataset was constructed to support chronological age prediction from PPG waveforms and contains approximately 10,000 samples. Unlike morphology labels, chronological age cannot be assumed to represent a precise biological reference due to discrepancies between chronological and vascular age and potential user-related reporting errors.
Our initial investigations revealed that highly unbalanced datasets, where a large number of recordings originate from a limited subset of users, can lead to severe overfitting and unrealistically low prediction error, as models inadvertently learn user-specific patterns rather than age-related signal characteristics. Standard balancing techniques only partially mitigated this effect.
To address this issue, the regression dataset was curated from over one million recordings using a rigorous balancing strategy. Only recordings from users aged 17–75 years were included, with each user limited to a maximum of 10 samples. Sample counts were capped per age-sex group to ensure demographic balance. Raw PPG signals were bandpass filtered, segmented into cardiac cycles, detrended, normalized, and averaged using a weighted correlation-based approach.
Signal quality control was designed to ensure that each retained recording exhibited a stable and representative pulse morphology under real-world acquisition conditions. In unsupervised smartphone recordings, variability may arise from both physiological factors (e.g., respiration or autonomic modulation) and acquisition artifacts such as finger movement, varying contact pressure, or ambient light interference. These artifacts often manifest as abrupt morphological deviations between consecutive beats that cannot be fully corrected through filtering.
Thus, quality assessment relied on two complementary correlation-based criteria: (i) beat-to-template correlation (threshold ), ensuring morphological consistency, and (ii) inter-beat correlation (threshold ), assessing temporal stability. These thresholds were empirically selected to ensure high signal fidelity. This approach prioritizes internal morphological consistency, ensuring that the ensemble-averaged template accurately represents the vascular state captured in the recording. A dynamic replacement strategy was applied whereby higher-quality samples replaced weaker ones within the same demographic group.
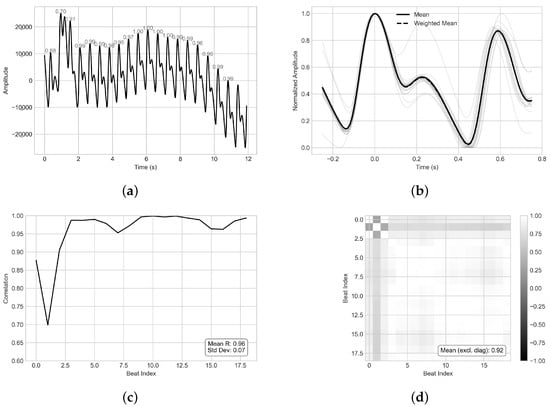
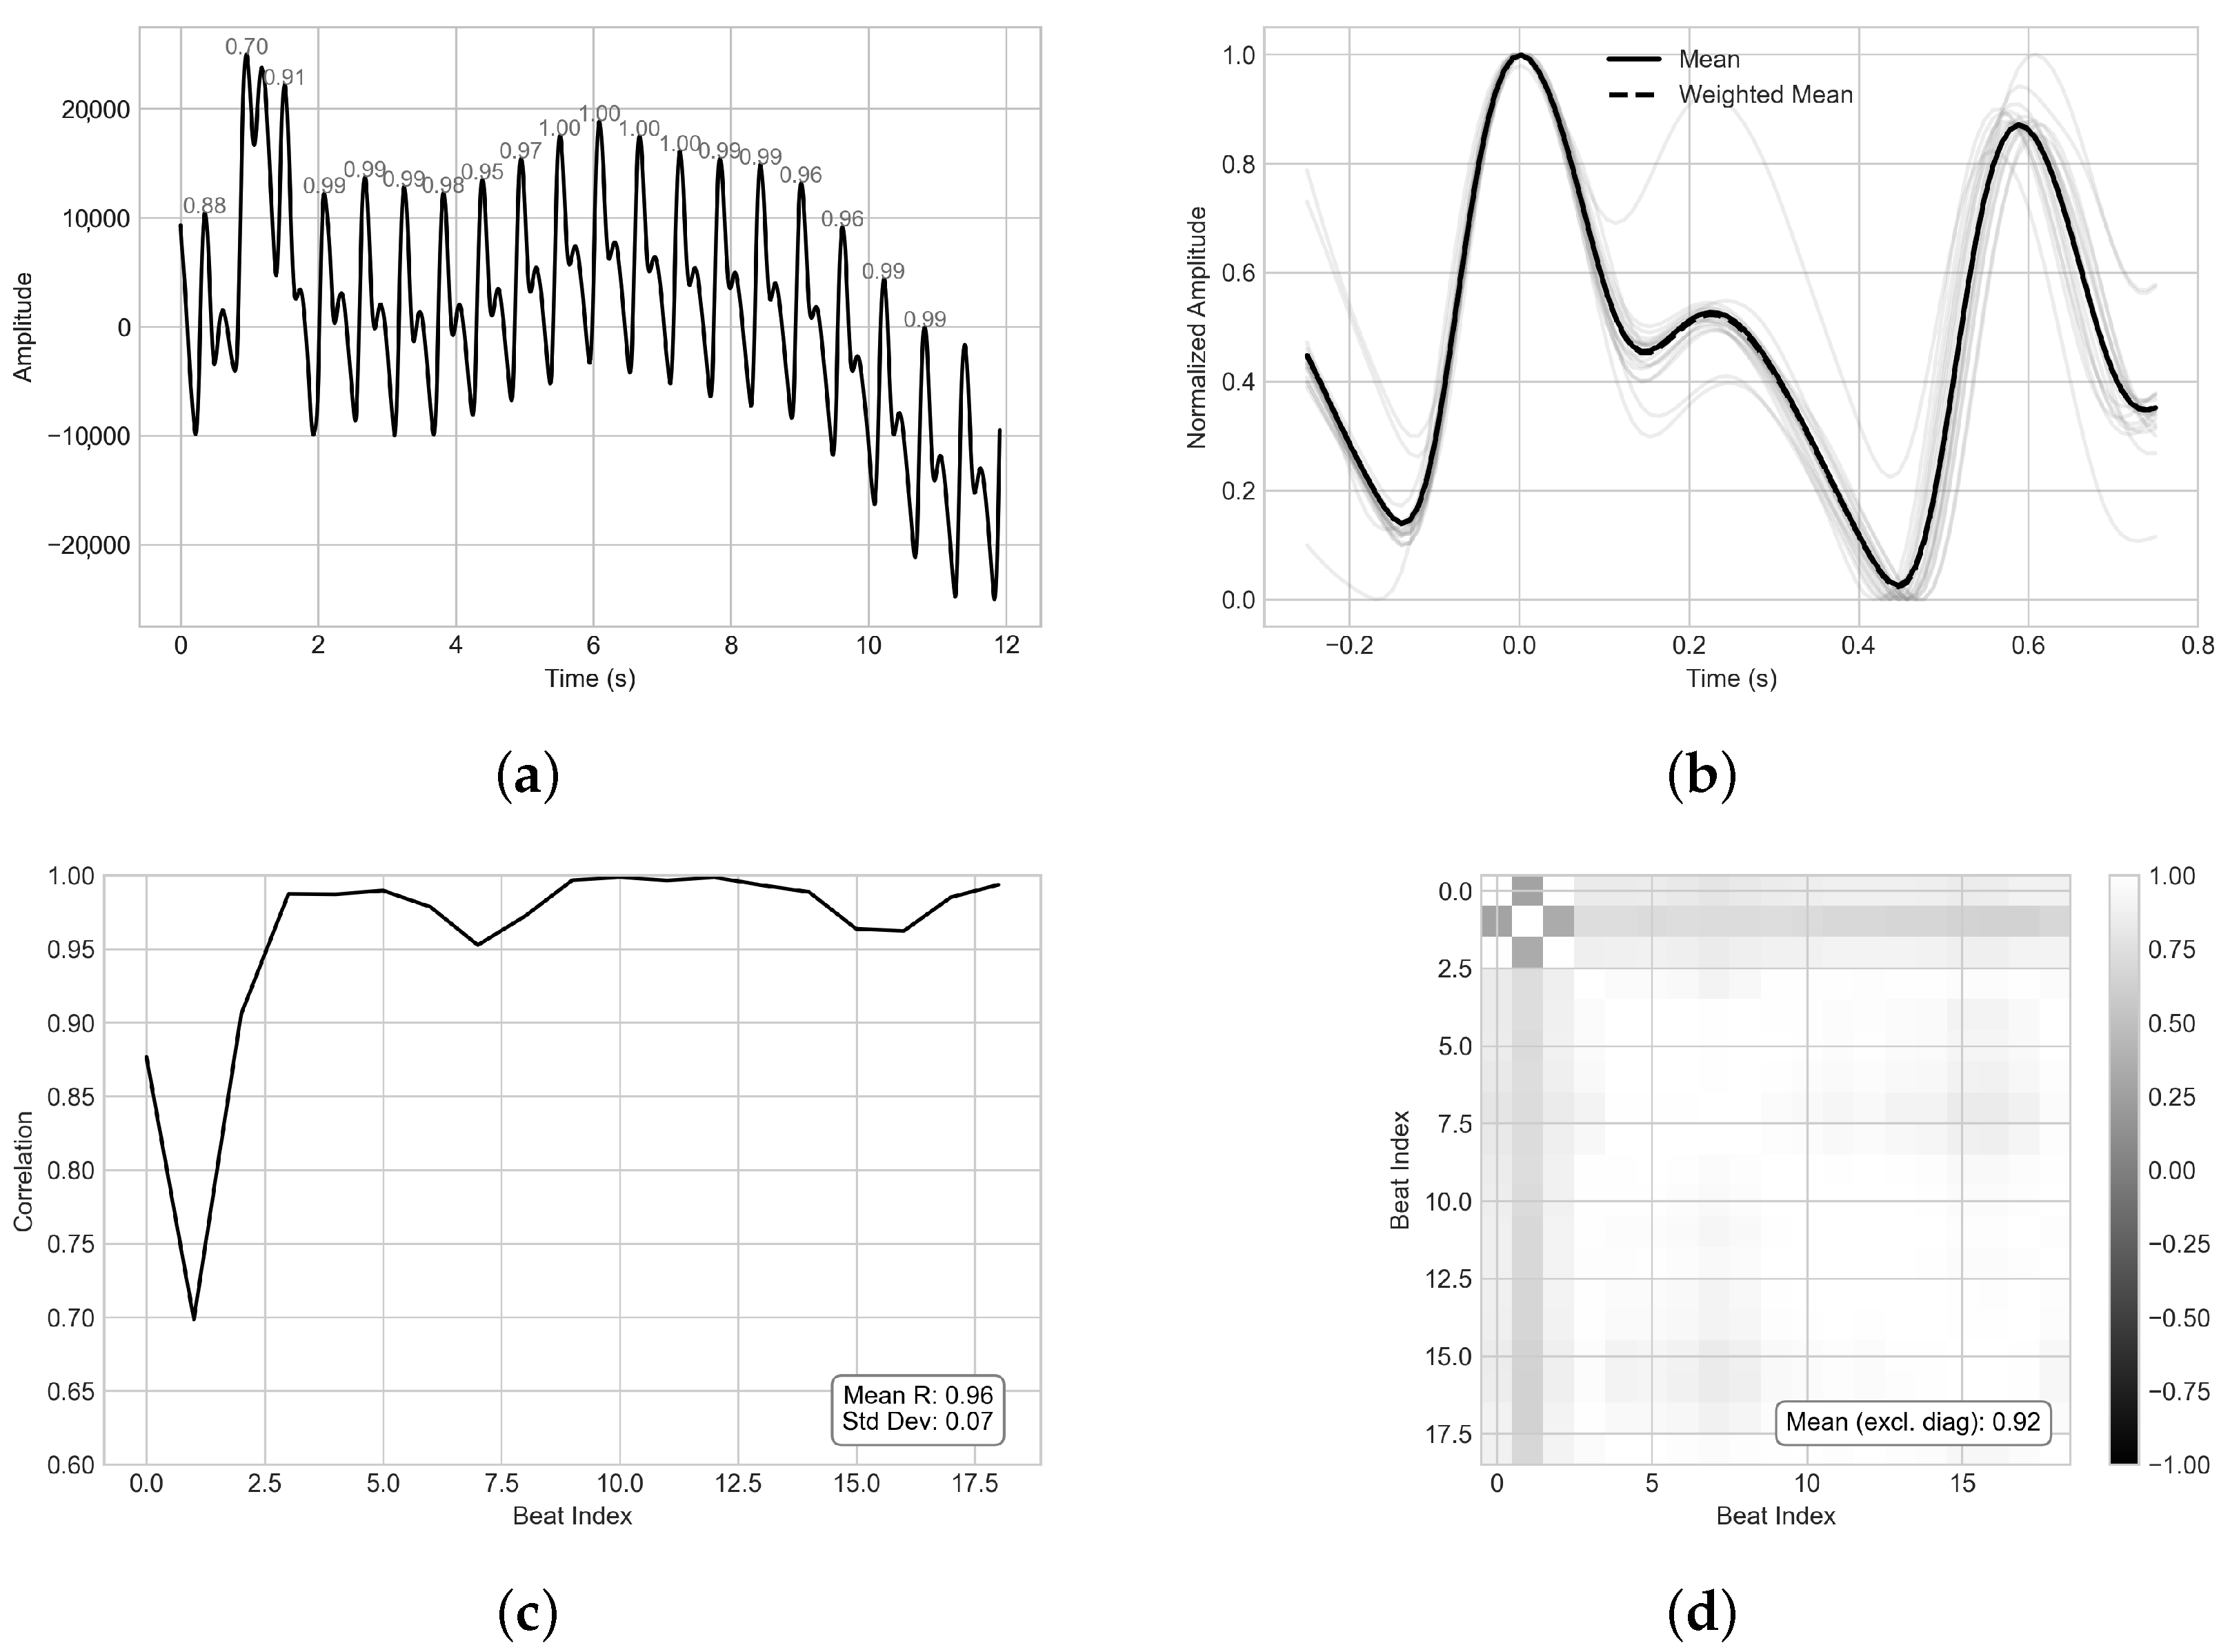
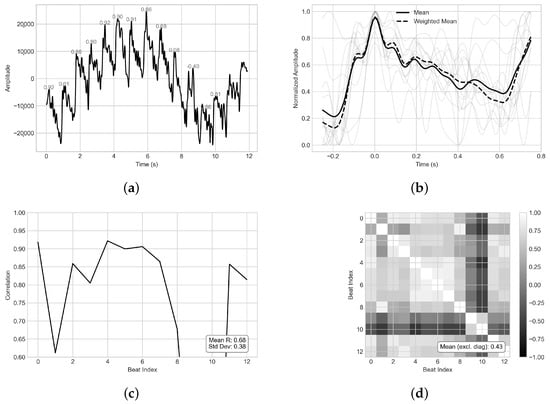
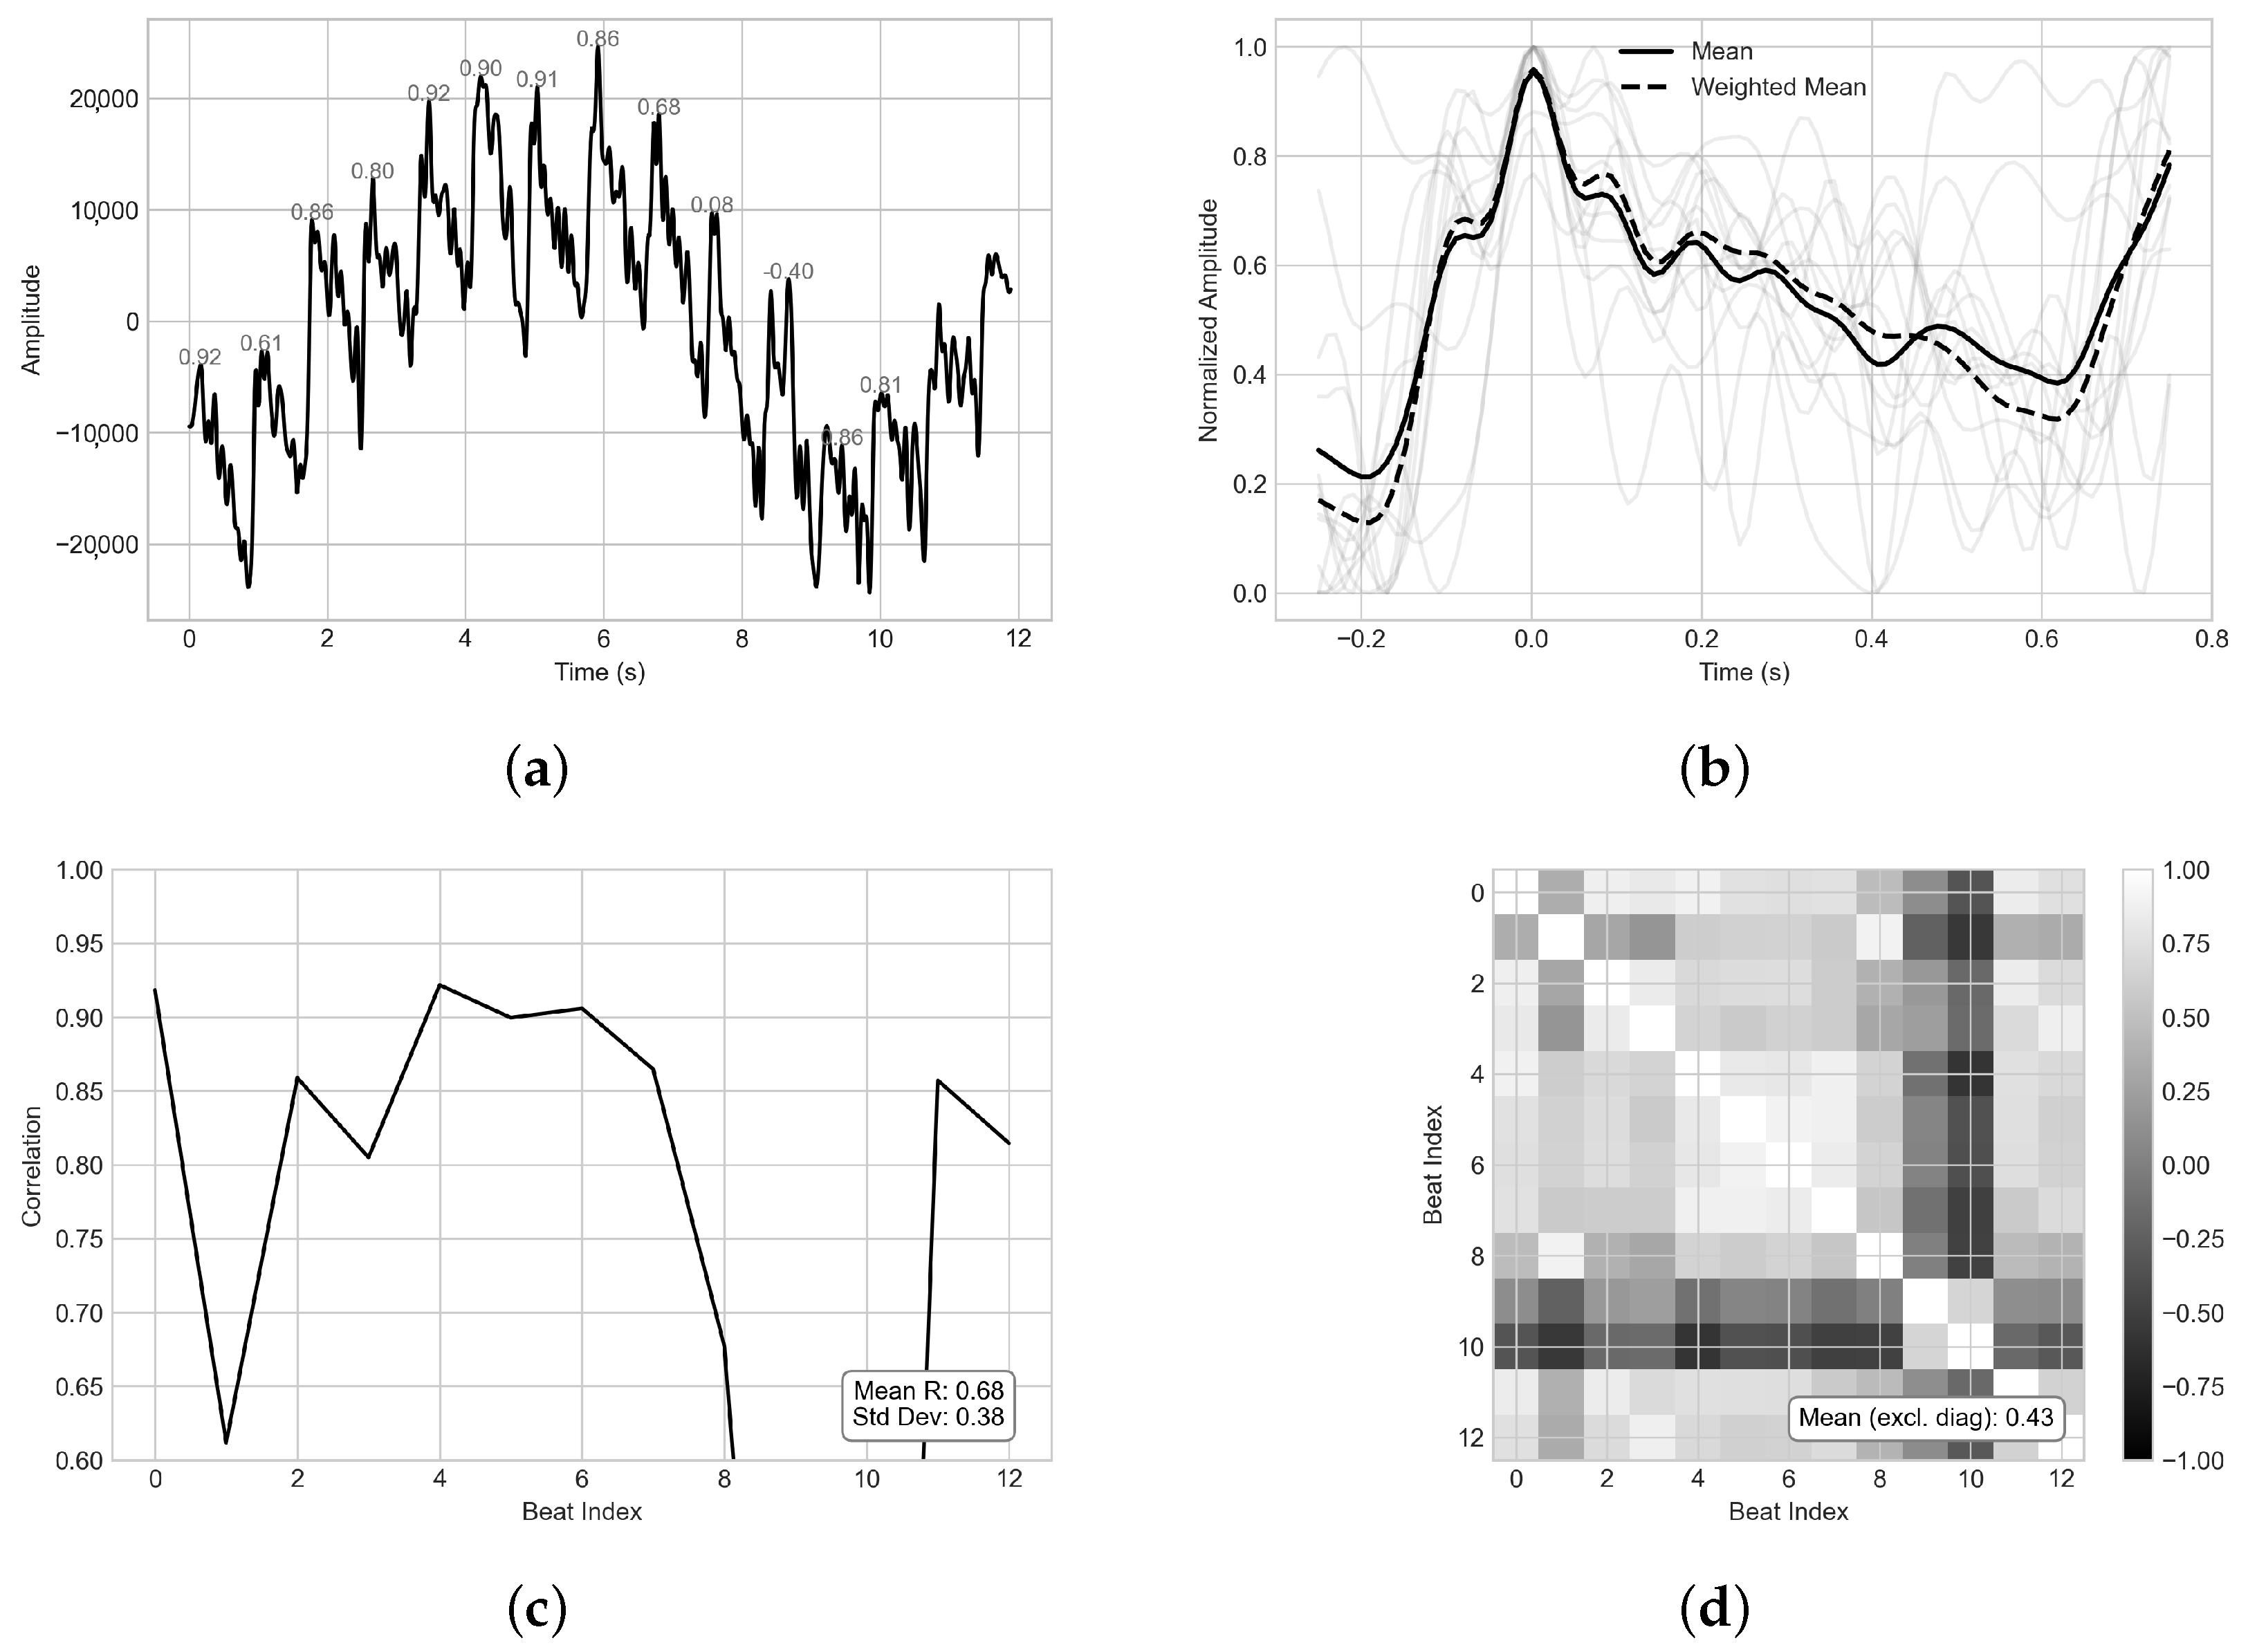
Representative examples of accepted and rejected recordings based on morphology and beat-wise stability are shown in Figure 3 and Figure 4, respectively. Panel (a) presents the preprocessed waveform with beat-wise Pearson correlation values, panel (b) overlays normalized beat segments and templates, panel (c) reports beat-to-template correlations, and panel (d) shows the pairwise inter-beat correlation matrix.
Figure 3.
Example of an accepted PPG recording with high beat-wise stability and morphological consistency. (a) Full preprocessed PPG waveform over time with beat-wise Pearson correlation values computed against the representative beat template. (b) Overlay of normalized beat segments aligned to detected peaks, showing the arithmetic mean template (solid) and a weighted mean template (dashed) where beat contributions are scaled by similarity to the initial template. (c) Pearson correlation coefficients between each beat and the weighted template with summary statistics. (d) Pairwise Pearson correlation matrix across beats; the reported mean excludes the diagonal and summarizes global temporal homogeneity.
Figure 4.
Example of a rejected PPG recording due to low beat-wise stability and/or morphological inconsistency. Panels correspond to the same diagnostics as in Figure 3: (a) preprocessed waveform with beat-wise template correlations; (b) aligned normalized beats with arithmetic and weighted templates; (c) beat-to-template correlation profile with summary statistics; (d) inter-beat correlation matrix summarizing temporal homogeneity (mean excluding diagonal).
Alternative signal quality indices (SQIs), such as SNR estimation, skewness, kurtosis, or perfusion-based indices, were not adopted for large-scale dataset curation. In real-world PPG recordings, spectral overlap between physiological components and noise complicates reliable SNR estimation. Moreover, certain SQI formulations require explicit separation of pulsatile and non-pulsatile components, which was not available during the template construction stage. While more advanced template matching techniques, such as dynamic time warping (DTW), could further accommodate physiological heart rate variability, their integration was beyond the scope of this large-scale processing pipeline.
Given the objective of curating a balanced regression dataset from more than one million recordings, the selected correlation-based strategy provided a computationally efficient and scalable mechanism to ensure high morphological fidelity while preserving physiologically meaningful variability.
Each accepted sample was stored together with its metadata, including anonymized subject ID, age, sex, heart rate, RMSSD, acquisition metadata, full raw PPG waveform, template waveform, and correlation metrics. Final datasets were saved in CSV format.
3.4. Morphology Classification Models
The classification task aimed to assign template PPG waveforms to one of four morphological classes based on dicrotic notch structure (Figure 1a). Three signal representations were evaluated: the template PPG waveform, its second derivative, and a parametric representation based on Gaussian decomposition. The second derivative of the template waveform was computed over a 50 ms window.
For raw and derivative signals, deep learning models were employed, including a multilayer perceptron (MLP), a one-dimensional convolutional neural network (CNN), and a residual network (ResNet). Models were optimized using categorical cross-entropy loss.
For parametric classification, each template waveform was approximated by a sum of Gaussian functions. The resulting parameters, such as amplitude, mean, and standard deviation, were used as input features for ensemble classifiers, including Random Forest and gradient-boosted decision trees.
3.5. Gaussian Modeling and Feature Extraction
Feature extraction is a critical step in PPG analysis. Prior studies have employed large handcrafted feature sets derived from waveform morphology and derivatives [29,30]. However, excessive feature dimensionality can introduce ambiguity and instability, particularly in morphologically diverse signals. In particular, compact feature representations have been shown to achieve comparable performance to deep architectures [18].
Employing models with a relatively small set of parameters effectively addresses the limitations associated with raw signal usage and mitigates the challenges of extracting numerous features across morphologically diverse PPG waveforms. One such approach is based on modeling the heartbeat as a sum of N Gaussian-like functions. We modeled each template PPG waveform as a sum of Gaussian components:
where x denotes normalized time and , , and represent amplitude, center, and width, respectively.
Although increasing the number of components improved signal reconstruction accuracy, it did not yield improved classification performance. As additional components tended to capture redundant or non-discriminative signal variations, we opted for a model with two Gaussian functions as an effective trade-off between model simplicity and discriminative power. The initial parameters of the model were determined by analyzing derivatives of the PPG signal to identify the systolic and diastolic waves. Parameters were then estimated using nonlinear least-squares optimization with analytically derived Jacobians to improve convergence stability.
3.6. Age Regression Models
Age regression was formulated as a supervised regression task with inherent label uncertainty. Mean Absolute Error (MAE) was selected as the loss function due to its robustness to outliers and linear penalty structure. Three input representations were evaluated: template PPG waveforms, second derivative signals, and Gaussian-derived features.
For the raw template PPG signal and its second derivative, MLP, CNN, and ResNet architectures were employed. Each model was fed with fixed-length input vectors of 150 samples, corresponding to normalized pulse segments. Six parameters were extracted from Gaussian-based inputs: the amplitude, mean, and standard deviation of each of the two Gaussian components. These were used to train MLP, Random Forest, Extra Trees, and XGBoost regressors. An extended feature set incorporating derivative landmarks, demographic metadata, and statistical descriptors was additionally evaluated.
3.7. Training and Evaluation
All experiments were conducted using subject-level 5-fold GroupKFold cross-validation to prevent data leakage and ensure unbiased evaluation. The grouping variable app_id uniquely identifies each participant, guaranteeing that recordings from the same individual were assigned exclusively to either the training or test subset within each fold. This separation was enforced algorithmically via scikit-learn’s GroupKFold and verified by confirming disjoint subject identifiers across all splits. Within each fold, stratified 80/20 train–test splits were applied to maintain demographic balance without compromising subject independence (Section 3.3.2). Model performance was evaluated using MAE, mean absolute percentage error (MAPE), root mean squared error (RMSE), coefficient of determination (), and Pearson correlation. Computational efficiency was evaluated through training time, batch inference time, and single-sample latency. Final model selection was based on a composite ranking of and Pearson correlation.
4. Results
4.1. Classification
Classification performance was evaluated across three representations of the photoplethysmographic (PPG) signal: the raw template waveform, its second derivative (SDPPG), and a parametric representation obtained from a two-component Gaussian model. For each representation, multiple classifiers were trained using 5-fold cross-validation, including multilayer perceptrons (MLP), convolutional neural networks (CNN), residual networks (ResNet), and ensemble-based tree models (Random Forest, Extra Trees, and XGBoost). A quantitative summary of classification performance across input representations and model families is provided in Table 2.
Table 2.
Summary of classification performance across input representations and model families.
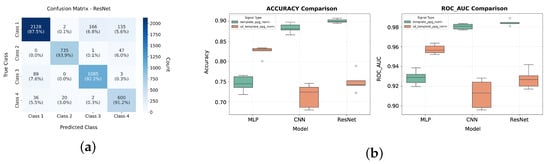
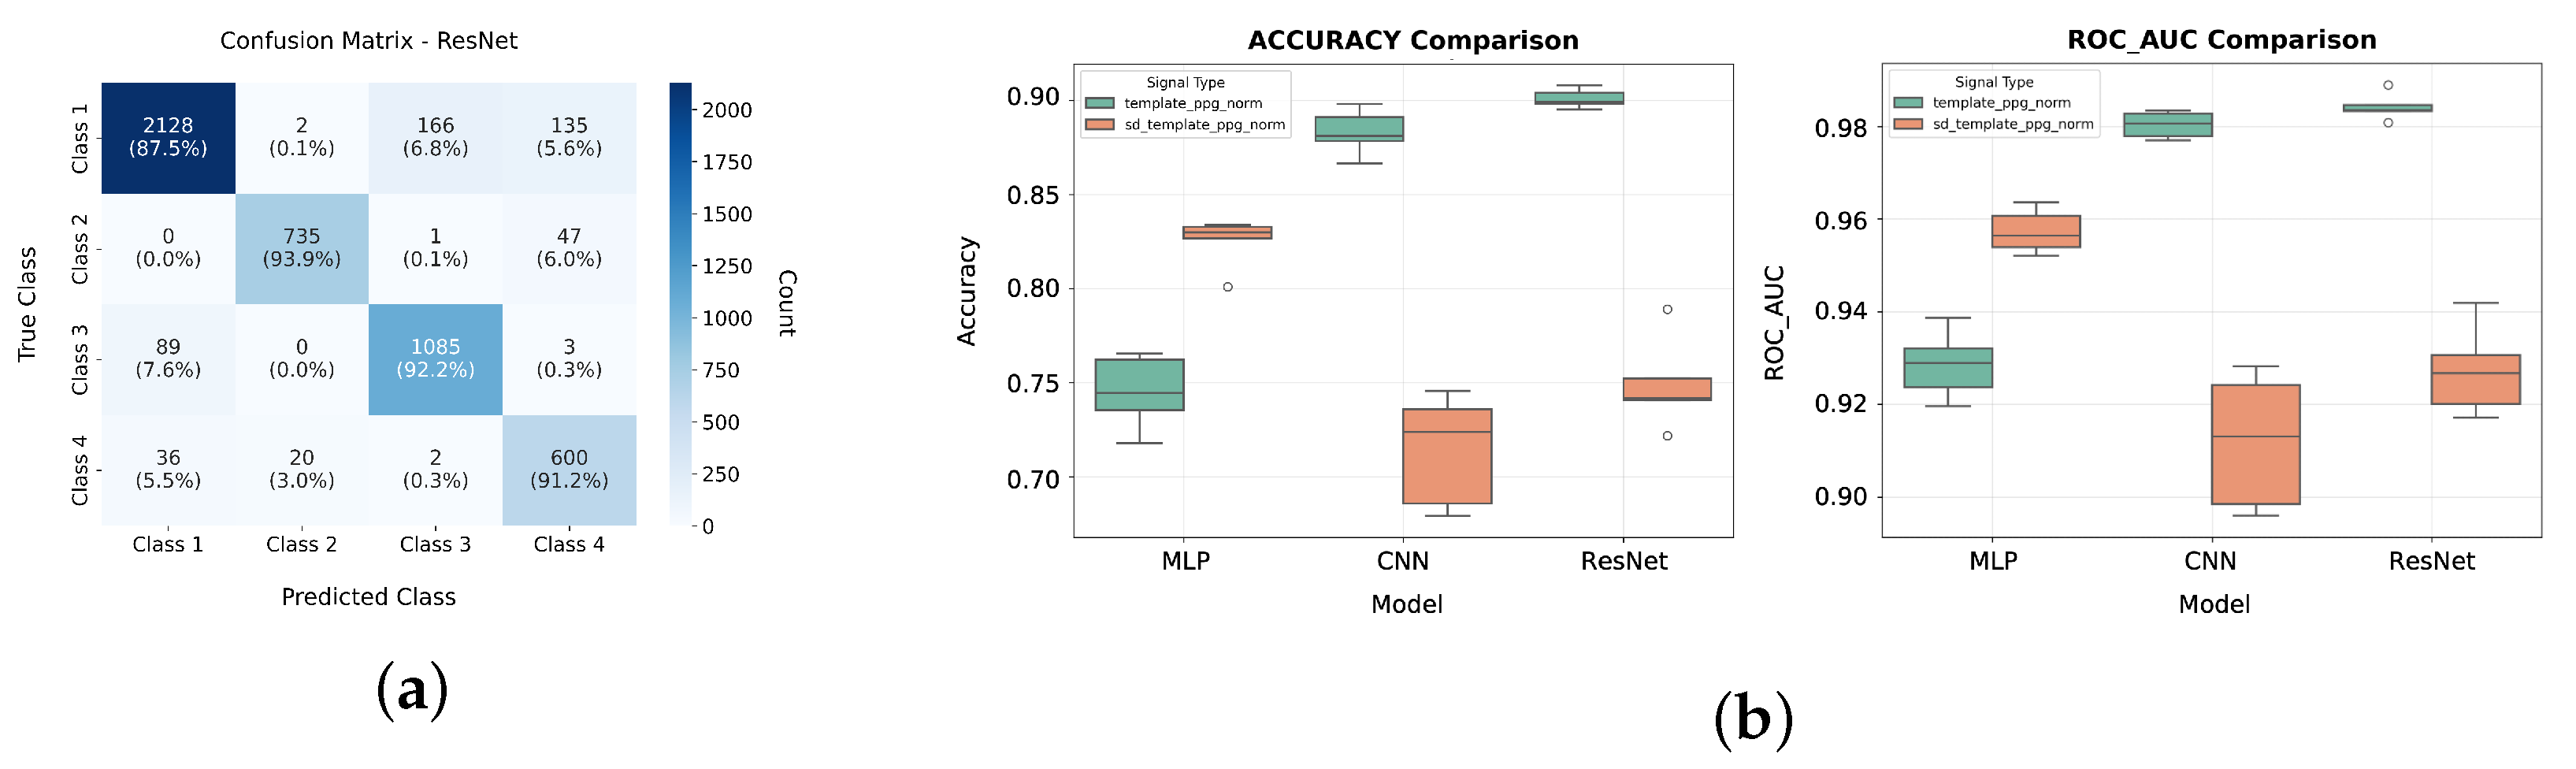
Models trained on raw template PPG achieved the highest overall performance. The ResNet architecture obtained the best results, with an average accuracy of 90.08% and a macro F1-score of 89.52% across 5 cross-validation folds. CNN yielded slightly lower but comparable performance (88.29% accuracy, 87.64% F1-score), whereas the MLP classifier achieved markedly lower scores (74.51% accuracy, 73.05% F1-score). Detailed classification performance of the ResNet model trained on raw PPG template waveforms is further illustrated in Figure 5a. Figure 5b presents a visual comparison of the performance of deep learning models across different input representations.
Figure 5.
(a) ResNet classification performance for raw PPG template input: confusion matrix showing per-class prediction accuracy across the four morphological waveform classes. The predictions are summed over 5 cross-validation folds. (b) Comparison of accuracy and area under the receiver operating characteristic (ROC_AUC) values between implemented deep learning architectures and across two types of waveform inputs: raw template PPG and its second derivative.
These results indicate that convolutional and residual architectures benefit from the full temporal structure of the waveform. The inferior performance of the MLP, on the other hand, suggests the architecture’s limited ability to capture local temporal patterns and signal characteristics that are important for morphological classification.
When SDPPG was used as input, classification performance declined for all models compared with raw PPG. The MLP achieved the highest accuracy (82.47%), followed by ResNet (74.91%) and CNN (71.40%). The reduction in performance was more evident for convolutional models. These results suggest that SDPPG amplifies high-frequency components and noise, which can distort local patterns that convolutional filters typically exploit. In contrast, the MLP appears less sensitive to such distortions because it relies on global feature interactions rather than local receptive fields. However, the overall decrease in accuracy indicates that SDPPG does not preserve all discriminative information present in the original waveform.
For two-Gaussian features, performance was lower than that achieved with raw PPG and SDPPG. The MLP achieved the highest accuracy (79.6%), while ensemble methods showed slightly inferior performance: XGBoost (77.9%), Random Forest (77.0%), and Extra Trees (75.6%). Furthermore, the reduced macro F1-scores across all models indicate that Gaussian-derived features do not adequately capture class-specific morphological differences, particularly for less frequent waveform patterns.
Inference time varied substantially across model families. Deep learning architectures, particularly ResNet, incurred higher computational cost (approximately 100 ms per sample), whereas ensemble tree-based models achieved significantly faster inference times (below 40 ms per sample) with minimal loss in accuracy. Training time was shortest for Extra Trees (below 1 s) and longest for ResNet (exceeding 30 min), reflecting differences in model complexity and optimization requirements.
These findings highlight a trade-off between interpretability and predictive performance. Parametric Gaussian features provide a compact and interpretable feature representation but at the cost of reduced discriminative power. On the other hand, raw waveform-based models achieve higher accuracy because they preserve detailed temporal information, but they require more complex architectures, require significantly longer training time, and offer limited interpretability.
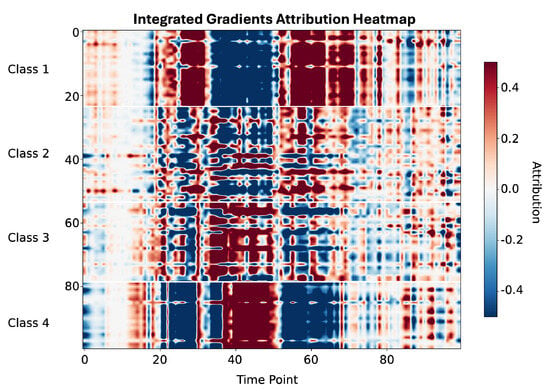
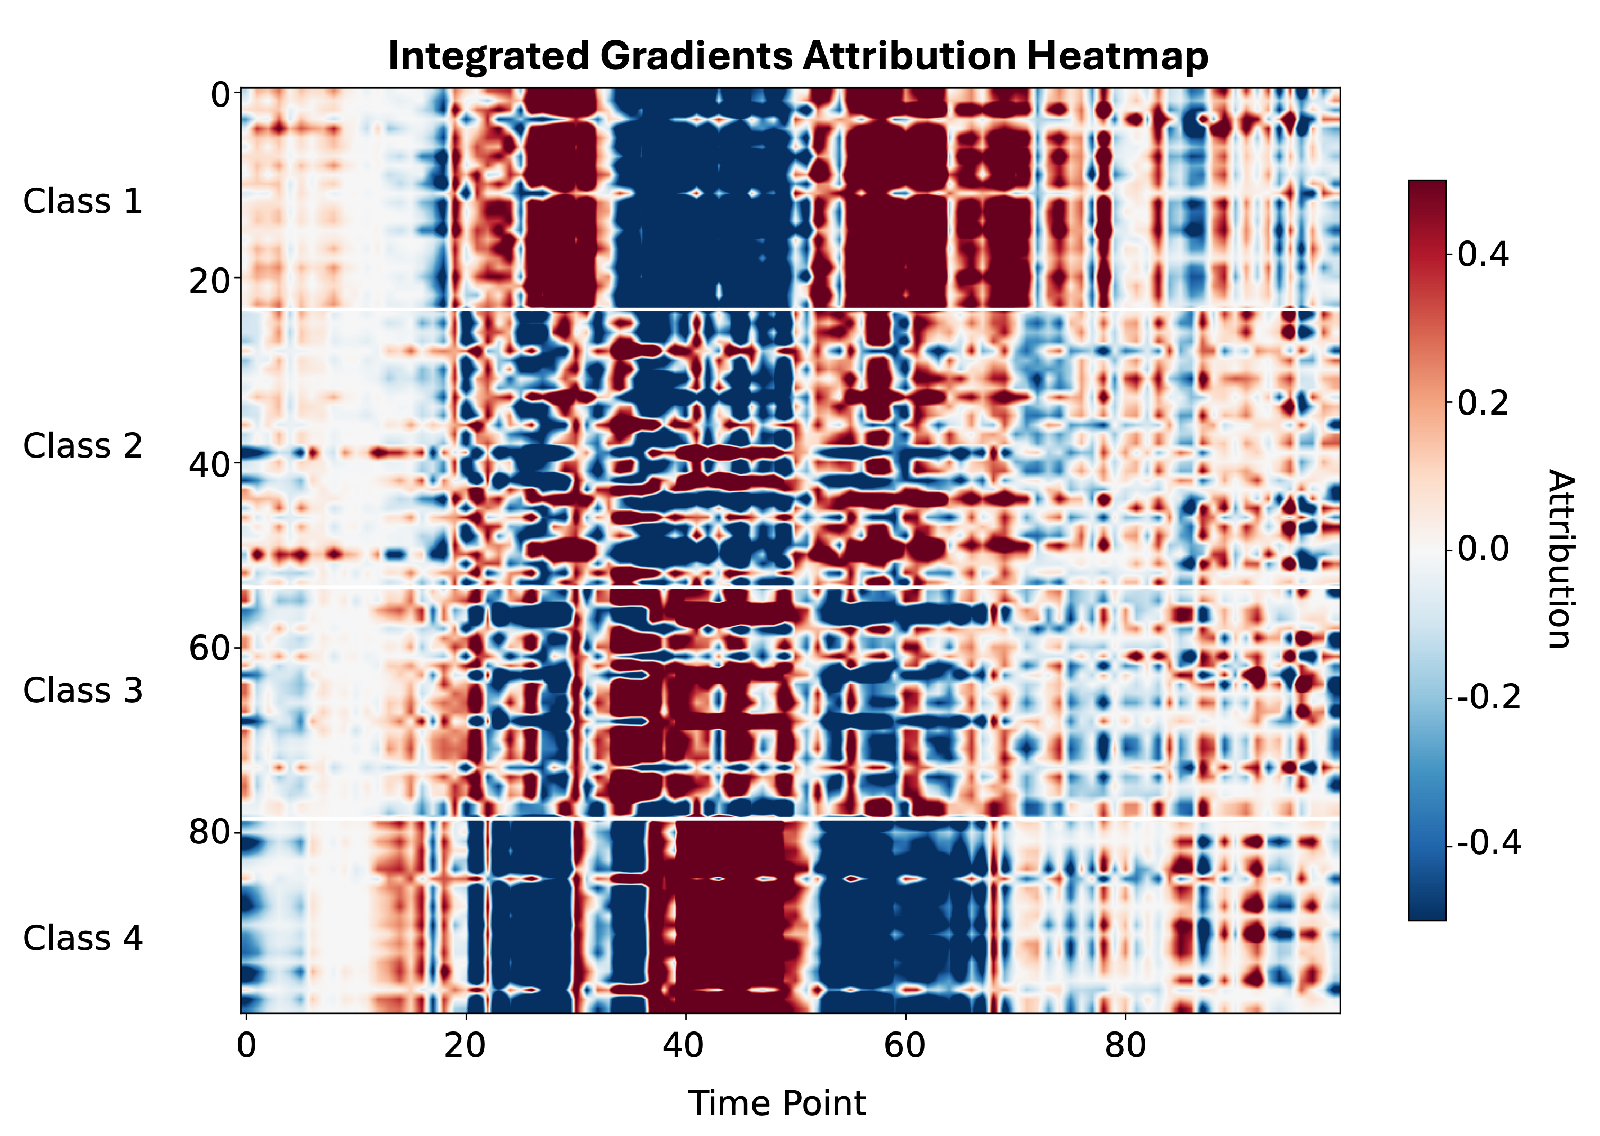
To improve the interpretability of the waveform-based models, Integrated Gradients (IG) were applied to identify the PPG signal regions contributing most strongly to classification decisions of the MLP model (Figure 6). The attribution maps reveal physiologically consistent patterns across the four morphological classes. For Class 1, predominantly representing younger vasculature, the highest attributions are concentrated in early systole (around sample 40) and the diastolic region (around sample 62), corresponding to a well-defined dicrotic notch and a clear separation between systolic and diastolic peaks. In contrast, for Classes 3 and 4, attribution shifts toward the systolic upstroke (samples 28–35) and the region where the dicrotic notch would normally appear (samples 43–45). This pattern reflects progressive attenuation of the dicrotic notch and reduced diastolic wave amplitude associated with increased arterial stiffness. Notably, for Class 4, the dominant attribution is centered precisely at the expected notch location (sample 43), indicating that the model relies on the absence of this feature when identifying advanced vascular aging.
Figure 6.
Integrated Gradients attribution heatmap for all analyzed samples, grouped by morphological class. For Class 1, positive attributions are primarily concentrated in the systolic and diastolic regions corresponding to a well-defined dicrotic notch. For Classes 3 and 4, the dominant attributions shift toward the systolic upstroke and the region where the dicrotic notch is expected. These attribution patterns are consistent with the Dawber morphological classification criteria and indicate that the model relies on physiologically meaningful waveform characteristics.
In summary, the results show that ensemble tree-based models do not consistently outperform neural networks when the feature space is low-dimensional. Instead, deep learning models are more effective when rich signal representations are available, while simpler representations limit the achievable performance regardless of model complexity.
4.2. Regression
Regression performance was evaluated using mean absolute error (MAE), mean absolute percentage error (MAPE), root mean squared error (RMSE), coefficient of determination (), and Pearson correlation. Table 3 summarizes regression performance across input representations and model classes using the reported error and correlation metrics averaged over 5-fold cross-validation results. Across all evaluated models and input representations, average MAE values ranged from approximately 10.05 to 11.65 years, with ensemble regressors trained on Gaussian-derived features achieving performance comparable to deep learning models trained on both raw and derivative PPG signals.
Table 3.
Regression performance summary for chronological age prediction.
For raw template PPG, ResNet achieved the lowest MAE of 10.41 years, followed closely by CNN (MAE = 10.45 years). The MLP model showed weaker performance, with a higher MAE of 11.65 years. When SDPPG was used as input, both ResNet (MAE = 10.05 years) and CNN (MAE = 10.07 years) showed improved performance compared with raw PPG, while MLP again exhibited inferior performance (MAE = 11.25 years). These results indicate that convolutional and residual architectures are better suited for learning age-related patterns directly from waveform signals.
For Gaussian-based input representations, ensemble regressors achieved performance comparable to deep learning models. XGBoost achieved the lowest average MAE of 10.18 years, followed by Random Forest (MAE = 10.28 years) and Extra Trees (MAE = 10.32 years). All three models achieved similar .
We have further evaluated the regression models using an extended set of features. The extended feature representation integrated higher-order morphological descriptors and temporal characteristics derived from both the PPG waveform and its second derivative, beyond the amplitude, mean, and variance parameters of the Gaussian components.
Across ten randomized training seeds, regression models incorporating an extended feature set consistently outperformed baseline models trained solely on two-Gaussian parameters. The mean absolute error was significantly reduced (MAE = 9.82 years versus 10.18 years), with paired t-test analysis confirming statistical significance (). Permutation testing further supported the robustness of this improvement (), indicating that the observed gains were unlikely to arise from random data partitioning.
The extended set of features captured subtle variations in waveform asymmetry, curvature, and temporal structure associated with vascular aging, leading to improved generalization and enhanced sensitivity to age-related physiological changes. Together, these findings highlight the importance of combining compact parametric models with carefully selected morphological descriptors for robust age regression from smartphone-acquired PPG signals.
5. Discussion
This study demonstrates that smartphone camera-derived photoplethysmography (PPG) signals can be leveraged for robust vascular waveform analysis and age-related assessment at scale using real-world data. By combining physiologically grounded signal representations with modern machine learning techniques, we achieved high morphological classification accuracy (up to 90.08% with a ResNet classifier) and competitive chronological age regression performance (mean absolute error of 10.18 years). These results highlight the untapped potential of consumer-grade sensing for scalable, non-invasive vascular assessment beyond traditional clinical environments.
The strong performance of deep residual networks trained directly on raw PPG template waveforms underscores their capacity to capture complex temporal dependencies and subtle morphological variations associated with arterial compliance and pulse wave reflection. At the same time, ensemble classifiers operating on compact Gaussian-derived features achieved comparable age prediction performance while offering substantially lower computational cost and improved interpretability. This trade-off is particularly relevant for mobile and edge-based applications, where inference latency, energy efficiency, and model transparency are critical.
A central contribution of this work is the introduction of a large-scale, real-world dataset explicitly curated for four-class PPG waveform morphology classification based on dicrotic notch characteristics, following the framework originally proposed by Dawber et al. [13]. In contrast to many prior studies that focus primarily on chronological age estimation or binary vascular aging labels, our results emphasize that vascular condition cannot be reliably inferred from age alone. As evidenced by the substantial overlap in age distributions across morphological classes (Figure 2), individuals of similar chronological age may exhibit markedly different arterial pulse characteristics. This observation reinforces the value of morphology-based classification as a more physiologically grounded and potentially more clinically relevant approach to vascular health assessment.
Relative to existing work, the present study advances the state of the art in both data scale and methodological rigor. Dall’Olio et al. [18] demonstrated the feasibility of classifying healthy versus non-healthy vascular aging using smartphone-acquired PPG signals, while Abrisham et al. [17] reported competitive age-range classification using deep neural networks trained on synthetic PPG data. In contrast, our approach achieves a high classification accuracy (90.08%) for finer-grained morphological categories using exclusively real-world smartphone recordings. The inclusion of unconstrained data introduces realistic noise, inter-subject variability, and demographic diversity that are typically absent from synthetic or laboratory datasets, thereby enhancing model robustness and generalizability compared with smaller cohorts such as PPG-DaLiA [25] or simulated waveform collections like the Pulse Wave Database [23].
In the regression setting, incorporating an extended feature set that included second-derivative landmarks and statistical descriptors yielded a statistically significant reduction in prediction error (MAE: 9.82 vs. 10.18 years). These features capture higher-order waveform asymmetries, curvature, and temporal dynamics associated with arterial stiffening, complementing the coarse descriptors provided by Gaussian parameters alone. Nevertheless, chronological age remains an imperfect surrogate for vascular aging.
While chronological age regression provides an initial benchmark, the observed MAE of approximately 10 years likely reflects the discrepancy between biological and chronological vascular aging. Therefore, regression toward chronological age has an inherent ceiling in achievable accuracy. Self-reported age may be affected by user input errors, and biological aging processes are known to diverge substantially from calendar time. Although rigorous demographic balancing and per-user sampling constraints were applied to mitigate these effects, future validation against established clinical markers, such as carotid-femoral pulse wave velocity or augmentation index [3], will be essential to establish clinical relevance.
Several limitations should be acknowledged. Smartphone camera-based PPG acquisition is restricted to fingertip measurements and may be influenced by user behavior, ambient illumination, and device-specific characteristics. While the two-Gaussian model provided an effective balance between simplicity and performance, richer representations or multimodal inputs, such as accelerometry, electrocardiography, or longitudinal context, may further improve sensitivity to early vascular changes. In particular, longitudinal analysis represents a promising direction for future work, enabling personalized tracking of vascular health trajectories rather than reliance on cross-sectional inference alone.
The datasets were collected under fully unconstrained real-world conditions without controlling or recording potentially confounding variables such as medical history, body weight, lifestyle factors, ethnicity, or medication use. Although this approach increases real-world representativeness and enables the development of models robust to population heterogeneity, correlations between PPG features and age may be influenced by uncontrolled factors. Future work should investigate how specific confounders affect PPG-age relationships through controlled sub-studies with clinically verified health data and detailed lifestyle information. Our datasets include activity labels for each recording, which can be used to account for variations in physiological state.
On the other hand, using chronological age as the target variable introduces inherent label noise, as it does not account for differences between chronological age and biological vascular health. Factors such as lifestyle, genetics, and comorbidities can lead to substantial variation in arterial stiffness among individuals of the same age [2,10]. To mitigate this limitation and reduce reliance on chronological labels, we introduce a dataset that classifies PPG signals based on hemodynamic characteristics and pulse wave morphology rather than age alone [7,13,14,17]. By emphasizing intrinsic vascular features, the model aims to better reflect cardiovascular status and provide a more clinically meaningful assessment of arterial stiffness. Additionally, incorporating direct measures such as Pulse Wave Velocity (PWV) could be used to further decouple chronological age from biological vascular health.
Overall, our findings demonstrate the feasibility of morphology-driven vascular assessment using smartphone-based PPG and underscore the importance of large-scale, real-world datasets for developing robust and generalizable models. By prioritizing waveform morphology over chronological age alone and emphasizing data quality, interpretability, and reuse, this work contributes a scalable and accessible foundation for future research in cardiovascular screening, preventive medicine, and personalized digital health.
6. Conclusions
This work demonstrates that smartphone camera-derived photoplethysmography (PPG), when supported by large-scale, real-world data curation and physiologically informed modeling, enables accurate and scalable assessment of vascular characteristics. By curating two complementary datasets from over one million unconstrained recordings, we provide a robust foundation for both waveform morphology classification and vascular aging research using consumer-grade devices. The achieved classification performance (up to 90.08% accuracy) and competitive age regression results (mean absolute error as low as 10.05 years) confirm that smartphone-acquired PPG signals retain clinically meaningful information related to arterial condition.
The results further show that model performance is strongly driven by signal representation. Deep learning architectures trained on raw waveform templates benefit from preserving full temporal structure and achieve the highest classification accuracy, whereas compact parametric representations based on Gaussian modeling offer improved interpretability and computational efficiency at the cost of reduced discriminative power. For regression, the combination of Gaussian parameters with carefully selected derivative- and morphology-based features yields robust and statistically significant performance gains, highlighting the importance of feature design when chronological age is used as a surrogate target.
Beyond predictive accuracy, this study emphasizes the limitations of age-based vascular assessment and supports morphology-driven analysis as a more physiologically grounded indicator of vascular health. By addressing the scarcity of large, open, real-world smartphone PPG datasets, this work overcomes key limitations of existing clinical, laboratory, and synthetic collections, improving robustness and generalizability of machine learning models.
Overall, the proposed datasets and benchmarking framework establish a practical pathway toward accessible, population-scale cardiovascular screening using ubiquitous smartphone technology. Moreover, PPG-derived vascular features can be integrated into multimodal analysis pipelines through existing health software development kits. This enables fusion of vascular morphology information with complementary signals already available on smartphones and wearables, including physical activity and sleep metrics derived from accelerometers and inertial sensors. By contributing vascular-state information without requiring additional sensors, the proposed approach extends current IoT health platforms toward more comprehensive cardiovascular monitoring.
Future work will focus on clinical validation to correlate smartphone-derived PPG features with established vascular markers, including carotid–femoral pulse wave velocity (cfPWV) and carotid intima–media thickness (CIMT), to establish their diagnostic relevance. Furthermore, dedicated cross-dataset studies will be conducted to evaluate generalizability across public PPG datasets that differ in hardware, acquisition settings, and annotation schemes, in addition to multimodal data integration and longitudinal analysis for personalized and preventive vascular health monitoring.
Author Contributions
Conceptualization, S.J.; methodology, S.J.; software, S.J. and I.J.; validation, S.J., A.K. and O.M.M.; formal analysis, S.J.; investigation, S.J., N.G., A.K., O.M.M. and I.J.; resources, N.G.; data curation, S.J. and I.J.; writing—original draft preparation, S.J.; writing—review and editing, A.K. and O.M.M.; visualization, S.J.; supervision, N.G. and O.M.M.; project administration, N.G. and O.M.M.; funding acquisition, N.G., O.M.M. and A.K. All authors have read and agreed to the published version of the manuscript.
Funding
This research was funded by the European Union through the ENFIELD project (European Lighthouse to Manifest Trustworthy and Green AI), Innovation Schemes Open Call OC1-2025-TIS-01, Sub-Grant Agreement No. oc1-2025-TIS-01-153, under Grant Agreement No. 101120657. The APC was funded by the same project.
Institutional Review Board Statement
The study was conducted in accordance with the Declaration of Helsinki and approved by the Ethics Committee of Alfa BK University, Serbia (protocol code 1129).
Informed Consent Statement
Informed consent was obtained from all subjects involved in the study.
Data Availability Statement
The code and data presented in this study are publicly available in the following GitHub repository: https://github.com/stevanjokic/rws-ppg-datasets-vascular (accessed on 31 January 2026).
Acknowledgments
The authors acknowledge administrative and technical support provided by the participating institutions. The authors used ChatGPT (OpenAI, San Francisco, CA, USA; https://openai.com) for language editing and text refinement. The tool was used exclusively to improve the clarity in sections of the manuscript originally written by the authors. The authors have reviewed and edited the content and take full responsibility for the final manuscript. Generative artificial intelligence (GenAI) tools were not used for study design, data analysis, data interpretation, figure generation, or result production. All scientific content, analyses, and conclusions were developed and verified by the authors.
Conflicts of Interest
Nenad Gligoric is employed in Zentrix Lab. The authors declare no conflicts of interest. The funders had no role in the design of the study; in the collection, analyses, or interpretation of data; in the writing of the manuscript; or in the decision to publish the results.
References
- World Health Organization. Cardiovascular Diseases (CVDs): Key Facts. 2023. Available online: https://www.who.int/news-room/fact-sheets/detail/cardiovascular-diseases-(cvds) (accessed on 15 January 2026).
- Liu, K.; Daviglus, M.L.; Loria, C.M.; Colangelo, L.A.; Spring, B.; Moller, A.C.; Lloyd-Jones, D.M. Healthy Lifestyle through Young Adulthood and the Presence of Low Cardiovascular Disease Risk Profile in Middle Age. Circulation 2012, 125, 996–1004. [Google Scholar] [CrossRef] [Scilit]
- Townsend, R.R.; Wilkinson, I.B.; Schiffrin, E.L.; Avolio, A.P.; Chirinos, J.A.; Cockcroft, J.R.; Heffernan, K.S.; Lakatta, E.G.; McEniery, C.M.; Mitchell, G.F.; et al. Recommendations for Improving and Standardizing Vascular Research on Arterial Stiffness. Hypertension 2015, 66, 698–722. [Google Scholar] [CrossRef] [Scilit] [PubMed]
- Ghouri, M.A.; Gupta, N.; Bhat, A.P.; Thimmappa, N.D.; Saboo, S.S.; Khandelwal, A.; Nagpal, P. CT and MR Imaging of the Upper Extremity Vasculature: Pearls, Pitfalls, and Challenges. Cardiovasc. Diagn. Ther. 2019, 9, S152–S173. [Google Scholar] [CrossRef] [Scilit] [PubMed]
- Charlton, P.; Aresu, M.; Spear, J.; Chowienczyk, P.; Alastruey, J. Assessing Vascular Age from Peripheral Pulse Waves. Artery Res. 2019, 25, S49. [Google Scholar] [CrossRef] [Scilit]
- Clarenbach, C.; Stoewhas, A.C.; van Gestel, A.; Latshang, T.D.; Cascio, C.M.L.; Bloch, K.E.; Kohler, M. Comparison of Photoplethysmographic and Arterial Tonometry-Derived Indices. Hypertens. Res. 2012, 35, 228–233. [Google Scholar] [CrossRef] [Scilit]
- Charlton, P.H.; Paliakaitė, B.; Pilt, K.; Bachler, M.; Zanelli, S.; Kulin, D.; Allen, J.; Hallab, M.; Bianchini, E.; Mayer, C.C.; et al. Assessing Hemodynamics from the Photoplethysmogram to Gain Insights into Vascular Age. Am. J. Physiol. Heart Circ. Physiol. 2022, 322, H493–H522. [Google Scholar] [CrossRef] [Scilit]
- Choi, J.; Park, M.G. Variations in the Second Derivative of a Photoplethysmogram with Age. Int. J. Environ. Res. Public Health 2022, 20, 236. [Google Scholar] [CrossRef] [Scilit]
- Park, J.; Seok, H.S.; Kim, S.S.; Shin, H. Photoplethysmogram Analysis and Applications: An Integrative Review. Front. Physiol. 2022, 12, 808451. [Google Scholar] [CrossRef] [Scilit]
- Karimpour, P.; May, J.M.; Kyriacou, P.A. Photoplethysmography for the Assessment of Arterial Stiffness. Sensors 2023, 23, 9882. [Google Scholar] [CrossRef] [Scilit]
- Ferizoli, R.; Karimpour, P.; May, J.M.; Kyriacou, A.P. Arterial Stiffness Assessment Using PPG Feature Extraction and Significance Testing in an In Vitro Cardiovascular System. Sci. Rep. 2024, 14, 2024. [Google Scholar] [CrossRef] [Scilit]
- Dewi, E.M.; Hadiyoso, S.; Mengko, T.L.E.R.; Zakaria, H.; Astami, K. Cardiovascular system modeling using windkessel segmentation model based on photoplethysmography measurements of fingers and toes. J. Med. Signals Sens. 2022, 12, 192–201. [Google Scholar] [CrossRef] [Scilit]
- Dawber, T.R.; Thomas, H.E.; McNamara, P.M. Characteristics of the Dicrotic Notch of the Arterial Pulse Wave. Angiology 1973, 24, 244–255. [Google Scholar] [CrossRef] [Scilit]
- Millasseau, S.C.; Ritter, J.M.; Takazawa, K.; Chowienczyk, P.J. Contour Analysis of the Photoplethysmographic Pulse Measured at the Finger. J. Hypertens. 2006, 24, 1449–1456. [Google Scholar] [CrossRef] [Scilit]
- Tran, K.T.; Tran, T.N.; Huynh, D.N.; Le, N.K.; Le, C.D.; Mai, H.X.; Huynh, Q.L.; Nguyen, T.H. A multimodal system for comprehensive cardiovascular monitoring using ECG, PCG, and PPG signal fusion. Sensors 2025, 25, 6708. [Google Scholar] [CrossRef] [Scilit] [PubMed]
- Ahn, J.M. New Aging Index Using Signal Features of Both Photoplethysmograms and Acceleration Plethysmograms. Healthc. Inform. Res. 2017, 23, 53–59. [Google Scholar] [CrossRef] [Scilit] [PubMed]
- Abrisham, K.P.; Alipour, K.; Tarvirdizadeh, B.; Ghamari, M. Neural Network Models for Predicting Vascular Age from PPG Signals. IET Wirel. Sens. Syst. 2024, 15, e12103. [Google Scholar] [CrossRef] [Scilit]
- Dall’Olio, L.; Curti, N.; Remondini, D.; Harb, Y.S.; Asselbergs, F.W.; Castellani, G.; Uh, H.-W. Prediction of Vascular Aging Based on Smartphone Acquired PPG Signals. Sci. Rep. 2020, 10, 19756. [Google Scholar] [CrossRef] [Scilit]
- Johnson, A.E.; Pollard, T.J.; Shen, L.; Lehman, L.H.; Feng, M.; Ghassemi, M.; Moody, B.; Szolovits, P.; Celi, L.A.; Mark, R.G. MIMIC-III, a Freely Accessible Critical Care Database. Sci. Data 2016, 3, 160035. [Google Scholar] [CrossRef] [Scilit]
- Lee, H.C.; Jung, C.W. Vital Recorder—A Free Research Tool for Automatic Recording of High-Resolution Physiological Data. Sci. Rep. 2018, 8, 1527. [Google Scholar] [CrossRef] [Scilit]
- Watts, G. UK Biobank Opens Its Data Vaults to Researchers. BMJ 2012, 344, e2459. [Google Scholar] [CrossRef] [Scilit]
- Schmidt, P.; Reiss, A.; Duerichen, R.; Marberger, C.; Van Laerhoven, K. Introducing WESAD: A Multimodal Dataset for Wearable Stress and Affect Detection. In Proceedings of the 20th ACM International Conference on Multimodal Interaction, Boulder, CO, USA, 16–20 October 2018; pp. 400–408. [Google Scholar] [CrossRef] [Scilit]
- Charlton, P.H.; Mariscal Harana, J.; Vennin, S.; Li, Y.; Chowienczyk, P.; Alastruey, J. Pulse Wave Database (PWDB). 2019. Available online: https://zenodo.org/records/3275625 (accessed on 16 January 2026).
- Meier, M.; Demirel, B.U.; Holz, C. WildPPG: A Real-World PPG Dataset of Long Continuous Recordings. Adv. Neural Inf. Process. Syst. 2024, 37, 2246–2266. [Google Scholar]
- Reiss, A.; Indlekofer, I.; Schmidt, P. PPG-DaLiA Dataset. 2019. Available online: https://archive.ics.uci.edu/dataset/495/ppg+dalia (accessed on 16 January 2026).
- Huttunen, J.M.J.; Kärkkäinen, L.; Honkala, M.; Lindholm, H. Deep Learning for Prediction of Cardiac Indices from Photoplethysmographic Waveform. Int. J. Numer. Methods Biomed. Eng. 2020, 36, e3303. [Google Scholar] [CrossRef] [Scilit]
- Jokić, S.D.; Jokić, I.D. ECG for Everybody—Pulse HRV by Camera BLE ECG, 2023. Android Application. Available online: https://ecg4everybody.com/ (accessed on 15 January 2026).
- Millasseau, S.C.; Guigui, F.G.; Kelly, R.P.; Prasad, K.; Cockcroft, J.R.; Ritter, J.M.; Chowienczyk, P.J. Noninvasive Assessment of the Digital Volume Pulse. Hypertension 2000, 36, 952–956. [Google Scholar] [CrossRef] [Scilit]
- Mathieu, A.J.W.; Pascual, M.S.; Charlton, P.H.; Volovaya, M.; Venton, J.; Aston, P.J.; Nandi, M.; Alastruey, J. Advanced Waveform Analysis of the Photoplethysmogram Signal. JRSM Cardiovasc. Dis. 2024, 13. [Google Scholar] [CrossRef] [Scilit]
- Shin, H. XGBoost Regression of the Most Significant Photoplethysmogram Features. IEEE J. Biomed. Health Inform. 2022, 26, 3354–3361. [Google Scholar] [CrossRef] [Scilit]

Disclaimer/Publisher’s Note: The statements, opinions and data contained in all publications are solely those of the individual author(s) and contributor(s) and not of MDPI and/or the editor(s). MDPI and/or the editor(s) disclaim responsibility for any injury to people or property resulting from any ideas, methods, instructions or products referred to in the content. |
© 2026 by the authors. Licensee MDPI, Basel, Switzerland. This article is an open access article distributed under the terms and conditions of the Creative Commons Attribution (CC BY) license.